1
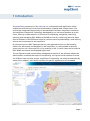
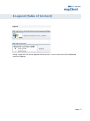
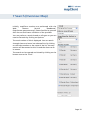
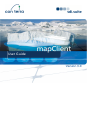
User Guide
Version 3.0
Copyright 2010
The lawful acquisition of the sdi.suite software products and its associated
handbooks entitles the license holder to use the products in accordance with
the terms and conditions of the license.
Any duplication, resale or use of either the software or this handbook in a
manner that does not comply with the terms and conditions of the license is
strictly forbidden and may result in criminal proceedings.
Warranty/ Disclaimer
Although this handbook has been produced with all due care, errors in detail
cannot be excluded. con terra GmbH shall not be liable in any way
whatsoever for any damage occurring as a result of using either this
handbook or the associated software.
Published by
con terra
Gesellschaft für Angewandte Informationstechnologie mbH
Martin-Luther-King-Weg 24
48155 Münster
Tel +49 (0)251.74745-0
Fax +49 (0)251.74745-2111
[email protected]
www.conterra.de
Table of Contents
1 Introduction
1
Features
2
Browser Settings
2
Browser Window Structure
3
2 Menu Bar
4
Navigation tools
4
Measurement
5
Draw
6
Extras
8
More Functions
8
3 Link Bar
10
Login/ Logout
10
Settings
10
Help
10
Restart
10
4 Add Data
11
Web addresses
11
Enter a link
11
Catalog search
11
Browse by theme
12
5 Map Content
13
Folder
13
Services
14
Layer
15
Page iii
Table of Contents
6 Legend (Table of Content)
17
7 Search (Overview Map)
18
Page iv
1 Introduction
1 Introduction
The mapClient component of the sdi.suite is a configurable web application which
enables the efficient use of services distributed by a spatial data infrastructure. The
services are integrated dynamically via standardised interfaces. mapClient is based on
the mapClient Framework Technology developed by con terra and operates as a thin
client, offering a wide selection of functions for displaying, navigating, searching,
selecting and managing OGC WMS and ArcIMS services. By interacting with the Open
Source Software of the 52°North Initiative, services that are protected by a web security
service are incorporated in the mapClient.
By connecting to an OGC Catalogue Service, the required services can be found by
means of a text search and displayed in the mapClient. It is also possible to directly
access a service via a favourites list, or by entering a URL. Current views can be saved as
OGC WMC documents and displayed again later.
The configuration and authorisation management feature of the software allows the
administrator to define the scope of functionality, the layout and the extent of access
for different uses and user groups. mapClient’s functionality can easily be extended by
means of an adapter, with which modules for specific applications can be added.
Page 1
1 Introduction
Features
> Dynamic integration of Map Services
> Easy access via an integrated topic browser
> Spatial reference system selection and free scale entry
> Map navigation with gazetteer service and overview map
> Catalogue Service interface for searching for services and displaying metadata
> Saving and displaying map views via OGC WMC documents
> Selection of predefined styles
> Searching, selecting and querying features
> Distance and area measuring
> Printer functions for map sections (HTML and PDF)
> Entry of text, points, lines, and areas (redlining)
> Forwarding map sections via e-mail
> Access to protected services via sdi.suite securityManager
> Portrayal Service for OGC Web Feature Services (optional)
> Collection and editing of geometries and features using OGC WFS-T interface
(optional)
Browser Settings
Supported browser:
- Microsoft Internet Explorer 7.0 and 8.0
- Firefox 3.x
It is not necessary to accept cookies. Without cookies mapClient is complete functional
but JavaScript has to be activated.
The browser’s pop-up-blocker has to be deactivated, because then the mapClient is
completely usable. Therefore starting the mapClient is combined with a pop-up-blocker
test.
The preferred minimum screen resolution is 1200x780 pixels.
Microsoft Internet Explorer (IE)
The following phenomenon has been known to occur occasionally. After zooming into
the map, the area outside the zoom frame is transparent rather than white. The cause
of this is that “ActiveX Scripting” has been deactivated in the IE programme. You can
Page 2
1 Introduction
restore the setting by going to Tools -> Internet Options > Security tab > Custom level
and activating “Binary and Script Behaviours”.
Browser Window Structure
The central elemnt of the window is the map area. The menu bar that contains tools
and other functions is located above the map area. The following tabs are located in
the left-hand section of the browser window: Themes and Legends. The default tab is
the one containing the Themes directory.
An overview map is positioned to the top left of the map area. The current position is
indicated by a red frame. The overview map can be opened and closed by clicking on
the button in the top left corner.
Top right is a field for a Search (detailed description in chapter 7).
Below the map there is a field for entering or selecting the scale and another field for
selecting the spatial reference system and displaying the scale bar and the coordinates
of the mouse cursor in the map.
Page 3
2 Menu bar
2 Menu Bar
Navigation tools
Zoom In
To enlarge the current map section, click on the map. The point on which the mouse
clicks becomes the centre of the new map image. The scale is halved (zoom levels are
fixed).
You can also define a zoom frame. Click on the map and move the mouse cursor
outwards while holding down the mouse button. Upon releasing the mouse button, the
map will zoom into this frame.
You can also enlarge the map section by turning the mouse wheel upwards
Zoom out
To reduce the current map section, click on the map. The point on which the mouse
clicks becomes centre of the new map image. The scale is doubled (fixed zoom levels).
You can also define a zoom frame. Click on the map and move the mouse cursor
outwards while holding down the mouse button. Upon releasing the mouse button, the
map will zoom into this frame.
You can also reduce the map section by turning the mouse wheel downwards.
Pan
Pan allows you to click and drag the mouse to recenter the map.
Pan
If you would like to pan the map to one direction, choose one of the Pan buttons
arranged around the map.
Identify
When toggled, information about all active map layers can be requested. Toggle button
and click somewhere on the map and all FeatureInfos available will be displayed.
Page 4
2 Menu bar
Search for Hyperlink
If you find a feature of the choosen layer, click it and the hyperlink of the object will be
opened (only ArcGIS Servers and ArcIMS).
Zoom to Full Extent
Click the Zoom to Full Extent button to display the full extent of the map. Depending
on the mapClient’s configuration it may be a defined initial extent.
Zoom to previous extent
Clicking here will cause the previous map section to be displayed (Zoom history).
Please note that once the first map section of the current history has been reached
it is not possible to move further back into previous map sections. This is the case when
the buttons is greyed out.
Zoom to next extent
To reload the subsequent map section, click on this button.
Please note that the button is greyed out once the final map section of the Zoom
history has been reached.
Measurement
Distance Measurement
Click on the map to set the starting point for a distance measurement. Each subsequent
click sets further points and the current respective distance in black. A double click ends
the measurement and the total distance of all the segments is displayed in turquoise.
Area Measurement
Click on the map to set the starting point for an area measurement. Each subsequent
click sets further points of the area polygon. Ther current area is displayed in black. A
double click indicates that the area is complete and total area is then displayed in
turquoise.
Please note:
Page 5
2 Menu bar
-
The shape of the area is monitored constantly to ensure that no invalid
geometries are created.
-
It is necessary to take care exiting the Internet Explorer
Remove the Mearuement and Selection
Clicking the “Remove the Selection” button deletes all geometries and selections on the
map.
Draw
Draw a Point
Click the Digitize a Point button then click on the map for drawing point geometries.
Draw a Line
Click the Digitize a Polyline button and click on the map to set the start point. Every
click will create a new point of the current line geometry (blue polyline). A double click
finishes the line and it becomes red. By clicking once more on the map the new
geometry starts.
Draw a Polygon
Click the “Digitize an Area” button and click on the map. Every click defines a new edge
of the polygon. A double click stops the digitizing and the geometry becomes red.
Clicking on the map once again, starts a new geometry.
Draw a Text
Click on the map to open a new window in which you can enter a text. After clicking on
OK, the text will be displayed in the map.
It is possible to enter several texts, as soon as and as long as this tool is active.
Insert and Move a Point
Activate this tool to move points within a line segment of a linear or area object or to
add new points in a line segement of a linear or area object.
-
Move: When the tool has been activated, all points are displayed. Select the
required point and move it by moving the mouse with the mouse button held
down.
Page 6
2 Menu bar
Insert: In this case, the points on the line segements are additionally displayed. You can
select and move these to define a new point.
Remove a Point
This button removes points from a line or polygon geometry. You can also remove a
point geometry.
Remove geometry
Clicking the “Remove Geometries” button deletes the active geometry (coloured in
blue). The last single-point, the last point of a line or the last edge of a polygon gets
removed.
If your geometries are all closed (coloured in red) always the last geometry which has
been drawn gets removed.
Show coordinates with a Click
Clicking on this tool activates an empty Textfield, named „Easting Northing“ and a
button „Show in tmap“ next to this tool.
Fill the textfield with coordinates and click on the button. This creates a marker on the
defined location and the marker becomes centre of the map.
Click in the map, and the point on which the mouse clicks becomes the marker and the
centre of the new map image.
Please note:
-
Other operations can be done in the meantime. Those don’t affect this tool.
-
Changing the references system will delet all object except for the coordinatorlocation-geometry. The new position will be calculated with the help of the old
coordinates (transformation). Also the new coordinates are shown in the
textfield.
-
Contains the input-box invalid values (e.g. characters), the background color of
the textfield will turn red.
Page 7
2 Menu bar
Extras
Open print page
Click the “Open Print Page” button for a printable version of the map display. But first
you have to define the Print Options:
-
Extent (keep the current extent or the current scale)
Outputformat (HTML or PDF)
Orientation (Portrait or Landscape)
Choose the printquality (low, middle, high)
North arrow
Select legends provided by the services for the Print
Load the project’s settings
Previously stored map views (formats: Web Map Context, Version 1.0 and Version 1.1)
can be reloaded and displayed.
It is possible to load locally stored (Local tab) and predefined (Favourites tab) map views
as well as maps from the Internet (Connect tab).
Save the project’s settings
The current map section is stored as a project (XML file) together with the settings for
the services, layers and displayed geometries (Version 1.1).
Web Service Perfomance
If you would like to know the response times, open the current statistics in a new
window.
Send the Map by Mail
Click “Send Map by E-Mail” button and the current map display will be shown in a new
dialog. Insert all necessary parameters and send that map to your recipient.
Add Data
Detailed description in chapter 4 “Add Data“.
More Functions
Page 8
2 Menu bar
Below the map the activated tool is named (bottom left). Also the current scale is given,
a number of predefined scales is presented in a list, and some coordinate reference
systems supported by the mapClient are provided.
A scale bar is displayed in the map. This bar is switched off using WGS84 (lat/lon) and
ETRS 89 (lat/lon).
Change Scale
You can put a scale value into the field and press enter
or you can choose a predefined scale out of the drop
down list. After choosing a scale out of the list the field
turns into an input field again.
Changing spatial reference system
You can change the spatial reference system on the fly.
Choose a system out of the list. Notice that some
service may not support the new system, so the display
can change.
Coordinates
By moving the mouse over the map the current coordinate
of the mouse position is shown.The coordinates are shown in the choosed CRS.
Page 9
3 Link bar
3 Link Bar
Login/ Logout
Log into mapClient by entering your user name and password; as a result you will not
be required to log in again when accessing seucre services via a preconfigured
authentification service.
One the login is succesfull you will be returned to the map view. The link is now
displayed as “Logout”. The name of the user is also displayed.
Note: If you wish to use a secure service which is based on a dieferent authentification
service, you will be required to perform a further explicit login procedure. Should this
be the case, a new login dialogue will be displayed for this service.
Settings
Open a popoup window in which you can switch the “Automatic Map Refresh’”function
on or off. When you activate this function, the “Refresh Map“ button is no longer
displayed beneath the theme tree. The map is now refreshed automatically whenever
any changes are made to the service, directory or layer visibilty. If you open a service’s
context menu and select the Properties item, any changes made in the Transparency tab
(transparency settings or grey level card) will also be refreshed automatically.
Help
Clicking this link opens the online help of mapClient.
Restart
This link causes a restart of the mapClient.
Page 10
4 Add Data
4 Add Data
The menubar “Extras” contains the tool “Add Data” for loading more services into the
map. The dialogue to add further geoservices and the possibilities for each service type
are described in the following passage.
Load more services to the mapClient dynamically. Depending on the configuration, you
can add these service types:
- Web Map Services (WMS)
- Web Feature Services (WFS)
- ArcIMS Image Services und ArcIMS Map Services (ArcIMS)
- ArcGIS Server Map Services (AGS)
- GeoRSS
- INSPIRE View Services
- Sensor Observation Service (SOS)
After the Properties of the services have been loaded, you can always decide which
layer should be added/removed to the map, which transparency the services should
have and if the layers should be visible or not.
Click on “Add/remove all layers” to add all layers to the map. Click on “Visibile/invisible
all layers” to add all layers and display them in the map.
Web addresses
Choose a service from the favorites list. For the selected service the service’s capabilities
will be shown. You have to decide which layers should be added to the map.
Enter a link
First select the type of the service to be added, because the input will depend on the
service’s type. Then the capabilities will be requested and you have to choose which
layers should be loaded.
Catalog search
Choose a catalog service from the list. Then you start searching without a keyword or
with a number of keywords. The following service types will be found: WFS and WMS. If
you select the spatial filter function, the current extent will be used.
Additionally the current scale of the map-area can be used as a spatial filter.
Page 11
4 Add Data
Also the user can search in distributed catalogues. That means, dependend on the
configuration for the chosen catalogue, the mapClient searches in extern catalogues
too.
A list of search results will be shown. Select a service and its capabilities will be
requested. Then choose the layer of the service.
Annotation for search with keywords: Input of several keywords will search for services
where at least one of the words is contained in the name.
Browse by theme
To use this function there has to be a terraCatalog in use.
It allocates the functionality “Browse by theme” from the terraCatalog. Clicking this tab
the structure of the themes is displayed. By choosing one theme a list of services from
this category will be shown.
Page 12
5 Map Content (Table of Content)
5 Map Content
Open a context menu on each level of the table of contents (folders, services, layers).
These menus show specific functions and tools of the elements. So, different and also
same service types can have different tools. The context menus will be explained below.
Folder
All directories are labeled by a folder icon. The hierarchy of the table of’ contents can
be flat and simple or go deeper into a complex structrure. The structure is defined by
the administrator.
Context Menu - Folder
Create Folder
To insert a folder into the tree of content, you can use the button “Create folder” right
beside the tree of content.
Move up or down
The folder’s menu enables to move folders up or down. Click “Reload map” to apply
the changes.
Rename
An existing folder can be renamed.
Insert
It is possible to insert a new folder into an existing folder. You can move services and
layer into this folder.
Page 13
5 MapContent (TOC)
Delete
This function deletes a folder. Services and layer in this folder will be deleted too.
Annotation
After restarting the mapClient the changes are not present anymore. But it is possible
to save the structure of the folders as WMC and to upload the WMC again.
Services
Services have specific functions restricted by the service type and definition.
Context Menu - Services
Move up or down
Change the services’ order and move them up, down or into another folder. Repeat
until you have the map services in the desired order. Click “Reload map” to apply the
changes.
Remove
Click the “Remove” button to remove a selected service. Click “Reload map” to apply
the changes.
Zoom to service
The map will be changed to the service’s bounding box.
Show legend (optional)
If a service has a legend, it will be shown in the context menu. For opening the legend
in a new window click “Legend”.
Page 14
5 MapContent (TOC)
Properties
Redefine the transparency options or request the service’s capabilities after clicking
“Properties”. Enter the desired transparency value for the map service and repeat for all
desired services. Click “Reload map” to apply the changes.
Note: By default, all added map services are set to 50% and the configured services are
set to an individual value. To make a service more transparent, increase the percentage
value and vice versa. Once you change the transparency of a service, it remains until you
change it again. Moving a map service does not change the transparency of the map
service.
Annotation
The service providers choose the coordinate reference systems which are supported. So
a service could only be displayed in that system. If a service does not support the current
reference system, its layers will be marked in red in the table of contents. Use the
tooltip to get to know the supported systems.
Layer
A layer always belongs to one map service and the tools and functions of the context
menu depend on the service type and the layer’s definition.
Context Menu - Services
Move up or down
The layers of a service can be sorted in a new order by moving up and down. After
changing the arrangement click “Reload map” to apply the changes.
Remove
Remove a layer from the table of contents. After that you have to reload the map.
Page 15
5 MapContent (TOC)
Zoom to extent
Click this function and zoom to the extent of a layer. If there isn’t a bounding box
defined for a layer, the service’s extent will be used.
Show metadata (optional)
If a legend URL is defined for a layer in the capabilities, the metadata will be shown in a
new window.
Styles (optional)
Predefined styles will be offered in a list (defined by the service’s provider). Choose a
style and the layer’s layout will change after reloading the map.
Open Search (ArcIMS only)
Search in the data of an ArcIMS layer. Choose the “Simple
query” or the “Advanced query” for more complex searches
and the combination of queries. You can choose highlighting
of all results and zooming to the extent of all hits. It is possible
also to select a hit out of the result list and to zoom to
that object. The map will be updated.
Feature Inforfmation (optional)
Click “Feature Information” and select an object on the map. A new window will be
opened and the attributes of the selected feature prepared by the provider are
presented.
Select features (ArcIMS and ArcGIS Server Map Services only)
Choose this function and click and drag on the map. The drawn rectangle marks the
extent of selection. All included objects and their information will be shown in a new
window. All selected features will be highlighted.
Annotation
The service’s provider defines the scale hints of a layer. If the current scale isn’t
supported the layer name will be marked in grey. Use the tooltip to get the supported
scales.
If a layer name is marked in red, the service doesn’t support the current spatial
reference system. The tooltip shows all supported systems.
Page 16
6 Legend (Table of Content)
6 Legend (Table of Content)
Using “Legend” the entire legend will be shown. It is an overview of all displayed
services’ legends.
Page 17
7 Search (Overview Map)
7 Search (Overview Map)
Initially, mapClient searches are performed with the
Web
Feature
Service
“GeoNames”
(http://www.geonames.org/). Please familiarize yourself
with the use and licence condition of the provider.
You can perform a search based on all types or you can
restrict the seach by clicking on Options.
The total number of hits is displayed. You can search
through these and zoom into selected hits. By clicking
on the index number or the name of the hit, the map
section will be centred on this hit and the zoom set to
its extent.
The search can be opened and closed by clicking on the
button next to the “Find”.
Page 18