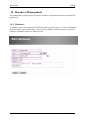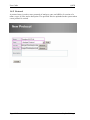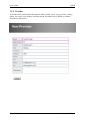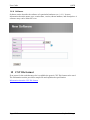
1
QPCR User Guide Version 1.7 Create Date Sep 25, 2007 Last modified May 25, 2009 by Stephan Pabinger User Guide QPCR Table of content Table of content....................................................................................................................... 2 1 Introduction ..................................................................................................................... 4 1.1 Purpose.................................................................................................................... 4 1.2 Hints for using the software .................................................................................... 4 1.3 Example of a standard workflow ............................................................................ 4 2 General information ........................................................................................................ 6 2.1 Welcome screen ...................................................................................................... 6 2.2 Header section......................................................................................................... 7 2.3 Navigation section................................................................................................... 9 2.4 Information section ................................................................................................. 9 2.5 Symbols................................................................................................................. 12 3 Upload and Parse........................................................................................................... 13 3.1 File Upload............................................................................................................ 13 3.2 Multiple Upload .................................................................................................... 15 3.3 Multiple Parse ....................................................................................................... 16 4 Run ................................................................................................................................ 17 4.1 Create a Run.......................................................................................................... 17 4.2 Run List................................................................................................................. 18 4.3 Display Run........................................................................................................... 18 4.4 Parse Run .............................................................................................................. 20 4.5 Parser Log ............................................................................................................. 21 4.6 Progress Information............................................................................................. 23 5 Plate............................................................................................................................... 24 5.1 Well ....................................................................................................................... 25 5.2 Charts .................................................................................................................... 26 5.3 Cq Analyze Results ............................................................................................... 28 6 Experiment .................................................................................................................... 30 7 Project ........................................................................................................................... 32 8 Analyze ......................................................................................................................... 33 8.1 Analyze Setup ....................................................................................................... 33 8.2 Cq Analyze Log .................................................................................................... 37 8.3 Normalization Result ............................................................................................ 38 8.4 Normalization Result – Bars ................................................................................. 40 9 Statistical Test ............................................................................................................... 43 9.1 Test Setup.............................................................................................................. 43 9.2 Graphical Result.................................................................................................... 45 10 Error propagation ...................................................................................................... 47 11 User settings .............................................................................................................. 48 12 Run Deletion Log...................................................................................................... 49 13 PCR Management ..................................................................................................... 51 13.1 CDNA ................................................................................................................... 51 13.2 Target .................................................................................................................... 51 13.3 Instrument Setting ................................................................................................. 52 13.4 Passive Reference.................................................................................................. 54 13.5 Primer.................................................................................................................... 55 13.6 Primer Validation .................................................................................................. 55 Page 2/63 Stephan Pabinger User Guide QPCR 13.7 Realtime Chemistry............................................................................................... 59 14 Resource Management .............................................................................................. 60 14.1 Hardware ............................................................................................................... 60 14.2 Protocol ................................................................................................................. 61 14.3 Provider ................................................................................................................. 62 14.4 Software ................................................................................................................ 63 15 CSV file format ......................................................................................................... 63 Page 3/63 Stephan Pabinger User Guide QPCR 1 Introduction QPCR is a web application designed for storing, parsing, managing, and analyzing qPCR data. Including several different algorithms it can facilitate the analysis of qPCR results. The application is not intended to be installed on client machines. We suggest installing one instance for your group on a Linux server where users connect to by a standard Web browser. Additionally you can request an account on the server hosted by the TU Graz. 1.1 Purpose This document is not written to be read from the first to the last page. It is more a compendium that tries to tell what to do if one is puzzled. However for an introduction it makes sense to read chapters 3 to 8 to get general information about the application. These chapters are sorted according to a typical procedure of uploading, parsing, analyzing, and normalizing a qPCR experiment. 1.2 1.3 Hints for using the software Always use meaningful names, to be able to distinguish the different entries in the future. Example of a standard workflow Upload files using the multiple file upload interface or upload them separately Parse and analyze the newly uploaded files using the multiple parse interface After parsing and analyzing is finished check the created runs: Check hardware/software/instrument setting & SDS, Rn files Check plate including wells Display charts and check values (save them as picture) Check Cq analyze result values Create experiment using the desired runs Analyze experiment (save analyze settings) Check normalized Cq values Export charts (picture) and Cq values (file) Perform statistical test Export fold change charts and test results Page 4/63 Stephan Pabinger User Guide QPCR This flowchart displays the suggested methods (printed in bold) for each analysis step. Please keep in mind that these suggestions do not consider special instrumental setups or practices of your laboratory. The uniqueness of this application is the support of several different methods and a variety of setup parameters which are helpful to find the best setup for your data. Page 5/63 Stephan Pabinger User Guide 2 QPCR General information This chapter contains information about the basic layout, the color and icon convention used throughout the whole application. 2.1 Welcome screen The picture above displays the welcome-screen of QPCR. The main view is divided into 3 sections: 1. The header section consists of some images on the top, of one bar managing the display settings, and one bar displaying information about the AAS(Authentication and Authorization System) 2. The left bar contains the menu used for navigation 3. The center frame displays the selected information Page 6/63 Stephan Pabinger User Guide 2.2 QPCR Header section 2.2.1 Display bar The Home- link sends the user back to the start page. The User Guide- link opens this document. The Tutorial link opens the tutorial The Information link displays a page with useful information about the software At the right side there are 3 icons where the user can change the spatial usage of the browser window: : resizes the window to the default size : stretches the window to the full width of the screen : uses the full width of the window and the images at the header section disappear, only the display bar and the authentication bar will stay. If the user is not logged in the following bar is shown: Page 7/63 Stephan Pabinger User Guide QPCR By clicking on the Log in link the user is directed to the login window. If the user is logged in the following bar is shown: It provides the possibility to: Log out Change user settings Display new Analyzer Logs (only shown when new results are present) Display new Parser Logs (only shown when new results are present) Display new Run Deletion Logs (only shown when new results are present) Page 8/63 Stephan Pabinger User Guide 2.3 QPCR Navigation section The navigation section is positioned at the right side of the screen. Grey fields with bold text are headers that reveal a submenu when the user clicks on them. A submenu can contain another submenu or links to a certain interface. 2.4 Information section QPCR uses a list form to present overviews of data (shown in the figure below). The header section contains 2 links: Customizable queries Customizable display The table with the data is always enclosed by bars used for scrolling and most columns in the table are sortable. An arrow indicates the current sort direction of the corresponding column. Sort settings are saved in the database for each user and are loaded when the user logs in the next time. 2.4.1 Customizable queries Queries are used to narrow the list of displayed entries according to the users needs. They Page 9/63 Stephan Pabinger User Guide QPCR can be added, removed, and saved. When the operators LIKE and NOT LIKE are used a preceding or trailing asterisk needs to be entered. The button Submit Query submits the entered query and updates the result table. Reset Query removes all entered queries and submits a query without any userdefined filters. Restore Default restores the default set of queries and submits them. Save Queries saves the current set of queries as default for this page. Unless the user changes the queries the data on that page will always be filtered with this default set of queries. 2.4.2 Customizable display The information that will be displayed on the screen is customizable to the needs of the user. One can select the desired columns by clicking on the checkboxes and update the view on the data by pressing the button Update. Save Settings allows the user to store his/her own display settings and whenever the user enters the same page his/her settings will be displayed by default. 2.4.3 Scrolling bar The left side of the scrolling bar displays the number of found elements (depending on the query the user submitted). In the middle of the scrolling bar the actual page and the total number of pages are displayed. At the right side one can choose how many entries are shown per page. Moreover the user can directly jump to a page by entering its number. Page 10/63 Stephan Pabinger User Guide QPCR 2.4.4 Table view The table view consists by default of the following parts: The header: if one hovers the mouse over a column-name the colour changes to blue and one can sort the list by this column The number in the first column indicates the hit number of the entry corresponding to the order Detailed information about an entry is loaded by clicking on links of the corresponding entry Indicates that the data can be edited Indicates that there is information downloadable Indicates that the entry can be shared Indicates that the entry can be removed By clicking on the share icon the user is redirected to the sharing page. and deleting are When selecting a user or an institute the checkboxes for editing enabled and the user can additionally specify if the shared entry can be edited or deleted. Page 11/63 Stephan Pabinger User Guide 2.5 QPCR Symbols : Indicates that one can edit the data : Indicates if there is some information downloadable : Indicates that one can delete this entry : Indicates that there is additional information available : Indicates that the user can share his/her data to other users of the system : Indicates that the entry is currently parsed : Indicates that the entry is currently analyzed : Indicates that the entry is currently deleted : Puts all entries from the left list into the right list : Puts all entries from the right list into the left list : Puts one or many (selected holding ctrl) entries from the left list into the right list : Puts one or many (selected holding ctrl) entries from the right list into the left list Page 12/63 Stephan Pabinger User Guide 3 Upload and Parse 3.1 File Upload QPCR Files can be uploaded separately or in batches using the multiple file upload interface (described in 3.2 ). When uploading a file the user has to specify the correct file type. Currently there are 2 file types available: File (.SDS – Applied Biosystems, .IXO – Roche, .CSV generic) Export File (Clipped Files, Component Files, DeltaRn Files, XML Files) File uploads are visible for all users of the same institute. When deleting files the user can choose to delete associated runs, experiments, and additional files by ticking “Delete associated Runs and Experiment”. By pressing the Delete button a list of entries is shown that are going to be deleted. Page 13/63 Stephan Pabinger User Guide QPCR Page 14/63 Stephan Pabinger User Guide 3.2 QPCR Multiple Upload The multiple file upload interface allows the user to upload several files at once. The type of the file (File, Export File) is determined automatically (if option is selected). Files are added using the Add Files button and after uploading them a status message is shown. If this page does not show up please check if Java Version 1.5 is installed. Page 15/63 Stephan Pabinger User Guide 3.3 QPCR Multiple Parse The multiple parse section is put into the “Upload & Parse” menu in order to increase the usability, because typically files are parsed and analyzed immediately after uploading. This interface shows by default only files (SDS, IXO, CSV) which are not linked to a run and therefore have not been parsed yet. Moreover the user can specify whether all files of the institute or only the files uploaded by the user are displayed. In addition all uploaded files can be shown in this interface. Each file can be accompanied by a maximum number of three additional export files (Export file) which are automatically linked to the according file. Remark: Export files need to contain the file name (e.g.: SDS: myFile.sds; rn: myFile_clipped.txt) in order to be correctly identified by the system. For each File – Export file combination the user can specify whether the files should be (1) parsed and analyzed, (2) only parsed, or (3) skipped. Pressing submit parses and analyzes the files in the background and creates a run for each selected file. The methods (one or multiple) used for analyzing can be set using the user settings interface (see 11 ). The legend explains which files need to be exported and parsed (for each thermocycler) in order to guarantee a successful analysis. More information about parsing is provided at 4.4 . Page 16/63 Stephan Pabinger User Guide 4 Run 4.1 Create a Run QPCR A Run in the application QPCR represents a performed qPCR run. To create a run three properties need to be specified: a name, the date of creation, and a category (relative or absolute run). In order to attach existing plate information to a run, a file for parsing needs to be specified (SDS file -> the *.sds file of the thermocycler, Rn Files -> exported Rn files). Category, Hardware, Software, Instrument Setting, and Plate are created by the parser and are set during the parsing process. Nevertheless they can be set manually by the user. Page 17/63 Stephan Pabinger User Guide 4.2 QPCR Run List The general layout of the run list is equal to the layout described in 2.4.4 . In addition to the standard view the run list contains three more columns which indicate the state of a certain run. The first column describes whether the run is currently parsed (blue dot). The second column (green dot) indicates that the run is currently analyzed. The third column (red dot) informs the user that the run is currently getting removed. Moreover the plate icon sends the user directly to the plate of the run and the chart icon directs the user to the chart view. 4.3 Display Run After a run has been parsed the combo boxes for run category, hardware, software, instrument settings, and plate are automatically set to the corresponding entry by the parser. The information section at the bottom of the page displays the current parse status and the latest successful parse job. Using the checkbox next to Options, the user can specify whether the names of wells (specified in the thermocycler software) are equal to sample names. Pressing the Parse button starts a parsing job using the files specified above. Whenever a parsing job is started the old plate including all plate information is deleted and a new plate is created. Each run possesses a plate which can be displayed by clicking on the show button next to Plate. If a run has not been added to an experiment the Create button next to Create Experiment including plate produces an experiment and adds the selected run to this experiment. Page 18/63 Stephan Pabinger User Guide QPCR Page 19/63 Stephan Pabinger User Guide 4.4 QPCR Parse Run Whenever a parsing job is started a notification message is displayed. The progress of the job can be monitored using the Progress Information list (described in 4.6 ). To parse a thermocycler run at least the main file (.eds, .sds, .ixo, .csv) has to be specified. The following files need to be uploaded into the application: Abi SDS 7000: SDS file Export and specify component file (e.g.: run1_Component.csv) Export and specify deltaRn file (e.g.: run1_DeltaRn.csv) Abi SDS 7500 SDS file Export file including Sample Setup and Amplification Data Abi SDS 7900 SDS file Export and specify clipped file (e.g.: run1_Clipped.txt) Roche Lightcycler 2.0 / 480 IXO file Export the fluorescence history in the Run->Online Data Display window; Select all samples, then select “Fluorescence history” as the Chart and “Fluorescence over Cycles” as the Axis. Then right click on the chart, select export, pick the data tab and select XML. CSV Generate a CSV file described in 15 . After a parsing job is complete a notification pops up in the display bar ( 2.2.1 ) which links to the parser log page. Page 20/63 Stephan Pabinger User Guide 4.5 QPCR Parser Log Displayed below is the parser log page. The coloring of the parser logs is explained in the attached legend. Each Parser log shows detailed information about the completed parsing job. It displays whether the job was successful, when it took place, and if a plate is attached to the run. Warnings produced during the parsing job are displayed in a box. Furthermore the result page shows the parsed run name and information about hardware, software, and instrument settings. Information about the created plate contain its id, name, size, input file, and plate status. Moreover the user can enter a description and update the plate using the Update & goto plate button. The three text fields for target, cDNA, and passive reference may contain entries that need to be added to the database. Page 21/63 Stephan Pabinger User Guide QPCR Page 22/63 Stephan Pabinger User Guide 4.6 QPCR Progress Information Progress Information is positioned in the run menu and shows the progress of parsing and analyzing jobs. The progress information list is automatically updated every five seconds. For each process the corresponding method is shown and by clicking on the run name the user is linked to the specified run. Page 23/63 Stephan Pabinger User Guide 5 QPCR Plate The upper part of the plate view contains detailed information about a plate entry. It shows the plate name (which is equal to run name), barcode, description, SDS & Rn files, and plate size. The Show button next to Display Charts sends the user to the charts interface described in ( 5.2 ). As soon as there are analyze results available the user can display them by clicking on Show next to Display Cq Analyze Results. The lower part of the plate view shows the list of attached wells. Displayed are: well number, whether this well is set to omitted, passive reference, target(s), cDNA, and task. Each well can be shown in detail by clicking on the well number. Moreover the wells can be edited by clicking on the edit symbol of the according well. Page 24/63 Stephan Pabinger User Guide 5.1 QPCR Well A well represents the reaction room on a plate. Each well consists of the following attributes: well number, omitted, x and y position on the plate, reaction volume, task (e.g.: standard, target, …), sample quantity, sample (cDNA), sample concentration, passive reference, realtime chemistries, targets, and description. Wells are a subunit of plates and can not be created without a plate reference. Page 25/63 Stephan Pabinger User Guide 5.2 QPCR Charts The chart interface can display four different datasets: raw dissociation data, derivative dissociation data, Rn vs. cycle, and deltaRn vs. cycle. The Show button next to the plate name redirects the user back to the plate interface. Tabs are used to navigate between the different datasets. Charts includes a title, axis annotation, and a legend and can be saved as a picture by right clicking on the image or by using the Export As SVG button. Below the chart, a grid or list is representing the plate layout, where each cell stands for a well of the plate. By clicking on a cell the well is added to the chart and the image is updated. Multiple cells can be selected by holding the ctrl key, clicking on the start well, holding the left mouse button, and dragging the mouse to the desired end point of the rectangle. When the mouse button is released the selected wells are added to the chart. Moreover entire rows and columns can be added to the chart by clicking on the respective header. Omitted wells are colored in light blue, whereas empty wells are colored in dark blue. To change the chart to a linear/logarithmic scale the user can click on the appropriate field. By clicking on the button Clear All the current cell selection is cleared. Page 26/63 Stephan Pabinger User Guide QPCR Page 27/63 Stephan Pabinger User Guide 5.3 QPCR Cq Analyze Results The Analyzer Results page displays a short overview over completed analyzes of the selected plate. It is divided into two sections: successful analyzing jobs and not successful analyzing jobs. Each entry in the successful analyzed list contains the name of the selected analyzer, the time of submission, and an export possibility. By clicking on the View button the user is guided to a detailed list of the selected analyzing result (described in 5.3.1 ). The same list is exported when the user presses the Export button, whereas the file format can be chosen using the list next to the Export button. Clicking on the delete symbol brings up a popup message which asks for confirmation to delete the analyzer result (including its Cq, efficiency, starting amount, and correlation value). 5.3.1 Detailed Analyzer Results The detailed analyzer results page displays detailed information about a particular analyzer result. The header section contains the name of the plate including a link back to it, the name of the analyzer, and the submission date. The export feature is the same as described in 5.3 . Each entry of the list contains information about a particular well of a plate. Displayed are: sample name, target(s), Cq value, and efficiency. Page 28/63 Stephan Pabinger User Guide QPCR Page 29/63 Stephan Pabinger User Guide 6 QPCR Experiment An experiment in the application QPCR maps a real world qPCR experiment. It consists of a name, a creation date, an optional description, and numerous runs. The experiment list is somewhat different to normal table views ( 2.4.4 ) because it contains an additional symbol for each entry. By clicking on it ( ) the user is guided to the analyze setting page ( 8.1 ). Experiments that cannot be analyzed have a grayed out symbol, experiments that can be analyzed have a colored symbol. Page 30/63 Stephan Pabinger User Guide QPCR The detailed view of an experiment contains its name, creation date, description, and added runs. The Go button next to analyze sends the user to the analyze setup page. Each added Run can be viewed by pressing the Show button next to the run an by clicking on Show Cq and Efficiency Results the user is sent to the Cq Analyze Results page ( 5.3 ). Page 31/63 Stephan Pabinger User Guide 7 QPCR Project Projects are used to group several different experiments. Each project consists of a name, date, and description. Experiments can be added to the project by assigning them to the right selection box. Existing projects are displayed in a tree where the associated experiments and their runs are shown. The user can sort the list and its child nodes according to name or date. Moreover links to the detailed pages of projects, experiments, and runs are given and an icon is shown to quickly jump to the analyze setup page of an experiment. Page 32/63 Stephan Pabinger User Guide 8 Analyze 8.1 Analyze Setup QPCR The Analyze Setup page is divided into two parts: the upper section contains information about the experiment, gives the user the possibility to save the current setting, and allows the user to load previously saved settings. The lower part contains a tabbed navigation which is used to define the different settings for analyzing an experiment. In general one can differ between two classes of analyzes: Cq value / efficiency value calculation Normalization Cq value / efficiency value calculation needs to be done before normalization can be started, because normalization is dependent on Cq values (and if chosen also on efficiency values). Therefore whenever a Cq calculation method is selected, the application checks if theses values are existent. If they are not present a message is shown at the bottom and the button changes from Analyze to Calculate values. By pressing this button the calculation of Cq/Efficiency values is started in the background. Because of the fact that this process is very time consuming the calculation is performed in the background. The normalization of Cq values is a very quick task and is therefore not performed in the background. It is only started if Cq values and efficiency values (if selected) exist. Normalization of the Cq values contains the following steps: Technical replicate handling – samples having the exact same name (cDNA) are averaged Efficiency correction Normalization using the selected reference genes – multiple reference genes are geometrically averaged Inter run calibration (on a gene specific base) – samples that are present on all used runs are used as calibrators For more information please consult the paper “qBase relative quantification framework and software for management and automated analysis of real-time quantitative PCR data” by Hellemans et al. (2007). 8.1.1 Cq Calculation Methods The first tab displays the available Cq calculation methods. Shown is the name of the method and a short description. Whenever a calculation method is chosen the application checks if Cq values are existent and displays the corresponding message at the bottom of the page. Page 33/63 Stephan Pabinger User Guide QPCR 8.1.2 Sample/Target selection The second tab allows the user to select samples and targets that will be used for normalization. On the left side, available samples and targets are displayed (omitted wells are not considered for normalization) in list form and on the right side the samples and targets used for normalization are shown. Using the arrow buttons the user can add or remove one or many entries form each list. When “Use Replicate Handling” is checked Cq values of replicates (all sample/target combinations on one plate) are averaged. When ticking “Average technical replicates over plates” then technical replicates are not only averaged within one plate but averaged over all plates that are in this experiment. 8.1.3 Housekeeping Genes selection The selection mechanism for reference genes is the same as described in 8.1.2 . If a reference gene is put into the used list the corresponding target is put into its corresponding used list, because technically a reference gene is a target. When analyzing multiple runs in one experiment the reference gene(s) can be: Page 34/63 Stephan Pabinger User Guide QPCR on only one plate and Cq values of the other plates are normalized to the values of the reference genes present on only one plate on every plate and Cq values are normalized to the values of the reference gene on the current plate If the checkbox next to “Reference Gene(s) need to be on all plates” is checked reference gene(s) need to be present on every plate. 8.1.4 Normalization The last tab is used for setting the normalization parameters. It is divided into two parts: definition of efficiency, specification of normalization algorithm. The efficiency of each well can be specified in three ways: Global efficiency: each well has the same user defined efficiency Efficiency determined by an analyzer: each well uses the calculated efficiency of a certain analyzer Target dependent efficiency: the user can specify the efficiency for each used target. If the target has a stored efficiency (see 13.6.2 ), it is automatically loaded into the corresponding field. Moreover the efficiencies calculated by Primer Validation (see 13.6 ) can be loaded for a particular primer validation run by selecting the corresponding entry in the combo box. To normalize the Cq values one of the three methods needs to be picked. In addition to these methods efficiency can be calculated using dilution series. Such a series is determined by the task attribute of a well which needs to be set to standard. The selection of normalization algorithm is similar to the selection of Cq calculation method described in 8.1.1 . Page 35/63 Stephan Pabinger User Guide QPCR Page 36/63 Stephan Pabinger User Guide 8.2 QPCR Cq Analyze Log When a Cq calculation is finished a message is displayed in the header section ( 2.2 ). By clicking on this link the user gets redirected to the Cq Analyzer Log page which lists the completed analyzing jobs. Entries that have not been viewed are colored blue and are put at the beginning of the list. The detailed Cq Analyzer Log contains information about the plate name, plate id, whether the analyzing job was successful, submission date, and in case of an error the error message. Page 37/63 Stephan Pabinger User Guide QPCR In case it was not successful: 8.3 Normalization Result The normalization result view contains information about the normalization process of Cq values. The header section displays the experiment and provides a link back to it. Pressing the button called Display Bars & Quality Control sends the user to the Bars section of normalize results ( 8.4 ). The button Back to Analyze Setup sends the user back to the setup page. Perform Statistical Test sends the users to the statistical test setup page. By selecting on or many samples in the Reference Samples box the calculated values of each sample are referenced to (divided by) the values of the selected samples. If more than one reference sample is picked the average of the selected samples is used. Save Normalize Results saves the current results to the database. These entries are used if external applications request for normalized QPCR results (MARS database). Using the export feature the user can export the result list in various file formats. Page 38/63 Stephan Pabinger User Guide QPCR By pressing on the Show/Hide log2 button the user can choose to display the calculated log2 results. Each entry in the list contains information about: cDNA target task average Cq value (averaged value of replicates) CV value relative Cq value (rel Cq – relative quantity of Cq value using gene specific efficiency (E∆Cq)) normalized relative Cq value (NRCq – normalized using geometric mean of reference genes) calibrated normalized Cq value (CNRCq – normalized NRCq values using calibrators) their respective standard errors. The legend at the bottom of the page explains each calculated result. Page 39/63 Stephan Pabinger User Guide 8.4 QPCR Normalization Result – Bars The normalization result bars page is divided into two sections. The upper part contains information about the normalized experiment and provides links to the normalization result page, statistical test setup page and normalization setup page. The lower part consists of a tabbed navigation interface with three tabs: Multiple Targets, Single Target, and Quality Control. 8.4.1 Multiple Targets The “multiple targets” tab allows the user to choose one or many targets. The chosen targets are shown in the legend and colored in different colors. The x-axis contains the selected samples and the y-axis shows the normalized Cq value whereas each bar displays the calculated error. The user can customize the chart in the following ways: Select the displayed error (standard error, standard deviation, confidence interval) Select the samples used for referencing Set a title for the chart Group the bars by sample or target Select which sample should be displayed in the chart The order of samples is equal to the order set in the single target chart (see 8.4.2 ). The chart can be saved either by right clicking on it and selecting the corresponding option or by using the Export AS SVG button. Page 40/63 Stephan Pabinger User Guide QPCR 8.4.2 Single Target The single target view shows samples of one specific target. The user can customize the chart in the following ways: Switch between Cq value, normalized Cq value, and calibrated normalized Cq value and their log2 values Select the displayed error (standard error, standard deviation, confidence interval) Select the samples used for referencing Set a title for the chart Specify the displayed minimum and maximum value Set the tick size Set the base to an arbitrary number or the lowest number displayed in the chart Include the number of replicates of each sample in the chart Customize and view the samples displayed in the chart o Include/Exclude the sample from the chart o Set an alternative name o Set a specific color for each sample o Rearrange the list using drag and drop The selected color, alternative name, and position of each sample is stored in the database and loaded when this experiment is analyzed again. 8.4.3 Quality Control Quality Control is only useful when multiple reference genes have been selected. Page 41/63 Stephan Pabinger User Guide QPCR The CV value represents the coefficient of variation of the normalized reference gene expression levels. A value lower than 50% for heterogeneous panels (lower than 25 % for homogeneous) is typically observed for stably expressed reference genes. The M value (geNorm) represents the mean stability measure of the used reference genes. A value lower than 1 for heterogeneous panels (lower than 0.5 % for homogeneous) is typically observed for stably expressed reference genes. The lower these quality values are, the more stable the reference genes are expressed in the tested samples. The next section checks if a NTC has been used for each selected target. In the next table the differences between the technical replicates is calculated and the user can choose to color the ones that are above a certain user defined threshold. Page 42/63 Stephan Pabinger User Guide 9 QPCR Statistical Test Statistical tests are used to test several groups (in the software named as class) of samples for significant difference between them. It can be used, for example, to test whether several biological replicates of certain samples are differentially expressed to several biological replicates acting as a control. 9.1 Test Setup The header section of the setup page provides links back to the experiment, to the Analyze Setup (see 8.1 ) and to the Normalization Result page. The following parameters can be set for the statistical test: Define which samples are included in the test Select the reference sample(s) used for referencing the calculated values. This has nothing to do with the actual statistical test. It is used to calculate the fold change ratios. By selecting a class all samples in this class will be used as reference samples. Select which test should be used Select the p-Value type Select multiple testing correction: Choose between four established methods to correct the calculated p-value; Additionally calculate your p-values without multiple testing correction Select the data type: choose between CNRCq and log2 CNRCq Select if samples should be averaged in each class. This causes that the output chart displays only the averaged value (only on bar) for each class. The next part of the setup page is used to define the classes (groups) and their attributes. The user can define as many classes as needed which are then used in the statistical test. One class acts as the statistical reference (reference class) and all other classes are tested for their statistical significant difference to this reference class. Do not confuse this with the sample references which are used to reference the samples to a given set of samples (no statistical test). Each class has a color or pattern associated, is given a specific name, and needs to consist of at least one sample. In one class the property Set As Statistical Reference is set which specifies to which class all other classes are compared (previously described). Classes can be added or removed from the list and the complete statistical setup is stored in the database and loaded whenever the test is repeated. Page 43/63 Stephan Pabinger User Guide QPCR Page 44/63 Stephan Pabinger User Guide 9.2 QPCR Graphical Result The upper section of the statistical result page displays links back to the various analysis pages and provides the functionality to export the generated results. The combined target view displays the averaged results of each class (in this case the classes replicates1 and replicates2) for the selected targets. It is possible to select multiple targets and to set a title for the generated chart. Page 45/63 Stephan Pabinger User Guide QPCR Next the results for each target are shown. Both the calculated values and the created chart are displayed. Displayed are the following values for each class: The calculated p-Value The average ddCq value of the class divided by the average value of the statistical reference class (NOT reference samples) The average SD of the class divided by the average SD of the statistical reference class (propagated standard deviation) Whether this class was set as statistical reference In addition to the graphical view results of the statistical test can be displayed in text format. This view is accessed by clicking on show next to Display Test Result. For each class the p-Value, average ddCq/reference and the corresponding error are shown. In addition, the fold change values and the corresponding errors of the samples used for the statistical test are displayed in a list. Page 46/63 Stephan Pabinger User Guide QPCR 10 Error propagation Throughout the whole analysis pipeline error propagation is performed to ensure statistical relevant results. It is based on truncated Taylor series expansion and uses general valid error propagation laws. Included in the pipeline is: Technical replicate handling Efficiency correction Normalization using reference genes Inter-run calibration Referencing the normalized Cq values to sample(s) Averaging of biological replicates Page 47/63 Stephan Pabinger User Guide QPCR 11 User settings The user settings interface can be reached by clicking on the corresponding link described in chapter 2.2.1 . Preferred Cq Analyzer(s) and Preferred Efficiency Analyzer(s) defines the analyzer(s) that is/are used when the user starts a multiple parse (described in 3.3 ). Use NTC’s in Cq analysis / Normalization defines whether the non template controls are used in the corresponding analysis. Chart Background defines the background color that is used in every chart (default is white). Page 48/63 Stephan Pabinger User Guide QPCR 12 Run Deletion Log Deleting a run is a very time consuming operation and is therefore performed in the background. Whenever such an operation is completed the user gets informed that a new Run Deletion Log is available. Results that have not been viewed are colored in blue and are put at the top of the list. After a Run Deletion Log run deletion result has been viewed by a user it is automatically deleted. Each Run Deletion Result entry presents information about the deleted run, whether the job was successful, the submission date, an error message if the deletion job was not successful, and the view status. Page 49/63 Stephan Pabinger User Guide QPCR Page 50/63 Stephan Pabinger User Guide QPCR 13 PCR Management The menu PCR Management groups properties that are necessary to specify a qPCR run. 13.1 CDNA A cDNA entry represents a physical cDNA (sometimes called sample) in qPCR experiments. Each entry consists of a name, amount, concentration, an optional protocol, an option to specify whether DNAse treatment was performed, and a description. RNA Extract defines the extract where the cDNA was created from and is linked to the MARS database. 13.2 Target A target contains information about the target’s name, type, barcode, description, and used primers. Page 51/63 Stephan Pabinger User Guide QPCR 13.3 Instrument Setting An Instrument Setting represents a thermocycler setup for a qPCR run. The general information contains a name and a description. Each setting consists of stages which are divided into steps. Each stage has a stage-number and a number of repetitions. Steps are also numbered and each step consists of a duration and a temperature. During the parsing process these values are extracted form the SDS file and stored in the database. Users can manually insert an instrument setting with at least one stage and one step in each stage. The number of stages and steps is not limited. Page 52/63 Stephan Pabinger User Guide QPCR Page 53/63 Stephan Pabinger User Guide QPCR 13.4 Passive Reference A passive reference entry consists of name and description and can be linked to a well. Page 54/63 Stephan Pabinger User Guide QPCR 13.5 Primer To create a primer six mandatory properties need to be set: name, sequence (the actual DNA sequence), sequence position, primer length, primer concentration, and type (forward, reverse, or probe). Optionally temperature, logNr, provider, author, and description can be specified. 13.6 Primer Validation Primer Validation is used to determine the efficiency of targets by using serial dilution series. After calculating the Cq values linear regression is used to calculate the efficiency of the target. The efficiency is then stored in the database and can be loaded into the analysis of an experiment (see 8.1.4 ). In order to calculate the efficiency, wells on the plate need to be marked by setting the task as standard! 13.6.1 Perform Validation First a Run, that has been used for primer validation (standard curve), needs to be parsed and analyzed using the standard procedure. Dependent on the selected Cq analyzer the systems checks if Cq values exist for this analyzer. If they are not present, the Cq value calculation can be started directly from this interface. If the system has found Cq values for this analyzer the calculation of efficiency values can be started by pressing the Analyze button. If this plate has been analyzed before the system displays a warning that the results will be overridden. When the calculation is finished the results for each target on this plate having a serial dilution series are shown in a list. Displayed are the efficiency, the standard error, R2, and the slope of the calculated line. The efficiency of each target can be stored by ticking the checkbox and pressing the save button. Page 55/63 Stephan Pabinger User Guide QPCR Displayed below is the message shown when Cq values don’t exist. The lower part of the page shows a graphical representation of the fitted line for the selected target. Targets can be selected by choosing the corresponding entry in the nearby combo box. Below the chart, a representation of the plate layout is displayed that marks the wells currently used to calculate the efficiency. The system allows the user to de/select wells used for calculating the curve (either by pressing on the point in the graph or by pressing on the colored well in the grid). Results are updated on the fly after the particular well has been in/excluded from the calculation. The color code used in the plate layout representation is explained in the legend. After the user is satisfied with the result of the calculated efficiency (using the slope of the curve) it can be stored in the database. The choice which wells are used for the calculation is stored in the database and loaded when the primer validation is performed again. Page 56/63 Stephan Pabinger User Guide 13.6.2 QPCR Target Efficiencies By pressing on Target Efficiencies a list of the currently stored efficiencies is shown. For each target the following information is displayed: Efficiency Standard error of this efficiency Slope R2 If this efficiency is used for this target The run used to calculate the efficiency (run used to perform the primer validation) If available a button to set this efficiency as the current on (activate) A link to delete this efficiency It is possible to perform several primer validations for one target and store each calculated efficiency. Therefore the system provides the opportunity to set one efficiency as the active one which is loaded into the analysis settings when an experiment is analyzed (see 8.1.4 ). To switch the currently active efficiency the button in the Activate column has to be pressed. Page 57/63 Stephan Pabinger User Guide QPCR Page 58/63 Stephan Pabinger User Guide QPCR 13.7 Realtime Chemistry A realtime chemistry (e.g. TaqMan, Scorpions, SYBR, ...) entry consists of name, catalog number, concentration, provider, and description. Realtime chemistries are linked to wells. Page 59/63 Stephan Pabinger User Guide QPCR 14 Resource Management The management section groups properties which are of general information in the QPCR application. 14.1 Hardware A hardware entry in the application QPCR describes a physical device. It stores information about the name, type, creation date, version, shown attribute, and description of a specific hardware. Hardware entries are linked to runs. Page 60/63 Stephan Pabinger User Guide QPCR 14.2 Protocol A protocol entry is used to store protocols of analyzes, runs, and cDNAs. It consists of a name, a type, its files, and a description. The specified files are uploaded to the system when a new protocol is created. Page 61/63 Stephan Pabinger User Guide QPCR 14.3 Provider A provider stores information about name, abbreviation, street, city, province, country, phone, fax, email, web address, and description. Providers can be linked to realtime chemistries and primes. Page 62/63 Stephan Pabinger User Guide QPCR 14.4 Software Software entries describe the software of a particular hardware (see 14.1 ). It stores information about the name, type, creation date, version, shown attribute, and description. A software entry can be linked to a run. 15 CSV file format If no parser for the used thermocycler is available the generic CSV file format can be used. The information section provides a sample file and explains the specification. Information about the CSV file format Page 63/63 Stephan Pabinger