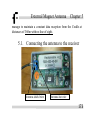
1
MicroLog & MicroLog Plus
User Guide
Sixth Edition
First print
Printed in July 2003
Feingerätebau K.Fischer GmbH
Venusberger Straße 24
D-09430 Drebach
Germany
Phone
Fax
E-mail
Internet
+49 (0) 37341 / 487-0
+49 (0) 37341 / 487-30
[email protected]
www.fischer-barometer.de
Contents
Using the Guide .............................................................................. 15
Chapter 1 MicroLog ..................................................................... 17
1.1.
Overview......................................................................... 18
1.2.
Getting Started ................................................................ 19
1.3. Working with MicroLog ................................................. 20
1.3.1. Data Displays............................................................... 20
1. Current data ........................................................... 20
2. Minimum and maximum values ............................ 20
3. Status messages...................................................... 23
1.3.2. Working Modes............................................................ 25
1.3.3. MicroLog’s Connections.............................................. 26
1. Connect MicroLog to a computer .......................... 27
2. Connect MicroLog to an external sensor ............... 29
1.3.4. Sleep Mode .................................................................. 30
1.3.5. Replacing the Battery ................................................... 32
1.4. Working with the MicroLab Software............................. 34
1.4.1. Install the Software ...................................................... 34
1.4.2. Overview...................................................................... 35
1.4.3. Getting Started ............................................................. 36
1. Download data ....................................................... 36
2. Save data ................................................................ 37
3. Open files............................................................... 39
4. Display properties .................................................. 39
5. Print a graph........................................................... 40
6. Print a table............................................................ 41
1.4.4. View the Data .............................................................. 43
1. Display options ...................................................... 43
2. Graph ..................................................................... 43
3. Table ...................................................................... 44
4. Data Map ............................................................... 45
5. The Cursor ............................................................. 47
6. Zooming and Panning............................................ 48
7. Crop the data.......................................................... 52
8. Format the graph.................................................... 53
9. Display alarm levels............................................... 54
10. Change the temperature units................................. 55
11. Export data to Excel............................................... 55
12. Copy the graph as a picture.................................... 56
1.4.5. Program MicroLog....................................................... 56
1. Setup ...................................................................... 56
2. Saving Setup .......................................................... 66
3. Start recording........................................................ 67
4. Stop recording........................................................ 67
5. Sensor calibration................................................... 68
Calibration password ....................................... 68
Humidity calibration ........................................ 70
Temperature calibration ................................... 73
6. Defining a custom sensor ....................................... 74
7. Communication setup ............................................ 76
1.4.6. Automatic Daily Download.......................................... 78
1. Prepare the MicroLog. ........................................... 78
2. Automatic download .............................................. 82
3. Manual transmission .............................................. 83
4. Viewing Daily Download data and status .............. 83
1.4.7. Toolbar Buttons ........................................................... 85
1. Main (upper) toolbar.............................................. 85
2. Graph (Lower) toolbar ........................................... 87
Chapter 2 MicroLog Plus ............................................................. 89
2.1. Overview......................................................................... 90
2.1.1. MicroLab Plus Default Window Layout ...................... 92
2.2. Getting Started ................................................................ 94
2.2.1. Installation ................................................................... 94
1. System Requirements ............................................ 94
2. Install the Software ................................................ 95
2.2.2. Setup the MicroLog Plus System ................................. 95
2.2.3. Saving data................................................................... 97
2.2.4. Activate Sound Alarm.................................................. 99
2.2.5. E-mail Alarm Notification.......................................... 100
2.2.6. Change the temperature units ..................................... 101
2.2.7. Display Properties ...................................................... 102
2.3. Online Mode.................................................................. 103
2.3.1. Display options........................................................... 103
2.3.2. Meters view................................................................ 104
2.3.3. Multiple graphs View................................................. 106
1. The Cursor ........................................................... 108
2. Zooming............................................................... 109
3. Autoscale ............................................................. 109
4. The stretch/compress axis tool ............................. 110
5. Panning ................................................................ 110
6. Display alarm levels............................................. 111
2.3.4. Cradle Map................................................................. 112
1. Setting up the Cradle Map ................................... 113
Add icons....................................................... 113
Load a picture ................................................ 114
Lock Cradle Map........................................... 115
2.4. Offline Mode................................................................. 116
2.4.1. Offline screen............................................................. 116
2.4.2. Open files................................................................... 116
2.4.3. Print............................................................................ 118
1. Print a graph......................................................... 118
2. Print a table.......................................................... 118
2.4.4. Graph display ............................................................. 120
1. Graph ................................................................... 120
2. The Cursor ........................................................... 120
3. Zooming and Panning.......................................... 121
Manual Scaling .............................................. 121
Autoscale ....................................................... 123
Default Zooming............................................ 123
4. Crop the data ........................................................ 125
5. Format the graph .................................................. 125
6. Copy the graph as a picture.................................. 126
2.4.5. Export data to Excel ................................................... 127
2.5. Program MicroLog ........................................................ 128
2.5.1. Setup .......................................................................... 128
2.5.2. Auto setup .................................................................. 137
2.5.3. Saving setup ............................................................... 139
2.5.4. Defining a custom sensor ........................................... 140
2.5.5. Sensor calibration....................................................... 143
1. Calibration password............................................ 144
2. Humidity calibration ............................................ 145
3. Temperature calibration ....................................... 148
2.5.6. Communication setup ................................................ 149
2.6. Toolbar Buttons............................................................. 151
2.6.1. Main (upper) toolbar .................................................. 151
2.6.2. Graph (Lower) toolbar ............................................... 154
2.6.3. Cradle Map (lower) toolbar........................................ 156
Chapter 3 The Cradle.................................................................. 157
3.1.
MicroLog Cradle Line................................................... 158
1. Alarm Cradle ....................................................... 158
2. Wireless Cradle with Alarm................................. 158
3.2.
Operating the Cradle ..................................................... 159
3.3.
Replace the Battery ....................................................... 162
3.4.
Screw Terminals............................................................ 163
Chapter 4 The Receiver .............................................................. 169
Chapter 5 External Magnet Antenna........................................... 171
5.1.
Connecting the antenna to the receiver.......................... 173
5.2.
Connecting the antenna to the Cradle............................ 174
5.3.
Preparing the Cradle to work with the external antenna 176
Chapter 6 External Sensors......................................................... 180
6.1.
Temperature -50°C to 100°C......................................... 180
6.2.
Temperature -10°C to 10°C .......................................... 181
6.3.
Temperature -100°C to 120°C PT100 adapter .............. 182
6.4.
Voltage Sensor .............................................................. 183
6.5.
Current Sensor............................................................... 184
6.6.
pH Sensor...................................................................... 185
6.7.
Contact Adapter ............................................................ 185
Specifications ............................................................................... 187
MicroLog.................................................................................. 187
MicroLog Cradle ...................................................................... 190
MicroLog Plus Receiver........................................................... 193
Software ................................................................................... 194
Appendix: Figures......................................................................... 199
Index ............................................................................................. 200
How to use this Guide
Using the Guide
MicroLog is a compact data logger used to monitor the temperature
and humidity of perishable goods. It can also be connected to
external sensors in order to monitor additional parameters, and can
be mounted onto a cradle for use with the Sound Alarm feature as
well as the wireless Daily Download tool.
MicroLog Plus is a sophisticated data logging system, which can
remotely monitor up to 200 MicroLogs simultaneously.
Chapter 1 of this guide details the operation procedures for
MicroLog as a stand-alone device, as well as how to work with its
software program, MicroLab.
If you are using the wireless MicroLog Plus system read Chapter 2,
which details the setup and operation of the wireless MicroLog
15
How to use this Guide
Plus system, while Chapter 3 deals with using MicroLog together
with a cradle. Chapter 4 covers connecting your MicroLog to a
receiver, Chapter 5 explains the use of external antenna, and
Chapter 6 deals with connecting it to external sensors.
16
MicroLog
Chapter 1
Chapter 1
MicroLog
17
Chapter 1
MicroLog
1.1. Overview
MicroLog can be used as a stand-alone device to monitor
temperature and humidity levels. All viewing, exporting and
printing of the data obtained is done with just two keys. MicroLog
continuously displays the most recent recordings, along with the
maximum and minimum values for a selected time interval. Users
can also define minimum and maximum alarm levels for a specific
shipment, and the display screen will begin to flash if either level is
breached.
(Instructions for using the Sound Alarm feature can be found in
section 3.1.1)
The data stored by MicroLog can be downloaded to any computer
for further viewing and analysis using the MicroLab software, and
can be exported to a spreadsheet.
18
MicroLog
Chapter 1
1.2. Getting Started
In order to save battery life, MicroLog is shipped in Stop Mode.
This means that before you can start recording, you must first
connect MicroLog to the PC and set it up with the accompanying
software. To set up MicroLog with the MicroLab software, refer to
section 1.4.
Once MicroLog receives the setup command, it begins logging the
data immediately.
19
Chapter 1
MicroLog
1.3. Working with MicroLog
1.3.1.
Data Displays
1.
Current data
When MicroLog is recording, the data from the sensors is
displayed alternately. The data obtained from external sensors is
displayed with a small EXT symbol.
When MicroLog stores the data, the LCD display briefly changes
to a “double dash” (- -) symbol.
2.
Minimum and maximum values
You can display minimum and maximum values for any hour from
the last 24 hours and for any day from the last 30 days by using
MicroLog’s left and right keys:
20
MicroLog
Chapter 1
Viewing Min. and Max Values in the Last 1-24 Hours
1. Select a time period by
pressing the right key on the
MicroLog. The LCD will
begin displaying the hour
number, ranging from hours 1
MicroLog
to 24. Once you’ve reached
the desired time period, release
the right key.
2. Once you’ve released the right key, MicroLog will display the
Min and Max values logged by the sensors during the selected time
period.
3. (Optional) Once the left key is released, MicroLog will send an
IR signal of the Min and Max values for the selected time period.
21
Chapter 1
MicroLog
To receive a printout of this data, simply point the MicroLog to the
IR printer (HP portable printer – model No. 82240B).
Viewing Min. and Max Values for the last 1-30 Days
1. Select a time period by pressing the left key on the MicroLog.
The LCD will display the day number, ranging from days 1 to 30.
Once you’ve reached the desired time period, release the left key.
MicroLog
22
MicroLog
Chapter 1
2. Once the left key is released, MicroLog will display the Min and
Max values of the sensors for the selected time period.
3. (Optional) Once the left key is released, the MicroLog will send
an IR signal of the Min and Max values for the selected time
period. To receive a printout of this data, simply point MicroLog to
the IR printer (HP portable printer – model No. 82240B).
3.
Status messages
When both the left and right keys are pressed simultaneously, the
MicroLog LCD will display MicroLog’s status. This will also
“wake up” the device, a step necessary for its communication with
a computer. The status messages include:
23
Chapter 1
MicroLog
MicroLog
– Run
– Cyclic Run
24
MicroLog
Chapter 1
– Timer Run
– Stop Mode
– Downloading data to a PC
1.3.2.
Working Modes
MicroLog is always set in one of the 4 possible modes:
Stop – MicroLog is idle and is not recording.
25
Chapter 1
MicroLog
Run – MicroLog is recording data. It will stop recording
automatically when its memory is full (16,000 recordings).
Cyclic Run – Same as Run, but MicroLog will record over the old
data when the memory is full, beginning with the earliest data
recording.
Timer Run – MicroLog can be configured to start recording at a
predetermined time. When MicroLog is set for such a run, its status
is set to Timer Run. Once MicroLog starts recording, its status
changes to either Run or Cyclic Run, depending on the desired
configuration.
1.3.3.
MicroLog’s Connections
Note: MicroLog ships with a rubber plug that covers the rear
socket. The plug protects the socket from moisture. Unless you are
using the socket leave the plug in.
26
MicroLog
Chapter 1
1.
Connect MicroLog to a computer
For this you will need a serial communication cable (catalog
number DT058).
The serial communication cable ends
with a type D 9-pin female plug. Plug
this in to any free COM port on your
computer.
27
Chapter 1
The other end of the
serial
communication
cable ends with a small
black flat plug. Plug this
end into the socket at the
back of the MicroLog.
Note that the socket has
three pins, with one
further away from the
other two (Figure 1).
Take care to plug the
cable in correctly.
28
MicroLog
Figure 1: Connecting MicroLog
MicroLog
Chapter 1
Note: You can also connect to the PC via the Cradle (see page
159).
2.
Connect MicroLog to an external sensor
Use the same PC connection socket to connect to an external
sensor (see Figure 1).
Note that the socket has three pins, with one further away from the
other two (Figure 1). Take care to plug the cable in correctly.
Note: You can also connect the external sensor to the Cradle
(see page 159).
29
Chapter 1
MicroLog
1.3.4.
Sleep Mode
The MicroLog battery's maximum lifespan is approximately 1.5
years. This long battery life is achieved by MicroLog putting itself
"to sleep" between recordings, or after 4 minutes goes by without
communication with the computer. While sleeping the data logger
consumes a minimal amount of power.
MicroLog "wakes up" every second for a very short time (a few
micro-seconds) to check if one of the keys has been pressed or if
there is a message coming in from the computer. This is the reason
you have to press and hold a key for at least two seconds before a
status message appears.
If you use high sampling rates, the MicroLog battery’s lifespan will
be considerably shorter (see Figure 2).
30
Battery lifespan in months
MicroLog
Chapter 1
30
25
20
15
10
0
5
10
Minutes between samples
15
Figure 2: MicroLog battery life
31
Chapter 1
MicroLog
1.3.5.
Replacing the Battery
Warning: The back cover of the MicroLog contains a special
compartment for the humidity sensor, which is very fragile. When
removing or replacing the cover, be careful not to harm the sensor
Humidity
sensor
Humidity sensor
compartment
+
Figure 3: Replacing the battery
32
MicroLog
Chapter 1
MicroLog’s battery is a 1/2AA 3.6V lithium
battery
1.
2.
3.
4.
5.
Unfasten the four screws on the back of the
MicroLog.
Carefully remove the back cover
Replace the battery, and be sure to insert the
new battery into the correct corresponding
polarities (look for the “+” symbol next to the
positive terminal)
Carefully reposition the electronic board on
MicroLog’s back cover and make sure that the
humidity sensor is placed in its compartment.
Refasten the four screws on the back of the
MicroLog.
33
Chapter 1
MicroLog
1.4. Working with the MicroLab Software
1.4.1.
Install the Software
Insert the CD into your CD drive.
The installation will start automatically. Once the process begins,
follow the on-screen instructions.
In case auto run is not working, open the CD drive folder and
double-click the setup icon, then follow the on-screen instructions.
To uninstall the software: From the Start menu select Settings /
Control Panel, and use the Add/Remove programs function to
remove the MicroLab application.
34
MicroLog
Chapter 1
1.4.2.
Overview
The MicroLab software was designed to allow for the
programming of the desired data recording specifications for
MicroLog, to enable the downloading of recorded data to a PC, and
to store, view and analyze the data.
The Logger menu handles all communication between the PC and
MicroLog such as programming the desired recording mode,
starting or stopping data recording, as well as downloading the
data.
The View menu controls the various data display options. Data can
be viewed in graph format, in table format, or in both. The Data
Map is a separate pane that displays a list of the open data sets. It
can also be used to quickly navigate through the data sets.
The Graph menu contains all the commands needed to format and
edit the graph.
35
Chapter 1
MicroLog
The most common tasks and commands are available as buttons on
the main toolbar and on the graph toolbar.
1.4.3.
1.
Getting Started
Download data
a.
Connect MicroLog to the PC
b.
Open the MicroLab software
c. Click Download
on the main toolbar.
Once the downloading has been completed, the data will be
displayed both in the graph and in the table, and a new data icon
will be added to the Data Map.
36
MicroLog
Chapter 1
You can now connect a different MicroLog to the PC and
download its data. The number of downloads is limited only by the
memory available on the computer.
Use the Data Map (section 1.4.4.4) to navigate between the
different data sets.
2.
Save data
To save the displayed data, click Save
on the main toolbar.
The data currently displayed by the graph will be saved in the
MicroLog Data folder:
C:\Program Files\Fourier Systems\MicroLog\MicroLog Data
The data file name consists of the MicroLog name (Comment, see
page 57) and of the time and date at which it was saved.
37
Chapter 1
MicroLog
To save data in a different location or under a different name, use
the Save as… command from the File menu:
d.
Select Save as… from the File menu.
e.
Enter a new name in the File name box
f.
To save the data in a different folder, select a drive
and/or folder from the Save in box
g. Click Save
If you’ve downloaded data from more than one MicroLog and you
want to save all the data sets, select Save all from the File menu.
If you are using the Daily download option, data will be saved
automatically.
38
MicroLog
Chapter 1
Note: If you want to remove unwanted data before saving, apply
the crop tool (see page 52).
3.
Open files
a.
Click Open
b.
To open a document that was saved in a different
folder, select a drive and/or folder in the Look in box.
c.
Double-click the file you want to open.
on the main toolbar.
4.
Display properties
You can change the way numbers and dates will be displayed on
screen.
39
Chapter 1
5.
a.
Click File on the menu bar, then click
Display properties.
b.
In the Decimal place settings, enter the number of
decimal places you want to display (Enter a number
between 0 and 4) for each sensor.
c.
In the Date format settings select the desired format
option.
d.
Click OK.
Print a graph
a.
40
MicroLog
Click Print
on the main toolbar to open the Print
MicroLog
Chapter 1
Options dialog box.
b.
Click the graph option.
c.
Click Print to open the Print Dialog Box.
d.
Click OK.
6.
Print a table
The displayed data can also be printed as a table. The table will
only include data from sensors that are currently represented on the
graph (to learn how to add or remove data sets from the graph, see
page 45) as well as the MicroLog name, serial number and the
alarm level setup. Data that exceeds any of the alarm levels will be
highlighted by arrows.
41
Chapter 1
42
MicroLog
a.
Click Print
on the main toolbar to open the Print
Options dialog box.
b.
Click the Table option.
c.
If you want to print only part of the data, uncheck the
check box and select the desired time and date in the
From and To boxes.
d.
Click the Print button to open the Print dialog box.
e.
Click OK.
MicroLog
1.4.4.
Chapter 1
View the Data
1.
Display options
MicroLab’s screen consists of three parts: the graph, the table and
the Data Map. You can display all three parts simultaneously (the
default view) or any combination of them.
If you are using the daily download option you can display a daily
status window.
2.
Graph
Click Graph
to display or remove the graph. The graph
displays the data sets plotted vs. time. The graph usually displays
all the data sets of a given MicroLog, but you can use the Data
43
Chapter 1
MicroLog
Map to remove one or more of the sets from the graph (see section
4 in this chapter).
In order to keep the graph clear and simple, only two Y-axes can
be shown on the graph simultaneously. If there are three curves in
the graph, one of the Y-axes will be hidden. To make this axis
visible, select the corresponding plot with the cursor (see page 47).
You can identify the Y-axis by its color, which matches the plot
color.
3.
Table
Click Table
to display or remove the table.
The data in the table always matches the data that is currently
displayed on the graph.
44
MicroLog
4.
Chapter 1
Data Map
Click Data Map
to display or remove the Data Map.
The Data Map is a separate window that displays the list of data
sets that were downloaded or opened in the current session. Use the
Data Map to navigate through the available plots and to keep track
of the data that is being displayed in the graph and/or table
windows.
When you double-click on a MicroLog icon
in the Document
Map, MicroLab jumps to the corresponding data and displays it in
the graph and table windows. It also expands the Data Map to show
the individual sensors included with the selected MicroLog.
45
Chapter 1
MicroLog
A graph icon
indicates that the data set is currently being
displayed. Double click on the icon to clear the data set from the
display.
indicates that the data set is not being
An empty icon
displayed. Double click on the icon to add the data set to the
display.
To collapse the sensor list under an individual MicroLog, click the
minus sign (-) next to the MicroLog icon.
To display the complete sensor list under an individual MicroLog,
click the plus sign (+) next to the MicroLog icon.
To remove an individual MicroLog from the Data Map, right-click
on its icon, then click Remove Data.
46
MicroLog
Chapter 1
To remove all data sets from the Data Map, right-click the Data
sets icon
, then click Remove All Data.
5.
The Cursor
Use the cursor to view individual data recording values, or to
reveal a hidden Y-axis.
To display the cursor, double click on an individual data point or
click Cursor
on the graph toolbar. You can drag the cursor
with the mouse to any other point on the plot, or to another plot
altogether.
The point coordinates of the selected data recording will appear in
the status bar at the bottom of the graph window.
47
Chapter 1
6.
MicroLog
Zooming and Panning
a.
Zooming
on the graph toolbar and drag the cursor
Click Zoom in
diagonally to select the area you want to magnify. Release the
mouse button to zoom in to the selected area.
Click on the Zoom in button a second time to turn off the Zoom
tool.
b.
Autoscale
Click Autoscale button
on the graph toolbar for the full data
display.
Double-click on an individual axis to auto scale it separately.
48
MicroLog
c.
•
•
•
•
•
Chapter 1
Manual scaling
Click Graph properties
on the graph
toolbar to open the Graph Properties dialog
box.
Select the Scale tab, and choose the axis you
want to scale in the select axis drop list.
Uncheck the Autoscale check box and enter the
new values in the edit box
In the time axis, you can either enter the time
and date manually, or select it with the up and
down arrow buttons.
Click OK.
To restore auto scaling, click Autoscale
.
49
Chapter 1
MicroLog
d. Default zooming
If you usually need to view a specific time frame (i.e. workday
hours) use the Default zooming tool. You can set the start and end
time of the time span and then use it whenever you open a file or
download data from the MicroLog.
To set the default zoom:
•
Click Graph Properties
on the graph
toolbar, then click Set Default Zoom.
•
Enter the start and end times, then click Set.
To zoom to the default zoom:
•
50
Click Graph Properties
toolbar.
on the graph
MicroLog
Chapter 1
•
Check the Use default zoom check box and
click OK.
Every file and every data recording you download will
automatically open in the default zoom as long as the Use default
zoom check box remains checked.
To restore auto scaling click Autoscale
.
e. The stretch/compress axis tool
Move the cursor onto one of graph axes. The cursor icon changes
to double arrow symbol (↔), indicating that you can stretch or
compress the axis scale. Drag the symbol to the desired location.
Repeat the procedure for the other axis if necessary.
51
Chapter 1
MicroLog
f. Panning
Use the pan tool after zooming view any part of the graph that is
outside the zoomed area.
on the graph toolbar, then click
To do this, click Pan
anywhere on the graph and drag the graph to view another area.
Click Pan a second time to turn off the Pan tool.
7.
Crop the data
Cropping enables you to trim the edges of a data set. Use it to
remove unwanted data
•
Zoom to the data range you want to keep.
•
Click Graph on the menu bar, then click
Crop.
All data outside the zoomed area will be permanently removed.
52
MicroLog
Chapter 1
8.
Format the graph
You can change a data line’s color, style or width. You can also
add markers that represent the data points on the graph and format
their style and color.
The Y-axis color matches the corresponding plot’s color and will
change accordingly. The time axis color can be changed separately:
•
•
•
Click Graph properties
on the graph
toolbar to open the Graph Properties dialog
box.
Select the Lines tab, then select the plot or axis
you want to format in the select plot drop list.
From here you can format the line’s color, style
and width, as well as the markers’ color and
53
Chapter 1
•
9.
MicroLog
style. To remove the line or the marker,
uncheck the corresponding visible check box.
To restore the default formatting, click the
Restore default button, and click OK
Display alarm levels
•
Click Display alarm level
•
Select the sensor you wish to display from the
select sensor drop list
54
.
MicroLog
10.
Chapter 1
Change the temperature units
to change the temperature scale
Click Toggle °C/°F button
from Fahrenheit to Celsius and vice versa.
Note: To change the units in the MicroLog display, use the Setup
dialog box (see page 56).
11.
Export data to Excel
Click Export to Excel
to export the currently displayed data
to an Excel spreadsheet. MicroLab will open a new Excel
workbook displaying the data along with the MicroLog info,
including the MicroLog name, serial number and alarm levels
setup.
55
Chapter 1
MicroLog
12. Copy the graph as a picture
You can copy the graph to the clipboard as a picture and then paste
it to other Windows programs such as Word and PowerPoint:
1. On the Graph menu, click Copy
graph.
2. Open the destination file.
3. In the destination file, right click
and select paste.
1.4.5.
Program MicroLog
1.
Setup
Use the Setup dialog box to view or to change the MicroLog and
the Cradle settings
56
MicroLog
Chapter 1
If you intend to setup more then one MicroLog or Cradle use the
Save setup tool (see page 66).
•
Connect MicroLog or the Cradle to the PC
•
Click Setup
to open the Setup dialog
box.
The dialog box is made up of five sections:
a.
MicroLog info
Comment
Click the edit box and type a name that will serve to
identify the specific MicroLog (e.g. its location).
57
Chapter 1
MicroLog
S/N
Displays the MicroLog’s serial number
Battery Level
If the indicator is in the red zone the battery should be
replaced (see page 32).
b.
Cradle info
Cradle ID
The cradle’s identification number sets the cradle’s
transmission time in daily download mode.
Battery Level
If the indicator is in the red zone the battery should be
replaced (see page 162).
58
MicroLog
c.
Chapter 1
Setup
Temperature
Click the Temperature check box to activate the internal
temperature sensor
Humidity
Click the Humidity check box to activate the internal
humidity sensor
External
Click on the External check box to activate the external
sensor option, and then select a sensor in the drop list.
If you want to use a sensor that is not found in the drop
list, you can define new sensor (see page 74).
The sensors’ current readings will appear in the labels next to the
sensor name once MicroLog begins logging for the first time.
59
Chapter 1
MicroLog
Temperature unit
To set the temperature unit in the MicroLog display,
select the option you want (Celsius or Fahrenheit).
Interval
Determines the logging interval, or the time interval
between successive data recordings.
The time format is hh:mm:ss. Set the time setting to
select a recording time interval from between 10 seconds
and 2 hours. For example, to set a time interval of one
hour, five minutes and thirty seconds, click the hours (hh)
and type 1 or use the arrows to select 01, then click the
minutes (mm) and type 5 or use the arrows, and finally,
click the seconds (ss) and type 30 or select 30 using the
arrows.
60
MicroLog
Chapter 1
Timer run
Click the Timer run check box if you want MicroLog to
start recording at a predetermined time. This option is
convenient if you are using several MicroLogs at once
and want them to all begin logging at the same time.
Use the time and date selectors to set the start time.
Cyclic run
In Cyclic run mode, MicroLog overwrites the old
measurements (starting with the oldest one) once the
MicroLog’s memory is full. Click the Cyclic run check
box to operate in this mode.
If the check box is clear, MicroLog will operate in
Normal run mode and will stop recording when the
memory is full.
61
Chapter 1
MicroLog
Daily download
Check the Daily download checkbox to enable automatic
daily download (see page 78 for details).
d.
Alarm levels
Type in the desired minimum and maximum alarm levels.
If MicroLog records a reading that exceeds either of these
levels, the MicroLog’s LCD will start to flash and the
cradle’s alarm will sound.
To stop the LCD’s flashing, press either of its two keys.
To stop the cradle’s alarm, press both the MicroLog’s
keys simultaneously.
62
MicroLog
Chapter 1
The default alarm levels are the lower and upper ends of
the sensors. Click Cancel Alarm to restore the default
levels.
e.
Cradle time settings
Workday hours
Use the up and down arrow buttons to set the daily period
when you want the Alarm and/or the Daily Download to
be active, or type the desired period in manually.
Alarm delay
Click the drop list to select the time delay between the
time MicroLog records a reading that exceeds the alarm
levels and the time the alarm will sound.
63
Chapter 1
MicroLog
Alarm duration
Click the drop list to select the time for which the alarm
will sound before it stops automatically.
Complete the setup
Click Send setup to send the new settings to MicroLog,
which will complete the setup. Click Cancel if you don’t
want to change the setup.
Note: The Send setup command erases all existing data in the
MicroLog.
64
MicroLog
Chapter 1
If you set it to Timer run mode, MicroLog will wait in standby
mode displaying
time.
, and will begin recording at the specified
65
Chapter 1
MicroLog
2.
Saving Setup
When setting up multiple MicroLogs or Cradles use the Save
Setup option in the Setup dialog.
1. After you have finished the settings selection of the first
MicroLog or Cradle and before sending the setup
command, click Save Setup to save all the setup settings.
2. Connect another MicroLog or Cradle to the PC, click
3.
4.
5.
66
Setup
on the main toolbar, then click Load
Setup to load your setup settings.
Change the Cradle ID.
Change the comment (optional).
Click Send Setup.
MicroLog
3.
Chapter 1
Start recording
Click Run
every time you want to start a new recording. The
Run command erases all previous data in the MicroLog’s memory
and begins recording.
Note: If you setup the MicroLog using the Setup command, it will
automatically begin recording, and you don’t have to click Run
4.
Stop recording
to stop recording. In Stop mode, MicroLog keeps
Click Stop
all recorded data but does not record new data. Use this mode to
save battery power.
67
Chapter 1
MicroLog
5.
Sensor calibration
A new MicroLog comes fully calibrated. After a period of long
use, however, you may want to recalibrate the humidity or the
temperature sensors.
The humidity calibration affects both MicroLog and MicroLab and
should be carried out while MicroLog is connected to the PC. The
temperature calibration affects only the MicroLab software and can
be carried out regardless of whether MicroLog is connected to the
PC.
Calibration password
To prevent accidental change of the calibration, the calibration
procedure is protected by a password. The default password is:
1234. To change the password:
68
MicroLog
a.
Click Logger on the menu toolbar, then
click Calibration.
b.
Click Change Password to open the
Change Password dialog box.
c.
Enter the current password in the Current
Password edit box.
d.
Enter the new password in the New
Password edit box.
e.
Enter the new password a second time in
the Confirm New Password edit box to
confirm your new password.
f.
Click OK.
Chapter 1
69
Chapter 1
MicroLog
Note: The password must include at least 4 characters and is case
sensitive.
Humidity calibration
To calibrate the humidity sensor you will need a humidity
chamber.
70
a.
Connect MicroLog to the PC
b.
Set up MicroLog to record every 10 seconds (see page
56).
c.
Click Logger on the menu bar, then click Calibration.
d.
Enter the calibration password, then click OK.
e.
Select Humidity in the Choose sensor drop list
MicroLog
Chapter 1
f.
Click Default to restore the original values
g.
Disconnect MicroLog from the PC and insert it into the
71
Chapter 1
MicroLog
humidity chamber.
h.
Set the humidity chamber to the first reference value.
Wait until the humidity level is stabilized and write
down MicroLog’s reading.
i.
Repeat the last step with the second reference value.
j.
Connect MicroLog to the PC.
k.
Enter the two reference values into the MicroLog
value edit boxes.
l.
Enter the two MicroLog values into the Reference
value edit boxes.
m. Click Calibrate.
To restore default calibration, click Default.
72
MicroLog
Chapter 1
Temperature calibration
a.
Click Logger on the menu bar, then click Calibration.
b.
Enter the calibration password, then click OK.
c.
Select Temperature or Ext. Temperature in the
Choose sensor drop list.
d.
Click the Default button to restore the original values.
e.
Enter the two reference values into the MicroLog
value edit boxes.
f.
Enter the two MicroLog values into the Reference
value edit boxes.
g.
Click Calibrate.
73
Chapter 1
MicroLog
To restore default calibration, click Default.
6.
Defining a custom sensor
You can use MicroLog with any sensor that has a 0 – 20mA
current output or a 0 – 10V voltage output.
74
a.
Click the Logger menu and then select Define new
sensors to open the Define New Sensor dialog box.
b.
Click Add to add a new sensor to the list.
c.
In the Based on drop list, select an external sensor that
matches your sensor’s output
d.
Type the sensor’s name in the Sensor Name edit box.
e.
Type the sensor’s unit in the Sensor Unit edit box.
MicroLog
f.
Chapter 1
In the Calibration Values section, enter two values of
your sensor that correspond to the base sensor values.
For example, see the definition for a 0 – 100mbar
pressure sensor whose output is 0 – 20mA:
Figure 4: Define New Sensor
75
Chapter 1
MicroLog
g. Click OK.
The new sensor will then appear in the External Sensor list in the
Setup dialog box.
7.
Communication setup
Communication between the PC and a MicroLog takes place
automatically whenever you send a command to MicroLog.
However, the Communication Setup dialog box can be used for
more advanced communication options.
Click on the Logger menu and then select Com setup to open the
Communication Setup dialog box:
If you are not using a receiver and cradle, uncheck the Search for
Receiver and Cradle checkbox in order to speed up the search.
76
MicroLog
Chapter 1
Figure 5: MicroLab’s Communication Setup dialog box
The checked COM ports are available for communication.
Click Try to connect to establish communication.
Click Work offline to work with saved files.
77
Chapter 1
MicroLog
1.4.6.
Automatic Daily Download
You can program all the MicroLogs on your line to automatically
transmit their data to a PC every day, at a preset time.
To work with this option you will need to mount the MicroLogs
onto wireless Cradles (see page 157) and connect a receiver to the
PC (see page 169).
1.
Prepare the MicroLog.
To prepare a Cradle with MicroLog system for daily download:
78
a.
Connect the cradle to the PC (see page 159).
b.
Setup the MicroLog and the cradle (see page 56).
MicroLog
Chapter 1
Notes:
1. Enter an identification number for the cradle in the Unit ID
edit box. The number should be an integer between 1 and 200
and every cradle should have a different ID number. (We
recommend attaching a label with the ID number to every
cradle.)
2. While in daily download mode the cradle transmits only data
that was recorded during workday hours. It is therefore
important to accurately set the workday hours when setting up
the cradle’s time settings. To download all data from a specific
cradle use the manual transmission option (see page 83).
3. The recording interval must be equal to or greater than 1
minute for recording data from one sensor, 2 minutes for 2
sensors and 3 minutes for 3 sensors.
79
Chapter 1
MicroLog
c.
Check the Daily download checkbox.
d.
To set the download time and file location click Daily
download at the bottom of the setup dialog to open the
Daily download dialog box.
e.
Enter the desired download time in the Download start
time box.
MicroLab automatically calculates and sets the cradles’
transmission times according to their ID numbers, so that the
cradles will transmit the data successively.
f.
80
MicroLab stores the data files in the following folder
by default: C:\Program Files\Fourier
Systems\MicroLab\MicroLog Data\Daily download. If
you want to store your data in another location click
Browse and navigate to the desired folder.
MicroLog
Chapter 1
g.
Click OK to return to the setup dialog.
h.
Click Send setup.
i.
Repeat this procedure (except for steps d to g which
should be performed only once) with every cradle.
Remember to assign a different ID number to each
cradle.
j.
After you have finished setting up all your
cradles, connect the RF receiver to the PC
(see page 169).
k.
Click Logger on the menu bar, then click
Com setup to open the Communication
setup dialog.
l.
Make sure that the Search for Receiver
81
Chapter 1
MicroLog
and Cradle checkbox is checked.
m. Click Try to connect to establish
communication with the receiver.
n.
Place the cradles at the desired data logging
locations.
2.
Automatic download
At the download’s start time the cradles should be within 300m of
the receiver and in its line of sight. The cradles will automatically
transmit the data one after the other according to their ID number.
The time interval between successive transmissions is two minutes.
MicroLab automatically saves the data after every transmission
under the name: daily download [&date]. After the daily download
82
MicroLog
Chapter 1
has been completed, the file will automatically be closed. Every 24
hours MicroLab creates new data file.
3.
Manual transmission
If one of the cradles fail to transmit data automatically, or if you
need to download all data from a specific cradle (not just data that
was recorded during working hours) press the Trs (Transmit)
button on the right side of the Cradle (see page 159). The cradle
will then transmit all stored data to the PC.
4.
Viewing Daily Download data and status
To open a daily download data file:
a.
Click Open
on the main toolbar
83
Chapter 1
MicroLog
b.
Navigate to the folder in which the daily download data
files are stored
c.
Double click the file name to open the file
MicroLab prompts to a daily summary of the automatic download.
The summary includes a list of the MicroLogs that have completed
their data download, along with their respective cradle’s battery
level, transmission status and indication as to whether alarm levels
were exceeded.
d.
84
Click OK to close the summery window and to display
the data.
MicroLog
1.4.7.
1.
Chapter 1
Toolbar Buttons
Main (upper) toolbar
Open
Opens saved files
Save
Saves the data that is currently displayed
Print…
Opens the Print Option dialog box
Export
Exports the displayed data to an Excel
spreadsheet.
85
Chapter 1
86
MicroLog
Run
Begins data recording.
Stop
Stops data recording.
Setup
Opens the Setup dialog box.
Download
Downloads data from the MicroLog onto the
PC.
Graph
Displays or removes the graph
Table
Displays or removes the table
MicroLog
2.
Chapter 1
Data Map
Displays or removes the Data Map
°C/°F
Displays the desired unit of temperature
Alarm
Displays or removes alarm levels from the
graph
Graph (Lower) toolbar
Zoom in
Activates the zoom tool
87
Chapter 1
88
MicroLog
Pan
Activates the pan tool
Auto scale
Returns the graph to full view
Graph
properties
Opens the Graph Properties dialog box
Cursor
Displays or hides the cursor
MicroLog Plus
Chapter 2
Chapter 2
MicroLog Plus
89
Chapter 2
2.1.
MicroLog Plus
Overview
MicroLog plus enables wireless communication between a PC and
up to 200 MicroLog devices simultaneously. Furthermore, realtime temperature and humidity readings from the MicroLog are
automatically delivered directly to the PC. Data from external
sensors can also be transmitted in the same manner. The complete
MicroLog Plus system includes the MicroLog data logging device,
the cradle that the data logger is mounted on, a small receiver that
is placed on the PC, and the user-friendly software that allows for
convenient central management.
MicroLog Plus uses MicroLog data loggers to record temperature
and humidity readings. The cradle that the data logger is mounted
on is a wireless transmitter that can transmit measurements to a PC
from up to 300 meters. Since each cradle is tagged with an ID
number, the cradles can be programmed to transmit data at various
90
MicroLog Plus
Chapter 2
time intervals based on the criteria defined in their IDs. This
advanced feature prevents data collision between two or more
loggers.
The MicroLab Plus software reports on the status of up to 200
MicroLogs on a single color-coded interface. Other features that
help automate all aspects of the industrial data logging procedure
include the ability to store the data of each MicroLog, to set
MicroLog alarm levels and to define sampling intervals, as well as
any other necessary parameters.
The Logger menu handles all communication between the PC and
MicroLog such as programming the desired MicroLog and Cradle,
calibrating sensors, as well as defining new sensors.
The View menu controls the various data display options. Online
data can be viewed in multiple meters format (the default view), in
multiple graph format, or Cradle map format. The stored data can
be viewed on an off-line graph and table.
91
Chapter 2
MicroLog Plus
The Offline Graph menu contains all the commands needed to
format and edit the graph.
The Cradle Map menu contains all the commands needed to setup
and edit the map.
The Multiple Graphs menu contains all the commands needed to
view and edit the graphs.
The most common tasks and commands are available as buttons on
the Main toolbar (upper toolbar), the Graph toolbar (lower
toolbar) and on the Cradle map toolbar (lower toolbar).
2.1.1.
MicroLab Plus Default Window Layout
In Meters view (the default view), the data for each MicroLog is
displayed in a separate window in a meter. There are six MicroLog
windows in each display. The picture below represents an
individual MicroLog display.
92
MicroLog Plus
Chapter 2
The blue and red zones on the meters represent the low and high
alarm levels
93
Chapter 2
MicroLog Plus
2.2.
Getting Started
2.2.1.
Installation
1.
System Requirements
To work with MicroLog Plus, your system should be equipped
with the following:
Software
Windows 95, or later
Internet Explorer 4.0, or later (you can install Internet Explorer 5
when you install MicroLog Plus, since it ships with the product)
Hardware
Pentium 300MHz or higher.
32 MB RAM (64 MB recommended)
5MB available disk space for the MicroLog Plus application
94
MicroLog Plus
Chapter 2
2.
Install the Software
Insert the CD into your CD drive.
The installation will start automatically. Once the process
begins, follow the on-screen instructions.
3. In case auto run is not working, open the CD drive folder
and double-click the setup icon, then follow the onscreen instructions.
To un-install the software: From the Start menu select Settings /
Control Panel, and use the Add/Remove programs function to
remove the MicroLab Plus application.
1.
2.
2.2.2.
Setup the MicroLog Plus System
Before you start using the MicroLog Plus System you must
connect each Cradle to the PC using the serial communication
cable and set it up. Follow the steps below to setup your system:
95
Chapter 2
1.
2.
3.
4.
5.
6.
MicroLog Plus
Mount the MicroLogs onto the cradles
Open the MicroLab Plus software
Connect the first cradle to the PC (see page 159)
Set up the first MicroLog data logger (see page 128)
Disconnect the first cradle from the PC
Repeat steps 3 – 5 with each cradle
Note: When setting up multiple Cradles we recommend to use the
Auto Setup tool (see page 137).
7.
8.
9.
96
Connect the RF receiver to the PC
Click Logger on the menu bar, then click Com setup to
open the Communication setup dialog.
Click Try to connect to establish communication with
the receiver.
MicroLog Plus
Chapter 2
10. Place the cradles at the desired data logging locations
Saving data
2.2.3.
There is no need to save data manually as the data is saved
automatically every half an hour in the MicroLog Data folder:
C:\Program Files\Fourier Systems\MicroLab Plus\MicroLog Data,
however, you can change the file location.
MicroLab Plus creates a folder for each MicroLog naming it with
the cradles ID number and stores the MicroLog's data in this folder.
MicroLab Plus creates a new data file for each MicroLog every 24
hours at midnight.
By default the data is saved in MicroLab Plus file format (.MPD –
MicroLog Plus data). If you want to use the data in another
program you can save it in text files (.CSV – comma separated
97
Chapter 2
MicroLog Plus
values). The data can be saved in either one of, or both the file
formats.
To select file format and location:
1. Click File on the menu bar, then click Stored data
folder…
2. To save data in MicroLab plus file format check the Save
MicroLab Plus files check box
3. To change the file location, click Browse and navigate to
the desired folder
4. To save the data in text file format Check the Save text
files check box
5. To change the file location, click Browse and navigate to
the desired folder
6. Click OK
98
MicroLog Plus
Chapter 2
Note: If you want to remove unwanted data, apply the crop tool
(see page 125).
2.2.4.
Activate Sound Alarm
on the main toolbar to activate sound
Click Enable Alarm
alarm.
If any MicroLog records a reading that exceeds its alarm levels, the
MicroLab Plus's alarm will sound.
The alarm will sound as long as the MicroLog readings exceeds the
alarm levels.
Click Enable Alarm a second time to disable the Alarm.
99
Chapter 2
MicroLog Plus
Note: To activate the Cradle alarm, use the Setup dialog box
2.2.5.
E-mail Alarm Notification
MicroLab Plus can be programmed to send e-mail notifications to
one, or more e-mail addresses whenever any MicroLog readings
exceed its alarm levels. The notifications include the MicroLog
name, the sensor whose alarm level was exceeded and the sensor's
measured value.
To setup MicroLab Plus in order to send e-mail notifications:
1. Click File on the menu bar, then click Mail properties.
2. Check the Send e-mail notification check box.
3. In the Server name box, type the outgoing mail server
name (mandatory).
4. In the To box, type the e-mail address of each recipient,
separating names with a semicolon (;) (mandatory).
100
MicroLog Plus
5.
6.
Chapter 2
In the From box, type your e-mail address (mandatory).
Click OK.
2.2.6.
Change the temperature units
Click Toggle °C/°F button
to change the temperature scale
from Fahrenheit to Celsius and vice versa.
Note: To change the units in the MicroLog display, use the Setup
dialog box or the Logger menu
101
Chapter 2
MicroLog Plus
2.2.7.
Display Properties
You can change the way numbers and dates will be displayed on
screen.
1. Click File on the menu bar, then click Display
properties.
2. In the Decimal place settings, enter the number of
decimal places you want to display (Enter a number
between 0 and 4) for each sensor.
3. In the Date format settings select the desired format
option.
4. Click OK.
102
MicroLog Plus
2.3.
Chapter 2
Online Mode
2.3.1.
Display options
Online data can be displayed in
•
Meters View (the default view), in which the current data
is displayed in meters
•
Multiple graph View, in which the data from the last 24
hours is displayed in graphs
•
Cradle Map format, where the MicroLogs are
represented by color coded icons
103
Chapter 2
2.3.2.
MicroLog Plus
Meters view
on the main toolbar to switch to Meters
Click Meters
view.
In Meters view (the default view), the data for each MicroLog is
displayed in a separate window in meters. The number of active
meters in the window corresponds to the number of active sensors
in each MicroLog. the meters are updated every time MicroLab
Plus receives new data.
If a MicroLog is inactive the corresponding window becomes gray
and disabled.
There are six MicroLog windows in each display. If you are using
more than six MicroLogs, you can manually scroll to the other
displays, or let MicroLab Plus do this automatically.
104
MicroLog Plus
•
•
Chapter 2
Click Auto scroll
on the main toolbar to allow
automatic scrolling.
Click Auto scroll a second time to return to manual
scrolling.
•
Click Scroll forward
on the main toolbar to
scroll to the next MicroLogs display.
•
Click Scroll back
on the main toolbar to scroll
to the previous MicroLogs display.
105
Chapter 2
2.3.3.
MicroLog Plus
Multiple graphs View
on the main toolbar to switch to
Click Multiple graphs
Multiple graphs view.
In Multiple graphs view, the data for each MicroLog is displayed
in a separate window in graphs. The graphs display the data sets
plotted versus time. In order to keep the graph clear and simple,
only two Y-axes can be shown on the graph simultaneously. If
there are three curves in the graph, one of the Y-axes will be
hidden. To make this axis visible, select the corresponding plot
with the cursor.
You can identify the Y-axis by its color, which matches the plot
color.
106
MicroLog Plus
Chapter 2
The graphs are updated every time MicroLab Plus receives new
data. If a MicroLog is inactive the corresponding window becomes
gray and disabled.
There are six MicroLog windows in each display. If you are using
more than six MicroLogs, you can manually scroll to the other
displays or let MicroLab Plus do it automatically.
•
•
•
Click Auto scroll
on the main toolbar to allow
automatic scrolling.
Click Auto scroll a second time to return to manual
scrolling.
Click Scroll forward
on the main toolbar to
scroll to the next MicroLogs display.
107
Chapter 2
•
MicroLog Plus
Click Scroll back
on the main toolbar to scroll
to the previous MicroLogs display
1.
The Cursor
Use the cursor to view individual data recording values, or to
reveal a hidden Y-axis.
on the graph toolbar.
To display the cursor, click Cursor
You can drag the cursor with the mouse to any other point on the
plot, or to another plot altogether.
The point coordinates of the selected data recording will appear in
the information bar at the bottom of the graph window.
108
MicroLog Plus
2.
Zooming
1.
2.
Click Zoom in
on the graph toolbar and drag the
cursor diagonally to select the area you want to magnify.
Release the mouse button to zoom in to the selected area.
Click on the Zoom in button a second time to turn off the
Zoom tool.
To restore auto scaling, click Autoscale
3.
Chapter 2
.
Autoscale
Click Autoscale button
display.
on the graph toolbar for the full data
109
Chapter 2
MicroLog Plus
4.
The stretch/compress axis tool
Move the cursor onto one of graph axes. The cursor icon changes
), indicating that you can stretch or
to double arrow symbol (
compress the axis scale. Drag the symbol to the desired location.
Repeat the procedure for the other axis if necessary.
To restore auto scaling, click Autoscale
.
5.
Panning
Use the pan tool after zooming view any part of the graph that is
outside the zoomed area.
110
MicroLog Plus
Chapter 2
To do this, click Pan
on the graph toolbar, then click
anywhere on the graph and drag the graph to view another area.
Click Pan a second time to turn off the Pan tool.
6.
Display alarm levels
1.
2.
Click Display alarm level
.
Select the sensor you wish to display from the select
sensor drop list
111
Chapter 2
2.3.4.
MicroLog Plus
Cradle Map
on the main toolbar to display the
Click Cradle Map
Cradle Map.
In Cradle Map, each MicroLog is represented by an icon. Each
icon carries the MicroLog’s individual ID number. When the
MicroLog is active, the icon’s color is green. If the recorded data
exceeds either of the alarm levels, the icon’s color turns to red.
Move the cursor over an icon to display the MicroLog’s name.
Double click on any MicroLog icon to display its meters window,
which is identical to its window in the Meters view format. To
close the meters window, click Close at the upper right-hand corner
of the window.
112
MicroLog Plus
Chapter 2
Before using the Cradle Map, you must set it up and then lock it.
1.
Setting up the Cradle Map
•
•
•
Click Cradle Map
on the main toolbar to display
the Cradle Map.
Click Cradle Map on the menu bar, then click Display
toolbar to display the Cradle Map toolbar.
Click Lock View
on the Cradle Map toolbar to
unlock the Cradle Map.
Add icons
Add icons to match the number of MicroLogs you are using.
113
Chapter 2
MicroLog Plus
•
Click Add cradle
on the Cradle Map toolbar to add
a new icon or click the down arrow button next to it to
add a group of 5, 10 or 15 icons.
•
Use the Remove cradle button
next to it to remove icons.
or the down arrow
Load a picture
You can arrange the icons on a picture or plan of your working
space, so that each icon represents the corresponding MicroLog’s
actual location in the working space. First, load the picture into the
program:
1.
114
Click Load picture
on the Cradle Map toolbar
MicroLog Plus
Chapter 2
2.
3.
Locate the picture file you want to load
Double-click on the file
Now you can click and drag the MicroLog icons to their desired
locations on the picture.
Lock Cradle Map
After you have finished arranging the icons, click Lock View
on the Cradle Map toolbar to prevent any accidental change in the
icon arrangement.
115
Chapter 2
2.4.
2.4.1.
MicroLog Plus
Offline Mode
Offline screen
on the main toolbar to switch to Offline
Click Offline
mode.
MicroLab plus’s Offline screen consists of two parts: the graph and
the table. The data in the table always matches the data that is
currently displayed on the graph.
Open files
2.4.2.
In Online mode the received data is displayed on-line both in
graphs and in meters.
116
MicroLog Plus
Chapter 2
To display previously saved data, switch to off-line mode:
1.
Click Offline
on the main toolbar.
2.
3.
4.
5.
6.
Click Open
on the main toolbar.
Enter the desired cradle ID number.
Select a date in the From box.
Select a date in the To box.
Click OK.
That will load all the data between the dates you selected and
display it in graph and table display.
117
Chapter 2
2.4.3.
MicroLog Plus
Print
1.
Print a graph
You can print saved data in Offline mode
1.
2.
3.
4.
Click Print
on the main toolbar to open the Print
Options dialog box.
Click the graph option.
Click Print to open the Print Dialog Box.
Click OK.
Print a table
2.
You can also print saved data as a table in Offline mode.
118
MicroLog Plus
Chapter 2
The table will include data as well as the MicroLog name, serial
number and the alarm level setup. Data that exceeds any of the
alarm levels will be highlighted by arrows.
1.
2.
3.
4.
5.
Click Print
on the main toolbar to open the Print
Options dialog box.
Click the Table option.
If you want to print only part of the data, uncheck the
check box and select the desired time and date in the
from and to boxes.
Click the Print button to open the Print dialog box.
Click OK.
119
Chapter 2
2.4.4.
MicroLog Plus
Graph display
1.
Graph
The graph displays the data sets plotted vs. time.
In order to keep the graph clear and simple, only two Y-axes can
be shown on the graph simultaneously. If there are three curves in
the graph, one of the Y-axes will be hidden. To make this axis
visible, select the corresponding plot with the cursor.
You can identify the Y-axis by its color, which matches the plot
color.
2.
The Cursor
Use the cursor to view individual data recording values, or to
reveal a hidden Y-axis.
120
MicroLog Plus
Chapter 2
To display the cursor, double click on an individual data point or
click Cursor
on the graph toolbar. You can drag the cursor
with the mouse to any other point on the plot, or to another plot
altogether.
The point coordinates of the selected data recording will appear in
the information bar at the bottom of the graph window.
3.
Zooming and Panning
Manual Scaling
1.
Click Graph Properties
on the graph toolbar to
open the Graph Properties dialog box.
121
Chapter 2
2.
3.
4.
5.
MicroLog Plus
Select the Scale tab, and choose the axis you want to
scale in the select axis drop list.
Un-check the Autoscale check box and enter the new
values in the edit box
In the time axis, you can either enter the time and date
manually, or select it with the up and down arrow
buttons.
Click OK.
To restore auto scaling, click Autoscale
122
.
MicroLog Plus
Chapter 2
Autoscale
1.
2.
Click Autoscale button
on the graph toolbar for
the full data display.
Double-click on an individual axis to autoscale it
separately.
Default Zooming
If you usually need to view a specific time frame (i.e. work-day
hours) use the Default zooming tool. You can set the start and end
time of the time span and then use it whenever you open a file or
download data from the MicroLog.
To set the default zoom:
123
Chapter 2
MicroLog Plus
1.
Click Graph Properties
on the graph toolbar,
then click Set Default Zoom.
2. Enter the start and end times, then click Set.
To zoom to the default zoom:
1.
2.
Click Graph Properties
on the graph toolbar.
Check the Use default zoom check box and click OK.
Every file and every data recording you download will
automatically open in the default zoom as long as the Use default
zoom check box remains checked.
To restore auto scaling click Autoscale
124
.
MicroLog Plus
Chapter 2
4.
Crop the data
Cropping enables you to trim the edges of a data set. Use it to
remove unwanted data:
1. Zoom to the data range you want to keep.
2. Click Offline Graph on the menu bar, then click Crop.
All data outside the zoomed area will be permanently removed.
5.
Format the graph
You can change a data line’s color, style or width. You can also
add markers that represent the data points on the graph and format
their style and color.
The Y-axis color matches the corresponding plot’s color and will
change accordingly. The time axis color can be changed separately:
125
Chapter 2
MicroLog Plus
1.
Click Graph Properties
on the graph toolbar to
open the Graph Properties dialog box.
2. Select the Lines tab, then select the plot or axis you want
to format in the select plot drop list.
3. From here you can format the line’s color, style and
width, as well as the markers’ color and style. To remove
the line or the marker, un-check the corresponding
visible check box.
To restore the default formatting, click the Restore
default button, and click OK
6.
Copy the graph as a picture
You can copy the graph to the clipboard as a picture and then paste
it to other Windows' programs, such as Word and PowerPoint:
126
MicroLog Plus
1.
2.
3.
Chapter 2
On the Offline Graph menu, click Copy graph.
Open the destination file.
In the destination file, right click and select paste.
2.4.5.
Export data to Excel
to export the currently displayed
Click Export to Excel
data to an Excel spreadsheet.
MicroLog Plus will open a new Excel workbook displaying the
data along with the MicroLog info, including the MicroLog name,
serial number and alarm levels setup.
127
Chapter 2
2.5.
MicroLog Plus
Program MicroLog
2.5.1.
Setup
Use the Setup dialog box to view or to change the MicroLog and
the Cradle settings
When setting up multiple Cradles use the Auto Setup tool (see
page 137).
To save the settings for future use, activate the Save setup tool (see
page 139).
1.
128
Connect the Cradle to the PC
MicroLog Plus
Chapter 2
2.
Click Setup
on the main toolbar to open the
Setup dialog box.
The dialog box is made up of five sections:
MicroLog info
Comment
Click the edit box and type a name that will
serve to identify the specific MicroLog (e.g. its
location).
S/N
Displays the MicroLog’s serial number
Battery Level
If the indicator is in the red zone the battery
should be replaced.
129
Chapter 2
MicroLog Plus
Cradle info
Cradle ID
The cradle’s identification number sets the
cradle’s transmission time in daily download
mode.
Battery Level
If the indicator is in the red zone the battery
should be replaced.
Setup
Temperature
Click the Temperature check box to activate
the internal temperature sensor
Humidity
Click the Humidity check box to activate the
internal humidity sensor
130
MicroLog Plus
Chapter 2
External
Click on the External check box to activate the
external sensor option, and then select a sensor
in the drop list.
Cradle contact
Click the Cradle contact check box to activate
the cradle contact
The sensors’ current readings will appear in the labels next to the
sensor name, once the MicroLog begins logging for the first time.
Temperature unit
To set the temperature unit in the MicroLog
display, select the option you want (Celsius or
Fahrenheit).
131
Chapter 2
MicroLog Plus
Interval
Determines the logging interval, or the time
interval between successive data recordings.
The time format is hh:mm:ss. Set the time
setting to select a recording time interval from
between 10 seconds and 2 hours. For example,
to set a time interval of one hour, five minutes
and thirty seconds, click the hours (hh) and type
1 or use the arrows to select 01, then click the
minutes (mm) and type 5 or use the arrows, and
finally, click the seconds (ss) and type 30 or
select 30 using the arrows.
Timer run
Click the Timer run check box if you want
MicroLog to start recording at a predetermined
time. This option is convenient if you are using
132
MicroLog Plus
Chapter 2
several MicroLogs at once and want them to all
begin logging at the same time.
Use the time and date selectors to set the start
time.
Cyclic run
In Cyclic run mode, MicroLog overwrites the
old measurements (starting with the oldest one)
once the MicroLog’s memory is full. Click the
Cyclic run check box to operate in this mode.
Use this mode if you intend to operate the
system continuously.
If the check box is clear, MicroLog will operate
in Normal run mode and will stop recording
when the memory is full.
133
Chapter 2
MicroLog Plus
Alarm levels
Type in the desired minimum and maximum
alarm levels. If MicroLog records a reading that
exceeds either of these levels, the software's
alarm will sound, the MicroLog’s LCD will
start to flash and the cradle’s alarm will sound.
To stop the LCD’s flashing, press either of its
two keys. To stop the cradle’s alarm, press both
the MicroLog’s keys simultaneously.
The default alarm levels are the lower and upper
ends of the sensors. Click Cancel Alarm to
restore the default levels.
134
MicroLog Plus
Chapter 2
Cradle time settings
Workday hours
Use the up and down arrow buttons to set the
daily period when you want the Alarm and/or
the Daily Download to be active, or type the
desired period in manually.
Alarm delay
Click the drop list to select the time delay
between the time MicroLog records a reading
that exceeds the alarm levels and the time the
alarm will sound.
Alarm duration
Click the drop list to select the time for which
the alarm will operate before it stops
automatically.
135
Chapter 2
MicroLog Plus
Complete the setup
Click Send setup to send the new settings to
MicroLog, which will complete the setup.
Click Cancel if you don’t want to change the
setup.
Note: The Send setup command erases all existing data in the
MicroLog, and it will automatically begin recording.
If you set it to Timer run mode, MicroLog will wait in standby
mode displaying
time.
136
, and will begin recording at the specified
MicroLog Plus
Chapter 2
2.5.2.
Auto setup
When setting-up multiple Cradles use the Auto Setup tool. This
tool will automatically set the minimum logging interval,
depending on the number of units you are using, and set the start
time for each unit.
To perform auto Setup:
1. Connect the first Cradle to the PC
2. Click Logger on the menu bar, then click Auto Setup
3. In the Number of units drop list select the number of
Cradles you are setting up, then click Start
4. Set up the first unit as you would normally
Note: the minimum logging interval is already set in the Interval
box and you cannot select a shorter time interval
137
Chapter 2
5.
6.
MicroLog Plus
Click OK
Click Send
After setup is completed the Auto Setup tool is ready to setup the
second unit (notice that the title bar on the Auto Setup dialog has
changed to ‘Unit 2’)
7. Connect another Cradle to the PC
8. Change the comment (optional).
9. Click Send
10. Repeat this procedure with every cradle
To change the settings of a specific unit click Edit on the Auto
Setup dialog and select the new settings before executing the Send
command. These settings will be saved until the next time you
change them.
138
MicroLog Plus
Chapter 2
Use the forward arrow and backward arrow buttons on the Auto
Setup dialog to navigate to a specific unit. Notice that this will
change the automatic sequence
2.5.3.
Saving setup
When setting up multiple Cradles use the Save Setup option in the
Setup dialog.
1. After you have finished the settings selection of the first
Cradle and before sending the setup command, click
Save setup. This will save all the setup settings.
139
Chapter 2
2.
3.
4.
5.
MicroLog Plus
Connect another Cradle to the PC, click Setup
on the main toolbar, then click Load Setup to load your
setup settings.
Change the Cradle ID
Change the comment (optional).
Click Send Setup.
Defining a custom sensor
2.5.4.
You can use MicroLog with any sensor that has a 0 – 20mA
current output or a 0 – 10V voltage output.
1. Click the Logger menu and then select Define New
Sensors to open the Define New Sensor dialog box.
2. Click Add to add a new sensor to the list.
140
MicroLog Plus
3.
4.
5.
6.
Chapter 2
In the Based On drop list, select an external sensor that
matches your sensor’s output
Type the sensor’s name in the Sensor Name edit box.
Type the sensor’s unit in the Sensor Unit edit box.
In the Calibration Values section, enter two values of
your sensor that correspond to the base sensor values.
For example, see the definition for a 0 – 100mbar
pressure sensor whose output is 0 – 20mA:
141
Chapter 2
7.
142
Click OK.
MicroLog Plus
MicroLog Plus
Chapter 2
The new sensor will then appear in the External Sensor list in the
Setup dialog box.
2.5.5.
Sensor calibration
A new MicroLog comes fully calibrated. After a period of long
use, however, you may want to re-calibrate the humidity or the
temperature sensors.
The humidity calibration affects both MicroLog and MicroLog
plus and should be carried out while MicroLog is connected to the
PC. The temperature calibration affects only the MicroLog Plus
software and can be carried out regardless of whether MicroLog is
connected to the PC.
143
Chapter 2
MicroLog Plus
1.
Calibration password
To prevent accidental change of the calibration, the calibration
procedure is protected by a password. The default password is:
1234. To change the password:
1. Click Logger on the menu toolbar, then click
Calibration.
2. Click Change Password to open the Change Password
dialog box.
3. Enter the current password in the Current Password
edit box.
4. Enter the new password in the New Password edit box.
5. Enter the new password a second time in the Confirm
New Password edit box to confirm your new password.
6. Click OK.
144
MicroLog Plus
Chapter 2
Note: The password must include at least 4 characters and is case
sensitive.
2.
Humidity calibration
To calibrate the humidity sensor you will need a humidity
chamber.
1. Connect the MicroLog to the PC
2. Set up the MicroLog to record every 10 seconds (see
page 128).
3. Click Logger on the menu bar, then click Calibration.
4. Enter the calibration password, then click OK.
5. Select Humidity in the Choose sensor drop list
145
Chapter 2
6.
146
MicroLog Plus
Click Default to restore the original values
MicroLog Plus
Chapter 2
7.
Disconnect MicroLog from the PC and insert it into the
humidity chamber.
8. Set the humidity chamber to the first reference value.
Wait until the humidity level is stabilized and write down
the MicroLog’s reading.
9. Repeat the last step with the second reference value.
10. Connect the MicroLog to the PC.
11. Enter the two reference values into the MicroLog Value
edit boxes.
12. Enter the two MicroLog values into the Reference Value
edit boxes.
13. Click Calibrate.
To restore default calibration, click Default.
147
Chapter 2
3.
MicroLog Plus
Temperature calibration
Click Logger on the menu bar, then click Calibration.
Enter the calibration password, then click OK.
Select Temperature or Ext. Temperature in the
Choose sensor drop list.
4. Click the Default button to restore the original values.
5. Enter the two reference values into the MicroLog Value
edit boxes.
6. Enter the two MicroLog values into the Reference Value
edit boxes.
7. Click Calibrate.
To restore default calibration, click Default.
1.
2.
3.
148
MicroLog Plus
Chapter 2
2.5.6.
Communication setup
Communication between a PC and a MicroLog take place
automatically whenever you send a command to MicroLog.
However, the Communication Setup dialog box can be used for
more advanced communication options.
Click on the Logger menu and then select Com setup to open the
Communication Setup dialog box:
149
Chapter 2
MicroLog Plus
The checked COM ports are available for communication.
Click Try to connect to establish communication.
Click Work off-line to work with saved files.
150
MicroLog Plus
2.6.
Chapter 2
Toolbar Buttons
2.6.1.
Main (upper) toolbar
Opens saved files (enabled only in
Open
Offline View)
Print…
Opens the Print Option dialog box
(enabled only in Offline View)
Export
Exports the displayed data to an Excel
spreadsheet. (enabled only in
Offline View)
151
Chapter 2
152
MicroLog Plus
Setup
Opens the Setup dialog box.
°C/°F
Displays the
temperature
Meters View
Displays Meters View
Multiple
graphs View
Displays Multiple graphs View
desired
unit
of
MicroLog Plus
Chapter 2
Offline View
Displays Offline View
Cradle Map
Displays Cradle Map
Scroll back
Scroll to the previous MicroLogs
display (enabled only in Online View)
Auto-scroll
Automatic
scrolling
between
MicroLogs displays (enabled only in
Online View)
153
Chapter 2
MicroLog Plus
Scroll forward Scroll to the next MicroLogs display
(enabled only in Online View)
Alarm
2.6.2.
154
Enables or disables sound alarm
Graph (Lower) toolbar
Zoom in
Activates the zoom tool
Pan
Activates the pan tool
MicroLog Plus
Chapter 2
Auto scale
Returns the graph to full view
Cursor
Displays or hides the cursor
Graph
properties
Opens the Graph Properties dialog box
(only in Offline view)
Alarm levels
Displays or removes alarm levels from the
graph
Alarm level selection box
155
Chapter 2
MicroLog Plus
2.6.3.
Cradle Map (lower) toolbar
In Cradle Map view, click Cradle Map on the menu bar, then click
Display toolbar to display the Cradle Map toolbar.
156
Lock
Locks or unlocks Cradle Map
Add Cradle
Adds Cradle icon to Cradle Map
Remove Cradle
Removes Cradle icon from Cradle
Map
Load picture
Inserts a picture to Cradle Map
The Cradle
Chapter 3
Chapter 3
The Cradle
157
Chapter 3
The Cradle
3.1. MicroLog Cradle Line
1.
Alarm Cradle
Accommodates an additional external sensor and RS 232/USB
Computer Serial Interface, as well as a hardware alarm that
operates sound alarm
Catalog number
DT174
2.
Wireless Cradle with Alarm
A wireless cradle that can accommodate additional external sensor
and RS 232/USB Computer Serial Interface, as well as a hardware
alarm that operates sound alarm.
Catalog number
DT175
158
The Cradle
Chapter 3
3.2. Operating the Cradle
1. Place the MicroLog in
the cradle so that its rear
connection socket fits into
the plug on the cradle.
2b. USB socket
4. DC power
input
2a. RS232 serial
communication socket
3. External
sensor input
Trs
button
Led
indicator
Figure 6: MicroLog and Cradle
159
Chapter 3
The Cradle
To set up MicroLog (see Figure 6 above):
1.
2.
3.
Mount MicroLog onto the cradle (1).
Connect the cradle to the PC using either serial
or USB communication cable (2).
Run your MicroLog’s software and use the
setup command.
To prepare the wireless cradle to transmit data:
1.
2.
Set up MicroLog (see above).
Connect an external sensor if needed (see 3 in
Figure 6 above).
The cradle will automatically transmit data online or once a day
depending on how it was set up.
See page 90 for more on online transmission or page 78 for more
on Daily Download.
160
The Cradle
Chapter 3
When the cradle transmits data the LED indicator lights up in a
green light.
To manually transmit data to the PC:
Press the Trs (Transmit) button on the right side of the Cradle. The
Cradle will then transmit all stored data to the PC.
To activate the Sound Alarm feature:
You must connect the AC power adaptor (see 4 in Figure 6 above).
When the alarm operates the LED indicator lights in red light.
161
Chapter 3
The Cradle
3.3. Replace the Battery
The cradle is powered by its internal battery or by external AC
adaptor. The cradle battery's maximum lifespan is approximately
100,000 transmissions (for example, if the recording rate is once
every 15 minutes the battery's lifespan is approximately 3 years.
The Cradle’s battery is a 1/2AA 3.6V lithium
battery
1.
2.
3.
162
Unfasten the four screws at the back of the
cradle.
Carefully rotate the cradle
Remove the front cover and replace the battery.
Be sure to insert the new battery in the correct
corresponding polarities (look for the “+”
symbol next to the positive terminal)
The Cradle
4.
Chapter 3
Replace the front cover, turn the cradle over
and refasten the four screws at the back of the
cradle.
3.4. Screw Terminals
The cradle is equipped with eight screw terminals for permanent
connections to the cradle. These terminals include:
Connection to external sensor: Identical to the cradle’s external
sensor socket.
Contact sensor (DT175 only): This cradle sensor (in addition to
the usual external contact sensor) monitors Reed Relay contacts
and switch status (open/closed) to identify the correlation between
phenomena such as temperature change and door status. This
163
Chapter 3
The Cradle
sensor’s data is stored in the cradle’s memory and is available only
through wireless transmission.
External control switch: Closes an external control circuit when
sensor readings exceed alarm levels. Maximum load: 30VDC, 1A.
Figure 7: external control switch wiring diagram
164
The Cradle
Chapter 3
You can wire one alarm device for High alarm level (AL – H
terminal) and another alarm device for the low alarm level (AL – L
terminal), or you can connect the same device to both terminals so
it will operate whenever any of the alarm level is exceeded.
If you want to operate an alarm device that consumes more than
30VDC, 1A or an AC alarm device. You will have to use a relay.
External power: Connection to an external 12VDC power supply
(i.e. vehicle battery).
To connect to the screw terminals:
1.
2.
Unfasten the antenna screw at the top back of
the cradle.
Remove the antenna.
165
Chapter 3
3.
4.
5.
6.
7.
8.
9.
166
The Cradle
Unfasten the four screws at the back of the
cradle.
Remove the back cover and break the oval seal
at the bottom of the back cover by pressing it
with a screwdriver.
Replace the back cover.
Carefully rotate the cradle.
Remove the front cover.
Insert the external wires through the oval
opening you have broken at the back cover and
fasten them to the appropriate screw terminals
(see picture and table below)
Replace the front cover, turn the cradle over
and refasten the four screws at the back of the
cradle.
The Cradle
Chapter 3
10. Replace the antenna and fasten the antenna
screw.
Figure 8: Cradle’s screw terminals
The table below lists the various screw terminals according to their
labels (from left to right) that are printed above the terminals:
167
Chapter 3
Label (Left to right)
The Cradle
Function
1
2
AN
PWR
External sensor (+Ground)
3
4
DOOR
GND
Contact sensor (online only)
5
6
AL–H
AL–L
External control switch (30VDC, 1A)
7
8
GND
+12V
External power
168
The Receiver
Chapter 4
Chapter 4
The Receiver
When the receiver is connected to a
PC, it enables any MicroLog
connected to a cradle to send data to
the PC without the need for a
connection cable.
Connect the AC/DC adaptor to the
AC Adaptor socket at the bottom of
the receiver (see Figure 9)
Connect the serial communication
cable (DT175): Connect the stereo
phone jack to the PC cable socket at
the bottom of the receiver and the
type D 9-pin plug to a free serial
port on your PC.
PC cable
AC Adaptor
Figure 9: the Receiver
169
Chapter 4
The Receiver
The receiver automatically starts receiving data from any active
MicroLogs, and transfers the data to the MicroLog Plus program.
170
External Magnet Antenna
Chapter 5
Chapter 5
External Magnet Antenna
For use with the Cradle and/or receiver
171
Chapter 5
External Magnet Antenna
The external antenna is equipped with a magnet clamp for easy
mounting on metallic surfaces. Just plug the antenna to the Cradle
or receiver, place the magnet antennae in a location where
transmission is most accessible (e.g. on the roof of a truck) and you
are ready to go.
Use the external antenna in case where the:
!
!
Cradle or receiver is located in metal chambers (like
refrigerators)
Cradle or receiver is located indoors for protection from
harsh environmental conditions and rain
The external antenna is designed for 914MHz and 433MHz carriers
The antenna adds a 1-3dB gain to the Transmitter-Receiver path.
With the use of an external antenna on both Cradle and receiver we
172
External Magnet Antenna
Chapter 5
manage to maintain a constant data reception from the Cradle at
distances of 360m with no line of sight.
5.1. Connecting the antenna to the receiver
Antenna shield wire
Antenna hot wire
173
Chapter 5
External Magnet Antenna
1.
Open the receiver case, by releasing the four screws on the
receiver back
2.
Remove the wipe antenna from the screw terminal
3.
Connect the antenna hot wire to the right terminal of J1
(wipe antenna location)
4.
Connect the antenna shield wire to the left terminal
5.
Close the receiver using its four screws
5.2. Connecting the antenna to the
Cradle
All Cradles produced after March 2003 have an SMA connector on
their right side.
174
External Magnet Antenna
Chapter 5
To use the external antenna, only screw the antenna to the SMA
connector
SMA external
antenna socket
.
175
Chapter 5
External Magnet Antenna
5.3. Preparing the Cradle to work
with the external antenna
The Cradle is equipped with an internal jumper that connects the
transmitter either to the built in wipe antenna or to the external
magnet antenna.
To change the jumper position:
176
1.
Unfasten the four screws at the back of the
Cradle
2.
Carefully rotate the Cradle
3.
Remove the front cover
4.
Place the jumper in the desired position
External Magnet Antenna
Chapter 5
Antenna
jumper
177
Chapter 5
External Magnet Antenna
The jumper connects the middle pin either to the right-hand pin
marked INT (internal antenna) or to the left-hand pin marked EXT
(external antenna)
178
External Magnet Antenna
5.
Chapter 5
Replace the front cover, turn the Cradle over
and refasten the four screws at the back of the
cradle
179
Chapter 5
External sensors
Chapter 6
External Sensors
MicroLog works with the following external sensors:
6.1.
Temperature -50°C to 100°C
This MicroLog sensor takes external temperature measurements
over a wider range than the internal temperature sensor with a
faster response time than the internal sensor.
Specifications:
Range:
-50°C to 100°C
Resolution:
Better than 1°C between -20°C to 75°C
Accuracy:
±2% of reading
Probe Length:
150 mm
180
External sensors
Chapter 5
Probe OD
3.2 mm
Max. Temperature 150°C
6.2. Temperature -10°C to 10°C
This is a high-precision temperature sensor designed for
refrigeration monitoring
Specifications:
Range:
-10°C to 10°C
Resolution:
0.2°C
Accuracy:
±0.2°C
Probe Length:
50 mm
Probe OD:
4 mm
181
Chapter 5
External sensors
Operating Temperature:
-10°C to 50°C
6.3. Temperature -100°C to 120°C
PT100 adapter
This is a wide range temperature adapter designed to process
PT100 output
Specifications:
Range:
-100°C to 120°C
Resolution:
1°C
Accuracy:
±1°C
Adapter operating Temperature:
-10°C to 50°C
182
External sensors
Chapter 5
Screw terminals for PT100 connection
6.4. Voltage Sensor
This is a general sensor that will measure any device or transmitter
that produces a linear analog output of 0-10V. The voltage can
easily be converted to the correct measured units with the help of
the MicroLab software.
Specifications:
Range:
0-10V
Resolution:
0.05V
Accuracy:
±3% before calibration
Input Impedance: 3MΩ
Calibration:
Two point calibration
183
Chapter 5
OV protection:
External sensors
+30V
6.5. Current Sensor
This MicroLog external sensor can sample any device or
transmitter producing a linear current of 0-20mA. The 0-20mA can
be converted to the correct measured units using the MicroLab
software’s Calibration option.
Specifications:
Range:
0-20mA
Resolution:
±0.1mA
Accuracy:
±3 before calibration
Calibration:
Two point calibration
OC protection:
55mA
184
External sensors
Chapter 5
6.6. pH Sensor
This external sensor monitors the pH level of liquids.
Specifications:
Range:
1-14pH
Resolution:
0.116pH
Accuracy:
5% of reading
Calibration:
Single point, done with a small trimmer on the
sensor.
6.7. Contact Adapter
This MicroLog sensor monitors Reed Relay contacts and switch
status (open/closed) to identify the correlation between phenomena
such as temperature change and door status.
185
Chapter 5
External sensors
Specifications:
Range:
open/close
Connector:
Screw Terminal
Cable Length:
2.5m
Internal Pull-Up Resistor: No need for external power source
186
Specifications
Specifications
MicroLog
Models:
EC600 temperature and external sensor data logger
EC650 temperature, relative humidity and external sensor
data logger
Inputs:
Two built-in sensors:
Temperature: -30°C - 50°C (resolution 0.5°C, accuracy
±0.6°C)
187
Specifications
Relative Humidity: 0-100% (resolution 0.5%, accuracy ±3%)
External sensor:
Voltage
0 to 10V
Current
4 to 20mA
Temperature -50°C to 100°C
pH
0 to 14pH
Contact
open / closed
Outputs:
Two digit 7-segment LCD
IRDA interface to HP-printer and host computer
RS232 serial communication at 19,200 bps
188
Specifications
Memory Capacity:
16,000 recording samples
Power Supply:
Internal Lithium Battery - 3.6V 1.2AH 1/2AA
Battery Life - approximately two years, replaceable
(Lifespan may vary with use of external sensors)
Sampling Rate:
User defined: from once every 10 seconds to every 2 hours
Dimensions:
Diameter - 72mm
Thickness - 22.9mm
189
Specifications
Weight - 55gr
Standards
Water and dust proof IP65 standard, compliance for EC600
model
CE and FCC standard compliance
MicroLog Cradle
Audible alarm.
Serial communication channels:
RS232 at 19.2Kbps
USB at 1.5Mbps
190
Specifications
Memory Capacity (DT175 only):
2,000 recording samples
Connectors:
4-pin flat connection to the MicroLog
4-pin flat connection to any MicroLog external sensor
Screw terminal for External DC supply, Connection to
external sensor, External control switch and additional
Contact sensor (the additional contact sensor is available in
DT175 only)
Power supply:
Internal: lithium battery, 3.6V
191
Specifications
Battery Life - approximately 100,000 transmissions,
replaceable
External: 6-30V, minimum 300mA
RF transmission (DT175 only):
EMC conformant to ETS 300-683
Type approved to ETS 300-220. Usable range to 300m
(75m indoors) 418 (UK) & 433.92MHz (Euro) versions
1mW on 418 MHz, 10mW on 433.92MHz
2nd harmonic <-60dBc
16cm wipe antenna
CE and FCC standard compliance
192
Specifications
MicroLog Plus Receiver
Usable range to 300m (75m indoors)
One RS232 communication port to the computer’s
Power supply:
External AC/DC 6V adapter
Red LED indicating RF signal
Green LED indicating valid data being received
Type approved to ETS 300-220
CE and FCC standard compliance
193
Specifications
Software
MicroLab software
Downloads data from MicroLogs
Graph and table displays
Displays alarm levels on graph
Setting up MicroLog:
Define sensors
The ID number of each of the cradles
The alarm levels of each data logger
Comment (name) for each data logger
194
Specifications
Sampling rate: From once every 10 seconds to every 2 hours
Automatic daily download:
Wireless daily download from up to 200 MicroLogs
Automatic data saving
Daily status report
System requirements
Software
Windows 95 or later
Internet Explorer 4.0 or later (you can install Internet
Explorer 5 when you install MicroLab, since it ships with
the product)
Hardware
Pentium 300MHz or higher
195
Specifications
32 MB RAM (64 MB recommended)
5MB available disk space for the MicroLab application
MicroLab Plus software
Wireless communication with up to 200 MicroLogs:
Real-time temperature and humidity and external sensor
readings
Displays data in meters or on graphs
Visual and sound alarm when the data reading exceeds a
minimum or maximum alarm threshold for temperature or
humidity
E-mail alarm notification
Displays battery level
Automatic data saving to an Excel file
196
Specifications
Setting up MicroLog:
Define sensors
Sensor calibration
The ID number of each of the cradles
The alarm levels and properties of each data logger
Comment (name) for each data logger
Sampling rate: From once every 10 seconds to every 2 hours.
System requirements
Software
Windows 95 or later
197
Specifications
Internet Explorer 4.0 or later (you can install Internet
Explorer 5 when you install MicroLab Plus, since it ships
with the product)
Hardware
Pentium 300MHz or higher
32 MB RAM (64 MB recommended)
5MB available disk space for the MicroLog Plus
application
198
Figures
Appendix: Figures
Figure 1: Connecting MicroLog .......................................................28
Figure 2: MicroLog battery life ........................................................31
Figure 3: Replacing the battery.........................................................32
Figure 4: Define New Sensor............................................................75
Figure 5: MicroLab’s Communication Setup dialog box..................77
Figure 6: MicroLog and Cradle ......................................................159
Figure 7: external control switch wiring diagram ...........................164
Figure 8: Cradle’s screw terminals .................................................167
Figure 9: the Receiver.....................................................................169
199
Index
Index
A
alarm · 54, 62
activate sound · 99
active time · 63
delay · 63
display levels · 111
duration · 64
E-mail notification · 100
set levels · 128
200
settings · 63, 128
antenna · 171
automatic download · 82
autoscale · 48, 123
B
battery · 32, 58, 162
battery level · 128
button · 85
Index
C
calibration · 70, 143
cancel alarm · 128
Celsius · 60, 101, 128
change
password · 143
temperature units · 101
COM · 149
comment · 57
communication · 76
communication cable · 27
communication setup · 149
connections · 27, 159
contact · 185
control · 164
coordinates · 47
copy · 56
copy graph · 126
cradle · 157, 159, 190
cradle ID · 79, 128
crop · 125
current · 184
cursor · 47, 120
custom sensor · 74, 140
cyclic · 128
cyclic run · 26, 61
201
Index
D
daily download · 62, 78
daily status · 83
data · 20
crop · 125
data logger · 15
data map · 45
date format · 102
decimal place · 102
default
sensor calibration · 143
zoom · 123
define
new sensor · 140
202
define new sensor · 128
delete · See remove
display · 20, 43
alarm levels · 111
options · 103
properties · 102
download · 36
E
excel · 127
Excel · 55
export · 55, 127
external · 59, 128
Index
external antenna · 171
external sensors · 29, 180
format · 125
print · 118
F
H
Fahrenheit · 60, 101, 128
format · 53
graph · 125
humidity · 59, 128
I
G
graph · 43, 120
copy · 126
icon
MicroLog · 112
icon · 45
ID · 58, 128
203
Index
install · 34, 94, 95
interval · 60
L
lines · 125
M
magnet antenna · 171
mail · 100
map · 45
maximum values · 20
204
MicroLab · 34
MicroLog · 17, 187
MicroLog Plus · 89
minimum values · 20
modes · 25
N
new password · 143
O
offline · 77
Index
open · 39, 116
P
pan · 52
panning · 110
password · 143
pH · 185
picture · 112, 126
print · 40
graph · 118
table · 118
Print · 118
R
recalibrate · 143
receiver · 169, 193
recording · 19, 26, 61, 67
reference · 143
remove · 47
data · 125
MicroLog icon · 112
run · 26, 67, 128
205
Index
S
S/N · 128
save · 37, 97
screw terminals · 163
send e-mail · 100
sensor · 128
calibration · 143
define new · 140
external · 180
serial · 27
setup · 56, 128
sleeping mode · 30
sound alarm · 99
specifications · 187
206
stand-alone · 18
start · 26, 61, 67
start recording · 128
status · 23
stop · 25, 67
stretch/compress · 51, 110
system requirements · 94
T
table · 44
print · 118
temperature · 59, 128, 180
units · 101
Index
terminal · 163
timer · 128
timer run · 26, 61
toolbar · 85, 151, 154
cradle map · 156
graph · 154
main · 151
transmission time · 80
trim · 125
U
V
value · 47
viewing · 43
voltage · 183
W
wireless · 158
work offline · 149
uninstall · 95
unit · 55, 60, 74
207
Index
Y
Z
Y-axis · 125
identify · 120
zoom · 48, 109
default · 50, 123
manual scaling · 49, 121
stretch/compress axis ·
51, 110
208