1
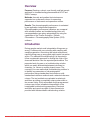
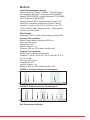
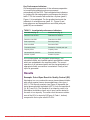
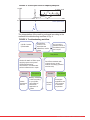
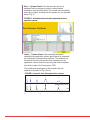
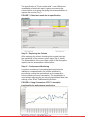
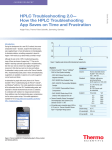
Developing a Guided Procedure for Troubleshooting HPLC and UHPLC Systems Susanne Fabel,1 Rainer Bauder, 2 and Frank Steiner1 1 Thermo Fisher Scientific, Germering, Germany, 2Thermo Fisher Scientific, Chelmsford, MA, U.S.A. Overview TABLE 1. Investig Purpose: Develop a robust, user-friendly, and fast generic approach for troubleshooting pharmaceutical HPLC and UHPLC assays. Retention time window Isocratic test (Fig. 1) Retention time RSD Methods: Isocratic and gradient test mixtures are separated on a reference column for assessing performance of instrument and separation column. Peak asymmetry Results: The chromatographic performance is evaluated by an application independent separation. Chromatographic performance indicators are compared with reference values and troubleshooting hints and recommendations are given automatically by using the capabilities of the Thermo Scientific™ Dionex™ Chromeleon™ Chromatography Data System (CDS) software. Capacity factor Introduction During sample analysis and interpretation things can go wrong. Problems can occur strarting with sampling and sample preparation. Also during the actual analysis and reporting things can go wrong and might require corrective action. For methodical troubleshooting it is important to follow a systematic approach for finding the origin of the observed deviation from the expected performance. The presented work focuses on a troubleshooting solution which can easily differentiate between instrument or chemistry (i.e. column or mobile phase) issues. The concept of our new methodical troubleshooting solution is to identify key parameters of chromatographic performance using standardized test mixes run with standardized reference methods and a selected reference column. The test methods are uploaded as electronic workflows providing a completely setup system within a few mouse clicks. A fully automated and preprogrammed custom report offers immediate interpretation of the investigated troubleshooting parameters. Electronic workflows and reports are part of the software tools provided with the described troubleshooting solution. Peak area RSD Theoretical plates Generated back press Number of peaks All chromatograms calculated results a which are embedde operation of all inst appropriate fluidic c report is generated Results Example: Out-of Nevirapine is a non with activity agains (HIV-1). The impuri active pharmaceuti (3), B(1) and C(4). Nevirapine formula the area of one imp area of the 25% for compared to the in FIGURE 3. Out-of 1.6 AU 0 0.9 AU Method Liquid Chromtaography System Thermo Scientific™ Dionex™ UltiMate™ 3000 RS system with: degasser SRD-3400, binary pump HPG-3400RS, sampler WPS-3000TRS, column thermostat TCC-3000RS and UV- detector VWD-3400RS. 2 Thermo Scientific XPert Troubleshooting Solution (PN 3200.0001) consisting of Reference Column (Thermo Scientific™ Accucore™ XL C18, 3 x 100 mm, 4 m , PN Developing a Guided Procedure for Troubleshooting HPLC and UHPLC Systems 74104-103030), XPert isocratic test mix , XPert gradient test mix, and eWorkflows™. 0 0 The interpretation o methodical troubles FIGURE 4. Troub (U)HPLC results questionable workflows and reports are part of the software tools provided with the described troubleshooting solution. 1 0 0.9 AU 2 Method Liquid Chromtaography System Thermo Scientific™ Dionex™ UltiMate™ 3000 RS system with: degasser SRD-3400, binary pump HPG-3400RS, sampler WPS-3000TRS, column thermostat TCC-3000RS and UV- detector VWD-3400RS. 1 0 0 The interpretation of the r methodical troubleshootin Thermo Scientific XPert Troubleshooting Solution (PN 3200.0001) consisting of Reference Column (Thermo Scientific™ Accucore™ XL C18, 3 x 100 mm, 4 m , PN 74104-103030), XPert isocratic test mix , XPert gradient test mix, and eWorkflows™. FIGURE 4. Troubleshoo Data Analysis Chromeleon CDS 7.2 with service release package SR1. Test fails Isocratic Test Conditions Mobile Phase: Water/Acetonitrile (50/50 v/v) Flow rate: 640 L/min Temperature: 30°C Injection Volume: 1 L Detection: 254 nm, 25 Hz data collection rate Review all details of XPert re applying system and system setup troubleshooting, rerun XPert, if recommended perform maintenance or repa Gradient Test Conditions Mobile Phase: A-Water, B-Acetonitrile Gradient: 0–3.8 min 40–95% B, 3.8–4.5 min 95% B, 4.5– 6.5 min 40 %B Flow rate: 800 L/min Temperature: 40°C Injection Volume: 1 L Detection: 254 nm, 25 Hz data collectiion rate Test fails Initiate Instrument Service FIGURE 1. Isocratic reference chromatogram. 140 mAU 4 1 3 2 5 0 -20 0 2.0 FIGURE 2. Gradient reference chromatogram. 300 mAU 2 1 0 -50 0 4.0 min 4.5 5 6 2.0 7 8 9 Test pas Perform valid or SST acco to your SOPs rerun XPert t benchmark application & system Step I – System Check: separated on the referenc installation using the eWo assed by an report, show status( Fig. 5) FIGURE 5. Automaticall operable system. 3 4 I c s e p (U)HPLC results questionable 10 min 4.0 Key Performance Indicators Chromatographic parameters of the reference separation in isocratic and gradient mode are processed automatically by the CDS. The investigated key indicators for judging the chromatographic performance are listed in table 1. For the isocratic test mode the o-XyleneThermo (peakScientific 5, Poster Note Figure 1) is investigated. For the gradient test mode the • PN71313-ISC-EN 0914S 3 a Guided Procedure for Troubleshooting Key Performance Indicators HPLC Systems Chromatographic parameters of the reference separation 0 -50 0 min 4.0 2.0 in isocratic and gradient mode are processed automatically by the CDS. The investigated key indicators for judging the chromatographic performance are listed in 1 table 1. For the isocratic test mode the o-Xylene (peak 5, Figure 1) is investigated. For 2 the gradient test mode the indicators of octanophenone (peak 10 , Figure 2) and butyrophenone and benzophenone as critical peak pair (peak 5/6) are evaluated Rainer Bauder2, and Frank Steiner cientific, Germering, Germany, Thermo Fisher Scientific, Che TABLE 1. Investigated performance indicators. riendly, and fast generic maceutical HPLC and est mixtures are or assessing paration column. rformance is evaluated aration. icators are compared hooting hints and matically by using the c™ Dionex™ ata System (CDS) retation things can go ng with sampling and e actual analysis and might require corrective oting it is important to nding the origin of the ted performance. The bleshooting solution een instrument or hase) issues. The ubleshooting solution is matographic est mixes run with nd a selected reference oaded as electronic setup system within a d and preprogrammed erpretation of the meters. Electronic he software tools eshooting solution. Isocratic test (Fig. 1) Gradient test (Fig. 2) Retention time window Retention time window Retention time RSD Retention time RSD Peak asymmetry Peak asymmetry Peak area RSD Peak area RSD Theoretical plates Resolution of critical peak pair Capacity factor Capacity factor Generated back pressure Pressure maximum Number of peaks Number of peaks Step II – Colum operability the a by running the tr transferred from application colum tool which is par The resulting ch separation is sh FIGURE 6. Isoc All chromatograms are integrated automatically. The calculated results are checked against specifications values which are embedded in the sequence table. The correct operation of all instrument parts and the characterization of appropriate fluidic connections is evaluated. Finally a final report is generated. Results Example: Out-of-Spec Result in Quality Control (QC) Nevirapine is a non-nucleoside reverse transcriptase-inhibitor with activity against human immunodeficiency virus type 1 (HIV-1). The impurity analysis (see Figure 3) separates the active pharmaceutical ingredient (API, 2) from its impurities A (3), B(1) and C(4). The trendplot of an impurity control of a Nevirapine formulation shows out-of spec results related to the area of one impurity. The outlier result shows an relative area of the 25% for impurity B (Figure 3, Peak 1, bottom) compared to the in spec result of 0.03%. 1 2 1 2 0 The specificatio immediately a fa column failure a replace the colu FIGURE 7. Faile mismatch. FIGURE 3. Out-of-spec result in impurity analysis. 1.6 AU 2 2 1 0 0.9 AU 1 Systems 4 Developing a Guided Procedure for Troubleshooting HPLC and UHPLC 2 3 4 In spec result 3 4 min Out-of spec result Step III – Repla ooting solution is phic es run with lected reference s electronic ystem within a preprogrammed tion of the Electronic ware tools ng solution. area of the 25% for impurity B (Figure 3, Peak 1, bottom) compared to the in spec result of 0.03%. FIGURE 3. Out-of-spec result in impurity analysis. 1.6 AU 2 1 1 0 0.9 AU 3 In spec result 2 3 4 4 min Out-of spec result 2 1 00 RS system PG-3400RS, tat TCC-3000RS Solution (PN mn (Thermo m, 4 m , PN XPert gradient 0 min 0.5 0.25 0 The interpretation of the result is performed according to the methodical troubleshooting workflow of Fig. 4. FIGURE 4. Troubleshooting workflow. Install XPert column, load standards and eWorkflow, mobile phase (U)HPLC results questionable e package SR1. Run isocratic or gradient method => immediately review tips in report Test fails Test passes Review all details of XPert report applying system and system setup troubleshooting, rerun XPert, if recommended: perform maintenance or repair Run XPert standards with original column, modify method accordingly (method transfer tools) /v) rate min 95% B, 4.5– Test fails Initiate Instrument Service rate ogram. 5 ogram. 8 9 4.0 min 4.5 Test passes Perform validation or SST according to your SOPs, rerun XPert to benchmark application & system Test fails Replace column min 4.0 After replacing the colu the operability of the co The interpretation of the impurity can be assess Step IV – Performance Long term monitoring o indicators is implement periodically running the column allowing an ear done without exporting settings of the XPert Tr FIGURE 8. Using Chro functionality for perfo Test passes Investigate application and verify sample or standard preparation Step I – System Check: First the isocratic test mix is separated on the reference column by easy method installation using the eWorkflow. The results are immediately assed by an report, showing that the system is in an operable status( Fig. 5) FIGURE 5. Automatically evaluated parameters show operable system. 10 Step III – Replacing th Conclusion an • A standardized check reference test mixture chromatographic para troubleshooting indepe • Automatically evaluat provide helpful indica suggested actions to simplified for LC begi knowledge and practi while making the use and introducing perfo intervention if things g Thermo Scientific Poster Note • PN71313-ISC-EN 0914S 5 • The XPert troublesho hromatogram. application & system 5 hromatogram. 4.0 min 4.5 Conclusio preparation Step I – System Check: First the isocratic test mix is separated on the reference column by easy method installation using the eWorkflow. The results are immediately assed by an report, showing that the system is in an operable status( Fig. 5) FIGURE 5. Automatically evaluated parameters show operable system. ubleshooting 7 8 9 10 min 4.0 © 2014 Thermo Fisher Scientific its subsidiaries. This information i intellectual property rights of othe rmo Fisher Scientific, Chelmsford, MA, U.S.A. nt test (Fig. 2) n time window n time RSD ymmetry ea RSD on of critical peak pair y factor Step II – Column Check: After checking the system operability the application column performance is evaluated by running the troubleshooting methods. The methods are transferred from the reference column dimension to the application column dimension by using the method transfer tool which is part of the Chromeleon CDS. The resulting chromatogram of the isocratic test mix separation is shown in Fig. 6 (blue). FIGURE 6. Isocratic test with application column. e maximum of peaks matically. The specifications values able. The correct e characterization of ated. Finally a final uality Control (QC) • Automatically provide helpfu suggested act simplified for L knowledge an while making t and introducin intervention if • The XPert trou automated tro and builds on Chromeleon 7 e reference separation processed estigated key indicators erformance are listed in the o-Xylene (peak 5, radient test mode the 10 , Figure 2) and e as critical peak pair ndicators. • A standardized reference test m chromatograph troubleshooting 1 2 3 4 1 2 3 4 5 Failing column Replacement column 5 min 0 1 2 3 The specification of “Peak number total” is not fulfilled and immediately a failed test report is given announcing the column failure as a cause and giving the recommendation to replace the column (Fig.7). FIGURE 7. Failed test result due to specification transcriptase-inhibitor mismatch. ciency virus type 1 ure 3) separates the 2) from its impurities A mpurity control of a ec results related to a Guided Procedure for Troubleshooting HPLC and UHPLC Systems 6 Developing ult shows an relative 3, Peak 1, bottom) haracterization of d. Finally a final ity Control (QC) nscriptase-inhibitor ncy virus type 1 3) separates the om its impurities A urity control of a results related to shows an relative eak 1, bottom) min 0 1 2 3 The specification of “Peak number total” is not fulfilled and immediately a failed test report is given announcing the column failure as a cause and giving the recommendation to replace the column (Fig.7). FIGURE 7. Failed test result due to specification mismatch. y analysis. In spec result 3 4 min Out-of spec result min 0.5 d according to the . 4. Run isocratic or gradient method => immediately review tips in report Test passes Step III – Replacing the Column After replacing the column rerunning the isocratic test mix, the operability of the column is given again (Fig. 6, black). The interpretation of the out-of spec result of the Nevirapine impurity can be assessed as column failure. Step IV – Performance Monitoring Long term monitoring of chromatographic performance indicators is implemented in the routine workflow by periodically running the test methods on the separation column allowing an early intervention. The visualization is done without exporting by just using the predefined data view settings of the XPert Troubleshooting Solution. FIGURE 8. Using Chromeleon CDS 7.2 trendplot functionality for performance monitoring. ert standards with column, modify accordingly (method tools) fails ce n Test passes Investigate application and verify sample or standard preparation Conclusion and Outlook Thermo Scientific Poster Note • PN71313-ISC-EN 0914S 7 Investigate application and verify sample or standard preparation Conclusion and Outlook • A standardized check run consisting of reference column and reference test mixture generates all fundamental chromatographic parameters required for system and column troubleshooting independent from the originally used method. est mix is method are immediately is in an operable • Automatically evaluated data with instant customized report provide helpful indication on the source of problems and suggested actions to remedy them. Troubleshooting is simplified for LC beginners and allows building own knowledge and practical troubleshooting competence, while making the user aware of key performance indicators and introducing performance monitoring for an early intervention if things go wrong. meters show • The XPert troubleshooting solution is the next generation of automated troubleshooting and performance monitoring and builds on the high degree of functionality of the Chromeleon 7.2 CDS software. © 2014 Thermo Fisher Scientific Inc. All rights reserved. All trademarks are the property of Thermo Fisher Scientific Inc. and its subsidiaries. This information is not intended to encourage use of these products in any manners that might infringe the intellectual property rights of others. PO71313-EN 0814S www.thermoscientific.com ©2014 Thermo Fisher Scientific Inc. All rights reserved. ISO is a trademark of the International Standards Organization. All other trademarks are the property of Thermo Fisher Scientific and its subsidiaries. This information is presented as an example of the capabilities of Thermo Fisher Scientific products. It is not intended to encourage use of these products in any manners that might infringe the intellectual property rights of others. Specifications, terms and pricing are subject to change. Not all products are available in all countries. Please consult your local sales representative for details. Africa +43 1 333 50 34 0 Australia +61 3 9757 4300 Austria +43 810 282 206 Belgium +32 53 73 42 41 Brazil +55 11 3731 5140 Canada +1 800 530 8447 China 800 810 5118 (free call domestic) 400 650 5118 Denmark +45 70 23 62 60 Europe-Other +43 1 333 50 34 0 Finland +358 9 3291 0200 France +33 1 60 92 48 00 Germany +49 6103 408 1014 India +91 22 6742 9494 Italy +39 02 950 591 Japan +81 6 6885 1213 Korea +82 2 3420 8600 Latin America +1 561 688 8700 Middle East +43 1 333 50 34 0 Netherlands +31 76 579 55 55 New Zealand +64 9 980 6700 Norway +46 8 556 468 00 Thermo Fisher Scientific, Sunnyvale, CA USA is ISO 9001:2008 Certified. Russia/CIS +43 1 333 50 34 0 Singapore +65 6289 1190 Sweden +46 8 556 468 00 Switzerland +41 61 716 77 00 Taiwan +886 2 8751 6655 UK/Ireland +44 1442 233555 USA +1 800 532 4752 PN71313-EN 0914S