1
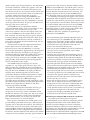
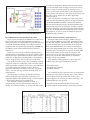
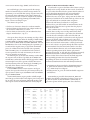
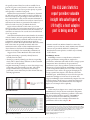
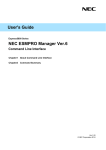
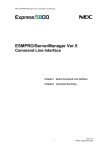
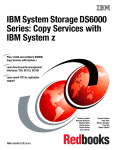
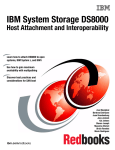
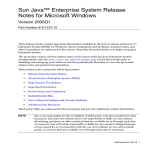
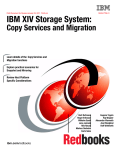
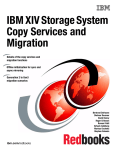
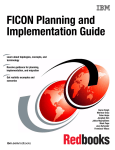
Troubleshooting
Performance Problems
With DASD Array
Host Adapters
By Steve Guendert, Ph.D.
T
he article “Performance Troubleshooting Using the
FICON Director Activity Report” (March/April 2013
Enterprise Tech Journal available at http://entsys.me/
c000r) is the latest in a series of articles on System z I/O
performance. As a quick review, this series has assumed
there was an application Service Level Agreement (SLA)/
Service Level Objective (SLO) for transaction response time
that wasn’t being met. Some basic root cause analysis was
performed by checking the key RMF reports used in
mainframe I/O performance management. The most recent
article examined the RMF 74-7 record, the RMF FICON
Director Activity Report, to determine if the FICON Storage
Area Network (SAN) may have caused the performance issue.
This article focuses on the DASD array host adapters
(i.e., what connects the DASD array to the FICON director
and to the System z channel). The section on DASD array
hardware specifics focuses on IBM DS8000 series DASD
arrays, specifically the DS8800 unless otherwise noted.
Space limitations preclude going into the technical details
on the EMC and HDS hardware equivalents, but the same
basic principles of analysis and troubleshooting apply
equally well to those and other DASD arrays that support
FICON attachment to IBM System z.
Figure 1 illustrates our environment and where the
various I/O-related RMF reports fit.
DASD Array Host Adapter Hardware
The DS8800 supports two types of Host Adapters (HAs)
installed in the array’s I/O enclosures: Fibre Channel/
FICON four-port and eight-port HA cards with a nominal
port speed of 8 Gbps. Fibre Channel (FC) is a technology
standard that allows data to be transferred from one node to
B • E n t e r p r i s e T e c h J o u r n a l • J u n e / J u l y 2 0 E1n3t e r p r i s e T e c h J o u r n a l • J u n e / J u l y 2 0 1 3
another at high speeds and great distances. This information
can include commands, controls, files, graphics, video and
sound. FC connections are established between FC ports
that reside in I/O devices, host systems and the network that
interconnects them. The network consists of elements such
as switches, bridges and repeaters that are used to
interconnect the FC ports. Using the DS8800 long-wave
fibre port HAs, connections are possible up to a 10 km
(6.2 miles). That distance isn’t user-configurable; it depends
on the type of HA and switch. All ports on each HA are the
same type: long wave or short wave.
The DS8800 uses FC to transmit Fibre Channel
connection (FICON) traffic, which uses FC frames to carry
System z I/Os. A Local Connector (LC) type cable
connector is required to attach to this adapter. Each of the
ports on a DS8800 HA can also independently be either
FCP or FICON. You can change the port type by using the
DS Storage Manager Graphical User Interface (GUI) or the
DS8000 Command-Line Interface (DSCLI) commands. A
port can’t be both FICON and FCP simultaneously, but can
be changed as required.
The HA card is a Peripheral Component Interconnect
Express (PCIe) Gen 2 bus with a dual-core 1.5 GHz
PowerPC processor (Freescale MPC8572). A new highfunction, high-performance, Application-Specific Integrated
Circuit (ASIC) drives the card. Each FC port supports a
maximum of 509 host login IDs and 1,280 paths so the user
can create large FICON SANs. The front-end with the
8 Gbps ports scales up to 128 ports for a DS8800, using the
eight-port HAs, which results in a theoretical aggregated
host I/O bandwidth of 128 x 8 Gbps.
The DS8800 8 Gbps host adapter ports can each
negotiate to 8, 4 or 2 Gbps speeds (but not 1 Gbps). The
eight-port HAs offer essentially the same total maximum
throughput when taking loads of all its ports together as the
four-port HAs of the DS8800. So, the eight-port HAs are
meant for more attachment options, but not for more
performance. Random, small-block performance is usually
no issue when considering HA performance because this
type of port can deliver up to 100K Input/Output
Operations Per Second (IOPS) for a 4K (small-block) cachehit workload. With several HAs, potential IOPS figures from
the HAs are far higher than the number of disk drives
currently supported in a DS8800.
FICON host channels limit the number of devices per
channel to 16,384. To fully access 65,280 devices on a
storage unit, it’s necessary to connect a minimum of four
FICON host channels to the storage unit. You can access the
devices through a switch to a single storage unit FICON
port. With this method, you can expose 64 control-unit
images (16,384 devices) to each host channel.
In the System z environment, the normal practice is to
provide multiple paths from each host to a disk subsystem
(typically, four to eight paths are installed). The channels in
each host that can access each Logical Control Unit (LCU)
in the DS8800 are defined in the Hardware Configuration
Definition (HCD) or I/O Configuration Data Set (IOCDS)
for that host. Dynamic Path Selection (DPS) lets the channel
subsystem select any available (non-busy) path to initiate an
operation to the disk subsystem. Dynamic Path Reconnect
(DPR) lets the DS8800 select any available path to a host to
reconnect and resume a disconnected operation such as to
transfer data after disconnection due to a cache miss. The
channel subsystem on the host and the DS8800 manages
these functions, which are part of the System z architecture.
An availability-oriented approach applies to the System z
environment: Plan enough host connections for each server
so if half the connections fail, processing can continue at the
level of performance before the failure. When using switches
to connect multiple paths between servers and a DS8000,
use a minimum of two separate FICON switching devices
(dual-fabric design) to avoid a single point of failure. Most
large installations use four or even eight fabrics.
IBM also offers these guidelines for optimizing the
performance of DS8800 HAs:
•For FC and FICON paths with high utilization, don’t use
more than four ports on a DS8800 8 Gbps HA, which
might increase the number of HAs required. Avoid using
all eight ports of the eight-port HA cards for demanding
workloads because the performance of the HA card
doesn’t scale with more than four ports.
•Don’t use the same DS8800 I/O port for host attachment
and copy services remote replication (such as Metro
Mirror or Global Mirror).
•Consider using separate HA cards for FICON protocol
and FCP. Even though I/O ports on the same HA can be
configured independently for the FCP and the FICON
protocol, it’s preferable to isolate your z/OS environment
(FICON) from your open systems environment (FCP).
•Spread the paths from all host systems across the available
I/O ports, HA cards and I/O enclosures to optimize workload
distribution across the available resources, depending on your
workload sharing and isolation considerations.
•Spread the host paths that access the same set of volumes
as evenly as possible across the available HA cards and I/O
enclosures. This approach balances workload across
hardware resources and helps ensure a hardware failure
doesn’t result in a loss of access.
•Ensure that each host system uses a multipathing device
driver, such as Subsystem Device Driver (SDD), and a
minimum of two host connections to different HA cards
in different I/O enclosures on the DS8800. Preferably,
evenly distribute them between left-side (even-numbered)
I/O enclosures and right-side (odd-numbered) I/O
enclosures for the highest availability and a balanced
workload across I/O enclosures and HA cards.
Monitoring for Potential HA Performance Problems
Let’s assume you’ve followed these best practice
recommendations, yet you still have a performance problem
causing missed SLAs/SLOs. This section identifies some
methods, tools and techniques you can use to determine
whether the bottleneck could be one or more DASD array
host adapter ports. We will briefly revisit the RMF 74-7 record
(FICON Director Activity Report) and discuss some
additional tools: the ESS Link Statistics component of the SMF
74-8 record, Brocade FabricWatch and Intellimagic Vision.
E n t e r p r i s e T e c h J o u r n a l • J u n e / J u l y 2 0E1n 3t e r p r i s e T e c h J o u r n a l • J u n e / J u l y 2 0 1 3 • C
Figure 1: Our Environment and Where the Various I/O-Related RMF Reports Fit
starvation or congestion). Bottlenecks increase the latency
or even cause frame drops and upper-level error recovery.
What we want to avoid is a build-up of back pressure—a
knock-on effect that spreads buffer credit starvation into a
switched fabric starting from a slow drain device. Because of
this effect, a slow drain device can affect apparently
unrelated devices.
Also, you should be correlating the frame pacing delay
with the traffic transmission going out of the port using the
“PORT BANDWIDTH WRITE” column of the FICON
Director Activity Report. You also should examine the ESS
Link Statistics Report to see what type of traffic is coming
into the host adapter port connected to the FICON director
port. Use the FICON Director management tools to analyze
the bottleneck, or even to set up thresholds for proactive
monitoring and prevention.
The FICON Director Activity Report Revisited
ESS Disk Systems Statistics (Link Statistics)
Figure 2 shows an example of an RMF 74-7 record from
the previous article. This shows significant amounts of
frame pacing delay on a FICON director port that’s attached
to a DASD control unit through a host adapter port. For
argument’s sake, let’s assume we’re discussing a DS8800 and
we think the source of the bottleneck may be this host
adapter port.
Figure 2 is a clear cut case of buffer credit starvation, a
situation where a transmitting port runs out of buffer credits
and isn’t allowed to send frames. The frames will be stored
within the sending device, blocking buffers, and eventually
must be dropped if they can’t be sent for a certain time.
The question becomes, why is this occurring? Is it due to
congestion, where the workload for a link exceeds its actual
usable bandwidth? Congestion occurs due to overutilization
or oversubscription. For example, could we have too
aggressive a fan-in/fan-out ratio? Is it due to a slow drain
device—one that can’t cope with the incoming traffic in a
timely manner?
Slow drain devices can’t free up their internal frame
buffers and therefore don’t allow the connected port to
regain their buffer credits quickly enough. A classic example
is an overutilized HA port on a DASD array.
This situation is causing a bottleneck—a link or
component that can’t transport all frames directed to or
through it in a timely manner (e.g., because of buffer credit
Enterprise Disk Systems Statistics (SMF record type
74-8) is the next RMF report to check. Specifically, look at
the ESS Link Statistics. The Enterprise Disk Systems report
provides measurements on the activities of an enterprise
disk system. RMF monitors the activity on an enterprise
disk system independently from the source of the activity.
Activity may be caused by the z/OS system on which RMF
runs or from another system using the enterprise disk
system. You can use the data contained in this report to
assess your current disk configuration, for bottleneck
analysis and capacity planning.
If the Monitor I data gatherer is set up to collect all
available data, the report contains three sections:
•ESS Link Statistics
•ESS Extent Pool Statistics
•ESS Rank Statistics.
The remainder of this section will focus on the ESS Link
Statistics. For each adapter of an ESS, this section contains
statistics about the I/O operations that occurred. One
adapter supports one or more types of I/O (link type). The
following link types are reported:
•Extended Count Key Data (ECKD) read and write
•Small Computer System Interface (SCSI) read and write
Figure 2: An RMF 74-7 Record
D • E n t e r p r i s e T e c h J o u r n a l • J u n e / J u l y 2 0 E1n3t e r p r i s e T e c h J o u r n a l • J u n e / J u l y 2 0 1 3
•Peer-to-Peer Remote Copy (PPRC) send and receive.
Bottleneck Detection and Fabric Watch
A bottleneck is a port in the fabric where frames can’t get
through as fast as they should. In other words, a bottleneck
is a port where the offered load is greater than the achieved
egress throughput. Bottlenecks can cause undesirable
degradation in throughput on various links. When a
bottleneck occurs at one place, other points in the fabric can
experience bottlenecks as the traffic backs up. There are two
types of bottlenecks in a FICON SAN: congestion
bottlenecks and latency bottlenecks. A congestion
bottleneck is a port that’s unable to transmit frames at the
offered rate because that rate is greater than the physical
data rate of the line.
This condition can be caused, for example, by trying to
transfer data at 8 Gbps over a 4 Gbps Inter Switch Link
(ISL). A latency bottleneck is a port where the offered load
exceeds the rate at which the other end of the link can
continuously accept traffic, but doesn’t exceed the physical
capacity of the link. This condition can be caused by a
device attached to the fabric that’s slow to process received
frames and send back credit returns. A latency bottleneck
due to such a device can spread through the fabric and slow
down unrelated flows that share links with the slow flow.
Brocade FICON directors, such as the DCX 8510, have
a Fabric Operating System (FOS) feature, aptly named
Bottleneck Detection, to deal with these situations proactively.
Bottleneck Detection is a feature integrated into the base
Fabric OS that detects device latencies and link congestion
and optionally generates alerts based on thresholds.
Depending on where it’s activated and what ports are
monitored, Bottleneck Detection will identify bottlenecks:
For each link type, this section provides the average
number of transferred bytes and the average number of
operations per second and their average response time. The
I/O intensity shows utilization of the adapter during the
report interval. Use this section for analysis of the external
link usage and for capacity planning of the PPRC links.
Figure 3 shows an example report.
The SAID is the port ID:
•The first two characters denote the enclosure number.
•The third character denotes the host adapter number in
the enclosure: numbered 0, 1, 3 and 4.
•The last character denotes the port ID within that host
adapter: numbered 0, 1, 2 up to 7.
The report shows the ports are running at 2 Gbps. There
are FICON ports, shown under the heading of LINK TYPE
as ECKD READ and ECKD WRITE. There are also PPRC
ports, shown as PPRC SEND and PPRC RECEIVE. The I/O
INTENSITY is the result of multiplying the operations per
second and the response time per operation. For FICON
ports, it’s calculated for both read and write operations,
while for PPRC ports, it’s calculated for both send and
receive operations. The total I/O intensity is the sum of
those two numbers on each port.
For FICON ports, if the total I/O intensity reaches 4000,
the response time is affected, probably in the PEND and
CONN times. When this number already approaches 2000,
actions might be needed to prevent a further increase in
total I/O intensity. This rule doesn’t apply for PPRC ports,
especially if the distance between the primary and
secondary site is significant.
If the DS8000 is shared between System z and open
systems, the report also shows the port activity used by the
open systems. It shows up as SCSI READ and SCSI WRITE
on ports 0200 and 0201.
The ESS Link Statistics report provides valuable insight
into what types of I/O traffic a host adapter port is being used
for, as well as for cross-referencing bandwidth and I/O with
other reports such as the FICON Director Activity Report.
E S S
•Originating in devices attached to the FICON Director’s
F_ports for both latencies and bandwidth congestion
(e.g., DASD array host adapters)
•Existing in ISLs (E_ports) for both bandwidth congestion
and latencies.
Functionality is provided that monitors R_RDY and
available bandwidth to determine if a latency exists on an
F_Port or E_Port, or that bandwidth is consistently 95
percent or greater of link capacity. For device latencies,
L I N K
S T A T I S T I C S
BYTES
/OPERATION
9.9K
14.5K
OPERATIONS
/SEC
1735.2
533.9
------ADAPTER-----SAID TYPE
0000 FIBRE 2Gb
--LINK TYPE-ECKD READ
ECKD WRITE
BYTES
/SEC
17.2M
7.7M
RESP TIME
/OPERATION
0.1
0.2
0001
FIBRE 2Gb
ECKD READ
ECKD WRITE
9.1M
7.7M
8.4K
17.0K
1087.2
455.9
0.1
0.2
0101
FIBRE 2Gb
PPRC SEND
PPRC RECEIVE
6.0M
0.0
53.1K
0.0
112.2
0.0
9.1
0.0
0102
FIBRE 2Gb
PPRC SEND
PPRC RECEIVE
6.2M
0.0
53.1K
0.0
115.9
0.0
8.6
0.0
0200
FIBRE 2Gb
SCSI READ
SCSI WRITE
10.8M
1.9M
30.7K
31.5K
352.4
60.9
0.2
1.4
0201
FIBRE 2Gb
SCSI READ
SCSI WRITE
9.0M
135.0K
38.7K
10.7K
232.0
12.6
0.2
0.3
I/O
INTENSITY
131.6
123.4
-----255.0
79.9
101.4
-----181.2
1024.9
0.0
-----1024.9
998.0
0.0
-----998.0
67.5
83.3
-----150.8
53.3
3.5
-----56.8
Figure 3: An ESS Link Statistics Report
E n t e r p r i s e T e c h J o u r n a l • J u n e / J u l y 2 0 E1n3t e r p r i s e T e c h J o u r n a l • J u n e / J u l y 2 0 1 3 • E
it’s typically assumed that if no credit is available for 98
percent of a given second, then the connected device has
latency. A link that’s used at 95 percent capacity or greater
will typically be considered congested.
Bottleneck Detection makes a calculation to determine
an “affected second.” The parameters used to calculate an
affected second are the percentage of time when there are
zero transmit buffer credits and the transmit utilization of
the port over a second. Affected seconds are counted over a
time interval and alerts are generated if the number of
affected seconds exceeds a predefined threshold.
Figure 4 shows affected seconds. Here, we see four
affected seconds over an averaging interval of 12 seconds. If
we wanted Bottleneck Detection to catch this situation, we
would have an interval of 12 seconds and a threshold level
of .33 (33 percent).
Note that FOS Bottleneck Detection identifies the existence
of device latencies. It doesn’t provide independent disk service
times that can be directly correlated with host-based storage
performance measuring tools. No attempt is made, for
example, to correlate detected latencies with disk service times.
Disk service times are generally associated with SCSI
transactions such as reads or writes. Bottleneck Detection
detects latencies at the frame level. IntelliMagic’s Vision
software is an example of an outstanding correlation tool.
Suggested uses of FOS Bottleneck Detection include:
•Regular monitoring to positively identify latencies
centrally from the fabric
•Alerting to positively identify ports that are responding
slowly. This is almost always sufficient to direct attention
to the source of the problem.
•Regular monitoring of storage to ensure that storage array
performance isn’t deteriorating over time. This allows
storage administrators to proactively avoid storage
performance issues before they become chronic and start
affecting applications.
The ESS Link Statistics
report provides valuable
insight into what types of
I/O traffic a host adapter
port is being used for.
•Monitor critical host FICON channels to ensure they
continue to process data in a timely manner. Host channel
latencies are particularly difficult to identify and
Bottleneck Detection provides a reliable way to identify
such behavior.
IntelliMagic Vision
IntelliMagic Vision is a comprehensive solution for
storage performance management. It analyzes the
performance, utilization and health of all the storage system
components. Direct benefits are the prevention of
performance issues, faster problem resolution and more
efficient use of storage hardware. IntelliMagic Vision offers
vendor-independent visibility into root causes of storage
performance issues. Often, the aggregate throughput of a
storage system’s host adapter is less than the sum of the
individual parts. Unfortunately, most tools don’t report the
cumulative throughput or I/O rates for an entire host
adapter. IntelliMagic Vision automatically computes the sum
of the key metrics for all ports on a given host adapter for
easy interpretation of the utilization of the host adapters.
Figure 5 is an example of this capability.
Conclusion
Figure 4: Affected Seconds
Figure 5: Host Adapter Utilization
DASD array host adapters are a critical component in
mainframe I/O. They’re often an overlooked component
when troubleshooting performance problems. This article
has discussed the hardware specifics of DS8800 host
adapters and looked at four different performance
management tools used to manage and monitor the
performance of these host adapters. ETJ
Dr. Steve Guendert is a principal engineer and global solutions architect for
Brocade Communications, where he leads the mainframe-related business efforts.
A senior member of both the Institute of Electrical and Electronics Engineers (IEEE)
and the Association for Computing Machinery (ACM), he serves on the board of
directors for the Computer Measurement Group (CMG). He is also a former
member of the SHARE Board of Directors.
Email: [email protected]
Twitter: @BRCD_DrSteve
F • E n t e r p r i s e TEenct he r p
J or ui sr en aTl e c•h J Juon uer/n Jaul l y • 2 M
01
a3
rch/April 2013 • Copyright ©2013 Enterprise Systems Media, Inc.