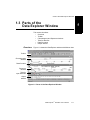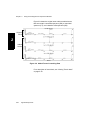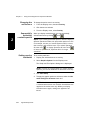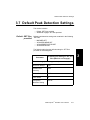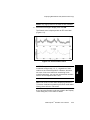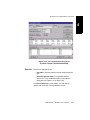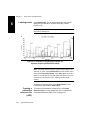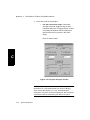
1
Data Explorer™ Software Version 4 Series Software User Guide © Copyright 2001, Applied Biosystems. All rights reserved. For Research Use Only. Not for use in diagnostic procedures. Information in this document is subject to change without notice. Applied Biosystems assumes no responsibility for any errors that may appear in this document. This document is believed to be complete and accurate at the time of publication. In no event shall Applied Biosystems be liable for incidental, special, multiple, or consequential damages in connection with or arising from the use of this document. Applied Biosystems is a registered trademark of Applera Corporation or its subsidiaries in the U.S. and certain other countries. AB (Design), Applera, Biospectrometry, CombiSolv, Data Explorer, Mariner, and Voyager are trademarks of Applera Corporation or its subsidiaries in the U.S. and certain other countries. HP and Laserjet are registered trademarks of Hewlett-Packard Co. Microsoft, PowerPoint, Visual Basic, and Windows NT are registered trademarks of Microsoft Corporation. All other trademarks are the sole property of their respective owners. Printed in the USA, 7/2001 Part Number 4317717 Rev. C Table of Contents Table of Contents How to Use This Guide .............................................................. xi Chapter 1 Data Explorer™ Basics 1.1 1.2 .............................................................................. 1-2 File Formats and Types ............................................................ 1-5 Overview 1.2.1 Software Applications Compatibility ....................................... 1-5 1.2.2 Data (.DAT) File Format ......................................................... 1-5 1.3 Parts of the Data Explorer Window ............................................. 1-11 1.4 Customizing the Data Explorer Window ....................................... 1-17 1.5 1.6 1.4.1 Setting Default Values ...........................................................1-17 1.4.2 Customizing Processing and Graphic Settings (.SET) ...........1-17 1.4.3 Customizing Toolbars ............................................................1-21 Setting Graphic Options .......................................................... 1-23 1.5.1 Changing Background Color .................................................1-23 1.5.2 Customizing Graphic Options ................................................1-24 1.5.3 Reverting to Previous Graphic Options .................................1-29 Managing Files ...................................................................... 1-30 1.6.1 Converting .SPC File Format to .DAT File Format (Mariner Data Only) ..............................................................1-30 1.6.2 Converting Data from Profile to Centroid (Mariner Data Only) ..............................................................1-33 1.6.3 Converting to and Exporting ASCII Data ..............................1-34 1.6.4 Importing a Trace in ASCII Format ........................................1-35 1.6.5 Extracting and Saving Information from .DAT, .RSD, and .RCD Files ..........................................1-36 1.6.6 Copying from Data Files ........................................................1-38 Data Explorer™ Software User’s Guide iii Table of Contents Chapter 2 Using Chromatogram and Spectrum Windows 2.1 ................................................. 2-2 2.1.1 Opening Data Files ................................................................ 2-2 2.1.2 Displaying Mariner DAD Traces ............................................. 2-6 2.1.3 Displaying Voyager Chromatograms ...................................... 2-7 2.1.4 Viewing Read-Only Files ........................................................ 2-7 2.1.5 Moving Between Open Files .................................................. 2-8 2.1.6 Closing Data Files .................................................................2-10 2.2 Adjusting the Display Range ..................................................... 2-11 2.3 Organizing Windows ............................................................... 2-13 2.4 Manipulating Traces 2.5 iv Opening and Closing Data Files ............................................................... 2-14 2.4.1 Zooming, Centering, and Customizing a Trace ......................2-14 2.4.2 Duplicating a Trace ...............................................................2-15 2.4.3 Dividing the Active Trace ......................................................2-15 2.4.4 Adding Traces from the Same Data File to a Window ...........................................2-16 2.4.5 Removing Traces ..................................................................2-21 2.4.6 Expanding and Linking Traces ..............................................2-21 2.4.7 Recalling and Rearranging Traces (Processing History) ........2-22 2.4.8 Overlaying Traces .................................................................2-24 2.4.9 Annotating Traces .................................................................2-28 2.4.10 Viewing Trace Labels ............................................................2-30 2.4.11 Printing Traces ......................................................................2-33 Working with Multiple Data Files ................................................ 2-36 2.5.1 Working with Separate Data Files .........................................2-36 2.5.2 Copying Traces from Multiple Data Files to a Window ...........2-37 2.6 Saving, Opening, and Deleting .DAT Results ................................ 2-38 2.7 Exporting, Opening, and Deleting .RCD and .RSD Results Files (Mariner Data Only) ................................................................ 2-39 2.8 Saving, Opening, and Deleting .SPC Results Files (Mariner Data Only) ................................................................ 2-40 Applied Biosystems Table of Contents Chapter 3 Peak Detection and Labeling 3.1 3.2 3.3 3.4 3.5 Overview .............................................................................. 3-2 3.1.1 Default Peak Detection .......................................................... 3-2 3.1.2 The Resolution-Based Peak Detection Routine ...................... 3-3 Peak Detection ....................................................................... 3-6 3.2.1 Strategy for Mariner Peak Detection ....................................... 3-6 3.2.2 Strategy for Voyager Peak Detection ...................................... 3-8 3.2.3 Setting Peak Detection Parameters ...................................... 3-11 3.2.4 Peak Detection Parameter Descriptions ................................3-19 3.2.5 Charge State Determination and Examples ................................................3-32 Peak List ............................................................................. 3-37 3.3.1 Displaying the Peak List ........................................................3-37 3.3.2 Inserting Peaks in the Peak List ............................................3-39 3.3.3 Saving the Peak List .............................................................3-40 3.3.4 Sorting, Filtering, and Printing the Peak List .........................3-42 .......................................................... 3-45 Peak Labeling ....................................................................... 3-52 Deisotoping a Spectrum 3.5.1 Charge State Labels .............................................................3-53 3.5.2 Setting Chromatogram and Spectrum Peak Labels ...............3-54 3.5.3 Setting Custom Peak Labels .................................................3-61 3.6 Process that Occurs During Peak Detection, Centroiding, and Integration ..................................................... 3-67 3.7 Default Peak Detection Settings ................................................ 3-71 Data Explorer™ Software User’s Guide v Table of Contents Chapter 4 Examining Chromatogram Data 4.1 4.2 .............................................................................. 4-2 Creating an Extracted Ion Chromatogram ..................................... 4-5 Overview 4.2.1 Creating an Extracted Ion Chromatogram (XIC) ..................... 4-5 4.2.2 Creating a Constant Neutral Loss (CNL) Chromatogram ........ 4-9 4.3 Creating an Extracted Absorbance Chromatogram (XAC) (Mariner Data Only) ................................................................ 4-13 4.4 Noise Filtering/Smoothing ........................................................ 4-17 4.5 Adding and Subtracting Raw Spectra Within a Data File .................. 4-20 4.6 Displaying MS Method Data (Mariner Data Only) ........................... 4-23 4.7 Adjusting the Baseline 4.8 ............................................................ 4-27 4.7.1 Using Baseline Offset ...........................................................4-27 4.7.2 Using Baseline Correction .....................................................4-29 Using UV Trace Offset (Mariner Data Only) .................................. 4-30 Chapter 5 Examining Spectrum Data 5.1 5.2 5.3 5.4 vi .............................................................................. 5-2 Creating a Combined Spectrum ................................................. 5-4 Manual Calibration .................................................................. 5-5 Overview 5.3.1 Overview of Manual Calibration ............................................. 5-5 5.3.2 Manually Calibrating .............................................................. 5-7 5.3.3 Creating or Modifying a Calibration Reference File (.REF) ....5-17 5.3.4 Reverting to Instrument Calibration .......................................5-22 5.3.5 Hints for Calibrating Mariner Data .........................................5-24 5.3.6 Hints for Calibrating Voyager Data ........................................5-25 Automatic Calibration .............................................................. 5-26 5.4.1 Overview of Automatic Calibration ........................................5-26 5.4.2 Importing and Specifying Automatic Calibration Settings .......5-29 5.4.3 Automatically Calibrating (Mariner Data Only) .......................5-34 Applied Biosystems Table of Contents 5.5 5.6 5.7 5.8 .......................................................................... Mass Deconvolution (Mariner Data Only) ..................................... Noise Filtering/Smoothing ........................................................ Adjusting the Baseline ............................................................ Centroiding 5-36 5-37 5-42 5-45 5.8.1 Using Baseline Offset ...........................................................5-45 5.8.2 Using Baseline Correction .....................................................5-47 5.8.3 Using Advanced Baseline Correction ....................................5-48 5.9 Truncating a Spectrum ............................................................ 5-56 5.10 Converting to a Singly Charged Spectrum (Mariner Data Only) ......... 5-59 5.11 AutoSaturation Correction (Mariner Data Only) 5.12 Adding and Subtracting Raw or Processed Spectra from the Same or Different Data Files (Dual Spectral Trace Arithmetic) ................... 5-64 ............................. 5-62 Chapter 6 Using Tools and Applications 6.1 6.2 Using the Elemental Composition Calculator ................................. 6-2 6.1.1 Determining Elemental Composition ...................................... 6-2 6.1.2 Setting Limits ......................................................................... 6-7 Using the Isotope Calculator ..................................................... 6-13 6.3 Using the Mass Resolution Calculator ......................................... 6-20 6.4 Using the Signal-to-Noise Ratio Calculator ................................... 6-23 6.5 Using the Ion Fragmentation Calculator ....................................... 6-25 6.6 Using the Elemental Targeting Application 6.7 ................................... 6-31 Using the Macro Recorder ....................................................... 6-34 6.7.1 Before Using the Macro Recorder .........................................6-34 6.7.2 Recording a Macro ................................................................6-37 6.7.3 Assigning Macros to Buttons .................................................6-38 6.7.4 Running a Macro ..................................................................6-39 6.7.5 Deleting a Macro ...................................................................6-41 6.7.6 Advanced Macro Editing .......................................................6-42 6.7.7 Importing or Exporting Macros in DATAEXPLORER.VB6 ......6-43 6.7.8 Running Macros Automatically When Opening and Closing Files ..........................................6-45 Data Explorer™ Software User’s Guide vii Table of Contents Chapter 7 Data Explorer Examples 7.1 7.2 Mariner Data Examples ............................................................ 7-2 7.1.1 Improving Signal-To-Noise Ratio ............................................ 7-2 7.1.2 Deconvoluting and Evaluating Unresolved Chromatographic Peaks .......................................7-4 7.1.3 Determining if a Peak is Background Noise ............................ 7-8 Voyager Data Examples .......................................................... 7-11 7.2.1 Detecting and Labeling Partially Resolved Peaks .................. 7-11 7.2.2 Processing Before Calibrating to Optimize Mass Accuracy ...7-14 7.2.3 Detecting Peaks from Complex Digests ................................7-18 Chapter 8 Viewing Voyager PSD Data 8.1 8.2 8.3 ............................................................... 8-2 Applying Fragment Labels ......................................................... 8-8 Calibrating a PSD Spectrum ..................................................... 8-10 Displaying PSD Data 8.3.1 Checking Peak Detection ...................................................... 8-11 8.3.2 Calibrating ............................................................................8-12 8.3.3 Creating PSD Calibration (.CAL) Files and Applying to Other Data Files .................................................8-20 8.3.4 Creating PSD Calibration Reference (.REF) Files .................8-21 8.3.5 Changing the Precursor Mass ...............................................8-23 Chapter 9 Troubleshooting 9.1 9.2 9.3 9.4 9.5 9.6 viii .............................................................................. 9-2 General Troubleshooting .......................................................... 9-3 Processing, Tools, and Applications Troubleshooting ....................... 9-6 Calibration Troubleshooting ...................................................... 9-10 Printing Troubleshooting .......................................................... 9-14 Peak Detection and Labeling Troubleshooting ............................... 9-15 Overview Applied Biosystems Table of Contents Appendix A Warranty Information ........................................ A-1 Appendix B Overview of Isotopes ........................................ B-1 Appendix C Data Explorer Toolbox (Visual Basic Macros) ......................................................... C-1 C.1 C.2 C.3 C.4 C.5 C.6 C.7 .............................................................................. C-2 Preparing Data Before Accessing Macros ..................................... C-3 Accessing the Macros .............................................................. C-4 Using the Ladder Sequencing Toolbox ......................................... C-5 Using the Peptide Fragmentation Toolbox ..................................... C-9 Using the Polymer Analysis Toolbox .......................................... C-15 Using MS Fit/MS Tag Toolbox .................................................. C-18 Overview Index Data Explorer™ Software User’s Guide ix Table of Contents x Applied Biosystems How to Use This Guide 1 How to Use This Guide Purpose of this guide The Applied Biosystems Data Explorer ™ Software User’s Guide describes processing and analyzing data with the Data Explorer software. You can use the Data Explorer software to analyze data collected on: • Mariner™ Workstations with Version 3.0 and later software • Voyager™-DE Biospectrometry™ Workstations with Version 5.0 and later software Audience This guide is intended for novice and experienced Mariner or Voyager workstation users who are analyzing biomolecules. Structure of this guide The Applied Biosystems Data Explorer ™ Software User’s Guide is organized into chapters and appendixes. Each chapter page is marked with a tab and a header to help you find information. The table below describes the material covered in each chapter and appendix. Chapter/Appendix Content Chapter 1, Data Explorer™ Basics Describes file formats, file management, the parts of the Data Explorer window, and how to customize the Data Explorer software. Chapter 2, Using Chromatogram and Spectrum Windows Describes window and trace handling. Also describes saving results. Chapter 3, Peak Detection and Labeling Provides background information on peak detection, centroiding, and integration. Describes peak detection, peak labeling, and peak deisotoping. Chapter 4, Examining Chromatogram Data Describes processing and analyzing chromatographic data. Data Explorer™ Software User’s Guide xi 1 How to Use This Guide Chapter/Appendix Content Chapter 5, Examining Spectrum Data Describes processing and analyzing mass spectral data. Chapter 6, Using Tools and Applications Describes how to generate results using several tools and applications: the Centroid calculator, Elemental Composition calculator, Isotope calculator, Mass Resolution calculator, Ion Fragmentation calculator and Signal-to-Noise calculator. Also describes using the Macro Recorder and the Elemental Targeting Application. Chapter 7, Data Explorer Examples Includes specific examples for Mariner data and Voyager data. Examples include how to improve the signal-to-noise ratio for reserpine, deconvolute unresolved peaks in cyctochrome c (Mariner data), and label partially resolved peaks (Voyager data). Chapter 8, Viewing Voyager PSD Data Describes how to view, label, and calibrate PSD data. Chapter 9, Troubleshooting Includes symptoms and possible causes of, and corrective actions for potential system problems. Appendix A, Warranty Provides warranty and service information. Appendix B, Overview of Isotopes Includes background information you need for understanding isotopes. Appendix C, Data Explorer Toolbox (Visual Basic Macros) Describes loading Visual Basic® macros, preparing data, and running the macros. xii Applied Biosystems How to Use This Guide Conventions 1 This guide uses the following conventions to make text easier to understand. • Bold indicates user action. For example: Type 0 and press Enter for the remaining fields. • Italic text denotes new or important words, and is also used for emphasis. For example: Before analyzing, always prepare fresh matrix. Notes, Cautions, Warnings, and Hints A note provides important information to the operator. For example: NOTE: If you are prompted to insert the boot diskette into the drive, insert it, then press any key. A caution provides information to avoid damage to the system or loss of data. For example: CAUTION Do not touch the lamp. This may damage the lamp. A warning provides information essential to the safety of the operator. For example: WARNING CHEMICAL HAZARD. Wear appropriate personal protection and always observe safe laboratory practices when operating your system. A hint provides helpful suggestions not essential to the use of the system. For example: Hint: To avoid complicated file naming, use Save First to Pass or Save Best Only modes. Data Explorer™ Software User’s Guide xiii 1 How to Use This Guide Related documentation The related documents shipped with your system include: • Mariner ™ Workstation User’s Guide—Use this document to learn detailed information about the Mariner Workstation. • Voyager™-DE Biospectrometry Workstation User’s Guide—Use this document to learn detailed information about the Voyager-DE Workstation. • Printer documentation (depends on the printer you purchase)—Use this documentation to set up and service your printer. • Microsoft ® Windows NT ® User’s Guide and related documents—Use this guide to learn detailed information about the Microsoft Windows NT user interface. Send us your comments We welcome your comments and suggestions for improving our manuals. You can send us your comments in two ways. • On the web at: www.appliedbiosystems.com/about/contact.html • By e-mail at: [email protected] xiv Applied Biosystems Chapter Explorer™ 1 Data Basics 1 This chapter contains the following sections: 1.1 Overview ................................................... 1-2 1.2 File Formats and Types ............................. 1-5 1.3 Parts of the Data Explorer Window .......... 1-11 1.4 Customizing the Data Explorer Window ... 1-17 1.5 Setting Graphic Options .......................... 1-23 1.6 Managing Files ........................................ 1-30 Data Explorer™ Software User’s Guide 1-1 Chapter 1 Data Explorer™ Basics 1 1.1 Overview Description The Data Explorer™ Version 4.0 processing software is graphical software that you use to analyze, calibrate, and report data. You can use the Data Explorer software to analyze data collected on: • Mariner™ Workstations • Voyager™-DE Biospectrometry™ Workstations NOTE: Application systems that automatically acquire and process data, such as Mariner High Throughput Analysis Option (CombiSolve™) and Proteomics Solution 1™ Option, require specific versions of Data Explorer software. Features 1-2 Applied Biosystems Data Explorer software includes a suite of tools and processing options to allow you to graphically and interactively manipulate chromatographic and mass spectral data. For example, you can: • Smooth and noise-filter data. • Automatically and manually calibrate spectral data. • Set peak detection parameters and custom labels for regions of the trace. Detected peaks can be evaluated for charge-state determination according to user-defined parameters. • Determine elemental composition, theoretical isotope distributions, resolution, signal-to-noise ratio, and fragment ions. • Perform target compound analysis (elemental targeting). • Customize windows, toolbars, and traces. • Create scripts and macros to automate your work using the Macro Recorder and Visual Basic® Editor. Overview Starting and exiting the software To start the Data Explorer software from the Windows NT desktop, double-click the Data Explorer icon on the desktop. The Data Explorer window opens. The Data Explorer window is blank with only a few menus displayed until you open a data file. Figure 1-1 shows the Data Explorer main window with a Mariner data file open. Figure 1-2 shows the Data Explorer main window with a Voyager data file open. To exit the software, select Exit from the File menu in the Data Explorer window. The Data Explorer software closes. Figure 1-1 Data Explorer Window with Mariner Data Data Explorer™ Software User’s Guide 1-3 1 Chapter 1 Data Explorer™ Basics 1 Figure 1-2 Data Explorer Window with Voyager Data Default colors The default colors are different for Mariner and Voyager: • Mariner—Black background, yellow traces, and green labels • Voyager—White background, blue traces, and red labels You can customize the default colors as needed. See Section 1.5.1, Changing Background Color. NOTE: For consistency, all Mariner and Voyager screen examples in the following sections of this User’s Guide are shown with a white background. 1-4 Applied Biosystems File Formats and Types 1.2 File Formats and Types 1 This section describes: • • Software applications compatibility Data (.DAT) file format 1.2.1 Software Applications Compatibility You can use the Data Explorer Macro Recorder function to create Visual Basic scripts to automate tasks. You can also use the Visual Basic Editor directly to create more complex programs customized to suit your needs. For more information, see Section 6.7, Using the Macro Recorder. Additionally, you can convert data to ASCII format for import into other software applications or import ASCII results. For more information, see Section 1.6.3, Converting to and Exporting ASCII Data, and Section 1.6.4, Importing a Trace in ASCII Format. 1.2.2 Data (.DAT) File Format .DAT file format Data generated by Mariner and Voyager systems is stored in .DAT file format. The .DAT file format incorporates all information about how a data file was acquired and processed into a single file. This format improves data processing and data storage efficiency. Data files can contain spectra from a single acquisition or from multiple acquisitions (for example, multiple spectral data from a Voyager acquisition or multiple injection results from a Mariner CombiSolv run). Data Explorer™ Software User’s Guide 1-5 Chapter 1 1 Data Explorer™ Basics Mariner .SPC file format In Mariner software versions earlier than version 3.0, data files are stored in .SPC format. You can view and process .SPC files in Data Explorer, or you can convert these files to .DAT format. For information about the differences between the .DAT and the .SPC formats, see the Mariner™ Workstation User’s Guide. Voyager .MS file format In Voyager software versions earlier than version 5.0, data files are stored in .MS, .MSF, .MSA, and .MSB format. You can view and process .MS, .MSF, .MSA, and .MSB files in Data Explorer. You cannot convert them to .DAT format. NOTE: Voyager .SPC format files are not supported in the Data Explorer software. Extracting information from .DAT files You can also store parameter settings in separate files by extracting information from a .DAT file as needed for use with other files. For more information, see Section 1.6.5, Extracting and Saving Information from .DAT, .RSD, and .RCD Files. The types of information stored in a .DAT file are described below. Table 1-1 Information Stored In a .DAT File Category Settings 1-6 File Type .BIC Applied Biosystems File Content Instrument settings for controlling the operation of the mass analyzer. For more information, see the: • Mariner Workstation User’s Guide • Voyager Biospectrometry Workstation User’s Guide File Formats and Types Table 1-1 Information Stored In a .DAT File (Continued) Category Settings (continued) Display Process File Type 1 File Content .MSM (Mariner only) MS Method settings, if data was acquired using an .MSM file. .SET Graphic and processing settings. See Section 1.4.2, Customizing Processing and Graphic Settings (.SET). .LBC Chromatogram label information. See Section 3.5.3, Setting Custom Peak Labels. .LBS Spectrum label information. See Section 3.5.3, Setting Custom Peak Labels. .CAL Calibration constants generated by mass calibration. For more information, see “Exporting .BIC, .MSM, and .CAL files” on page 1-36, and “Applying new constants to additional files” on page 5-16. .CTS Processed trace that you access by selecting Processing History from the Display menu. For information, see Section 2.4.7, Recalling and Rearranging Traces (Processing History). NOTE: To access the instrument settings used to acquire each spectrum in an MS Method, you must first extract the .MSM file from the data file, then export the .BIC files from the .MSM file using the Export button in the MS Method editor. For more information on exporting a .BIC file from an .MSM file, see the Mariner Workstation User’s Guide. NOTE: You select the name of the trace from the Processing History menu. You do not directly select a .CTS file. To purge or disable .CTS files, see “Setting Processing History options” on page 2-23. Data Explorer™ Software User’s Guide 1-7 Chapter 1 1 Data Explorer™ Basics Additional files types Additional file types you may see on your system are described below. Table 1-2 Additional File Types Category Data Data Procedure 1-8 File Type File Content .PKT Text file containing a chromatogram or a spectrum peak list that you can save from the Output window. See “Output window” on page 1-15. .TXT Data file exported to an ASCII text file. See Section 1.6.3, Converting to and Exporting ASCII Data. .SPC (Mariner only) Data file format for files acquired before Version 3.0 of the Mariner Instrument Control Panel. .MS (Voyager only) Data file format for files acquired before Version 5.0 of the Voyager Instrument Control Panel. .MSA and .MSF (Voyager only) PSD data file format for composite and fragment files acquired before Version 5.0 of the Voyager Instrument Control Panel. .MSB (Voyager only) Baseline-corrected data file format for composite and fragment files acquired before Version 5.0 of the Voyager Instrument Control Panel. .TUN (Mariner only) AutoTune method. See the Mariner Workstation User’s Guide. Applied Biosystems NOTE: Voyager data files in .SPC format have a file structure different from Mariner data files in .SPC format, and are not supported in the Data Explorer software. NOTE: The Data Explorer software cannot generate composite spectra from .MSF fragment files. File Formats and Types Table 1-2 Additional File Types (Continued) Category File Type 1 File Content Reference .REF List of masses to select from during calibration. See “Creating and saving a calibration reference file” on page 5-18. Process .RCT (Mariner only) Results file saved from: • Mariner .SPC format data file (versions earlier than 3.0) in the Data Explorer software after a chromatogram is manually processed. See Section 2.8, Saving, Opening, and Deleting .SPC Results Files (Mariner Data Only). • Mariner .DAT format data file (version 3.0 and later) in the Mariner Instrument Control Panel for a snapshot of chromatogram data. NOTE: Results for a .DAT file are stored within the .DAT file, not as a separate file. .RST Results file saved from: • Mariner .SPC format data file (versions earlier than 3.0) in the Data Explorer software after a spectrum is manually processed. See Section 2.8, Saving, Opening, and Deleting .SPC Results Files (Mariner Data Only). • Voyager .MS format data file in the Data Explorer software after a spectrum is manually processed. • Mariner .DAT format data file (version 3.0 and later) in the Mariner Instrument Control Panel for a snapshot of spectrum data. NOTE: Results for a .DAT file are stored within the .DAT file, not as a separate file. Data Explorer™ Software User’s Guide 1-9 Chapter 1 Data Explorer™ Basics Table 1-2 Additional File Types (Continued) 1 Category Process File Type .RCD Chromatogram results file exported from .DAT files. See Section 2.7, Exporting, Opening, and Deleting .RCD and .RSD Results Files (Mariner Data Only). .RSD Spectrum results file exported from .DAT files. See Section 2.7, Exporting, Opening, and Deleting .RCD and .RSD Results Files (Mariner Data Only). (continued) 1-10 File Content Applied Biosystems Parts of the Data Explorer Window 1.3 Parts of the Data Explorer Window 1 This section describes: • • • • • • Overview Overview Toolbar Chromatogram and Spectrum windows Tabs for data files Data file names Output window Figure 1-3 shows the Data Explorer window with Mariner data. Toolbar Chromatogram window Data file name Spectrum window Tabs for open data files Output window Figure 1-3 Parts of the Data Explorer Window Data Explorer™ Software User’s Guide 1-11 Chapter 1 Data Explorer™ Basics Toolbar 1 The toolbar contains buttons that access Data Explorer functions. For a description of a toolbar button, place the cursor on the button. A brief description of the button (ToolTip) is displayed below the button. For information on adding or removing toolbar buttons, see “Customizing toolbars” on page 1-21. Chromatogram and Spectrum windows Refer to the following tables for descriptions of the types of data that you can display in the Chromatogram (CHRO) and Spectrum (SPEC) windows: • • Mariner data—Table 1-3 Voyager data—Table 1-4 Table 1-3 Mariner Data Displayed in Chromatogram and Spectrum Windows Window CHRO Mariner Data Displays: • Total Ion Chromatogram—Includes the entire mass range saved in the data file. • Extracted Ion Chromatogram (XIC) (optional)—Includes only the signal response from a mass window or range • Constant Neutral Loss Chromatogram (CNL) (optional)—Extracts only the response from peaks that are separated by a selected mass difference. Optionally displays the following from Diode Array data (DAD): • • • Total Absorbance Chromatogram (TAC) Channel (Ch) Extracted Absorbance Chromatogram (XAC) Can be displayed as % Intensity versus Retention Time or Spectrum number by selecting Traces from the Display menu, then selecting X Axis In, then selecting Spectrum Number or Time. 1-12 Applied Biosystems Parts of the Data Explorer Window Table 1-3 Mariner Data Displayed in Chromatogram and Spectrum Windows (Continued) Window SPEC Mariner Data Displays the spectrum for the selected time in the TIC or TAC trace. By default, displays spectrum #1. The trace label includes “DAD” for spectra selected from TAC. Indicates Base Peak (BP) mass and intensity for the tallest peak in the spectrum. Displayed as % Intensity versus Mass-to-Charge (m/z). The right axis is scaled to the intensity of the base peak. Table 1-4 Voyager Data Displayed in Chromatogram and Spectrum Windows Window CHRO Voyager Data Window is not displayed by default. Optionally displays Total Ion Current (TIC) for multiple spectra .DAT files if you select Restore Chromatogram from the View menu. NOTE: DAD functions are not supported for Voyager data. SPEC Depends on the type of data file you open: • Single spectrum files—Displays the spectrum and labels the plot as spectrum #1. • Multiple spectrum files—Displays the spectrum for the selected time in the TIC trace (if displayed). By default, displays spectrum #1. • PSD files—Displays the composite spectrum and labels it as Stitched PSD. You can display segment spectra by clicking and . Indicates Base Peak (BP) mass and intensity for the tallest peak in the spectrum. Displayed as % Intensity versus Mass-to-Charge (m/z). The right axis is scaled to the intensity of the base peak. Data Explorer™ Software User’s Guide 1-13 1 Chapter 1 Data Explorer™ Basics Labels in the chromatogram or spectrum title identify the type of data displayed in the window. For a description of labels, see Section 2.4.10, Viewing Trace Labels. 1 For more information on Chromatogram and Spectrum windows, see Chapter 2, Using Chromatogram and Spectrum Windows. Context-sensitive menus Tabs for data files Data file names The commands displayed on the menus in the Data Explorer window depend on the window that is active when you select the menu: • Only Mariner-related commands are displayed on menus when you open a Mariner .DAT file. • Only Voyager-related commands are displayed on menus when you open a Voyager .DAT file. • Only spectrum-related commands are displayed if you select menus when the Spectrum window is active. • Only chromatogram-related commands are displayed if you select menus when the Chromatogram window is active. For Voyager multiple spectra .DAT files, UV functions are disabled. Chromatogram and Spectrum windows display a tab at the bottom (see Figure 1-3 on page 1-11) that allow you to switch between data files, or between Chromatogram and Spectrum windows for a Mariner data file. See “Moving Between Open Files” on page 2-8. Data file names are displayed in the: • • Title bar of each window Tab for each window NOTE: If the full name of the data file does not fit in the tab, part of the name is displayed followed by “...”. To display the full name of the data file, place the cursor on the tab. The full name of the data file is displayed below the tab. 1-14 Applied Biosystems Parts of the Data Explorer Window Output window Output window tabs The Output window (see Figure 1-3 on page 1-11) displays tabs at the bottom that you can click to switch between the types of information displayed: • Result—Displays results generated using commands on the Process, Tools, and Applications menus. For more information on results, see: • Section 5.3, Manual Calibration, or Section 5.4, Automatic Calibration • Section 5.6, Mass Deconvolution (Mariner Data Only) • Section 6.2, Using the Isotope Calculator • Section 6.3, Using the Mass Resolution Calculator • Section 6.4, Using the Signal-to-Noise Ratio Calculator • Chro Peak List —Displays results of chromatogram peak detection and integration. For more information, see Section 3.3, Peak List. • Spectrum Peak List—Displays results of spectrum peak detection, integration, and centroiding. For more information, see Section 3.3, Peak List. • Sample Info—For data files, displays the: • Software version used for acquisition • Acquisition time and sample comments entered when data was acquired For result files (.RCT, .RST, .RCD, .RSD), displays any processing functions that have been performed and saved in the result file. Data Explorer™ Software User’s Guide 1-15 1 Chapter 1 Data Explorer™ Basics 1 Displaying, clearing, and closing • Instrument Setting—Displays a list of instrument settings used to obtain the data. The settings are taken from instrument settings pages in the Instrument Control Panel. Also displays segments, event numbers, and event tags from Mariner MS Method acquisitions and LC information if LCMS was acquired using Mariner. • Elemental Analysis—Displays results for the Elemental Composition calculator. For information, see Section 6.1, Using the Elemental Composition Calculator. • Elemental Targeting—Displays results for the Elemental Targeting application. For information, see Section 6.6, Using the Elemental Targeting Application. The Output window is automatically displayed when you generate results (for example, when you calculate resolution). To display the Output window manually, select Output Window from the View menu. To clear the Output window, right-click the Output window, then select Clear Window. To close the Output window, deselect Output Window from the View menu, or right-click the Output window, then select Hide. Hint: To maximize the Chromatogram and Spectrum windows after hiding the Output window, click or in the toolbar. 1-16 Applied Biosystems Customizing the Data Explorer Window 1.4 Customizing the Data Explorer Window 1 This section includes: • • • Setting default values Customizing Graphic and Processing settings Customizing toolbars 1.4.1 Setting Default Values You can set defaults for most dialog boxes in the Data Explorer software by setting a value or selecting a button, closing the dialog box, then closing the data file you are viewing. The next time you open the dialog box, the last settings specified are displayed. 1.4.2 Customizing Processing and Graphic Settings (.SET) This section includes: • • • • • • • • Overview of processing and graphic settings What settings contain Default processing and graphic settings Default graphic settings Customizing settings saved in a data file Making a copy of default .SET files before customizing Opening, customizing, and saving .SET files Applying a .SET file Data Explorer™ Software User’s Guide 1-17 Chapter 1 1 Data Explorer™ Basics Overview of processing and graphic settings What settings contain Processing and graphic settings control how data is processed and displayed in the Data Explorer software. The last settings used are automatically saved in the data file when you close it. The next time you open the data file, you can select any of the following to apply: • Settings from the data file—Described in Section 2.1, Opening and Closing Data Files. • Default settings—Described below. • Settings from a selected set file—You can also apply processing and graphic settings that have been exported as stand-alone .SET files from other data files. See “Applying a .SET file” on page 1-20. Graphic settings include the attributes you set in Graphic Options, described in Section 1.5, Setting Graphic Options. Processing settings include: • Peak detection parameters, described in Section 3.2.4, Peak Detection Parameter Descriptions • Smoothing points, described in Section 5.7, Noise Filtering/Smoothing • Automatic calibration settings, described in Section 5.4, Automatic Calibration NOTE: You can open a .SET file in Microsoft Notepad to view the complete file contents. Default processing and graphic settings The following default settings files (stand-alone .SET files) that contain both processing and graphic settings are provided on your system in the C:\MARINER\PROGRAM\Set Files directory or the C:\VOYAGER\PROGRAM\Set Files directory: • • • • MARINER.SET VOYAGERLINEAR.SET VOYAGERREFLECTOR.SET VOYAGERPSD.SET For more information on Peak Detection settings, see Section 3.7, Default Peak Detection Settings. 1-18 Applied Biosystems Customizing the Data Explorer Window Additional .SET files that have been developed for detection of different types of data are included in the C:\VOYAGER\PROGRAM\SET FILES directory. The names of the .SET files indicate the type of data the files can be used for. The appropriate default settings for the type of data you open are automatically applied to a data file the first time you open it in Data Explorer. You can also manually apply these settings if desired. For information, see “Applying a .SET file” on page 1-20. Default graphic settings Two additional default settings files (stand-alone .SET files) that contain graphic settings only are also provided on your system in the C:\MARINER\PROGRAM directory or the C:\VOYAGER\PROGRAM directory: • • DEFAULTWHITE.SET DEFAULTBLACK.SET These .SET files contain the default graphic settings applied when you select White Background or Dark Background (after selecting Default from the Display menu). For information, see Section 1.5.1, Changing Background Color. Customizing settings saved in a data file You can customize settings saved in a data file by adjusting graphic or processing settings in the Data Explorer window. Settings are saved with a data file when you close the data file, and are automatically applied the next time you open the data file, if specified. For more information, see Section 2.1, Opening and Closing Data Files. You can also save the settings in a .SET file for use with other data files, as described in “Saving .SET files” on page 1-37. Making a copy of default .SET files before customizing All .SET files are user editable. However, before you edit the default processing/graphic .SET files (see page 1-18), make a copy of the original .SET file, in case you need to reload the settings for default peak detection. Copy the file using Windows NT® Explorer. Data Explorer™ Software User’s Guide 1-19 1 Chapter 1 1 Data Explorer™ Basics Opening, customizing, and saving .SET files To open, customize, and save .SET files: 1. If you are customizing a default .SET file, make a copy of the original file before opening it. See “Making a copy of default .SET files before customizing” on page 1-19. 2. Select Settings from the File Menu. 3. Select one of the following: • Restore Processing Settings • Restore Graphic Settings • Restore Graphic/Processing Settings 4. In the Restore dialog box, select or type the name of the .SET file, then click OK. 5. Customize processing and graphic settings as needed. For information on the contents of processing and graphic settings, see “What settings contain” on page 1-18. 6. To save settings, select Settings from the File menu, then select one of the following: • Save Processing Settings As • Save Graphic Settings As • Save Graphic/Processing Settings As 7. Applying a .SET file In the Save As dialog box, type the name of the .SET file, then click OK. You can apply a .SET file two ways: • Select Recent Processing Settings from the File menu, then select a .SET file from the list of most recently used files NOTE: When you apply a .SET file from the Recent Processing Settings menu, only the process settings are applied. • 1-20 Applied Biosystems Select an option from the Settings command on the File menu Customizing the Data Explorer Window To use the Settings option: 1. Select Settings from the File menu. 2. Select one of the following: 1 • Restore Processing Settings • Restore Graphic Settings • Restore Graphic/Processing Settings • Revert to the Last Saved Graphic/Processing Settings 3. If you select a Restore Settings option, select or type the name of the .SET file in the Restore dialog box, then click OK. Hint: You can also restore default processing and graphic settings when you open a file or files. See Section 2.1, Opening and Closing Data Files. 1.4.3 Customizing Toolbars Customizing toolbars To customize the toolbar: 1. Select Customize Toolbar from the Tools menu to display the Customize dialog box. 2. To display or hide a toolbar section, click the Toolbars tab, then select or deselect a toolbar. 3. To add a button to a toolbar, click the Commands tab, select the appropriate category, then click-drag the button to any toolbar in the main toolbar. Hint: To display a button description, click the button within the Customize dialog box. You can add buttons from any category to any toolbar. For example, you can add buttons from the File category to the Graph toolbar. Data Explorer™ Software User’s Guide 1-21 Chapter 1 Data Explorer™ Basics 4. 1 To remove a button from a toolbar, click-drag the button from the toolbar. NOTE: The Customize dialog box must be displayed to click-drag a button from a toolbar. 5. Undocking toolbars Click OK to close the Customize dialog box. The toolbar at the top of the Data Explorer window is divided into sections. A section is preceded by a double vertical bar. You can move (undock) each section of the toolbar within the Data Explorer window by click-dragging the double bar at the left side of the toolbar section. To move the toolbar section back to the top of the window, click-drag the toolbar back to the original position. You can display or hide each section individually, add or remove buttons on the toolbar, and rearrange the order of buttons displayed. To do so, you must have the Customize dialog box open, as described in the previous section. Creating toolbars 1-22 Applied Biosystems You can create new toolbars by click-dragging buttons to a window area where there is no toolbar. You can then add buttons to the new toolbar as described in “Customizing toolbars” on page 1-21. Setting Graphic Options 1.5 Setting Graphic Options 1 This section includes: • • • Changing background color Customizing options Reverting to previous graphic options NOTE: Changes you make to Graphic Options are saved with the data file. 1.5.1 Changing Background Color White or dark background You can switch background color by selecting Default from the Display menu, then selecting: • White Background—Displays blue traces and red labels by default. Default settings are contained in DEFAULTWHITE.SET. • Dark Background—Displays yellow traces and green labels by default. Default settings are contained in DEFAULTBLACK.SET. NOTE: These .SET files contain graphic settings only. They do not contain processing settings. You can customize the graphic settings associated with default settings if desired. For information, see Section 1.4.2, Customizing Processing and Graphic Settings (.SET). Data Explorer™ Software User’s Guide 1-23 Chapter 1 1 Data Explorer™ Basics 1.5.2 Customizing Graphic Options This section includes: • • • • • • Accessing graphic options 1-24 Applied Biosystems Accessing graphic options Setting colors Setting line widths Setting data cursors Setting traces in line or bar mode Setting graphic compression To access graphic options: 1. Display the trace of interest. 2. From the Display menu, select Graphic Options. 3. To use the graphic options settings for all traces, click Use same settings for all traces in the View Setup tab. 4. Click a Graph Setup tab in the Graph and Plot Options dialog box (Figure 1-4). 5. Set colors, line widths, data cursors, and graphic compression as described in the following sections. 6. Click OK. Setting Graphic Options 1 Line or vertical bar traces Peak bounds Line width Data cursor Graphic compression Figure 1-4 Graphic Options Dialog Box— Graph Setup Tab Setting colors Manually You can set colors manually or automatically. To manually select the color of graph features (axis, peak bounds, tick labels, data cursor) and plot features (traces, peak labels): 1. Select Graphic Options from the Display menu. 2. Set colors in the Graph Setup tab (see Figure 1-4). Data Explorer™ Software User’s Guide 1-25 Chapter 1 Data Explorer™ Basics When you manually set colors, note: 1 • Selections set to white (or line widths set to 0) may not print on certain printers. • If you select different trace colors for multiple traces, only the color for the active trace is saved when you close the data file. Automatically using Auto Color Automatically assigning trace colors is useful when overlaying traces. To automatically assign trace colors: 1. Select Graphic Options from the Display menu. 2. Select Auto Color in the View Setup tab. The software assigns and displays trace colors when the traces are overlaid. When you use Auto Color: • The active trace color stays at its original setting. • Other trace colors are set based on the active trace color. For example, if the active trace is yellow, other traces are assigned the colors pale blue, pale green, and medium gray, which are the colors listed after yellow in the Trace color list, excluding white. NOTE: White is not used in Auto Color because white may not print on certain printers. Setting line widths You can control trace appearance by setting line widths. To set line widths: 1. Select Graphic Options from the Display menu. 2. Set line width in the Plot Setup section of the Graph Setup tab (see Figure 1-4 on page 1-25). NOTE: Line Widths of 0 or 1 (or lines set to the color white) may not print on certain printers. If traces do not print, change the line width (or color). 1-26 Applied Biosystems Setting Graphic Options Setting data cursors To enable data cursors and set cursor labels and attributes: 1 1. Select Graphic Options from the Display menu. 2. In the Data Cursor section of the Graph Setup tab (see Figure 1-4 on page 1-25), select Show Data Cursors, then select one of the following cursors from the Type drop-down list: • • • • • X—Single vertical cursor Y—Single horizontal cursor X-Y—Vertical and horizontal cursors X-X—Two vertical cursors X-Y-X—Two vertical cursors and one horizontal cursor NOTE: If data cursors are displayed, they are printed when you print traces. To suppress data cursor printing, deselect Show Data Cursors before printing. To set the cursor mode, select the appropriate label type as described below: Label Type Y Label X-X Label Options • Absolute—Displays the number of counts. • BP Relative—Displays the % Intensity value relative to the base peak in the trace. Includes “BP%” marker on the cursor label. • Display Relative—Displays the % Intensity value relative to the largest peak in the current display range. • Absolute—Displays the Spectrum Number or Retention Time (chromatogram) or the Mass (spectrum). • X-Relative—Available if you have two X cursors displayed. For the first cursor, displays the Spectrum Number or Retention Time (chromatogram) or the Mass (spectrum). For the second cursor, displays the appropriate value relative to the first cursor. For example, if you place the first X cursor in a spectrum at 100 m/z and the second X cursor at 80 m/z, the cursors are labeled 100 and –20. Data Explorer™ Software User’s Guide 1-27 Chapter 1 1 Data Explorer™ Basics Setting traces in Line or Vertical Bar mode Setting graphic compression You can change the trace display from Line to Vertical Bars. Each vertical bar represents one data point. Vertical bar mode is useful when setting peak detection parameters to determine the number of points across a peak. NOTE: Graphic Compression mode is not saved as part of graphic settings. When you close a data file, it is automatically reset to the default Local Max setting. By default, all data is compressed when it is displayed on your computer screen. The degree of compression is determined by the number of data points in the data file and the resolution setting of your computer monitor. For example, assume that a data file contains 10,000 data points and needs compression to 1,000 data points to fit on your computer screen. Every 10 data points will be compressed into a single data point. To set graphic compression settings: 1. Select Graphic Options from the Display menu. 2. In the Graph Setup tab of the Graph and Plot Options dialog box (see Figure 1-4 on page 1-25), select a Graphic Compression mode: • Local Max (default)—Uses the maximum data point within the range of data points being compressed (range of 10 in the example above). • Average—Uses the average of the data points within the range of data points being compressed (range of 10 in the example above). • Sum (Binning)—Uses the sum of the data points within the range of data points being compressed (range of 10 in the example above). NOTE: Changing the graphic compression mode may alter the displayed intensities of peaks in a trace. 1-28 Applied Biosystems Setting Graphic Options 1.5.3 Reverting to Previous Graphic Options You have two options to revert to previously used graphic options: • Revert to Last Saved Graphic Setting—Reverts to the last graphic settings saved in the data file. Does not affect processing settings. To access, select Default from the Display menu, then select Revert to Last Saved Graphic Setting. • Revert to Last Saved Graphic/Processing Settings—Reverts to the last graphic and processing settings saved in the data file. To access, select Settings from the File menu, then select Revert to Last Saved Graphic/Processing Settings. Hint: Instead of applying the settings saved with a data file, you can apply the default settings stored in the default .SET file for your system (see page 1-18). To apply the default settings, close the data file, open the data file again, then select Use Default Settings in the Open dialog box. For more information, see Section 2.1, Opening and Closing Data Files. Data Explorer™ Software User’s Guide 1-29 1 Chapter 1 Data Explorer™ Basics 1 1.6 Managing Files This section describes: • Converting .SPC file format to .DAT file format (Mariner only) • Converting data from profile to centroid (Mariner only) • Converting to and exporting ASCII data • Importing a trace in ASCII format • Extracting and saving information from .DAT, .RSD, and .RCD files • Copying from data files 1.6.1 Converting .SPC File Format to .DAT File Format (Mariner Data Only) This section includes: • • • • • When to convert Before you begin Converting Viewing file properties Searching file properties NOTE: You cannot convert Voyager .MS files to .DAT format. When to convert 1-30 Applied Biosystems You are not required to convert Mariner .SPC file format (for data acquired in software versions earlier than 3.0) to .DAT file format. However, the .DAT format allows you to store all information associated with the file (such as data, results, settings) in one file, simplifying file management. Managing Files Before you begin Confirm that the .SPC and .CGM files are located in the same directory. Use Windows NT® Explorer to display the directory contents and to move the .SPC and .CGM files as necessary. If the .SPC and .CGM files are not in the same directory, when you open the .SPC file, a “Failed to open chromatogram data” message is displayed. To check that the .SPC and .CGM files are in the same directory: 1. Select Open from the File menu. The Open dialog box is displayed. 2. From the Files of type drop-down list, select All Files (*.*). A list of all files contained in the directory is displayed. 3. Converting Check that the .SPC and .CGM files are present. In the Data Explorer window: 1. Open or click the .SPC file to convert. 2. Select Convert from the File menu. 3. Select New Data Format. The Convert to .DAT Format dialog box is displayed (Figure 1-5). Figure 1-5 Convert to .DAT Format Dialog Box 4. To add file property information (for example, Title, Author, or Keywords) to the file, click Set Property, enter the appropriate information, then click OK. For more information, see “Viewing file properties” on page 1-32. Data Explorer™ Software User’s Guide 1-31 1 Chapter 1 Data Explorer™ Basics The Convert to .DAT Format dialog box reappears. 1 5. Click OK. A message box is displayed, showing the file name of the newly created .DAT file. 6. Viewing file properties Close the .SPC file and open the .DAT file before processing. If desired, manually delete the .SPC file and associated files. File properties are accessible in Windows NT Explorer and provide general information about a data file without opening the file in the Data Explorer software. To view file properties: 1. In Data Explorer, close the file of interest. 2. In Windows NT Explorer, select the file, then right-click. 3. Select Properties from the menu. 4. Click the Summary tab. NOTE: If the Summary tab is not available, the file may be open in Data Explorer. Close the file and repeat the steps above. Searching file properties To search for a file based on file properties: 1. In Windows NT Explorer, select Find from the Tools menu, then select Files or Folders. The Find: All Files dialog box is displayed. 1-32 Applied Biosystems 2. In the Name & Location tab, type or select a directory in the Look in text box. 3. Select the Advanced tab. 4. Select Data Explore Document from the Of type drop-down list. 5. Type the information you are searching for (for example, a title or keyword) in the Containing text box, then click Find Now. Managing Files 1.6.2 Converting Data from Profile to Centroid (Mariner Data Only) Overview You can convert an entire data file from profile to centroid format. Centroid format files are smaller than profile format files. NOTE: Profile data is not automatically deleted when you convert to centroid data. You can delete the profile data file using Windows NT Explorer. Before you begin Converting to centroid If the file to convert is in .SPC format, confirm that the .SPC and .CGM files are located in the same directory. For information see “Before you begin” on page 1-31. If the .SPC and .CGM files are not in the same directory, when you open the.SPC file, a “Failed to open chromatogram data” message is displayed. To convert from profile to centroid format: 1. Open or activate the .DAT or .SPC file to convert. 2. Select Convert from the File menu, then select Centroid. The Save As dialog box is displayed. The software appends a “-CT” suffix to the file name. This is the default file name. You can enter a new file name for the centroid file. 3. Click Save. NOTE: The m/z range in a data file that is converted from profile to centroid is determined by the peak detection range set in Data Explorer, not the m/z range in the original data file. For more information, see Section 3.2, Peak Detection. Data Explorer™ Software User’s Guide 1-33 1 Chapter 1 1 Data Explorer™ Basics 1.6.3 Converting to and Exporting ASCII Data This section describes: • • Converting a data file to ASCII format Converting a data file to ASCII format Exporting a trace to ASCII format You can convert a data file for use in a spreadsheet or another application and export and import single traces in ASCII format. To convert an entire active data file to an ASCII text file: 1. Open the data file to convert. 2. From the File menu, select Convert, then select ASCII text. A Save As dialog box is displayed. Exporting a trace to ASCII format 3. Specify the name and destination for the file to be exported. By default, the software assigns a .TXT extension to the file. 4. Click OK. You can export a selected trace to ASCII format for display in Data Explorer software or for use in another application. To export trace data to ASCII format: 1. With a data file open, select the trace window. 2. From the File menu, select Export, then select Chromatogram or Spectrum (the menu item is context sensitive). A Save As dialog box is displayed. 1-34 Applied Biosystems 3. Specify the name and destination of the file to be exported. By default, the software assigns a .TXT extension to the file. 4. Click OK. Managing Files 1.6.4 Importing a Trace in ASCII Format 1 You can import trace data in ASCII format. If the file you are importing was originally exported using the Data Explorer software, you can import a spectrum trace only into the Spectrum window and a chromatogram trace only into the Chromatogram window. However, if the data is from another source, the software does not know the data type and you must make sure to import the data into the correct window type. Importing a Trace in ASCII Format To import an ASCII trace: 1. Open a data file and activate a Chromatogram or Spectrum window. NOTE: You must open a data file before you can import ASCII data, even if the data file is unrelated to the imported data. 2. Select Add/Remove Traces from the File menu, then set the Replace Mode by selecting one of the following: • Replace the Active Trace • Add a New Trace 3. From the File menu, select Import, then select ASCII Chromatogram or ASCII Spectrum (the menu item is context sensitive to the selected window). An Open dialog box appears. 4. Select the ASCII file to import. 5. Click OK. The imported trace is displayed in the active window. Data Explorer™ Software User’s Guide 1-35 Chapter 1 Data Explorer™ Basics 1 CAUTION An imported ASCII format trace contains only the data points for the trace. The Sample Info and Instrument settings tabs in the Output window display data from the data file you opened in step 1. These tabs do not include information about the imported trace. 1.6.5 Extracting and Saving Information from .DAT, .RSD, and .RCD Files Overview You can extract the following information from a .DAT data file, .RSD spectrum results file, and .RCD chromatogram results file, then save the information as a stand-alone file for use with other files: • • • • • • Exporting .BIC, .MSM, and .CAL files Instrument settings (.BIC) MS Method (.MSM) (Mariner data only) Calibration constants (.CAL) Processing/graphic settings (.SET) Spectrum or chromatogram peak labels (.LBS or .LBC) ASCII Spectrum and ASCII Chromatogram (.TXT) To export Instrument settings (.BIC), MS Method settings (.MSM), or calibration constants (.CAL) from a .DAT or results file: 1. Open or activate the data (.DAT) or results (.RSD or .RCD) file. 2. From the File menu, select Export, then select: • Calibration—To export the last applied calibration constants in a .CAL file. 1-36 Applied Biosystems Managing Files NOTE: To export calibration constants used to acquire the data, select Mass Calibration from the Process menu, then select the Revert to Instrument Calibration before exporting. For more information, see Section 5.3.4, Reverting to Instrument Calibration. • Configuration—To export .BIC or .MSM files (.MSM—Mariner data only). NOTE: To access the instrument settings for each spectrum in a data file acquired using a Mariner MS Method, you must first extract the .MSM file from the data file as described above. Then export the .BIC files from the .MSM file using the Export button in the MS Method editor. For more information on exporting a .BIC file from .MSM, see the Mariner Workstation User’s Guide. 3. Saving .SET files In the Save As dialog box, type a name for the exported file, then click Save. To save processing and graphic settings (.SET) from a .DAT or results file: 1. Open or activate the .DAT, .RSD or .RCD file. 2. From the File menu, select Settings, then select one of the following: • Save Processing Settings As • Save Graphic Settings As • Save Graphic/Processing Settings As 3. In the Save As dialog box, type a name for the .SET file, then click OK. For information, see Section 1.4.2, Customizing Processing and Graphic Settings (.SET). Data Explorer™ Software User’s Guide 1-37 1 Chapter 1 Data Explorer™ Basics Saving .LBS and .LBC files 1 To save spectrum (.LBS) or chromatogram (.LBC) peak label files from a .DAT, .RSD, or .RSC file, see Section 3.5.3, Setting Custom Peak Labels. 1.6.6 Copying from Data Files Overview Copy trace image 1-38 Applied Biosystems You can copy the following types of data from data and result files to the Windows clipboard: • Trace Image—Copies the graphic image of the trace in the active window. • Trace Data—Copies the raw data for the trace displayed in the active window. You can also use this command by right-clicking, then selecting Copy Trace Data. For more information, see Section 2.5.2, Copying Traces from Multiple Data Files to a Window. • Displayed Peaks—Copies peak list entries for the peaks displayed in the active window. • All Peaks—Copies peak list entries for all peaks in the active view. • Mass List—Copies all centroid or apex masses from the peak list for the active Spectrum window. To copy the trace as it is displayed in the active window to the Windows clipboard: 1. Select the trace window to copy. Zoom and adjust the trace as needed. 2. From the Edit menu, select Copy, then select Trace Image. 3. Paste the image into an application that handles Windows Metafile format images, for example Microsoft PowerPoint®. Managing Files NOTE: If you paste the image into an application that does not handle Windows Metafile format images, for example Microsoft Paint, images are distorted. Copy trace data To copy raw data (x,y pairs) for the peaks displayed in the active trace to the Windows clipboard: 1. Select the trace window to copy. Zoom and adjust the trace as needed. NOTE: Only raw data for the set of peaks displayed in the trace window is copied. 2. From the Edit menu, select Copy, then select Trace Data. 3. Paste the data into an appropriate application, for example, another Data Explorer trace window or Microsoft Excel. When pasted into a Data Explorer trace window, the trace appears with the filename in parentheses and the trace label from the copied trace. CAUTION A trace pasted into an active Data Explorer window contains only the data points for the trace. The Sample Info and Instrument settings tabs display data from the original data file. These tabs do not include information about the copied trace. Copy displayed peaks Use this method to copy the section of the peak list pertaining to the peaks displayed in the active trace window. To copy the peak list for all peaks in the active trace, see “Copy all peaks” on page 1-40. Data Explorer™ Software User’s Guide 1-39 1 Chapter 1 Data Explorer™ Basics 1 NOTE: Copy Displayed Peaks copies all fields and headings. However, some data applications may not work correctly if headings are present because the first row contains text and not data. For information on copying the peaks list without headings, see Section 3.3.3, Saving the Peak List. To copy the peak list for the displayed peaks to the Windows clipboard: 1. Set peak detection as needed to create a peak list. See Section 3.2, Peak Detection. 2. Select the trace window to copy. Zoom and adjust the trace as needed. NOTE: Only peak list information for the set of peaks displayed in the trace window is copied. Copy all peaks 3. From the Edit menu, select Copy, then select Displayed Peaks. 4. Paste the data into an appropriate application, for example Microsoft Excel. Use this method to copy the peak list for all peaks in the active trace. To copy only the section of the peak list pertaining to the peaks displayed in the active trace window, see “Copy displayed peaks” on page 1-39. NOTE: Copy All Peaks copies all fields and headings. However, some data applications may not work correctly if headings are present because the first row contains text and not data. For information on copying the peaks list without headings, see Section 3.3.3, Saving the Peak List. To copy the peak list for all peaks in the active trace to the Windows clipboard: 1. 1-40 Applied Biosystems Set peak detection as needed to create a peak list. See Section 3.2, Peak Detection. Managing Files Copy mass list 2. Select the trace window to copy. 3. Display the peak list by selecting Output Window from the Display menu, then clicking the Chro Peak List or Spec Peak List tab. 4. Sort the peak list as needed. See “Sorting the peak list” on page 3-42. 5. From the Edit menu, select Copy, then select All Peaks. 6. Paste the data into an appropriate application, for example, Microsoft Excel. This function copies only the masses for the spectrum and is useful for pasting data directly into spreadsheets or other applications without having to delete header information. To copy all centroid or apex mass data from the spectrum peak list to the clipboard: 1. Select the Spectrum window to copy from. 2. Select Peak Label from the Peaks menu. 3. Specify the Mass Type by selecting Apex or Centroid. For more information, see Section 3.5.2, Setting Chromatogram and Spectrum Peak Labels. 4. Click OK. 5. From the Edit menu, select Copy, then select Mass List. Hint: If you activate the Spec Peak List tab, you can copy the mass list by right-clicking, then selecting Copy Mass List from the popup menu. The mass list is copied to the clipboard with a header indicating Apex Mass or Centroid Mass. 6. Paste the data into an appropriate application, for example, Microsoft Excel. Data Explorer™ Software User’s Guide 1-41 1 Chapter 1 Data Explorer™ Basics 1 1-42 Applied Biosystems Chapter 2 Using Chromatogram and Spectrum Windows 2 This chapter contains the following sections: 2.1 Opening and Closing Data Files ......................................... 2-2 2.2 Adjusting the Display Range ............................................ 2-11 2.3 Organizing Windows ........................................................ 2-13 2.4 Manipulating Traces ......................................................... 2-14 2.5 Working with Multiple Data Files ...................................... 2-36 2.6 Saving, Opening, and Deleting .DAT Results ................... 2-38 2.7 Exporting, Opening, and Deleting .RCD and .RSD Results Files (Mariner Data Only) .................... 2-39 2.8 Saving, Opening, and Deleting .SPC Results Files (Mariner Data Only) ......................................................... 2-40 Data Explorer™ Software User’s Guide 2-1 Chapter 2 Using Chromatogram and Spectrum Windows 2.1 Opening and Closing Data Files This section includes: • • • • • • 2 Opening data files Displaying Mariner UV traces Displaying Voyager chromatograms Viewing read-only files Moving between open files Closing data files 2.1.1 Opening Data Files This section includes: • • • Opening a recently opened file Opening a recently opened file Opening data files with File Open Automatically running macros The File menu lists the last several opened files (up to a maximum of nine). To quickly open one of these files, select it from the list. NOTE: If you access Data Explorer software from the Voyager Instrument Control Panel, the most recently saved Voyager data file is displayed in the Data Explorer window. This data file and other recently acquired data files are listed in the Data Explorer File menu the next time you open Data Explorer. Opening data files with File Open You can open up to eight data files using the File Open dialog box: 1. Select Open from the File menu. The Select Files dialog box (Figure 2-1) appears. 2-2 Applied Biosystems Opening and Closing Data Files . 2 Figure 2-1 Select Files Dialog Box 2. Click the down arrow to display the Files of type list, then select the file extension to display. 3. Select up to eight data files to open, then click Add or Add All. Add All is not active if the number of selected files exceeds eight. NOTE: You can also select files by double-clicking the file name in the file list. The files are listed in the Files Selected box. Displaying acquisition comment 4. To display acquisition comments before opening the data file, right-click a file name in the top pane of the dialog box, select Properties, then click the Summary tab. Data Explorer™ Software User’s Guide 2-3 Chapter 2 Using Chromatogram and Spectrum Windows Specifying settings 5. Select a Restoring Graphics and Processing Settings option to apply to new files you are opening (settings are not applied to files in the list that are already open): • Use Settings from Data File—Applies the last settings used on the data. • Use Default Settings—Applies settings from the appropriate default .SET file for your system. See “Default processing and graphic settings” on page 1-18. 2 • Use Selected Set File—Opens the Restore Graphics and Processing Settings dialog box, where you select the .SET file to open. For information on customizing a .SET file, see Section 1.4.2, Customizing Processing and Graphic Settings (.SET). 6. Click Finish to open the selected files. The Data Explorer window displays the selected data files with the processing and graphic settings you selected (Figure 2-2 and Figure 2-3). 2-4 Applied Biosystems Opening and Closing Data Files 2 Figure 2-2 Data Explorer Window with Four Mariner Data Files Open (Each .DAT File Displays a Chromatogram and a Spectrum Trace) Figure 2-3 Data Explorer Window with Four Voyager Data Files Open (Spectrum Traces Only Displayed by Default) Data Explorer™ Software User’s Guide 2-5 Chapter 2 Using Chromatogram and Spectrum Windows The data is labeled accordingly: Type of Data Mariner data Spectrum Trace Labels If you open a data file you previously calibrated in Data Explorer, all spectra in the data file are calibrated and displayed with an MC or AC trace label. If AutoSaturation Correction is turned on, all spectra in the data file are corrected and displayed with an ASC trace label. For more information, see Section 5.11, AutoSaturation Correction (Mariner Data Only). 2 Voyager data If you open a data file you previously calibrated in Data Explorer, the spectrum is calibrated and displayed with an MC trace label. For multispectrum data files, you can display chromatograms. For more information, see Section 2.1.3, Displaying Voyager Chromatograms. Automatically running macros You can set macros to automatically run when you open or close files. For information, see “Running Macros Automatically When Opening and Closing Files” on page 6-45. 2.1.2 Displaying Mariner DAD Traces When you use a diode array detector (DAD) to acquire Mariner data, you can display the following types of DAD traces: • DAD chromatogram—With the Chromatogram window active, select Traces from the Display menu, then select DAD TAC or DAD Channel. • DAD spectrum—Double click a DAD chromatogram. For more information, see “Types of Mariner data” on page 4-2 and “Creating an Extracted Absorbance Chromatogram (XAC) (Mariner Data Only)” on page 4-13. 2-6 Applied Biosystems Opening and Closing Data Files 2.1.3 Displaying Voyager Chromatograms To display chromatograms for multispectrum Voyager .DAT files: 1. Open the .DAT files as described in “Opening Data Files” on page 2-2. Spectrum traces for the .DAT files are displayed. 2. To display a Chromatogram window, click a Spectrum window to activate it, then select Restore Chromatogram from the View menu. 2 A Chromatogram window is displayed for the data file. NOTE: Diode array support and UV display are disabled for Voyager chromatogram traces. 2.1.4 Viewing Read-Only Files For quick scanning of archived data files, you can view read-only files using the File Open dialog box. When you open a read-only file, a message indicates that the file is read-only and prompts you to open the file. All functions that write information to disk are disabled when you view a read-only file. CAUTION Although you can process read-only files, you cannot save any changes you make. When you close a read-only file any changes you made are lost. Data Explorer™ Software User’s Guide 2-7 Chapter 2 Using Chromatogram and Spectrum Windows 2.1.5 Moving Between Open Files You can have more than one file open at a time. You can move between open files in three ways: • • • Using tabs 2 Select the open file to view from the Window menu Use tabs Use the Activate File dialog box To move between open files using tabs, click the tab at the bottom of the Data Explorer window (Figure 2-4) to activate the file. Click a tab to select an open data file Double-click an active title bar to maximize a window Figure 2-4 Tabs for Open Data Files If the window for the tab you click is already open, clicking the tab activates the window. If the window for the tab you click is minimized, clicking the tab activates the title bar for the window. Double-click the active title bar to display the window. Using Activate File 2-8 Applied Biosystems To move between Spectrum windows of open data files using Activate File: 1. Select Activate File from the Windows menu. 2. Select a file from the Current Data File list. Opening and Closing Data Files 2 Figure 2-5 Select File to Activate Dialog Box 3. Select: • Maximize—To maximize the Spectrum window of the selected file • Activate—To activate the Spectrum window of the selected file Data Explorer™ Software User’s Guide 2-9 Chapter 2 Using Chromatogram and Spectrum Windows 2.1.6 Closing Data Files You can close files in the following ways: • Select Close from the File menu to close the active file. • Select Close All Files from the File menu to close all files. • In the Open File dialog box, select any open files from the Files Selected list, click Remove, then click Finish to close the selected files. • Select Exit from the File menu to close all files and exit the software. 2 If you enabled Processing History and selected the Show Save History option, a dialog box is displayed. Click Save or Purge. For more information, see “Setting Processing History options” on page 2-23. 2-10 Applied Biosystems Adjusting the Display Range 2.2 Adjusting the Display Range To set the display range: 1. Click the Chromatogram or Spectrum window to activate it. 2. From the Display menu, select Range. 3. Select X Range to set the x-axis range. The scaling units depend on the window you are scaling: • Chromatogram—Scales in the same units currently displayed in the Chromatogram window (Spectrum Number or Time [Mariner data only]) • Spectrum—Scales in m/z units 4. Select Y Range to scale the y-axis range. The Y Axis Setup dialog box (Figure 2-6) is displayed. Figure 2-6 Y Axis Setup Dialog Box Data Explorer™ Software User’s Guide 2-11 2 Chapter 2 Using Chromatogram and Spectrum Windows 5. Set the parameters described below as needed: Parameter Description Scaling Mode 2 Display Relative Autoscales the trace to the largest peak in the selected range. Base Peak Relative Autoscales the trace to the base peak in the entire range, not the selected range. Displays a right-axis label with the base peak intensity. NOTE: To turn off the right axis, select Graphic Options from the Display menu, click the Graph #1 Setup tab, then deselect the Show Right Y-Axis check box. Absolute Value Sets the trace to the Y Display Range you enter in the Y Display Range From/To boxes. Display Min/Max Sets the trace display to the minimum and maximum Y values. Minimum Absolute Max Y Use Limit Sets the minimum value for Y-axis scaling. Useful to maintain relative scaling of peaks and to prevent autoscaling noise to full scale. Y Display Range From/To Sets the range for scaling. If Display Relative or Base Peak Relative is selected, range is in percent. If Absolute Value is selected, range is in counts. 6. 2-12 Applied Biosystems Click OK. Organizing Windows 2.3 Organizing Windows Linking views Linking Chromatogram or Spectrum windows in different data files allows you to zoom on multiple data files. NOTE: When different data files are linked, zooming functions performed on one data file are applied to all linked files. Processing and peak centering functions are applied to the active file only. To link data files: 1. Open the data files you want to link. 2. In the first data file, click the window (Chromatogram or Spectrum) that you want to link to another data file, then select Link View from the View menu. NOTE: Clicking views. in the toolbar links traces, not 3. Repeat step 2 if you want to link both windows. 4. Repeat step 2 and step 3 for the remaining data files. NOTE: You must select Link View for each window and each data file you want to link. Organizing windows You can organize all open windows by clicking buttons in the toolbar: • Tile Horizontal • Tile Vertical • Cascade Windows You can also move and resize windows by click-dragging. Data Explorer™ Software User’s Guide 2-13 2 Chapter 2 Using Chromatogram and Spectrum Windows 2.4 Manipulating Traces This section includes: • • • • • • • • • • • 2 Zooming centering, and customizing a trace Duplicating a trace Dividing the active trace Adding traces from the same data file to a window Removing traces Expanding and linking traces Recalling and rearranging traces (Processing History) Overlaying traces Annotating traces Viewing trace labels Printing traces 2.4.1 Zooming, Centering, and Customizing a Trace Zooming and unzooming You can expand (zoom) an area of a trace by click-dragging a box around the area of interest. You can also click buttons in the toolbar to: • Zoom in NOTE: Display data cursors, then click the point you want to zoom on before clicking this button. See “Setting data cursors” on page 1-27. 2-14 Applied Biosystems • Zoom out to the previous zoom • Full Unzoom Manipulating Traces Centering a peak in the trace To center a peak in the trace window: 1. Display the trace containing the peak of interest. 2. Click the Spec Peak List or Chro Peak List tab in the Output window. 3. Double-click the peak to center. The peak is centered in the active trace. Customizing a trace See Section 1.5, Setting Graphic Options, for information on customizing trace parameters such as line widths and data compression. 2.4.2 Duplicating a Trace To make a duplicate of a trace: 1. Click the trace. 2. From the Display menu, select Duplicate Active Trace. The active trace is duplicated and displayed in another trace position. 2.4.3 Dividing the Active Trace You can divide the active trace into equal segments with one command. This is useful to expand the x-axis range to better see spectral and chromatographic features. To divide a trace: 1. Click the trace. 2. From the Display menu, select Divide Active Trace, then select the number of segments to divide the trace into. The active trace is automatically split into the selected number of traces, with the range evenly divided among the traces. Data Explorer™ Software User’s Guide 2-15 2 Chapter 2 Using Chromatogram and Spectrum Windows For example, if you select Divide Active Trace to Four when the active trace has a range of 0.0 to 20.0, the active trace is divided into four traces: • • • • 2 First trace represents the range from 0 to 5 Second trace represents the range from 4 to 10 Third trace represents the range from 9 to 16 Fourth trace represents the range from 15 to 20 NOTE: To restore the display to a single trace, select Remove Inactive Traces from the Display menu. 2.4.4 Adding Traces from the Same Data File to a Window This section describes: • • • Overview Overview Setting the Replace mode Adding a trace By default, the Data Explorer software displays: Data Type Window Mariner Chromatogram and Spectrum. Voyager single spectrum Spectrum only. Voyager multispectrum Spectrum only. Can also optionally display chromatogram. Chromatogram and Spectrum windows each contain one trace (see Figure 1-3 on page 1-11). 2-16 Applied Biosystems Manipulating Traces When you perform certain functions (for example, smoothing), a new trace is created. You can set the Replace mode to add to or replace the active trace. You can add up to seven new traces to a window to allow you to keep original data displayed when you generate new traces. Setting the Replace mode To set the Replace mode: 1. From the Display menu, select Add/Remove Traces. The Display Trace dialog box is displayed (Figure 2-7). Figure 2-7 Display Trace Dialog Box Data Explorer™ Software User’s Guide 2-17 2 Chapter 2 Using Chromatogram and Spectrum Windows 2. Select the Replace Mode: • Replace the Active Trace (default)—Replaces the active trace with the newly created trace. • Add a New Trace—Adds the newly created trace to the window. The original trace remains displayed and accessible, allowing visual comparison of the traces. 2 NOTE: If Replace Mode is set to Add a New Trace and eight traces are present when you perform a function, the active trace is replaced when a new trace is generated. Hint: A toolbar button is available for switching between Replace and Add mode. See “Customizing toolbars” on page 1-21 for information. The button is located in the Graph category. Adding a trace 3. If desired, you can also add traces by selecting the trace to add from the Select Traces to Display section. 4. Click OK. To add a new trace to a window: 1. Click the Chromatogram or Spectrum window. 2. Click in the toolbar. NOTE: You can also add traces by selecting Add/ Remove Traces from the Display menu. The software adds a trace to the window. You can add up to seven traces (Figure 2-8). Hint: Resize the window to view all added traces. 2-18 Applied Biosystems Manipulating Traces Original trace 2 Added traces Figure 2-8 Adding Traces (Four Traces Shown, up to Four More Can Be Added) When you perform a function that adds a new trace, the label of the trace changes from Not Used to the label for the type of trace created (Figure 2-9). Data Explorer™ Software User’s Guide 2-19 Chapter 2 Using Chromatogram and Spectrum Windows Figure 2-9 shows the original trace and three added traces that now contain a smoothed spectrum (SM), a centroided spectrum (CT), and a baseline offset spectrum (BO). Original trace 2 Added traces Figure 2-9 Added Traces Containing Data For a description of trace labels, see “Viewing Trace Labels” on page 2-30. 2-20 Applied Biosystems Manipulating Traces 2.4.5 Removing Traces Removing the active trace To remove the active trace from a window: 1. Click the trace to remove. 2. Click in the toolbar, or right-click the trace, then select Remove Trace from the menu. The trace is removed. Removing inactive traces 2 To quickly remove all inactive traces from the window: 1. Click the trace to keep displayed to make it the active trace. 2. Select Remove Inactive Traces from the Display menu. 2.4.6 Expanding and Linking Traces When you have more than one trace displayed in a window, you can: • Expand traces—Click a trace, then click in the toolbar to expand the selected trace for closer examination. To display all traces, click • Link traces—Click again. in the toolbar to link all traces. Any zooming actions you perform on one trace affect all traces in that window. To unlink traces, click again. Data Explorer™ Software User’s Guide 2-21 Chapter 2 Using Chromatogram and Spectrum Windows 2.4.7 Recalling and Rearranging Traces (Processing History) Overview The Chromatogram and Spectrum windows can display up to 8 traces at a time for a data file. However, up to 16 traces are held in memory. You can recall traces previously displayed for an open data file, or rearrange the order of traces, using the Processing History command. You can also set Processing History Options to automatically delete history or to disable the function completely. 2 Recalling or rearranging To recall or rearrange previously displayed traces: 1. Click the trace position in which you want to recall or rearrange a trace. 2. From the Display menu, select Processing History. A submenu is displayed, listing the last 16 processed traces viewed in the window. NOTE: Unprocessed traces and theoretical traces generated using commands on the Applications menu are not listed. 3. Select the trace to display. The selected trace is displayed in the active trace position. Removing traces from the history list 2-22 Applied Biosystems To remove traces from the Processing History list: 1. From the Display menu, select Processing History. 2. Select Remove History. 3. Select the traces to remove from the list, then click OK. Manipulating Traces Setting Processing History options To set Processing History options: 1. From the Tools menu, select Processing History Options. The Processing History Options dialog box (Figure 2-10) is displayed. 2 Figure 2-10 Processing History Options Dialog Box 2. Turn Processing History on or off. If you turn on, specify: • Purge processing history—Records all processing functions performed. Stores the history log in a .CTS file and purges the history log when you close the data file. Purging a history file does not affect the data contained in the data file. It clears the contents of the .CTS file that contains the processing history. • Save processing history—Records all processing functions performed. Stores the history log in a .CTS file and maintains the history log when you close the data file. If you save processing history, .CTS files can become very large. You can periodically delete older .CTS files to clear disk space. 3. If you want a reminder dialog box to appear when you close a data file that prompts you to selectively save or purge the history file, select Show Save History dialog. 4. Click OK. Data Explorer™ Software User’s Guide 2-23 Chapter 2 Using Chromatogram and Spectrum Windows 2.4.8 Overlaying Traces This section includes: • • • • • 2 Overlaying traces from different data files Overlaying traces from different data files Overlaying traces in a single data file Changing the active trace Sequentially activating overlaid spectra Setting overlay attributes To overlay traces from different data files: 1. Copy chromatogram or spectrum traces you want to overlay into a trace window. For more information, see Section 2.5.2, Copying Traces from Multiple Data Files to a Window. Hint: The copied traces display the original trace label and filename. 2. To use settings other than defaults, set attributes for the overlay if needed. See “Setting overlay attributes” on page 2-26. 3. Click the trace of interest to activate it. NOTE: Only the active trace in an overlay is affected by processing tools. However, all traces are affected by zooming functions. 4. From the Display menu, select Overlay Traces. Hint: A toolbar button is available to toggle between Overlay and Undo Overlay mode. See “Customizing toolbars” on page 1-21 for information. The button is located in the Graph category. The traces are overlaid. The trace names are listed in the trace label. 2-24 Applied Biosystems Manipulating Traces NOTE: When saving results, only the results for the active trace are saved. Overlaying traces in a single data file To overlay traces in a single data file: 1. Display the chromatogram or spectrum traces you want to overlay. For more information, see Section 2.4.4, Adding Traces from the Same Data File to a Window 2. To use settings other than defaults, set attributes for the overlay if needed. See “Setting overlay attributes” on page 2-26. 3. Click the trace of interest to activate it. NOTE: Only the active trace in an overlay is affected by processing tools. However, all traces are affected by zooming functions. 4. From the Display menu, select Overlay Traces. Hint: A toolbar button is available to toggle between Overlay and Undo Overlay mode. See “Customizing toolbars” on page 1-21 for information. The button is located in the Graph category. The traces are overlaid. The trace names are listed in the trace label. NOTE: When saving results, only the results for the active trace are saved. Data Explorer™ Software User’s Guide 2-25 2 Chapter 2 Using Chromatogram and Spectrum Windows Changing the active trace 2 Sequentially activating overlaid spectra To change the active trace in an overlay: 1. From the Display menu, deselect Overlay. 2. Click the trace to activate. 3. From the Display menu, select Overlay. When you display overlaid traces, you can sequentially activate each trace by clicking and . NOTE: If you overlay processed spectra, and then display a different spectrum number, the processed spectrum is lost. For example, assume you smooth Spectrum #3 in a trace, then overlay it with another trace. If you select Spectrum #3, then click to display Spectrum #2, then click to return to Spectrum #3, Spectrum #3 is no longer smoothed. Setting overlay attributes To set overlay attributes: 1. Display the individual traces to overlay. 2. Select Graphic Options from the Display menu. The Graph and Plot Options dialog box is displayed. NOTE: If traces are overlaid when you select Graphic Options, you can set attributes for the active trace only. 3. Click View Setup. 4. To apply the graphic options to all traces, select the Use same settings for all traces check box. NOTE: If the Use same settings for all traces check box is selected when traces are overlaid, the attributes are applied to the active trace only. When you display individual traces again, settings are applied to all traces. 2-26 Applied Biosystems Manipulating Traces NOTE: You must select the Use same settings for all traces check box before selecting options for traces. If you do not, settings are applied only to the active trace. 5. In View Setup, select Overlay Trace scaling: • Display Relative—Autoscales each trace to the base peak in the display range • BP Relative—Autoscales each trace to the base peak in the trace • Absolute Value—Maintains scaling of individual traces 6. Set trace colors as needed: • If you selected Use same settings for all traces, click Autocolor to allow the software to automatically assign trace colors. NOTE: The active trace color stays at its original setting. Other trace colors are set based on the active trace color. For example, if the active trace is yellow, other traces are assigned the colors pale blue, pale green and medium gray, which are the colors listed after yellow in the Trace color list, excluding white. White is not used in Autocolor, because white may not print on certain printers. • If you did not select Use same settings for all traces, click Graph Setup, then select trace colors. See “Setting colors” on page 1-25 for information. 7. Click OK. Data Explorer™ Software User’s Guide 2-27 2 Chapter 2 Using Chromatogram and Spectrum Windows 2.4.9 Annotating Traces You can add text annotation to traces by: 2 Copying results • Copying a line of results from the Output window (or copying any ASCII text from any source), then pasting the copied information on the trace • Typing text on the trace To copy results: 1. Generate results as desired by selecting commands from the Tools or Applications menu. For more information, see: • Section 5.3, Manual Calibration, or Section 5.4, Automatic Calibration • Section 5.6, Mass Deconvolution (Mariner Data Only) • Section 6.2, Using the Isotope Calculator • Section 6.3, Using the Mass Resolution Calculator • Section 6.4, Using the Signal-to-Noise Ratio Calculator 2. Click the Results tab in the Output window. 3. Select the line of text to copy, then right-click and select Copy from the menu displayed. NOTE: If you select more than one line of text, only the first line is pasted when you annotate the trace. 2-28 Applied Biosystems Manipulating Traces Annotating the trace To annotate the trace: 1. Click the trace at the location where you want to insert text. 2. Right-click, then select: • Paste text—If you copied results. • Add text annotation—If you want to type in text. Type in text as needed. 2 The text is added to the trace, and remains in the Spectrum window until you delete it. NOTE: The text is associated with the x-coordinate. If you display another spectrum, the text remains in view. If you zoom on a different region of the trace and the xcoordinate moves out of view, the annotated text also moves out of view. If you annotate overlaid traces, only the text associated with the active trace is displayed. NOTE: To move the text, click-drag the text to the desired position. 3. To customize the appearance of the annotated text, see Section 1.5, Setting Graphic Options. 4. To delete an annotation, do either of the following: • Select the text, right-click, then select the appropriate delete or cut option. • Right-click the trace, then select Delete All Text. NOTE: Text annotations are included when you print the spectrum. They are not saved with the spectrum when you close the data file. Data Explorer™ Software User’s Guide 2-29 Chapter 2 Using Chromatogram and Spectrum Windows 2.4.10 Viewing Trace Labels The Data Explorer software includes a label in the trace header to identify the type of data displayed. NOTE: Trace labels are applied by the software and cannot be removed. Chromatogram trace labels Labels in the chromatogram title identify the following types of displayed data: Chromatogram Trace Label Description 2 BC Baseline corrected BO Baseline offset BP Base Peak mass and intensity CNL Constant neutral loss chromatogram EF Event filtered chromatogram (MS Method data only) Mass xxx:yyy Extracted ion chromatogram for a mass range where xxx is the starting mass and yyy is the ending mass NFX Noise-filtered trace, where X is the applied Correlation Factor NRX Noise-removed trace, where X is the number of standard deviations of noise removed SMX Smoothed trace, where X is the number of smoothing points applied TAC Total absorbance chromatogram + TAC Realigned total absorbance chromatogram XAC Extracted absorbance chromatogram 2-30 Applied Biosystems Manipulating Traces Chromatogram Trace Label Description + XAC Realigned extracted absorbance chromatogram XIC xxx ± yyy Extracted ion chromatogram for a selected mass where xxx is the center mass and yyy is the specified window NOTE: Extracted ion chromatograms were previously labeled with “Mass” instead of “XIC”. Figure 2-11 illustrates an extracted ion chromatogram with a “XIC” chromatogram trace label. Trace label Figure 2-11 Chromatogram Trace Label Spectrum trace labels Labels in the spectrum title identify the following types of data displayed: Spectrum Trace Label Type of Processing +, /, or –mmm:nnn (Mariner data only) Added, accumulated, or subtracted spectrum from spectrum #mmm to #nnn AC Automatically mass calibrated AdvBC Advanced baseline correction ASC (Mariner data only) AutoSaturation corrected trace BC Baseline corrected BO Baseline offset Data Explorer™ Software User’s Guide 2-31 2 Chapter 2 Using Chromatogram and Spectrum Windows Spectrum Trace Label 2 Type of Processing BPI Base peak intensity CT Centroid DAD Diode array data DECONV (Mariner data only) Zero charge deconvoluted trace DI Deisotoped trace ISO Isotope MC Manually mass calibrated NF Noise-filtered trace NRX Noise-removed trace, where X is the number of standard deviations of noise removed RSMX (does not apply to Voyager PSD data) Default smoothing applied, where X is the resolution value (from peak detection) used to calculate the optimum number of smoothing points to apply at every mass point SC (Mariner data only) Converted to single-charge SMX Smoothed, where X is the number of smoothing points applied Stitched PSD Composite PSD spectrum TR Truncated spectrum 2-32 Applied Biosystems Manipulating Traces Figure 2-12 illustrates a smoothed spectrum with an “SM5” spectrum trace label. Trace label 2 Figure 2-12 Spectrum Trace Label 2.4.11 Printing Traces Printing traces To print traces: 1. Display the traces to print. To obtain a clear printout, you can set the Trace Color and other attributes to dark colors before printing traces by selecting Default from the Display menu, then selecting White Background. NOTE: If you previously modified the colors associated with this command as described in Section 1.5.1, Changing Background Color, selecting this command may not set a white background and black traces. When you manually set colors, note the following: • Selections set to white (or line widths set to 0) may not print on certain printers. • If you select different trace colors for multiple traces, only the color for the active trace is saved. 2. Click the window (Chromatogram or Spectrum) to print. Data Explorer™ Software User’s Guide 2-33 Chapter 2 Using Chromatogram and Spectrum Windows 3. To print with the x-axis along the longest length of the paper, select Print Setup from the File menu, then select Landscape orientation. NOTE: The Landscape printing orientation you set in Data Explorer is lost when you close Data Explorer. To permanently set the printer, see “Dedicating a printer to landscape orientation” on page 2-35. 2 4. From the File menu, select a print option: • Print File with Instrument Settings—Prints displayed trace windows from the active file along with the settings used to obtain the data. • Print Spectrum or Chromatogram Trace— Prints the active trace. • Print Spectrum or Chromatogram View— Prints all traces in the Spectrum or Chromatogram window. • Print All Views—Prints traces for all open data files. NOTE: If you select Print All Views when more than two data files are open, certain printers may not print the data file name. To ensure data file names are printed, print views individually, or only open two data files before you select Print All Views. NOTE: To print a trace that is displayed as Vertical Bars, change the Line Width to 1. If Line Width is set to 0, Vertical Bar traces may not print on certain printers. See Section 1.4, Customizing the Data Explorer Window, for information. 2-34 Applied Biosystems Manipulating Traces NOTE: Line Widths of 0 or 1 (or lines set to the color white) may not print on certain printers. If traces do not print, change the line width (or color). Dedicating a printer to landscape orientation To dedicate the printer to landscape orientation: 1. From the Windows desktop, click Start, then select Settings. 2. Click Printers. 3. Select the printer name in the displayed list. 4. Click File, then select Document Defaults. 5. In the Page Setup tab, select Landscape orientation. 2 NOTE: If you cannot select Landscape orientation, you do not have access permission. See your administrator. Print Setup The Print Setup function allows you to select a printer and set printer options. For more information on Print Setup and on connecting printers to your computer, refer to the documentation provided with your computer. Data Explorer™ Software User’s Guide 2-35 Chapter 2 Using Chromatogram and Spectrum Windows 2.5 Working with Multiple Data Files When you have multiple data files open, you can: 2 • Work with the data files separately to view, zoom, and print • Copy traces from one data file to another to compare or combine data 2.5.1 Working with Separate Data Files To view, zoom, and print multiple data files: 1. Open the data files as described in Section 2.1, Opening and Closing Data Files. 2. Set the Y Scaling mode to Display Relative, as described in Section 2.2, Adjusting the Display Range. 3. Link the data files by selecting the Spectrum window for each data file, then selecting Link View from the View menu. You must select Link View for each data file. NOTE: Clicking views. 2-36 Applied Biosystems in the toolbar links traces, not 4. Organize the Spectrum windows for the data files by clicking and in the toolbar. 5. Zoom and manipulate traces as needed. 6. To print all data files, select Print All Views from the File menu. Working with Multiple Data Files NOTE: If you select Print All Views when more than two data files are open, certain printers may not print the data file name. To ensure data file names are printed, print views individually, or only open two data files before you select Print All Views. 2 2.5.2 Copying Traces from Multiple Data Files to a Window You can copy up to seven traces from open data files to a different trace window: 1. Select the trace to copy. 2. From the Edit menu, select Copy, then Trace Data, or right-click the trace, then select Copy Trace Data. 3. Activate the window in which to paste the trace. NOTE: The Add/Replace Trace state, as set in the Display Trace dialog box, determines whether the copied trace replaces or is added below the active trace. See “Setting the Replace mode” on page 2-17. 4. From the Edit menu, select Paste, then Trace Data, or right-click the window, then select Paste Trace Data. The copied trace is added to the active window. The original trace label is preceded by the name of the file from which you copied the trace. You can repeat step 1 through step 4 until a maximum of eight traces are displayed in a trace window. If eight traces are displayed and you copy a new trace to the window, the active trace is replaced. Data Explorer™ Software User’s Guide 2-37 Chapter 2 Using Chromatogram and Spectrum Windows Comparing copied traces After you copy a trace to another trace window, you can compare traces by overlaying (see Section 2.4.8, Overlaying Traces) or by using trace arithmetic (see Section 5.12, Adding and Subtracting Raw or Processed Spectra from the Same or Different Data Files (Dual Spectral Trace Arithmetic). 2.6 Saving, Opening, and Deleting .DAT Results 2 Saving results for .DAT files To save results for .DAT files: 1. Process a data file to generate results as needed. 2. From the File menu, select Result Spectrum or Result Chromatogram, then select Save As. 3. Use the default title, or enter a name (up to 31 characters) for the results in the Title text box, then click OK. Only the results for the active trace are saved. NOTE: Results are stored within the .DAT file, not as separate files. Title is an identifier you can use to recall the results. It is not a file name. Opening results for .DAT files Deleting results for .DAT files 2-38 Applied Biosystems To open results for .DAT files: 1. From the File menu, select Result Spectrum or Result Chromatogram, then select Open. 2. Select the title of the previously saved results to open, then click OK. 3. Click the Sample Info tab in the Output window to display information for the result. To delete results for .DAT files: 1. From the File menu, select Result Spectrum or Result Chromatogram, then select Delete. 2. Select the title of the results to delete, then click OK. Exporting, Opening, and Deleting .RCD and .RSD Results Files (Mariner Data Only) 2.7 Exporting, Opening, and Deleting .RCD and .RSD Results Files (Mariner Data Only) Exporting results for .RCD and .RSD files To export results to a .RSD or .RCD file: 1. With a data file open in Data Explorer, select a spectrum or chromatogram. 2. From the File menu, select Export, then Result Chromatogram or Result Spectrum. 2 A Save As dialog box appears. Opening results for .RCD and .RSD files 3. Specify the name and destination of the exported file. By default, the software assigns a .RCD extension for a chromatogram or a .RSD extension for a spectrum. 4. Click OK. To open results from .RCD and .RSD files: 1. Select Open from the File menu. The Select Data File to Open dialog box is displayed. 2. From the Files of Type drop-down list, select Result Spectrum Files (*.RS*) or Result Chromatogram Files (*.RC*). 3. Select the .RCD or .RSD file to open, then click OK. 4. Click the Sample Info tab in the Output window to display the following information for the result file: • Name of the original raw data file the result file was generated from • Processing functions that were performed and saved in the result file Data Explorer™ Software User’s Guide 2-39 Chapter 2 Using Chromatogram and Spectrum Windows Deleting results for .RCD and .RSD files Use Windows NT Explorer to delete .RCD and .RSD result files. 2.8 Saving, Opening, and Deleting .SPC Results Files (Mariner Data Only) 2 Saving results for .SPC files To save results for .SPC files (Mariner data only): 1. Process a data file to generate results as needed. 2. From the File menu, select Result Spectrum or Result Chromatogram, then select Save As. 3. Enter a file name for the result file in the File Name text box. Spectrum files are automatically named with an .RST extension. Chromatogram files are automatically named with an .RCT extension. 4. Click OK. NOTE: You can also save Mariner .RCT and .RST files from .DAT format data files in the Instrument Control Panel. For more information, see the Mariner Workstation User’s Guide. Opening results: for .SPC files To open results for .SPC files: 1. Select Open from the File menu. The Select Data File to Open dialog box is displayed. 2. 2-40 Applied Biosystems From the Files of Type drop-down list at the bottom of the dialog box, select Result Spec Files (*.RS*) or Result Chro Files (*.RC*). Saving, Opening, and Deleting .SPC Results Files (Mariner Data Only) 3. Select the .RST or .RCT file to open, then click OK. NOTE: Saturation Correction is not applied to Mariner .RST files. For more information, see Section 5.11, AutoSaturation Correction (Mariner Data Only). 4. Click the Sample Info tab in the Output window to display the following information for the result file: • Name of the original raw data file from which the result file was generated • Processing functions that were performed and saved in the result file Deleting results for .SPC files Use Windows NT Explorer to delete .RST and .RCT result files generated from .SPC files. Data Explorer™ Software User’s Guide 2-41 2 Chapter 2 Using Chromatogram and Spectrum Windows 2 2-42 Applied Biosystems Chapter 3 Peak Detection and Labeling 3 This chapter contains the following sections: 3.1 Overview ......................................................... 3-2 3.2 Peak Detection ................................................ 3-6 3.3 Peak List ....................................................... 3-37 3.4 Deisotoping a Spectrum................................. 3-45 3.5 Peak Labeling ................................................ 3-52 3.6 Process that Occurs During Peak Detection, Centroiding, and Integration .......................... 3-67 3.7 Default Peak Detection Settings .................... 3-71 Data Explorer™ Software User’s Guide 3-1 Chapter 3 Peak Detection and Labeling 3.1 Overview This section includes: • Default peak detection • The resolution-based peak detection routine 3.1.1 Default Peak Detection Overview When you open a data file, it is automatically peak detected. For: • Chromatographic data—The software uses default settings that have been optimized to yield acceptable peak detection for many sample types. For more information, see Section 3.7, Default Peak Detection Settings. 3 • Spectral data—The software uses a resolution-based peak detection routine to calculate peak detection values that provide optimum peak detection for most sample types. For more information, see Section 3.1.2, The Resolution-Based Peak Detection Routine. For many applications, the default peak detection settings and settings calculated by the resolution-based peak detection routine provide acceptable peak detection. If default settings do not provide acceptable peak detection, you can adjust the settings as described in: • Section 3.2.1, Strategy for Mariner Peak Detection • Section 3.2.2, Strategy for Voyager Peak Detection NOTE: If peak detection settings do not detect desired peaks, you can manually insert peaks. See Section 3.3.2, Inserting Peaks in the Peak List. 3-2 Applied Biosystems Overview 3.1.2 The Resolution-Based Peak Detection Routine This section describes: • • • • Type of data affected Process that occurs Detection ranges PSD peak detection for Voyager data Type of data affected The resolution-based peak detection routine applies to spectral data only. You can enable or disable the resolution-based peak detection routine as described on page 3-14. Process that occurs When enabled, the resolution-based peak detection routine automatically: • Divides a trace into detection ranges based on the expected number of data points across a typical mass spectral peak. 3 • Applies a Filter Width that is equal to the number of data points per peak in each detection range. • Uses a Filter Increment of 1. Data Explorer™ Software User’s Guide 3-3 Chapter 3 Peak Detection and Labeling The software uses the following formula to calculate the expected number of data points in a peak: Expected number of data points Flight time to which the data point corresponds = (2 × mass resolution × Bin size) Where: Mass resolution is a user-defined value. Data-type-dependent defaults are provided, but can be overwritten. Bin size is an instrumental constant: · For Mariner data, Bin size = 1 ns. · For Voyager data, Bin size is variable based on the digitizer used and the mass range acquired. 3 Detection ranges Number of data points Figure 3-1 is an example of the resolution-based detection ranges automatically calculated by the software. 41 47 53 59 65 71 77 83 Figure 3-1 Example Detection Ranges Calculated by Software Based on Number of Data Points Per Peak 3-4 Applied Biosystems Overview Overlapping peak detection ranges To accommodate spectral peaks that occur on the boundary of two peak detection ranges, the software creates detection ranges that overlap (Figure 3-2). Peak A Peak B Peak C Peak D Range 4 Range 3 Range 2 Range 1 Figure 3-2 Overlapping Detection Ranges If a peak occurs in an overlapping range (for example, Peak B in Figure 3-2), the software detects the peak using the settings from the detection range within which the entire peak occurs (Range 2 in Figure 3-2). If a peak occurs completely within two ranges (for example, Peak D in Figure 3-2), the software uses the settings from the higher m/z detection region (Range 4 in Figure 3-2). PSD peak detection for Voyager data For PSD data, the mass-time correlation is different from that of standard TOF spectra. Therefore, resolution-dependent settings are not supported for PSD data. Data Explorer™ Software User’s Guide 3-5 3 Chapter 3 Peak Detection and Labeling 3.2 Peak Detection This section includes: • • • • • Strategy for Mariner peak detection Strategy for Voyager peak detection Setting peak detection parameters Peak detection parameter descriptions Charge state determination and examples 3.2.1 Strategy for Mariner Peak Detection This section gives some quick suggestions on how to approach Mariner peak detection. For details on peak detection, see Section 3.2.3, Setting Peak Detection Parameters. 3 Default peak detection values are listed in Section 3.7, Default Peak Detection Settings. Strategy When detecting peaks in Mariner data: 1. Open the data file and observe the effects of the default peak detection settings. If you are analyzing resolved isotopes, default settings should yield acceptable peak detection. The default resolution setting of 5,000 is optimized for masses below 3,000 Da. 2. 3-6 Applied Biosystems If you are analyzing proteins, decrease the Mass Resolution setting. Peak Detection 3. If peak detection is not acceptable, leave the Use Resolution Dependent Settings option enabled, and adjust the following global threshold parameters in the following order: • %Base Peak Intensity—Use this parameter to eliminate peaks with an intensity below the specified threshold. This threshold is represented as a percentage of the intensity of the base peak. • %Max Peak Area—Use this parameter to fine-tune noise discrimination on the baseline or noise spikes on peaks. This threshold is represented as a percentage of the area of the peak with the largest area and is calculated above the local baseline. To determine an appropriate threshold, display the Spectrum Peak list, note the area of the peak with the greatest area and the areas of unwanted peaks, and estimate the percentage to enter as the threshold. Specifying a %Max Peak Area Threshold is particularly useful if the spectrum includes a rising baseline that would cross a %Base Peak Intensity Threshold and eliminate peaks of interest in one portion of the trace. 4. If peak detection is still not acceptable, adjust the remaining peak detection parameters, as described in Section 3.2.3, Setting Peak Detection Parameters. Data Explorer™ Software User’s Guide 3-7 3 Chapter 3 Peak Detection and Labeling 3.2.2 Strategy for Voyager Peak Detection This section gives some quick suggestions on how to approach Voyager peak detection. For details on peak detection, see Section 3.2.3, Setting Peak Detection Parameters. Default peak detection values are listed in Section 3.7, Default Peak Detection Settings. Strategy When detecting peaks in Voyager data: 1. Open the data file and observe the effects of the default resolution-dependent settings. Hint: To improve peak detection, you can calculate the resolution on a tall, resolved peak in the middle of the spectrum. If the resolution result differs by more than 50% from the default resolution setting, fine-tune the Resolution setting and reapply peak detection. For more information, see Section 6.3, Using the Mass Resolution Calculator. 3 2. To aid in peak interpretation, do all of the following: • Baseline-correct—The Centroid% peak detection value is derived from a percentage of the peak height, which is measured from 0. For information, see Section 5.8.2, Using Baseline Correction. • Noise-filter or smooth—Use the method appropriate for your data to remove noise spikes: Data Type Method Linear Default or Gaussian smoothing Reflector Noise Reduction For more information, see Section 5.7, Noise Filtering/Smoothing. 3-8 Applied Biosystems Peak Detection • Deisotope (reflector data only)—Peak deisotoping reduces the spectrum to a monoisotopic centroided plot of the monoisotopic masses. This is useful in identifying overlapping isotope clusters. Make sure peak detection thresholds are set low enough to detect the monoisotopic peak before deisotoping. For more information, see Section 3.4, Deisotoping a Spectrum. Deisotoping provides no benefit on linear data (non-isotopically resolved) or on PSD data (pure isotope data). 3. Problem If peak detection is not acceptable, keep the Use Resolution Dependent Settings option enabled, and adjust the parameter associated with the observed problem: 3 Suggested Actions High-mass peaks not detected Decrease Mass Resolution setting. The default Mass Resolution settings are optimized for masses below 20,000 Da. Noise detected as peaks Increase the %Max Peak Area. Decrease the Resolution. Peaks of interest are not detected Decrease the %Max Peak Area. Low Mass Gate spike is identified as the Base Peak Truncate the data to eliminate the Low Mass Gate spike, then reapply peak detection settings. See Section 5.9, Truncating a Spectrum. Peaks detected before deisotoping are not detected after deisotoping Set %Max Peak Area and %BP Intensity to 0 before deisotoping, deisotope, then reset thresholds to appropriate settings after deisotoping. NOTE: %Max Peak Area is calculated above the local baseline and can compensate for problems related to a rising global baseline. Data Explorer™ Software User’s Guide 3-9 Chapter 3 Peak Detection and Labeling Problem Suggested Actions Partially resolved peaks not detected If peaks represent two compounds, and you want both peaks labeled, do either of the following: • Set %Max Peak Area to 0, then adjust the %Base Peak Intensity until peaks are detected. • Click the Peak Processing tab, then change the default Integration Baseline Setting from Valley-to-Valley to Valley-to-Baseline. If peaks represent partially resolved isotopes, and you want to label and detect the average mass, decrease the Mass Resolution setting until the isotopic envelope is detected. 4. 3 If you see more than one of the problems listed above in a spectrum, you can adjust peak detection parameters for any or all detection ranges (referred to as setting parameters locally) by doing the following in the order listed: • Disable Use Resolution Dependent Settings. • Click the Advanced tab. • Select a detection region that is exhibiting the problem. • Adjust the local settings to fine tune detection. • Click OK. 5. 3-10 Applied Biosystems If peak detection is still not acceptable, adjust the remaining peak detection parameters, as described in Section 3.2.3, Setting Peak Detection Parameters. Peak Detection 3.2.3 Setting Peak Detection Parameters This section includes: • Before you begin • Setting chromatogram parameters • Setting Basic Settings (spectrum data) • Setting Peak Processing parameters (spectrum data only) • Setting Advanced Settings (spectrum data only) • Resetting Basic Settings Before you begin Before setting peak detection, read: • Section 3.2.1, Strategy for Mariner Peak Detection • Section 3.2.2, Strategy for Voyager Peak Detection Setting chromatogram parameters 3 To set chromatogram parameters for data: 1. Click the Chromatogram window to activate it. 2. Click the trace of interest. 3. Click in the toolbar or select Peak Detection from the Peaks menu. The Chromatogram Peak Detection dialog box is displayed (Figure 3-3). You can click-drag the threshold cursor to adjust the %Base Peak Intensity. For a description of the parameters in the Chromatogram Peak Detection dialog box, see “Chromatogram settings” on page 3-19. Data Explorer™ Software User’s Guide 3-11 Chapter 3 Peak Detection and Labeling Figure 3-3 Chromatogram Peak Detection Setup Dialog Box 3 4. Select a detection range and set parameters as needed. 5. To apply settings to all traces, select Use same settings for all traces in view. To set parameters independently for all traces in a window, deselect Use same settings for all traces in view. 6. 3-12 Applied Biosystems Click Apply to accept the parameters and leave the dialog box open, or click OK to accept the parameters and close the dialog box. Peak Detection Setting Basic Settings (spectrum data) Basic Settings should provide acceptable peak detection for most applications. After you apply these parameters, no further adjustment should be required. If further adjustment is required, select Use Advanced Settings and adjust parameters as needed. To set Basic Settings parameters for spectrum data: 1. Click the Spectrum window to activate it. 2. Click the trace of interest. 3. Click in the toolbar or select Peak Detection from the Peaks menu. The Spectrum Peak Detection Setup dialog box opens, with the Basic Settings tab (Figure 3-4) displayed. NOTE: If you applied Advanced Settings to a data file, they override the settings on the Basic Settings tab, and the Advanced Settings tab is displayed when you select Peak Detection. See “Setting Advanced Settings (spectrum data only)” on page 3-17. 4. Set Global Thresholds as needed. These thresholds are applied to all detection ranges, unless you override them for a detection range on the Advanced Settings tab. For a description of the parameters, see “Basic Settings (spectrum data only)” on page 3-22. Data Explorer™ Software User’s Guide 3-13 3 Chapter 3 Peak Detection and Labeling Figure 3-4 Spectrum Peak Detection Setup— Basic Settings Tab 3 5. If you are detecting PSD data, or want to override the Global Thresholds, select Use Advanced Settings and skip to step 7. 6. If you are detecting mass spectral data, select Use Resolution Dependent Settings if you want the software to: • Automatically determine the number of data points across a peak • Divide the trace into different detection ranges based on the resolution • Apply a Filter Width and Increment appropriate for each detection range • Apply a Minimum Area of 0 and a Minimum Intensity of 0 to all detection ranges 3-14 Applied Biosystems Peak Detection NOTE: Resolution-dependent settings do not apply to Mariner chromatogram data or Voyager PSD data. For more information, see Section 3.1.2, The Resolution-Based Peak Detection Routine. 7. To apply settings to all traces, select Use same settings for all traces in view. To set parameters independently for all traces in a window, deselect Use same settings for all traces in view. 8. Type the Mass Resolution value to use for peak detection. The default value for the type of data displayed is acceptable for most applications. Defaults are listed in “Basic Settings (spectrum data only)” on page 3-22. NOTE: The Mass Resolution you set here is also used by the Elemental Composition Calculator, the Elemental Targeting Application, and the Default Smoothing function. For more information, see Section 6.1, Using the Elemental Composition Calculator, Section 6.6, Using the Elemental Targeting Application, and Section 5.7, Noise Filtering/Smoothing. 9. Click Apply to accept the parameters and leave the dialog box open, or click OK to accept the parameters and close the dialog box. Data Explorer™ Software User’s Guide 3-15 3 Chapter 3 Peak Detection and Labeling Setting Peak Processing parameters (spectrum data only) To set Peak Processing parameters: 1. Click the Peak Processing tab in the Spectrum Peak Detection Setup dialog box. The Peak Processing tab is displayed (Figure 3-5). 3 Figure 3-5 Spectrum Peak Detection Setup— Peak Processing Tab NOTE: You can enable the %BP Intensity Threshold Cursor and click-drag it to adjust the %Base Peak Intensity. 2. Set parameters as needed, then click Apply to accept the parameters and leave the dialog box open, or click OK to accept the parameters and close the dialog box. For a description of the parameters, see “Peak Processing parameters (spectrum data only)” on page 3-26. 3-16 Applied Biosystems Peak Detection Setting Advanced Settings (spectrum data only) To set Advanced Settings that you can apply locally to a selected detection range, and that override the thresholds set in the Basic Settings tab: 1. In the Basic Settings tab, select Use Advanced Settings. 2. Click the Advanced Settings tab in the Spectrum Peak Detection Setup dialog box. NOTE: If you select Use Resolution Dependent Settings in the Basic Settings tab, Basic Settings override Advanced Settings. The Advanced Settings tab is accessible, but all parameters are dimmed. To make Advanced Settings available for editing, select Use Advanced Settings on the Basic Settings tab. The Advanced Settings tab is displayed (Figure 3-6). 3 Figure 3-6 Spectrum Peak Detection Setup— Advanced Settings Tab Data Explorer™ Software User’s Guide 3-17 Chapter 3 Peak Detection and Labeling 3. Select a detection range, then set parameters as needed. 4. Click Apply to accept the parameters and leave the dialog box open, or click OK to accept the parameters and close the dialog box. For a description of the parameters and the data cursor, see “Advanced Settings (spectrum data only)” on page 3-28. Resetting Basic Settings 3 If you override Basic Settings by entering parameters on the Advanced Settings tab, you can reset Basic Settings by doing the following: 1. Click the Basic Settings tab. 2. Select Use Resolution Dependent Settings. 3. Enter the desired Global Thresholds. 4. Click Apply or OK. The following occurs: • Detection ranges, Filter Width, and Filter Increment previously set on the Advanced Settings tab are reset to defaults. • Minimum Area and Minimum Intensity are set to 0. • Global Threshold settings from the Basic Settings tab are applied to all detection ranges and override the thresholds set for individual detection ranges on the Advanced Settings tab. Detection ranges that do not correspond to ranges calculated by resolution-dependent peak detection are deleted. NOTE: To reset to original peak detection settings, restore the default .SET file for your system. For more information, see “Applying a .SET file” on page 1-20. 3-18 Applied Biosystems Peak Detection 3.2.4 Peak Detection Parameter Descriptions This section describes: • • • • Chromatogram settings Chromatogram settings Basic Settings (spectrum data) Peak Processing parameters (spectrum data only) Advanced Settings (spectrum data only) Table 3-1 describes the parameters in the Chromatogram Peak Detection Setup dialog box (see Figure 3-3 on page 3-12). Default peak detection values are listed in Section 3.7, Default Peak Detection Settings. Table 3-1 Chromatogram Settings Parameter Detection Ranges 3 Description Specifies one or more non-contiguous m/z ranges for peak detection. You can set parameters for each range independently. You select a range in the Detection Ranges list box by single-clicking the range number. To add a detection range, do one of the following: • Select an existing range, then click . This creates a new range with boundaries ranging from the end of the existing range to the end of the trace. If the existing range ends at the end of the trace, the region of the existing range is split in half between the existing range and the new range. • Double-click an existing range to manually enter lower and upper boundaries. • Select a range in the dialog box, then click-drag the X data cursors labels in the trace to set the lower and upper boundaries. Continued Data Explorer™ Software User’s Guide 3-19 Chapter 3 Peak Detection and Labeling Table 3-1 Chromatogram Settings (Continued) Parameter Description Detection Ranges To delete a range, select the range, then click . (continued) To combine all ranges in the list into one range, click . The peak detection settings displayed in the dialog box correspond to the selected range. To view peak detection settings for another range, select the range of interest. 3 %Base Peak Intensity Specifies a percentage of the base peak intensity as the threshold value. NOTE: This parameter was previously named Peak Threshold% and Base Peak Relative%. To be detected, peaks must be above this threshold and above the %Max Peak Area value. %Max Peak Area Specifies a percentage of the peak with the largest area as the threshold value. Hint: For most Voyager applications, leave this parameter set at 0 and adjust the %Max Peak Area. To be detected, peaks must be above this threshold and above the %Base Peak Intensity value. %Max Peak Area is calculated above the local baseline and can compensate for problems related to a rising global baseline and signal spikes. Hint: If you are analyzing digest data, set %Max Peak Area to 0 before deisotoping to ensure that all peaks of interest are detected. For more information, see Section 7.2.3, Detecting Peaks from Complex Digests. Filter Width Specifies the number of data points used in smoothing for peak detection before integration. The software uses a Filter Width Increment of 1 when applying smoothing. NOTE: If you set Filter Width too high, narrow peaks may not be detected. Continued 3-20 Applied Biosystems Peak Detection Table 3-1 Chromatogram Settings (Continued) Parameter Filter Width (continued) Description Hint: Set Filter Width to a number equal to the number of points across the peak. To determine the number of points across a peak, you can change the trace display from Line to Vertical Bars. Each vertical bar represents one data point. For more information, see Section 1.4, Customizing the Data Explorer Window. Integration Baseline Settings NOTE: You can set peak labels to display peak start, peak end, and baseline marks. See Section 3.5.2, Setting Chromatogram and Spectrum Peak Labels. Valley-to-Baseline Valley-to-Valley Drops a vertical line from all valleys to a horizontal baseline. The level of the horizontal baseline is determined using the minimum peak valley point (left or right) for each peak. See Figure 3-25 on page 3-70. Forces a baseline through all valley points. See Figure 3-25 on page 3-70. Trace Settings Use same settings for all traces in view Applies settings to all traces in the active window. NOTE: In previous versions of Data Explorer software, peak detection allowed you to specify Peak Width and Noise Threshold for chromatogram data. The software now automatically: Uses a minimum peak width that is equal to the Filter Width, and a maximum peak width of 10,000 data points. Calculates the Noise Threshold by performing an automatic signal-to-noise calculation on a chromatogram and by using 75 percent of the noise value determined as the threshold. Data Explorer™ Software User’s Guide 3-21 3 Chapter 3 Peak Detection and Labeling Basic Settings (spectrum data only) Table 3-2 describes the parameters in the Basic Settings tab of the Spectrum Peak Detection Setup dialog box (see Figure 3-4 on page 3-14). Default peak detection values are listed in Section 3.7, Default Peak Detection Settings. Table 3-2 Basic Settings Tab Parameters (Spectrum Data Only) Parameter Description Global Thresholds 3 %Base Peak Intensity Specifies a percentage of the base peak intensity as the threshold value. NOTE: This parameter was previously named Peak Threshold% and Base Peak Relative%. To be detected, peaks must be above this threshold and above the %Max Peak Area value. If you override Global Thresholds by selecting Use Advanced Settings (described on page 3-23), the software ignores Global Thresholds and uses the %Base Peak Intensity, %Max Peak Area, Minimum Area, and Minimum Intensity thresholds set on the Advanced tab (described on page 3-28) to detect peaks for the selected detection range. NOTE: If you are examining Voyager data that contains a Low Mass Gate spike, the software may identify the Low Mass Gate spike as the Base Peak. Truncate the data as described in Section 5.9, Truncating a Spectrum, to eliminate the Low Mass Gate spike and correctly identify the Base Peak. Hint: For most Voyager applications, leave this parameter set at 0 and adjust the %Max Peak Area. Continued 3-22 Applied Biosystems Peak Detection Table 3-2 Basic Settings Tab Parameters (Spectrum Data Only) (Continued) Parameter %Max Peak Area Description Specifies a percentage of the peak with the largest area as the threshold value. To be detected, peaks must be above this threshold and above the %Base Peak Intensity value. %Max Peak Area is calculated above the local baseline and can compensate for problems related to a rising global baseline. If you override Global Thresholds by selecting Use Advanced Settings (described on page 3-23), the software ignores Global Thresholds and uses the %Base Peak Intensity, %Max Peak Area, Minimum Area, and Minimum Intensity thresholds set on the Advanced tab (described on page 3-28) to detect peaks for the selected detection range. Enable %BP Intensity Threshold Cursor When enabled, allows you to click-drag the cursor to set the % Base Peak Intensity Threshold. Peak Detection Use Resolution Dependent Settings (not available for Voyager PSD data) When selected, the software automatically determines detection ranges and uses an appropriate Filter Width and an Increment of 1. For more information, see Section 3.1.2, The Resolution-Based Peak Detection Routine. Use Advanced Settings When selected, the software ignores the Global Threshold values on the Basic Settings tab, and uses the threshold values set on the Advanced tab. See “Advanced Settings (spectrum data only)” on page 3-28. Continued Data Explorer™ Software User’s Guide 3-23 3 Chapter 3 Peak Detection and Labeling Table 3-2 Basic Settings Tab Parameters (Spectrum Data Only) (Continued) Parameter Description Peak Resolution Mass Resolution Value used to determine the Filter Width used for detection. For more information, see Section 3.1.2, The ResolutionBased Peak Detection Routine. Default values for different types of data are: 3 • Mariner data—5,000, which is optimized for masses below 3,000 m/z. Decrease this value if you are analyzing proteins. • Voyager linear data—2,000, which is optimized for masses below 20,000 m/z. Decrease this value if you are analyzing higher masses or want to label average isotope masses. • Voyager reflector data—10,000, which is optimized for masses below 20,000 m/z. Decrease this value if you are analyzing higher masses or want to label average isotope masses. If you set a resolution value of: • 1,000 or greater—The software uses the setting until it reaches the mass at which isotopic resolution is no longer possible, then switches to a resolution of 1,000, the resolution that corresponds to isotopic clusters. • Less than 1,000—The software uses the setting for all masses. NOTE: The Mass Resolution you set here is also used by the Elemental Composition Calculator, the Elemental Targeting Application, and the Default Smoothing function. For more information, see Section 6.1, Using the Elemental Composition Calculator, Section 6.6, Using the Elemental Targeting Application, and Section 5.7, Noise Filtering/Smoothing. Continued 3-24 Applied Biosystems Peak Detection Table 3-2 Basic Settings Tab Parameters (Spectrum Data Only) (Continued) Parameter Description Trace Settings Use same settings for all traces in view Applies settings to all traces in the active window. NOTE: In previous versions of Data Explorer software, peak detection allowed you to specify Peak Width. The software now automatically uses a minimum peak width that is equal to the Filter Width and a maximum peak width of 10,000 data points. 3 Data Explorer™ Software User’s Guide 3-25 Chapter 3 Peak Detection and Labeling Peak Processing parameters (spectrum data only) Table 3-3 describes the parameters in the Peak Processing tab of the Spectrum Peak Detection Setup dialog box (see Figure 3-5 on page 3-16). Default peak detection values are listed in Section 3.7, Default Peak Detection Settings. Table 3-3 Peak Processing Parameters (Spectrum Data Only) Parameter Description Integration Baseline Settings NOTE: You can set peak labels to display peak start, peak end, and baseline marks. See Section 3.5.2, Setting Chromatogram and Spectrum Peak Labels. 3 Valley-to-Baseline Draws a vertical line from all valleys to a horizontal baseline. The level of the horizontal baseline is determined using the minimum peak valley point (left or right) for each peak. See Figure 3-25 on page 3-70. Valley-to-Valley Forces a baseline through all valley points. See Figure 3-25 on page 3-70. Spectrum Parameters Centroid % Specifies the percentage of peak height used to determine the location of the centroid mass. For example, with a Centroid % of 10, the software examines the top ten percent of signal. Enable Gaussian Fitting Increases the accuracy of the centroid calculation for spectral peaks with limited data points (fewer than 6 data points across the peak), in particular, Mariner data below m/z 400. Continued 3-26 Applied Biosystems Peak Detection Table 3-3 Peak Processing Parameters (Spectrum Data Only) (Continued) Parameter Description Charge State Determination (Spectrum only) Maximum Charge State Determines the peak spacing evaluated for the presence of isotope peaks. The expected peak spacing is determined by the Max Charge State plus or minus a tolerance value. The tolerance is calculated as (proton mass/charge state) × 15%. For example, with a Max Charge State of 3, the software checks for peaks that are 0.33 m/z apart, with a fixed tolerance of 0.05 m/z, where proton mass equals 1.007276456. Maximum Charge State is 6 for Mariner data and 1 for Voyager data. Maximum Isotopes # Specifies the maximum number of peaks included in an isotope cluster. NOTE: Setting this value too low can result in peaks not being included in the appropriate isotope cluster. For more information, see “Max Isotope # set too low” on page 3-35. Minimum and Maximum Intensity% Specifies the intensity range that a peak must fall within (relative to the previously evaluated higher mass peak) to be included in the current isotope cluster. Data Explorer™ Software User’s Guide 3-27 3 Chapter 3 Peak Detection and Labeling Advanced Settings (spectrum data only) Table 3-4 describes the parameters in the Advanced Settings tab of the Spectrum Peak Detection Setup dialog box (see Figure 3-6 on page 3-17). Default peak detection values are listed in Section 3.7, Default Peak Detection Settings. NOTE: If you select Use Resolution Dependent Settings in the Basic Settings tab, Basic Settings override Advanced Settings. The Advanced Settings tab is accessible, but all parameters on the tab are dimmed. To make Advanced Settings available for editing, select Use Advanced Settings on the Basic Settings tab. Table 3-4 Advanced Settings (Spectrum Data Only) Parameter 3 Description Peak Detection Settings Detection Ranges Specifies the region of the trace (defined by x-axis lower and upper boundaries) to which the settings apply. If you select Use Resolution Dependent Settings in the Basic Settings tab (described on page 3-23), the software automatically divides the trace into detection ranges. If you select Use Advanced Settings, the detection ranges calculated by the software are maintained, and you can modify the ranges and settings, or combine all ranges in the list into one range, as described below. Continued 3-28 Applied Biosystems Peak Detection Table 3-4 Advanced Settings (Spectrum Data Only) (Continued) Parameter Detection Ranges (continued) Description You can set multiple, non-contiguous ranges and define parameters for each range independently. You select a range in the Detection Ranges list box by single-clicking the range number. To add a detection range, do one of the following: • Select an existing range, then click . This creates a new range with boundaries ranging from the end of the existing range to the end of the trace. If the existing range ends at the end of the trace, the region of the existing range is split in half between the existing range and the new range. • Double-click an existing range to manually enter lower and upper boundaries. • Select a range in the dialog box, then click-drag the X data cursors labels in the trace to set the lower and upper boundaries. To delete a range, select the range, then click . To combine all ranges in the list into one range, click . The peak detection settings displayed in the dialog box correspond to the selected range. To view peak detection settings for another range, select the range of interest. Continued Data Explorer™ Software User’s Guide 3-29 3 Chapter 3 Peak Detection and Labeling Table 3-4 Advanced Settings (Spectrum Data Only) (Continued) Parameter Description Active Range Thresholds NOTE: These settings apply to the Detection Range selected, and override the Global Thresholds specified on the Basic Settings tab (described on page 3-19). %BP Intensity See “%Base Peak Intensity” on page 3-20. %Max Peak Area See “%Max Peak Area” on page 3-20. Minimum Intensity Specifies the absolute peak intensity below which peaks are not detected. Calculated relative to zero. NOTE: Maximum possible intensity for Mariner data is 11,000 counts (spectrum that has not been accumulated or summed), and for Voyager data is 66,000 counts. 3 NOTE: This parameter was previously named Absolute Threshold. Minimum Area Specifies the peak area below which peaks are not detected. Calculated relative to peak valleys. Hint: Display the peak list to determine the appropriate area value to enter. Noise Threshold Used to determine peak boundaries. Click the field, then right-click-drag over a segment of the trace to automatically set. For more information, see “Process that Occurs During Peak Detection, Centroiding, and Integration” on page 3-67. Continued 3-30 Applied Biosystems Peak Detection Table 3-4 Advanced Settings (Spectrum Data Only) (Continued) Parameter Description Filter Settings Width Number of data points used in smoothing for peak detection before integration. This value is automatically calculated by the software if you select Use Resolution Dependent Settings on the Basic Settings tab. For more information, see Section 3.1.2, The Resolution-Based Peak Detection Routine. NOTE: If you set Filter Width too high, narrow peaks may not be detected. Hint: If you manually set Filter Width, set to a number equal to the number of points across the peak. To determine the number of points across a peak, you can change the trace display from Line to Vertical Bars. Each vertical bar represents one data point. For more information, see Section 1.4, Customizing the Data Explorer Window. Increment Number of data points the filter moves across. Use 1 for all applications. This value is automatically set to 1 if you enable Use Resolution Dependent Settings on the Basic Settings tab. For more information, see Section 3.1.2, The ResolutionBased Peak Detection Routine. Data Explorer™ Software User’s Guide 3-31 3 Chapter 3 Peak Detection and Labeling 3.2.5 Charge State Determination and Examples NOTE: Isotope-resolved peaks in Voyager data are typically singly charged. See Section 3.7, Default Peak Detection Settings, for recommended settings. This section includes: • Charge state determination • Charge state parameter examples • Charge state determination troubleshooting Isotopes Charge state determination 3 For information on isotopes, see Appendix B, Overview of Isotopes. Charge state is determined by evaluating the relative isotope peak spacing. The expected peak spacing is determined by the Max Charge State, plus or minus a tolerance value. The tolerance is calculated as (proton mass/charge state) × 15%, where proton mass equals 1.007276456. During charge state determination, the software starts with the most intense peak and the peak spacing determined by the Max Charge state, then evaluates all detected peaks. The software iteratively decreases the Max Charge State and repeats the process for all peaks not already identified as members of an isotope cluster. Charge state parameter examples To accurately determine charge state, Charge State parameters must be set appropriately. The following sections illustrate: • • • • 3-32 Applied Biosystems Max Charge State and Max Isotope # set correctly Max Charge State set too low Max Isotope # set too low Effect of Minimum Intensity Peak Detection Max Charge State and Max Isotope # set correctly When the Max Charge State and Max Isotope # are set correctly (in the example shown in Figure 3-7, both are set to 4), the neurotensin 558 m/z isotope cluster contains four peaks at charge state 3. Peaks are 0.33 m/z apart (Figure 3-7). Figure 3-7 Max Charge State and Max Isotope # Set Correctly for Neurotensin Max Charge State set too low When the Max Charge State is set too low, the charge state for all peaks may not be correctly determined. In this example with the Max Charge State set to 2, only the first and fourth peaks are labeled with charge states (Figure 3-8 on page 3-34). This is because the software: • Checks for peaks at 0.5 m/z from each peak (charge state 2 evaluation). • Finds no peaks and checks for peaks at 1 m/z from each peak (charge state 1 evaluation). • Finds one peak pair at 558.3 m/z and 559.3 m/z and labels these peaks as charge state 1. • Does not find a match for peaks at 558.6 m/z or 558.9 m/z, so these peaks are considered to have no calculated charge, and are not labeled with a charge state (Figure 3-8 on page 3-34). Data Explorer™ Software User’s Guide 3-33 3 Chapter 3 Peak Detection and Labeling . Figure 3-8 Max Charge State Set Too Low and Max Isotope # Set Correctly The grouping of the first and fourth peaks into an isotope cluster is apparent when you turn on monoisotopic peak list filtering (Figure 3-9). The software labels the first peak, but removes the mass and charge state labels from the 559.3 m/z peak, indicating that it is part of the 558.3 m/z isotope cluster. 3 Note that turning on monoisotopic peak list filtering does not affect the mass labels on the 558.6 m/z or 558.9 m/z peaks, because these peaks have no calculated charge and are not part of the determined isotope cluster. . Figure 3-9 Max Charge State Set Too Low, Monoisotopic Peak List Filtering Turned On 3-34 Applied Biosystems Peak Detection Max Isotope # set too low If the Max Isotope # is set too low, the software incorrectly groups peaks into different isotope clusters. In this example with the Max Isotope # set to 2 and Max Charge State set to 4, the software labels all peaks as charge state 3 (Figure 3-10). Figure 3-10 Max Isotope # Set Too Low, Max Charge State Set Correctly The effect of setting Max Isotope # too low is apparent when you turn on Monoisotopic peak list filtering. Figure 3-11 shows that the software has grouped the peaks into two clusters and has identified two monoisotopic peaks. Figure 3-11 Max Isotope # Set Too Low, Monoisotopic Peak List Filtering Turned On Data Explorer™ Software User’s Guide 3-35 3 Chapter 3 Peak Detection and Labeling Effect of Minimum Intensity The Minimum Intensity setting on the Advanced Settings tab can also determine how charge states are determined for a peak, because it determines if the software can find a match for a peak. Figure 3-12 illustrates two peaks correctly labeled with charge state 1. Figure 3-12 Minimum Intensity Set Correctly If you increase the Minimum Intensity setting to 85 in the example shown in Figure 3-12, the software cannot determine a charge state for the first peak (Figure 3-13). This is because: 3 • The increased threshold suppresses the detection of the 236.6 m/z peak. • When the software evaluates the peak at 235.6 m/z, it does not find a peak at the appropriate peak spacing for charge state 1, and therefore determines that the peak has no calculated charge. Figure 3-13 Minimum Intensity Set Incorrectly Charge state determination troubleshooting 3-36 Applied Biosystems See Table 9-12, “Charge State and Isotope Determination Troubleshooting—Mariner Only,” on page 9-18. Peak List 3.3 Peak List This section describes: • • • • Displaying the peak list Inserting peaks in the peak list Saving the peak list Sorting, filtering, and printing the peak list 3.3.1 Displaying the Peak List After peak detection, centroiding, and integration, the software creates a peak list for the chromatogram (Mariner data only) and each spectrum in the data file. Displaying To display the peak list, select Output Window from the View menu, then click the Chro Peak List or Spec Peak List tab at the bottom of the window (Figure 3-14). Click the Peak List tab at the bottom of the Output window Figure 3-14 Peak List in Output Window Data Explorer™ Software User’s Guide 3-37 3 Chapter 3 Peak Detection and Labeling Contents of peak list Chromatogram peak list Spectrum peak list 3 3-38 Applied Biosystems The peak lists contain the following information. Each entry represents one chromatographic peak in the trace and includes: • Index, a sequential number assigned to each entry in the peak list • Spectrum # or retention time (minutes), determined by the command selected from the Display menu • Lower bound (spectrum # or minutes) • Upper bound (spectrum # or minutes) • Peak height (calculated relative to zero) • Peak area (calculated relative to local baseline) Each entry represents one spectral peak in the trace and includes: • Index, a sequential number assigned to each entry in the peak list • Centroid or Apex mass (reflects the Mass Type selected in the Peak Label dialog box) • Lower bound (m/z) • Upper bound (m/z) • Charge (z) • Peak height • Relative intensity (calculated relative to zero, not to baseline) • Peak area (calculated relative to local baseline) Peak List 3.3.2 Inserting Peaks in the Peak List Description Procedure If chromatogram or spectrum peaks are not detected and labeled by the selected detection parameters, you can manually detect and label peaks by inserting peaks in the peak list. To insert peaks: 1. Display the chromatogram or spectrum trace of interest. 2. From the Peaks menu, select Insert Peaks. The Insert Peaks dialog box is displayed (Figure 3-15). 3 Figure 3-15 Insert Peaks Dialog Box 3. To enter the Left Edge and Right Edge of the peak to insert, right-click-drag over the region of the trace to calculate, or type in masses. 4. Click Calculate. The peak is inserted in the peak list displayed in the Peak list tab in the Output window, and centroid information is listed in the Result tab. For more information, see “Output window” on page 1-15. Data Explorer™ Software User’s Guide 3-39 Chapter 3 Peak Detection and Labeling Inserted peaks are: • Removed from the list when you close the data file, reprocess the data, or set peak detection parameters so that the inserted peak is no longer detected. • Assigned a charge state of 0 to indicate the charge state is unknown. CAUTION A zero value in the Spec Peak list does not indicate a charge state of zero. It indicates that the software could not determine the charge state. 3.3.3 Saving the Peak List 3 Saving as a stand-alone .PKT file You can save the contents of the chromatogram and spectrum peak lists as stand-alone peak list files (.PKT). Stand-alone peak list files can be used in other applications such as Microsoft Notepad Editor or Microsoft Excel. To save a peak list as a stand-alone .PKT file for use in other applications: 1. Click the trace of interest. 2. Display the peak list of interest in the Output window by clicking the Chro Peak List or the Spec Peak List tab. 3. Right-click the Output window, then select Save As. The Save Peak Table As dialog box is displayed. 4. Select a directory and type a file name. 5. Click Save. The software automatically assigns a .PKT extension and saves the peak list as a tab-delimited text file. 3-40 Applied Biosystems Peak List NOTE: Inserted peaks are included when you save a .PKT file. NOTE: Peak list headings are not included when you save a .PKT file. If you require headings, copy the peak list directly to Excel instead of saving it as a .PKT file and then importing it. Right-click the peak list to copy. Importing and saving in Excel You can import peak list values into Microsoft Excel to create a spreadsheet. To import and save the peak list in Microsoft Excel: 1. In Excel, select Open from the File menu. The Open dialog box is displayed. 2. Select All Files (*.*) from the Files of Type drop-down list at the bottom of the dialog box. Select the directory and file to import, then click Open. The Text Import wizard is displayed. 3. Follow the prompts from the Text Import wizard, accepting the default settings provided. The peak list is converted to an Excel spreadsheet. 4. Select Save As from the File menu. The Save As dialog box is displayed. 5. Select Microsoft Excel Workbook (*.xls) in the Save as Type drop-down list at the bottom of the dialog box. 6. Type a file name or modify the default name (delete quotation marks, if present, and the .PKT extension). 7. Click Save. The file is saved with an .XLS extension. For more information on using Excel, refer to your Microsoft Excel User’s Guide. Data Explorer™ Software User’s Guide 3-41 3 Chapter 3 Peak Detection and Labeling 3.3.4 Sorting, Filtering, and Printing the Peak List Sorting the peak list The peak list is displayed in order by index number. You can sort the list by any field by clicking the column header buttons (Figure 3-16). Click column header buttons to sort by different fields 3 Figure 3-16 Sorting the Peak List Filtering the spectrum peak list Peak list filtering allows you to display only desired peaks in the spectrum peak list. Only peaks that are included in the peak list are labeled on the trace. To filter the peak list: 1. From the Peaks menu, select Filter Peak List. Hint: You can also display the Mass Peak List Filter dialog box by right-clicking the Spec Peak List, then selecting Peak Filter. 3-42 Applied Biosystems Peak List 2. Select Enable Peak List Filter, then select: Filter Type Description Monoisotopic Labels the peak of the lowest detected mass in an isotope envelope. Before applying filtering, set the values in Peak Processing detection parameters to accurately detect and label all peaks in the isotope envelope with the correct charge state. If the parameters are not correctly set to yield correct charge states for all peaks, the monoisotopic peak may not be correctly labeled. See Section 3.2.5, Charge State Determination and Examples, for more information on setting parameters. Monoisotopic filtering is useful on isotope clusters where the approximate elemental composition and isotopic ratios are not known, for example, in PSD analysis (where the precursor ion filtering enhances the precursor ion isotope intensity relative to the rest of the cluster), or in a spectrum that contains molecules with very different elemental compositions. For most applications, especially peptide analysis, the deisotoping function yields more accurate results than monoisotopic peak filtering. See Section 3.4, Deisotoping a Spectrum. Charge State Labels the peaks with the selected charge state (z). If you select a charge state of 0, the software displays mass labels only on peaks for which the software could not determine a charge state. CAUTION: A zero value in the Spec Peak list does not indicate a charge state of zero. It indicates that the software could not determine the charge state. Data Explorer™ Software User’s Guide 3-43 3 Chapter 3 Peak Detection and Labeling Printing the peak list Deleting items from the peak list To print the peak list: 1. Display the peak list as you want it printed. 2. Right-click the peak list, then select Print. To delete an item from the peak list, select the item, right-click the spectrum peak list, then select Delete Peak. The entry is removed from the list, and the peak label is removed from the trace. To display the deleted item in the peak list again, select Peak Detection from the Peaks menu, then click OK. 3 3-44 Applied Biosystems Deisotoping a Spectrum 3.4 Deisotoping a Spectrum This section includes: • • • • • • • • Description Description During peak deisotoping When to use Requirements Using the Deisotope function Troubleshooting Example Returning to the original spectrum The Deisotope function reduces a spectrum to a centroided plot by deconvoluting the monoisotopic peaks from the current peak list. Peak deisotoping is an advanced peak filtering method that can determine the relative abundance of multiple components with overlapping isotope distributions. The deisotoping algorithm uses the elemental composition that you specify to improve the determination of the monoisotopic mass by considering the centroid masses of all peaks in the isotopic envelope. During peak deisotoping For each detected peak in a spectrum, the software inspects the peak list for the higher theoretical masses and areas associated with additional expected peaks in a theoretical isotopic cluster, relative to the peak in question. Data Explorer™ Software User’s Guide 3-45 3 Chapter 3 Peak Detection and Labeling If the expected higher theoretical peak masses and areas are present in the peak list: • The peak in question is considered to be a monoisotopic peak. • The intensities of the higher mass peaks that correspond to the expected isotope ratios are combined with the intensity of the peak in question (additional intensity that may be related to a contaminant or an overlapping isotope envelope is not combined, and will be evaluated in the next iteration). • The peak in question is represented in the trace as a centroid bar with increased amplitude. The total intensity of the centroid bar represents the total area of each fitted cluster. If the expected higher theoretical peak masses and areas are not present in the peak list, the peak in question is represented in the trace as a centroid bar with its original amplitude. 3 Figure 3-17 illustrates how peaks that are and peaks that are not part of an isotope cluster are represented in a deisotoped trace. When to use For most applications, particularly peptide analysis, the deisotoping function yields more useful results than monoisotopic peak filtering (described in Section 3.3.4, Sorting, Filtering, and Printing the Peak List) because the deisotoping function: • Can successfully identify the monoisotopic peaks in overlapping clusters. • Does not consider noise peaks that exhibit the mass, but not the area of an expected isotope peak. • Amplifies the intensity of monoisotopic masses at high m/z (due to contribution from other peaks in the cluster), which allows the peak detection thresholds to eliminate chemical noise without eliminating the high m/z peaks of interest, enables improved peak matching in calibration, and provides better results in database searching (which relies on monoisotopic masses). 3-46 Applied Biosystems Deisotoping a Spectrum Peaks in original trace Deisotoped trace Increased amplitude of first peak indicates it is a monoisotopic peak If first three peaks are part of the same isotope cluster Contribution to expected isotope ratio by contaminant Peak that is not part of cluster Increased amplitude of first peak indicates it is a monoisotopic peak If first three peaks are part of the same isotope cluster, but contaminant is also present Contaminant Peak that is not part of cluster Increased amplitude of peaks indicate they are monoisotopic peaks 3 If two isotope clusters are present Figure 3-17 Interpreting a Deisotoped Trace Requirements The Deisotope function requires a singly charged spectrum. If the spectrum you are examining includes multiply charged peaks, use the Single-Charge Conversion function on the Process menu before using the Deisotope function. For information, see Section 5.10, Converting to a Singly Charged Spectrum (Mariner Data Only). CAUTION If you use the Deisotope function on multiply charged peaks, invalid results are reported. Data Explorer™ Software User’s Guide 3-47 Chapter 3 Peak Detection and Labeling Using the Deisotope function To use the Deisotope function: 1. Display the spectrum trace of interest. 2. Make sure peak detection thresholds are set low enough to detect the monoisotopic peak before deisotoping. If the detection thresholds are not set low enough, adjust them. For information, see Section 3.2.3, Setting Peak Detection Parameters. If you are analyzing digest data, set %Max Peak Area to 0 before deisotoping to ensure that all peaks of interest are detected. For more information, see Section 7.2.3, Detecting Peaks from Complex Digests. 3 3. If multiply charged peaks are present, convert to a singly charged spectrum. See Section 5.10, Converting to a Singly Charged Spectrum (Mariner Data Only). 4. Select Duplicate Active Trace from the Display menu to keep the original data displayed after processing. 5. From the Peaks menu, select Peak Deisotoping. The Deisotoping dialog box (Figure 3-18) is displayed. Figure 3-18 Deisotoping Dialog Box 6. 3-48 Applied Biosystems In the Adduct text box, type the adduct that is the charge-carrying species in the spectrum you are examining. Deisotoping a Spectrum CAUTION If you enter an invalid value in the Adduct field, for example, numbers, the spectrum is still converted to a deisotoped spectrum, and the peak height is proportional to the original peak area. 7. In the Formula text box, type the generic formula (using any elements in the Periodic table) that approximates the isotopic pattern for the compound class you are examining. Generic formulas include: • • • • 8. Peptides—C6H5NO DNA—C38H49N15O24P4 RNA—C38H47N15O28P4 Carbohydrate—C6H12O6 Click OK. The deisotoped spectrum is displayed with a DI trace label. The mass of the vertical bar corresponds to the mass of the monoisotopic peak. The height of the vertical bar is proportional to the peak areas of all peaks in the isotope cluster. Troubleshooting If you see several small peaks around a very large peak after deisotoping, the software has successfully identified a monoisotopic peak, but the isotope cluster does not exactly match the theoretical elemental composition that you specified. This may be caused by the following: • The signal-to-noise ratio of the spectrum is poor and the calculated peak areas are not accurate. • The specified elemental composition is not correct for the compound. For example, if the peptide contains sulfur, and sulfur was not in the specified formula, a small peak may occur 2 Da higher than the expected monoisotopic mass. • There are two overlapping isotope clusters but the intensity of one cluster is stronger than the intensity of the other. Increase the peak detection threshold after deisotoping to remove the residual peaks from the peak list. Data Explorer™ Software User’s Guide 3-49 3 Chapter 3 Peak Detection and Labeling Example Figure 3-19 and Figure 3-20 illustrate the effects of deisotoping. Before deisotoping (Figure 3-19), the spectrum includes an isotope pattern with four detected peaks. Figure 3-19 Spectrum Before Deisotoping After deisotoping (Figure 3-20), the trace includes two labeled centroid bars that represent monoisotopic masses, indicating that the original trace represents two isotopic envelopes. The intensity of a centroid bar is proportional to the area of all peaks in the isotope cluster. 3 Figure 3-20 Spectrum After Deisotoping 3-50 Applied Biosystems Deisotoping a Spectrum Returning to the original spectrum To return to the original spectrum: • If the original spectrum was an unprocessed spectrum, select Spectrum Number from the Display menu. The number of the original spectrum is displayed in the Select Spectrum dialog box. Click OK. • If the original trace was a processed spectrum, select Processing History from the Display menu, then select the original trace. 3 Data Explorer™ Software User’s Guide 3-51 Chapter 3 Peak Detection and Labeling 3.5 Peak Labeling This section includes: • Charge state labels • Setting chromatogram and spectrum peak labels • Setting custom peak labels Factors affecting peak labeling Peak labels are displayed only for detected peaks in the peak list (displayed in the Output window). Thresholds for peak labeling are set independent of peak detection. Peaks listed in the peak list are determined by: • Peak detection parameters, described in Section 3.6, Process that Occurs During Peak Detection, Centroiding, and Integration • Charge state determination, described in Section 3.2.5, Charge State Determination and Examples 3 • Peak list filtering, described in “Filtering the spectrum peak list” on page 3-42 NOTE: If peak labeling is disabled, no labels are displayed, even for peaks in the peak list. If you delete a peak from the peak list, it is not labeled. Labeling peaks manually 3-52 Applied Biosystems If peak detection settings do not detect and label desired peaks, you can also manually label peaks by inserting them into the peak list. See Section 3.3.2, Inserting Peaks in the Peak List. Peak Labeling 3.5.1 Charge State Labels Charge state labels A unique feature of the Data Explorer software is the ability to label multiply charged isotope peaks with their charge state. In general, the observed spacing between isotopes is determined by the charge state of the detected ion. Spacing between isotope peaks is narrower at higher charge states. For more information on isotopes, see Appendix B, Overview of Isotopes. To determine charge state, the software uses the following charge state determination parameters: • Max Charge State • Max Isotope # • Min and Max Intensity For a description of these parameters, see “Advanced Settings (spectrum data only)” on page 3-28 and “Charge State Determination and Examples” on page 3-32. 3 NOTE: If Charge State Determination parameters are set incorrectly, the charge state is determined incorrectly. For more information, see “Charge state parameter examples” on page 3-32 and “Charge State and Isotope Determination Troubleshooting—Mariner Only” on page 9-18. Requirements To label isotope peaks with charge states, the following must be true: • Mass must be within the range in which the system can resolve the isotope peaks: • <4,000 Da on a Mariner system • <5,000 Da on a Voyager-DE PRO system • <6,000 Da on a Voyager-DE STR system Data Explorer™ Software User’s Guide 3-53 Chapter 3 Peak Detection and Labeling • Isotopes must be resolved • Peak detection parameters must be set to detect all of the peaks in the isotope cluster • Charge determination parameters must be set appropriately • Charge state labels must be enabled 3.5.2 Setting Chromatogram and Spectrum Peak Labels This section includes: • • • • • • 3 Customizing colors, font, and size Setting chromatogram labels Customizing colors, font, or size Setting chromatogram labels Setting spectrum labels Deleting labels Labels not displayed Charge state not displayed To set colors, font, and size for peak labels, see Section 1.5, Setting Graphic Options. To label chromatogram peaks: 1. Click the Chromatogram window to activate it. 2. From the Peaks menu, select Peak Label. The Chromatogram Peak Label dialog box is displayed (Figure 3-21). 3-54 Applied Biosystems Peak Labeling Figure 3-21 Chromatogram Peak Label Dialog Box 3. Select Enable Labeling. 4. Set the number of decimal points to be displayed. 5. Select Label Attributes: • Overlapping—Allows labels to be displayed when peaks are close together. • Peak bounds—Displays peak start, peak end, and baseline. • Orientation—Specifies Horizontal, 45-degree, or Vertical labels. 6. Select the label content to display, (for example, Spectrum #, Time, Vial Number). 7. To create custom labels, select User Labels, then click User Label Setup. See Section 3.5.3, Setting Custom Peak Labels. Data Explorer™ Software User’s Guide 3-55 3 Chapter 3 Peak Detection and Labeling 8. Click OK. The trace is displayed. The detected peaks that meet the peak labeling criteria are labeled. Setting spectrum labels To label spectrum peaks: 1. Click the Spectrum window to activate it. 2. From the Peaks menu, select Peak Label. The Spectrum Peak Label dialog box is displayed (Figure 3-22). 3 Figure 3-22 Spectrum Peak Label Dialog Box 3-56 Applied Biosystems 3. Select Enable Labeling to label peaks in m/z format. 4. Set the number of decimal points to be displayed. Peak Labeling Label Mass 5. Select the Mass Type (peak apex or peak centroid). 6. Select the Peak Mass Label Type: Description Labels with Apex or Centroid mass. NOTE: If you create a custom user label for a mass, the user label is displayed instead of the mass. For more information, see Section 3.5.3, Setting Custom Peak Labels. Mass difference from the selected peak NOTE: This label was previously called Mass Offset. Mass difference between adjacent peaks Shifts all peak labels by the value entered (either positive or negative) and can be used to calculate mass differences from a reference peak. Right-click-drag across the reference peak to enter the negative of the value of the peak in the Mass difference text box, then click OK. The reference peak is labeled with zero, and all the other labels are plus or minus their mass difference from the reference peak. This label is useful to display neutral losses and adducts on a given peak. Labels peaks with a mass relative to the adjacent labeled peak of lower m/z. Data Explorer™ Software User’s Guide 3-57 3 Chapter 3 Peak Detection and Labeling 7. Select label attributes: • Overlapping—Allows labels to be displayed when peaks are close together. • Peak bounds—Displays peak start, peak end, and baseline. • Orientation—Specifies Horizontal, 45-degree, or Vertical labels. 8. Select label content to be displayed in addition to m/z: • Area—Integrated area of peak, displayed with an “A” label. • Charge State—Charge state of peak, displayed with a “z” label, where the “z” represents a positive or negative charge. 3 NOTE: A “z” is displayed for positive or negative ions. To determine the actual charge of the ions, display the Instrument Setting tab in the Data Explorer Output window. See “Output window” on page 1-15 for information. Check the listed polarity. For spectra acquired in positive ion mode, positive ions are produced. For spectra acquired in negative ion mode, negative ions are produced. 9. 10. To create custom labels, select User Labels, then click User Label Setup. See Section 3.5.3, Setting Custom Peak Labels. Click OK. The trace is displayed. 3-58 Applied Biosystems Peak Labeling If peak list filtering is enabled, only the detected peaks that meet the peak filtering criteria are labeled according to the peak label settings. Otherwise, all detected peaks are labeled according to the peak label settings. See Section 3.2.4, Peak Detection Parameter Descriptions, and “Filtering the spectrum peak list” on page 3-42. Deleting labels Labels not displayed To delete a peak label from the trace, click the Spec Peak List tab in the Output window, select the item, right-click the spectrum peak list, then select Delete Peak. If a label is not displayed or is displayed incorrectly, possible causes are: • The label is too long, peaks are too close together, or a peak is very close to the right axis. If there is not enough room for the label to be displayed, the label is suppressed. Zooming the region of interest expands the trace and may allow the labels to display. To display labels when peaks are close together, select Allow overlapping peak labels in the Peak Label dialog box. • Peak filtering is enabled, labeling only peaks that meet the peak list filtering criteria. • Filter Width is set too high to detect the peak. Data Explorer™ Software User’s Guide 3-59 3 Chapter 3 Peak Detection and Labeling Charge state not displayed If no charge is displayed, there are a few possible causes: • Peaks are more than 1 Da apart. • Filter width is set too high to detect other isotope peaks. • The maximum charge state for charge state determination is set lower than the charge state of the peak. • Charge state determination parameters are set such that peaks are determined to have no charge. See Section 3.2.5, Charge State Determination and Examples. • Peaks are not from the same isotope species. NOTE: If you set %Base Peak Intensity or %Max Peak Area too low (described on page 3-20), noise peaks can be detected, and charge states can be incorrectly labeled. 3 3-60 Applied Biosystems Peak Labeling 3.5.3 Setting Custom Peak Labels This section includes: • • • • • • Description Description Customizing colors, font, and size Creating custom peak labels Applying user labels from .LBC or LBS files Displaying user labels User labels not displayed A custom peak label displays the label name you enter. If you specify a custom label for a spectrum, it is displayed instead of the mass value. Customizing colors, font, and size To set colors, font, and size for custom labels or peak labels, see Section 1.5, Setting Graphic Options. Creating custom peak labels To create custom peak labels: 1. Click the Chromatogram or Spectrum window to activate it. 2. From the Peaks menu, select Peak Label. 3 The Peak Label dialog box is displayed (see Figure 3-22 on page 3-56). 3. Click User Label Setup. The User Label Setup dialog box appears (Figure 3-23). NOTE: The Chromatogram User Label Setup dialog box displays X Value and X Tolerance instead of Peak Mass and Mass Error. Data Explorer™ Software User’s Guide 3-61 Chapter 3 Peak Detection and Labeling Column header buttons Figure 3-23 User Label Setup Dialog Box 3 4. Select the Label Type (spectra only): • Mass—Labels with Apex or Centroid mass. • Mass difference from adjacent peaks—Applies the labels to peaks that have the specified mass difference relative to the adjacent labeled peak of lower m/z. 5. Select Match Charge State (spectra only) if you want the charge state of a peak evaluated before applying the user label. When this function is enabled, a peak must occur within the specified Mass Tolerance (described below), and have the specified charge state before the user label is applied. Hint: The Match Charge State function allows you to screen out peaks that are within the specified Mass Tolerance, but are not the charged species you are interested in. 3-62 Applied Biosystems Peak Labeling 6. To manually enter label settings, click . The User Label Entry dialog box is displayed (Figure 3-24). Figure 3-24 User Label Entry Dialog Box (Spectrum) 7. Set the following parameters: 3 Spectrum Parameter Description/Specifies Label Text of the label to display. Peak Mass (if Label Type selected is Mass) Mass of the peak to which the label applies. Mass Difference (if Label Type selected is Difference) Difference in mass that must exist between peaks to apply user labels. Mass Tolerance Mass tolerance that the peak must occur within to apply user labels. NOTE: If a peak meets the criteria for more than one user label, multiple user labels are applied to the peak and are separated by commas. Charge State Charge state that the peak must have in order to apply user labels. Data Explorer™ Software User’s Guide 3-63 Chapter 3 Peak Detection and Labeling Chromatogram Parameter Description Label Text of the label to display. X Value Retention time or Spectrum Number of the peak to label. The default units for X Tolerance correspond to the units of the x-axis. X Tolerance Retention time or Spectrum Number that the peak must fall within to apply user labels. To enter Peak Mass, X Value, or Mass Difference, you can type values or right-click-drag over a peak. A Mass Tolerance or X Tolerance of 1 is automatically entered when you right-click-drag. Charge state is also automatically entered when you right-click-drag a spectrum peak. 3 8. Click OK. The User Label Setup dialog box reappears. 9. To change any information, double-click the Label field in the User Label Setup dialog box. The User Label Entry dialog box for the label opens. Enter the new values, then click OK. Hint: You can sort the label list by any field by clicking the column header button (see Figure 3-23 on page 3-62). 10. To save the label settings as a .LBC or .LBS file, click Save As, type a file name, then click Save. 11. Click OK. The Peak Label dialog box reappears. 3-64 Applied Biosystems Peak Labeling Applying user labels from .LBC or .LBS files You can apply labels you previously created and saved in .LBC or .LBS files. Open the .LBC or .LBS file by clicking in the User Label Setup dialog box. Select the file, then click Open. The labels are imported into the .DAT file and displayed in the label list. You can modify the settings, delete or add labels, and save the changes in a new .LBC or .LBS file. NOTE: Changes you make to user labels imported into a .DAT file are not saved in the .LBC or .LBS file from which they originated. Click Save As, then resave the file if you want the changes saved to the originating file. Displaying user labels Select both Enable Labeling and User Labels in the Peak Label dialog box to display user labels. Peaks that do not meet the peak detection criteria are not labeled. NOTE: If you specify user labels with an X Tolerance that is outside the acquisition range for the data file, the user labels are not displayed. Be aware that the default X Tolerance of 1 may be outside the acquisition range when the chromatogram is displayed in retention time. Data Explorer™ Software User’s Guide 3-65 3 Chapter 3 Peak Detection and Labeling User labels not displayed If a user label is not displayed or is displayed incorrectly, possible causes are: • User labels are not enabled. • The peak does not fall within the specified Tolerance. • The label is too long or peaks are too close together. If there is not enough room for the label to be displayed, the label may be suppressed. Zooming the region of interest expands the trace and may allow the labels to be displayed. To display labels when peaks are close together, select Allow overlapping peak labels, or change Orientation to Vertical or 45 degrees in the Peak Label dialog box. • Peak filtering is enabled, and only peaks that meet the peak list filtering criteria are labeled. • Filter Width is set too high to detect the peak. 3 • If you have Match Charge State enabled for spectrum user labels, the peak of interest does not have the charge state specified in the user label. 3-66 Applied Biosystems Process that Occurs During Peak Detection, Centroiding, and Integration 3.6 Process that Occurs During Peak Detection, Centroiding, and Integration This section gives an overview of the process that occurs during peak detection, centroiding and integration. Parameters are defined in detail in Section 3.2.4, Peak Detection Parameter Descriptions. Peak detection During peak detection, the Data Explorer software: • Divides the trace into detection ranges based on the number of data points per peak (described in Section 3.1.2, The Resolution-Based Peak Detection Routine). • Starts scanning the chromatogram or spectrum at the origin of the x-axis. • Applies a Gaussian sliding filter to the number of raw data points defined by the Filter Width setting. The filter moves across the raw data by the number of data points specified by the Increment parameter. An Increment of 1 is used for chromatogram data. • Searches for an upward-to-downward inflection point greater than the larger of the two specified peak detection thresholds (% Base Peak Intensity or Minimum Intensity). A Minimum Intensity of 2 is used for chromatogram data. This inflection point defines the apex region. • After the apex region is identified, scans to find the downward-to-upward inflection points. These downward to upward inflection points are the valley regions of the peak. Data Explorer™ Software User’s Guide 3-67 3 Chapter 3 Peak Detection and Labeling • For spectral data, determines the peak boundaries by one of two means: • If the Noise Threshold is greater than zero, the software scans from the valley regions toward the apex region using the number of data points defined by the Filter Width. If the difference between two consecutive filtered regions is greater than the Noise Threshold, the midpoint of the filter region closest to the apex is used as the peak bound. • If the Noise Threshold is zero, the software scans the valley regions for the minimum points to determine the peak bounds. For chromatogram data, determines the peak boundaries by: • Determining the Noise Threshold by performing an automatic signal-to-noise calculation on the tallest peak in the chromatogram and using 75 percent of the noise value determined as the threshold. 3 • Scanning from the valley regions toward the apex region using the number of data points defined by the Filter Width. If the difference between two consecutive filtered regions is greater than the Noise Threshold, the midpoint of the filter region closest to the apex is used as the peak bound. • Compares the area of the new peak to the %Max Peak Area and the Minimum Area. A Minimum Area of 2 is used for chromatogram data. If the new peak is within the specified area settings, the peak is added to the peak list. 3-68 Applied Biosystems Process that Occurs During Peak Detection, Centroiding, and Integration After peak detection After peaks are detected: • Centroid mass is calculated for spectral data, then modified by Gaussian peak fitting, if it is selected. • Chromatographic and spectral peaks are integrated. • Peak lists are generated for chromatograms and spectra. Centroiding The Data Explorer software calculates the peak centroid for spectral data by: • Drawing a projected centroid baseline at the percentage of the peak height specified by the Centroiding% entered. Centroiding is measured between the top of the peak and 0. For example, a centroiding% of 10 uses the top ten percent of the peak, where peak height is determined from 0. • Searching to the left and right of the apex for data points that bound the projected centroid baseline, then interpolating the centroid baseline. • Calculating the intensity-weighted area of the peak from the left to the right intersection of the centroid baseline, then dividing by the area of the same region. Data Explorer™ Software User’s Guide 3-69 3 Chapter 3 Peak Detection and Labeling Integration The Data Explorer software integrates chromatographic and spectral peaks to calculate the peak area using one of two methods to determine the peak baseline (Figure 3-25): • Valley-to-baseline—Drops a vertical line from all valleys to a horizontal baseline. The level of the horizontal baseline is determined using the minimum peak valley point (left or right) for each peak. • Valley-to-valley—Forces a baseline to all valley points. 3 Valley-to-Baseline Valley-to-Valley Figure 3-25 Valley-to-Baseline and Valley-to-Valley Integration 3-70 Applied Biosystems Default Peak Detection Settings 3.7 Default Peak Detection Settings This section includes: • Default .SET files provided • Additional Voyager .SET files provided Default .SET files provided Default peak detection settings are contained in the following .SET files: • • • • MARINER.SET VOYAGERLINEAR.SET VOYAGERREFLECTOR.SET VOYAGERPSD.SET The following table lists the default settings in .SET files provided for chromatograms. Parameter Chromatogram Settings in All .SET Files (Mariner and Voyager) Basic Settings (chromatogram data) Detection Range Full %Base Peak Intensity 0.25 %Max Peak Area 0.25 Filter Width 3 Integration Baseline Setting V-to-B Data Explorer™ Software User’s Guide 3-71 3 Chapter 3 Peak Detection and Labeling The following table lists the default settings in the .SET files provided for spectra. Parameter Voyager Spectrum Mariner Reflector Spectrum Linear PSD VOYAGER MARINER.S VOYAGER VOYAGER REFLECTOR ET LINEAR.SET PSD.SET .SET Basic Settings (spectrum data) 3 %Base Peak Intensity 0.25 0 0 0 %Max Peak Area 0.25 2 2 2 Use Resolution Dependent Settings ON ON ON OFF Mass Resolution 5,000 2,000 10,000 N/A Integration Baseline Setting V-to-V V-to-B V-to-B V-to-B Centroid% 50 50 50 50 Max. Charge State 6 1 1 1 Max. Isotopes# 6 5 10 5 Min. Intensity% 5 10 10 10 Max. Intensity% 100 100 100 100 Peak Processing 3-72 Applied Biosystems Default Peak Detection Settings Parameter Voyager Spectrum Mariner Reflector Spectrum PSD Linear VOYAGER MARINER.S VOYAGER VOYAGER REFLECTOR ET PSD.SET LINEAR.SET .SET Advanced Detection Range Resolution dependent Resolution dependent Resolution dependent Five ranges Filter Width Resolution dependent Resolution dependent Resolution dependent Range dependent Increment Resolution dependent 1 1 1 Noise Threshold 0 0 0 0 %Base Peak Intensity 0.25 0 0 0 %Max Peak Area 0.25 2 2 2 Min. Intensity 0 0 0 0 Min. Area 0 0 0 Range dependent Additional Voyager .SET files provided 3 Additional .SET files that have been developed for detection of different types of data are included in the C:\VOYAGER\SETTINGS directory. The names of the .SET files indicate the type of data the files can be used for. Data Explorer™ Software User’s Guide 3-73 Chapter 3 Peak Detection and Labeling 3 3-74 Applied Biosystems Chapter 4 Examining Chromatogram Data 4 This chapter contains the following sections: 4.1 Overview ......................................................... 4-2 4.2 Creating an Extracted Ion Chromatogram ........ 4-5 4.3 Creating an Extracted XAC Chromatogram (Mariner Data Only) ....................................... 4-13 4.4 Noise Filtering/Smoothing .............................. 4-17 4.5 Adding and Subtracting Spectra .................... 4-20 4.6 Displaying MS Method Data (Mariner Data Only) ........................................ 4-23 4.7 Adjusting the Baseline ................................... 4-27 4.8 Using UV Trace Offset ................................... 4-30 Data Explorer™ Software User’s Guide 4-1 Chapter 4 Examining Chromatogram Data 4.1 Overview This section includes: • • • • Types of Mariner data Select Types of Mariner data Types of Voyager data Creating macros to combine processing functions Returning to the original trace You can display different types of chromatogram traces from Mariner data files by selecting Traces from the Display menu with the Chromatogram window displayed, then selecting: To display TIC Total Ion Chromatogram, which includes the entire mass range saved in the data file. Each data point represents the sum of all ion intensities in the corresponding spectrum. BPI Base Peak Intensity trace, which includes only the base peak in each spectrum. Each data point represents the single most intense ion in the corresponding spectrum. Analog Trace of the input from an outside source representing any signal that changes over time, for example, the UV signal from an LC system, or the Analyzer Temperature, Air Temperature, Spray Tip Potential, or Nozzle Temperature from the Mariner mass spectrometer. DAD TAC Diode Array Detector (DAD) Total Absorbance Chromatogram (TAC), which displays data acquired from LC samples. 4 Hint: To display spectra for DAD data, double-click the TAC or Ch Absorbance trace. DAD Channel N Diode Array Detector Channel chromatograms, which display specific wavelength ranges, where N is the channel number set during acquisition. The data file can include up to five channels. Hint: To display spectra for DAD data, double-click the TAC or Ch Absorbance trace 4-2 Applied Biosystems Overview You can display extracted chromatograms from Mariner data files by selecting the Process menu with a Chromatogram window displayed, then selecting: Select To display Extracted Ion— Center Window or Range Extracted Ion Chromatogram (XIC), which includes only the signal response from a mass window or range. For more information, see Section 4.2.1, Creating an Extracted Ion Chromatogram (XIC). Extracted Ion— Neutral Loss Constant Neutral Loss chromatogram, which extracts only the response from peaks that are separated by a selected mass difference. For more information, see Section 4.2.2, Creating a Constant Neutral Loss (CNL) Chromatogram. Extracted Absorbance (XAC) Extracted Absorbance Chromatogram, which includes only the response from a specified wavelength window or range. For more information, see Section 4.3, Creating an Extracted Absorbance Chromatogram (XAC) (Mariner Data Only). Types of Voyager data Voyager chromatograms can optionally be displayed for multispectrum .DAT files. To display a Voyager chromatogram, select Restore Chromatogram from the View menu. For more information, see Section 2.1.3, Displaying Voyager Chromatograms. If you have a chromatogram displayed, you can display the following type of Voyager data by selecting Traces from the View menu, then selecting: Select TIC To display Total Ion Chromatogram, which includes the entire mass range saved in the data file. Each data point represents the sum of all ion intensities in the corresponding spectrum. Data Explorer™ Software User’s Guide 4-3 4 Chapter 4 Examining Chromatogram Data You can display the following types of Voyager data by selecting Extracted Ion from the Process menu with a Chromatogram window displayed, then selecting: Select To display Center Window or Range (XIC) Extracted Ion chromatogram, which includes only the response from a mass window or range. For more information, see Section 4.2.1, Creating an Extracted Ion Chromatogram (XIC). Neutral Loss (CNL) Constant Neutral Loss Chromatogram, which extracts only the response from a mass difference from a selected peak. For more information, see Section 4.2.2, Creating a Constant Neutral Loss (CNL) Chromatogram. Creating macros to combine processing functions You can create macros that perform multiple functions (for example, smooth and baseline-correct), then start the macro with one mouse click. Returning to the original trace Many processing functions generate a new trace. If you have Trace Replace mode set to Replace, the new trace replaces the original trace. For information on Replace mode, see Section 2.4.4, Adding Traces from the Same Data File to a Window. 4 For information, see Section 6.7, Using the Macro Recorder. To redisplay the original trace, select the trace type from the Display menu or click the corresponding toolbar button. 4-4 Applied Biosystems Creating an Extracted Ion Chromatogram 4.2 Creating an Extracted Ion Chromatogram This section includes: • Creating an Extracted Ion Chromatogram (XIC) • Creating a Constant Neutral Loss (CNL) Chromatogram You can create an extracted ion chromatogram: • To improve the signal-to-noise ratio for a mass or mass range of interest • To determine if mass differences in a data file correspond to loss of specific fragments by generating a Neutral Loss Chromatogram 4.2.1 Creating an Extracted Ion Chromatogram (XIC) This section describes how to create an XIC: • From the Chromatogram window • From the Spectrum window From the Chromatogram window 4 To create an extracted ion chromatogram (XIC) from the Chromatogram window: 1. Click the Chromatogram window to activate it. 2. Select Duplicate Active Trace from the Display menu to keep the original data displayed after processing. 3. From the Process menu, select Extracted Ion or click in the toolbar. Data Explorer™ Software User’s Guide 4-5 Chapter 4 Examining Chromatogram Data 4. In the Extracted Ion Chromatogram dialog box (Figure 4-1 on page 4-7), select one of the following from the Mass Range/Difference Type drop-down list: • Center/Window, then type the mass of interest and the mass window for masses to include. NOTE: When analyzing multiple components with similar masses, set a Window of less than 0.5 to include only the mass of interest. • Range, then type the From and To values for masses to include. NOTE: To improve the signal-to-noise ratio in the extracted ion chromatogram, set the starting range above the low-mass solvent ions. NOTE: For more information on Constant Neutral Loss chromatograms, see Section 4.2.2, Creating a Constant Neutral Loss (CNL) Chromatogram. 4 4-6 Applied Biosystems Creating an Extracted Ion Chromatogram Figure 4-1 Extracted Ion Chromatogram Dialog Box 5. 6. Specify the Extraction Mode: • Accumulative—Creates one extracted ion chromatogram for all masses entered and sums intensities • Individual—Creates one extracted ion chromatogram for each mass entered 4 Click OK. The extracted ion chromatogram is displayed in the Chromatogram window (Figure 4-2 on page 4-8) with an XIC trace label and the center mass and window or the mass range indicated in the trace label Data Explorer™ Software User’s Guide 4-7 Chapter 4 Examining Chromatogram Data From the Spectrum window To create an extracted ion chromatogram for a mass range from the Spectrum window: 1. Click the Chromatogram window to activate it. 2. Select Duplicate Active Trace from the Display menu to keep the original data displayed after processing. 3. In the Spectrum window, right-click-drag over the mass region of interest in the extracted ion chromatogram. The width of the box you draw defines the precise mass range used in the extracted ion chromatogram. The extracted ion chromatogram is displayed in the Chromatogram window (Figure 4-2) with the mass range indicated in the trace label. Extracted ion chromatogram (center window) 4 Figure 4-2 Extracted Ion Chromatogram 4. 4-8 Applied Biosystems To return to the original trace, see “Returning to the original trace” on page 4-4. Creating an Extracted Ion Chromatogram 4.2.2 Creating a Constant Neutral Loss (CNL) Chromatogram This section includes: • • • • • Overview Overview Applications Labeling spectrum peaks with mass difference (optional) Procedure Example To rapidly screen for the presence of mass differences corresponding to loss of specific fragments, you can create a Constant Neutral Loss (CNL) extracted chromatogram. When you generate a Constant Neutral Loss Extracted ion chromatogram, the software constructs a chromatogram that contains signal only for spectra that contain peaks separated by the specified mass difference. To construct a Neutral Loss Extracted ion chromatogram, the software: • Compares each mass in the peak list to every other mass in the peak list and derives mass differences. • Takes the total signal of any pairs of peaks that generated the mass difference and includes it in the chromatogram, if any mass difference corresponds to a mass difference plus tolerance specified. Applications 4 You can generate a CNL extracted chromatogram: • To determine if a fragment of known mass is present • To increase sensitivity of a trace by including signal from both the parent and one or more fragment ions For LCMS data, a CNL extracted chromatogram is useful to identify eluting components with a given neutral loss. For other types of data, a CNL extracted chromatogram is useful to screen samples for a given mass difference. For example, create a CNL extracted chromatogram to survey a peptide digest for the presence of peaks separated by a glycosyl residue, as you might see in a digest containing glycopeptides. Data Explorer™ Software User’s Guide 4-9 Chapter 4 Examining Chromatogram Data Labeling spectrum peaks with mass difference (optional) You can label spectrum peaks with mass differences to assist you in determining the mass differences to specify in the CNL extracted chromatogram. To label spectrum peaks with mass differences: 1. Display a spectrum of interest from the data file for which you are creating the CNL extracted chromatogram. 2. Click the Spectrum window to activate it, then select Peak Label from the Peaks menu. 3. In the Peak Mass Label Type, select Mass difference from the selected peak. 4. In the Spectrum window, right-click-drag across the peak from which you are measuring the difference. This enters a negative value that corresponds to the reference peak in the text box. 5. Click OK. The reference peak is labeled with zero, and all the other peak labels are plus or minus their mass difference from the reference peak. For more information on peak labels, see Section 3.5, Peak Labeling. Procedure 4 To create a CNL extracted chromatogram: 1. Click the Chromatogram window to activate it. 2. Select Duplicate Active Trace from the Display menu to keep the original data displayed after processing. 3. From the Process menu, select Extracted Ion or click in the toolbar. The Extracted Ion Chromatogram dialog box appears (Figure 4-3). 4. 4-10 Applied Biosystems In the Mass Range/Difference Type field select Neutral Loss. Creating an Extracted Ion Chromatogram 5. Type in the Mass Difference and Tolerance. NOTE: Do not right-click-drag across a peak in the Spectrum window to select the mass difference. Figure 4-3 Extracted Ion Chromatogram Dialog Box with Neutral Loss Selected 6. Specify the Extraction Mode: • Accumulative—Creates one extracted ion chromatogram for all mass differences entered and sums intensities • Individual—Creates one extracted ion chromatogram for each mass difference entered 7. Click OK. The CNL is displayed in the Chromatogram window (Figure 4-5). Data Explorer™ Software User’s Guide 4-11 4 Chapter 4 Examining Chromatogram Data Example Figure 4-4 shows a TIC that contains three flavonoid compound peaks. To determine if the diglycosyl group has fragmented from the parent ion in any of these compounds, you can generate a CNL extracted chromatogram. Figure 4-4 TIC for Flavonoid Mixture Containing Three Peaks Figure 4-5 shows a CNL extracted chromatogram generated for mass difference of 308.146 m/z which corresponds to the diglycosyl group. 4 Figure 4-5 CNL Containing Two Peaks The CNL extracted chromatogram contains only two peaks, indicating that the diglycosyl group has fragmented from the parent ion in the first two compounds only. 4-12 Applied Biosystems Creating an Extracted Absorbance Chromatogram (XAC) (Mariner Data Only) 4.3 Creating an Extracted Absorbance Chromatogram (XAC) (Mariner Data Only) This section describes how to create an Extracted Absorbance chromatogram (XAC) for DAD Mariner data: • From the Chromatogram window • From the Spectrum window From the Chromatogram window To create an extracted absorbance chromatogram (XAC) for a selected wavelength window or range: 1. Click the Chromatogram window to activate it. 2. Display a TAC or Channel chromatogram by selecting Traces from the View menu, then selecting the chromatogram. 3. Select Duplicate Active Trace from the Display menu to keep the original data displayed after processing. 4. Select Extracted Absorbance from the Process menu or click 5. in the toolbar. In the Extracted DAD Chromatogram dialog box (Figure 4-6), click one of the following: 4 • Center/Window, then enter the wavelengths of interest (from 190 nm to 950 nm) and the window for wavelengths to include. • Range, then enter the From and To values for wavelengths from 190 nm to 950 nm. Data Explorer™ Software User’s Guide 4-13 Chapter 4 Examining Chromatogram Data Figure 4-6 Extracted Absorbance Chromatogram Dialog Box 6. 4 7. Specify the Extraction Mode: • Accumulative—Creates a single trace combining intensities of all specified wavelengths • Individual—Creates one trace for each specified wavelength Click OK. The extracted absorbance chromatograms are displayed in the Chromatogram window with an XAC trace label. 4-14 Applied Biosystems Creating an Extracted Absorbance Chromatogram (XAC) (Mariner Data Only) From the Spectrum window To create an extracted absorbance chromatogram for a wavelength range from the Spectrum window: 1. Click the Chromatogram window to activate it. 2. From the Display menu, select Traces, then select a DAD TAC or DAD Channel chromatogram. The TAC or Sig Absorbance trace appears in the Chromatogram window. 3. Select Duplicate Active Trace from the Display menu to keep the original data displayed after processing. 4. Double-click the left mouse button or right-click-drag over an area of interest in the Chromatogram window. A DAD Spectrum appears in the Spectrum window. 5. Click the Spectrum window to activate it. 6. In the Spectrum window, right-click-drag over the region of interest. The width of the box you draw defines the precise wavelength range used in the extracted absorbance chromatogram. The extracted absorbance chromatogram is displayed in the Chromatogram window (Figure 4-7) with an XAC trace label and the center mass and window, or the mass range indicated in the trace label. 4 Data Explorer™ Software User’s Guide 4-15 Chapter 4 Examining Chromatogram Data Figure 4-7 Extracted Absorbance Chromatogram 7. 4 4-16 Applied Biosystems To return to the original trace, see “Returning to the original trace” on page 4-4. Noise Filtering/Smoothing 4.4 Noise Filtering/Smoothing Description The Noise Filter/Smooth command provides three options for reducing noise in chromatogram traces: • Noise filter • Smooth by the Gaussian method • Noise removal Procedure To noise filter or smooth a chromatogram trace: 1. From the Process menu, select Noise Filter/Smooth. The Noise Filter/Smooth dialog box (Figure 4-8) is displayed. Figure 4-8 Noise Filter/Smooth Dialog Box 4 Data Explorer™ Software User’s Guide 4-17 Chapter 4 Examining Chromatogram Data 2. Type of Data Higher resolution data Select the method to use based upon the type of data you are examining, then enter the associated value displayed for the method you select: Suggested Method Noise Filter (NF) (May affect peak resolution.) Higher molecular weight data 4 Gaussian Smooth (SM) (May affect peak resolution.) 4-18 Applied Biosystems Description Specify a Correlation Factor of 0 to 1.0. Settings from 0.5 to 0.7 yield acceptable results for most data. A setting close to 1.0 yields a higher degree of noise reduction. If applying the Noise Filter with a certain Correlation Factor does not yield the necessary noise removal, return to the original trace (see “Returning to the original trace” on page 4-4) and apply the Noise Filter again with a higher Correlation Factor setting. Applying the filter more than one time with the same Correlation Factor setting does not improve noise removal. Specify a Filter Width in data points (odd integers only). The maximum number of smoothing points is 2001. Points less than 1 Filter Width from the edge of the spectrum are not smoothed. Noise Filtering/Smoothing Type of Data High-resolution data Suggested Method Noise Removal (NR) (Does not affect peak resolution.) Description Specify the number of standard deviations of noise to remove. The software automatically calculates the average white noise for all frequencies across the spectrum, then removes the specified number of standard deviations of noise. This method slightly affects peak intensity, and removes peaks with a signal-to-noise ratio less than the specified standard deviation. In general: If you set Std Dev to: % White Noise removed is: 1 68 2 95 3 99 If applying Noise Removal with a certain Std Dev does not yield the necessary noise removal, return to the original trace (see “Returning to the original trace” on page 4-4) and apply the Noise Removal again with a higher Standard Deviation setting. Applying the Noise Removal more than one time with the same Standard Deviation setting will not improve noise removal. 3. Click OK. The trace is displayed with an NF, SM, or NR trace label. 4. To return to the original trace, see “Returning to the original trace” on page 4-4. Data Explorer™ Software User’s Guide 4-19 4 Chapter 4 Examining Chromatogram Data 4.5 Adding and Subtracting Raw Spectra Within a Data File Use the Add/Subtract Spectra command to manipulate raw spectra within a single data file. NOTE: To manipulate processed spectra, spectra from different data files, or spectra acquired under slightly different instrument calibrations, use Trace Arithmetic. For more information, see Section 5.12, Adding and Subtracting Raw or Processed Spectra from the Same or Different Data Files (Dual Spectral Trace Arithmetic). Adding and subtracting spectra To add and subtract spectra: 1. Click the Spectrum window to activate it. 2. Select Duplicate Active Trace from the Display menu to keep the original data displayed after processing. 3. From the Process menu, select Add/Subtract Spectra. The Add and Subtract Spectra dialog box is displayed (Figure 4-9). 4 4-20 Applied Biosystems Adding and Subtracting Raw Spectra Within a Data File Figure 4-9 Add and Subtract Spectra Dialog Box . 4. Select spectra to add by doing one of the following: • Right-click-drag the area of the trace in the Chromatogram window. The numbers of the selected spectra are added to the list window. A range of spectrum numbers is indicated as X:X. For example, 10:20 indicates spectrum number 10 through spectrum number 20. • Click , type the spectrum number range to add, for example 10:20, then press Enter. Hint: To sum non-contiguous regions of spectra, repeat step 4. For example, you can add spectra 10 to 20 and spectra 30 to 40 to the list window. 5. Click in the Spectra To Be Subtracted list box. Data Explorer™ Software User’s Guide 4-21 4 Chapter 4 Examining Chromatogram Data NOTE: Before you can subtract spectra, you must first specify spectra to be added. 6. Select spectra to subtract as described in step 4. 7. Select the Add/Subtract mode: • Average—Spectra in each list are averaged before the addition or subtraction occurs. • Accumulate—Spectra in each list are summed before the addition or subtraction occurs. NOTE: If you select Accumulate mode, include at least the same number of spectra in the Subtract range that you include in the Add range. For example, if you include spectra 775 to 794 in the Add range, make sure to include 20 or more spectra in the Subtract range. 8. Click OK. The subtracted baseline trace is displayed, with the added and subtracted spectrum numbers in the trace label. Also, if the retention time labels are displayed, the retention time range is included in the trace label. 4 4-22 Applied Biosystems Displaying MS Method Data (Mariner Data Only) 4.6 Displaying MS Method Data (Mariner Data Only) Overview In this section If you acquired a data file using an MS Method and assigned event tags, you can display chromatogram traces in Data Explorer filtered by event tag. This section includes: • • • • • • Example applications Example applications Displaying acquisition conditions and event tags Setting Trace Replace mode Filtering event tags Evaluating filtered traces Displaying additional filtered traces Assume that you acquired data using two events, one specifying a low Nozzle Potential, and one specifying a higher Nozzle Potential to induce in-source fragmentation. You also assigned a Tag 1 event tag to the first event and the In-Source CID event tag to the second event. You can filter the TIC (or any chromatogram data) to display separate traces for the different Nozzle Potentials. Displaying acquisition conditions and event tags Setting Trace Replace mode To display instrument settings, MS Method segment and event numbers, and event tags for a spectrum: 4 1. Display the spectrum of interest. 2. Click the Instrument Setting tab in the Output window. Before selecting the event tag to display, set the Trace Replace mode (Add or Replace) in the Display Trace dialog box. For information on Trace Replace mode, see Section 2.4.4, Adding Traces from the Same Data File to a Window. Data Explorer™ Software User’s Guide 4-23 Chapter 4 Examining Chromatogram Data Hint: Add mode is useful when you filter the same trace for different event tags. The original trace remains displayed and accessible. Each filtered trace (up to four total traces) is added, allowing for visual comparison. Filtering event tags To display chromatogram traces for selected event tags: 1. Display the data file containing the event tags. 2. Click the Chromatogram window to activate it. 3. From the Display menu, select Traces, then select the trace type to filter. 4. If you have more than one trace displayed, select the trace to filter. 5. From the Process menu, select Event Tag Filtering. NOTE: If the Chromatogram window is not active, Event Tag Filtering is not displayed on the Process menu. If the active chromatogram was not collected with an MS Method that specified event tags, the Event Tag Filtering command is dimmed. The Event Tag dialog box is displayed (Figure 4-10). 4 Figure 4-10 Event Tag Dialog Box 4-24 Applied Biosystems Displaying MS Method Data (Mariner Data Only) NOTE: Only tags present in the data file are available. 6. Select the event tags to display, then click OK. The filtered trace is displayed with an EF trace label (Figure 4-11). Figure 4-11 Event Filtered Trace NOTE: The spectra in an event-filtered trace are numbered contiguously (1,2,3...) regardless of their relation to the overall acquisition. However, because the axes of the trace reflect the numbering of the overall experiment, you may see spectra with numbers that do not correspond to the x-axis. Hint: Line mode is useful when displaying filtered LC TIC traces. Vertical bar mode may be more useful when filtering direct infusion TIC traces. If you have the Replace mode set to Add in the Display Trace dialog box, a new trace is added. Data Explorer™ Software User’s Guide 4-25 4 Chapter 4 Examining Chromatogram Data Hint: Add mode is useful when you are filtering the same trace for different event tags. The original trace remains displayed and accessible. Each filtered trace (up to four total traces) is added, allowing for visual comparison. 7. Evaluating filtered traces To return to the original trace, see “Returning to the original trace” on page 4-4. Note the following when evaluating filtered traces: • If you select more than one tag to display, all spectra containing the specific combination of tags are included in the filtered trace. For example, assume the MS Method used to acquire the data specifies Tag 1 for event 1, and both Tag 1 and Tag 2 for event 2. If you select Tag 1 to filter, spectra from event 1 are included in the filtered trace, but not spectra from event 2. • A filtered trace displays data points for the selected tags only. However, if you double-click the filtered trace in an area that does not appear to contain data, a spectrum is displayed in the Spectrum window. • Any actions you perform on a filtered trace, such as summing, include only the spectra displayed in the filtered trace. Spectra from areas of the filtered trace that do not appear to contain data are not included. 4 NOTE: In a summed trace, the trace label includes the spectrum numbers for all spectra in the summing range, even if they are not in the filtered trace. However, only the spectra with the appropriate tags are included in the summed spectrum. Displaying additional filtered traces 4-26 Applied Biosystems To display additional filtered traces: 1. Select the original, unfiltered trace. 2. From the Process menu, select Event Tag Filtering, then select the tags to display. Adjusting the Baseline 4.7 Adjusting the Baseline This section includes: • Using Baseline Offset • Using Baseline Correction 4.7.1 Using Baseline Offset Use the Baseline Offset command to offset the y-axis in a chromatogram to improve the appearance of a trace or correct a sloping baseline. To use Baseline Offset: 1. Activate the window on which you want to perform the offset. NOTE: You can select a Chromatogram or Spectrum window. If you do not activate the correct type of window before performing the next step, the software does not select values when you click-drag on the trace. For example, you must select a Chromatogram window before starting baseline offset on a chromatogram. 2. Select Duplicate Active Trace from the Display menu to keep the original data displayed after processing. 3. From the Process menu, select Baseline Offset. The Baseline Offset dialog box (Figure 4-12) is displayed. Data Explorer™ Software User’s Guide 4-27 4 Chapter 4 Examining Chromatogram Data Figure 4-12 Baseline Offset Dialog Box 4. Right-click-drag the left baseline to offset. The selected value is displayed in the Left Baseline field. 5. Right-click-drag the right baseline to offset. The selected value is displayed in the Right Baseline field. 6. To limit the baseline offset to the area between the two selected points, select Only Apply from L to R Baseline Midpoint. To perform the baseline offset on the entire x-axis, deselect Only Apply from L to R Baseline Midpoint. 7. Click OK. The offset baseline trace is displayed with a BO trace label. 4 8. 4-28 Applied Biosystems To return to the original trace, see “Returning to the original trace” on page 4-4. Adjusting the Baseline 4.7.2 Using Baseline Correction Description When to use The Baseline Correction feature is a function that corrects for a curved baseline, including a DC-offset baseline, by eliminating broad artifacts from the data set. Baseline-correct if you are analyzing data: • With a baseline that is not flat, and you are using the %Base Peak Intensity parameter (intensity-based thresholding) to screen out noise peaks. For best results, apply Baseline Correction, then re-detect peaks. If you use area-based thresholding (%Max Peak Area) during peak detection, Baseline Correction is not typically needed. %Max Peak Area compensates for a rising or falling baseline. • With a baseline that is not at 0, to improve peak detection of small peaks. Correcting the baseline To correct the baseline: 1. Display the spectrum of interest. 2. From the Process menu, select Baseline Correction. The baseline is adjusted, and the trace is displayed with a BC trace label. Returning to the original trace To return to the original trace, see “Returning to the original trace” on page 4-4. Data Explorer™ Software User’s Guide 4-29 4 Chapter 4 Examining Chromatogram Data 4.8 Using UV Trace Offset (Mariner Data Only) To align a UV trace with a chromatogram trace: 1. Display the chromatogram and UV traces of interest. 2. Display the x-axis in retention time for each trace by selecting Traces from the Display menu, selecting X Axis In, then selecting Time. 3. Set the Replace Mode to Add a New Trace. For information see “Setting the Replace mode” on page 2-17. 4. From the Process menu, select Realign UV Trace. The UV Trace Offset dialog box is displayed (Figure 4-13). Figure 4-13 UV Trace Offset Dialog Box 4 5. Enter the retention times as follows. Click the Original UV Peak Value (min) text box, then right-click-drag over the peak to offset in the UV trace. Select the Aligned UV Peak To (min) text box, then right-click-drag over the peak to align with in the chromatogram trace. Hint: You can type retention times in the UV Trace Offset dialog box. Use an X data cursor to read the retention time of the peak. If you enter spectrum numbers by mistake, the peak does not align properly. 4-30 Applied Biosystems Using UV Trace Offset (Mariner Data Only) 6. Click OK. The UV trace peak is shifted to align with the chromatogram trace peak. NOTE: To restore the original UV trace, open the UV Trace Offset dialog box (see step 4), then click Reset. 7. To return to the original trace, see “Returning to the original trace” on page 4-4. 4 Data Explorer™ Software User’s Guide 4-31 Chapter 4 Examining Chromatogram Data 4 4-32 Applied Biosystems Chapter 5 Examining Spectrum Data 5 This chapter contains the following sections: 5.1 Overview ......................................................... 5-2 5.2 Creating a Combined Spectrum ...................... 5-4 5.3 Manual Calibration........................................... 5-5 5.4 Automatic Calibration..................................... 5-26 5.5 Centroiding .................................................... 5-36 5.6 Mass Deconvolution (Mariner Data Only) ....... 5-37 5.7 Noise Filtering/Smoothing .............................. 5-42 5.8 Adjusting the Baseline ................................... 5-45 5.9 Truncating a Spectrum................................... 5-56 5.10 Converting to a Singly Charged Spectrum (Mariner Data Only) ....................................... 5-59 5.11 AutoSaturation Correction (Mariner Data Only) ....................................... 5-62 5.12 Adding and Subtracting Raw or Processed Spectra From the Same or Different Data Files (Dual Spectral Trace Arithmetic) .................... 5-64 Data Explorer™ Software User’s Guide 5-1 Chapter 5 Examining Spectrum Data 5.1 Overview Types of spectra you can display You can display the following types of spectrum data: • Single spectrum—Double-click any point in the TIC to display the corresponding spectrum. • Combined spectrum—Click-drag across a region of the chromatogram to sum the intensity at each mass for all selected spectra. Combining spectra can improve peak shape, signal intensity, and signal-to-noise ratio. NOTE: You cannot display a combined spectrum for Voyager single-spectrum data files. • DAD spectrum (Mariner DAD data only)—Click the Chromatogram window, select Traces from the Display menu, select the DAD TAC or channel of interest, then double-click any point in the TAC or channel data trace to display the corresponding DAD spectrum. Voyager PSD spectra Creating macros to combine processing functions 5 5-2 Applied Biosystems Voyager PSD data files contain the precursor spectrum and fragment ion spectra. You can view up to eight spectra at a time and can click and to display other fragment ions. You can create macros that perform multiple functions (for example, smooth and baseline correct), and then start the macro with one mouse click. For information, see Section 6.7, Using the Macro Recorder. Overview Returning to the original spectrum Many processing functions generate a new trace. If you have Trace Replace mode set to Replace, the new trace replaces the original trace. For information on Replace mode, see Section 2.4.4, Adding Traces from the Same Data File to a Window. To return to the original spectrum: • If the original spectrum was an unprocessed spectrum, select Spectrum # from the Display menu. The number of the original spectrum is displayed in the Select Spectrum dialog box. Click OK. • If the original trace was a processed spectrum, select Processing History from the Display menu, then select the original trace. 5 Data Explorer™ Software User’s Guide 5-3 Chapter 5 Examining Spectrum Data 5.2 Creating a Combined Spectrum NOTE: Before creating a combined spectrum for Voyager multispectrum data files, calibrate the data. See Section 5.3, Manual Calibration. To create a combined spectrum: 1. Select Duplicate Active Trace from the Display menu to keep the original data displayed after processing. 2. In the Chromatogram window, right-click-drag across the region of the chromatogram that contains the spectra to combine. The combined spectrum (Figure 5-1) is displayed. Combined spectrum label Figure 5-1 Combined Spectrum 3. 5 5-4 Applied Biosystems To return to the original trace, see “Returning to the original spectrum” on page 5-3. Manual Calibration 5.3 Manual Calibration This section describes: • • • • • • Overview of manual calibration Manually calibrating Creating or modifying a calibration reference file Reverting to instrument calibration Hints for calibrating Mariner data Hints for calibrating Voyager data NOTE: Manual calibration is not supported for Mariner DAD data. 5.3.1 Overview of Manual Calibration Overview During manual calibration: • You specify a calibration reference file (.REF) that contains reference masses. • The software matches peaks by comparing observed masses in the spectrum to reference masses. • The software lists masses that match within the specified peak matching criteria, and calculates calibration constants. • You can apply the calibration constants to all spectra in a Mariner or Voyager data file. • You can apply individual calibration constants to each spectrum in a Voyager data file. 5 Data Explorer™ Software User’s Guide 5-5 Chapter 5 Examining Spectrum Data The manual calibration feature provides two modes for peak matching: • Automatic—The software automatically compares reference masses to observed masses, and lists peaks that are within the specified peak matching criteria. • Manual—You manually select an observed mass, then select the reference mass for comparison. Hint: It is often useful to automatically perform a match and fit first, then manually adjust the fit as needed. Calibration references files (.REF) provided Default calibration reference files are provided with the software. You can use these files as a starting point and add delete reference masses as needed. For information, see Section 5.3.3, Creating or Modifying a Calibration Reference File (.REF). When to use manual calibration Use manual calibration when you: • Calibrate Voyager data • Calibrate Mariner data and any of the following occur: • You have one or only a few spectra to calibrate • You do not know in advance which reference masses to use • You do not know in advance if the quality of the reference mass signals is acceptable • You want to fine-tune the results of an automatic calibration For information on automatic calibration, see Section 5.4, Automatic Calibration. Accurate mass measurements 5 Before performing an internal calibration, refer to the: • Mariner Workstation User’s Guide • Voyager Biospectrometry Workstation User’s Guide 5-6 Applied Biosystems Manual Calibration 5.3.2 Manually Calibrating This section describes: • • • • • Before calibrating Voyager data Before calibrating Voyager data Manually calibrating a single spectrum Applying new constants to the data file Exporting calibration constants (.CAL file) Applying new constants to additional files Before you calibrate Voyager data, do the following to improve mass accuracy: • Baseline correct—The Centroid% peak detection value is derived from a percentage of the peak height, which is measured from 0 (not from the local baseline). For information, see Section 5.8.2, Using Baseline Correction. • Noise filter or use default smoothing—Use the method appropriate for your data to remove noise spikes. For more information, see Section 5.7, Noise Filtering/Smoothing. It is critical to perform both these functions, which affect the peak centroid, before calibration. It is also good practice to perform the same processing functions on calibrants and unknowns. NOTE: If you are calibrating Mariner data, baseline correction and noise filtering or smoothing are not recommended before calibrating. Due to the shorter flight times and fewer data points associated with Mariner data, these functions may affect peak shape, which in turn affect mass accuracy. 5 Data Explorer™ Software User’s Guide 5-7 Chapter 5 Examining Spectrum Data Manually calibrating a single spectrum NOTE: Multi-point calibration yields higher mass accuracy than one-point calibration. Selecting calibrant peaks that bracket the mass of interest also yields higher mass accuracy. To manually calibrate a single spectrum: 1. Click the Spectrum window to activate it, then select the spectrum trace of interest. 2. From the Peaks menu, select Peak Label, set the Mass Label Type to Centroid, then click OK. NOTE: For spectra containing broad peaks that have unresolved adducts or impurities such as proteins, you may obtain better results if you use apex instead of centroid settings. 3. From the Process menu, select Mass Calibration, then select Manual Calibration. The Manual Mass Calibration dialog box is displayed (Figure 5-2). 5 5-8 Applied Biosystems Manual Calibration Figure 5-2 Manual Mass Calibration Dialog Box 4. Select a calibration reference file. For information on creating a reference file, see Section 5.3.3, Creating or Modifying a Calibration Reference File (.REF). 5. Enter reference matching and calibration criteria: • Minimum Intensity—Peaks must be above this intensity to be considered a match. Select the unit for Minimum Intensity, % Relative Intensity or Absolute Counts. • Mass Tolerance—Peaks must be within this tolerance of the theoretical m/z to be considered a match. Select the unit, m/z or ppm. 5 Data Explorer™ Software User’s Guide 5-9 Chapter 5 Examining Spectrum Data 6. Select the Peak Weighting Factor. If the calibration includes more than two points, you can apply the following weighting factors to fit points to the curve: • None—All peaks weighted equally • Inverse Width—Narrower peaks are weighted more than broader peaks • Height—More intense peaks are weighted more than less intense peaks Manually matching peaks 7. To manually select the reference mass for a peak, right-click-drag over the peak of interest. The Select or Create Reference Peak Information dialog box (Figure 5-3) is displayed and lists all masses in the selected reference file. The selected entry is the nearest match in the calibration reference file to the selected peak. 5 Figure 5-3 Select or Create Reference Peak Information Dialog Box 5-10 Applied Biosystems Manual Calibration 8. Do any of the following: • Click OK to accept the selected reference mass for matching, then add it to the Peaks Matched list. • Select a different reference mass, then click OK. • Type new reference mass information in the Name, Theoretical m/z, Charge, and Elemental Composition text boxes, select the mass type, then click OK to accept the reference mass for matching. NOTE: You must type a minus sign (–) preceding the charge in the Charge text box for negative charge states. • Type new reference mass information in the appropriate text boxes, click Save or Save As to add the information to the reference file, then click OK to accept the reference mass for matching. • Type new reference mass information in the appropriate text boxes, click Update to replace an entry in the reference file, click Save or Save As to add the information to the reference file, then click OK to accept the reference mass for matching. The Manual Mass Calibration dialog box is displayed again (see Figure 5-2 on page 5-9) with the observed mass and the reference mass you selected displayed in the Peaks Matched list. Hint: You can sort the list of matches by clicking the column header buttons. You can display complete information about a reference mass by double-clicking the mass. Data Explorer™ Software User’s Guide 5-11 5 Chapter 5 Examining Spectrum Data 9. Repeat step 7 and step 8 until all desired peaks are in the matched list. Eliminating data 10. To eliminate unacceptable data points from the calibration, do either of the following: points • Select the data point (mass) in the Peaks matched list, then click Delete Selected Match. • Click Eliminate Fit Outlier. The software deletes from the calibration the data point with the largest calibrated Fit Error (difference between the calibrated mass and the reference mass) as reported in the Output window (Figure 5-4). NOTE: The point deleted may not be the point with the largest Initial Error (difference between the pre-calibration observed mass and the reference mass) listed in the Peaks Matched List in the Manual Calibration dialog box. 5 5-12 Applied Biosystems Manual Calibration Eliminate Fit Outlier removes the mass associated with the largest fit error in the Output window, not the mass associated with the largest initial error in the Peaks Matched list. The 267 Da mass is removed when you click Eliminate Fit Outliers because it generated the largest fit error (below). Figure 5-4 Eliminate Fit Outlier Deletes the Match with the Largest Fit Error from the Output Window To clear the entire list, click Delete Entire List. Plotting 11. To apply the calibration constants to the displayed spectrum, click Plot. The spectrum is calibrated and displayed with an MC trace label. The calibration statistics are displayed in the Result tab of the Output window (Figure 5-5). 5 Data Explorer™ Software User’s Guide 5-13 Chapter 5 Examining Spectrum Data Calibration statistics Figure 5-5 Calibration Statistics in Output Window If you calibrate more than once, subsequent calibration statistics are added to the end of the list in the Output window. Older calibration statistics are listed at the top of the list. Automatically matching peaks You can automate peak matching by clicking Match Peaks instead of right-click-dragging individual peaks and selecting the mass. If any masses within the tolerances of any of the masses listed in the calibration reference file are found in the spectrum, the matches are displayed in the Calibration Mass Peak Selection window with an Initial Error reported. 5 5-14 Applied Biosystems Manual Calibration NOTE: If you are calibrating Mariner data, see “Ensuring that masses match during calibration” on page 5-24. Applying new constants to the data file If you are calibrating To apply the calibration constants to the data: Click The following occurs Mariner data (including MS Method data) Apply Calibration All spectra in the data file are calibrated and displayed with an MC trace label. The calibration constants are saved with the data file. Each spectrum in the data file is calibrated when displayed. Voyager data Apply Calibration The current spectrum is calibrated and displayed with an MC trace label. The calibration constants are saved with the spectrum. Apply to All All spectra in the data file are calibrated using the currently displayed calibration, and are displayed with an MC trace label. The calibration constants are saved with the data file. Each spectrum in the data file is calibrated when displayed. NOTE: This button is displayed only if you are calibrating a Voyager multispectrum data file. NOTE: If you select Apply to All, you overwrite any calibrations previously applied to individual spectra by clicking Apply Calibration. 5 Data Explorer™ Software User’s Guide 5-15 Chapter 5 Examining Spectrum Data Exporting calibration constants (.CAL file) The calculated calibration constants can be exported to a .CAL file for use with other data files. You have two options for exporting: • Export the current calibration—Click Export in the Manual Mass Calibration dialog box to calculate and export the current calibration constants from the masses displayed in the Peaks Matched list in the Manual Mass Calibration dialog box. NOTE: The calibration constants saved in the .CAL file are not calculated from the active trace on the screen or taken from the calibration in the data file. They are calculated from the listed masses. • Export a calibration from a previously calibrated data file—Open an existing data file, then export the calibration constants in a .CAL file. See “Exporting .BIC, .MSM, and .CAL files” on page 1-36. Applying new constants to additional files You can apply calibration constants from a .CAL file to any data file. To apply the new constants from a mass calibration file to a different file: 1. Display the spectrum to calibrate. 2. From the Process menu, select Mass Calibration. 3. Select Import Calibration. NOTE: If you are importing a calibration into a Voyager data file, see “Importing a calibration” on page 5-25. 4. Select the .CAL file to use, then click Open. The software displays the calibrated spectrum with an MC trace label. 5 5-16 Applied Biosystems Manual Calibration 5. If you are calibrating To save the calibration to the data file, select Mass Calibration from the Process menu, then: Select The following occurs Mariner data (including MS Method data) Apply Calibration All spectra in the data file are calibrated and displayed with an MC trace label. The calibration constants are saved with the data file. Each spectrum in the data file is calibrated when displayed. Voyager data Apply Calibration The current spectrum is calibrated and displayed with an MC trace label. The calibration constants are saved with the spectrum. Apply to All All spectra in the data file are calibrated using the currently displayed calibration, and are displayed with an MC trace label. The calibration constants are saved with the data file. Each spectrum in the data file is calibrated when displayed. NOTE: This button is displayed only if you are calibrating a Voyager multispectrum data file. 5.3.3 Creating or Modifying a Calibration Reference File (.REF) This section includes: • • • • • • Definition .REF files provided Calibration reference file contents Creating and saving a calibration reference file Modifying a calibration reference file Specifying mass type for highly charged, narrow peaks Data Explorer™ Software User’s Guide 5-17 5 Chapter 5 Examining Spectrum Data Definition A calibration reference file (.REF) is a list of masses and corresponding information from which you can select reference masses during calibration. .REF files provided The following default calibration reference files are provided with the software: • • • • • Calibration reference file contents MARINER_POS.REF MARINER_NEG.REF VOYAGER.REF ANGIOTENSIN_FRAGMENTS.REF IMMONIUM_IONS.REF A calibration reference file is a tab-delimited text file that contains the following columns of information: • Reference mass • Charge (defaults to 0 if you do not specify) • Type—Resolved, Average, or Unknown (defaults to Resolved if you do not specify) • Name (optional) • Elemental composition (optional) NOTE: If you view the reference file in a text editor (such as Notepad Editor), the order of the information listed in the reference file is different than the order of the information displayed in the Reference Mass dialog box (see Figure 5-3 on page 5-10). Creating and saving a calibration reference file NOTE: You can also create a reference file using the Ion Fragmentation calculator. For more information, see “Creating a calibration reference file (.REF)” on page 6-30. To create and save a calibration reference file: 5 1. 5-18 Applied Biosystems From the Process menu, select Mass Calibration, then select Edit/Create Reference File. Manual Calibration The Edit/Create Reference Peak Information dialog box (Figure 5-6) is displayed. Figure 5-6 Edit/Create Reference Peak Information Dialog Box 2. Type the Name and Theoretical m/z for a reference compound, then select the charge state. Optionally, enter the Elemental Composition for the compound. 3. Specify the mass type (Resolved Isotope Mass or Average Mass). If you are adding masses for highly charged compounds, see “Specifying mass type for highly charged, narrow peaks” on page 5-21. 4. Click Insert. 5. Repeat step 2 through step 4 for remaining compounds. Data Explorer™ Software User’s Guide 5-19 5 Chapter 5 Examining Spectrum Data CAUTION The software allows you to add multiple items with the same m/z value to the reference file if any other attribute of the reference compound is different (for example, charge state or name). Each mass in the list is considered during calibration. If the mass list contains duplicate entries, the calibration may return an invalid number of matches. 6. To modify an entry, click the reference mass in the list to select it, modify the entry as needed, then click Update. The modified entry is saved in the .REF file. 7. Click Save. 8. In the Save As dialog box, select a location and type a name for the file, then click OK. The name of the reference file used for mass calibration is stored in the .DAT file and is displayed in the Calibration Reference File field when you open the Manual Calibration dialog box again. NOTE: Only the name and path of the reference file are stored in the .DAT file. Contents of the file are not stored. Modifying a calibration reference file Hint: You can also modify a calibration reference file when you manually select reference masses during calibration. See step 8 on page 5-11. To add or delete information in a calibration reference file: 1. 5 From the Process menu, select Mass Calibration, then select Edit/Create Reference File. The Edit/Create Reference Peak Information dialog box (Figure 5-6 on page 5-19) is displayed. 2. 5-20 Applied Biosystems Click Browse, then select a calibration reference file. Manual Calibration 3. To modify an entry, click the entry to select it, modify the entry as needed, then click Update. 4. To delete an entry, click the entry to select it, then click Delete. 5. To add an entry, type the Name and Theoretical m/z for a reference compound, then select the charge state. Optionally, enter the Elemental Composition for the compound. 6. Specify the mass type (Resolved Isotope or Average). 7. Click Insert. CAUTION The software allows you to add multiple items with the same m/z value to the calibration list box if any other attribute of the reference compound is different (for example, charge state or name). Each mass in the list is considered during calibration. If the mass list contains duplicate entries, the calibration may return an invalid number of matches. Specifying mass type for highly charged, narrow peaks 8. Click Save or Save As. 9. In the Save As dialog box, select a location and type a name for the file, then click Save. When specifying highly charged, non-isotopically resolved species with peaks less than 1 Da wide (for example, myoglobin +20) as reference masses in a calibration reference file, set the peak type as a Resolved Isotope Mass (even though it is not a resolved isotope). The calibration routine checks peak width to determine if a peak matches a Resolved Isotope Mass or an Average mass. If narrow peaks are specified as Average Masses in the calibration reference file, the software mistakes these narrow peaks as isotopically resolved and ignores the reference mass. Data Explorer™ Software User’s Guide 5-21 5 Chapter 5 Examining Spectrum Data 5.3.4 Reverting to Instrument Calibration The Revert to Instrument Calibration function does the following: • Mariner data—Reapplies the original calibration constants used to acquire the data. • Voyager data—Applies default calibration to the data, regardless of whether default or external calibration is used to acquire the data. To revert the calibration: 1. From the Process menu, select Mass Calibration, then select Revert to Instrument Calibration. The spectrum is recalibrated with the original calibration constants used during acquisition (Mariner data) or default calibration (Voyager data) and displayed with an MC trace label. The original and new constants are displayed in the Output window. 2. If you are calibrating Mariner data (including MS Method data) Select Apply Calibration 5 5-22 To save the reverted calibration with the data file, select Mass Calibration from the Process menu, then: Applied Biosystems The following occurs All spectra in the data file are calibrated and displayed with an MC trace label. The calibration constants are saved with the data file. Each spectrum in the data file is calibrated when displayed. Manual Calibration If you are calibrating Voyager data Select The following occurs Apply Calibration The current spectrum is calibrated and displayed with an MC trace label. The calibration constants are saved with the spectrum. Apply to All All spectra in the data file are calibrated using the currently displayed calibration, and are displayed with an MC trace label. The calibration constants are saved with the data file. Each spectrum in the data file is calibrated when displayed. NOTE: This button is displayed only if you are calibrating a Voyager multispectrum data file. If you apply the calibration, the next time you open the data file, the MC trace label is not displayed. 5 Data Explorer™ Software User’s Guide 5-23 Chapter 5 Examining Spectrum Data 5.3.5 Hints for Calibrating Mariner Data Ensuring that masses match during calibration Mariner TOF Analyzer parameters affect flight times of ions. If you acquired Mariner data using different TOF Analyzer parameters, and did not calibrate the data in the Instrument Control Panel to compensate for the altered parameters, masses in the data file may be significantly different from the reference masses. For information on calibrating in the Instrument Control Panel, see the Mariner Workstation User’s Guide. Before performing automatic matching, set the Mass Tolerance and Minimum Intensity appropriately to match the expected reference masses. After automatic matching, check the list of matched peaks to make sure the correct reference masses and peak masses are selected. 5 5-24 Applied Biosystems Manual Calibration 5.3.6 Hints for Calibrating Voyager Data Importing a calibration If you import a calibration, you must import a calibration generated from a data file that was acquired on the same instrument using identical settings for the following instrument setting parameters: • Polarity • Instrument mode If you import a calibration that was generated using settings that are different from the current Polarity and Instrument Mode settings, an error message is displayed. NOTE: The calibration of the mass scale changes when you change the Accelerating Voltage, Grid Voltage%, or Delay Time. Default calibration adjusts for these changes. However, you observe more accurate calibration if you use an external calibration (.CAL) file generated with the same Accelerating Voltage, Grid Voltage%, or Delay Time. 5 Data Explorer™ Software User’s Guide 5-25 Chapter 5 Examining Spectrum Data 5.4 Automatic Calibration This section includes: • Overview of automatic calibration • Importing and specifying automatic calibration settings • Automatically calibrating (Mariner data only) NOTE: Automatic calibration is not supported for Mariner DAD data. 5.4.1 Overview of Automatic Calibration This section includes: • During automatic calibration • Automatic calibration for Mariner data • Automatic calibration for Voyager data During automatic calibration During automatic calibration: • You specify auto calibration settings (reference masses, matching criteria, and fit rejection parameters). Auto calibration settings are saved as part of processing settings in a .DAT file. • If Auto Calibrate is enabled in the Data Explorer software (Mariner data only), or if the Automatic Calibration function is accessed by the Voyager Sequence Control Panel (Voyager data only), the software does the following for each spectrum it displays or processes: • Compares peaks in the trace to peaks listed in the Masses to Match list in auto calibration settings. 5 5-26 Applied Biosystems Automatic Calibration • Matches all peaks that meet the specified Reference Matching criteria. If the number of peaks matched is greater than or equal to the specified Minimum Number of Peaks to Match, and the resulting fit errors are less than or equal to the specified Max Outlier Error, calibration is successful. • If any points exceed the specified Max Outlier Error, the software eliminates the outliers, one-by-one, worst to best, until all points are within the specified Max Outlier Error. If the number of matching peaks falls below the Minimum Number of Peaks to Match when the software eliminates an outlier, the calibration fails. Automatic calibration for Mariner data The Automatic Calibration function in Data Explorer is useful for quickly calibrating all spectra in a Mariner data file, after you prepare automatic calibration settings. You use the Automatic Calibration function in Data Explorer to prepare Automatic Calibration settings (contain reference masses and other matching information) and to calibrate the data. You can also use the Automatic Calibration function in Data Explorer to prepare Automatic Calibration settings (contain reference masses and other matching information) for use by the Mariner Sequence Control Panel (described in the Mariner Workstation Version 4.0 Supplement). You can save a .SET file that contains the settings, and specify the .SET file in the Sequence Control Panel. If you create and specify a macro to automatically calibrate, the Sequence Control Panel can use the calibration settings contained in the .SET file. 5 Data Explorer™ Software User’s Guide 5-27 Chapter 5 Examining Spectrum Data When to use Use automatic calibration for Mariner data when you: • Have many spectra to calibrate • Know in advance what reference masses to use • Know in advance that the quality of the reference mass signals is acceptable For information on manual calibration, see Section 5.3, Manual Calibration. Automatic calibration for Voyager data When to use 5 5-28 Applied Biosystems The Automatic Calibration function in Data Explorer is used by the Voyager Sequence Control Panel (described in the Voyager Biospectrometry Workstation User’s Guide) to calibrate data as it is acquired. You use the Automatic Calibration function in Data Explorer to prepare Automatic Calibration settings (contain reference masses and other matching information). You then save a .SET file that contains the settings, then specify the .SET file in the Sequence Control Panel. The Sequence Control Panel automatically calibrates spectra using the calibration settings contained in the .SET file. Use automatic calibration for Voyager data to prepare Automatic Calibration settings. The Sequence Control Panel uses Automatic Calibration settings to calibrate data as it is acquired. For more information on the Sequence Control Panel and on specifying automatic calibration, see the Voyager Biospectrometry Workstation User’s Guide. Automatic Calibration 5.4.2 Importing and Specifying Automatic Calibration Settings Importing Hint: Importing automatic calibration settings is useful when you calibrate batches of related samples. Automatic calibration settings are saved as part of processing settings in a .DAT file. To use auto calibration settings from another .DAT file: 1. Open the data file containing the desired auto calibration settings files. 2. Save the .SET information from this file by selecting Settings from the File menu, then selecting Save Processing Settings As. For more information, see Section 1.6.5, Extracting and Saving Information from .DAT, .RSD, and .RCD Files. 3. Open or activate the new file. 4. Copy the settings to the new file by selecting Settings from the File menu, then selecting Restore Processing Settings. For more information, see Section 1.4.2, Customizing Processing and Graphic Settings (.SET). NOTE: All processing settings, not just calibration settings, are applied to the new file. Specifying To specify automatic calibration settings: 1. Click the Spectrum window to activate it, then select the spectrum of interest. 5 Data Explorer™ Software User’s Guide 5-29 Chapter 5 Examining Spectrum Data 2. From the Peaks menu, select Peak Label, then set the Mass Label Type to Centroid. NOTE: For spectra containing broad peaks that have unresolved adducts or impurities such as proteins, you may obtain better results if you use apex instead of centroid settings. 3. From the Process menu, select Mass Calibration, then select Automatic Calibration. The Automatic Calibration Settings dialog box is displayed (Figure 5-7). Figure 5-7 Automatic Calibration Settings Dialog Box 4. 5 5-30 Applied Biosystems Click Select New File, then select a calibration reference file. For information on creating a reference file, see Section 5.3.3, Creating or Modifying a Calibration Reference File (.REF). Automatic Calibration 5. To add up to 10 reference masses to the Masses to Match list, do either of the following: • Click Add All to add the first 10 reference masses from the reference file. • Click Add Reference To List to individually select reference masses to add. NOTE: If the current list already contains 10 reference masses, you must delete a mass before you click Add References to List. If you click Add Reference to List, the Select or Create Reference Peak Information dialog box (Figure 5-8) is displayed and lists all masses in the reference file. If you click Add All, this dialog box is not displayed. 5 Figure 5-8 Select or Create Reference Peak Information Dialog Box Data Explorer™ Software User’s Guide 5-31 Chapter 5 Examining Spectrum Data 6. Specify reference masses to add by doing either of the following: • Click a mass, then click OK. • Type new reference mass information in the Name, Theoretical m/z, Charge, and Elemental Composition fields, then click OK. NOTE: You must type a minus sign (–) preceding the charge in the Charge text box for negative charge states. NOTE: You can save changes to the Calibration Reference File by clicking Save. For more information, see “Modifying a calibration reference file” on page 5-20. The Automatic Calibration Settings dialog box is displayed again (see Figure 5-7 on page 5-30). 7. Repeat step 5 and step 6 to add all needed masses. 8. To delete masses, do either of the following: • Select a reference, then click Delete Selected Reference • Click Delete All References 9. Enter Reference Matching Criteria: • Minimum Intensity—Peaks must be above this intensity to be considered a match. Select the unit for Minimum Intensity, % Relative Intensity or Absolute Counts. 5 • Mass Tolerance—Peaks must be within this tolerance of the theoretical m/z to be considered a match. Select the unit, m/z or ppm. 5-32 Applied Biosystems Automatic Calibration 10. Select the Peak Weighting Factor. If the calibration includes more than two points, you can apply the following weighting factors to fit points to the curve: • None—All peaks are weighted equally • Inverse Width—Narrower peaks are weighted more than broader peaks • Height—More intense peaks are weighted more than less intense peaks 11. Enter Fit Rejection parameters: • Minimum Peaks to Match—Minimum number of peaks that must meet the matching criteria for this calibration to be successful. • Maximum Outlier Error (m/z or ppm)—Tolerance within which all matched peaks must fall for this calibration to be successful. NOTE: If the software finds fewer than three matches, the maximum Outlier Error is not significant. Masses are labeled with the specified reference masses. 12. Saving the .SET file Click Save Settings to save the automatic calibration settings (reference masses, matching criteria, and fit rejection parameters) as part of processing settings in the .DAT file. If you are preparing Automatic Calibration settings for use by the Voyager Sequence Control Panel, save the .SET file by selecting Settings from the File menu, then select Save Graphic/Processing Settings As. 5 Data Explorer™ Software User’s Guide 5-33 Chapter 5 Examining Spectrum Data 5.4.3 Automatically Calibrating (Mariner Data Only) This section includes: • • • • Automatically calibrating Automatically calibrating Applying new constants to the data file Calibration results Applying auto calibration settings to other files To automatically calibrate: 1. Open the data file to calibrate. 2. Click the Spectrum window. 3. From the Process menu, select Mass Calibration, select Auto Calibrate State, then select On. NOTE: The Auto Calibrate State command setting is stored in a .DAT file. That is, if you turn on this command, then close the .DAT file, the command is on the next time you open the .DAT file. NOTE: The Auto Calibrate State command is dimmed unless you specified automatic calibration settings in the data file. See Section 5.4.2, Importing and Specifying Automatic Calibration Settings. 4. Display the spectrum of interest. The spectrum is calibrated and displayed with an AC trace label if calibration is successful. Calibration results are displayed in the Output window. 5 If calibration fails, the spectrum is displayed with an AC-failed trace label. 5-34 Applied Biosystems Automatic Calibration Applying new constants to the data file Calibration results To save the calibration constants for each spectrum in the data file, select Apply Calibration from the Process menu. Automatic calibration results are displayed in the Output window (Figure 5-9). Figure 5-9 Automatic Calibration Results For each spectrum in the data file, results include: • Number of peaks matched • Original and new calibration constants, calibrated mass, and fit errors • Successful or failed calibration message Applying auto calibration settings to other files To apply auto calibration settings to other files: 1. Extract the .SET information from the data file containing the auto calibration settings by selecting Settings from the File menu, then selecting Save Processing Settings As. For more information, see Section 1.6.5, Extracting and Saving Information from .DAT, .RSD, and .RCD Files. 2. Copy the settings to the new file by selecting Settings from the File menu, then selecting Restore Processing Settings. For more information, see Section 1.4.2, Customizing Processing and Graphic Settings (.SET). 5 Data Explorer™ Software User’s Guide 5-35 Chapter 5 Examining Spectrum Data 5.5 Centroiding NOTE: Centroiding is not supported for Mariner DAD data. To display peaks as centroid traces: 1. Click the Spectrum window to activate it. 2. Select Duplicate Active Trace from the Display menu to keep the original data displayed after processing. 3. From the Process menu, select Centroiding. The centroid spectrum is displayed with a CT trace label (see Figure 5-10). The height of each vertical bar corresponds to the original peak area. Figure 5-10 Centroid Spectrum 4. To return to the original trace, see “Returning to the original spectrum” on page 5-3. NOTE: If the original spectrum is displayed in vertical bars instead of lines, select Graphic Options from the Display menu, click the trace tab of interest, then select Lines for the Line Type in the Plot Setup section of the dialog box. For more information, see Section 1.5, Setting Graphic Options. 5 5-36 Applied Biosystems Mass Deconvolution (Mariner Data Only) 5.6 Mass Deconvolution (Mariner Data Only) NOTE: Mass deconvolution is not supported for Mariner DAD data. NOTE: The Mass Deconvolution software is an option in the Data Explorer software. The Multiple Charge command on the Process menu is dimmed if you have not purchased the option. Overview Mass Deconvolution You can use the Data Explorer Mass Deconvolution features to generate a theoretical zero-charge spectrum that represents the molecular mass of a protein: • Mass Deconvolution—Use when you have a spectrum with clearly resolved, multiply charged peaks. You specify the m/z values for the peaks to include. This function requires at least two adjacent peaks within the same charge envelope. • Convert to Zero-Charge Spectrum—Use when you have a spectrum with overlapping charge envelopes, or a noisy baseline. You specify a mass range for the peaks to include and a mass range for the molecular mass. To use the Mass Deconvolution function: 1. Click the Spectrum window. 2. Select Duplicate Active Trace from the Display menu to keep the original data displayed after processing. 3. From the Process menu, select Multiple Charge, then select Mass Deconvolution. Data Explorer™ Software User’s Guide 5-37 5 Chapter 5 Examining Spectrum Data The Multiply Charged Deconvolution dialog box (Figure 5-11) is displayed. 4. In the Spectrum window, right-click-drag one multiply charged peak. 5. Right-click-drag a second multiply charged peak adjacent to the first selected peak and in the same envelope of charged peaks. Mass/Charge values are entered in the list box. Figure 5-11 Multiply Charged Deconvolution Dialog Box 5 5-38 Applied Biosystems Mass Deconvolution (Mariner Data Only) 6. Select the method to use for calculation: • Automatic—Selects additional multiply charged peaks based on the selected peaks and performs the calculation. NOTE: If the trace is noisy, the software may not accurately select additional multiply charged peaks. • Manual—Performs the calculation using only selected peaks. Does not select additional multiply charged peaks. 7. Select Apex or Centroid mass to use for the calculation. 8. Enter the mass/charge range to include in the calculation. This range is used for two purposes: • If you selected Automatic mode, the software searches this range for other peaks that are in the same charge series as the peaks selected above. The software includes these other peaks in the calculation, to improve signal-to-noise ratio and the accuracy of the calculation. • Regardless of mode, the software uses all data points in this range to construct the deconvoluted spectrum. 9. 10. Select or enter the mass of the adduct ion to use in the calculation. The mass of a proton (H+) is selected by default. To display both the zero-charge spectrum trace and the deconvolution results, select Generate Zero-Charge Spectrum. To display only the deconvolution results, do not select Generate Zero-Charge Spectrum. Data Explorer™ Software User’s Guide 5-39 5 Chapter 5 Examining Spectrum Data 11. Click OK. The result is displayed in the Output window and the zero-charge spectrum is displayed with a DECONV trace label, if selected. NOTE: The numerical result displayed in the output window generally is more accurate than the computer-generated spectrum. 12. To return to the original spectrum, click in the toolbar. The number of the original spectrum is displayed in the Select Spectrum dialog box. 13. Click OK. Converting to zero-charge To convert to a zero-charge spectrum: 1. Activate the Spectrum window. 2. Select Duplicate Active Trace from the Display menu to keep the original data displayed after processing. 3. From the Process menu, select Multiple Charge, then select Convert to Zero-Charge Spectrum. The Zero-Charge Spectrum Conversion dialog box (Figure 5-12 on page 5-41) is displayed. 4. 5 5-40 Applied Biosystems Specify the Input Spectrum m/z range to include in the calculation by doing one of the following: • Type in From and To values • Right-click-drag over a region of the trace that includes the m/z range of interest Mass Deconvolution (Mariner Data Only) 5. Type values for the following masses for the generated zero-charge spectrum: • Center—Center mass • Half Width—Mass (±) from the Center mass to include in the spectrum • Increment—Mass increment at which to perform the calculation (0.1 for resolved isotope peaks, 1.0 for unresolved isotope peaks, >1.0 for noisy trace) Figure 5-12 Zero-Charge Spectrum Conversion Dialog Box 6. Select or type the mass of the adduct ion to use in the calculation. The mass of a proton (H+) is selected by default. 7. Click OK. The deconvoluted trace (with a DECONV trace label) replaces the original trace. 8. To return to the original trace, see “Returning to the original spectrum” on page 5-3. Data Explorer™ Software User’s Guide 5-41 5 Chapter 5 Examining Spectrum Data 5.7 Noise Filtering/Smoothing Description The Noise Filter/Smooth function includes four options for reducing noise in a spectrum trace: • • • • Procedure Default smoothing Noise-filtering Smoothing by the Gaussian method Noise removal To noise-filter or smooth the display: 1. Select Duplicate Active Trace from the Display menu to keep the original data displayed after processing. 2. From the Process menu, select Noise Filter/Smooth. The Noise Filter/Smooth dialog box (Figure 5-13) is displayed. Figure 5-13 Noise Filter/Smooth Dialog Box NOTE: The smoothing/filtering method selected in this dialog box is the method performed when you click in the toolbar. 5 5-42 Applied Biosystems Noise Filtering/Smoothing 3. Type of Data Noisy, low-resolution data Select the method to use based on the type of data you are examining, then enter the associated value displayed for the method you select: Suggested Method Default smoothing (RSM) (May affect peak resolution.) Description No associated value is displayed. Default smoothing is a self-adjusting Gaussian filter that uses the Peak Resolution (specified in the Peak Detection Setup dialog box) to calculate the optimum number of smoothing points to apply at every mass point. See Figure 3-3 on page 3-12. NOTE: Default smoothing is not available for PSD data. High-resolution data, but the Noise Removal method may yield better results Noise Filter (NF) Noisy, low-resolution data, chromatogram data, or Voyager PSD data Gaussian Smooth (SM) (May affect peak resolution.) (May affect peak resolution.) Specify a Correlation Factor of 0 to 1.0. Settings from 0.5 to 0.7 yield acceptable results for most data. A setting close to 1.0 yields a higher degree of noise reduction. If applying the Noise Filter with a certain Correlation Factor does not yield the necessary noise removal, return to the original trace (see “Returning to the original spectrum” on page 5-3) and apply the Noise Filter again with a higher Correlation Factor setting. Applying the Noise Filter more than one time with the same Correlation Factor setting does not improve noise removal. Specify a Filter Width in data points (odd integers only). The maximum number of smoothing points is 2001. Points less than 1 Filter Width from the edge of the spectrum are not smoothed. Data Explorer™ Software User’s Guide 5-43 5 Chapter 5 Examining Spectrum Data Type of Data High-resolution data Suggested Method Noise Removal (NR) (Does not affect peak resolution.) Description Specify the number of standard deviations of noise to remove. The software automatically calculates the average white noise for all frequencies across the spectrum, then removes the specified number of standard deviations of noise. This method slightly affects peak intensity, and removes peaks with a signal-to-noise ratio less than the specified standard deviation. In general: If you set Std Dev to: % White Noise removed is: 1 68 2 95 3 99 If applying Noise Removal with a certain Std Dev does not yield the necessary noise removal, return to the original trace (see “Returning to the original spectrum” on page 5-3) and apply Noise Removal again with a higher Std Dev setting. Applying Noise Removal more than one time with the same Std Dev setting does not improve noise removal. 4. Click OK. The trace is displayed with an RSM, NF, NR or SM trace label. 5 5. 5-44 Applied Biosystems To return to the original trace, see “Returning to the original spectrum” on page 5-3. Adjusting the Baseline 5.8 Adjusting the Baseline This section includes: • Using Baseline Offset • Using Baseline Correction • Using Advanced Baseline Correction 5.8.1 Using Baseline Offset Use the Baseline Offset command to offset the y-axis in a spectrum or to correct a sloping baseline: 1. Activate the window in which you want to perform the offset. NOTE: You can select a Chromatogram or a Spectrum window. If you do not activate the correct type of window before performing the next step, the software does not select values when you click-drag on the trace. For example, you must select a Spectrum window before starting baseline offset on a spectrum. 2. Select Duplicate Active Trace from the Display menu to keep the original data displayed after processing. 3. From the Process menu, select Baseline Offset. The Baseline Offset dialog box (Figure 5-14) is displayed. 5 Data Explorer™ Software User’s Guide 5-45 Chapter 5 Examining Spectrum Data Figure 5-14 Baseline Offset Dialog Box 4. Right-click-drag the left baseline to offset. The selected value is displayed in the Left Baseline field. 5. Right-click-drag the right baseline to offset. The selected value is displayed in the Right Baseline field. 6. To limit the baseline offset to the area between the two selected points, select Only Apply from L to R Baseline Midpoint. To perform the baseline offset on the entire x-axis, deselect Only Apply from L to R Baseline Midpoint. 7. Click OK. The offset baseline trace is displayed with a BO trace label. 8. 5 5-46 Applied Biosystems To return to the original trace, see “Returning to the original spectrum” on page 5-3. Adjusting the Baseline 5.8.2 Using Baseline Correction Description When to use The Baseline Correction function corrects for a curved baseline, including a DC-offset baseline, by eliminating broad artifacts from the data set. Baseline-correct if you are analyzing data: • With a baseline that is not flat, and you are using the %Base Peak Intensity parameter (intensity-based thresholding) to screen out noise peaks. For best results, apply Baseline Correction, then re-detect peaks. If you use area-based thresholding (%Max Peak Area) during peak detection, Baseline Correction is not typically needed. %Max Peak Area compensates for a rising or falling baseline. • With a baseline that is not at 0. Some measurements (for example, Centroid% peak detection value, or the Peak Height % in the Resolution calculator), are derived from a peak height measured from 0. NOTE: If you are analyzing Mariner data, baseline correction is typically not needed. If you baseline-correct Mariner data, note that due to the shorter flight times and fewer data points associated with Mariner data, baseline correction may affect peak shape, which in turn affects mass accuracy. Correcting the baseline To correct the baseline: 1. Display the spectrum of interest. 2. Select Duplicate Active Trace from the Display menu to keep the original data displayed after processing. 3. From the Process menu, select Baseline Correction. The baseline is adjusted, and the trace is displayed with a BC trace label. Returning to the original spectrum To return to the original trace, see “Returning to the original spectrum” on page 5-3. Data Explorer™ Software User’s Guide 5-47 5 Chapter 5 Examining Spectrum Data 5.8.3 Using Advanced Baseline Correction This section includes: • • • • • • Description Description When to use Correcting the baseline General guidelines for setting parameters Troubleshooting Returning to the original spectrum The Advanced Baseline Correction feature corrects the baseline by: • Iteratively estimating baseline amplitude at regularly spaced intervals throughout the spectrum • Smoothly connecting the calculated baseline points • Removing the calculated baseline from the spectrum x x x x x x x x x x x x x x 5 Figure 5-15 Advanced Baseline Correction 5-48 Applied Biosystems Adjusting the Baseline When to use Use advanced baseline correction if you are analyzing data with an offset in the spectrum, particularly data with a strong sloping baseline at low mass. NOTE: Because this function is iterative, it may take several seconds to complete, and typically takes longer for narrower peaks. Correcting the baseline To correct the baseline: 1. Select Duplicate Active Trace from the Display menu to keep the original data displayed after processing. 2. From the Process menu, select Advanced Baseline Correction. The Advanced Baseline Correction dialog box (Figure 5-16) is displayed. Figure 5-16 Advanced Baseline Correction Dialog Box 5 Data Explorer™ Software User’s Guide 5-49 Chapter 5 Examining Spectrum Data 3. Enter parameters as described below. These parameters interact with each other and require experimentation to determine the optimum settings for your data. Refer to “General guidelines for setting parameters” on page 5-54 for more information. Parameter Peak Width (at half height) Description/Specifies Value the software uses to estimate the baseline amplitude at regularly spaced points in the spectrum. The number of regularly spaced points used is derived using the Peak Width parameter and the Flexibility parameter. The illustration below shows how using a higher number of points estimate the baseline (accomplished by using higher Peak Width and Flexibility settings) can affect the shape and slope of the calculated baseline. Lower number of points x x x x x x Higher number of points x x x x x x x x x x x x (continued) 5 5-50 Applied Biosystems Adjusting the Baseline Parameter Peak Width (at half height) Description/Specifies Set Peak Width according to the data you are correcting: • For best results, set to the peak width at half height of the narrowest peak. However, smaller peak width values increase processing time. • If peak width varies across the spectrum, set to the average peak width. • If peaks are narrow relative to the baseline region you are correcting, set a larger value (for example, 10 times the width of widest peak) to increase processing speed. • If the baseline changes sharply across the spectrum, set a smaller value closer to the narrowest peak width. • If the baseline is broad or gently sloping, set a larger value, for example 10 to 20 times the width of the actual peak width. (continued) To determine the number of points across a peak, change the trace display from Line to Vertical Bars (select Graphic Options from the Display menu, click Graph # Setup and change Line Type). Each vertical bar represents one data point. For more information, see Section 1.4, Customizing the Data Explorer Window. (continued) 5 Data Explorer™ Software User’s Guide 5-51 Chapter 5 Examining Spectrum Data Parameter Flexibility Description/Specifies With the Peak Width parameter, determines the number of points used to estimate the baseline amplitude at regularly spaced points in the spectrum, but is not directly proportional to the number of points used. Valid entries are 0 to 1.0. The default value of 0.5 works best for most applications. A value closer to 0 reduces flexibility and provides a smoother more generalized baseline correction (see below). A value closer to 1 provides more localized baseline correction by using a larger number of points to estimate the baseline (see below). If the baseline rises adjacent to peaks after baseline-correcting, decrease the Flexibility value and baseline-correct again. Flexibility=0 Flexibility=1 (continued) 5 5-52 Applied Biosystems Adjusting the Baseline Parameter Degree Description/Specifies Determines how closely the calculated baseline fits the data. Valid entries are 0.0 to 1.0. A value closer to 1 fits the baseline more closely to the data, and corrects the midpoint of the noise signal to approximately 0 intensity. A value closer to 0 fits the baseline less closely to the data, and corrects the midpoint of the noise signal to a value greater than 0 intensity (see below). For protein and tryptic digest peptide spectra, use 0 to 0.5. If the baseline after correction is too high, increase the Degree value (see below). Degree=1 Midpoint of noise signal corrected to 0 Degree=0 Midpoint of noise signal corrected above 0 A lower Degree setting allows the baseline correction to occur more quickly, and often provides better correction than a higher setting. NOTE: Flexibility and Degree parameters may require some testing to determine the optimum settings for your data. 4. 5 Click OK. The baseline is adjusted, and the trace is displayed with a AdvBC trace label. Data Explorer™ Software User’s Guide 5-53 Chapter 5 Examining Spectrum Data General guidelines for setting parameters Refer to the following table to determine how to set Advance Baseline Correction parameters and obtain the desired baseline correction. Condition Baseline follows a rising peak cluster Baseline is gently curving Baseline rise should be ignored and treated as signal Set Parameters To • Peak Width—Average peak width • Flexibility—0.5 • Degree—0.5 • Peak Width—10 to 20 times peak width • Flexibility—0 • Degree—0.5 (decrease further to raise the baseline) • Peak Width—Half of the width of the cluster to correct (in the illustration shown, if the width of the cluster is 200, set Peak Width to 100) • Flexibility—0 • Degree—0.5 (decrease further to raise the baseline) Peak cluster 5 5-54 Applied Biosystems Adjusting the Baseline Troubleshooting If the baseline rises preceding and following a peak after the correction (a “hump” under the peak), adjust the following parameters in the order listed: • Decrease Flexibility • Decrease Degree • Decrease Peak Width NOTE: Lower Peak Width values increase the time needed for processing. Returning to the original spectrum To return to the original trace, see “Returning to the original spectrum” on page 5-3. 5 Data Explorer™ Software User’s Guide 5-55 Chapter 5 Examining Spectrum Data 5.9 Truncating a Spectrum Description The Truncate function removes data points from a trace outside a selected region. Truncating spectra is useful to: • Mariner data—Remove noise at the low end of a spectrum before generating a result file • Voyager data—Eliminate the Low Mass Gate spike and background in the low-mass range Truncating To truncate spectra: 1. Display the spectrum to truncate. 2. Select Duplicate Active Trace from the Display menu to keep the original data displayed after processing. 3. From the Process menu, select Truncate Spectrum. The Truncate Spectrum dialog box (Figure 5-17) is displayed. Figure 5-17 Truncate Spectrum Dialog Box 4. Type the starting and ending m/z values for the range of the spectrum to retain, or right-click-drag over the range in the spectrum. 5. Click OK. 5 5-56 Applied Biosystems Truncating a Spectrum The data in the spectrum is truncated to the selected range and is displayed with a TR trace label. The range displayed on the axis of the truncated trace is the range of the original data file, and may be wider than the range of the truncated spectrum. 6. Example To return to the original trace, see “Returning to the original spectrum” on page 5-3. Figure 5-18 and Figure 5-19 illustrate the effects of truncating a Voyager spectrum and eliminating the Low Mass Gate peak. Figure 5-18 includes a Low Mass Gate spike. Because the Low Mass Gate spike is the most intense peak in the spectrum, it is identified as the base peak, and: • All other peaks in the spectrum are scaled as a percentage of the base peak. • A default peak detection threshold, %Base Peak Intensity, is set to 1 percent of the base peak. One percent of an intense peak yields a high default threshold, and many peaks in the spectrum are not detected. Low Mass Gate spike Figure 5-18 Complete Spectrum with Low Mass Gate Spike Figure 5-19 shows the spectrum truncated to eliminate the Low Mass Gate spike. The peak at 3772 Da is identified as the base peak, the %Base Peak Intensity is set to a lower value, and more peaks in the spectrum are detected. Data Explorer™ Software User’s Guide 5-57 5 Chapter 5 Examining Spectrum Data Figure 5-19 Truncated Spectrum—Low Mass Gate Spike Eliminated 5 5-58 Applied Biosystems Converting to a Singly Charged Spectrum (Mariner Data Only) 5.10 Converting to a Singly Charged Spectrum (Mariner Data Only) NOTE: Single-charge conversion is not supported for Mariner DAD data. Description The Single-Charge Conversion function generates a theoretical, centroided, singly charged spectrum. This function uses isotopic spacing in detected spectral peaks to generate the theoretical spectrum. For example, if you use this function on a spectrum that includes +3 peaks, the software multiplies each mass by 3 and removes the mass of two extra protons. The resulting spectrum contains theoretical +1 species. If more than one charge state is present, each charge state is converted appropriately, and the total range of the converted spectrum is approximately 1.2 times the m/z of the highest m/z present. Requirements Use this function only on isotopically resolved data that is labeled with the correct charge state. Peaks with low signal-to-noise ratios may be labeled with incorrect charge states. Set peak detection thresholds to disregard these peaks before converting the spectrum. If you use this function on a spectrum that is not correctly labeled, the resulting spectrum may contain charge states other than 1. Converting To convert a multiply charged spectrum to a singly charged spectrum: 1. Display the spectrum trace of interest. 2. Examine the spectrum. Make sure peaks are labeled with the correct charge state, and that no noise peaks are labeled with a charge state. Adjust peak detection parameters as needed. Data Explorer™ Software User’s Guide 5-59 5 Chapter 5 Examining Spectrum Data 3. Select Duplicate Active Trace from the Display menu to keep the original data displayed after processing. 4. From the Process menu, select Single-Charge Conversion. The Single-Charge Spectrum Conversion dialog box (Figure 5-20) is displayed. Figure 5-20 Single-Charge Spectrum Conversion Dialog Box 5. In the Adduct text box, type or select the adduct that is the charge-carrying species in the spectrum you are examining. 6. Select the polarity for the converted spectrum. You must select the same charge as the spectrum you are evaluating. CAUTION If you do not select the same charge as the spectrum you are evaluating, an incorrect mass is reported. 7. Click OK. The converted spectrum is displayed with an SC trace label. The height of each vertical bar corresponds to the original peak areas. 5 8. 5-60 Applied Biosystems To return to the original trace, see “Returning to the original spectrum” on page 5-3. Converting to a Singly Charged Spectrum (Mariner Data Only) Example Figure 5-21 and Figure 5-22 illustrate the effects of single-charge conversion. Before conversion (Figure 5-21), the spectrum includes +2 and +3 charged species of neurotensin. Neurotensin multiply charged species Figure 5-21 Spectrum Before Single-Charge Conversion After conversion (Figure 5-22), the +2 and +3 charged species are converted to the +1 species of neurotensin. Neurotensin singly charged species 5 Figure 5-22 Spectrum After Single-Charge Conversion Data Explorer™ Software User’s Guide 5-61 Chapter 5 Examining Spectrum Data NOTE: Charge states other than 0 or 1 in the converted trace indicate that a peak in the original spectrum is labeled with an incorrect charge state. Set peak detection thresholds to disregard these peaks and convert the spectrum again. CAUTION A zero value in the Spec Peak list does not indicate a charge state of zero. It indicates that the software could not determine the charge state. 5.11 AutoSaturation Correction (Mariner Data Only) NOTE: Autosaturation correction is not supported for Mariner .RST or DAD data. Function The AutoSaturation Correction function mathematically corrects for signal saturation of the Mariner detector system to provide optimum mass accuracy. The AutoSaturation Correction feature is turned on by default, and automatically corrects the data when you open a Mariner data file in Data Explorer. Leave this feature turned on for normal operation. Hardware requirements 5 5-62 Applied Biosystems The AutoSaturation Correction function requires special hardware. If the system used to acquire the data does not include the required hardware, the AutoSaturation Correction does not completely correct for saturation of the detection system, even if it is enabled. AutoSaturation Correction (Mariner Data Only) Effect on Mariner .RST files The AutoSaturation Correction feature is not applied to .RST files saved from the Mariner Instrument Control Panel, even when Saturation Correction is turned on. Saturation requires information about the pulser frequency used to acquire the data, and this information is not stored in .RST files saved from the Instrument Control Panel. Trace label When AutoSaturation Correction is turned on, spectra in the data file are displayed with an ASC (AutoSaturation Correction) trace label. 5 Data Explorer™ Software User’s Guide 5-63 Chapter 5 Examining Spectrum Data 5.12 Adding and Subtracting Raw or Processed Spectra from the Same or Different Data Files (Dual Spectral Trace Arithmetic) The Dual Spectral Trace Arithmetic function lets you add two spectra together, or subtract one spectrum from another. Spectra can be raw or processed, and can be from the same or different data files. To use the Dual Spectral Trace Arithmetic function: 1. To perform this function on spectra from different data files, copy a spectrum trace from one data file to another. See Section 2.5.2, Copying Traces from Multiple Data Files to a Window, for information on copying traces. 2. Activate the Spectrum window that contains the two traces of interest. 3. Process the traces as needed. 4. Click the first trace in the Spectrum window to make it the active trace. NOTE: The Dual Spectral Trace Arithmetic command is dimmed unless the first trace in the Spectrum window is the active trace. 5. From the Process menu, select Dual Spectral Trace Arithmetic. The Dual Spectral Trace Arithmetic dialog box is displayed (Figure 5-23). 5 5-64 Applied Biosystems Adding and Subtracting Raw or Processed Spectra from the Same or Different Data Files (Dual Figure 5-23 Dual Spectral Trace Arithmetic Dialog Box 6. Set the Mass Tolerance within which data points from the different traces will be considered as the same mass. 7. Select Add or Subtract for Operation. 8. Select Add New Trace or Replace Active Trace for the result trace. 9. Click OK. Absolute intensities of the two traces are added or subtracted, and the result trace is displayed with ADD or SUB in the trace header. 5 Data Explorer™ Software User’s Guide 5-65 Chapter 5 Examining Spectrum Data 5 5-66 Applied Biosystems Chapter 6 Using Tools and Applications 6 This chapter contains the following sections: 6.1 Using the Elemental Composition Calculator .......... 6-2 6.2 Using the Isotope Calculator ................ 6-13 6.3 Using the Mass Resolution Calculator .................. 6-20 6.4 Using the Signal-to-Noise Ratio Calculator ........... 6-23 6.5 Using the Ion Fragmentation Calculator ............... 6-25 6.6 Using the Elemental Targeting Application............ 6-31 6.7 Using the Macro Recorder .................... 6-34 Data Explorer™ Software User’s Guide 6-1 Chapter 6 Using Tools and Applications 6 6.1 Using the Elemental Composition Calculator This section includes: • • Determining elemental composition Setting limits 6.1.1 Determining Elemental Composition This section includes: • • • • • • • Description Determining identity of fragment masses Procedure Calculating Results If no results are displayed Displaying the theoretical isotope distribution Description The Elemental Composition calculator determines possible elemental or amino acid compositions for a given mass. The application then generates a theoretical isotope pattern using the Mass Resolution specified in Basic Peak Detection settings, compares each observed mass and isotope pattern to the theoretical mass and isotope pattern for each possible composition, and reports an isotope match score that reflects how closely they match. Determining identity of fragment masses You can also use the Elemental Composition calculator to determine the identity of fragment masses. To do so, set Peak Labels to display Mass Difference From Selected Peak, then specify the mass of the intact molecule. For more information, see “Setting spectrum labels” on page 3-56. 6-2 Applied Biosystems Using the Elemental Composition Calculator Procedure To determine elemental composition: 1. Display the spectrum containing the peak of interest. 2. Click the Spectrum window to activate it. 3. From the Applications menu, select Elemental Composition. 6 The Elemental Composition Calculator dialog box (Figure 6-1) is displayed. Figure 6-1 Elemental Composition Calculator Dialog Box Data Explorer™ Software User’s Guide 6-3 Chapter 6 Using Tools and Applications 4. 6 Enter m/z values in the m/z ratio list by doing any of the following: • Right-click-drag over a peak in the spectrum to add the m/z and the associated charge state. • Double-click the line to display the Elemental Target Mass dialog box, type the m/z and the associated charge state, then click OK. • Click to add a line to the list, then double-click the line to display the Elemental Target Mass dialog box, type the m/z and the associated charge state, then click OK. 5. Specify the Tolerance to use. The Tolerance value entered is directly used as the window for elemental comparisons, and is also multiplied by 2 and used as the window for isotope peak comparison (because related isotope peaks will usually have lower mass accuracy than monoisotopic peak). Setting Tolerance too low can result in a falsely low Isotope Match Score (see page 6-6). 6. Specify the Mass Type to calculate. 7. If the displayed Mass Peak Resolution is not appropriate for this calculation, change the setting in Peak Detection. For more information, see Section 3.2.4, Peak Detection Parameter Descriptions. 8. Specify the Result Type (Elemental, Amino Acid, Carbohydrate, DNA, or RNA). 9. Specify the Max Number of Results for each m/z entered in step 4. NOTE: Max Number of Results is per m/z entered, not total number of results generated for the calculation. 10. Set limits as described in: • 6-4 Applied Biosystems “Setting limits for existing elements” on page 6-7 Using the Elemental Composition Calculator 11. • “Adding new elements and setting limits” on page 6-9 • “Setting limits for other result types” on page 6-12 Click More Parameters, then enter the Minimum and Maximum Double Bond Equivalents to include in the calculation. Electron state for 12. Set the Electron State to calculate. If you are calculating composition for: intact molecules or fragment ions • Intact molecules—Use the default of Even Only. • Fragment ions—Set to Both Odd and Even if you are analyzing mass differences or absolute masses. NOTE: You may be able to refine results for fragment ions by setting Electron State to Odd Only. 13. Click OK. Calculating 14. Click Calculate. To cancel a lengthy calculation, click Cancel Calc. Results The results of the calculation are displayed in the Elemental Analysis tab of the Output window (Figure 6-2). Figure 6-2 Elemental Composition Calculation Results in Output Window Data Explorer™ Software User’s Guide 6-5 6 Chapter 6 Using Tools and Applications 6 Hint: You can sort the results in a column by clicking the column header. Results include: • Index—Sequential number assigned to each result. • Input m/z—Entered m/z for each composition calculation. • Calculated Mass—Calculated mass for the entered m/z and charge state for each theoretical composition. • mDa Error and ppm Error—Error for each calculation. • Double Bond Equivalents (DBE)—Value that corresponds to the number of double bonds or rings that the valence-bond theory requires to construct a molecule from each calculated composition. If the target mass is a protonated molecular ion, (M+H)+, the DBE value includes 0.5 and corresponds to an even electron state. To convert the reported DBE value to the actual number of double bonds or rings, add 0.5. For example, H2C=NH2+ has an (M+H)+ total mass of 30.0344 and a reported double bond equivalent of 0.5, with an actual number of double bonds of 1. • Formula—Elemental composition for each mass. • Isotope Match Score—Number between 0 and 1.0 that reflects how well the observed peak matches the theoretical formula, based on mass and isotope pattern. A higher number represents a better match. NOTE: An Isotope Match Score of 0.00000 is always reported for fragment ion calculations. If no results are displayed 6-6 Applied Biosystems If no results are displayed, it may indicate that the specified Tolerance is too limiting and no matches were found. Using the Elemental Composition Calculator Displaying the theoretical isotope distribution To display the theoretical isotope distribution for a calculated formula, double-click the corresponding line in the Elemental Analysis tab of the Output window. The theoretical isotope trace is displayed in the Spectrum window with an ISO trace label and the elemental formula. To return to the original trace, see “Returning to the original spectrum” on page 5-3. 6.1.2 Setting Limits This section includes: • • • Setting limits for existing elements Setting limits for existing elements Adding new elements and setting limits Setting limits for other result types To set limits for existing elements: 1. To set limits for Elemental results, click Element Limits in the Elemental Composition Calculator dialog box. The Limits dialog box is displayed (Figure 6-3). Figure 6-3 Element Limits Dialog Box Data Explorer™ Software User’s Guide 6-7 6 Chapter 6 Using Tools and Applications 2. 6 To change the limits for an element, double-click an element to display the Isotope dialog box (Figure 6-4). Figure 6-4 Isotope Dialog Box NOTE: Ignore the column of check boxes to the left of the Isotope column if it is displayed. 3. Change the Minimum and Maximum number of occurrences for the element as needed. NOTE: The software ignores changes you make to the individual isotope minimum and maximum values. 6-8 4. Click OK. 5. Change limits for other elements as needed, then click OK to return to the Elemental Composition Calculator. Applied Biosystems Using the Elemental Composition Calculator Adding new elements and setting limits To add new elements and set limits: 6 1. To add new elements and set limits for Elemental results, click Element Limits in the Elemental Composition Calculator dialog box. The Limits dialog box is displayed (Figure 6-5). Figure 6-5 Element Limits Dialog Box 2. Click . The Periodic Table (Figure 6-6) is displayed. Data Explorer™ Software User’s Guide 6-9 Chapter 6 Using Tools and Applications 6 Figure 6-6 Periodic Table 3. 6-10 Applied Biosystems Click an element to select it and to display the Isotope dialog box (Figure 6-7). Using the Elemental Composition Calculator 6 Figure 6-7 Isotope Dialog Box NOTE: Ignore the column of check boxes to the left of the Isotope column if it is displayed. 4. Change the Minimum and Maximum number of occurrences for the first isotope of the element as needed. NOTE: The software ignores changes you make to the individual isotope minimum and maximum values. 5. Click OK two times to return to the Element Limits dialog box. 6. Repeat step 2 through step 5 to add other elements as needed, then click OK to return to the Elemental Composition Calculator. Data Explorer™ Software User’s Guide 6-11 Chapter 6 6 Using Tools and Applications Setting limits for other result types To set limits for amino acid, DNA, RNA, or carbohydrate result types: 1. Click the limits button displayed for the selected result type in the Elemental Composition Calculator dialog box (see Figure 6-1 on page 6-3). The Limits dialog box for the selected Result Type is displayed. Figure 6-8 shows the Amino Acid Limits dialog box. Figure 6-8 Amino Acid Limits Dialog Box 6-12 Applied Biosystems 2. Change the Min Number and Max Number for the compound for which you are setting limits, then click OK. 3. Change limits for other entries as needed, then click OK to return to the Elemental Composition Calculator. Using the Isotope Calculator 6.2 Using the Isotope Calculator Description Using the Isotope Calculator 6 Use the Isotope calculator to generate a theoretical isotope distribution. You can compare or overlay the theoretical distribution with your observed distribution. To use the Isotope calculator: 1. Display the spectrum containing the observed isotope distribution. 2. Click the Spectrum window to activate it. 3. From the Applications menu, select Isotope Calculator. The Isotope Calculator dialog box (Figure 6-9) is displayed. Figure 6-9 Isotope Calculator Dialog Box Data Explorer™ Software User’s Guide 6-13 Chapter 6 Using Tools and Applications 6 4. Select the Formula or Sequence for the type of isotope to calculate. 5. Select a formula from the list, or type in a new formula. Valid entries for each formula type are: Formula Type Valid Entries Elemental Any element from the Periodic Table. The first letter of two-letter elemental symbols must be capitalized. Spaces do not matter. Amino Acid Sequence One-letter or three-letter amino acid codes. The first letter of amino acid codes must be capitalized. Spaces do not matter. NOTE: Do not include elemental codes when you type the sequence (for example, to specify water of hydration). Invalid results may be generated. DNA Sequence ACGT RNA Sequence ACGU Carbohydrates Any entry listed for carbohydrates from Elemental Composition Limits. See “Setting limits for other result types” on page 6-12. Separate entries with spaces. 6. 6-14 Applied Biosystems Select the Plus H2O check box if you want to calculate the isotopes for the complete molecule (residue plus water of hydration). Using the Isotope Calculator 7. 8. Specify the Add/Subtract Group option. To enable or disable the option, select or deselect the Group Type check box. 6 In the Add/Subtract Group section, select: • Element or group to add or subtract from the formula before calculating the isotope (does not apply if Add/Subtract Group is disabled). • Number of elements or groups to add or remove and the charge state to divide by. NOTE: When Add/Subtract is enabled, the Group Count/Charge field determines the number of groups to add or subtract, and the charge state to calculate. When Add/Subtract is disabled, the Charge field determines the charge state to calculate. • Whether to add or subtract the specified number of elements or groups. NOTE: If you specify Subtract, the group to subtract must be present in the formula you specify in step 5. For more information, see “Add and subtract examples” on page 6-16. 9. Select the Resolution option: • Da—Resolves peaks that are separated by the number of daltons you enter. • Resolving Power—Resolves peaks using the resolving power (M/∆M) you enter. • PPM—Resolves peaks within the number of PPM (parts per million) you enter. Data Explorer™ Software User’s Guide 6-15 Chapter 6 Using Tools and Applications 10. 6 Select the calculation mode: • FWHM—Resolves peaks using the full peak width at peak half height. • 10% Valley—Resolves peaks to a 10 percent valley. 11. Set the Threshold %. Signal intensity below this percent intensity is not included in the calculation or display. NOTE: Setting Threshold % too high distorts the isotope pattern. 12. Click Calculate. The theoretical isotope distribution is displayed in the Spectrum window with an ISO trace label and the elemental formula, or the amino acid, DNA, or RNA sequence. The result is displayed in the Result tab in the Output window. For more information, see “Evaluating traces” on page 6-18. Add and subtract examples The following examples illustrate how the software adds and subtracts groups to or from an elemental formula, and how it applies the charge state field. To calculate a theoretical isotope distribution for doubly sodiated β-cyclodextrin with a +2 charge state (m/z 545) With these parameters specified Formula*—C42H60O30 Group type—Na Group Count/Charge—2 Add 6-16 Applied Biosystems The software performs this calculation (C42H60O30 + 2Na)/2 Using the Isotope Calculator To calculate a theoretical isotope distribution for doubly sodiated and deprotonated β-cyclodextrin with –1 charge state (m/z –1089) With these parameters specified Formula*—C42H60O30Na2 The software performs this calculation (C42H60O30Na2 – H) Group type—H Group Count/Charge—1 Subtract To calculate a theoretical isotope distribution for β-cyclodextrin with +2 charge state (m/z 522) With these parameters specified Formula*—C42H60O30 The software performs this calculation C42H60O30/2 Group type—deselected Charge—2 Add *Formula entry is case sensitive Data Explorer™ Software User’s Guide 6-17 6 Chapter 6 6 Using Tools and Applications Evaluating traces The theoretical isotope distribution is displayed in the Spectrum window with an ISO trace label (Figure 6-10). Figure 6-10 Isotope Trace If you have the Replace mode set to Add in the Display Trace dialog box, a new trace is added. If you have the Replace mode set to Replace, the isotope trace replaces the active trace. For more information on Replace mode, see “Setting the Replace mode” on page 2-17. To evaluate the trace, you can: • Overlay theoretical and observed isotope patterns. See Section 2.4.8, Overlaying Traces, for information. • Add new traces and calculate the isotope multiple times using different settings, then compare or overlay the different calculations. Returning to the original spectrum 6-18 Applied Biosystems To return to the original trace, see “Returning to the original spectrum” on page 5-3. Using the Isotope Calculator Results The results of the calculation are displayed in the Result tab of Output window (Figure 6-11). Figure 6-11 Isotope Calculation Results in Output Window If results are not calculated If results are not calculated, you may have tried to remove a group that is not present in the formula. Data Explorer™ Software User’s Guide 6-19 6 Chapter 6 Using Tools and Applications 6 6.3 Using the Mass Resolution Calculator Calculating mass resolution To calculate mass resolution: 1. Display the spectrum of interest. Make sure the Spectrum window is active. 2. If you are examining Voyager data, baseline correct the spectrum. The Peak Height used by the Resolution calculator is calculated from 0. For information, see Section 5.8.2, Using Baseline Correction. NOTE: Baselines in Mariner data are typically at 0. Baseline correction is not necessary. 3. From the Tools menu, select Resolution Calculator. NOTE: If the Spectrum window is not active, Resolution Calculator does not appear on the Tools menu. 4. In the Resolution Calculator dialog box (Figure 6-12), set the percentage of peak height at which to calculate resolution. The default is 50%, which calculates the resolution at the full width/half maximum (FWHM) of a peak. NOTE: Measuring resolution at the full width/half maximum is the industry standard. Use 50% Peak Height for most applications. If a peak is not resolved at the Peak Height % you set, an error message is displayed in the Result tab. 6-20 Applied Biosystems Using the Mass Resolution Calculator 6 FWHM=50% peak height Figure 6-12 Mass Resolution Calculator 5. Specify the peak for which to calculate resolution by doing one of the following: • Type in a Mass/Charge value. • In the Spectrum window, right-click-drag over the peak for which you want to calculate resolution. The mass is automatically entered in the Resolution Calculator dialog box. NOTE: If you right-click-drag over more than one peak, the mass of the highest peak is used. 6. Click OK. Data Explorer™ Software User’s Guide 6-21 Chapter 6 Using Tools and Applications The result is displayed in the Output window (Figure 6-13). 6 Resolution calculator results Figure 6-13 Resolution Calculator Results 6-22 Applied Biosystems Using the Signal-to-Noise Ratio Calculator 6.4 Using the Signal-to-Noise Ratio Calculator Description A signal-to-noise ratio is typically used to describe how well a peak of interest in a spectrum or chromatogram is distinguished from background noise. The Data Explorer software provides two signal-to-noise ratio methods that calculate signal-to-RMS noise (electronic and chemical): • Auto—You specify the peak for calculation and the software automatically calculates the average noise across the spectrum. • Manual—You specify the peak and the baseline region for calculation. For accurate results, this method requires a flat (non-rising) baseline that does not include peaks. The manual method is useful when evaluating a narrow region around a peak to determine the relative significance of a peak. Calculating signal-to-noise ratio To calculate a signal-to-noise ratio: 1. Click the Spectrum window to activate it. 2. From the Tools menu, select S/N Calculator. The Signal-to-Noise Calculator dialog box (Figure 6-14) is displayed. Figure 6-14 Signal-to-Noise Dialog Box Data Explorer™ Software User’s Guide 6-23 6 Chapter 6 Using Tools and Applications 3. 6 Select the method to use, then right-click-drag on peaks in the trace to enter the associated values displayed for the method you select: • Auto—Right-click-drag across the apex of the peak for signal-to-noise calculation. The software automatically calculates the average noise across the entire spectrum. The noise calculation is not affected by the presence of peaks or a poor baseline. • Manual—Right-click-drag across the apex of the peak for signal-to-noise calculation. Right-click-drag across a flat region of the baseline to use to determine the RMS noise for the calculation. NOTE: If you enter a baseline value instead of right-click-dragging, the software uses an RMS value of 1.000 to perform the signal-to-noise calculation. 4. 6-24 Applied Biosystems Click OK. The result is displayed in the Output window. Using the Ion Fragmentation Calculator 6.5 Using the Ion Fragmentation Calculator Description 6 The Ion Fragmentation calculator generates a list of possible fragment masses for a peptide sequence you enter. It can calculate the masses for: • Multiply charged fragments you may see in Mariner data. • PSD fragments you may see in Voyager data. If the calculated fragments are present in the current data file, you can label fragments. The calculator includes a list of defined amino acids and residues that you can add to as needed. Using the Ion Fragmentation calculator To use the Ion Fragmentation Calculator: 1. Display the spectrum of interest. 2. Click the Spectrum window to activate it. 3. From the Applications menu, select Ion Fragmentation Calculator. The Ion Fragmentation Calculator dialog box (Figure 6-15) is displayed. Data Explorer™ Software User’s Guide 6-25 Chapter 6 Using Tools and Applications 6 Figure 6-15 Ion Fragmentation Calculator Dialog Box 4. Type or copy the amino acid or residue sequence of interest. Use single-letter codes. Sequence codes are case-sensitive. Click the User-Defined Amino Acids button to display the list of allowed residues and their associated codes. 6-26 Applied Biosystems 5. Select the N-terminus and C-terminus options for the sequence. 6. Specify the cysteine modification, and specify the mass type (average or monoisotopic) for the calculated fragment ion masses. Using the Ion Fragmentation Calculator Setting Options 7. Click Options. The Ion Fragmentation Options dialog box (Figure 6-16) is displayed. Figure 6-16 Ion Fragmentation Options Dialog Box 8. Select the ion types to display, and whether or not to generate results for internal fragments. 9. If you are analyzing Mariner data, select Calculate multiple charge states if desired, then specify the maximum charge state to calculate (up to 12). 10. Type the Mass Tolerance to use when labeling peaks. Masses that fall outside the tolerance are not labeled. 11. To add the labels generated by this operation to the list of available user labels, select Append new labels to existing user label list. For more information, see Section 3.5.3, Setting Custom Peak Labels. 12. Click OK. Data Explorer™ Software User’s Guide 6-27 6 Chapter 6 6 Using Tools and Applications Setting 13. Click User-Defined Amino Acids. user-defined amino The User-Defined Amino Acids dialog box (Figure 6-17) acids is displayed. Figure 6-17 User-Defined Amino Acids Dialog Box 14. Add amino acid definitions and codes as needed. NOTE: You cannot modify pre-defined amino acids. User-defined amino acids are not saved when you close the Data Explorer software. 15. Click Close. Calculating the 16. Click Induce Fragmentation. fragment ions Results are displayed in the Ion Fragmentation Calculator dialog box (Figure 6-18). 6-28 Applied Biosystems Using the Ion Fragmentation Calculator 6 Figure 6-18 Ion Fragmentation Results for Synthetic Peptide (PPPPPPPPPPPPAR) Results Results are displayed in the: • Ions table—Lists the masses for each fragment and ion type. • Internal fragments table—Lists possible internal sequences, if you enabled this option in the Options dialog box (see Figure 6-16 on page 6-27). Click Clear Table Info to clear results. You can change options and recalculate ion fragmentation results. Data Explorer™ Software User’s Guide 6-29 Chapter 6 Using Tools and Applications Labeling peaks 6 Click Label Peaks. The ion peaks specified in the Options dialog box are labeled on the trace if they are present (Figure 6-19). Hint: To screen out labels, decrease the Label Tolerance in the Options dialog box. Figure 6-19 Labeled Ion Fragmentation Peaks for Synthetic Peptide (PPPPPPPPPPPPAR) Hint: The Label Peaks function creates User Labels in the data file. To view, select Peak Label from the Peaks menu, then select User Label Setup. Click Save As to save the labels in a .LBS file for use with other data files. For more information, see Section 3.5.3, Setting Custom Peak Labels. To display the original labels, select Peak Label from the Peaks menu, then deselect User Labels. Creating a calibration reference file (.REF) 6-30 Applied Biosystems To create a PSD calibration reference file, click Create Reference File. For more information, see “Creating PSD Calibration Reference (.REF) Files” on page 8-21. Using the Elemental Targeting Application 6.6 Using the Elemental Targeting Application Description 6 The Elemental Targeting application determines if observed masses in a spectrum correspond to chemical formulas you enter. This application generates a theoretical isotope pattern for the mass you enter using the Mass Resolution specified in Basic Peak Detection settings. It then compares each observed mass and isotope pattern to the theoretical mass and isotope pattern for each composition you entered, and reports an isotope match score that reflects how closely they match. Use the Elemental Targeting application to screen a spectrum for the presence of specific chemical compounds. Using the Elemental Targeting application To use the Elemental Targeting application: 1. Display the spectrum of interest. 2. Click the Spectrum window to activate it. 3. From the Applications menu, select Elemental Targeting. The Elemental Targeting dialog box (Figure 6-20) is displayed. 4. Enter the Mass Tolerance for the evaluation. 5. If the displayed Mass Peak Resolution is not appropriate for this calculation, change the setting in the Basic Settings tab of the Spectrum Peak Detection Setup dialog box. For more information, see Section 3.2.4, Peak Detection Parameter Descriptions. 6. Enter formulas in the Element list by doing either of the following: • Click , type a formula, select a charge state, then click OK. • Click Import, then select a tab-delimited .TXT file that contains formulas and charge states. Data Explorer™ Software User’s Guide 6-31 Chapter 6 Using Tools and Applications Note the following when entering formulas: 6 • Spaces do not matter for formula. The first letter of two-letter elemental symbols must be capitalized (for example, Na). • To ensure a better match between theoretical and observed isotopes, include the appropriate number of protons in the formula you enter for multiply charged ions. Figure 6-20 Elemental Targeting Dialog Box 7. 6-32 Applied Biosystems Click Calculate. Using the Elemental Targeting Application Displaying results The results of the calculation are displayed in the Elemental Target tab of the Output window (Figure 6-21). Figure 6-21 Elemental Targeting Results in the Output Window Results include: • Index—Sequential number assigned to each result. • Formula—Elemental composition you entered. • m/z—Mass/charge of an observed peak that, compared to the theoretical mass of the formula specified, is within the Mass Tolerance and Resolution you specified. • Charge—Charge of the observed peak. • Isotope Match Score—Number between 0.0 and 1.0 that reflects how well the observed peak matches the theoretical formula, based on mass and isotope pattern. A higher number represents a better match. • Isotope Match Intensity—Peak area (counts) that overlaps between the observed isotope pattern and the theoretical isotope pattern. A higher number represents a better match. Displaying the theoretical isotope distribution To display the theoretical isotope distribution for a formula, double-click the line in the Elemental Target tab of the Output window. The theoretical isotope trace is displayed in the Spectrum window with an ISO trace label and the elemental formula. Data Explorer™ Software User’s Guide 6-33 6 Chapter 6 Using Tools and Applications 6 6.7 Using the Macro Recorder Description Macros provided In this section The Macro Recorder feature in Data Explorer allows you to set up multi-step tasks to execute automatically when you click a macro button. The Macro Recorder feature creates a Visual Basic script of your actions as you record the macro, then executes the script when you run the macro. Macros provided with the Data Explorer software are described in Appendix C, Data Explorer Toolbox (Visual Basic Macros). This section includes: • Before using the macro recorder • Recording a macro • Assigning macros to buttons • Running a macro • Deleting a macro • Advanced macro editing • Importing or Exporting Macros in DATAEXPLORER.VB6 • Running macros automatically when opening and closing files 6.7.1 Before Using the Macro Recorder Importing macros provided Macros are provided with the Data Explorer software, but are not available for use until you import them into the Data Explorer project. For information, see Section 6.7.7, Importing or Exporting Macros in DATAEXPLORER.VB6. Maximum number of macros You can create an unlimited number of macros. However, there are only 10 buttons in the toolbar to which you can assign macros at a given time. You can change the macro assigned to a button. 6-34 Applied Biosystems Using the Macro Recorder Location of macros Displaying the macro toolbar All macros you record are stored in a file called DATAEXPLORER.VB6 in the C:\MARINER\PROGRAM or C:\VOYAGER directory. If the macro toolbar (Figure 6-22) is not displayed: 1. Select Toolbar from the View menu. 2. Select Macros, then click Close. Figure 6-22 Macro Toolbar If a numbered macro button is disabled (gray), no macro has been assigned to it. If a numbered macro button is enabled (green), a macro has been assigned to it. For a description of a toolbar button, place the cursor on the toolbar button. The name you assign to the macro or the default macro name is displayed below the button. Functions not supported Most commands in the Data Explorer software can be included in a macro that you create with the Macro Recorder. The following menu commands are not supported by the Macro Recorder: Menu File Commands Not Supported • • • • • • • • • • • • Open Close Close All Result Spectrum—Delete Convert All Spectra—New Data Format Export—Result Spectrum Settings—Save Processing Settings Settings—Restore Graphic Settings Settings—Save Graphic Settings Settings—Revert to last saved Graphic/Processing Settings Print Setup Exit Continued Data Explorer™ Software User’s Guide 6-35 6 Chapter 6 6 Using Tools and Applications Menu View Commands Not Supported No commands supported Display • Add/Remove Traces NOTE: The and buttons are supported by the Macro Editor. • • • • Processing History Range Graphic Options* Default—Revert to Last Graphic Settings Process • • • • • • • • PSD processing Mass Calibration—Manual Calibration Mass Calibration—PSD calibration Mass Calibration—Automatic Calibration Mass Calibration—Revert to instrument calibration Mass Calibration—Edit/Create Reference File Dual Spectral Trace Arithmetic Multiple Charge—Mass Deconvolution Peaks • • • Peak Detection* Peak Label* Insert Peak (chromatogram) Tools • • • • Processing History Options Customize Toolbar Customize ToolMenu Macro commands, including Automatic Macros Applications • • Elemental Targeting Ion Fragmentation Calculator Window No commands supported * You can apply specific Graphic Options or Peak Detection settings by creating a macro that loads a .SET file containing the desired settings. You can apply specific peak labels by creating a macro that loads a .USR (user label file) containing the desired labels. Functions you perform in the Output window, for example, sorting or copying the peak list, are not supported by the Macro Recorder. 6-36 Applied Biosystems Using the Macro Recorder 6.7.2 Recording a Macro 6 To record a macro: 1. Open a data file. 2. From the Tools menu, select Record New Macro. The Record Macro dialog box (Figure 6-23) is displayed. Figure 6-23 Record Macro Dialog Box 3. Type a name and a description if desired. 4. Click OK. 5. Select the commands you want to automate with the macro. For example, select Noise Filter/Smooth from the Process menu, select the smoothing method, specify the associated parameter, then click OK. Not all functions in Data Explorer are supported. See “Functions not supported” on page 6-35. 6. From the Tools menu, select Stop Macro Recording. The macro is saved and added to the DATAEXPLORER.VB6 file. Data Explorer™ Software User’s Guide 6-37 Chapter 6 6 Using Tools and Applications 6.7.3 Assigning Macros to Buttons Only macros present in the DATAEXPLORER.VB6 file can be assigned to buttons and run in the Data Explorer software. NOTE: If you have installed a new version of Data Explorer software, new macros may be provided. New macros are not available for use until you import them into the Data Explorer project. For information, see Section 6.7.7, Importing or Exporting Macros in DATAEXPLORER.VB6. Assigning a macro to a button You can assign macros to 10 buttons. To assign a macro: 1. From the Tools menu, select Assign Macro. The Assign Macro dialog box (Figure 6-24) is displayed. Figure 6-24 Assign Macro Dialog Box 2. Select the button to assign from the list on the left, and the macro to assign from the list on the right. 3. Click Assign. The macro button in the toolbar to which you assigned the macro turns from gray to green (if it did not previously have a macro assigned to it). 6-38 Applied Biosystems Using the Macro Recorder De-assigning a macro from a button To de-assign a macro from a button, select the macro button in the Assign Macro dialog box, then click De-assign. 6.7.4 Running a Macro You can run a macro using a: • • Using a toolbar button Toolbar button Menu command To run a macro using the toolbar button: 1. Open the data file on which you want to run the macro. 2. Click the button assigned to the macro you want to run. Hint: Place the cursor on a macro button to display the name of the macro assigned to the button. The macro executes. Using the menu command To run a macro using the menu: 1. Open the data file on which you want to run the macro. 2. From the Tools menu, select Macros. The Macros dialog box (Figure 6-25) is displayed. Data Explorer™ Software User’s Guide 6-39 6 Chapter 6 Using Tools and Applications 6 Figure 6-25 Macros Dialog Box 3. Select the macro to run from the list. 4. Click Run. The macro executes. If the macro contains a syntax error If the macro contains a syntax error, it may cause the Data Explorer software to close unexpectedly. If this occurs, restart the Data Explorer software and examine the macro in the Visual Basic Editor. See Section 6.7.6, Advanced Macro Editing. Macro lines containing syntax errors are displayed in color in the Visual Basic Editor. For information on correcting errors, refer to the online help available in the Visual Basic Editor. 6-40 Applied Biosystems Using the Macro Recorder 6.7.5 Deleting a Macro 6 To delete a macro: 1. From the Tools menu, select Macros. The Macros dialog box (Figure 6-26) is displayed. Figure 6-26 Macros Dialog Box 2. Select the macro to delete from the list. 3. Click Delete. NOTE: Other buttons on this dialog box are for advanced editing. Refer to the online help available within the Visual Basic Editor. Data Explorer™ Software User’s Guide 6-41 Chapter 6 6 Using Tools and Applications 6.7.6 Advanced Macro Editing Accessing the Visual Basic Editor You can access the Visual Basic Editor to enhance or edit a script created by the Macro Recorder in Data Explorer, or to create a new script. Access the Visual Basic Editor from Data Explorer in three ways: • Select Visual Basic Editor from the Tools menu. • Select Macros from the Tools menu, select the macro to edit, then click Edit. • Click in the Macro toolbar The DATAEXPLORER.VB6 file is displayed in the Visual Basic Project Explorer window. Macro scripts created using the Macro Recorder in Data Explorer are stored in Module folders in the Project Explorer window. Displaying scriptable objects To display a list of the scriptable objects available within Data Explorer, select Object Browser from the View menu in the Visual Basic Project Explorer window. For information on using the Visual Basic Editor, refer to the online help in the Visual Basic Editor. Numbering sequence 6-42 Applied Biosystems When you create Macro scripts, the Visual Basic Editor uses a numbering sequence that starts at 0. If you specify a number of 1 in the Visual Basic Editor, it indicates the second item in a sequence, not the first. For example, if you create a script to sort the Peak List in the Output window, and you want to sort by Area (column 8 in the Peak List), specify sorting on column 7 in the script. Using the Macro Recorder 6.7.7 Importing or Exporting Macros in DATAEXPLORER.VB6 6 You can import macros into, or export macros from, the DATAEXPLORER.VB6 project for use in the Data Explorer software. Importing when new versions of Data Explorer software installed When you install a new version of the Data Explorer software: • The DATAEXPLORER.VB6 file is not overwritten. This allows you to maintain any macros you have developed in the DATAEXPLORER.VB6 file. • New macros are supplied in stand-alone ASCII format (.BAS and .FRM files) in C:\MARINER\PROGRAM\ MACROS or C:\VOYAGER\MACROS and are not incorporated into the DATAEXPLORER.VB6 file automatically. To make the new macros available for use, import them into the DATAEXPLORER.VB6 file. Importing NOTE: You can also import by opening NT Explorer, then click-dragging the files into the DataExplorerProject displayed in the Visual Basic Editor window. To import macros: 1. Access the Visual Basic Editor from Data Explorer as described in Section 6.7.6, Advanced Macro Editing. 2. From the File menu, select Import File. 3. Select the .BAS file (Basic File module containing the macros) or .FRM file (form containing the user interface for the macros, if applicable), then click Open. Data Explorer™ Software User’s Guide 6-43 Chapter 6 Using Tools and Applications The selected macros are imported into the DATAEXPLORER.VB6 project. The .BAS files are included in the Modules folder in the DataExplorerProject, and the .FRM files are included in the Forms folder in the DataExplorerProject. All macros imported into the DataExplorerProject are displayed in the list of macros you can assign in the Data Explorer software. See Section 6.7.3, Assigning Macros to Buttons. 6 Exporting To export macros: 1. Access the VBA Editor from Data Explorer as described above. 2. From the File menu, select Export File. 3. Select the .BAS or .FRM file to export, then click Save. NOTE: You have to export modules or forms one at a time. 6-44 Applied Biosystems Using the Macro Recorder 6.7.8 Running Macros Automatically When Opening and Closing Files 6 You can set the Data Explorer software to automatically run macros you previously created when you open or close a data file. For information on creating macros, see Section 6.7.2, Recording a Macro. To set up automatic macros: 1. From the Tools menu, select Automatic Macros. The Automatic Macro Setup dialog box (Figure 6-26) is displayed. Figure 6-27 Automatic Macro Setup Dialog Box 2. Select File Open Macro or File Close Macro, as desired, then select the macro to run when you open or close a data file. 3. Click OK. Data Explorer™ Software User’s Guide 6-45 Chapter 6 Using Tools and Applications 6 6-46 Applied Biosystems Chapter 7 Data Explorer Examples 7 This chapter contains the following sections: 7.1 7.2 Mariner Data Examples ...................................... 7-2 7.1.1 Improving Signal-To-Noise Ratio ......... 7-2 7.1.2 Deconvoluting and Evaluating Unresolved Chromatographic Peaks ... 7-4 7.1.3 Determining if a Peak is Background Noise .............................. 7-8 Voyager Data Examples..................................... 7-11 7.2.1 Detecting and Labeling Partially Resolved Peaks ...................7-11 7.2.2 Processing Before Calibrating to Optimize Mass Accuracy .................. 7-14 7.2.3 Detecting Peaks from Complex Digests ............................... 7-18 Data Explorer™ Software User’s Guide 7-1 Chapter 7 Data Explorer Examples 7.1 Mariner Data Examples This section includes: • Improving signal-to-noise ratio • Deconvoluting and evaluating unresolved chromatographic peaks • Determining if a peak is background noise 7 7.1.1 Improving Signal-To-Noise Ratio Overview You can improve the signal-to-noise ratio for low-level components in the total ion chromatogram (TIC) by creating an extracted ion chromatogram for the mass of interest. Each data point in the TIC represents the sum of all ion intensities for all masses in the corresponding spectrum. By creating an extracted ion chromatogram for a specific mass, you can screen out ion contribution from masses that you are not interested in. Creating an extracted ion chromatogram 7-2 Applied Biosystems The following example illustrates how you can create an extracted ion chromatogram to improve the signal-to-noise ratio for reserpine (609 Da): 1. Display the data file. 2. In the Chromatogram window, click in the toolbar, or set the Trace Replace mode to Add, if you want to add a new trace. See Section 2.4.4, Adding Traces from the Same Data File to a Window, for information. 3. From the Display menu, select Trace, then select Extracted Ion. 4. In the Extracted Ion Chromatogram window, select Center/Window, then type the mass of interest (609 Da) and the window for the mass (for example, 0.5 Da). 5. Click OK. Mariner Data Examples Figure 7-1 illustrates the improved signal-to-noise ratio in the extracted ion chromatogram for three replicate loop injections. 7 Original TIC containing all masses Extracted ion chromatogram for 609 Da with improved signal-to-noise ratio Figure 7-1 Improving Signal-To-Noise Ratio with an Extracted Ion Chromatogram Data Explorer™ Software User’s Guide 7-3 Chapter 7 Data Explorer Examples 7.1.2 Deconvoluting and Evaluating Unresolved Chromatographic Peaks Overview 7 You can use the Data Explorer software to deconvolute chromatographic peaks and obtain masses for each component by: • Creating a combined spectrum to identify the coeluting species by mass • Creating extracted ion chromatograms for the masses, and comparing the extracted ion chromatograms to the original TIC containing the unresolved peaks You can then create a combined spectrum from each extracted ion chromatogram to evaluate the spectral data. Creating a combined spectrum The following example illustrates how to deconvolute two unresolved chromatographic peaks in a tryptic digest of cytochrome c: 1. Display the data file. 2. In the Chromatogram window, zoom in on the unresolved peaks (Figure 7-2). Figure 7-2 Unresolved Peaks in Cytochrome C 3. 7-4 Applied Biosystems In the Chromatogram window, right-click-drag over the unresolved peak pair. Mariner Data Examples The combined spectrum is displayed (Figure 7-3), with two intense peaks at 410 Da and 723 Da. Generate extracted ion chromatograms as described below to determine if these peaks are the coeluting components. NOTE: If these peaks do not yield chromatograms with profiles that correspond to the unresolved peaks, try another spectral peak. 7 Figure 7-3 Combined Spectrum for Unresolved Peaks in Cytochrome C Creating extracted ion chromatograms To create extracted ion chromatograms: 1. With the Chromatogram window activated, click in the toolbar two times to add two traces. Click an added trace to activate it. 2. In the Spectrum window, right-click-drag over the first peak. The extracted ion chromatogram is displayed. 3. In the Chromatogram window, click the second added trace to activate it. 4. In the Spectrum window, right-click-drag over the second peak. The extracted ion chromatogram is displayed. Figure 7-4 illustrates the peaks deconvoluted from the original unresolved peaks. Data Explorer™ Software User’s Guide 7-5 Chapter 7 Data Explorer Examples 7 Original TIC containing unresolved peaks Extracted ion chromatograms with deconvoluted peaks Figure 7-4 Deconvoluting Unresolved Chromatographic Peaks Creating combined spectra 7-6 Applied Biosystems Create a combined spectrum for each extracted ion chromatogram: 1. Activate the Spectrum window, then click toolbar two times to add two traces. in the 2. Right-click-drag over the first half of the mass range in the 410 extracted ion chromatogram. 3. Activate the second trace in the Spectrum window. 4. Right-click-drag over the second half of the mass range in the 723 extracted ion chromatogram. Mariner Data Examples Figure 7-5 illustrates the combined spectra for the deconvoluted peaks. Note that both spectra contain a peak at 391 Da which requires investigation to determine if it is a low-level component or background noise. See Section 7.1.3, Determining if a Peak is Background Noise. 7 Both combined spectra contain a peak at 391 Da Figure 7-5 Combined Spectra for Deconvoluted Peaks Data Explorer™ Software User’s Guide 7-7 Chapter 7 Data Explorer Examples 7.1.3 Determining if a Peak is Background Noise Overview To determine if spectral peaks represent low-level components or if they are due to solvent contribution, you can: 7 Subtracting spectral peaks • Subtract the spectral peaks from the chromatogram • Create an extracted ion chromatogram for the spectral peaks The following example uses the chromatograms and spectra from Section 7.1.2, Deconvoluting and Evaluating Unresolved Chromatographic Peaks. It illustrates how to subtract baseline and determine if the spectral peak observed at 391 Da (Figure 7-5 on page 7-7) is eliminated. To subtract spectra: 1. Activate the first extracted ion chromatogram in Chromatogram window (see Figure 7-4 on page 7-6). 2. From the Process menu, select Add/Subtract Spectra. 3. Click , then right-click-drag over the peak in the extracted ion chromatogram. The spectrum range is displayed in the Spectra To Be Added list in the Add and Subtract Spectra dialog box (Figure 7-6). 4. In the Add and Subtract Spectra dialog box, click anywhere in the Spectra To Be Subtracted list. 5. In the TIC, right-click over a region of baseline that does not contain any peaks. NOTE: When selecting spectra to subtract, select from the TIC. The baseline in the extracted ion chromatograms is for a selected mass and does not represent all components which may be present. 7-8 Applied Biosystems Mariner Data Examples The spectrum range is displayed in the Spectra To Be Subtracted list in the Add and Subtract Spectra dialog box (Figure 7-6). 7 Figure 7-6 Subtracting Spectra 6. Click OK. The subtracted spectrum is displayed (Figure 7-7 on page 7-10). Data Explorer™ Software User’s Guide 7-9 Chapter 7 Data Explorer Examples Figure 7-7 Subtracted Spectrum 7 The peak at 391 is still present, which indicates one of the following conditions: • • You did not subtract sufficient baseline The peak is a coeluting component To evaluate further, create an extracted ion chromatogram for 391 Da as described below and evaluate the signal. Creating extracted ion chromatogram To create the extracted ion chromatogram, right-click-drag over the peak at 391 Da in the spectrum trace. NOTE: You can also create an extracted ion chromatogram by selecting Trace from the Display menu, selecting Extracted Ion, then entering a mass. Figure 7-8 illustrates the extracted ion chromatogram for mass 391. The signal is relatively consistent, indicating that it is background instead of a component peak. Figure 7-8 Extracted Ion Chromatogram for Mass 391 Da 7-10 Applied Biosystems Voyager Data Examples 7.2 Voyager Data Examples This section includes: • Detecting and labeling partially resolved peaks • Processing before calibrating to optimize mass accuracy • Detecting peaks from complex digests 7 7.2.1 Detecting and Labeling Partially Resolved Peaks If peaks are not labeled If peaks are partially resolved and the peaks of interest are not labeled, you can adjust the following peak detection parameters: If... Adjust the following... Peaks represent two compounds, and you want both peaks labeled In the Peak Label dialog box, select Allow Overlapping Peak Labels. OR On the Basic Settings tab in Peak Detection, set %Max Peak Area to 0, then adjust the %Base Peak Intensity until peaks are detected. OR On the Peak Processing tab in Peak Detection, change the default Integration Baseline Setting from Valley-to-Valley to Valley-to-Baseline. Peaks represent partially resolved isotopes, and you want to label and detect the average mass On the Basic Settings tab in Peak Detection, decrease the Mass Resolution setting until the isotopic envelope is detected. Figure 7-9 shows a spectrum with partially resolved peaks that represent two compounds. Data Explorer™ Software User’s Guide 7-11 Chapter 7 7 Data Explorer Examples Figure 7-9 Partially Resolved Peaks That Represent Two Compounds, Minor Component Not Detected Adjusting peak detection To adjust peak detection: 1. Click in the toolbar or select Peak Detection from the Peaks menu. The Spectrum Peak Detection Setup dialog box is displayed with the Basic Settings tab (Figure 7-10) displayed. Figure 7-10 Spectrum Peak Detection Setup— Basic Settings Tab 7-12 Applied Biosystems Voyager Data Examples 2. Do either of the following: • Change the %Max Peak Area from 1 (the default) to 0, and the %Base Peak Intensity from 0 (the default) to 1. • Click the Peak Processing tab and change the default Integration Baseline Setting from Valley-to-Valley to Valley-to-Baseline. 3. Click OK. Figure 7-11 shows the partially resolved peaks that are now labeled. Figure 7-11 Partially Resolved Peaks Labeled Data Explorer™ Software User’s Guide 7-13 7 Chapter 7 Data Explorer Examples 7.2.2 Processing Before Calibrating to Optimize Mass Accuracy This section includes: • Calibrating without baseline correcting and deisotoping • Before calibrating • Calibrating 7 Calibrating without baseline correcting and deisotoping For optimum mass accuracy, baseline correct and deisotope a spectrum before calibrating. Figure 7-12 shows a spectrum before calibration. Figure 7-12 Spectrum Before Calibration Figure 7-13 shows a spectrum that has been calibrated without initial baseline correction and deisotoping. Mass accuracy is not acceptable. Figure 7-13 Calibration Without Baseline Correction or Deisotoping 7-14 Applied Biosystems Voyager Data Examples Before calibrating Baseline correcting To optimize mass accuracy, do the following before calibrating: 1. Display the spectrum of interest. 2. From the Process menu, select Baseline Correction. The spectrum is baseline corrected. For more information, see Section 5.8.2, Using Baseline Correction. Deisotoping 3. From the Peaks menu, select Peak Deisotoping. The Deisotoping dialog box (Figure 7-14) is displayed. Figure 7-14 Deisotoping Dialog Box 4. For this example spectrum, specify H for Adduct and C6H5NO for Generic Formula. 5. Click OK. Figure 7-15 shows the baseline-corrected, deisotoped spectrum before calibration. For more information on deisotoping, see Section 3.4, Deisotoping a Spectrum. Figure 7-15 Baseline-Corrected, Deisotoped Spectrum Before Calibration Data Explorer™ Software User’s Guide 7-15 7 Chapter 7 Data Explorer Examples Calibrating To calibrate the deisotoped spectrum: 1. From the Peaks menu, select Peak Label, and select the Mass Label Type (peak apex or peak centroid) to use for calibration. Click OK. 2. From the Process menu, select Mass Calibration and then select Manual Calibration. The Manual Calibration dialog box is displayed (Figure 7-16). 7 Figure 7-16 Manual Calibration Dialog Box 3. Click , then select the VOYAGER.REF calibration reference file. 4. Enter Reference Matching and Calibration Criteria. NOTE: For descriptions of calibration parameters, see Section 5.3, Manual Calibration. 7-16 Applied Biosystems Voyager Data Examples Matching peaks 5. Click Match Peaks and Solve. The software compares observed masses in the spectrum to reference masses in the selected reference file, lists the matches in the Peak Matched list, calibrates the spectrum, and displays the calibration statistics in the Output window. NOTE: If you set Mass Tolerance too low, no peaks will match. You can also add peaks to the Peak Matched list by right-click-dragging on a peak in the spectrum, then selecting the mass from the reference Peak Information dialog displayed. Click Solve and Plot after manually adding masses. The spectrum is calibrated and displayed with an MC trace label. The calibration statistics are displayed in the Output window. Applying 6. If the calibration statistics are acceptable, click Apply Calibration. Figure 7-17 shows the deisotoped spectrum after calibration, with improved mass accuracy. Figure 7-17 Deisotoped Spectrum After Calibration Data Explorer™ Software User’s Guide 7-17 7 Chapter 7 Data Explorer Examples 7.2.3 Detecting Peaks from Complex Digests Overview Complex digests often contain hundreds of peaks which may have relatively low signal-to-noise ratios. To quickly screen out noise and detect peaks of interest: • Noise filter/smooth to remove initial noise. 7 • Set initial peak detection thresholds low enough to detect all peaks, to ensure that monoisotopic peaks are detected for proper deisotoping. • Deisotope to identify isotope peak clusters. The deisotope function amplifies peak intensity based on the total area of all peak areas in the isotope cluster. It does not amplify noise peaks. • Increase peak detection thresholds to eliminate noise peaks. Figure 7-18 represents a spectrum trace from a digest. Overlapping Peak Labels are enabled to illustrate the large number of peaks detected in the spectrum (over 300 peaks contained in the peak list displayed in the Output window). Figure 7-18 Digest with Several Hundred Peaks Detected (Allow Overlapping Labels Enabled) 7-18 Applied Biosystems Voyager Data Examples Procedure Noise filtering/smoothing To detect peaks from complex mixtures: 1. Display the spectrum of interest. 2. From the Process menu, select Noise Filter/Smooth. The Noise Filter/Smooth dialog box (Figure 7-19) is displayed. 7 Figure 7-19 Noise Filter/Smooth Dialog Box 3. Select Default Smoothing or Noise Filter (with a Correlation Factor of 0.7), then click OK. For more information, see Section 5.7, Noise Filtering/Smoothing. Setting detection thresholds 4. Click in the toolbar or select Peak Detection from the Peaks menu. The Spectrum Peak Detection Setup dialog box is displayed with the Basic Settings tab (Figure 7-20) displayed. Data Explorer™ Software User’s Guide 7-19 Chapter 7 Data Explorer Examples 7 Figure 7-20 Spectrum Peak Detection Setup— Basic Settings Tab 5. Click Use Advanced Settings. The Advanced Settings tab is displayed (Figure 7-21). 7-20 Applied Biosystems Voyager Data Examples 7 Figure 7-21 Spectrum Peak Detection Setup— Advanced Settings Tab 6. Set Minimum Area to 0. 7. Click the Basic Settings tab (see Figure 7-20 on page 7-20), then set %Max Peak Area to 0 or 0.1. 8. Click Apply. Note that many peaks are added to the peak list in the Output window. For more information, see Section 3.2, Peak Detection. Deisotoping 9. From the Peaks menu, select Peak Deisotoping. The Deisotoping dialog box (Figure 7-14) is displayed. Data Explorer™ Software User’s Guide 7-21 Chapter 7 Data Explorer Examples 7 Figure 7-22 Deisotoping Dialog Box 10. For this example spectrum, specify H for Adduct and C6H5NO for Generic Formula. 11. Click OK. For more information on deisotoping, see Section 3.4, Deisotoping a Spectrum. Increasing 12. In the Basic Settings tab in Global Thresholds (see Figure 7-20 on page 7-20), increase %Max Peak Area detection to a setting between 0.1 and 1% until the peaks of thresholds interest are detected and noise is screened out. Figure 7-23 shows the trace after deisotoping. Note that many fewer peaks are detected. By further fine-tuning %Max Peak Area, you can screen out additional noise peaks. Figure 7-23 Digest After Noise Filtering, Deisotoping, and Adjusting Detection Thresholds 7-22 Applied Biosystems Chapter 8 Viewing Voyager PSD Data 8 This chapter contains the following sections: 8.1 Displaying PSD Data ....................................... 8-2 8.2 Applying Fragment Labels ............................... 8-8 8.3 Calibrating a PSD Spectrum .......................... 8-10 8.3.1 Checking Peak Detection ............... 8-11 8.3.2 Calibrating ..................................... 8-12 8.3.3 Creating PSD .CAL Files and Applying to Other Data Files .......... 8-20 8.3.4 Creating PSD Calibration Reference (.REF) Files .................. 8-21 8.3.5 Changing the Precursor Mass ........ 8-23 Data Explorer™ Software User’s Guide 8-1 Chapter 8 Viewing Voyager PSD Data 8.1 Displaying PSD Data This section includes: • • • • • Displaying the composite spectrum Advancing through segment traces Displaying multiple segment traces Redisplaying the composite spectrum How the composite spectrum is generated NOTE: For information on acquiring PSD spectra, see the Voyager Biospectrometry Workstation User’s Guide. Displaying the composite spectrum 8 NOTE: You cannot display the PSD data you are currently acquiring in the Instrument Control Panel in the Data Explorer software until you stop the PSD experiment in the Instrument Control Panel. Error messages are displayed if you try to open the file. For more information, see the Voyager Biospectrometry Workstation User’s Guide. To display PSD data: 1. Open the PSD data file of interest in the Data Explorer software as described in Section 2.1, Opening and Closing Data Files. NOTE: PSD data files are named with a .DAT extension. When you acquire PSD data files, include a _PSD suffix when you name PSD data files, for example, Test_PSD, to help you distinguish them from non-PSD data files. The composite spectrum is generated as described in “How the composite spectrum is generated” on page 8-6, and displayed with a Stitched PSD trace label (Figure 8-1). 8-2 Applied Biosystems Displaying PSD Data 8 Figure 8-1 PSD Spectrum in Data Explorer Advancing through segment traces To advance through segment traces, click and . Segments are displayed in the order in which they were acquired. NOTE: If these buttons are not displayed in the toolbar, you can add them. See Section 1.4.3, Customizing Toolbars. Displaying multiple segment traces To display multiple segment traces: 1. Click in the toolbar three times to add three “Not Used” traces. 2. From the Process menu, select PSD Processing. Data Explorer™ Software User’s Guide 8-3 Chapter 8 Viewing Voyager PSD Data The PSD Processing dialog box is displayed (Figure 8-2) and lists all segments contained in the PSD .DAT file in the order in which they were acquired with associated Mirror Ratios and Max Stitch Masses. Column header 8 Figure 8-2 PSD Processing Dialog Box The Max Stitch Mass is equal to the Precursor Mass times the Mirror Ratio. This value reflects the maximum mass of the segment that will be included in the composite spectrum. The mass range included in the segment is approximately 15 percent higher than the Max Stitch Mass. Optimum focus and resolution is achieved for fragment ions close to this mass. 8-4 Applied Biosystems Displaying PSD Data NOTE: The entry number in the PSD Segment list above may not correspond to Segment number specified in the Segment list for acquisition (described in the Voyager Biospectrometry Workstation User’s Guide) if you did not acquire all segments, or did not acquire segments in order of decreasing Mirror Ratio. The number above reflects the order of acquisition. For example, if you listed Segments 1 through 5 for acquisition, but acquired Segments 1, 3, and 5, you would see three entries above that correspond to the three acquired segments. Redisplaying the composite spectrum 3. In the Spectrum window, click the first Not Used trace. 4. In the PSD Processing dialog box, double-click the Entry number of the segment to add. 5. Repeat step 3 and step 4 to display additional segments. 6. To advance through traces, select any trace, then click and . To redisplay the composite spectrum, click Generate Composite in the PSD Processing dialog box (Figure 8-2). Data Explorer™ Software User’s Guide 8-5 8 Chapter 8 Viewing Voyager PSD Data How the composite spectrum is generated The software does the following to generate a composite spectrum: • Evaluates all segments in the .DAT file to determine if there are multiple segments acquired using the same PSD Mirror Ratio. • If there are duplicates, selects the most recently acquired segment to include in the composite spectrum. • Using the precursor ion mass and calibration constants from the PSD calibration in the .DAT file (see “PSD calibration equation” below), determines the region of each segment to include in the composite spectrum as illustrated in Figure 8-3 on page 8-7. • Applies baseline correction and two-standard-deviation noise removal to the composite region of each segment. • “Stitches” the composite regions together and displays the composite spectrum. 8 PSD calibration equation The equation that the Voyager software uses to calculate the mass for fragment ions is: mf 8-6 Applied Biosystems = (α Ri + β) [(tf – tp) + γ (tf – tp)2] + where: mf = Fragment ion mass α, β, γ = Ri = Calibration constants Mirror Ratio α Ri + β mp α+β tf = Fragment ion flight time tp = Precursor ion flight time (at Ri = 1) calculated during acquisition mp = Precursor ion mass entered in PSD Acquisition settings before acquisition, or changed in PSD Processing Displaying PSD Data If you are performing an internal standard calibration, the software determines the constants as listed below: PSD Internal Constant Standard Calibration One-point Two-point or three-point More than three-point Region of segments included in composite spectrum Value Used α Calculated from standard mass β and γ 0 α and β Calculated from standard masses γ 0 α, β, γ Calculated from standard masses The composite spectrum is generated from portions of the segment traces. The upper mass limit of the composite region in each segment is determined by the PSD Mirror Ratio (Rn) with which the segment was acquired and the mass of the precursor ion (mp) (Figure 8-3). included in composite Seg 1 included in composite Seg 2 Seg 3 Seg 4 R 1 x mp included in composite R2 x m p R 3 x mp (If first segment acquired with PSD Mirror Ratio=1.0, upper limit is slightly higher than precursor ion mass) Figure 8-3 Portions of Segment Traces Included in the Composite Spectrum Data Explorer™ Software User’s Guide 8-7 8 Chapter 8 Viewing Voyager PSD Data 8.2 Applying Fragment Labels Overview Use the Ion Fragmentation calculator to apply fragment labels. For detailed information on using the Ion Fragmentation calculator, see Section 6.5, Using the Ion Fragmentation Calculator. Applying labels To apply fragment labels to PSD spectra: 1. From the Applications menu, select Ion Fragmentation Calculator. The Ion Fragmentation Calculator dialog box (Figure 8-4) is displayed. 8 Figure 8-4 Ion Fragmentation Calculator Dialog Box 8-8 Applied Biosystems Applying Fragment Labels 2. In the Sequence text box, type the amino acid sequence of the compound. Use single-letter codes. Set other parameters as needed. For parameter descriptions, see Section 6.5, Using the Ion Fragmentation Calculator. 3. Click Options to specify the fragment peaks to label. 4. Click Induce Fragmentation. 5. Click Label Peaks. The ion peaks specified in Options are labeled on the trace if they are present. Hint: To more selectively apply labels, decrease the Mass Tolerance in the Options dialog box. Hint: This function creates User Labels in the data file. To view, select Peak Label from the Peaks menu, then click User Label Setup. Click Save As to save the labels in a .LBS file for use with other data files. For more information, see Section 3.5.3, Setting Custom Peak Labels. 6. To display the original labels, select Peak Label from the Peaks menu, then deselect User Labels. Data Explorer™ Software User’s Guide 8-9 8 Chapter 8 Viewing Voyager PSD Data 8.3 Calibrating a PSD Spectrum NOTE: Multi-point calibration yields higher mass accuracy than one-point calibration. This section includes: • • • • • When to use this procedure 8 Checking peak detection Calibrating Creating PSD .CAL files and applying to other data files Creating PSD calibration reference (.REF) files Changing the precursor mass Use this procedure to: • Generate a PSD calibration (.CAL) file from a known standard analyzed in PSD mode. You can then export the PSD .CAL file and include the PSD .CAL file in a PSD instrument settings (.BIC) file you use to acquire unknown PSD samples. • Internally calibrate an unknown PSD data file by specifying known monoamino acid fragment ions as the peaks to match during calibration. Overview of creating a PSD .CAL file To create a PSD .CAL file: • Acquire a peptide standard with a known sequence in PSD mode. • Check peak detection as described in Section 8.3.1, Checking Peak Detection. • Create a calibration reference (.REF) file as described in Section 8.3.4, Creating PSD Calibration Reference (.REF) Files. • Internally calibrate the PSD .DAT file as described in Section 8.3.2, Calibrating. Specify the calibration reference (.REF) file created in Section 8.3.4, Creating PSD Calibration Reference (.REF) Files, when calibrating. • Export the calibration (.CAL) file from the PSD .DAT file to use when acquiring unknown samples in PSD mode. 8-10 Applied Biosystems Calibrating a PSD Spectrum 8.3.1 Checking Peak Detection Checking Before calibrating, check that peaks in all segment traces of interest are properly peak detected and that noise is not detected as peaks. Note the following when setting peak detection parameters: • Peak detection settings are applied to the currently displayed composite spectrum or segment traces. • The default peak detection settings (in VOYAGERPSD.SET) have different detection ranges for different mass ranges. You can fine tune ranges and Filter Width settings in ranges to optimize detection. For more information, see “Detection Ranges” on page 3-28. • Fragment ion peaks in segments collected with lower PSD Mirror Ratios are broader and include more data points. Use a higher Filter Width setting for these segments. • Within a segment, resolution increases with increasing mass, as the flight time of the fragment ions approaches the flight time of the precursor. Use a lower Filter Width setting for higher resolutions. For more information, see Section 3.2, Peak Detection. Smoothing If a segment appears noisy, smooth the trace (for example, use 25-point Gaussian smoothing) before calibrating. Data Explorer™ Software User’s Guide 8-11 8 Chapter 8 Viewing Voyager PSD Data 8.3.2 Calibrating This section includes: • • • • • • Calibrating Calibrating Matching peaks automatically Selecting peaks manually Solving and plotting Applying new constants to the data file Selecting calibration peaks for optimum mass accuracy To calibrate a PSD spectrum: 1. Click the Spectrum window to activate it. Select the spectrum of interest. NOTE: You cannot calibrate a result spectrum or a composite spectrum you have accessed from the Processing History command on the Display menu. For more information, see Section 2.4.7, Recalling and Rearranging Traces (Processing History). 8 2. From the Peaks menu, select Peak Label, then select the Mass Label Type (peak apex or peak centroid) to use for calibration. Click OK. 3. From the Process menu, select Mass Calibration, then select PSD Calibration. The PSD Processing dialog box is displayed with the Calibration tab selected (Figure 8-5). Hint: You can also access this dialog box by selecting PSD Processing from the Process menu, then clicking the Calibration tab. 8-12 Applied Biosystems Calibrating a PSD Spectrum Column header buttons 8 Figure 8-5 PSD Processing Dialog Box with Calibration Tab Displayed 4. Select a PSD Calibration Reference File that you generated as described in Section 8.3.4, Creating PSD Calibration Reference (.REF) Files. A calibration reference file called Angiotensin_Fragments.REF is provided with the software. NOTE: Use a calibration reference (.REF) file that specifies the peak type for reference masses as Resolved Isotope Mass (even if they are not resolved isotopes). The calibration routine checks peak width to determine if a peak matches a Resolved Isotope Mass or an Average mass. If narrow peaks are specified as Average Masses in the calibration reference file, the software mistakes these narrow peaks as isotopically resolved and ignores the reference mass. For more information on creating calibration reference files, see Section 5.3.3, Creating or Modifying a Calibration Reference File (.REF). Data Explorer™ Software User’s Guide 8-13 Chapter 8 Viewing Voyager PSD Data NOTE: If the calibration reference file is stored on a network drive, an error message may display when you select the calibration file when performing a calibration. If an error message is displayed, copy the file to a local drive on your computer using Windows NT Explorer. 5. Enter Reference Matching Criteria: • Minimum Intensity—Peaks must be above this intensity to be considered a match. Select the unit for Minimum Intensity, % Relative Intensity or % Relative Area. • Mass Tolerance—Peaks must be within this tolerance of the theoretical mass to be considered a match. Select the unit, m/z or ppm. 6. 8 Select the Peak Weighting Factor. If the calibration includes more than two points, you can apply the following weighting factors to fit points to the curve: • None—All peaks weighted equally • Inverse Peak Width—Narrower peaks are weighted more than broader peaks • Height—More intense peaks are weighted more than less intense peaks 7. Match observed peaks in the spectrum with reference masses in the calibration reference file using one of the following procedures: • “Matching peaks automatically” described below • “Selecting peaks manually” on page 8-16 8-14 Applied Biosystems Calibrating a PSD Spectrum Matching peaks automatically If you want the software to compare observed masses in all segment spectra included in the .DAT file to reference masses in the selected calibration reference file: 1. Click Match. If a mass within the tolerance of any of the masses listed in the calibration reference file is found in any spectrum in the .DAT file, the match is displayed in the Calibration Mass Peak Selection window. CAUTION Use the Match function with care. Before using, ensure that all peaks in all segments are correctly peak detected. The Match function examines the complete mass range in all segments in the .DAT file. NOTE: The entire mass range of each spectrum in the .DAT file is checked, not just the mass range included in the composite spectrum, and even if the spectrum is not currently displayed in the Spectrum window. For comparison, the difference between the reference mass in the calibration reference file and the observed peak mass is displayed. Hint: You can sort the list of matches by clicking on the column header buttons (see Figure 8-5 on page 8-13). You can display complete information about a reference mass by double-clicking on the mass. If no matches are found, an error message is displayed. 2. To delete a match from the list, select the mass and click Delete Selected Match. To clear the entire list, click Delete Entire List. 3. Complete the calibration as described in “Solving and plotting” on page 8-18. Data Explorer™ Software User’s Guide 8-15 8 Chapter 8 Viewing Voyager PSD Data Selecting peaks manually For optimum mass accuracy, select peaks as described in “Selecting calibration peaks for optimum mass accuracy” on page 8-19. To manually select the reference mass for a peak: 1. Right-click-drag over the peak of interest. The Reference Mass dialog box (Figure 8-6) is displayed and lists all masses in the calibration reference file. The entry highlighted is the nearest match in the calibration reference file to the selected peak that is within the mass tolerance specified. 8 Figure 8-6 Reference Mass Dialog Box 8-16 Applied Biosystems Calibrating a PSD Spectrum 2. Do any of the following: • Click OK to accept the highlighted reference mass for matching. • Select a different reference mass and click OK. • Type new reference mass information in the Name, Theoretical Mass, Charge and Elemental Composition text boxes and select the mass type. Click OK to accept the reference mass for matching. NOTE: You must type in a minus sign (-) for negative charge states. • Type new reference mass information in the appropriate text boxes, click Save or Save As to add the information to the calibration reference file, then click OK to accept the reference mass for matching. The PSD Calibration dialog box is displayed again (see Figure 8-5 on page 8-13) with the observed mass and the reference mass you selected displayed in the Matched Peak list. 3. Repeat step 1 through step 2 until the desired peaks are in the matched list. For optimum mass accuracy, take at least one mass from each segment, if possible. The software does not allow you to add duplicate masses collected with the same PSD Mirror Ratio. However, if a mass exceeds the Mass Tolerance specified in Reference Matching Criteria, but has the same PSD Mirror Ratio, the software allows you to add it. 4. Complete the calibration as described in “Solving and plotting” on page 8-18. Data Explorer™ Software User’s Guide 8-17 8 Chapter 8 Viewing Voyager PSD Data Solving and plotting After matching peaks, click Solve and Plot. The calibration statistics are displayed in the Result tab of the Output window and the calibration constants are applied to the spectrum displayed If you calibrate more than one time, subsequent calibration statistics are added to the end of the list in the Output window. Older calibration statistics are listed at the top of the list. Use the scroll bar to view newer statistics at the bottom of the list. The spectrum is calibrated and displayed with an MC trace label. The calibration statistics are displayed in the Output window. Applying new constants to the data file 8 To apply the calibration constants to each spectrum (all segments) in the data file, click Apply Calibration. All spectra in the data file are calibrated and displayed with an MC trace label. The calibration constants are saved with the data file. Each spectrum in the data file is calibrated when displayed. The software uses different values in the calibration equation calculation based on the type of calibration performed. 8-18 Applied Biosystems Calibrating a PSD Spectrum Selecting calibration peaks for optimum mass accuracy To improve calibration statistics, you can select the same fragment ion from more than one segment. Monoamino acid fragments (immonium ions) below 150 Da are useful for this purpose. Because the segments have been collected with different PSD Mirror Ratios, the software allows you to add the same mass to the list multiple times. Hint: A calibration reference file called Immonium_Ions.REF is provided with the software. To optimize mass accuracy across the entire PSD composite spectrum (multi-point calibration): • Select reference peaks from a wide range of segments to ensure that high and low Mirror Ratios are represented. • Include peaks with masses that are substantially below the Max Stitch Mass (for example, up to 50 percent lower than the Max Stitch Mass. • Avoid selecting peaks with masses that are above the Max Stitch Mass. • Avoid selecting peaks with signal-to-noise ratios less than 20. Data Explorer™ Software User’s Guide 8-19 8 Chapter 8 Viewing Voyager PSD Data 8.3.3 Creating PSD Calibration (.CAL) Files and Applying to Other Data Files Creating PSD .CAL files To generate a PSD .CAL file: 1. Acquire a standard, for example, angiotensin, in the Instrument Control Panel in PSD mode. For more information, see the Voyager Biospectrometry Workstation User’s Guide. 2. Open the .DAT file in the Data Explorer software. 3. Calibrate as described in Section 8.3.2, Calibrating. 4. From the File menu, select Export, then select Calibration. 5. Name and save the file. 8 Hint: Include a _PSD suffix when you export a PSD .CAL file to help you distinguish them from non-PSD .CAL files. For example, type Cal_PSD as the file name. The complete file name will be Cal_PSD.CAL. Applying new constants to additional files You can apply calibration constants from a .CAL file to any data file. To apply the new constants from a mass calibration file to a different file: 1. Display the spectrum to calibrate. 2. From the Process menu, select Mass Calibration. 3. Select Import Calibration. 4. Select the .CAL file to use. Click Open. The software displays the calibrated spectrum with an MC trace label. 5. 8-20 Applied Biosystems To save the calibration to the data file, select Mass Calibration from the Process menu, then select Apply Calibration. Calibrating a PSD Spectrum 8.3.4 Creating PSD Calibration Reference (.REF) Files Overview You can manually create a calibration reference file by typing masses in a text file as described in Section 5.3.3, Creating or Modifying a Calibration Reference File (.REF). You can also use the Ion Fragmentation calculator to generate theoretical fragments and masses from the sequence for a standard compound, then automatically save the masses and associated information in a calibration reference file. For detailed information on using the Ion Fragmentation calculator, see Section 6.5, Using the Ion Fragmentation Calculator. Using the Ion Fragmentation calculator to create a calibration reference (.REF) file To create a PSD calibration reference file using the Ion Fragmentation calculator: 1. From the Applications menu, select Ion Fragmentation Calculator. The Ion Fragmentation Calculator dialog box is displayed (Figure 8-4 on page 8-8). 2. In the Sequence text box, type the amino acid sequence of the standard compound. Use single-letter codes. Set other parameters as needed. For parameter descriptions, see Section 6.5, Using the Ion Fragmentation Calculator. 3. Select Monoisotopic from the Calculate fragment ion masses as drop-down list. Data Explorer™ Software User’s Guide 8-21 8 Chapter 8 Viewing Voyager PSD Data NOTE: This selection determines the mass type specified for the reference masses in the calibration reference file. Use a calibration reference (.REF) file that specifies the peak type for reference masses as Resolved Isotope Mass (even if they are not resolved isotopes). The calibration routine checks peak width to determine if a peak matches a Resolved Isotope Mass or an Average mass. If narrow peaks are specified as Average Masses in the calibration reference file, the software mistakes these narrow peaks as isotopically resolved and ignores the reference mass. For more information on creating calibration reference files, see Section 5.3.3, Creating or Modifying a Calibration Reference File (.REF). 4. Click Induce Fragmentation. Results are listed in the ions table, and fragment ions are labeled if they are present in the spectrum. 8 5. Click Create Reference File. A Save As dialog box is displayed. 6. Name and save the calibration reference file. Hint: PSD calibration reference files are named with an .REF extension. When you create PSD calibration reference files, include a _PSD suffix when you name files to help you distinguish them from non-PSD calibration reference files. Hint: Calibration reference files are ASCII text files. You can delete unwanted fragment ion entries using Microsoft Notepad. 8-22 Applied Biosystems Calibrating a PSD Spectrum 8.3.5 Changing the Precursor Mass When to change precursor mass When analyzing the composite spectrum, you may find that the observed fragments and sequence are not consistent with the precursor mass used to acquire the .DAT file. For example, you acquired the data with a precursor mass of 1,000.5 Da, and while examining the data in Data Explorer, you realize that the data may correspond to a precursor mass of 1,000 Da or 1,001 Da. You can change the precursor mass in the Data Explorer software and regenerate the composite spectrum to observe whether the mass accuracy of the fragment ions improves with a different precursor mass specified. Before changing the precursor mass, note the following points: • The Change Mass function changes the value for mp in the PSD calibration equation (described on page 8-6). It does not change the value for tp. • Use the Change Mass function only if the precursor mass used to acquire the data does not correspond to the sequence you are observing in Data Explorer. • Do not use the Change Mass function to correct a precursor mass that you incorrectly typed before acquiring. The precursor ion flight time associated with the incorrect mass is stored in the .DAT file and will yield invalid fragment masses even if you correct the precursor mass. You must specify the correct precursor mass and reacquire the data to obtain correct mass and flight time values to yield a valid fragment mass calibration. Data Explorer™ Software User’s Guide 8-23 8 Chapter 8 Viewing Voyager PSD Data Changing If the precursor mass taken from the data file is not correct: 1. Display the Segments tab (see Figure 8-2 on page 8-4) by doing either of the following: • In the PSD Calibration dialog box, click the Segments tab • From the Process menu, select PSD Processing 2. Click Change Mass and enter a new mass to use for calibration. 3. Click OK. 4. Click Plot to display the composite spectrum for the new mass. The following occurs: • A new composite spectrum is generated as described in “How the composite spectrum is generated” on page 8-6, and displayed. 8 • The PSD calibration for the data file is updated with the new precursor ion mass. • The new composite spectrum is displayed. NOTE: The Max Stitch Masses displayed in the PSD segment list in the PSD Processing dialog box are not updated until you apply the new calibration. 5. 8-24 Applied Biosystems To save the updated calibration information in the data file, click Apply Precursor Mass. Chapter 9 9 Troubleshooting This chapter contains the following sections: 9.1 Overview ......................................................... 9-2 9.2 General Troubleshooting.................................. 9-3 9.3 Processing, Tools, and Applications Troubleshooting ............................................... 9-6 9.4 Calibration Troubleshooting ........................... 9-10 9.5 Printing Troubleshooting ................................ 9-14 9.6 Peak Detection and Labeling Troubleshooting ............................................. 9-15 Data Explorer™ Software User’s Guide 9-1 Chapter 9 Troubleshooting 9.1 Overview This section includes: • • • • • General troubleshooting Processing, tools, and applications troubleshooting Calibration troubleshooting Printing troubleshooting Peak detection and labeling troubleshooting Troubleshooting information is organized according to likelihood of possible cause, from most likely to least likely possible cause. If you are unable to solve your problem using the information in the following tables, call Applied Biosystems Technical Support. To reach Applied Biosystems Technical Support, refer to the list of offices on the back cover of this book. 9 9-2 Applied Biosystems General Troubleshooting 9.2 General Troubleshooting Table 9-1 General Troubleshooting—Mariner and Voyager Symptom Possible Cause Action Cannot find data file Did not save the spectrum to a .DAT file Reacquire spectrum. Save .DAT file. Error message displayed when opening PSD data file You are currently acquiring the PSD DAT file and have not stopped the experiment Stop the Experiment. See the Voyager Biospectrometry Workstation User’s Guide. Parts of other software windows are displayed on top of the Data Explorer window, or toolbar buttons or status indicators are not displayed Multiple application windows overlap Close applications not in use, then minimize and maximize the Data Explorer window to refresh the display. “Failed to create empty document” message displayed when you open a data file Chromatogram and Spectrum windows are too small Resize the Output window (click-drag border) so that at least a small part of the Chromatogram or Spectrum window is displayed. Graphic Option settings are not applied to all traces Did not select Use same settings for all graphs before entering settings Select Use same settings for all graphs then click Apply. Data Explorer™ Software User’s Guide 9-3 9 Chapter 9 Troubleshooting Table 9-1 General Troubleshooting—Mariner and Voyager (Continued) Symptom Possible Cause Action M/z range in data files converted to centroid does not match m/z range in original data file M/z range in a data file that is converted from profile to centroid is determined by the peak detection range set in Data Explorer, not the m/z range in the original data file No action. Normal occurrence. Text annotation from a previous trace displayed on current trace Annotation stays in the view until you delete it, even if you advance to the next spectrum Delete the annotation. See Section 2.4.9, Annotating Traces. Table 9-2 General Troubleshooting—Mariner Only 9 Symptom Possible Cause Action “Failed to open chromatogram data” message displayed when you open a data file You are opening a data file collected with version 2.1 software and the .CGM file not located in the same directory as the .SPC file Place the .CGM and .SPC files in the same directory. 9-4 Applied Biosystems General Troubleshooting Table 9-2 General Troubleshooting—Mariner Only (Continued) Symptom Possible Cause Action Spectra labeled with spectrum numbers that do not correspond to the axis You are viewing event-filtered MS Method data. Spectra in an event-filtered trace are numbered contiguously (1,2,3...) regardless of their relation to the overall acquisition. However, the axis of the trace reflects the numbering of the overall experiment. No action. Normal occurrence. Conversion of .SPC to .DAT failed A .DAT file with the same file name you are specifying for the converted .SPC file is open 1. Close the open .DAT file. 2. Use a different name for the converted .SPC file to prevent the new conversion from overwriting the existing file. 9 Table 9-3 General Troubleshooting—Voyager Only Symptom Possible Cause “Failed to get original calibration” message displayed when you open a data file You are opening a Voyager .MSF data file collected with version 4.0 or earlier software. Action No action. Normal occurrence. Data Explorer™ Software User’s Guide 9-5 Chapter 9 Troubleshooting 9.3 Processing, Tools, and Applications Troubleshooting Table 9-4 Processing, Tools, and Applications Troubleshooting—Mariner and Voyager Symptom Possible Cause Action Failed to calculate result for isotope calculator You may have tried to remove a group that is not present in the formula Can only remove a group that is present in the formula. For information, see Section 6.2, Using the Isotope Calculator. All traces in an overlaid trace are not processed Only the active trace in an overlaid trace is processed Display individual traces, select Use same settings for all graphs from Graphic Options, then process. For more information, see: 9 9-6 Applied Biosystems • Section 1.5, Setting Graphic Options • Section 2.4.8, Overlaying Traces Processing, Tools, and Applications Troubleshooting Table 9-4 Processing, Tools, and Applications Troubleshooting—Mariner and Voyager (Continued) Symptom Possible Cause Action Results not saved for all traces in an overlaid trace Only results for the active trace are saved Display individual traces, then save results for each trace. For more information, see: Link View command does not have an effect on windows or open data files You did not select Link View for each window or data file • Section 2.4.8, Overlaying Traces • Section 2.6, Saving, Opening, and Deleting .DAT Results • Section 2.8, Saving, Opening, and Deleting .SPC Results Files (Mariner Data Only) You must select Link View for each window and each data file you want to link. See “Linking views” on page 2-13. Data Explorer™ Software User’s Guide 9-7 9 Chapter 9 Troubleshooting Table 9-4 Processing, Tools, and Applications Troubleshooting—Mariner and Voyager (Continued) Symptom Possible Cause Action After Single-charge Conversion of multiply charged peaks, you see charge states other than 0 or 1 Peaks in the original spectrum are labeled with an incorrect charge state 1. Set peak detection thresholds to disregard these peaks. See Section 3.2.5, Charge State Determination and Examples. 2. Convert the spectrum again. See Section 5.10, Converting to a Singly Charged Spectrum (Mariner Data Only). 9 9-8 Applied Biosystems Processing, Tools, and Applications Troubleshooting Table 9-5 Processing, Tools, and Applications Troubleshooting—Mariner Only Symptom Possible Cause Action Failed to calculate result for mass deconvolution Did not select at least two peaks for same charge envelope Select at least two peaks (for example, +1 and +2). For more information, see Section 5.6, Mass Deconvolution (Mariner Data Only). Multiple Charge/Mass Deconvolution commands dimmed on Process menu Your system does not include the optional mass deconvolution software Contact Applied Biosystems to purchase the option. Centroiding, Mass Calibration, Multiple Charge commands not displayed on Process menu Spectrum window not active Activate Spectrum window, then select Process menu. Resolution command not displayed on Tools menu Spectrum window not active Activate Spectrum window, then select Tools menu. Only the active trace zooms in Overlay mode Zooming may not behave as expected on overlaid traces Click in the top right corner of the window to restore the view. Data Explorer™ Software User’s Guide 9 9-9 Chapter 9 Troubleshooting 9.4 Calibration Troubleshooting Table 9-6 Calibration Troubleshooting—Mariner and Voyager Symptom Possible Cause Action Auto Calibration is turned on, but current spectrum is not auto calibrated Current spectrum is not calibrated until the next time the spectrum is displayed Advance to the next spectrum, then return to the current spectrum. For more information, see Section 5.4, Automatic Calibration. During calibration, the software is not matching spectrum masses to some reference masses in the calibration reference file The calibration routine checks peak width to determine if a peak matches a Resolved Isotope Mass or an Average mass. If narrow peaks are specified as Average Masses in the calibration reference file, the software mistakes these narrow peaks as isotopically resolved and ignores the reference mass. When specifying highly charged, non-isotopically resolved species with peaks less than 1 Da wide (for example, myoglobin +20) as reference masses in a calibration reference file, set the peak type as a Resolved Isotope Mass (even though it is not a resolved isotope). See Section 5.3.3, Creating or Modifying a Calibration Reference File (.REF). Mass tolerance or Minimum Intensity set too high Adjust. See Section 5.3, Manual Calibration. 9 9-10 Applied Biosystems Calibration Troubleshooting Table 9-6 Calibration Troubleshooting—Mariner and Voyager (Continued) Symptom Possible Cause Action Calibration returns an invalid number of matches When creating a reference mass list in Manual or Automatic calibration, the software allows you to add multiple items with the same m/z value to the calibration list box if any other attribute of the reference compound is different (for example, charge state or name). Each mass in the list is considered during calibration. Do not include multiple entries with the same m/z value in the Calibration Reference file. See Section 5.3.3, Creating or Modifying a Calibration Reference File (.REF). .REF file created with Windows Notepad not listed when you select Reference file Reference file does not include .REF extension Some applications automatically append a .TXT extension to file names. To name the file with a .REF extension, include the file name and extension in double-quotes in the Save File dialog box, for example “CAL.REF”. Data Explorer™ Software User’s Guide 9-11 9 Chapter 9 Troubleshooting Table 9-7 Calibration Troubleshooting—Mariner Only Symptom Possible Cause Action Mass Calibration commands are dimmed Chromatogram window is selected Select Spectrum window. Apply Calibration command is dimmed when calibrating MS Method data For MS Method data, calibration is valid for an individual spectrum. You cannot apply the calibration from one spectrum to the entire data file. No action. Normal occurrence. Error displayed when you import a calibration .CAL file corrupted Create new .CAL file. See “Exporting .BIC, .MSM, and .CAL files” on page 1-36. Importing a .CAL file generated from a Voyager data file Import a Mariner .CAL. 9 9-12 Applied Biosystems Calibration Troubleshooting Table 9-8 Calibration Troubleshooting—Voyager Only Symptom Error displayed when you import a calibration Possible Cause Action .CAL file corrupted Create new .CAL file. See “Exporting .BIC, .MSM, and .CAL files” on page 1-36. Importing a .CAL file generated from a Mariner data file Import a Voyager .CAL. Importing a .CAL file generated from a data file collected in a different instrument mode (Linear, Reflector, or PSD) Import a .CAL generated from a data file collected in the same instrument mode. Importing a .CAL file generated on a different instrument Import a .CAL generated on the same instrument. 9 Data Explorer™ Software User’s Guide 9-13 Chapter 9 Troubleshooting 9.5 Printing Troubleshooting Table 9-9 Printing Troubleshooting—Mariner and Voyager Symptom Traces do not print Possible Cause Action Line width is set to 0 or 1 Change the line width. See Section 1.5, Setting Graphic Options. Line color is set to white Change the color. See Section 1.5, Setting Graphic Options. Landscape printer setup lost when you close Data Explorer Landscape option set using Printer Setup in Data Explorer Set landscape printing using Printer Settings in Windows Control Panel. See “Dedicating a printer to landscape orientation” on page 2-35. Data file names do not print for multiple data files Some printers may not print the data file name if you select Print All Views from the File menu with more than two data files open. We have observed this on HP LaserJet4, HP LaserJet5, and HP LaserJet6 printers. Print views individually, or open only two data files before you select Print All Views. For more information, see Section 2.4.11, Printing Traces. 9 9-14 Applied Biosystems Peak Detection and Labeling Troubleshooting 9.6 Peak Detection and Labeling Troubleshooting This section includes: • Peak detection and labeling troubleshooting • Charge state and isotope determination troubleshooting Table 9-10 Peak Detection and Labeling Troubleshooting—Mariner and Voyager Symptom Peaks are not detected or labeled Possible Cause Peaks are very close together or label is too long Action • Zoom in on region of interest. • Select Allow overlapping peak labels in the Peak Label dialog box. See Section 3.5.2, Setting Chromatogram and Spectrum Peak Labels. Peak detection parameters, in particular, Filter Width, not set to detect peaks Adjust parameters. See Section 3.2, Peak Detection. Peak filtering is enabled. Only peaks that meet the peak list filtering criteria are labeled. Disable peak list filtering. See “Filtering the spectrum peak list” on page 3-42. Data Explorer™ Software User’s Guide 9 9-15 Chapter 9 Troubleshooting Table 9-10 Peak Detection and Labeling Troubleshooting—Mariner and Voyager (Continued) Symptom Peaks are not detected or labeled Possible Cause Analyzing masses above 20,000 Da Increase Mass Resolution setting in Peak Detection Setup. See Section 3.2.2, Strategy for Voyager Peak Detection. %Max Peak Area set too high Decrease. See Section 3.2.2, Strategy for Voyager Peak Detection. %Base Peak Intensity set too high Set to 0. Adjust %Max Peak Area to optimize peak detection for Voyager data. See Section 3.2.2, Strategy for Voyager Peak Detection. The Chromatogram window was active when you selected Peak Label from the Display menu Make sure the Spectrum window is active before selecting Peak Label from the Display menu. (continued) 9 When creating a custom label for a spectrum, you right-click-drag across a peak to identify the peak, and an extracted ion chromatogram is created instead 9-16 Applied Biosystems Action Peak Detection and Labeling Troubleshooting Table 9-10 Peak Detection and Labeling Troubleshooting—Mariner and Voyager (Continued) Symptom Expected user label not displayed Peak label placed on peak shoulder instead of peak apex Possible Cause Action Delta X value includes more than one peak apex Set Delta X value low enough to prevent the peak labeling windows from overlapping. For information, see Section 3.5.3, Setting Custom Peak Labels. Delta X value is outside acquisition range for the data file Set Delta X value within acquisition range for the data file. For information, see Section 3.5.3, Setting Custom Peak Labels. Filter Width Increment set higher than 1 Set Increment to 1. See “Increment” on page 3-31. Table 9-11 Peak Detection and Labeling Troubleshooting—Voyager Only Symptom Possible Cause Action Noise detected as peaks %Max Peak Area set too low Increase. See Section 3.2.2, Strategy for Voyager Peak Detection. Low Mass Gate spike identified as Base Peak (linear data) Software identifies the most intense peak in a trace as the base peak, and does not ignore artifacts Truncate the data. See Section 5.9, Truncating a Spectrum. Data Explorer™ Software User’s Guide 9-17 9 Chapter 9 Troubleshooting Table 9-11 Peak Detection and Labeling Troubleshooting—Voyager Only Symptom Partially resolved peaks not detected Possible Cause Action Mass resolution set too high to detect average mass Decrease Mass Resolution setting. See Section 3.2.2, Strategy for Voyager Peak Detection. %Base Peak Intensity not adjusted correctly Adjust. See Section 3.2.2, Strategy for Voyager Peak Detection. Table 9-12 Charge State and Isotope Determination Troubleshooting—Mariner Only Symptom Possible Cause Known isotope labeled with incorrect charge state (too low) Max Charge State parameter set too low. See example in “Max Charge State set too low” on page 3-33. 9 9-18 Applied Biosystems Action Set Max Charge State correctly. See “Peak Processing parameters (spectrum data only)” on page 3-26. Peak Detection and Labeling Troubleshooting Table 9-12 Charge State and Isotope Determination Troubleshooting—Mariner Only (Continued) Symptom Possible Cause Action Known isotope not labeled with charge state Charge State peak labels disabled Turn on Charge State peak labels. See Section 3.5.2, Setting Chromatogram and Spectrum Peak Labels. Max Charge State parameter set too low. See example in “Max Charge State set too low” on page 3-33. Set Max Charge State correctly. See “Peak Processing parameters (spectrum data only)” on page 3-26. Peak List Filtering is enabled, with Charge State filter enabled and set too low Disable Peak List Filtering. See “Filtering the spectrum peak list” on page 3-42. Minimum Intensity set too high to detect other isotope peaks. See example in “Effect of Minimum Intensity” on page 3-36. Set Minimum Intensity correctly. See “Advanced Settings (spectrum data only)” on page 3-28. Filter width set too high to determine other isotope peaks Set Filter Width correctly. See “Advanced Settings (spectrum data only)” on page 3-28. Data Explorer™ Software User’s Guide 9-19 9 Chapter 9 Troubleshooting Table 9-12 Charge State and Isotope Determination Troubleshooting—Mariner Only (Continued) Symptom Spectrum peaks not labeled with charge state when charge state labels are selected 9 9-20 Applied Biosystems Possible Cause Action Mass of original molecule above 4,000 Da, not range in which the Mariner system can resolve the isotope peaks No action. Normal occurrence. Charge State parameters not set to detect at least two isotope peaks Adjust parameters. See “Peak Processing parameters (spectrum data only)” on page 3-26. Peaks are more than 1 Da apart No action. Normal occurrence. Peaks are not from the same isotope species No action. Normal occurrence. Filter width is set too high to detect other isotope peaks Adjust Filter Width. See “Advanced Settings (spectrum data only)” on page 3-28. Maximum Charge State for charge state determination is set lower than the charge state of the peak Adjust the Maximum Charge State. See “Peak Processing parameters (spectrum data only)” on page 3-26. Peak Detection and Labeling Troubleshooting Table 9-12 Charge State and Isotope Determination Troubleshooting—Mariner Only (Continued) Symptom Possible Cause Spectrum peaks labeled with incorrect charge state when charge state labels are selected Charge state determination parameters are set such that peaks are determined to have no charge (continued) Noise between isotope peaks is detected Action Adjust parameters. See: • “Peak Processing parameters (spectrum data only)” on page 3-26 • Section 3.2.5, Charge State Determination and Examples Increase %Base Peak Intensity or %Max Peak Area to eliminate noise. See “Basic Settings (spectrum data only)” on page 3-22. Apply noise filter. See Section 5.7, Noise Filtering/Smoothing. Monoisotopic peak not labeled correctly Peak detection charge state parameters are not set correctly, the software is identifying the tallest peak in a cluster as the monoisotopic peak Adjust parameters to correctly identify the monoisotopic peak. See “Peak Processing parameters (spectrum data only)” on page 3-26. Data Explorer™ Software User’s Guide 9-21 9 Chapter 9 Troubleshooting 9 9-22 Applied Biosystems Appendix A A Warranty Applied Biosystems supplies or recommends certain configurations of computer hardware, software, and peripherals for use with its instrumentation. Applied Biosystems reserves the right to decline support for or impose extra charges for supporting non-standard computer configurations or components that have not been supplied or recommended by Applied Biosystems. Applied Biosystems also reserves the right to require that computer hardware and software be restored to the standard configuration prior to providing service or technical support. Limited Product Warranty Limited warranty Applied Biosystems warrants that for a period of ninety (90) days from the date of installation, the Data Explorer™ software designated for use with Mariner™ API-TOF Workstations or Voyager™ Biospectrometry™ Workstations will perform substantially in accordance with the function and features described in its accompanying documentation when properly installed on the instrument system. Applied Biosystems does Data Explorer™ Software User’s Guide A-1 Appendix A Warranty not warrant that the operation of the instrument or software will be uninterrupted or error free. Applied Biosystems will provide any software corrections or “bug-fixes”, if and when they become available, for a period of ninety (90) days after installation. A Warranty period effective date Any applicable warranty period under these sections will begin on the date of installation, but no later than three (3) months from the date of shipment, for software installed by Applied Biosystems personnel, unless that date has been delayed at the buyer’s request, but in no event later than thirty (30) days after shipment. In that case, and for all hardware and software installed by the buyer, and for all other products, the applicable warranty period begins the date the component is delivered to the buyer. For software installed by the buyer or any person other than Applied Biosystems, the applicable warranty period will begin the date the product is delivered to the buyer. Warranty claims Warranty claims must be made within the applicable warranty period or, for chemicals or other consumable products, within thirty (30) days after receipt by the buyer. Warranty exceptions The above warranties do not apply to defects resulting from misuse, neglect, or accident, including without limitation: operation outside of the environmental or use specifications or not in conformance with the instructions for the instrument system, software, or accessories; performance of improper or inadequate maintenance by the user; installation of software or interfacing not supplied by Applied Biosystems; and modification or repair of the instrument or the software not authorized by Applied Biosystems. THE FOREGOING PROVISIONS SET FORTH APPLIED BIOSYSTEMS SOLE AND EXCLUSIVE REPRESENTATIONS, WARRANTIES, AND OBLIGATIONS WITH RESPECT TO ITS PRODUCTS, AND APPLIED BIOSYSTEMS MAKES NO OTHER WARRANTY OF ANY KIND WHATSOEVER, EXPRESSED OR IMPLIED, INCLUDING WITHOUT LIMITATION, WARRANTIES OF MERCHANTABILITY AND FITNESS FOR A PARTICULAR PURPOSE, WHETHER ARISING FROM A STATUTE OR OTHERWISE IN LAW OR FROM A COURSE OF DEALING OR USAGE OF TRADE, ALL OF WHICH ARE EXPRESSLY DISCLAIMED. A-2 Applied Biosystems Warranties limitations THE REMEDIES PROVIDED HEREIN ARE BUYER’S SOLE AND EXCLUSIVE REMEDIES. WITHOUT LIMITING THE GENERALITY OF THE FOREGOING, IN NO EVENT SHALL APPLIED BIOSYSTEMS BE LIABLE, WHETHER IN CONTACT, TORT, WARRANTY OR UNDER ANY STATUTE (INCLUDING WITHOUT LIMITATION ANY TRADE PRACTICE, UNFAIR COMPETITION OR OTHER STATUTE OF SIMILAR IMPORT) OR ON ANY OTHER BASIS, FOR DIRECT, INDIRECT, PUNITIVE, INCIDENTAL, CONSEQUENTIAL, OR SPECIAL DAMAGES SUSTAINED BY BUYER OR ANY OTHER PERSON OR ENTITY, WHETHER OR NOT FORESEEABLE AND WHETHER OR NOT APPLIED BIOSYSTEMS IS ADVISED OF THE POSSIBILITY OF SUCH DAMAGES, INCLUDING WITHOUT LIMITATION, DAMAGES ARISING FROM OR RELATED TO LOSS OF USE, LOSS OF DATA, FAILURE OR INTERRUPTION IN THE OPERATION OF ANY EQUIPMENT OR SOFTWARE, DELAY IN REPAIR OR REPLACEMENT, OR FOR LOSS OF REVENUE OR PROFITS, LOSS OF GOOD WILL, LOSS OF BUSINESS OR OTHER FINANCIAL LOSS OR PERSONAL INJURY OR PROPERTY DAMAGE. NO AGENT, EMPLOYEE, OR REPRESENTATIVE OF APPLIED BIOSYSTEMS HAS ANY AUTHORITY TO BIND APPLIED BIOSYSTEMS TO ANY AFFIRMATION, REPRESENTATION, OR WARRANTY CONCERNING THE PRODUCT THAT IS NOT CONTAINED IN THIS LIMITED WARRANTY STATEMENT. ANY SUCH AFFIRMATION, REPRESENTATION, OR WARRANTY MADE BY ANY AGENT, EMPLOYEE, OR REPRESENTATIVE OF APPLIED BIOSYSTEMS WILL NOT BE BINDING ON APPLIED BIOSYSTEMS. THIS WARRANTY IS LIMITED TO THE BUYER OF THE PRODUCT FROM APPLIED BIOSYSTEMS AND IS NOT TRANSFERABLE. Data Explorer™ Software User’s Guide A-3 A Appendix A Warranty A A-4 Applied Biosystems Appendix B B Overview of Isotopes This appendix contains the following sections: B.1 Isotopes .................................................... B-2 B.2 Monoisotopic and Average Masses ........... B-6 B.3 Isotopes of Common Elements .................. B-8 Data Explorer™ Software User’s Guide B-1 Appendix B Overview of Isotopes B.1 Isotopes Overview Many elements in their natural state exist as one of several isotopes. An isotope is one of two or more atoms with the same atomic number but a different mass. The most abundant isotope of carbon is 12C, but natural carbon also contains 13C and 14C. Because a mass spectrometer measures mass-to-charge ratios, isotopes appear in the mass spectrum. Isotopes of low abundance, such as 14C, do not affect the appearance of a mass spectrum. However, isotopes that occur in greater abundance, such as 13C, which occurs in a natural abundance of approximately 1.1 percent1 in carbon, do affect the appearance of a mass spectrum. B The mass spectrum of methane (Figure B-1) illustrates the impact of an isotope on the appearance of a mass spectrum. Methane includes a peak representing the molecular ion at 16 Da (12CH4) and a peak representing the isotope at 17 Da (13CH4). The relative abundance of the ions is about 99:1. 12 C 13 C Figure B-1 Mass Spectrum of Methane 1. Meth. Enzymol., McCloskey, J.A, ed., 1990, 193, 869. B-2 Applied Biosystems Isotopes As the number of carbon atoms in a compound increases, the possibility of the compound containing a 13C instead of a 12C also increases. A compound with ten carbon atoms includes a molecular ion M+ and an isotopic ion (M+1)+ one mass unit greater than the molecular ion, which is approximately 11 percent of the abundance of the molecular ion. The possibility of including two 13C atoms in the same molecule also increases with increasing number of carbon atoms. Therefore, (M+2)+ ions become more visible. In a compound with ten carbon atoms such as decahydro naphthalene, C10H18 (Figure B-2), relative heights of M+, (M+1)+, and (M+2)+ peaks are 100:11:0.5. M+ (M+1)+ (M+2)+ Figure B-2 Mass Spectrum of Decahydro Naphthalene Isotopic pattern in mass spectra All compounds containing carbon include molecular ions and isotopic ions that are 1 and 2 mass units higher than the molecular ion. At higher masses, the isotopic pattern of a mass spectrum is more pronounced as the relative abundance of isotopes increases. In angiotensin I (Figure B-3) with a molecular weight of 1,296 Da, (C62H89O14N17), a peak containing one 13C isotope is approximately 70 percent of the pure 12C peak. Data Explorer™ Software User’s Guide B-3 B Appendix B Overview of Isotopes M+ (M+1)+ (M+2)+ B Figure B-3 Mass Spectrum of Angiotensin I at Resolution 3,000 In compounds with more than 100 carbon atoms, the height of the first 13C isotope peak exceeds the height of the 12C peak. Isotope-limited resolution The mass range you analyze and the resolving power of the analyzer determine if you observe resolved isotope peaks in a mass spectrum. Figure B-3 represents angiotensin I at a resolution of 3,000. Isotopes are fully resolved, and sharp peaks are observed in the mass spectrum. At lower resolutions, the shape of the individual peaks becomes less pronounced, or may not be differentiated at all. Figure B-4 represents angiotensin I at a theoretical resolution of 1,000. B-4 Applied Biosystems Isotopes M+ (M+1)+ (M+2)+ B Figure B-4 Mass Spectrum of Angiotensin I at Resolution 1,000 If isotopes cannot be resolved, the highest resolution you can obtain is limited by the width of the isotopic envelope. The isotopic envelope is the mass range of the combined isotopes, as measured at the half height of the tallest isotope peak in the compound (Figure B-5). isotopic envelope Figure B-5 Unresolved Isotopes Data Explorer™ Software User’s Guide B-5 Appendix B Overview of Isotopes B.2 Monoisotopic and Average Masses When isotopes are clearly resolved (Figure B-6), the monoisotopic mass is used for mass labeling, and corresponds to the lowest mass peak in the cluster. B Monoisotopic mass corresponds to lowest mass peak Figure B-6 Monoisotopic Mass When isotopes are not resolved (Figure B-7), the average mass is used for mass labeling, and corresponds to the centroid of the unresolved peak cluster (weighted average of all isotope peaks in the cluster). B-6 Applied Biosystems Monoisotopic and Average Masses Average mass corresponds to centroid of unresolved peak cluster B Figure B-7 Average Mass Data Explorer™ Software User’s Guide B-7 Appendix B Overview of Isotopes B.3 Isotopes of Common Elements Table B-1 lists the natural abundance of isotopes for some common elements seen in mass spectrometry Table B-1 Isotopes of Common Elements1 B Isotope 1 Mass Natural abundance (%) Isotope Mass Natural abundance (%) H 1.0078 99.985 31 P 30.9737 100 2H 2.0141 0.015 32S 31.9720 95.02 12 12 98.90 33 S 32.9714 0.75 13.0033 1.10 34S 33.9678 4.21 14.0030 99.63 36 35.9670 0.02 15N 15.0001 0.37 35Cl 34.9688 75.77 16 O 15.9949 99.76 37 36.9659 24.23 17O 16.9991 0.04 39K 38.9637 93.2581 18 O 17.9991 0.200 40 K 39.9639 0.012 19F 18.9984 100 41K 40.9618 6.7302 23 22.9897 100 79 Br 78.9183 50.69 28Si 27.9769 92.23 81Br 80.9162 49.31 29 Si 28.9764 4.67 127 126.9044 100 30Si 29.9737 3.10 ____ ____ C 13C 14 N Na S Cl I ____ 1. Meth. Enzymol., McCloskey, J.A, ed., 1990, 193. B-8 Applied Biosystems C Data Explorer Toolbox (Visual Basic Macros) Appendix C This appendix includes: C.1 Overview................................................ C-2 C.2 Preparing Data Before Accessing Macros ....................... C-3 C.3 Accessing the Macros ............................ C-4 C.4 Using the Ladder Sequencing Toolbox .................... C-5 C.5 Using the Peptide Fragmentation Toolbox ............... C-9 C.6 Using the Polymer Analysis Toolbox ..... C-15 C.7 Using MS Fit/MS Tag Toolbox ............... C-18 Data Explorer™ Software User’s Guide C-1 Appendix C Data Explorer Toolbox (Visual Basic Macros) C.1 Overview Macros provided C The following toolbox of Visual Basic macros is provided with the Data Explorer software: • Ladder SequencingUse when performing sequencing to label peaks with the appropriate amino acid, DNA residue, or RNA residue. • Peptide FragmentationUse when examining Voyager composite PSD spectra or Mariner in-source CID spectra to label immonium ions, identify pairs, view sequences based on different reference peaks, and determine if a selected peak is of a specific fragment ion category. • Polymer AnalysisUse when analyzing polymer spectra to calculate average molecular weight values. • MS Fit/MS TagUse when analyzing peptide or peptide fragment spectra to perform a protein database search. Importing macros provided If the macros listed above are not listed when you try to run them (described in Section C.3, Accessing the Macros), you must import them into the Data Explorer project. For information, see Section 6.7.7, Importing or Exporting Macros in DATAEXPLORER.VB6. Modifying the macros The Visual Basic macros described in this document are provided in a file called DataExplorer.VB6 in the directory that contains the Mariner or Voyager program file. New macros you create using the Macro Recorder in the Data Explorer software are also added to this file. You can modify the macros in this file as desired. However, before you make changes, make a copy of the DataExplorer.VB6 file (for example, make a copy called DataExplorer.BAK). If the changes you make are not acceptable, you can copy or rename the backup file over the modified file. C-2 Applied Biosystems Preparing Data Before Accessing Macros References required The following references are selected by default in the DataExplorerProject in the Visual Basic Editor and are required for the macros in the DataExplorer.VB6 file to successfully run: • • • • • Visual Basic For Applications Data Explorer 4.0 Type Library OLE Automation Microsoft Forms 2.0 Object Library Microsoft Internet Controls To view references: 1. Open the DataExplorerProject (select VisualBasicEditor from the Tools menu in the Data Explorer window). 2. Select References from the Tools menu in the Visual Basic Editor. C C.2 Preparing Data Before Accessing Macros Before you access the toolbox, open data files of interest and: • Smooth the data, if necessary, to reduce noise • Set optimum peak detection and labeling • Set the display range or zoom as needed • Resize and organize the displays as needed • Enable Allow Overlapping Labels (select Peak Label from the Peaks menu). If overlapping labels are not enabled, some peaks may not be labeled. NOTE: Before using the MS Fit/MS Tag toolbox, additional data preparation is recommended. See Section Using MS Fit/MS Tag Toolbox. Data Explorer™ Software User’s Guide C-3 Appendix C Data Explorer Toolbox (Visual Basic Macros) C.3 Accessing the Macros To access the macros: 1. Open the Data Explorer software. 2. Open a data file. 3. Prepare the data as described in the previous section. 4. From the Tools menu, select Macros. 5. In the Macros dialog box, select modToolBoxPalette.Toolbox_Palette, then click Run. The Toolbox Palette dialog box is displayed. C Figure 3-8 Toolbox Palette Dialog Box C-4 Applied Biosystems Using the Ladder Sequencing Toolbox NOTE: If the modToolBoxPalette.Toolbox_Palette is not listed, you must import the macro into the Data Explorer project. For information, see Section 6.7.7, Importing or Exporting Macros in DATAEXPLORER.VB6. Hint: You can assign the modToolBoxPalette.Toolbox_Palette macro to a macro button in the Data Explorer software. For information, see the Data Explorer User’s Guide, Section 6.7, Using the Macro Recorder. You can also access individual macros directly, or assign individual macros to a macro button, by selecting the individual macro in the Macros dialog box. C C.4 Using the Ladder Sequencing Toolbox Use the Ladder Sequencing toolbox when you perform sequencing to label peaks with the appropriate amino acid, DNA, or RNA residue. Labels are determined by calculating the mass differences between the peaks and comparing the values to an internal listing of mass differences and corresponding residues. Running the macro To run the Ladder Sequencing macro: 1. In the Toolbox Palette dialog box, click Ladder Sequencing Toolbox. The range displayed in the Spectrum window is reflected in the Mass Range fields. NOTE: If you zoom on a different region in the Spectrum window, the new range is not updated in the Mass Range field, but is used for the analysis when you click Label Peaks. The range is updated when you click any button. Data Explorer™ Software User’s Guide C-5 Appendix C Data Explorer Toolbox (Visual Basic Macros) 2. Enter the mass tolerance to apply to the analysis. 3. Click Get Spec Peak List. 4. Remove peaks you do not want included in the calculation by clicking the peak in the list, then clicking Delete Selected Peaks/Adducts. 5. Select the type of spectrum you are examining: Peptide, DNA, or RNA. 6. Under Adducts to Remove, select the items you do not want included in the interpretation. C Figure 3-9 Ladder Sequencing Toolbox C-6 Applied Biosystems Using the Ladder Sequencing Toolbox 7. 8. Under Annotate Spectrum, select the types of labels you want displayed: • Reference Mass (*)Mass of the reference peak against which the current peak is compared. • Mass DifferenceDifference between the current peak and the reference, preceded by a minus sign (–). • Peak MassMass of the current peak, preceded by an equal sign (=). Click Label Peaks. If Peptide is selected, the software: • Examines the spectrum in 55 Da increments and selects the most intense ion in the range. (The 55 Da increment is used because it is less than the smallest mass difference related to a residue.) • Labels mass differences (plus or minus the specified Tolerance) that correspond to amino acids. • Labels the reference peak from which the mass difference was derived with an asterisk (*). • Applies the additional labels you selected under Annotate Spectrum. Data Explorer™ Software User’s Guide C-7 C Appendix C Data Explorer Toolbox (Visual Basic Macros) If DNA or RNA is selected, the software: Displaying the original labels C C-8 Applied Biosystems • Examines the spectrum in 270 Da increments and selects the most intense ion in the range. (The 270 Da increment is used because it is less than the smallest mass difference related to a DNA or RNA base.) • Labels mass differences (plus or minus the specified Tolerance) that correspond to DNA (ACGT) or RNA (ACGU) bases. • Labels the reference peak from which the mass difference was derived with an asterisk (*). • Applies the additional labels you selected under Annotate Spectrum. To display the original labels, select Peak Label from the Peaks menu in the Data Explorer software, then deselect User Labels box. Using the Peptide Fragmentation Toolbox C.5 Using the Peptide Fragmentation Toolbox Use the Peptide Fragmentation toolbox when examining Voyager composite PSD spectra or Mariner in-source CID spectra to label immonium ions, identify fragment ion pairs, view sequences based on different reference peaks, and determine if a selected peak is of a specific fragment ion category. Setup To enter Setup parameters for the Peptide Fragmentation Toolbox macro: 1. In the Toolbox Palette dialog box, click Peptide Fragmentation Toolbox. C Figure 3-10 Peptide FragmentationSetup 2. In the Setup tab, click Get Spec Peak List. Data Explorer™ Software User’s Guide C-9 Appendix C Data Explorer Toolbox (Visual Basic Macros) 3. Add peaks to the peak list to be included in the calculation by typing a mass in the Add Mass to Peak List field, then clicking Add Peak. Remove unwanted peaks from the list that you do not want included in the calculation by clicking the peak in the list, then clicking Delete Selected Peaks. 4. Pairs If you will be identifying y and b pairs, select the precursor peak, then click Use Selected Peak. To list ion pairs: 1. Click the Pairs tab. C Figure 3-11 Peptide FragmentationPairs 2. C-10 Applied Biosystems Click the button that corresponds to the ion masses you want identified: • a and b pairs Lists peak pairs with a 28 Da mass difference. • (a, b, y) –17 pairs Lists peak pairs with a 17 Da mass difference, which corresponds to the loss of NH3. Using the Peptide Fragmentation Toolbox Sequence • y and b pairsLists peak pairs whose combined masses plus 1 Da add up to the Precursor Ion Mass you specified on the Setup tab. • Loss of H2O Lists peak pairs with a 18 Da mass difference. 3. To remove all pairs results, click Clear List. 4. To remove a mass from the Spec Peak List (to simplify the sequence interpretation), select an entry in the pairs results, then click Left or Right under Remove Mass. 5. Click Copy to Output Window Result Tab to copy results to the Result tab. You can then copy from the Result tab to another application such as Notepad, or print, as needed. To list ion sequences: 1. C Click the Sequence tab. Figure 3-12 Peptide FragmentationSequence Data Explorer™ Software User’s Guide C-11 Appendix C Data Explorer Toolbox (Visual Basic Macros) 2. If desired, click Label Immonium Ions. NOTE: Label immonium ions before selecting a reference peak and starting the search. If you click Label Immonium Ions after selecting a reference peak, the amino acid labels applied to the spectrum are erased, and mass labels are reapplied. 3. Select a peak in the Spec Peak List, then click Set Selected Peak as Reference. The software evaluates mass differences between the reference peak (labeled with *) and all other peaks, and labels any differences that correspond to amino acid residues. 4. C Select a result peak from the results list, if desired, then continue the sequence search by clicking the Search Down or Up buttons. The newly selected peak is now labeled as the reference peak, and mass differences minus (if you click Down) or plus (if you click Up) are labeled if they correspond to an amino acid residue. You can generate the complete sequence ladder by appending new results to existing results. NOTE: When you search using reference peaks selected from the Sequence Results list, new results retain the label of the original reference peak, and new labels are appended. For example, if you select 433.08(+Thr)(*) as the reference, results are listed as 362.13(+Thr)(-Ala), 331.98(+Thr)(-Thr), and 334.07(+Thr)(-Val). The (+Thr) immediately following the mass corresponds to the selected reference (the result of the original search). The residue following (+Thr) is the residue that corresponds to the mass difference between the mass and the reference mass. C-12 Applied Biosystems Using the Peptide Fragmentation Toolbox 5. Correlation Click Copy to Output Window Result Tab to copy results to the Result tab. You can then copy from the Result tab to another application such as Notepad, or print, as needed. To list ion pair correlations: 1. Click the Correlation tab. 2. Select a peak in the Spec Peak List. 3. Select the correlation you want to determine for the selected peak (that is, click a and b if you want to determine if the selected peak is a member of an ab fragment ion pair). C Figure 3-13 Peptide FragmentationCorrelation Data Explorer™ Software User’s Guide C-13 Appendix C Data Explorer Toolbox (Visual Basic Macros) 4. Click Find Correlation. Correlations for the selected peak are listed. NOTE: Yp, Sp and Tp represent phosphotyrosine, phosphoserine, and phosphothreonine, respectively. Displaying the original labels C C-14 Applied Biosystems 5. Click Copy to Output Window Result Tab to copy results to the Result tab. You can then copy from the Result tab to another application such as Notepad, as needed. 6. You can remove a peak from the Spec Peak list by selecting a correlation in the results list, then clicking Delete Selected Peaks from Spec List. To display the original labels, select Peak Label from the Peaks menu, then deselect User Labels. Using the Polymer Analysis Toolbox C.6 Using the Polymer Analysis Toolbox Use the Polymer Analysis Toolbox to determine the following values that define the molecular distribution of a polymer: • • • • Mn—Number average molecular weight Mw—Weight average molecular weight Mz—z-average molecular weight Mw/Mn—Polydispersity Index The Polydispersity Index represents how widely dispersed the polymeric distribution is. A lower value (for example, 1.02) indicates a narrowly dispersed polymer. A higher value (for example, 3.0) indicates a widely dispersed polymer. Using Polymer Analysis 1. In the Toolbox Palette dialog box, click Polymer Analysis Toolbox. The range displayed in the Spectrum window is reflected in the X Display Range fields. NOTE: If you zoom on a different region in the Spectrum window, the new range is not updated in the X Display Range field, but is used for the analysis when you click Calculate. The range is updated when you click Calculate. 2. Baseline correct the trace. Peak intensities and areas used in the polymer calculations are calculated from a 0 y-axis value, not from the calculated baseline of the peak. Data Explorer™ Software User’s Guide C-15 C Appendix C Data Explorer Toolbox (Visual Basic Macros) 3. Select the mode for the analysis: • Use the entire mass range—Calculates average molecular weights using all peak intensities within the X Display Range. It does not distinguish between different polymeric species that may be present in the mass range. Enter an adduct mass. C Figure 3-14 Polymer Analysis Toolbox NOTE: If the predominant ion series is M+Na+, enter 23 for the adduct ion. If the predominant ion series is M+Ag+, enter 108 for the adduct ion. If you are analyzing an unknown or a mixture, leave this field blank; the calculation is performed without subtracting the adduct ion mass. C-16 Applied Biosystems Using the Polymer Analysis Toolbox • Use labeled peaks—Calculates average molecular weights using areas of peaks listed in the Spec Peak List. It allows calculation of values for a distinct polymer series when two or more species are present. Enter an adduct mass. Enter the mass of the end group to subtract from the calculation. You can leave this field blank if you do not know the end group mass. CAUTION: Correct labeling of the peaks is essential when using the labeled peaks option. 4. Click Calculate. 5. Click Copy to Output Window Result Tab to copy results to the Result tab. You can then copy from the Result tab to another application such as Notepad, as needed. Calculations Data Explorer™ Software User’s Guide C-17 C Appendix C Data Explorer Toolbox (Visual Basic Macros) C.7 Using MS Fit/MS Tag Toolbox Use the MS Fit/MS Tag toolbox when analyzing protein digest, peptide, or peptide fragment spectra to perform a protein database search. Preparing data before accessing C Running MS Fit/MS tag Before using the MS Fit/MS Tag toolbox: 1. In the Data Explorer software, smooth the data, perform a baseline correction, then deisotope. 2. If needed, use Advanced Peak Detection parameters to adjust peak detection ranges and thresholds to screen out noise in low-mass regions and to detect peaks in high-mass regions. 3. Set the Set the %Base Peak Intensity or %Max Peak Area in peak detection until the unwanted noise peaks are removed from the Spec Peak list. To run the MS Fit/MS Tag macro: 1. In the Toolbox Palette dialog box, click MS Fit/MS Tag. Figure 3-15 MS Fit Dialog BoxMS Tag Dialog Box C-18 Applied Biosystems Using MS Fit/MS Tag Toolbox 2. Click: • MS-Fit tabIf you are examining peptide data from a protein digest. • MS-Tag tabIf you are examining PSD data. 3. Navigate to the web site containing the database to search. 4. Adjust settings on the web site as needed. 5. Minimize the web page. Do not exit. 6. In the MS Tag dialog box, enter Parent Ion mass if you are using MS-Tag. 7. Click Copy Peaks. The Spec Peak list for the data file is copied to the web page. 8. C Start the search from the web site. The database search is performed. Results of the search are displayed on the web site. Data Explorer™ Software User’s Guide C-19 Appendix C Data Explorer Toolbox (Visual Basic Macros) C C-20 Applied Biosystems Index Numerics and Symbols - in spectrum header 2-31 %Base Peak Intensity definition, chromatogram 3-20 definition, spectrum 3-22 in peak detection algorithm 3-67 Mariner data 3-7 setting for active detection range, spectrum 3-30 setting global, spectrum 3-22 setting with data cursor, chromatogram 3-11, 3-16 setting with data cursor, spectrum 3-23 setting, chromatogram 3-20 Voyager data 3-10 %Max Peak Area definition, chromatogram 3-20 definition, spectrum 3-23 Mariner data 3-7 setting for active detection range, spectrum 3-30 setting global, spectrum 3-23 setting, chromatogram 3-20 Voyager data 3-9 + in spectrum header 2-31 / in spectrum header 2-31 A a and b ion pairs, labeling C-10 a, b, y -17 ion pairs, labeling C-10 Absolute Threshold, replaced by Minimum Intensity 3-30 AC in spectrum header 2-31, 5-34 Accelerating Voltage changes compensated for by system 5-25 effect on calibration 5-25 Accumulate spectra 4-22 Acquiring data comment, displaying 1-15 comment, displaying for open data file 1-15 comment, displaying when opening a data file 2-3 version of software used for 1-15 Acquisition comment displaying for open data file 1-15 displaying when opening a data file 2-3 Activate file 2-8 Add mode, setting for added traces 2-18 Adding and subtracting spectra from different data files 5-64 from same data file 5-4 raw data only 4-20, 5-4 raw or processed data 5-64 within a data file 4-20 Adding peaks to peak list 3-39 Adding text to traces 2-29 Adding traces maximum number 2-18 procedure 2-18 Replace mode, setting 2-18 Advanced baseline correction 5-48 Advanced peak detection parameters description, spectrum 3-28 setting spectrum 3-17 AdvBC in spectrum header 2-31, 5-53 Air Temperature, displaying trace 4-2 Data Explorer Software User’s Guide Index-1 I N D E X I N D E X Amino acids, labeling C-5 Analog signal, displaying 4-2 Analyzer Temperature, displaying trace 4-2 ANGIOTENSIN_FRAGMENTS.REF 518 Annotating traces adding text 2-29 deleting text 2-29 text from previous trace displayed 2-29 with ASCII text 2-28 with results 2-28 Apex mass copying from peak list 1-41 labeling 3-57 Applied Biosystems Technical Support 9-2 world wide web address xiv Area, peak detection threshold, chromatogram 3-20 detection threshold, global, spectrum 3-23 detection threshold, local, spectrum 3-30 displaying 3-38 in peak detection algorithm 3-68 labeling, chromatogram 3-55 labeling, spectrum 3-58 ASC 5-63 ASC in spectrum header 2-6, 2-31, 5-63 ASCII text annotating traces with 2-28 exporting traces to 1-34 importing traces from 1-35 Assign Macro 6-38 Auto Cal, see Calibrating mass, automatic (Mariner data only) Autocolor description 2-27 setting 1-26 Index-2 Applied Biosystems Automatic Calibration On command dimmed 5-34 see also Calibrating mass, automatic (Mariner data only) settings (reference masses) for Mariner Sequence Control Panel 5-27 settings (reference masses) for Voyager Sequence Control Panel 5-28 settings, importing 5-29 settings, specifying 5-29 Automatic macros 6-45 AutoSaturation Correction (Mariner data only) description 5-62 effect on Mariner .RST files 5-62 effect on mass accuracy 5-62 Average mass definition B-6 labeling partially resolved isotopes 3-10, 7-11 Averaging data, graphic compression 1-28 Averaging spectra 4-22 Axes numbers do not match spectrum numbers 4-25 offsetting Y 4-27 scaling 2-11 turning off right axis 2-12 B Background color changing 1-23 default, Mariner 1-4 default, Voyager 1-4 Background signal evaluating 7-8 subtracting 4-20 Bar mode, traces 1-28 BAS files for macros 6-43 Base mass, labeling peaks 3-55, 3-56 Base peak intensity definition 4-2 scaling to 2-12 threshold for peak detection, chromatogram 3-20 threshold for peak detection, spectrum 3-22, 3-30 Baseline changing line width 1-26 displaying on trace 3-55, 3-58 Baseline correction chromatogram 4-29 spectrum 5-47 spectrum, advanced 5-48 Baseline offset chromatogram 4-27 spectrum 5-45 Basic peak detection parameters description, chromatogram 3-19 description, spectrum 3-22 resetting 3-18 setting, chromatogram 3-11 setting, spectrum 3-13 Basics of the Data Explorer software 1-1, 1-2 BC in chromatogram header 2-30, 4-29 in spectrum header 2-31, 5-47 BIC files see also Instrument settings description 1-6 exporting from DAT 1-36 exporting from RSD and RCD 1-36 Binning data, graphic compression 1-28 BO in chromatogram header 2-30 in spectrum header 2-31, 5-46 BP Relative% label on data cursor 1-27 BPI see also Base peak intensity in chromatogram header 2-30 in spectrum header 1-13, 2-32 C CAL files see also Calibration constants applying 5-16, 8-20 description 1-7 exporting during calibration 5-16 exporting from DAT 1-36 importing 5-16, 8-20 importing, error displayed 9-11, 9-12 PSD, creating 8-20 PSD, overview of creating 8-10 saving 5-16 Calculator tools elemental composition 6-2 Ion Fragmentation 6-25 isotope 6-13 mass resolution 6-20 signal-to-noise ratio 6-23 Calibrating mass, automatic (Mariner data only) see also Calibration constants applying settings to other data files 5-29 batches of related samples 5-29 calibration reference file (REF) 5-17 calibration settings 5-29 commands dimmed on menu 9-11 constants, calculating A and B 5-34 error, fit 5-12 error, initial 5-12 overview 5-26 peak weighting factor 5-33 results 5-35 Data Explorer Software User’s Guide Index-3 I N D E X I N D E X Calibrating mass, automatic (Mariner data only) (continued) reverting to instrument calibration 5-22 troubleshooting 9-9 turning on 5-34 when to use 5-28 Calibrating mass, manual see also Calibration constants baseline correcting and deisotoping to optimize mass accuracy 7-14 calibration reference file (REF) 5-17 commands dimmed on menu 9-11 constants, applying A and B to new file 5-16 error, fit 5-12 error, initial 5-12 fit outliers, eliminating 5-12 importing, Voyager requirements 5-25 multi-point calibration 5-8 overview 5-5 peak matches, clearing list 5-13 peak matches, sorting 5-11 peak matching, automatic 5-6 peak matching, manual 5-6 peak weighting factor 5-10 procedure 5-8 results 5-13 reverting to instrument calibration 5-22 single-point calibration 5-8 troubleshooting 9-9 when to use 5-6 Index-4 Applied Biosystems Calibrating mass, PSD (Voyager data only) all segment masses considered 8-15 calibration reference file (REF) 8-21 constants, applying A and B to new file 8-20 error message when selecting calibration reference file 8-14 internal calibration using known monoamino acid fragment ions 8-10 internal calibration, values used 8-7 multi-point calibration 8-10 peak detection, checking before calibrating 8-10 peak matches, clearing list 8-15 peak matching, automatic 8-15 peak matching, manual 8-16 peak weighting factor 8-14 Precursor mass, changing 8-23 procedure 8-12 results 8-18 reverting to instrument calibration 5-22 selecting peaks for optimum mass accuracy 8-19 selecting peaks near Max Stitch Mass 8-19 single-point calibration 8-10 Calibration, see Calibrating mass Calibration constants see also Calibrating mass applying to new file 5-16, 8-20 calculating 5-34 displayed in Output window 5-14, 8-18 exporting 1-36 extracting from DAT file 1-36 importing from another source 5-16, 8-20 PSD 8-20 reverting to original instrument 5-22 Calibration curve, peak weighting factors 5-10, 8-14 Calibration fit error 5-12 Calibration reference file (REF) ANGIOTENSIN_FRAGMENTS.RE F 5-18 contents 5-18 creating 5-18 default 5-18 duplicate m/z entries 5-20, 5-21, 9-10 error message when selecting 8-14 MARINER_NEG.REF 5-18 MARINER_POS.REF 5-18 modifying 5-20 narrow peaks, specifying as Resolved Isotope mass 5-21, 9-9 not listed 9-10 provided 5-18 PSD, creating 8-21 PSD, specifying Resolved Isotope masses 8-13 selecting for automatic calibration 5-30 selecting for manual calibration 5-9 selecting for PSD calibration 8-13 viewing contents of 5-10 VOYAGER.REF 5-18 Centering a peak 2-15 Centroid mass calculated during peak detection 3-69 calculating 3-39 copying from peak list 1-41 definition B-6 determining 5-36 improving accuracy of calculation during peak detection 3-26 labeling 3-57 Centroid Percent, spectrum, setting 3-26 Centroiding centroid data file size smaller than profile 1-33 command not displayed 9-8 converting profile to centroid data 1-33 creating centroid trace 5-36 during peak detection 3-69 during peak detection, improving calculation 3-26 example 5-36 histogram trace 5-36 manual 5-36 CGM files 1-31, 1-33 Channel, displaying DAD data by 1-12 Charge state, peak and isotope spacing 3-53 converting to singly charged 5-59 converting to zero charged 5-40 custom label applied only if specified charge is present 3-62 determining ion polarity 3-58 examples 3-32 filtering peak list by 3-42 labeled incorrectly 3-60, 9-20 labels 3-53, 3-58, 3-62 labels not displayed 3-60, 9-19 parameters, setting 3-27 Data Explorer Software User’s Guide Index-5 I N D E X I N D E X Charge state, peak (continued) requirements for labeling 3-53 single 5-59 tolerance calculation 3-32 troubleshooting 9-17 z labels 3-58 zero 3-40, 3-43 Chro peak list tab, Output window 1-15 CHRO window, see Chromatogram window Chromatogram noise threshold calculated automatically 3-21, 3-68 in peak detection algorithm 3-68 Chromatogram window see also Chromatogram window, traces see also Peak Labels see also Traces adding and subtracting spectra 4-20 baseline correction 4-29 baseline offset 4-27 composite PSD data, displaying 1-13 constant neutral loss (CNL) chromatogram, creating from 4-9 DAD (diode array detector), displaying Mariner data 4-2 description 1-12 display range, adjusting 2-11 event tags (Mariner data only), filtering 4-24 extracted absorbance chromatogram (XAC) from Mariner data, creating from 4-13 extracted ion chromatogram (XIC) chromatogram, creating from 4-5 improving signal-to-noise ratio 7-2 Mariner data, displaying 1-12, 2-2 Index-6 Applied Biosystems Chromatogram window (continued) multispectrum Voyager data, displaying 1-13 noise filtering 4-17 peak labels 3-52 peak list 3-38 results, opening 2-40 retention time, displaying 1-12 smoothing 4-17 spectrum number, displaying 1-12 traces, selecting type 4-2 vial #, displaying 3-55 Voyager data, displaying multispectrum 2-7 Chromatogram window, traces adding 2-18 do not print 2-34 overlaying 2-25 overlaying from different data files 2-24 previewing and printing 2-33 trace labels in chromatogram 2-30 CID data, labeling C-9 CNL see also Extracted ion chromatogram (CNL) in chromatogram header 2-30 Colors background, changing 1-23 changing to black before printing 2-33 customizing 1-25 default, Mariner 1-4 default, Voyager 1-4 overlaid traces 2-27 setting 1-25 Combined spectrum creating 5-4 definition 5-2 example 7-4, 7-6 label 5-4 CombiSolv data displaying one injection 4-24 Event Tag Filtering command dimmed (Mariner data only) 4-24 Comment acquisition, displaying 1-15 acquisition, displaying for open data file 1-15 acquisition, displaying when opening a data file 2-3 result file 1-15, 2-40 Comparing data files 2-38 Composite spectrum, PSD automatically processed when generated 8-6 displaying segment traces 8-3 generating 8-2, 8-5 how it is generated 8-6 labeling fragment ions 8-8 Max Stitch Masses 8-4 precursor mass, changing 8-23 Composition, elemental 6-2 Compression, data 1-28 Computer configuration requirement A-1 technical support for altered configuration A-1 Configuration, exporting from DAT file 1-36 Constant neutral loss (CNL), see Extracted ion chromatogram (CNL) Context-sensitive menus 1-14 Converting see also Exporting DAT to ASCII 1-34 profile data to centroid 1-33 SPC to DAT 1-30 Voyager .MS files 1-30 Copying all peaks 1-40 apex mass list 1-41 centroid mass list 1-41 data from other data files 2-37 data to Windows clipboard 1-38 displayed peaks 1-39 mass list 1-41 peak list 1-40 results 2-28 to metafile 1-38 trace data 1-39, 2-37 trace image 1-38 Correcting baseline chromatogram 4-29 spectrum 5-47 spectrum, advanced 5-48 Correlation factor, noise filtering 4-18, 5-43 CT file suffix 1-33 in spectrum header 2-32, 5-36 CTS files 1-7 disabling 2-23 purging 2-23 Cursors, see Data cursors 1-27 Custom labels see Graphic options, peak labels, customizing see Peak labels, custom Customer feedback, Technical Publications e-mail address xiv Customizing colors, text, and line width 1-25 creating your own software applications 1-5 data compression 1-28 Data Explorer window 1-17 defaults 1-17 graphic options 1-24 peak labels 3-52 processing settings 1-17 Data Explorer Software User’s Guide Index-7 I N D E X I N D E X Customizing (continued) SET files 1-17 toolbars 1-22 D DAD displaying Channels 1-12, 4-2 displaying TAC 1-12 displaying traces 2-6 extracted absorbance chromatogram (XAC) 4-13 in spectrum header 2-32 spectrum, displaying 4-2, 5-2 TAC in chromatogram header 2-30 XAC in chromatogram header 2-30 Dark background changing colors 1-20 default settings 1-23 SET file 1-19 DAT format converting DAT file to ASCII 1-34 converting from SPC 1-30 converting profile to centroid 1-33 extracting information from 1-6, 1-36 file properties, adding to DAT file 1-31 file properties, searching 1-32 file properties, viewing 1-32 information stored in 1-6 overview 1-5 results, saving, opening, deleting 2-38 Data cursors %Base Peak Intensity, spectrum 3-23 displaying retention time on 1-27 horizontal 1-27 labels 1-27, 4-2 printing and suppressing 1-27 Index-8 Applied Biosystems Data cursors (continued) turning on and off in graphic options 1-27 turning on and off in peak detection 3-23 vertical 1-27 Data Explorer moving between open files 2-8 starting and exiting the software 1-3 window, customizing 1-17 window, parts of 1-11 Data Explorer examples Mariner data 7-2 Voyager data 7-11 Data Explorer Toolbox accessing C-4 Ladder Sequencing macro C-2, C-5 modifying C-2 MS Fit/MS Tag macro C-2 overview C-2 Peptide fragmentation macro C-2, C-9 Polymer analysis macro C-2, C-15 preparing data for C-3 Visual Basic References required C-3 Data file activate 2-8 cannot find 9-3 closing 2-10 closing and running a macro automatically 6-45 comparing open files 2-36, 2-38 converting from profile to centroid 1-33 converting to ASCII 1-34 copying traces from 2-37 decreasing size 1-33 default settings, applying 2-4 error message displayed when opening PSD 8-2, 9-3 Data file (continued) full name not displayed 1-14 inserting traces into 2-37 moving between open 2-8 multiple, zooming 2-36 name 1-14 names do not print 9-13 opening 1-30 opening and applying default and selected settings 2-4 opening and running a macro automatically 6-45 opening manually 2-2 opening PSD 8-2 read-only 2-7 result, opening 2-39, 2-40 switching between open 2-8 trace browser 2-8 version of software used to acquire 1-15 working with separate 2-36 zooming multiple 2-36 Data format, see DAT format Data points copying 1-39 determining number across a peak 3-21, 3-31, 5-51 eliminating from spectrum 5-56 Database search macro C-18 DATAEXPLORER.VB6 exporting macros from 6-44 importing new macros into 6-43 location 6-35 new supplied macros not available until imported 6-43 not overwritten when new software installed 6-43 DBE, definition 6-6 Decimal points, number displayed 3-55, 3-56 DECONV in spectrum header 2-32, 5-40, 5-41 Deconvolution, see Mass deconvolution Default settings, applying from SET file 2-4 DEFAULTBLACK.SET 1-19, 1-23 Defaults background color 1-23 colors, Mariner 1-4 colors, Voyager 1-4 peak detection 3-2 processing and graphics settings, applying when you open a data file 2-4 REF files 5-6, 5-18 SET files 1-19, 1-23, 8-11 setting for dialog boxes 1-17 trace color 1-23 DEFAULTWHITE.SET 1-19, 1-23 Deisotoping description 3-45 enhancing peak interpretation 3-9 example 3-50 formula 3-49 procedure 3-48 requirements 3-47 Deleting peak labels from the trace 3-44, 3-59 peaks from the peak list 3-44, 3-59 text annotation 2-29 Detection Ranges adding, chromatogram 3-19 adding, spectrum 3-29 calculating automatically 3-4 combining, chromatogram 3-20 combining, spectrum 3-29 deleting chromatogram 3-20 deleting, spectrum 3-29 example 3-4 overlapping regions 3-5 PSD data 8-11 Data Explorer Software User’s Guide Index-9 I N D E X I N D E X Detection Ranges (continued) setting manually, chromatogram 3-19, 3-20 setting manually, spectrum 3-28 setting parameters globally, spectrum 3-22 setting parameters locally, spectrum 3-30 Detection, see Peak detection DI in spectrum header 2-32, 3-49 Diode array detector data, see DAD Diode array detector data, see DAD data Disk space, conserving by converting profile data to centroid 1-33 Display range scaling 2-11 x range, expanding 2-11 y range, expanding 2-11 Display Trace dialog box 2-18 Displaying peak labels 3-54, 3-56 Voyager chromatogram window 2-7 DNA residues, labeling C-5 Double bond equivalents (DBE) definition 6-6 determining 6-6 Duplicating a trace 2-15 E EF in chromatogram header 2-30, 4-25 redisplaying original data 4-26 Elemental composition calculating 6-2 description 6-2 elements, adding 6-9 fragment ions, electron state for accurate results 6-5 fragment ions, identifying 6-2 Index-10 Applied Biosystems Elemental composition (continued) Isotope Match Score 6-6 Isotope Match Score not reported for fragment ion calculations 6-6 isotope min and max values ignored 6-8, 6-11 limits, setting 6-7, 6-9, 6-12 Periodic table 6-10 procedure 6-3 results 6-5 Elemental targeting description 6-31 Isotope Match Score 6-33 procedure 6-31 results 6-33 theoretical isotope, displaying 6-33 Eliminate Fit Outlier 5-12 E-mail address, Technical Publications xiv Equations PSD calibration 8-6 resolution-based peak detection 3-4 Error, calibration fit 5-12 initial 5-12 Event tag filtering (Mariner data only) not displayed on Process menu 4-24 overview 4-23 performing 4-24 redisplaying original data 4-26 Event tag, MS Method (Mariner data only) see also MS Method (Mariner data only), events determining tags in file 4-23 displaying 4-23 filtering 4-23 redisplaying original data 4-26 Examples, see Data Explorer examples Excel, see Microsoft Excel Exiting software 1-3 Expanding traces 2-21 Exporting see also Converting ASCII data 1-34 BIC 1-36 CAL files 1-36 Configuration from DAT file 1-36 entire data file 1-34 macros from DATA EXPLORER.VB6 6-44 MSM and CAL from DAT 1-36 results 2-39 RSD and RCD files 2-39 trace to ASCII format 1-34 Extracted absorbance chromatogram (XAC) (Mariner data only) creating 4-13 definition 4-3 displaying 4-13 trace label 4-14, 4-15 Extracted ion chromatogram (CNL) corresponds to loss of fragments 4-9 creating, example 4-12 definition 4-3, 4-9 determining if mass difference 4-9 trace label 4-9, 4-10 Extracted ion chromatogram (XIC) creating 4-5 definition 4-3, 4-4 example 7-2, 7-5, 7-10 improving signal-to-noise ratio 4-6 including only mass of interest 4-6 trace label 2-31, 4-7, 4-8, 4-16 Extraction mode, setting 4-7, 4-11 F Failed to create empty document message 9-3 Failed to open chromatogram data message 9-4 File format, converting SPC to DAT 1-30 File management 1-30 File name does not print 9-13 full name not displayed 1-14 File properties searching 1-32 viewing 1-32 File size, reducing 1-33 File types 1-6 to 1-8 Files automatically running macros when opening or closing 6-45 cannot find 9-3 closing 2-10 error message displayed when opening PSD 8-2, 9-3 moving between open 2-8 opening manually 2-2 opening PSD 8-2 read-only 2-7 Filter Width in peak detection algorithm 3-3, 3-67 PSD segments 8-11 setting automatically 3-3 setting manually, chromatogram 3-20, 3-21 setting manually, spectrum 3-31 too high, peaks not labeled 3-20, 3-21, 3-31, 9-19 value used when resolution-based detection enabled 3-3 Data Explorer Software User’s Guide Index-11 I N D E X I N D E X Filter Width Increment setting manually, spectrum 3-31 suggested value, spectrum 3-31 value used when resolution-based peak detection enabled 3-31 Filtered traces, viewing, see Filtering Filtering chromatogram traces 4-23 event tags (Mariner data only) 4-24 monoisotopic peaks 3-43 noise, chromatogram 4-17 peak list 3-42 Fit Error, calibration 5-12 Formulas determining if present in observed spectrum 6-31 determining possible for a mass 6-2 Fragment ions correspond to loss of 4-9 determining if mass difference 4-9 electron state for accurate results 6-5 generating list of masses with Ion Fragmentation calculator 6-25 identifying with Elemental Composition calculator 6-2 labeling 6-25, C-9 Peptide fragmentation macro C-9 Fragment spectrum, PSD, see Segment spectrum, PSD FRM files for macros 6-43 FWHM 6-20 Index-12 Applied Biosystems G Gaussian Fitting, peak detection 3-26 Gaussian smoothing, see Smoothing Global peak detection parameters description, spectrum 3-22 overriding for individual detection ranges, spectrum 3-30 setting spectrum 3-13 Graphic options accessing 1-24 default settings for white or dark background 1-19, 1-23 extracting from DAT file 1-36 graphic compression 1-28 peak labels, customizing 1-25 saving and restoring 1-20 saving to a SET file 1-37 setting graph and plot colors with 1-25 turning off right axis 2-12 Graphic settings applying 2-4 automatically saved when data file closed 1-18 description 1-18 extracting from DAT file 1-37 modifying 1-19 saving and restoring 1-20 saving for use with other data files 1-19 H Help, see PerSeptive Biosystems Technical Support Histogram, centroid 5-36 Horizontal cursor 1-27 Horizontal peak labels 3-55, 3-58 How to use this guide xi I Immonium ions, labeling C-9 IMMONIUM_IONS.REF 5-18, 8-19 Import Calibration error displayed 9-11, 9-12 procedure 5-16 PSD 8-20 Importing macros into DATA EXPLORER.VB6 6-43 PKT files to Excel 3-41 trace from ASCII format 1-35 Improving signal-to-noise ratio 5-2, 7-2 Initial Error, calibration 5-12 Inserting peaks in peak list 3-39 In-source CID data, labeling C-9 Instrument calibration reapplying 5-22 reverting to 5-22 Instrument settings extracting from DAT file 1-36 tab, Output window 1-16 viewing 1-16 Integration description 3-70 setting, chromatogram 3-21 setting, spectrum 3-26 Valley-to-Baseline, chromatogram 3-21, 3-70 Valley-to-Baseline, spectrum 3-26, 3-70 Valley-to-Valley, chromatogram 3-21, 3-70 Valley-to-Valley, spectrum 3-26, 3-70 Internal mass calibration 5-5, 5-26 Internal standard calibration, see Calibrating mass Ion Fragmentation Calculator description 6-25 procedure 6-25 PSD segment spectra, labeling 8-8 REF file, PSD, creating 8-21 results 6-29 sequence codes, acceptable 6-26 ISO in spectrum header 2-32, 6-6, 6-16, 6-18, 6-33 Isotope average mass, labeling 3-10, 7-11 description B-1 displaying theoretical 6-33 isotopic envelope B-5 list of common B-8 monoisotopic and average masses B-6 monoisotopic, labeling 3-43 overview B-1 parameters controlling charge state determination 3-27 partially resolved, labeling 7-11 resolution, limits of system 3-53 resolution, overview B-4 spacing, and charge state 3-53 theoretical, generating with Elemental Composition Calculator 6-6 theoretical, generating with Elemental Targeting 6-33 theoretical, generating with Isotope Calculator 6-18 troubleshooting 9-17 Isotope calculator amino acid codes 6-14 charge state to calculate 6-15 element codes 6-14 evaluating traces 6-18 examples 6-16 result, failed to calculate 9-6 results 6-19 using 6-13 Data Explorer Software User’s Guide Index-13 I N D E X I N D E X Isotope Match Intensity, elemental targeting 6-33 Isotope Match Score elemental composition 6-6 elemental composition, not reported for fragment ion calculations 6-6 elemental targeting 6-33 K Keywords, Windows NT entering 1-31 searching 1-32 viewing 1-32 L Labeling peaks see also Peak labels chromatogram 3-54 customizing label appearance 1-25 factors affecting 3-52 manually 3-39 monoisotopic 3-43 partially resolved 7-11 spectrum 3-56 with amino acid, DNA, or RNA labels C-5 with area 3-58 with charge state 3-43, 3-53, 3-58 with time 3-55 with vial number 3-55 Labels see also Data cursor see also Peak labels see also Trace labels AC 5-34 added and subtracted spectra 4-22 AdvBC 5-53 BC 4-29, 5-47 BO 4-28, 5-46 Index-14 Applied Biosystems Labels (continued) CNL 4-9 CT 5-36 DECONV 5-40, 5-41 filtered trace 4-25 ISO 6-6, 6-16, 6-33 MC 5-13 NF 4-19, 5-44 NR 4-19, 5-44 retention time displayed 4-22 RSM 5-44 SC 5-60 SM 4-19, 5-44 TR 5-57 XAC 4-14, 4-15 XIC 4-7 Ladder Sequencing macro C-2, C-5 Landscape printer orientation lost when you exit 9-13 setting permanently 2-35 LBC or LBS files, in DAT format applying 3-65 creating 3-64 description 1-7 extracting from DAT file 1-36 Line mode, traces 1-28 Line width, setting 1-26 Linking multiple data files for zooming 2-13 traces within a data file 2-21 views 2-13 views, does not work 9-7 Local peak detection parameters description, spectrum 3-28 setting, spectrum 3-28 Loss of H2O, determining C-11 Loss of NH3, determining C-10 Low Mass Gate spike, eliminating 5-56, 5-57 M Macro Recorder advanced editing 6-42 buttons, assigning to macros 6-38 DATAEXPLORER.VB6 location 6-35 DATAEXPLORER.VB6 not overwritten when new software installed 6-43 deleting a macro 6-41 description 6-34 exporting macros from DATA EXPLORER.VB6 6-44 functions not supported 6-35 importing macros into DATA EXPLORER.VB6 6-43 location of macros 6-35 maximum number of macros 6-34 new supplied macros not available until imported 6-43 recording 6-37 running a macro 6-39 toolbar, displaying 6-35 Visual Basic Editor 6-42 Macros provided, see Data Explorer Toolbox recording 6-37 running automatically when opening and closing data files 6-45 running manually 6-39 Manual calibration, see Calibrating mass, manual Manually labeling peaks 3-39, 3-52 Mariner data Chromatogram window, displaying 2-2 DAD data (diode array detector), displaying 1-12 DAD spectrum, displaying 5-2 Mariner data (continued) examples 7-2 in-source CID, labeling C-9 isotope resolution limits 3-53 mass accuracy affected by peak shape 5-7, 5-47 peak detection strategy 3-6 Mariner Sequence Control Panel, automatic calibration settings (reference masses) for 5-27 MARINER.REF viewing masses in 5-10 MARINER_NEG.REF provided 5-18 MARINER_POS.REF provided 5-18 Mass apex, copying from peak list 1-41 apex, labeling 3-57 average B-6 centroid, see Mass, centroid in chromatogram header 2-30 in chromatogram header, replaced by XIC 2-31 labels 3-56 monoisotopic, see Monoisotopic peak Mass accuracy affected by peak shape 5-7, 5-47 multi-point calibration versus single-point calibration 5-8, 8-10 Mass accuracy, optimizing by AutoSaturation Correction (Mariner data only) 5-62 by baseline correcting and deisotoping before calibrating 7-14 by baseline correcting and noise filtering before calibrating 5-7 Data Explorer Software User’s Guide Index-15 I N D E X I N D E X Mass Calibration commands dimmed on menu 9-11 not displayed on menu 9-8 Mass calibration, see Calibrating mass Mass, centroid calculating 3-39 copying from peak list 1-41 definition B-6 displaying peaks as histograms 5-36 labeling 3-57 Mass deconvolution command dimmed on Process menu 5-37, 9-8 example 7-4 performing 5-37 result, failed to calculate 9-8 results 5-40 Mass Difference peak label from adjacent peak (regular labels) 3-57 from adjacent peak (user labels) 3-62 from selected peak 3-57 Mass list, copying to Windows clipboard 1-41 Mass Offset, replaced by Mass Difference from Selected Peak 3-57 Mass Resolution Calculator, see Resolution, mass Mass resolution defaults used in peak detection 3-24 Match Charge State 3-62 Max Stitch Mass definition 8-4 displaying 8-4 optimum focus and resolution observed near this mass 8-4 updated when Precursor mass changed 8-24 Index-16 Applied Biosystems Maximize trace window 2-9 Maximum Charge State description 3-27 set too low 3-33 Maximum Isotopes setting 3-27 setting too low 3-35 MC in spectrum header 2-6, 2-32, 5-13, 5-15, 5-17, 5-22, 5-23, 7-17, 8-18 Metafile, copying to 1-39 Microsoft applications Excel 1-5 Microsoft Office 1-5 Visual Basic Editor 6-42 Word 1-5 Microsoft Excel, importing PKT files to 3-41 Minimum Area, setting spectrum 3-30 Minimum Intensity in peak detection algorithm 3-67 setting spectrum 3-30 Mn Mw Mz Mw/Mn, determining C-15 Monoisotopic peak deisotoping a spectrum 3-9, 3-45 displaying in peak list 3-43 filtering 3-43 labeling 3-43 mass, definition B-6 reducing trace to 3-9, 3-45 Moving between open files 1-12 MS Fit/MS Tag macro C-2 MS Method (Mariner data only) applications 4-23 conditions and tags, displaying 4-23 Event Tag Filtering command dimmed 4-24 event tag, filtering 4-23 instrument settings, extracting from DAT file 1-36 MS Method (Mariner data only) (continued) instrument settings, viewing 4-23 spectrum numbers in filtered trace 4-25 MSM files extracting from DAT file 1-36 overview 1-7 Multiple Charge command dimmed on menu 5-37, 9-8 not displayed on menu 9-8 Multiple data files comparing 2-36, 2-38 copying traces into a window 2-37 printing 2-36 working with separately 2-36 zooming 2-13, 2-36 Multiple spectra in Voyager data files 2-7 Multiply charged peaks deconvoluting 5-37 single-charge conversion 5-59 Multi-point calibration, see Calibrating mass N Negative ion z label 3-58 Neutral loss chromatogram, see Extracted ion chromatogram (CNL) NF in chromatogram header 2-30, 4-19 in spectrum header 2-32, 5-44 Noise filtering chromatogram 4-17 spectrum 5-42 spectrum, recommended setting 4-18, 5-43 Noise Threshold chromatogram, calculated automatically 3-21, 3-68 in peak detection algorithm 3-68 setting locally, spectrum 3-30 Noise, screening out noise filtering command 4-17, 5-42 subtracting spectra and creating extracted ion chromatogram (Mariner data) 7-8 truncate spectrum 5-56 Nozzle Temperature, displaying trace 4-2 NR in chromatogram header 2-30, 4-19 in spectrum header 2-32, 5-44 Number average molecular weight, determining C-15 Number of data points across a peak, determining 3-21, 3-31, 5-51 O Offsetting baseline chromatogram 4-27 spectrum 5-45 Offsetting UV trace (Mariner data only) Mariner data 4-30 restoring original trace 4-31 Open files, moving between 2-8 Opening data files 2-2 data files and automatically running a macro 6-45 PSD data files 8-2 result files 2-40 Data Explorer Software User’s Guide Index-17 I N D E X I N D E X Output window acquisition comment, displaying 1-15 calibration statistics, displaying 5-13, 8-18 Chro Peak list tab 1-15 clearing 1-16 closing 1-16 copying results from 2-28 instrument settings 1-16 Instrument Settings tab 1-15 peak list, chro 1-15 peak list, displaying 1-15 peak list, importing and saving in Excel 3-41 peak list, saving as a file 3-40 peak list, spec 1-15 Results tab 1-15 results, displaying 1-15 sample info 1-15 Sample Info tab 1-15 Spec Peak list tab 1-15 Overlapping peak labels 3-55, 3-58 Overlaying traces active trace color 2-26 advancing 2-26 autocolor 2-27 colors, setting 2-27 procedure 2-24 scaling options 2-27 troubleshooting 9-6 P Partially resolved peaks, labeling 7-11 Peak area, see Area, peak centroid, see Centroid mass charge state, see Charge state, peak deisotoping, see Deisotoping inserting 3-39 Index-18 Applied Biosystems Peak bounds color, changing 1-25 in peak labels 3-55, 3-58 Peak detection see also Detection Ranges see also Peak detection parameters see also Peak detection, Mariner data see also Peak detection, resolution-based see also Peak detection, Voyager data accessing 3-11, 3-13 Advanced Settings tab not available 3-17, 3-28 Advanced Settings, spectrum 3-17, 3-28 baseline, changing line width 1-26 baseline, displaying 3-55, 3-58 Basic Settings, spectrum 3-13, 3-22 charge state determination 3-27 chromatogram 3-68 chromatogram, Noise Threshold calculated automatically 3-21, 3-68 data cursors, turning on and off 3-23 data points across a peak, determining number 3-21, 3-31, 5-51 default 3-2, 3-71 Filter Width and Increment used 3-3 Gaussian Fitting 3-26 isotope determination 3-27 isotope, partially resolved 7-11 manually inserting peaks in peak list 3-39 Peak detection (continued) Noise Threshold, calculated automatically for chromatogram data 3-21, 3-68 overview 3-2 Peak Processing parameters, spectrum 3-16, 3-26 peak start and end, displaying 3-55, 3-58 peaks do not appear in spectrum 9-17 process that occurs during 3-67 proteins 3-6 ranges, overlapping 3-5 regions, setting chromatogram 3-19, 3-20 regions, setting spectrum 3-28 resetting Basic settings 3-18 spectrum 3-68 troubleshooting 9-14 use same settings for all traces 3-21, 3-25 Peak detection parameters, chromatogram description 3-19 setting 3-11, 3-19 Peak detection parameters, spectrum Advanced 3-28 Basic 3-22 global, description 3-22 global, setting 3-13 individual detection ranges, setting for 3-30 local, description 3-28 local, setting 3-28 Peak Processing 3-26 Peak detection, Mariner data see also Peak detection default settings 3-71 noise detected as peaks 3-7 strategy for 3-6 troubleshooting 3-6 Peak detection, resolution-based see also Peak detection default resolution 3-6, 3-24 description 3-3 enabling 3-23 Filter Width value used 3-3 formula used to calculate number of data points 3-4 overriding 3-10, 3-14 Peak detection, Voyager data see also Peak detection complex digests 7-18 default settings 3-71 deisotoping to aid in peak detection 3-9 high mass peaks not detected 3-9 improving by baseline correcting, noise filtering, or smoothing 3-8 noise detected as peaks 3-9 partially resolved peaks not detected 3-10, 7-11 peaks of interest not detected 3-9 PSD 8-11 strategy for 3-8 troubleshooting 3-9 Peak integration, see Integration Peak labels see also Peak labels, charge state see also Peak labels, filtering see also Peak labels, Mass Difference 45 degree angle 3-55, 3-58 amino acid C-5 apex 3-56 applying user labels from LBC and LBS files 3-65 area, chromatogram 3-55 area, spectrum 3-56, 3-58 base peak mass 3-55, 3-56 baseline, changing line width 1-26 baseline, displaying 3-55, 3-58 Data Explorer Software User’s Guide Index-19 I N D E X I N D E X Peak labels (continued) centroid 3-56 chromatogram, setting 3-54 custom 3-61 custom, creating for fragment spectra 8-9 customizing 1-25 decimal places displayed 3-55, 3-56 deleting from trace 3-44, 3-59 displaying 3-65 DNA C-5 extracting from DAT file 3-64 factors affecting 3-52 height 3-55, 3-56 horizontal 3-55, 3-58 immonium ions C-9 manually applying 3-39, 3-52 manually inserting peaks 3-39 monoisotopic 3-43 not displayed 3-59, 3-66, 9-14, 9-15 overlapping 3-55, 3-58 peak start and end, displaying 3-55, 3-58 PSD 8-8 RNA C-5 spectrum number 3-55, 3-56 spectrum, setting 3-56 time 3-55, 3-56 troubleshooting 9-14 turning on and off in chromatogram 3-52 user defined 3-61 vertical 3-55, 3-58 Vial number 3-55 Peak labels, charge state filtering 3-43 incorrect 9-20 not displayed 9-19 parameters used 3-53 requirements 3-53 selecting 3-58 user labels 3-62 Index-20 Applied Biosystems Peak labels, filtering charge state 3-43 monoisotopic peak 3-43 Peak labels, Mass Difference From Adjacent Peak (regular labels) 3-57 From Adjacent Peak (user labels) 3-62 From Selected Peak 3-57 Peak list charge state, displaying selected 3-42 Chro and Spec 3-40 contents 3-38 copying apex masses only 1-41 copying centroid masses only 1-41 copying to Windows clipboard 1-40 copying with headings 1-40 copying without headings 3-41 deleting peaks 3-44, 3-59 description 3-37 displaying 3-37, 3-40 filtering 3-43 importing and saving in Excel 3-41 inserting peaks manually 3-39 monoisotopic peaks, displaying 3-42 printing 3-44 saving as a file 3-40 sorting 3-42 when created 3-37 zero charge state displayed 3-43 Peak matches clearing list 5-13, 8-15 sorting 5-11 Peak matching automatic calibration 5-32 manual calibration 5-6, 5-9 PSD calibration 8-14 Peak resolution, see Resolution, mass Peak Threshold%, replaced by %Base Peak Intensity 3-20, 3-22 Peak weighting factors 5-10, 8-14 Peak Width minimum and maximum used 3-21, 3-25 set automatically by software 3-21, 3-25 Peaks, do not appear in spectrum 9-17 Peptide fragmentation macro C-2, C-9 Periodic table 6-10 PerSeptive Biosystems Technical Support, see Applied Biosystems Technical Support PKT files 3-40 Points across a peak, determining 3-21, 3-31, 5-51 Polydispersity index, determining C-15 Polymer analysis macro C-2, C-15 Positive ion z label 3-58 Precursor mass, see PSD analysis Preface xi Previewing traces before printing 2-33 Print preview 2-33 Print Setup 2-36 Printer, setting to landscape orientation 2-35 Printing all traces in view 2-34 changing colors to black before 2-33 data cursors 1-27 data file names do not print 2-34, 2-37 landscape orientation 2-35 multiple files 2-34 peak list 3-44 traces 2-33 traces do not print 2-34 troubleshooting 9-13 without previewing 2-34 Process menu, commands not displayed 9-8 Processing see also Processing settings commands not displayed on menu 9-6 troubleshooting 9-6 Processing History description 2-22 disabling 2-23 options 2-23 using 2-22 Processing settings applying when opening data file 2-4 automatically saved when data file closed 1-18 customizing 1-19 description 1-18 extracting from DAT file 1-36 modifying 1-19 peak detection parameters, spectrum 3-26 saving and restoring 1-20 saving for use with other data files 1-19 Profile data converting to centroid 1-33 traces do not print 1-26, 2-35 Properties, see File properties Protein database search macro C-18 Proteins, detection 3-6 Proton mass, value 3-32 PSD analysis see also Calibration mass, PSD (Voyager data only) see also Voyager Biospectrometry Workstation Users Guide CAL file, creating 8-20 calibrating 8-10 Change Mass function 8-23 Data Explorer Software User’s Guide Index-21 I N D E X I N D E X PSD analysis (continued) composite spectrum, displaying 8-2, 8-5 composite spectrum, how it is generated 8-6 fragment labels, applying 8-8 optimum resolution observed near Max Stitch Mass 8-4 peak detection algorithm 3-5 peak detection, checking 8-10 Peptide fragmentation macro C-9 precursor mass, changing 8-23 PSD, overview of creating 8-10 REF file, creating 8-21 segment labels, applying 8-8 segment traces, displaying 8-3 PSD calibration equation 8-6 Precursor mass, impact of changing 8-23 PSD data, in Voyager, displaying 1-13 PSD mode constants 8-6 equation 8-6 R Raw data, copying x,y pairs 1-39 RCD file deleting 2-39 description 1-10 exporting 2-39 extracting information from 1-36 opening 2-39 RCT files see also Results name of raw data file result is derived from 2-38, 2-39, 2-41 opening 2-39, 2-40 saving 2-40 Read-only files, viewing 2-7 Index-22 Applied Biosystems Realign, UV trace 4-30 Reapplying instrument calibration 5-22 Recording a macro 6-37 REF files, see Calibration reference file (REF) Reference masses, calibration see also Calibration reference file (REF) adding to REF file 5-18 displaying list of 5-10, 8-16 for Voyager Sequence Control Panel 5-27, 5-28 selecting 5-10, 5-14, 7-17, 8-15, 8-16 References required for Data Explorer Toolbox (Visual Basic macros provided) C-3 Related documents xiv Removing traces active 2-21 inactive 2-21 Replace mode, setting for added traces 2-18 Resolution Calculator not displayed 9-8 Resolution, mass calculating 6-20 command not on menu 9-8 default peak height used 6-20 defaults used in peak detection 3-24 isotope B-4 isotope, Mariner data 3-53 isotope, Voyager data 3-53 isotope-limited B-5 PSD segment, optimum observed near Max Stitch Mass 8-4 results 6-22 trend within PSD segments 8-11 Resolution-based peak detection, see Peak detection, resolution-based Result tab, Output window 1-15 Results see also RSD and RCD annotating traces with 2-28 copying 2-28 displaying in Output window 1-15 elemental composition 6-5 elemental targeting 6-33 exporting 2-39 extracting information from 1-36 ion fragmentation 6-29 isotope 6-19 mass deconvolution 5-40 name of raw data file result is derived from 1-15 peak list 3-38 RCD and RSD files 2-39 resolution, mass 6-22 signal-to-noise ratio 6-24 Results (DAT) copying 2-28 deleting results 2-38 opening results 2-38 saving results 2-38 title when saving 2-38 Results (SPC) AutoSaturation Correction, effect on (Mariner only) 5-62 copying 2-28 name of raw data file result is derived from 2-38, 2-39, 2-41 opening RST and RCT files 2-39, 2-40 saving RST and RCT files 2-40 Retention time, displaying for chromatogram 1-12 on data cursor 1-27 Reverting to instrument calibration 5-22 Right axis, turning off 2-12 RNA residues, labeling C-5 RSD file deleting 2-39 description 1-10 exporting 2-39 extracting information from 1-36 opening 2-39 RSM in spectrum header 2-32, 5-44 RST files see also Results name of raw data file result is derived from 2-38, 2-39, 2-41 not affected by AutoSaturation Correction 5-62 opening 2-39, 2-40 saving 2-40 Running a macro automatically 6-45 manually 6-39 S Sample info tab, Output window 1-15 Saturated spectra, correcting (Mariner data only) 5-62 SC in spectrum header 2-32, 5-60 Scaling see also Display Range overlaid traces 2-27 to Absolute Value 2-12 to Base Peak 2-12 to min/max Y 2-12 Searching for keywords 1-32 Segment spectra, PSD calibrating 8-12 creating custom peak labels 8-9 labeling 8-8 lower masses require higher Filter Width setting 8-11 optimum resolution observed near Max Stitch Mass 8-4 resolution trend within 8-11 Data Explorer Software User’s Guide Index-23 I N D E X I N D E X Sequence Control Panel, Mariner, automatic calibration settings (reference masses) for 5-27 Sequence Control Panel, Voyager, automatic calibration settings (reference masses) for 5-28 SET files applying 1-20 applying when opening data file 2-4 contents 1-18 creating for Mariner Sequence Control Panel 5-27 creating for Voyager Sequence Control Panel 5-28, 5-29 customizing 1-19 defaults 1-19, 1-23 description 1-7 extracting from DAT 1-37 modifying 1-19 restoring 1-20 saving for use with other data files 1-19 saving for Voyager Sequence Control Panel 5-33 viewing contents of 1-18 Settings see also Graphic settings see also Processing settings see also SET files automatically saved when data file closed 1-18 restoring and saving 1-20 Signal intensity, summing for one mass 5-2 Signal-to-noise ratio algorithm 6-23 calculating 6-23 improving 5-2, 7-2, 7-3 Index-24 Applied Biosystems Single-charge conversion description 5-59 example 5-61 multiply-charged peaks seen after conversion 5-62 procedure 5-59 troubleshooting 5-62 Single-point calibration, see Calibrating mass SM in chromatogram header 2-30, 4-19 in spectrum header 2-32, 5-44 Smoothing chromatogram 4-17 setting method performed by toolbar 5-42 spectrum 5-42 spectrum, default 5-43 Software, starting and exiting 1-3 Sorting the peak list 3-42 SPC file converting from profile to centroid 1-33 converting to DAT 1-30 results, saving, opening, and deleting 2-40 Voyager, not supported 1-6 Spec peak list, Output window 1-15 SPEC window, see Spectrum window Spectra accumulating 4-22 adding/subtracting from different data files 5-64 adding/subtracting within a data file 4-20 averaging 4-22 combining (Mariner data only) 5-2, 5-4, 7-4 saturated, correcting 5-62 single-charge conversion 5-59 subtracting 4-20 Spectra (continued) summing non-contiguous 4-21 troubleshooting 9-17 truncating 5-56 types of 5-2 Spectrum noise threshold, setting locally 3-30 Spectrum window see also Peak labels see also Spectrum window, traces see also Traces adding spectra from different data files 5-64 adding spectra from same data file 5-4 baseline correction 5-47 baseline correction, advanced 5-48 baseline offset 5-45 centroid, creating 5-36 centroiding 3-69, 5-36 charge state labels incorrect 3-60, 9-20 charge state labels not displayed 9-19 charge state, labeling peaks with 3-53 combined spectrum, creating 5-4 context-sensitive menus 1-14 DAD (diode array detector), displaying Mariner data 4-2 description 1-13 display range, adjusting 2-11 extracted absorbance chromatogram (XAC), creating from 4-13 extracted ion chromatogram (XAC), creating from 4-15 extracted ion chromatogram (XIC), creating from 4-5, 4-8 linking in different data files 2-13 Mariner DAD data, displaying 1-13 mass deconvolution 5-37 noise filtering 5-42 Spectrum window (continued) organizing 2-13 peak list 3-38 peak, centering 2-15 resolution, mass, calculating 6-20 results, opening 2-40 signal-to-noise ratio, calculating 6-23 smoothing 5-42 spectrum numbers on trace do not match axis 9-5 subtracting spectra from different data files 5-64 types of data 5-2 Spectrum window, traces adding 2-18 displaying as vertical bars 5-36 do not print 2-34 overlaying 2-25 overlaying from different data files 2-24 previewing and printing 2-33 Spray Tip Potential, displaying trace 4-2 Spreadsheet, saving peak list in 3-41 Starting Data Explorer software 1-3 Stitched PSD in spectrum header 2-32, 8-2 Stitched spectrum, see Composite spectrum Stopping Data Explorer software 1-3 Subtracting background 4-20 raw spectra within a data file 4-20 spectra from different data files 5-64 spectra, example 7-8 Summing data, graphic compression 1-28 Summing spectra see Adding spectra see Combined spectrum Data Explorer Software User’s Guide Index-25 I N D E X I N D E X T Tabs for open files 2-8 in Data Explorer window 2-8 TAC in chromatogram header 2-30 Mariner data, optional 1-12 Tag, see Event tag Target compounds determining if present in spectrum 6-31 Technical support contacting 9-2 for computers with altered configuration A-1 Temperature trace, displaying 4-2 Text files saving peak list in PKT 3-40 Threshold, peak detection chromatogram 3-20 global, spectrum 3-22 local, spectrum 3-30 TIC see also Chromatogram window description 4-2, 4-3 Title when saving results 2-38 Toolbars buttons, adding and removing 1-21 customizing 1-21, 1-22 description 1-12 Macro, displaying 6-35 moving 1-22 Smoothing button, setting method performed 5-42 Tools commands not displayed on menu 9-6 ToolTips 1-12 TR in spectrum header 2-32, 5-57 Trace browser 2-9 Index-26 Applied Biosystems Trace labels cannot be removed 2-30 chromatogram 2-30 spectrum 2-31 Trace windows, maximizing 2-9 Traces see also Trace labels see also Traces, copying see also Traces, removing adding 2-16, 2-18 annotating 2-28 axes, setting 2-11 bar mode 1-28 centering a peak 2-15 centroid, creating 5-36 changing colors to black before printing 2-33 colors, setting 1-25 comparing 2-38 display range, setting 2-11 displaying as vertical bars 5-36 distorted when you copy to another application 1-39 dividing 2-15 do not print 2-34 duplicating 2-15 expanding 2-21 exporting to ASCII format 1-34 filtering, see Event tag filtering (Mariner data only) graphic compression 1-28 importing from ASCII format 1-35 line mode 1-28 line width 1-26 linking 2-21 overlaid, troubleshooting 9-6 overlay scaling 2-27 overlaying 2-25 previewing 2-33 printing 2-33 rearranging order 2-22 recalling previously processed 2-22 Traces (continued) Replace mode, setting 2-17 scaling mode, setting 2-12 splitting 2-15 switching between 2-8 text, customizing 1-25 traces do not print 1-26, 2-33 type, selecting in Chromatogram window 4-2 use same graphic options settings for all 1-24 UV, offset 4-30 vertical bar mode 1-28 white, does not print 1-26, 2-33 Traces, copying from different data file 2-37 to Windows clipboard 1-38 to WMF 1-39 Traces, removing active 2-21 from history list 2-22 inactive 2-21 Troubleshooting calibration 9-9 calibration reference file (REF) not listed 9-10 charge state and isotope 9-17 charge state incorrectly labeled 9-17 conversion 9-5 Deconvolution commands dimmed 5-37 elemental composition limits ignored 6-8, 6-11 error messages when you open a file 9-4, 9-5 extracted ion chromatogram created when you right-click-drag to apply custom label 9-15 general 9-3 Isotope calculator 6-19 Troubleshooting (continued) Link View does not work 9-7 Multiple Charge commands dimmed 5-37 overlaid traces 9-6 overview 9-2 peak detection 9-14 peak detection, Voyager 3-9 peak labeling 9-14 printer does not stay set to landscape mode 9-13 printing 9-13 processing 9-6 single-charge conversion 5-62 spectrum 9-17 tools 9-6 Truncate spectrum 5-56 TXT file 1-34 U Unresolved peaks, deconvoluting and evaluating 7-4 Unzooming 2-14 User labels changing values 3-64 creating 3-61 customizing colors, font, size 3-61 do not display 3-59, 3-66 enabling 3-65 importing from other files 3-65 saving settings 3-64 setting values 3-64 UV (Mariner data only) see also DAD data (diode array detector) DAD data (diode array detector), displaying 5-2 displaying trace 4-2 trace offset 4-30 Data Explorer Software User’s Guide Index-27 I N D E X I N D E X V Valley-to-Baseline integration chromatogram 3-21, 3-70 spectrum 3-26, 3-70 Valley-to-Valley integration chromatogram 3-21, 3-70 spectrum 3-26, 3-70 Version of software used to acquire data 1-15 Vertical bars displaying centroid traces 5-36 traces do not print 2-34 Vertical cursor 1-27 Vertical peak labels 3-55, 3-58 Vial number, displaying in Chromatogram window 3-55 Viewing read-only files 2-7 Views, linking 2-13 Visual Basic Editor 6-42 Visual Basic macros provided see also Data Explorer Toolbox accessing C-4 Ladder Sequencing macro C-5 Ladder sequencing macro C-2 modifying C-2 MS Fit/MS Tag macro C-2 overview C-2 Peptide fragmentation macro C-2, C-9 Polymer analysis macro C-2, C-15 preparing data for C-3 References required C-3 Voyager .MS files, converting to .DAT not supported 1-30 Voyager data Chromatogram window, displaying 1-13, 2-7 examples 7-11 isotope resolution limits 3-53 peak detection strategy 3-8 Index-28 Applied Biosystems Voyager Sequence Control Panel, automatic calibration settings (reference masses) for 5-28 VOYAGER.REF provided 5-18 viewing masses in 5-10 VOYAGERPSD.SET 8-11 W Warranty exceptions A-3 for computers with altered configuration A-1 Weight average molecular weight, determining C-15 White background changing colors 1-20 default settings 1-23 SET file 1-19 Windows activate 2-8Applied adding traces from same data file 2-16 copying traces from different data files 2-37 customizing 1-17 displayed 1-12 organizing 2-13, 2-36 Windows Metafile format, copying to 1-39 Windows NT keywords, entering 1-31 keywords, searching 1-32 keywords, viewing 1-32 Print setup 2-36 WMF, copying to 1-39 World wide web address, Applied Biosystems xiv X I N D E X X cursors, setting 1-27 x,y data pairs, copying 1-39 XAC in chromatogram header 2-30 see also Extracted absorbance chromatogram (XAC) X-axis chromatogram 2-11 setting range 2-11 spectrum 2-11 XIC see also Extracted ion chromatogram (XIC) in chromatogram header 2-31 Y y and b ion pairs, labeling C-11 Y cursor, setting 1-27 Y-axis offsetting chromatogram 4-27 offsetting spectrum 5-45 scaling 2-12 spectrum 2-11 Z z labels 3-58 z-average molecular weight, determining C-15 Zero charge state displayed in peak list 3-40, 3-43 Zero-charge spectrum for overlapping peaks 5-40 for resolved peaks 5-37 Zooming, multiple data files 2-13, 2-36 Data Explorer Software User’s Guide Index-29 I N D E X Index-30 Applied Biosystems Headquarters 850 Lincoln Centre Drive Foster City, CA 94404 USA Phone: +1 650.638.5800 Toll Free (In North America): +1 800.345.5224 Fax: +1 650.638.5884 Worldwide Sales and Support Applied Biosystems vast distribution and service network, composed of highly trained support and applications personnel, reaches into 150 countries on six continents. For sales office locations and technical support, please call our local office or refer to our web site at www.appliedbiosystems.com. www.appliedbiosystems.com Applera Corporation is committed to providing the world’s leading technology and information for life scientists. Applera Corporation consists of the Applied Biosystems and Celera Genomics businesses. Printed in the USA, 07/2001 Part Number 4317717 Rev. C