1
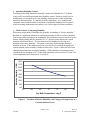
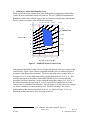
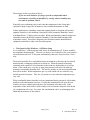
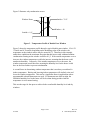
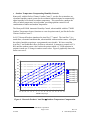
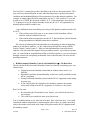
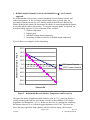
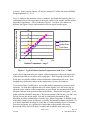
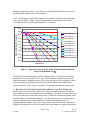
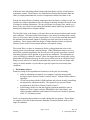
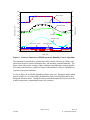
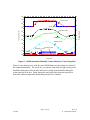
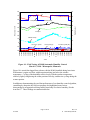
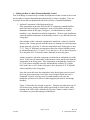
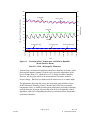
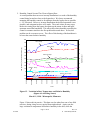
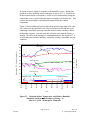
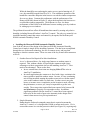
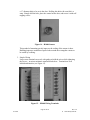
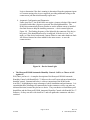
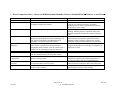
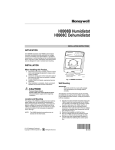
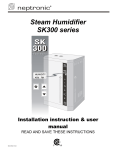
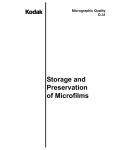
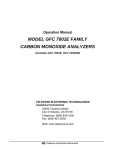
Honeywell H1008 Automatic Humidity Control with HumidiCalc+ Software Copyright © 1998 Honeywell Inc. • All Rights Reserved Rev 1.0 May 27, 1998 Automatic Humidity Control The Honeywell H1008 Automatic Humidity Control with HumidiCalc+ Software is the world’s most advanced stand-alone humidity control. Simple to install, easy to troubleshoot, it is designed to save the installing contractor time, while maximizing benefits to the homeowner. It’s much more than a humidistat - it’s a sophisticated electronic control with the ability to maintain a comfortable humidity level in a home, while preventing condensation on windows over a wide range of weather conditions. Back to Basics - Expressing Humidity When most people think of humidity they probably are thinking of “relative humidity.” But there is a significant drawback in expressing humidity in terms of relative humidity. In order for relative humidity to be meaningful, the temperature of the air needs to be also known. Simply stating that the “humidity is X %” does not really indicate how much moisture is present in the air. The best measure of the humidity level in the air is dewpoint, not relative humidity. Dewpoint is a measure of the absolute amount of moisture in the air. If the temperature of the air is raised or lowered the dewpoint will remain constant, unless moisture is added or taken away. Figure 1 shows the effect that changing temperature has on relative humidity. With conditions of constant moisture content in the air (dewpoint of 50 F) the relative humidity varies between 35% and 70% as the temperature varies between 60 F and 80 F. Relative Humidity - % RH 80.0 70.0 60.0 50.0 40.0 30.0 20.0 10.0 0.0 55 60 65 70 75 80 85 Dry Bulb Temperature - deg F Figure 1 – Variation of Relative Humidity with Changes in Temperature at a Constant Moisture Level Page 2 of 22 63-7048 Rev 2.0 1998 Honeywell Inc. Defining a Comfortable Humidity Level Much research has been conducted on what combination of temperature and humidity creates the most comfortable indoor environment. The 1997 ASHRAE Fundamentals Handbook1 defines how comfort is perceived as a function of temperature and humidity. Figure 2 shows a summary of the ASHRAE conclusions. 90 % RH 80 % RH 70 % RH 60 % RH 65 50 % RH Comfort Zone 60 55 Dewpoint (F) 40 % RH 50 30 % RH 45 40 20 % RH 30 20 10 % RH 10 60 65 70 75 80 Dry Bulb Temperature (F) Figure 2 – ASHRAE Winter Comfort Zone In designing a humidifier control, what is of particular interest is the lower region of the comfort zone. Figure 2 shows that a comfortable humidity level is defined in terms of dewpoint, rather than relative humidity. The lower end of the winter comfort zone is a dewpoint of 36 F, for dry bulb temperatures ranging from about 69 F to 76 F. This strongly supports the notion that a comfortable humidity level is best described by dewpoint, not relative humidity. In fact within the temperature range of 69 F to 76 F, the relative humidity can vary from 23 % to 81% and still be considered to be in the comfort zone, as ASHRAE has defined it! You can begin to see the problem in trying to use relative humidity to control humidity level. Relative humidity is not a direct measurement of the amount of moisture in the air. As shown in Figure 1, it is very dependent on the temperature of the air being measured. 1 "Conditions for Thermal Comfort", 1997 ASHRAE Fundamentals Handbook, page 8.12, Page 3 of 22 Rev 2.0 63-7048 1998 Honeywell Inc. The message to take away from all this is: If you are in the business of trying to provide a comfortable indoor environment, controlling a humidifier by sensing relative humidity may not result in optimum control. Especially poor performance may result when the temperature in the living space experiences large swings, like in instances where setback thermostats are used. In these applications, a humidity control that controls based on dewpoint will result in optimum control over all conditions. Honeywell H1008 Automatic Humidity Control with HumidiCalc+ Software does just that. While most humidity controls simply have a humidity sensor, the H1008 Automatic Humidity Control has both humidity and a temperature sensor. This allows dewpoint to be calculated, and the humidification equipment controlled to achieve the desired dewpoint. The Quest for Dry Windows – All Winter Long As we said above, “If the dewpoint could always be maintained at 50 F, there would be no complaints about humidity.” However, as much as we would like to live year-round in an environment with a 50 F dewpoint, unfortunately, that can’t always be done. Here’s why: The need to humidify for a comfortable indoor environment is driven by the fact that all homes breathe, exchanging outside air for inside air. When the amount of moisture contained in the outside air is less than that in the inside air, the humidity level will go down. If the outside air is very dry, at some point moisture will need to be added to maintain a comfortable humidity level. The drier the outside air, the more humidification that will be needed. When temperatures get very cold outside, the air can hold a very limited amount of moisture. Thus, the very driest air occurs when the temperatures get very cold. When comfortable indoor humidity levels are maintained during extremely cold weather, problems with condensation can occur. Usually this condensation will occur first on windows, because windows generally have less insulation value than walls. If the temperature of the inside surface of the window is lower than the dewpoint of the inside air, condensation will occur. Over time, this condensation can be very damaging to the finish and the structure of the window. Page 4 of 22 63-7048 Rev 2.0 1998 Honeywell Inc. Figure 3 illustrates why condensation occurs: Inside = 70 F Window Panes Window = 40 Outside = 0 F Figure 3 – Temperature Profile of Double Pane Window Figure 3 shows the temperature profile through a typical double pane window. If it is 70 F inside and 0 F outside, depending on the insulating value of the window, the temperature at the window surface may be around 40 F. Therefore in this example, under these conditions the maximum dewpoint that this house could withstand without condensation forming on the window would be 40 F. If the outside temperature were to increase, the window temperature would also increase, meaning that the house could stand more humidity. Conversely, if the outside temperature were to decrease, the window temperature would decrease, meaning the humidity level in the house would have to decrease further to prevent condensation. A second factor in determining window temperature that is not always considered is indoor temperature. Raising and lowering indoor temperature will similarly raise and lower the window temperature. This can be a significant factor in applications where programmable setback thermostats are used. If a thermostat sets back at night, the allowable humidity level in the home will be less than during periods when the temperature is at its normal setting. This sets the stage for the quest to achieve both a comfortable humidity level and dry windows. Page 5 of 22 63-7048 Rev 2.0 1998 Honeywell Inc. Outdoor Temperature Compensating Humidity Controls Honeywell, with the Perfect Climate Comfort Center, was the first to introduce an electronic humidity control system for the residential market designed to automatically adjust humidity levels based on outdoor temperature. This system also considers the effect of indoor temperature in its algorithm, providing optimum control for all combinations of indoor and outdoor temperature. The Honeywell H1008 Automatic Humidity Control, when installed with the C7089H Outdoor Temperature Sensor, functions as a true dewpoint control, just like the Perfect Climate Comfort Center. In 1997, Research Products introduced its AutoTrac 2 control. The AutoTrac is a stand-alone, electronic humidistat that, when installed with an outdoor sensor, will adjust the relative humidity setpoint per a programmed reset schedule. We have tested the AutoTrac and found that it does perform as advertised. It attempts to control to 45 % RH, until the outdoor sensor value reaches the point at which a ½ % RH reduction in setpoint is made per F change in outdoor sensor value. Figure 4 graphically shows the linear reset curves. 50.0 45.0 40.0 Relative Humidity - % 35.0 Knob Setting = 1 Knob Setting = 2 30.0 Knob Setting = 3 Knob Setting = 4 25.0 Knob Setting = 5 20.0 Knob Setting = 6 Knob Setting = 7 15.0 10.0 5.0 0.0 -30 -25 -20 -15 -10 -5 0 5 10 15 20 25 30 35 40 45 50 Outside Tem p - deg F Figure 4 – Research Products’ AutoTrac Outdoor Temperature Compensation 2 AutoTrac is a trademark of Research Products Corporation. Page 6 of 22 63-7048 Rev 2.0 1998 Honeywell Inc. The AutoTrac control does not have the ability to provide true dewpoint control. This may result in overhumidification at times when the temperature is greater than normal conditions and underhumidification if the temperature is less than normal conditions. For example, if during night setback the temperature was 60 F, if the AutoTrac were able to achieve its 45 %RH, the dewpoint would be 39 F. If the temperature were raised to 72 F during recovery, the relative humidity would only be 30 %. All opportunities to humidify during setback would be lost. Some additional items noted during our testing of this product (conducted in the fall of 1997): If the outdoor sensor fails open, or is not connected, the humidistat will not function, with no feedback to the user. If the sensed outdoor temperature exceeds 50 F, the humidistat will not function, losing opportunities to humidify under those conditions. The concept of adjusting the indoor humidity level depending on what is happening outdoors in one that we embrace – in fact, Honeywell pioneered the concept with the Perfect Climate Comfort Center. What we heard that installing contractors do not embrace is the time and effort required wiring an outdoor sensor – up to an hour on some jobs. So, armed with an unequalled knowledge of comfort systems, we set out to design a humidity control with exceptional performance, that would also make life easier for the installing contractor. H1008 Automatic Humidity Control with HumidiCalc+ - The Basic Idea The idea for the H1008 Automatic Humidity Control was born by considering some very obvious facts: Wiring between the humidity control and an outdoor sensor can be very difficult Humidifiers and duct mounted humidity controls are usually installed near the HVAC equipment Wiring between the humidity control and the HVAC equipment would usually be pretty easy If you could replace the wiring from the humidity control to the outdoor sensor with wiring to the HVAC equipment, it would save a lot of time Here’s a few more: By monitoring the W terminal on your furnace, you could tell how much it was running The colder it gets outside the more your furnace runs You’re probably starting to see where this is headed. Here’s the basic idea - if we could estimate the outdoor temperature by monitoring the calls for heat, we could conceivably replace the outdoor sensor with some simple wiring between the HVAC equipment and the humidity control. Page 7 of 22 63-7048 Rev 2.0 1998 Honeywell Inc. H1008 Automatic Humidity Control with HumidiCalc+ - The Technical Approach We found that there is more than a casual relationship between furnace run time and outdoor temperature. In fact, in a single stage heating system, in steady state, the percentage of burner on-time (% on) is linearly related to the difference between the balance point (in this context, the temperature at which it is warm enough that the furnace never runs) and the outdoor temperature. To carry this one step further, an equation can be derived which expresses % on as a function of four variables: 1. Outdoor temperature 2. Balance point 3. ASHRAE heating design temperature 4. Oversizing of furnace, relative to ASHRAE design temperature Figure 5 shows two examples of this relationship. 80.0 Outdoor Temperature - deg F 60.0 40.0 20.0 0.0 0 10 20 30 40 50 60 70 80 90 10 -20.0 0 0% Furnace Oversize 100% Furnace Oversize -40.0 -60.0 -80.0 -100.0 Percent On Figure 5 – Relationship Between Outdoor Temperature and Percent On The upper line shows an application with a balance point of 55 F, where the furnace is exactly matched to the heat loss (0% furnace oversize) at the ASHRAE 99.6% design temperature for Minneapolis (-16 F). In this case the curve is a straight line connecting the balance point at 0 % on, with the design temperature at 100 % on. The lower line shows the same application with a furnace with twice the btu output (100% furnace Page 8 of 22 63-7048 Rev 2.0 1998 Honeywell Inc. oversize). In this case the furnace will only be running 50% of the time at the ASHRAE design temperature of –16 F. Window Surface Temperature - deg F Next, we looked at the insulation values of windows, and found that naturally, there is a relationship between the temperature of the inside surface of the window and the outdoor and indoor temperatures. This was shown in Figure 2. Of course, all windows are different, but Figure 6 shows some nominal values for typical window types. 80 70 60 50 Single Glaze 40 Double Glaze 30 Triple Glaze 20 10 0 -50 0 50 100 Outdoor Temperature - deg F Figure 6 – Typical Window Surface Temperatures (with Tindoor = 72 F) Again, what’s important about the window surface temperature is that is the upper limit of the dewpoint that we can allow in the living space. If the dewpoint of the air in the living space exceeds the window surface temperature, condensation will occur. If the dewpoint stays below the window surface temperature, we have dry windows. If you look at Figure 5 and Figure 6 you see that outdoor temperature is present in both equations. We took these equations and, with a little algebra, were able to develop an equation for the window surface temperature, or equivalently, the maximum allowable dewpoint, in terms of the percent on time of the furnace. Now for the tricky part – if you graph maximum allowable dewpoint vs. the percent on time of the furnace, you don’t end up with just one line on the graph. You end up with literally thousands of lines, depending on all the combinations of window type, indoor temperature, ASHRAE design temperature, balance point, and furnace oversizing. But through computer simulation, we were able to determine the range of values that we could reasonably expect to encounter. Once this was known, we could design a control that could span this entire range. Because the effect of all of the above variables add or subtract in the same way, by Page 9 of 22 63-7048 Rev 2.0 1998 Honeywell Inc. adjusting a single input value, we can achieve a control point that satisfied every one of the thousands of combinations of the variables. Voila. By adjusting a single knob setting we can provide a solution for the entire range of five input variables. Figure 7 shows the operational characteristics of the H1008 Automatic Humidity Control with HumidiCalc+ Software. 60.0 Maximum Allowable Dewpoint 50.0 Knob Setting = 1 40.0 Knob Setting = 2 30.0 Knob Setting = 3 20.0 Knob Setting = 4 Knob Setting = 5 10.0 Knob Setting = 6 0.0 Knob Setting = 7 0% 10% 20% 30% 40% 50% 60% 70% 80% 90% 100 -10.0 % -20.0 Knob Setting = 8 Knob Setting = 9 Knob Setting = 10 -30.0 -40.0 Percent On Figure 7 – Operation Characteristics of the H1008 Automatic Humidity Control with HumidiCalc+. The H1008 Automatic Humidity Control with HumidiCalc+ attempts to control the humidity level to a dewpoint of 50 F. The control continuously monitors the calls for heat and maintains a running estimate of the current percent on of the equipment. Based on the knob setting, the H1008 calculates the maximum allowable dewpoint for the current percent on. If this value is less than 50 F, that becomes the new control point. How Does it Work Under Real World Conditions? Very Well, Thank You. The discussion thus far has been limited to the analysis around steady state conditions; that is conditions where the heating load is not changing. We know, of course, that in the real world conditions are not always steady state. If either the outdoor temperature or the setpoint changes, the heating load changes. Of particular interest to us is what happens when the setpoint changes, either manually or automatically through the use of programmable thermostats. This causes a step change to the heating load, a much faster change in load than will occur due to even the most rapid changes in outdoor temperature. Page 10 of 22 63-7048 Rev 2.0 1998 Honeywell Inc. Nobody has more knowledge about heating loads than Honeywell, the world leader in temperature control. More furnaces are controlled by Honeywell thermostats than any other, so nobody understands the science of temperature control better than we do. In order for the prediction of outdoor temperature based on furnace cycling to work, we needed to develop an algorithm to filter out changes in heating load that are not the result of changes in outdoor temperature. We have developed a two-stage filter, which we've shown to be very effective in preventing the humidity control from being thrown off by heating load changes due to setpoint changes. The first filter looks at the furnace cycle times that can be expected under normal, steadystate conditions. We analyzed the limit of furnace cycle times for heating loads varying from 5 to 95 percent, and cycle rates varying from 3 to 9 cycles per hour and determined the minimum and maximum length of a heating cycle that can occur in steady state conditions. Times measured that are shorter or longer than these limits are ignored, known to be the result of some outside influence, not normal cycling. The second filter is in place to compensate for the cycling pattern that exists as the heating system works through a setpoint change. When a thermostat starts a recovery period from a setback temperature, the first on cycle will typically exceed the “normal” maximum, and thus will be ignored in our percent on calculation. The subsequent on cycles will likely be within the “normal” limits, but longer than the steady-state cycling pattern that will ultimately develop. In order to prevent the percent on calculation from being severely affected, we limit the amount that the percent on value can change after each cycle for the number of cycles that are typically required to reach steady-state conditions. Performance Curves Extensive testing of this algorithm has been done over the past year including: Software simulation, run entirely on a computer, using the house models developed for the Perfect Climate Comfort Center, with the H1008 software algorithm. Closed loop testing with the H1008 hardware and software actually controlling the inputs to the simulation models. This approach was also used in the development of the Perfect Climate Comfort Center. Field testing with devices and data logging equipment installed in sites in Minnesota, West Virginia, and New Hampshire in the United States, and Alberta, northern Manitoba, and Northwest Territories in Canada for portions of the ‘97-’98 heating season. Some very interesting observations were made during this test program. Shown below are samples of how the H1008 Automatic Humidity Control performed under a wide range of conditions. Page 11 of 22 63-7048 Rev 2.0 1998 Honeywell Inc. 80 40 Room Temp. 70 35 60 30 Temp. Setpoint Window Temp. 25 40 20 30 Dewpoint 20 15 10 Digitial Output o Temperature ( F) 50 Outdoor Temp. 10 0 Furnace Cycles Humidifier Cycles 5 -10 0 -20 0 2 4 6 8 10 12 14 16 18 20 22 24 26 28 30 32 Time (hrs) Figure 8 – Software Simulation of H1008 Automatic Humidity Control Algorithm The simulation is performed by constructing a house model with a given volume, wall and window heat loss factors, infiltration rates, and internally generated humidity. The house is then subjected to varying weather conditions and temperature setpoint profiles. The result is shown above; a pattern of furnace and humidifier cycling is established in response to the input conditions. As seen in Figure 8, the H1008 algorithm performs quite well. During the night setback periods, when it is very cold outside, the humidifier cycles less frequently than it does during the afternoon hours. During the entire period the dewpoint tracks just below the window temperature, maintaining moisture free windows. Page 12 of 22 63-7048 Rev 2.0 1998 Honeywell Inc. 80 40 70 Indoor Temp. 35 60 30 Temp. Setpoint Window Temp. 25 40 20 30 Dewpoint 20 15 Outdoor Temp. 10 10 0 Furnace Cycles Humidifier Cycles 5 -10 0 -20 0 2 4 6 8 10 12 14 16 18 20 22 24 26 28 30 32 Time (hrs) Figure 9 – H1008 Automatic Humidity Control Hardware Closed Loop Run Figure 9 is the identical case, with the actual H1008 hardware and software in control of the simulated humidifier. The results are very similar, with relatively light cycling of the humidifier during the colder periods, and heavier cycling of the humidifier during the warmer periods of the day. Again, during the entire period the dewpoint tracked just below the window temperature, maintaining moisture free windows. Page 13 of 22 63-7048 Rev 2.0 1998 Honeywell Inc. Digitial Output o Temperature ( F) 50 80 40 Room Temp. 70 35 60 Window Temp. Temp. Setpoint 30 25 40 20 Dewpoint 30 20 15 Digitial Output o Temperature ( F) 50 Outdoor Temp. 10 10 0 Humidifier Cycles Fan Cycles (G) Furnace Cycles (W) 5 -10 24:00:00 23:00:00 22:00:00 21:00:00 20:00:00 19:00:00 18:00:00 17:00:00.0 16:00:00 15:00:00 14:00:00.0 13:00:00 12:00:00 11:00:00 10:00:00 09:00:00 08:00:00 07:00:00.0 06:00:00 05:00:00 04:00:00 03:00:00 02:00:00 01:00:00 0 00:00:00 -20 Time Figure 10 – Field Testing of H1008 Automatic Humidity Control March 11, 1998 – Minneapolis, Minnesota Figure 10 is actual data logged from a home with the H1008 installed during last winter. Performance is again excellent, with dewpoint tracking just below the window temperature. Cycling of the humidifier tracks closely with the outdoor temperature; relatively light cycling during the colder portion of the day, and heavier cycling during the warmer portion. In addition to demonstrating the excellent performance of our humidity control algorithm, controlling by dewpoint, the field test program also highlighted some serious shortcomings in an approach utilizing control based only on relative humidity, like the AutoTrac. These findings are summarized below. Page 14 of 22 63-7048 Rev 2.0 1998 Honeywell Inc. Making the Best of a Duct Mounted Humidity Control One of the things we learned early on in this development was that a return air duct is not the best place to mount a humidistat that controls only by relative humidity. There are two major factors that can dramatically affect the accuracy of standard humidistats: 1. Ambient Temperature of the Equipment Room If the temperature in the area where the HVAC equipment is installed differs much from the living space temperature, errors in sensed RH can develop. Remember earlier in this paper, in Figure 1, we talked about how relative humidity is very dependent on ambient temperature. We have seen installations where the ambient temperature at the humidity control is very different from the living space. One example of this is when the equipment is installed in a relatively confined furnace room. During periods when the furnace is running a lot, the temperature in that room can exceed 80 F, when the temperature in the living space is only 72 F. This 8 F difference in temperature causes the relative humidity sensed by the humidistat to be 11 % lower (35% in the duct vs. 46% in the living space, for a dewpoint of 50 F) than the relative humidity in the living space. Another example is when the equipment is installed in an unfinished area of the house. In this case the temperature in that location can be much cooler than the temperature in the living space. If the temperature at the humidity control was 64 F, the relative humidity sensed by the humidistat would be 14 % higher (60% in the duct vs. 46% in the living space, for a dewpoint of 50 F) than the relative humidity in the living space. Once the system fan starts, the temperature in the duct begins to move toward the living space temperature, but it takes several minutes before the error is eliminated. In these cases the errors in sensed humidity will cause the humidifier operation to be affected, either supplying too much or not enough humidity. Figure 11 shows the first example in practice. This data was taken from one of our field test sites, during a night setback period with no calls for heat, while running in the CIRC mode, controlled by a Perfect Climate Comfort Center (10 minutes of system fan running each half-hour). Page 15 of 22 63-7048 Rev 2.0 1998 Honeywell Inc. 100 40 90 Room Temp. 30 70 60 25 50 Dewpoint 20 40 30 15 20 Duct RH 10 0 Humidifier Cycles 10 Fan Cycles (G) 5 Furnace Cycles (W) -10 14:00:00.0 13:30:00 13:00:00 12:30:00.0 12:00:00 11:30:00 11:00:00 10:30:00 10:00:00 09:30:00 09:00:00 08:30:00.0 0 08:00:00 -20 Time Figure 11 – Variation in Duct Temperature and Relative Humidity (Warm Furnace Room) March 11, 1998 – Minneapolis, Minnesota Note the large variations in temperature and relative humidity in the duct, while the dewpoint remains constant. Each fan cycle causes the temperature in the duct to change about 8 F, which drives a 12 % change in relative humidity. However, the dewpoint, which is the actual amount of moisture in the air, doesn’t change. Which do you think would be better to use as a control input? The phenomena discussed above does not present the same problems for the H1008 Automatic Humidity Control. Because the H1008 has an on-board temperature sensor, it actually measures both temperature and relative humidity and calculates the dewpoint, and uses that value in all of its humidity control algorithms, effectively eliminating the effects of variations in duct temperature and relative humidity. Page 16 of 22 63-7048 Rev 2.0 1998 Honeywell Inc. Digitial Output o Temperature ( F) / Relative Humidity (%) 35 Duct Temp. 80 2. Humidity Control Located Too Close to Bypass Duct A second problem that can occur in many installations is a result of the humidity control being located too close to the bypass duct. We always recommend mounting the humidity control as far upstream from the bypass duct as possible (> 24” is desired). However, in many installations the desired separation is not possible, and compromises have to be made. The result is that, in many cases, the hot air coming from the bypass duct heats up the return air duct and spills upstream toward the humidistat. This affects the relative humidity sensed by the control in a manner similar to the first problem discussed above. In fact, this problem can be even more severe. The effect of this heating of the humidistat is to lower the sensed relative humidity. 100 40 Duct Temp. 90 35 Room Temp. 30 70 60 25 Window Temp. 50 20 40 Dewpoint 30 Duct RH 15 20 Outdoor Temp. 10 10 0 Humidifier Cycles Fan Cycles (G) 5 Furnace Cycles (W) -10 Time Figure 12 – Variation in Duct Temperature and Relative Humidity (Bypass Air Affecting Sensor) March 11, 1998 – Minneapolis, Minnesota Figure 12 shows this in practice. This data was also taken from one of our field test sites, during a long recovery period from night setback. Again, note the large variations in temperature and relative humidity in the duct, while the Page 17 of 22 63-7048 Rev 2.0 1998 Honeywell Inc. 08:00:00 07:30:00 07:00:00.0 06:30:00 06:00:00 05:30:00 05:00:00 04:30:00 04:00:00 03:30:00.0 0 03:00:00 -20 Digitial Output o Temperature ( F) / Relative Humidity (%) 80 dewpoint increases slightly in response to the humidifier cycles. During this period the relative humidity sensed in the duct is as low as 13 %. Because the H1008 controls based on dewpoint, it is able to cycle intermittently during the temperature recovery period when the relative humidity is artificially low. This ensures that the dewpoint is maintained dewpoint below the window temperature. Figure 13 shows additional field test data taken the following night at the same site. In this case the humidifier was wired to operate each fan and heat cycle, simulating a humidifier operating when the sensed relative humidity is below the humidity setpoint. In many cases this will occur each time the furnace is running. The effect of the heating of a standard humidistat, like AutoTrac, is to lower the sensed relative humidity, essentially creating a humidifier lock-on condition. 100 40 Duct Temp. 90 35 Room Temp. 30 70 60 25 50 Window Temp. 20 40 Dewpoint 30 15 Digitial Output o Temperature ( F) / Relative Humidity (%) 80 20 Duct RH Outdoor Temp. 10 10 0 Humidifier Cycles Fan Cycles (G) Furnace Cycles (W) 5 -10 08:00:00 07:30:00 07:00:00.0 06:30:00 06:00:00 05:30:00 05:00:00 04:30:00 04:00:00 03:30:00.0 0 03:00:00 -20 Time Figure 13 – Variation in Duct Temperature and Relative Humidity Simulated AutoTrac Performance (Setting ~ 4) March 12, 1998 – Minneapolis, Minnesota Page 18 of 22 63-7048 Rev 2.0 1998 Honeywell Inc. While the humidifier was on during the entire recovery period starting at 4:15 a.m., the sensed RH ranged from 20 to 30 %. The continuous operation of the humidifier caused the dewpoint in the house to exceed the window temperature for over two hours. Contrast this performance with the performance of the Honeywell H1008, shown in Figure 12, where the dewpoint in the house never exceeded the window temperature. The difference is clear - the better performance of the H1008 is the difference between waking up to dry windows or waking up to wet windows. The problems discussed here affect all humidistats that control by sensing only relative humidity, including Research Products’ AutoTrac control. The only way around it is to install the humidity control that senses and controls by dewpoint, like the Honeywell H1008 Automatic Humidity Control. Installing the Honeywell H1008 Automatic Humidity Control One of the key drivers in the design of the Honeywell H1008 Automatic Humidity Control was to make it simple for the installing contractor. This has been accomplished through the use of advanced technology, the use of common sense, and just plain listening to what the customer wants. These are some of the key features that contractors will love: 1. Outdoor Sensor Not Required for Most Installations As we’ve discussed above, for single stage furnaces no outdoor sensor is required. This, without a doubt, will provide the contractor with a huge advantage over their competition who are still installing AutoTrac. How much of an advantage? These are the facts: In new construction, electricians are charging $40 to $70 to wire an AutoTrac installation. In retrofit applications the contractor is faced with a large variation in the time required to install the outdoor sensor. In cases, if a new condensing unit is being installed, running the outdoor sensor wires with the control wires to the condenser adds very little time. In other cases it may take hours; or in some cases a compromise on the location is made, affecting the performance; or worse yet, it may be impossible to get the wire outside. The average time required has been reported to be between 30 and 60 minutes to properly wire an outdoor sensor. In addition, significant problems with the AutoTrac control have been reported, believed to be the result of poor noise immunity in the design of the control when sensor wires pick up interference. 2. Simple Mounting Rather than the awkward rectangular cutout that is required to mount the AutoTrac control, we’ve designed the H1008 to mount much easier. We’ve encased the sensors in a circular protective shield (see Figure 14), requiring only Page 19 of 22 63-7048 Rev 2.0 1998 Honeywell Inc. a ¾” diameter hole to be cut in the duct. Drilling this hole with a uni-bit is a snap. Simply drill the hole, place the control on the duct, and secure it with selftapping screws. Figure 14 – H1008 Sensors This method of mounting greatly improves the sealing of the return air duct. Building inspectors sometimes require leaks around the rectangular cutouts to be sealed by caulking. 3. Simple Wiring Large screw terminals are used, with guides to hold the wires while tightening the screws – no micro-miniature terminal blocks here. Terminals are well labeled and intuitive (see Figure 15). Figure 15 – H1008 Wiring Terminals Page 20 of 22 63-7048 Rev 2.0 1998 Honeywell Inc. Logic to determine if the fan is running is determined from the equipment inputs so a current sensing relay is never required, providing additional savings to the contractor on jobs that would normally require one. 4. Automatic Configuration and Diagnostics Unlike AutoTrac, the H1008 does not require a jumper selection if the control is installed with either a bypass or powered flow through humidifier. The H1008 also automatically detects whether or not the outdoor sensor is installed. One final feature to help the installing contractor – a device status light (see Figure 16). The flashing frequency of the light tells the contractor if the device has power, if the humidification relay is energized, if the device is in “Test” mode, or if the device has detected a sensor failure or some other hardware fault. All of these features have been added for the same reason – to save the contractor time. Figure 16 – Device Status Light The Honeywell H1008 Automatic Humidity Control: Sell It, or Choose to Sell Against It Well, there you have it. A complete description of the Honeywell H1008 Automatic Humidity Control with HumidiCalc+ Software, the world’s most advanced stand-alone humidity control. Summarized below is a direct comparison of the H1008 to the AutoTrac, highlighting its many advantages, both in installation and performance. It is essential that these advantages be communicated to the contractor, so they can make an informed decision, because they do have a choice. They can choose to install Honeywell humidifiers and the Honeywell H1008 Automatic Humidity Control with HumidiCalc+ Software. Or they can stick with AutoTrac and sell against the contractors who have switched. Page 21 of 22 63-7048 Rev 2.0 1998 Honeywell Inc. Direct Comparison Chart – Honeywell H1008 Automatic Humidity Control with HumidiCalc+ Software vs. AutoTrac AutoTrac Honeywell H1008 Installation Outdoor Sensor Not required for single stage furnaces. Recommended for heat pumps and multi-stage furnaces. Mounting ¾” diameter hole for inserting sensors into return air duct. Wiring Large screw terminals provided for wiring. Determining fan operation automatically detected by control logic. 24 VAC input provided directly from HE360 Powered Humidifier – no separate transformer required. No jumper selection required if the control is installed with either a bypass or powered flow through humidifier. Automatically detects whether or not the outdoor sensor is installed. Device status light provides key diagnostics. System Configuration and Diagnostics Required for all installations at an incremental cost of $20 to $50 for new construction and 30 to 60 minutes installation time for retrofit. Significant noise problems reported due to sensor wiring. 3” x 5” rectangular cutout in return air duct required for mounting. Building inspectors sometimes require leaks around the rectangular cutouts to be sealed by caulking or foam. Miniature terminal blocks used for wiring. Model 50 current sensing relay required in applications without humidifier contacts on furnace control board. Separate transformer required for all installations to power control. Jumper selection required to switch between flow through and powered humidifier to avoid damage to equipment. No diagnostics provided. Performance Sensors Indoor Temperature Compensation Return Air Duct Temperature Variations Bypass Air Affecting Control 63-7048 Absolute humidity control based on dewpoint performed with duct-mounted humidity and temperature sensors. Dewpoint control allows for accurate control during aggressive setback periods. Dewpoint control allows for accurate control even if return air temperature differs from living space. Dewpoint control allows for accurate control even if bypass air affects sensor readings. Humidity sensor only. Sensing of relative humidity only. Lower window temperatures caused by lower indoor temperatures not accounted for which could cause overhumidification. Sensing of relative humidity only will cause large errors in control if return air temperature differs from living space. Sensing of relative humidity only will cause large errors in control if bypass air affects sensor readings. Page 22 of 22 1998 Honeywell Inc. Rev 2.0 XXXXXXXXXX Home and Building Control Honeywell Inc. Honeywell Plaza P.O. Box 524 Minneapolis MN 55408-0524 Home and Building Control Honeywell Limited-Honeywell Limitée 155 Gordon Baker Road North York, Ontario M2H 3N7 Honeywell Latin American Region 480 Sawgrass Corporate Parkway Suite 200 Sunrise FL 33325 Honeywell Europe S.A. 3 Avenue du Bourget 1140 Brussels Belgium 63-7048 XX-XXXX 8-98 Printed in U.S.A. on recycled paper containing at least 10% post-consumer paper 2 fibers. Honeywell Asia Pacific Inc. Room 3213-3225 Sun Hung Kai Centre No. 30 Harbour Road Wanchai Hong Kong www.honeywell.com