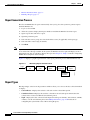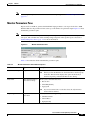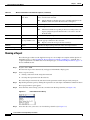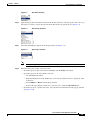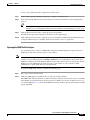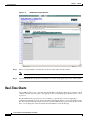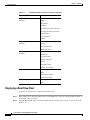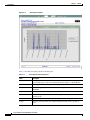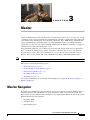
1
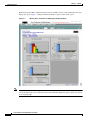
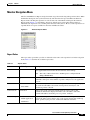
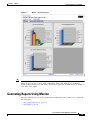
CH A P T E R
3
Monitor
The Cisco PVM monitor function provides near real-time and real-time access to resource data, as well
as summary views of aggregated traffic data with drill-down capability, formatted into tables and graphs
for troubleshooting and analyzing current network performance. Cisco PVM displays individual and
aggregated NAM metrics, including displays for single NAM data sources, for multiple NAM data
aggregated across the network, and for all NAMs. Additionally, the Monitor tab displays a snapshot of
current network activity immediately upon access.
Using the Monitor function, you can display near real-time and dynamic traffic data for applications,
hosts, conversations, DCSP groups, switches and routers, and VLAN data. You can view network
resources based on these data sources and drill down to access details about a particular resource.
Reports can be viewed, printed, and saved as PDF, Microsoft Excel, and Rich Text Format files.
Note
Reports generated under the Monitor tab are not archived.
This chapter contains the following sections:
•
Monitor Navigation, page 3-1
•
Generating Reports Using Monitor, page 3-5
•
Drill-Down Capabilities, page 3-11
•
Real-Time Charts, page 3-14
•
Trend Reports, page 3-18
For samples of individual reports and their field descriptions, see Appendix B, “Report Samples for
Monitor and Reports.”
Monitor Navigation
Navigating Cisco PVM monitor features employs an easy-to-use interface requiring minimal clicks to
obtain the desired results. The Monitor tab opens immediately when you log in to the system, first
displaying the progress indicator while loading data, then displaying the Monitor Overview report. The
Monitor GUI provides three windows:
•
Navigation Menu
•
Parameters Pane
•
Report Display Pane
Cisco Performance Visibility Manager User Guide
OL-8620-03
3-1
Chapter 3
Monitor
Monitor Navigation
Both the Navigation Menu and the Parameters Pane are hidden, however, when the Monitor Overview
display first opens. Figure 3-1 displays the Monitor GUI as it appears when it first opens
Figure 3-1
Note
Monitor GUI—Parameters and Navigation Hidden (default)
To see a single TopN chart as a larger image in the Overview pane, click directly on the magnifying glass
icon in the upper right corner of the desired chart. The individual TopN chart appears in the reports pane
as an enlarged graph.
Cisco Performance Visibility Manager User Guide
3-2
OL-8620-03
Chapter 3
Monitor
Monitor Navigation
Monitor Navigation Menu
The Cisco PVM Generate Reports navigation menu categorizes monitoring and reports into suites. When
the Monitor GUI opens, the system automatically runs the Overview report but hides the Generate
Reports menu. Clicking the expand icon at the far left side of the Monitor GUI opens the Generate
Reports menu (Figure 3-2), defaulted to Overview, with the report suite names displayed next to
individual suite expansion icons. Clicking either the suite name (such as “Hosts”) or the expansion icon
expands the list of reports available for that suite and hides the others.
Figure 3-2
Generate Reports Menu
Report Suites
The report suites open when you click on either the suite name or the expansion icon in the navigation
menu. Table 3-1 describes the available report suites.
Table 3-1
Report Suites
Suite
Available Reports
Description
Overview
Overview
Displays, in graphic format, the TopN active hosts, DSCP applications, and
active applications monitored for the selected Data Source Group.
Note
Application
Hosts
Conversations
DSCP Group
Applications
•
Hosts IP
•
Hosts MAC
Conversation
•
DSCP
•
DSCP Application
•
DSCP Host
The value of N used in all Cisco PVM reports is configured under
Setup > Preferences.
Provides the ability to see which applications are consuming network
bandwidth, and reports on the number of packets and bytes for each application
protocol.
Provides an analysis of the traffic for each specific host. These reports display
data on the host IP address, host name, in/out packets, in/out bytes, and
non-unicast packets collected.
Displays data on the conversation traffic between various sources and
destinations. Information displayed includes source IP address and name,
destination IP address and name, protocol, packets, and bytes.
Displays data on specific encoded information related to how packets traverse
the network. These reports display data on the Aggregation Profile and Group
Names, packets, bytes, protocols, and host IP addresses and names.
Cisco Performance Visibility Manager User Guide
OL-8620-03
3-3
Chapter 3
Monitor
Monitor Navigation
Table 3-1
Report Suites (continued)
Suite
Available Reports
Switch/Router
VLANs
Note
•
Interface
•
Ethernet Traffic
•
Ethernet Error
•
VLAN ID
•
VLAN Priority
Description
Displays the:
•
Port name, in/out bytes, in/out packets, in/out Non-Unicast packets, in/out
discards, in/out errors, and percentage in/out utilization.
•
Bytes, packets, broadcast packets, and multicast packets.
•
Dropped events, CRC align errors, under- and oversize packets, fragments,
jabbers, and collisions.
Displays data on the VLAN ID, errors, packets, bytes, non-unicast packets, and
non-unicast bytes collected.
For samples and descriptions of individual reports, see Appendix B, “Report Samples for Monitor and
Reports.”
Overview
When the Monitor GUI opens, the display defaults to Overview, which automatically displays in graphic
format the TopN hosts, DSCP applications, and active applications monitored for a given Data Source
Group (DSG). The data view defaults to All NAM; you can choose another data view from the
parameters pane and click Run to refresh the Overview display with the new view.
Figure 3-3 displays a sample Overview report.
Cisco Performance Visibility Manager User Guide
3-4
OL-8620-03
Chapter 3
Monitor
Generating Reports Using Monitor
Figure 3-3
Note
Monitor—Overview Report
The value of N in TopN reports is configured, under Setup > Preferences, to values from 1 – 15. See
Editing Preferences, page 2-50 for details. Additionally, unlike other TopN reports, the Monitor
Overview display allows you to drill down to detailed host, application, or DSCP reports by clicking on
a bar in one of the graphs.
Generating Reports Using Monitor
The report generation process in Cisco PVM requires minimal intervention. This section contains the
following topics:
•
Report Generation Process, page 3-6
•
Report Types, page 3-6
Cisco Performance Visibility Manager User Guide
OL-8620-03
3-5
Chapter 3
Monitor
Generating Reports Using Monitor
•
Monitor Parameters Pane, page 3-7
•
Running a Report, page 3-8
Report Generation Process
The Cisco PVM Monitor tab opens automatically after you log in to the system. To generate reports
under the Monitor tab:
Note
1.
Log in to Cisco PVM.
2.
Allow the system to display the Progress Indicator and then the Monitor Overview report.
3.
Open a report suite and select a report.
4.
Open the parameters pane.
5.
Select the data source group, data view, desired data source (if applicable), and report type.
6.
Select the time or date range (if desired).
7.
Click Run.
If you have not loaded any NAMs into Cisco PVM, you have removed them for some reason, or there
are no Data Source Groups available in the system, the Monitor Overview pane will display an error
indicating that no data is available to display the report. See Chapter 2, “Setup” for details on importing
NAMs and creating Data Source Groups.
Figure 3-4 displays a graphic representation of the report generation process under the Monitor tab.
Login
Monitoring Report Generation Flow
Monitor
tab
Monitor
suite
Select
report
Monitor
parameters
Run
report
Parameters
selection
149714
Figure 3-4
Report Types
The Report Type selection on the parameters window allows you to choose the data collection method
to display:
•
Current Rates—Displays the statistics collected over the selected time period.
•
Cumulative Rates—Displays the statistics collected for the selected report element since the
collection was created or within the selected time period.
•
TopN—Displays the data collected for the TopN selected report elements, such as Hosts, VLANs,
or Hosts, over the selected time period. See Editing Preferences, page 2-50 for details on
configuring the system-wide value of N for all TopN reports.
Cisco Performance Visibility Manager User Guide
3-6
OL-8620-03
Chapter 3
Monitor
Generating Reports Using Monitor
Note
For a complete explanation of available data views and report types, see Understanding Data Views,
page 1-13.
Monitor Parameters Pane
Reports in Cisco PVM are generated with minimal input parameters: each report in the Cisco PVM
Monitor GUI uses the parameters frame at the top of the window for parameter input. Figure 3-5 shows
the Monitor parameters pane.
Note
Each time you select a new report to run, the parameters pane retains the parameters from the previously
run report. The available Data Views and Report Types depend on the specific report selected. See
Understanding Data Views, page 1-13 for more information.
Figure 3-5
Monitor Parameters Pane
Table 3-2 describes the fields in the Monitor parameters pane.
Table 3-2
Monitor Parameters Pane Field Descriptions
Field
Type
Description
Data Source Group
Drop-down list
Allows you to select from a list of user-defined Data Source Groups.
Note
Data View
Drop-down list next to
Data Source Group
Allows you to select the data view:
•
Data Source
•
All NAM [default]
•
Aggregated
Note
Report Type
Drop-down list next to
Data View
When you click the Monitor tab, the list defaults to the first group
in the list. The Overview display that opens automatically is
therefore reporting on the default Data Source Group.
If you select Data Source as the data view, the adjacent Data
Source field is enabled.
Allows you to select the type of report to view:
•
Cumulative Rates
•
Current Rates
•
TopN [default]
Cisco Performance Visibility Manager User Guide
OL-8620-03
3-7
Chapter 3
Monitor
Generating Reports Using Monitor
Table 3-2
Monitor Parameters Pane Field Descriptions (continued)
Data Source
Drop-down list next to
Data View
Allows you to select the specific data source for the report if the Data
Source view has been selected.
Note
The list defaults to the first data source available in the list for the
NAM or switch selected in the Data Source Group list.
Today
Radio button
Runs the report for all data collected since midnight. [default]
Last
Radio button
Runs the report for the last n hours or minutes.
Note
The historical limit for reporting is the last seven days, but to run
reports going back greater than 24 hours, it is easier to use the
From/To fields.
Auto Refresh
Check box
Refreshes the displayed report at the interval selected in the Last option.
From / To
Radio button with
pop-up calendar icons
Allows selection of a specific set of dates using the calendar icons to
open the pop-up calendar for date selection.
Note
Reports can be run for up to the last seven days.
Refresh
Button
Refreshes the displayed report based on the selected parameters.
Expand/Collapse
Icon
Expands or collapses the Monitor parameters pane.
Running a Report
The following procedure uses the Applications report as an example. For samples and descriptions of
individual reports, see the Appendix B, “Report Samples for Monitor and Reports.” appendix. For a
complete explanation of available data views and report types, see Understanding Data Views, page 1-13
in Cisco PVM Overview.
Step 1
Log in to Cisco PVM.
The Overview report runs automatically and appears in the Monitor display pane.
Step 2
Select a report to run by
a.
clicking a suite name in the navigation menu and
b.
selecting the report name from the suite list.
The selected report automatically runs based on the parameters used in the previously run report.
Step 3
Expand the parameters pane by clicking the expansion icon at the right of the Monitor window header. T
The report parameters pane appears.
Step 4
Select the Data Source Group you want to monitor from the drop-down list (see Figure 3-6).
Figure 3-6
Step 5
Select Data Source Group
Select the data view you want to see from the drop-down list (see Figure 3-7).
Cisco Performance Visibility Manager User Guide
3-8
OL-8620-03
Chapter 3
Monitor
Generating Reports Using Monitor
Figure 3-7
Step 6
(Optional) If you have selected Data Source from the Data View list, select the specific data source you
whose data you want to view in the report from the Data Source drop-down list (see Figure 3-8).
Figure 3-8
Step 7
Data Source Selection
Select the desired Report Type from the drop-down list (see Figure 3-9).
Figure 3-9
Note
Step 8
Data View Selection
Report Type Selection
The Report Types available in the drop-down list depend on the report you have selected to run.
Select the time point or range you want to view:
•
To run the report for data collected since midnight, click the Today radio button.
•
To run the report for the last n minutes or hours:
– Click the Last radio button.
– Enter the number for N in the number box (or use the up and down arrows to change the value
in the box).
– Select Minutes or Hours from the drop-down list.
– To have the report display refresh every collection cycle, check the Auto Refresh box.
•
To run the report for a specific date range, select the dates from the From and To pop-up calendars
(see Figure 3-10).
Cisco Performance Visibility Manager User Guide
OL-8620-03
3-9
Chapter 3
Monitor
Generating Reports Using Monitor
Figure 3-10
Step 9
Calendar Selection
Click Refresh. The system closes the parameters pane and displays the selected report.
Figure 3-11 shows a sample report as it appears in the Monitor window.
Figure 3-11
Sample Report—Applications
Cisco Performance Visibility Manager User Guide
3-10
OL-8620-03
Chapter 3
Monitor
Drill-Down Capabilities
Drill-Down Capabilities
Cisco PVM reports display hyperlinks for linking one report to another. For example, from the
Applications Report that displays a list of protocols in table rows, you can click on a Protocol hyperlink
to access the Application Details report for that protocol. This section describes drill-down rules and
design.
This section contains the following topics:
•
General Rules, page 3-11
•
Drill-Down Link Formats, page 3-12
General Rules
Cisco PVM reports adhere to the following rules for hyperlink access among reports:
•
Each time you see a Host IP address, you can drill down to the host details.
•
Each application allows you to drill down to the application details.
•
Each time you see a NAM name, you can click on the name to open a new window for the individual
NAM GUI and automatically sign him in.
•
Real-time charting drill-down: each time you see an “R” hyperlink, you can click on the “R” to open
a new window to monitor this report row details graphed in real-time. Drill-down capability is
available on both Data Source view and All NAM view, for all tabular reports.
•
Trend Reports drill-down: each time you see a “T” hyperlink, you can click on the “T” to drill down
to this report row details graphed against the selected time period. This drill-down capability is
available for Data Source, All NAM, and Aggregated views for all tabular reports.
Table 3-3 shows the Cisco PVM reports and the reports you can access through the available drill-down
hyperlinks.
Table 3-3
Reports Drill-Down Capability
Report Name
Overview
Drill-Down Reports Available
•
Host Details
•
Application Details
•
DSCP Applications
Applications
Application Details
Hosts (IP)
Host Details
Hosts (MAC)
N/A
Conversations
•
Source Host Details
•
Destination Host Details
DSCP
N/A
DSCP Application
Application Details
DSCP Host
Host Details
Switch/Router
N/A
Cisco Performance Visibility Manager User Guide
OL-8620-03
3-11
Chapter 3
Monitor
Drill-Down Capabilities
Table 3-3
Reports Drill-Down Capability (continued)
Report Name
Drill-Down Reports Available
VLAN ID
Applications
VLAN Priority
N/A
Drill-Down Link Formats
Figure 3-12 depicts the drill-down from a Hosts report to the Host Details report.
Figure 3-12
Sample Drill-Down Format - Hosts to Host Details
The host IP address for which the user wants to see details appears as a red hyperlink in the report shown
on the left, and its respective Host Details report, shown on the right, opens when that hyperlink is
clicked. In the Cisco PVM GUI, the second report replaces the initial report in the report display pane.
You can click Back in the report header to see the initial report.
Using Report Drill-Down Links
Drill-down links are generally available in tabular reports only. Cisco PVM tabular reports include those
run for cumulative and current rates; TopN reports do not normally allow drill-down to other reports.
The exception is the Monitor Overview TopN display, which allows drill-down to specific reports when
you click on a bar in one of the graphs.
Cisco Performance Visibility Manager User Guide
3-12
OL-8620-03
Chapter 3
Monitor
Drill-Down Capabilities
To use a report drill-down links, complete the following steps:
Step 1
Open a tabular report by running a new report or opening an archived report.
Step 2
In the table, find the linked resource about which you want more information, such as the Host ID or
Protocol.
Tip
Step 3
You can use the sorting arrows in the column header to re-sort the resource or performance
information, or use the pagination links in the report header to view different pages of the report.
Click the desired resource name or application protocol hyperlink.
The drill-down report opens and replaces the display of the original report.
Step 4
Click additional resource name or application protocol hyperlinks available in the first drill-down report
to display additional reports containing details for the desired resource or application.
Opening the NAM Traffic Analyzer
You can link directly to the Cisco NAM Traffic Analyzer for NAM configuration options from Cisco
PVM reports. The traffic analyzer opens in a new window.
Note
The traffic analyzer opens directly to a specific NAM only if that NAM has been set up in Cisco PVM
with the correct user ID and password (Setup > NAM in the Cisco PVM GUI) or if the current Cisco
PVM user credentials match the NAM credentials. If the traffic analyzer does not open for the desired
NAM, log in to the NAM using the traffic analyzer’s login window, or contact the Cisco PVM
administrator to obtain traffic analyzer login information.
To open the NAM traffic analyzer, complete the following steps:
Step 1
Run a report for the desired statistic.
Step 2
Click the “NAM (Type)” hyperlink at the top of the report display window.
The NAM Traffic Analyzer opens in a new browser window, signed on automatically to the correct NAM
if that NAM’s logon information has been set up in Cisco PVM or if your user credentials allow you to
access the NAM. Figure 3-13 shows the NAM Traffic Analyzer window opened just beneath the “NAM
(Type)” hyperlink.
Cisco Performance Visibility Manager User Guide
OL-8620-03
3-13
Chapter 3
Monitor
Real-Time Charts
Figure 3-13
Step 3
Review or change NAM or switch/router parameters in the traffic analyzer window.
Note
Step 4
NAM Traffic Analyzer Window
Changes you make using the traffic analyzer affect future data aggregation and reports only.
Close the NAM Traffic Analyzer by clicking the close button in the upper right corner of the window.
Real-Time Charts
Cisco PVM provides access to real-time data through links available in tabular reports. Reports contain
a link in each table row that opens a chart pop-up for the corresponding report element, such as a host
or protocol.
The Real-Time Chart pop-up allows you to troubleshoot a specific data source by displaying a
continuously refreshed plot of its current performance. Monitoring begins as soon as the window opens.
The chart will automatically refresh every 30 seconds and additional data points will be plotted. At any
time, you can change the selected variable and click Submit to restart monitoring.
Cisco Performance Visibility Manager User Guide
3-14
OL-8620-03
Chapter 3
Monitor
Real-Time Charts
This section contains the following topics:
•
Variables Available for Real-Time Monitoring, page 3-15
•
Displaying a Real-Time Chart, page 3-16
Variables Available for Real-Time Monitoring
Variables are displayed for individual statistics as rates in units per second (such as PACKETS/SEC).
This rate reflects the change in the selected variable value over time. Table 3-4 shows the real-time
variables that you can monitor for the different statistics available in Cisco PVM tabular reports.
Table 3-4
Available Variables for Real-Time Charts
Statistic Type
Available Variables (units/sec)
Application Statistics
Packets
Bytes
Hosts (IP) Statistics
In Packets
In Bytes
Out Packets
Out Bytes
Non-Unicast Packets
Hosts (MAC) Statistics
In Packets
Out Packets
In Bytes
Out Bytes
Multicast Packets
Broadcast Packets
Conversation
Packets
Bytes
DSCP Statistics
Application Packets
Application Bytes
DSCP Application Statistics
Application Packets
Application Bytes
DSCP Host Statistics
In Packets
In Bytes
Out Packets
Out Bytes
Cisco Performance Visibility Manager User Guide
OL-8620-03
3-15
Chapter 3
Monitor
Real-Time Charts
Table 3-4
Available Variables for Real-Time Charts (continued)
Statistic Type
Available Variables (units/sec)
Switch/Router: Interface
Statistics
In Packets
In Bytes
Out Packets
Out Bytes
Incoming Non-Unicast Packets
Outgoing Non-Unicast Packets
Discarded Ins
Discarded Outs
In Errors
Switch/Router: Ethernet Traffic
Statistics
Bytes
Packets
Broadcast Packets
Multicast Packets
Switch/Router: Ethernet Error
Statistics
Drop Events
CRC Errors
Oversize Packets
Undersize Packets
Jabbers
Fragment Counts
Number of Collisions
VLAN ID Statistics
Packets
Bytes
Non-Unicast Packets
Non-Unicast Bytes
VLAN Priority Statistics
Packets
Bytes
Displaying a Real-Time Chart
To display a real-time chart, complete the following steps:
Step 1
Run a tabular report using either Data Source or All NAM views, and look at the hyperlinks available on
the left side of the report pane.
Step 2
Click the R hyperlink, next to the report element whose real-time data you want to view, as shown in
Figure 3-14.
Cisco Performance Visibility Manager User Guide
3-16
OL-8620-03
Chapter 3
Monitor
Real-Time Charts
Figure 3-14
Real-Time Chart Hyperlink
The Real-Time Chart pop-up opens and begins monitoring by displaying the Data Source and variable
selected in the original report, as shown in Figure 3-15.
Figure 3-15
Real-Time Chart Sample
Table 3-5 describes the fields in a Real-Time Chart.
Table 3-5
Real-Time Chart Field Description
Element
Type
Description
Started
Fixed Text
Displays the date and time that the real-time display parameters were
submitted for charting.
NAM
Fixed Text
Displays the name of the NAM whose data flow is being monitored.
Data Source
Drop-down List
Allows selection of the desired NAM Data Source for monitoring.
Note
Variable
Drop-down List
The chart automatically refreshes and begins collecting new
data points whenever you select a new Data Source.
Allows selection of the data type to monitor, such as packets or bytes.
Note
The chart automatically refreshes and begins collecting new
data points whenever you select a new Variable.
Chart Y-Axis Fixed Text
Displays the variable selected within the chart for display, such as
packets or bytes.
Chart X-Axis Dynamic Data
Displays the current time of day in increments that continuously
refresh as time passes.
Cisco Performance Visibility Manager User Guide
OL-8620-03
3-17
Chapter 3
Monitor
Trend Reports
Table 3-5
Real-Time Chart Field Description (continued)
Element
Type
Description
Chart Body
Dynamic Data
Displays a line graph with demarcated points that continuously
refresh as the time increments pass.
Close
Button
Closes the chart pop-up window.
The chart refreshes and displays new data points every 30 seconds.
Note
Step 3
Change the data being monitored by:
a.
Selecting a desired Data Source from the drop-down list.
b.
Selecting a desired Variable from the drop-down list.
The chart refreshes automatically and begins to display a new set of data points based on the new
Data Source or Variable selections.
Clicking Close terminates data refresh and closes the chart window.
Note
Trend Reports
Cisco PVM provides dynamic performance reporting capability within the Reports GUI by displaying a
link to a Trend Report on each report pane. The report displays raw data for the selected network
component (such as protocol, host, or interface) with a superimposed line showing the data trend over
time, offering a magnified view of the data flow for analysis of abnormal or problematic patterns.
To see different statistics for the same report displayed as a Trend report, simply click a different metric
within the report display (such as PACKETS or BYTES) and the chart automatically refreshes.
This section contains the following topics:
•
Trend Statistics, page 3-18
•
Displaying a Trend Report, page 3-19
Trend Statistics
Trend reports are available from tabular reports (those showing Current Rates or Cumulative Data) for
the following statistics:
•
Applications
•
Interface
•
Ethernet Traffic
•
Ethernet Errors
•
Conversations
Cisco Performance Visibility Manager User Guide
3-18
OL-8620-03
Chapter 3
Monitor
Trend Reports
•
DSCP
•
DSCP Application
•
DSCP Host
•
Hosts (IP)
•
Hosts (MAC)
•
VLAN ID and
•
VLAN Priority.
The various metrics for each statistics are viewable through links directly in the Trend Report. Drilling
down from a tabular to a Trend Report depends on which Report View is currently displayed. The
drill-down rules are summarized in Table 3-6.
Table 3-6
Trend Report Drill-Down Rules
Current Tabular Report View
Trend Report Values
Aggregated
The metric value will be aggregated across the Data Source Group.
All NAM
The metric value will be aggregated for those data sources that are
both part of the selected Data Source Group and the specific NAM
selected for drill-down.
Data Source
The metric value will display for the data source specified in the
original report.
Displaying a Trend Report
Complete the following steps to display a trend report:
Step 1
Generate a tabular report.
Step 2
Click the T link next to the desired element in the report display, as shown in Figure 3-16.
Figure 3-16
Trend Report Hyperlink
The Trend Report displays in the Reports window, as shown in Figure 3-17.
Cisco Performance Visibility Manager User Guide
OL-8620-03
3-19
Chapter 3
Monitor
Trend Reports
Figure 3-17
Trend Report Sample
Table 3-7 describes the fields available in Trend reports.
Table 3-7
Trend Report Field Descriptions
Field
Description
Title
The report name from which the Trend Report was accessed (the original report
accessed in Reports), with a label indicating that the display is a Trend Report.
Time Period
The time period selected to generate the original report.
NAM (TYPE)
The NAM supplying the data flow and the NAM type (NAM-1, NAM-2, or
NM-NAM).
Data Entity Name
The name of the source being monitored, such as the VLAN ID name.
Chart Title
The Trend Report name and data variable being monitored (as selected in the
original report).
Variable [link]
The variables (metrics) available for viewing in the Trend Report.
Y-Axis
The name and value of the data variable being monitored (such as packets or
bytes).
Cisco Performance Visibility Manager User Guide
3-20
OL-8620-03
Chapter 3
Monitor
Trend Reports
Table 3-7
Trend Report Field Descriptions (continued)
Field
Description
X-Axis
The incremental timestamps for the trending interval being monitored.
Chart Body
The trending line with data labels indicating the raw data value for the selected
metric over time and the trend line.
Tip
You can change the data type being displayed by clicking one of the green hyperlink boxes at
the top of the report display.
Cisco Performance Visibility Manager User Guide
OL-8620-03
3-21
Chapter 3
Monitor
Trend Reports
Cisco Performance Visibility Manager User Guide
3-22
OL-8620-03