1
Managing Your Network
Using the HTTP Server
BayRS Version 13.00
Site Manager Software Version 7.00
BCC Version 4.05
Part No. 303552-A Rev 00
October 1998
4401 Great America Parkway
Santa Clara, CA 95054
8 Federal Street
Billerica, MA 01821
Copyright © 1998 Bay Networks, Inc.
All rights reserved. Printed in the USA. October 1998.
The information in this document is subject to change without notice. The statements, configurations, technical data,
and recommendations in this document are believed to be accurate and reliable, but are presented without express or
implied warranty. Users must take full responsibility for their applications of any products specified in this document.
The information in this document is proprietary to Bay Networks, Inc.
The software described in this document is furnished under a license agreement and may only be used in accordance
with the terms of that license. A summary of the Software License is included in this document.
Trademarks
AN, BCN, BLN, BN, FRE, Optivity, PPX, and Bay Networks are registered trademarks and Advanced Remote Node,
ANH, ARN, ASN, BayRS, BaySecure, BayStack, BayStream, BCC, SPEX, System 5000, and the Bay Networks logo
are trademarks of Bay Networks, Inc.
Microsoft, MS, MS-DOS, Win32, Windows, Internet Explorer, and Windows NT are registered trademarks of
Microsoft Corporation.
All other trademarks and registered trademarks are the property of their respective owners.
Restricted Rights Legend
Use, duplication, or disclosure by the United States Government is subject to restrictions as set forth in subparagraph
(c)(1)(ii) of the Rights in Technical Data and Computer Software clause at DFARS 252.227-7013.
Notwithstanding any other license agreement that may pertain to, or accompany the delivery of, this computer
software, the rights of the United States Government regarding its use, reproduction, and disclosure are as set forth in
the Commercial Computer Software-Restricted Rights clause at FAR 52.227-19.
Statement of Conditions
In the interest of improving internal design, operational function, and/or reliability, Bay Networks, Inc. reserves the
right to make changes to the products described in this document without notice.
Bay Networks, Inc. does not assume any liability that may occur due to the use or application of the product(s) or
circuit layout(s) described herein.
Portions of the code in this software product may be Copyright © 1988, Regents of the University of California. All
rights reserved. Redistribution and use in source and binary forms of such portions are permitted, provided that the
above copyright notice and this paragraph are duplicated in all such forms and that any documentation, advertising
materials, and other materials related to such distribution and use acknowledge that such portions of the software were
developed by the University of California, Berkeley. The name of the University may not be used to endorse or
promote products derived from such portions of the software without specific prior written permission.
SUCH PORTIONS OF THE SOFTWARE ARE PROVIDED “AS IS” AND WITHOUT ANY EXPRESS OR
IMPLIED WARRANTIES, INCLUDING, WITHOUT LIMITATION, THE IMPLIED WARRANTIES OF
MERCHANTABILITY AND FITNESS FOR A PARTICULAR PURPOSE.
In addition, the program and information contained herein are licensed only pursuant to a license agreement that
contains restrictions on use and disclosure (that may incorporate by reference certain limitations and notices imposed
by third parties).
ii
303552-A Rev 00
Bay Networks, Inc. Software License Agreement
NOTICE: Please carefully read this license agreement before copying or using the accompanying software or
installing the hardware unit with pre-enabled software (each of which is referred to as “Software” in this Agreement).
BY COPYING OR USING THE SOFTWARE, YOU ACCEPT ALL OF THE TERMS AND CONDITIONS OF
THIS LICENSE AGREEMENT. THE TERMS EXPRESSED IN THIS AGREEMENT ARE THE ONLY TERMS
UNDER WHICH BAY NETWORKS WILL PERMIT YOU TO USE THE SOFTWARE. If you do not accept these
terms and conditions, return the product, unused and in the original shipping container, within 30 days of purchase to
obtain a credit for the full purchase price.
1. License Grant. Bay Networks, Inc. (“Bay Networks”) grants the end user of the Software (“Licensee”) a personal,
nonexclusive, nontransferable license: a) to use the Software either on a single computer or, if applicable, on a single
authorized device identified by host ID, for which it was originally acquired; b) to copy the Software solely for backup
purposes in support of authorized use of the Software; and c) to use and copy the associated user manual solely in
support of authorized use of the Software by Licensee. This license applies to the Software only and does not extend
to Bay Networks Agent software or other Bay Networks software products. Bay Networks Agent software or other
Bay Networks software products are licensed for use under the terms of the applicable Bay Networks, Inc. Software
License Agreement that accompanies such software and upon payment by the end user of the applicable license fees
for such software.
2. Restrictions on use; reservation of rights. The Software and user manuals are protected under copyright laws.
Bay Networks and/or its licensors retain all title and ownership in both the Software and user manuals, including any
revisions made by Bay Networks or its licensors. The copyright notice must be reproduced and included with any
copy of any portion of the Software or user manuals. Licensee may not modify, translate, decompile, disassemble, use
for any competitive analysis, reverse engineer, distribute, or create derivative works from the Software or user manuals
or any copy, in whole or in part. Except as expressly provided in this Agreement, Licensee may not copy or transfer
the Software or user manuals, in whole or in part. The Software and user manuals embody Bay Networks’ and its
licensors’ confidential and proprietary intellectual property. Licensee shall not sublicense, assign, or otherwise
disclose to any third party the Software, or any information about the operation, design, performance, or
implementation of the Software and user manuals that is confidential to Bay Networks and its licensors; however,
Licensee may grant permission to its consultants, subcontractors, and agents to use the Software at Licensee’s facility,
provided they have agreed to use the Software only in accordance with the terms of this license.
3. Limited warranty. Bay Networks warrants each item of Software, as delivered by Bay Networks and properly
installed and operated on Bay Networks hardware or other equipment it is originally licensed for, to function
substantially as described in its accompanying user manual during its warranty period, which begins on the date
Software is first shipped to Licensee. If any item of Software fails to so function during its warranty period, as the sole
remedy Bay Networks will at its discretion provide a suitable fix, patch, or workaround for the problem that may be
included in a future Software release. Bay Networks further warrants to Licensee that the media on which the
Software is provided will be free from defects in materials and workmanship under normal use for a period of 90 days
from the date Software is first shipped to Licensee. Bay Networks will replace defective media at no charge if it is
returned to Bay Networks during the warranty period along with proof of the date of shipment. This warranty does not
apply if the media has been damaged as a result of accident, misuse, or abuse. The Licensee assumes all responsibility
for selection of the Software to achieve Licensee’s intended results and for the installation, use, and results obtained
from the Software. Bay Networks does not warrant a) that the functions contained in the software will meet the
Licensee’s requirements, b) that the Software will operate in the hardware or software combinations that the Licensee
may select, c) that the operation of the Software will be uninterrupted or error free, or d) that all defects in the
operation of the Software will be corrected. Bay Networks is not obligated to remedy any Software defect that cannot
be reproduced with the latest Software release. These warranties do not apply to the Software if it has been (i) altered,
except by Bay Networks or in accordance with its instructions; (ii) used in conjunction with another vendor’s product,
resulting in the defect; or (iii) damaged by improper environment, abuse, misuse, accident, or negligence. THE
FOREGOING WARRANTIES AND LIMITATIONS ARE EXCLUSIVE REMEDIES AND ARE IN LIEU OF ALL
OTHER WARRANTIES EXPRESS OR IMPLIED, INCLUDING WITHOUT LIMITATION ANY WARRANTY OF
MERCHANTABILITY OR FITNESS FOR A PARTICULAR PURPOSE. Licensee is responsible for the security of
303552-A Rev 00
iii
its own data and information and for maintaining adequate procedures apart from the Software to reconstruct lost or
altered files, data, or programs.
4. Limitation of liability. IN NO EVENT WILL BAY NETWORKS OR ITS LICENSORS BE LIABLE FOR ANY
COST OF SUBSTITUTE PROCUREMENT; SPECIAL, INDIRECT, INCIDENTAL, OR CONSEQUENTIAL
DAMAGES; OR ANY DAMAGES RESULTING FROM INACCURATE OR LOST DATA OR LOSS OF USE OR
PROFITS ARISING OUT OF OR IN CONNECTION WITH THE PERFORMANCE OF THE SOFTWARE, EVEN
IF BAY NETWORKS HAS BEEN ADVISED OF THE POSSIBILITY OF SUCH DAMAGES. IN NO EVENT
SHALL THE LIABILITY OF BAY NETWORKS RELATING TO THE SOFTWARE OR THIS AGREEMENT
EXCEED THE PRICE PAID TO BAY NETWORKS FOR THE SOFTWARE LICENSE.
5. Government Licensees. This provision applies to all Software and documentation acquired directly or indirectly
by or on behalf of the United States Government. The Software and documentation are commercial products, licensed
on the open market at market prices, and were developed entirely at private expense and without the use of any U.S.
Government funds. The license to the U.S. Government is granted only with restricted rights, and use, duplication, or
disclosure by the U.S. Government is subject to the restrictions set forth in subparagraph (c)(1) of the Commercial
Computer Software––Restricted Rights clause of FAR 52.227-19 and the limitations set out in this license for civilian
agencies, and subparagraph (c)(1)(ii) of the Rights in Technical Data and Computer Software clause of DFARS
252.227-7013, for agencies of the Department of Defense or their successors, whichever is applicable.
6. Use of Software in the European Community. This provision applies to all Software acquired for use within the
European Community. If Licensee uses the Software within a country in the European Community, the Software
Directive enacted by the Council of European Communities Directive dated 14 May, 1991, will apply to the
examination of the Software to facilitate interoperability. Licensee agrees to notify Bay Networks of any such
intended examination of the Software and may procure support and assistance from Bay Networks.
7. Term and termination. This license is effective until terminated; however, all of the restrictions with respect to
Bay Networks’ copyright in the Software and user manuals will cease being effective at the date of expiration of the
Bay Networks copyright; those restrictions relating to use and disclosure of Bay Networks’ confidential information
shall continue in effect. Licensee may terminate this license at any time. The license will automatically terminate if
Licensee fails to comply with any of the terms and conditions of the license. Upon termination for any reason,
Licensee will immediately destroy or return to Bay Networks the Software, user manuals, and all copies. Bay
Networks is not liable to Licensee for damages in any form solely by reason of the termination of this license.
8. Export and Re-export. Licensee agrees not to export, directly or indirectly, the Software or related technical data
or information without first obtaining any required export licenses or other governmental approvals. Without limiting
the foregoing, Licensee, on behalf of itself and its subsidiaries and affiliates, agrees that it will not, without first
obtaining all export licenses and approvals required by the U.S. Government: (i) export, re-export, transfer, or divert
any such Software or technical data, or any direct product thereof, to any country to which such exports or re-exports
are restricted or embargoed under United States export control laws and regulations, or to any national or resident of
such restricted or embargoed countries; or (ii) provide the Software or related technical data or information to any
military end user or for any military end use, including the design, development, or production of any chemical,
nuclear, or biological weapons.
9. General. If any provision of this Agreement is held to be invalid or unenforceable by a court of competent
jurisdiction, the remainder of the provisions of this Agreement shall remain in full force and effect. This Agreement
will be governed by the laws of the state of California.
Should you have any questions concerning this Agreement, contact Bay Networks, Inc., 4401 Great America
Parkway, P.O. Box 58185, Santa Clara, California 95054-8185.
LICENSEE ACKNOWLEDGES THAT LICENSEE HAS READ THIS AGREEMENT, UNDERSTANDS IT, AND
AGREES TO BE BOUND BY ITS TERMS AND CONDITIONS. LICENSEE FURTHER AGREES THAT THIS
AGREEMENT IS THE ENTIRE AND EXCLUSIVE AGREEMENT BETWEEN BAY NETWORKS AND
LICENSEE, WHICH SUPERSEDES ALL PRIOR ORAL AND WRITTEN AGREEMENTS AND
COMMUNICATIONS BETWEEN THE PARTIES PERTAINING TO THE SUBJECT MATTER OF THIS
AGREEMENT. NO DIFFERENT OR ADDITIONAL TERMS WILL BE ENFORCEABLE AGAINST BAY
NETWORKS UNLESS BAY NETWORKS GIVES ITS EXPRESS WRITTEN CONSENT, INCLUDING AN
EXPRESS WAIVER OF THE TERMS OF THIS AGREEMENT.
iv
303552-A Rev 00
Contents
Preface
Before You Begin ............................................................................................................xvii
Text Conventions ........................................................................................................... xviii
Acronyms .........................................................................................................................xix
Bay Networks Technical Publications .............................................................................. xx
How to Get Help ..............................................................................................................xxi
Chapter 1
Starting the HTTP Server
Browser Requirements ...................................................................................................1-2
Starting the HTTP Server Using install.bat .....................................................................1-2
Starting the HTTP Server Using the BCC or Site Manager ............................................1-3
Chapter 2
HTTP Server Concepts
What the HTTP Server Does ..........................................................................................2-1
Navigating the HTTP Server Interface ............................................................................2-3
Chapter 3
HTTP Server Security
User Name/Password Security .......................................................................................3-1
Network Address Filtering ..............................................................................................3-2
Chapter 4
Using the HTTP Server
Getting Help ....................................................................................................................4-1
Specifying a Device ........................................................................................................4-2
Viewing Overall System Status .......................................................................................4-3
Viewing Hardware Summary Information .................................................................4-5
Viewing PROM Summary Information .....................................................................4-6
Viewing Software Image Summary Information .......................................................4-7
303552-A Rev 00
v
Viewing System Resource Summary Information ....................................................4-8
Viewing System Task Summary Information ............................................................4-9
Chapter 5
Viewing Circuit Alerts and Events
Displaying Circuit Alerts ..................................................................................................5-2
Viewing the Event Log ....................................................................................................5-2
Specifying the Contents of the Event Log Display ...................................................5-3
Interpreting Event Messages ...................................................................................5-4
Chapter 6
Viewing Router Service Statistics
Viewing TFTP Statistics ..................................................................................................6-2
Viewing TCP Statistics ...................................................................................................6-3
Viewing FTP Statistics ....................................................................................................6-4
Viewing Telnet Statistics .................................................................................................6-4
Viewing BootP Statistics .................................................................................................6-5
Viewing BootP Traffic Statistics ................................................................................6-5
Viewing BootP Interface Statistics ............................................................................6-5
Viewing BootP Client Statistics ................................................................................6-6
Viewing BootP Preferred Server Statistics ...............................................................6-6
Viewing BootP Relay Agent Statistics ......................................................................6-7
Viewing SNMP Statistics ................................................................................................6-7
Viewing SNMP Counter Statistics ............................................................................6-8
Viewing SNMP Community Statistics .......................................................................6-8
Viewing SNMP Entity Trap Statistics ........................................................................6-9
Viewing SNMP Exception Statistics .......................................................................6-10
Viewing HTTP Statistics ...............................................................................................6-10
Viewing HTTP Server Configuration Statistics .......................................................6-11
Viewing HTTP Counter Summary Statistics ...........................................................6-12
Viewing HTTP Request Statistics ..........................................................................6-13
Viewing HTTP Response Statistics ........................................................................6-14
vi
303552-A Rev 00
Chapter 7
Viewing Router Port Statistics
Changing the Administrative Status of a Port .................................................................7-2
Viewing Traffic Statistics for All Ports ..............................................................................7-2
Viewing Ethernet Port Statistics .....................................................................................7-3
Viewing Ethernet Summary Statistics ......................................................................7-4
Viewing Ethernet Traffic Statistics ............................................................................7-4
Viewing Ethernet Receive Error Statistics ................................................................7-5
Viewing Ethernet Transmit Error Statistics ...............................................................7-5
Viewing Synchronous (Sync) Port Statistics ...................................................................7-6
Viewing Synchronous Summary Statistics ...............................................................7-6
Viewing Synchronous Traffic Statistics .....................................................................7-7
Viewing Synchronous Receive Error Statistics ........................................................7-7
Viewing Synchronous Transmit Error Statistics ........................................................7-8
Viewing Synchronous System Error Statistics .........................................................7-8
Viewing FDDI Port Statistics ...........................................................................................7-9
Viewing FDDI Summary Statistics ...........................................................................7-9
Viewing FDDI Traffic Statistics ...............................................................................7-10
Viewing FDDI Receive Error Statistics ...................................................................7-10
Viewing FDDI Transmit Error Statistics ..................................................................7-11
Viewing FDDI System Error Statistics ....................................................................7-11
Viewing HSSI Port Statistics .........................................................................................7-12
Viewing HSSI Summary Statistics .........................................................................7-12
Viewing HSSI Traffic Statistics ...............................................................................7-13
Viewing HSSI Receive Error Statistics ...................................................................7-13
Viewing HSSI Transmit Error Statistics ..................................................................7-14
Viewing HSSI System Error Statistics ....................................................................7-14
Viewing Token Ring Port Statistics ...............................................................................7-15
Viewing Token Ring Summary Statistics ................................................................7-15
Viewing Token Ring Traffic Statistics ......................................................................7-16
Viewing Token Ring Receive Error Statistics .........................................................7-16
Viewing Token Ring Transmit Error Statistics .........................................................7-17
Viewing Token Ring System Error Statistics ..........................................................7-17
303552-A Rev 00
vii
Chapter 8
Viewing Router Protocol Statistics
Changing the Administrative Status of a Port .................................................................8-2
Viewing IP Statistics .......................................................................................................8-2
Viewing IP Summary Statistics ................................................................................8-3
Viewing IP Traffic Statistics ......................................................................................8-4
Viewing IP Interface Statistics ..................................................................................8-5
Viewing IP Route Statistics ......................................................................................8-6
Viewing IP ARP Cache Statistics .............................................................................8-7
Viewing IP RIP Interface Statistics ...........................................................................8-8
Viewing IP ICMP Statistics .......................................................................................8-8
Viewing ICMP Counter Statistics .............................................................................8-9
Viewing ICMP Received Statistics .........................................................................8-10
Viewing ICMP Transmitted Statistics ......................................................................8-11
Viewing IPX Statistics ...................................................................................................8-11
Viewing IPX Summary Statistics ............................................................................8-12
Viewing IPX Traffic Statistics ..................................................................................8-13
Viewing IPX Interface Statistics ..............................................................................8-13
Viewing IPX Forwarding Statistics ..........................................................................8-14
Viewing IPX Host Statistics ....................................................................................8-14
Viewing IPX Route Statistics ..................................................................................8-15
Viewing IPX Service Statistics ...............................................................................8-15
Viewing IPX RIP Interface Statistics .......................................................................8-16
Viewing IPX SAP Statistics ....................................................................................8-16
Viewing AppleTalk Statistics .........................................................................................8-17
Viewing AppleTalk Summary Statistics ..................................................................8-17
Viewing AppleTalk Traffic Statistics ........................................................................8-18
Viewing AppleTalk Interface Statistics ....................................................................8-18
Viewing AppleTalk Route Statistics ........................................................................8-19
Viewing AppleTalk ARP Cache Statistics ...............................................................8-19
Viewing AppleTalk Zone Statistics .........................................................................8-20
viii
303552-A Rev 00
Chapter 9
Customizing HTTP Server Parameters
Disabling and Reenabling the HTTP Server ...................................................................9-2
Specifying the Port Number for the HTTP Server ...........................................................9-3
Specifying the Maximum Number of Cached Archives ...................................................9-4
Specifying the Maximum Time of Cached Archives .......................................................9-5
Appendix A
Site Manager Parameters
Appendix B
Viewing HTTP Server Statistics Using the Statistics Manager
Selecting the Screens to Display ................................................................................... B-2
Starting the Statistics Launch Facility ............................................................................ B-3
Viewing HTTP Request Statistics .................................................................................. B-4
Viewing HTTP Response Statistics ............................................................................... B-5
Viewing HTTP Server Configuration Statistics .............................................................. B-6
Viewing HTTP Summary Statistics ................................................................................ B-7
Index
303552-A Rev 00
ix
Figures
Figure 2-1.
Initial HTTP Server Window .....................................................................2-2
Figure 2-2.
Navigational Frame ..................................................................................2-4
Figure 4-1.
Initial HTTP Server Window .....................................................................4-3
Figure 4-2.
System Information Summary .................................................................4-4
Figure 4-3.
Hardware Information Summary ..............................................................4-5
Figure 4-4.
PROM Information Summary ...................................................................4-6
Figure 4-5.
Software Image Information Summary ....................................................4-7
Figure 4-6.
System Resource Summary ....................................................................4-8
Figure 4-7.
System Task Summary ............................................................................4-9
Figure 5-1.
Circuit Alert Display .................................................................................5-2
Figure 5-2.
Event Log Display ....................................................................................5-3
Figure 6-1.
TFTP Statistics .........................................................................................6-2
Figure 6-2.
TCP Statistics ..........................................................................................6-3
Figure 6-3.
FTP Statistics ...........................................................................................6-4
Figure 6-4.
Telnet Statistics ........................................................................................6-4
Figure 6-5.
BootP Traffic Statistics .............................................................................6-5
Figure 6-6.
BootP Relay Agent Interface Statistics ....................................................6-6
Figure 6-7.
BootP Client Statistics ..............................................................................6-6
Figure 6-8.
BootP Preferred Server Statistics ............................................................6-7
Figure 6-9.
BootP Relay Agent Statistics ...................................................................6-7
Figure 6-10. SNMP Counter Statistics .........................................................................6-8
Figure 6-11. SNMP Community Statistics ....................................................................6-9
Figure 6-12. SNMP Entity Trap Statistics .....................................................................6-9
Figure 6-13. SNMP Exception Statistics ....................................................................6-10
Figure 6-14. HTTP Server Configuration Statistics ....................................................6-11
Figure 6-15. HTTP Summary Statistics ......................................................................6-12
Figure 6-16. HTTP Request Statistics ........................................................................6-13
Figure 6-17. HTTP Response Statistics .....................................................................6-14
Figure 7-1.
303552-A Rev 00
Port Traffic Statistics ................................................................................7-3
xi
Figure 7-2.
Ethernet Summary Statistics ...................................................................7-4
Figure 7-3.
Ethernet Traffic Statistics .........................................................................7-4
Figure 7-4.
Ethernet Receive Error Statistics .............................................................7-5
Figure 7-5.
Ethernet Transmit Error Statistics ............................................................7-5
Figure 7-6.
Synchronous Summary Statistics ............................................................7-6
Figure 7-7.
Synchronous Traffic Statistics ..................................................................7-7
Figure 7-8.
Synchronous Receive Error Statistics ......................................................7-7
Figure 7-9.
Synchronous Transmit Error Statistics .....................................................7-8
Figure 7-10. Synchronous System Error Statistics .......................................................7-8
Figure 7-11. FDDI Summary Statistics .........................................................................7-9
Figure 7-12. FDDI Traffic Statistics .............................................................................7-10
Figure 7-13. FDDI Receive Error Statistics ................................................................7-10
Figure 7-14. FDDI Transmit Error Statistics ................................................................7-11
Figure 7-15. FDDI System Error Statistics .................................................................7-11
Figure 7-16. HSSI Summary Statistics .......................................................................7-12
Figure 7-17. HSSI Traffic Statistics .............................................................................7-13
Figure 7-18. HSSI Receive Error Statistics ................................................................7-13
Figure 7-19. HSSI Transmit Error Statistics ................................................................7-14
Figure 7-20. HSSI System Error Statistics .................................................................7-14
Figure 7-21. Token Ring Summary Statistics .............................................................7-15
Figure 7-22. Token Ring Traffic Statistics ...................................................................7-16
Figure 7-23. Token Ring Receive Error Statistics .......................................................7-16
Figure 7-24. Token Ring Transmit Error Statistics ......................................................7-17
Figure 7-25. Token Ring System Error Statistics ........................................................7-17
Figure 8-1.
IP Summary Statistics ..............................................................................8-3
Figure 8-2.
IP Traffic Statistics ....................................................................................8-4
Figure 8-3.
IP Interface Statistics ...............................................................................8-5
Figure 8-4.
IP Route Statistics ....................................................................................8-6
Figure 8-5.
IP ARP Cache Statistics ..........................................................................8-7
Figure 8-6.
IP RIP Interface Statistics ........................................................................8-8
Figure 8-7.
ICMP Counter Statistics ...........................................................................8-9
Figure 8-8.
ICMP Received Statistics .......................................................................8-10
Figure 8-9.
ICMP Transmitted Statistics ...................................................................8-11
Figure 8-10. IPX Summary Statistics .........................................................................8-12
Figure 8-11. IPX Traffic Statistics ...............................................................................8-13
xii
303552-A Rev 00
Figure 8-12. IPX Interface Statistics ...........................................................................8-13
Figure 8-13. IPX Forwarding Statistics .......................................................................8-14
Figure 8-14. IPX Host Statistics .................................................................................8-14
Figure 8-15. IPX Route Statistics ...............................................................................8-15
Figure 8-16. IPX Service Statistics .............................................................................8-15
Figure 8-17. IPX RIP Interface Statistics ....................................................................8-16
Figure 8-18. IPX SAP Interface Statistics ...................................................................8-16
Figure 8-19. AppleTalk Summary Statistics ...............................................................8-17
Figure 8-20. AppleTalk Traffic Statistics .....................................................................8-18
Figure 8-21. AppleTalk Interface Statistics .................................................................8-18
Figure 8-22. AppleTalk Route Statistics .....................................................................8-19
Figure 8-23. AppleTalk ARP Table Statistics ..............................................................8-19
Figure 8-24. AppleTalk Zone Statistics .......................................................................8-20
Figure A-1.
Edit HTTP Global Parameters Window ................................................... A-2
Figure B-1.
Statistics Manager Window ..................................................................... B-2
Figure B-2.
Statistics Launch Facility Window ........................................................... B-3
Figure B-3.
HTTP Request Statistics Window ........................................................... B-4
Figure B-4.
HTTP Response Statistics Window ........................................................ B-5
Figure B-5.
HTTP Server Configuration Window ....................................................... B-6
Figure B-6.
HTTP Summary Statistics Window ......................................................... B-7
303552-A Rev 00
xiii
Tables
Table 5-1.
303552-A Rev 00
Event Message Severity Levels ...............................................................5-4
xv
Preface
This guide describes the Hypertext Transfer Protocol ( HTTP) Server and what you
do to start and customize the HTTP Server on a Bay Networks® router.
You can use the Bay Command Console (BCC™) or Site Manager to configure the
HTTP Server on a router. In this guide, you will find instructions for using both
the BCC and Site Manager.
Before You Begin
Before using this guide, you must complete the following procedures. For a new
router:
•
Install the router (see the installation guide that came with your router).
•
Connect the router to the network and create a pilot configuration file (see
Quick-Starting Routers, Configuring BayStack Remote Access, or Connecting
ASN Routers to a Network).
Make sure that you are running the latest version of Bay Networks BayRS™ and
Site Manager software. For information about upgrading BayRS and Site
Manager, see the upgrading guide for your version of BayRS.
303552-A Rev 00
xvii
Managing Your Network Using the HTTP Server
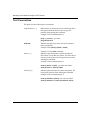
Text Conventions
This guide uses the following text conventions:
angle brackets (< >)
Indicate that you choose the text to enter based on the
description inside the brackets. Do not type the
brackets when entering the command.
Example: If the command syntax is:
ping <ip_address>, you enter:
ping 192.32.10.12
bold text
Indicates text that you need to enter and command
names and options.
Example: Enter show ip {alerts | routes}
Example: Use the dinfo command.
braces ({})
Indicate required elements in syntax descriptions
where there is more than one option. You must choose
only one of the options. Do not type the braces when
entering the command.
Example: If the command syntax is:
show ip {alerts | routes}, you must enter either:
show ip alerts or show ip routes.
brackets ([ ])
Indicate optional elements in syntax descriptions. Do
not type the brackets when entering the command.
Example: If the command syntax is:
show ip interfaces [-alerts], you can enter either:
show ip interfaces or show ip interfaces -alerts.
xviii
303552-A Rev 00
Preface
italic text
Indicates file and directory names, new terms, book
titles, and variables in command syntax descriptions.
Where a variable is two or more words, the words are
connected by an underscore.
Example: If the command syntax is:
show at <valid_route>
valid_route is one variable and you substitute one value
for it.
screen text
Indicates system output, for example, prompts and
system messages.
Example: Set Bay Networks Trap Monitor Filters
separator ( > )
Shows menu paths.
Example: Protocols > IP identifies the IP option on the
Protocols menu.
vertical line ( | )
Separates choices for command keywords and
arguments. Enter only one of the choices. Do not type
the vertical line when entering the command.
Example: If the command syntax is:
show ip {alerts | routes}, you enter either:
show ip alerts or show ip routes, but not both.
Acronyms
303552-A Rev 00
ARP
Address Resolution Protocol
BootP
Bootstrap Protocol
FDDI
Fiber Distributed Data Interface
FTP
File Transfer Protocol
GUI
graphical user interface
HSSI
High-Speed Serial Interface
HTTP
Hypertext Transfer Protocol
ICMP
Internet Control Message Protocol
IP
Internet Protocol
xix
Managing Your Network Using the HTTP Server
IPX
Internetwork Packet Exchange
ISO
International Organization for Standardization
LAN
local area network
MAC
media access control
MIB
management information base
MTU
maximum transmission unit
OSPF
Open Shortest Path First
PPP
Point-to-Point Protocol
PROM
programmable read-only memory
RIP
Routing Information Protocol
SAP
Service Advertising Protocol
SNMP
Simple Network Management Protocol
TCP
Transmission Control Protocol
TFTP
Trivial File Transfer Protocol
WAN
wide area network
Bay Networks Technical Publications
You can now print Bay Networks technical manuals and release notes free,
directly from the Internet. Go to support.baynetworks.com/library/tpubs/. Find the
Bay Networks product for which you need documentation. Then locate the
specific category and model or version for your hardware or software product.
Using Adobe Acrobat Reader, you can open the manuals and release notes, search
for the sections you need, and print them on most standard printers. You can
download Acrobat Reader free from the Adobe Systems Web site,
www.adobe.com.
xx
303552-A Rev 00
Preface
You can purchase Bay Networks documentation sets, CDs, and selected technical
publications through the Bay Networks Collateral Catalog. The catalog is located
on the World Wide Web at support.baynetworks.com/catalog.html and is divided
into sections arranged alphabetically:
•
The “CD ROMs” section lists available CDs.
•
The “Guides/Books” section lists books on technical topics.
•
The “Technical Manuals” section lists available printed documentation sets.
Make a note of the part numbers and prices of the items that you want to order.
Use the “Marketing Collateral Catalog description” link to place an order and to
print the order form.
How to Get Help
For product assistance, support contracts, or information about educational
services, go to the following URL:
http://www.baynetworks.com/corporate/contacts/
Or telephone the Bay Networks Technical Solutions Center at:
800-2LANWAN
303552-A Rev 00
xxi
Chapter 1
Starting the HTTP Server
The Bay Networks® HTTP Server is an embedded Web-based device
management tool accessible from any standard Web browser. The HTTP Server is
included with the Bay Networks router operating system software. Using HTTP
Server software, you can monitor network devices, viewing summary, fault, and
statistical information on a device-by-device basis.
Before you can use the HTTP Server to monitor a router, you must ensure that
your browser is at the correct version and that its settings are appropriate to
support the HTTP Server software. You must also configure and enable the HTTP
Server software on the router using the Quick-Start installation script install.bat,
Site Manager, or the Bay Command Console (BCC™).
This chapter describes how you do each of these tasks.
303552-A Rev 00
Topic
Page
Browser Requirements
1-2
Starting the HTTP Server Using install.bat
1-2
Starting the HTTP Server Using the BCC or Site Manager
1-3
1-1
Managing Your Network Using the HTTP Server
Browser Requirements
The HTTP Server software requires a Web browser that supports frames, such as
Netscape 3.0 or higher and Microsoft® Internet Explorer® 3.0 or higher. You can
use the default settings for these browsers. If you have changed these settings, you
must ensure that Java is enabled.
Note: Internet Explorer allows you to store your browser password. For
security reasons, it is wise not to store your password.
Starting the HTTP Server Using install.bat
A new router comes with a flash memory card containing the software image for
the router, two configuration files (config and ti.cfg), and the Quick-Start script
install.bat.
The Quick-Start installation script creates an initial IP network interface on the
router, so that your router can communicate with the configuration workstation
from which you will manage the router. The install.bat script prompts you to enter
the network information that dynamically configures the initial IP interface.
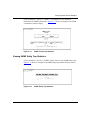
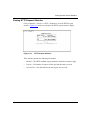
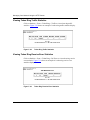
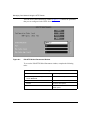
As the following example shows, step 7 of the script asks whether you want to
enable HTTP. Answer yes to this question. (The default is no.)
Step 7. Enable HTTP
Enable the HTTP (Web) Server
---------------------------Do you want to enable the HTTP (Web) server? (y/n)[n]: y
HTTP server enabled.
Note: For complete instructions on running the install.bat script and verifying
that the installation is successful, see Quick-Starting Routers.
1-2
303552-A Rev 00
Starting the HTTP Server
When you enable the HTTP Server during the Quick-Start procedure, you can use
the HTTP Server after completing the install.bat procedure. If necessary, you can
modify the default HTTP Server settings (see Chapter 9, “Customizing HTTP
Server Parameters).
After you run the install.bat script, you can install Site Manager software, as
described in Quick-Starting Routers.
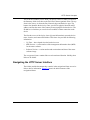
Starting the HTTP Server Using the BCC or Site Manager
If you did not use the Quick-Start procedure to start the HTTP Server, you can
start it using the BCC or Site Manager. Before you start the HTTP Server, verify
that you configured IP on an interface.
You can start the HTTP Server using default values for all parameters. If you
decide to change any of the default values, see Chapter 9, “Customizing HTTP
Server Parameters.”
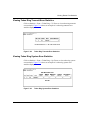
Using the BCC
Adding the HTTP Server to a router automatically loads TCP on all slots. To add
the HTTP Server to a router, navigate to the box prompt and enter:
http
For example, the following command adds HTTP Server to a router:
box# http
http#
303552-A Rev 00
1-3
Managing Your Network Using the HTTP Server
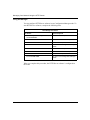
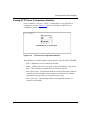
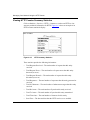
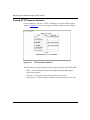
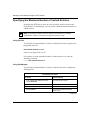
Using Site Manager
You can configure HTTP Server software in any Configuration Manager mode. To
start HTTP Server software, complete the following tasks:
Site Manager Procedure
You do this
System responds
1. In the Configuration Manager window,
choose Protocols.
The Protocols menu opens.
2. Choose Global Protocols.
The Global Protocols menu opens.
3. Choose TCP.
The TCP menu opens.
4. Choose Create TCP.
You return to the Configuration Manager
window.
5. Choose Protocols.
The Protocols menu opens.
6. Choose Global Protocols.
The Global Protocols menu opens.
7. Choose HTTP.
The HTTP menu opens.
8. Choose Create HTTP.
You return to the Configuration Manager
window.
When you complete this procedure, the HTTP Server software is configured on
the router.
1-4
303552-A Rev 00
Chapter 2
HTTP Server Concepts
With HTTP Server software, you can access device information from anywhere in
the network using any standard Web browser that conforms to HTTP and HTML
specifications. The HTTP Server is part of the router operating system for all Bay
Networks non-VME-based GAME routers. This chapter provides an overview of
the HTTP Server.
Topic
Page
What the HTTP Server Does
2-1
Navigating the HTTP Server Interface
2-3
To obtain Web-accessible data, you must configure the embedded HTTP Server
software on the router. Chapter 1, “Starting the HTTP Server,” summarizes the
configuration procedure.
What the HTTP Server Does
The HTTP Server is a graphical user interface (GUI) that lets you view real-time
device summaries, events, alerts, and statistics. The HTTP Server graphically
displays information similar to (and a subset of) the text-only information
available through the BCC show, enable, and disable commands. Through this
point-and-click interface, you also have direct access to online documentation and
Bay Networks Technical Support.
303552-A Rev 00
2-1
Managing Your Network Using the HTTP Server
The information that you gather through the HTTP Server interface can help you
monitor your network’s performance on a device-by-device basis. You can see, for
example, where congestion is occurring or where transmission or reception
problems exist. For detailed information about interpreting this information, refer
to Troubleshooting Routers and Event Messages for Routers.
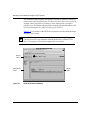
Figure 2-1 is an example of the HTTP Server interface viewed with the Netscape
Navigator 3.01 browser.
Note: The examples in this book were generated using Netscape Navigator
3.01, but you can use any standards-compliant Web browser with the HTTP
Server. You must use a browser that supports the use of frames.
Banner
frame
Navigational
frame
Figure 2-1.
2-2
Display
frame
Initial HTTP Server Window
303552-A Rev 00
HTTP Server Concepts
This is the first window you see when you specify a device or when you click on
the Summary folder icon, then on the Info icon in the navigational frame. The top
frame is the banner; it shows the Bay Networks logo and the device type. The
banner also identifies the device by name, specifies its physical location and IP
address, and lists the name of the contact person responsible for that device. The
IP address is a link that you can click on to establish a Telnet connection to the
device.
The first three rows of the display frame (System Information) repeat the device
name, location, and contact information. This frame also provides the following
information:
•
Up Time -- time elapsed since the last device reset
•
MIB Version -- version number of the management information base (MIB)
for the router software
•
Software Version -- version number and creation date and time of the router
software image
The navigational frame contains links to each monitored function. Initially, these
links are all folders.
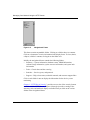
Navigating the HTTP Server Interface
The folders (and the documents they contain) in the navigational frame are active
links to device information. Figure 2-2 shows the initial contents of this
navigational frame.
303552-A Rev 00
2-3
Managing Your Network Using the HTTP Server
Figure 2-2.
Navigational Frame
This frame contains expandable folders. Clicking on a folder shows its contents.
Click on a document to view its information in the display frame. To close (that is,
collapse) a folder’s contents, click again on the folder icon.
Initially, the navigational frame contains the following folders:
•
Summary -- System information, hardware status, PROM information,
software image information, system resource information, and system task
information
•
Fault -- Circuit alerts and the event log
•
Statistics -- Services, ports, and protocols
•
Support -- Help, release notes, technical manuals, and customer support links
Click on each folder in turn to display the information for the device you are
monitoring.
Chapter 3, “HTTP Server Security,” provides an overview of the security features
available with the HTTP Server. Chapters 4 through 8 provide a catalog of the
summary, fault, and statistical displays available when you click on the various
folders in the navigational frame.
2-4
303552-A Rev 00
Chapter 3
HTTP Server Security
The HTTP Server allows access to device information from anywhere in the
network. To protect your network information, you may want to implement
security controls. The HTTP Server offers two levels of access control:
user name/password security and network address filtering.
Topic
Page
User Name/Password Security
3-1
Network Address Filtering
3-2
User Name/Password Security
The HTTP Server controls access to network device information by grouping that
information into collections that share the same security attributes, called realms.
The HTTP Server defines two security realms on the router: User and Manager.
These are the same as the logins for the Technician Interface. Similarly, a
user name/password authorization mechanism controls access to each realm.
•
User access privileges let you view information.
•
Manager access privileges grant complete access to the router, letting you, for
example, enable and disable an interface.
Before allowing any Manager-level operations, however, the HTTP Server
requires that the system administrator set a nonnull Manager password. If the
system administrator does not set a User password, the HTTP Server accepts an
empty (null) string as the password. Generally, the system administrator sets
passwords using Technician Interface commands, just as for console access
through the Technician Interface.
303552-A Rev 00
3-1
Managing Your Network Using the HTTP Server
If you have User access privileges and attempt to access information requiring
Manager privileges (or, if you attempt to use the Manager login with a null
password), the HTTP Server prompts you for the Manager password. If you do
not provide the appropriate password, an error message appears, and you cannot
perform that operation.
For specific information about how to set user names and passwords, see Using
Technician Interface Software. For information about securing a router as part of
the Quick-Start procedure, see Quick-Starting Routers.
Network Address Filtering
For additional security, you can implement IP access control filters when you
configure IP on the router. These filters further restrict access to the router,
limiting access to specific IP addresses or IP address ranges.
You must also ensure that IP is appropriately configured to support HTTP. To do
this, you must ensure that:
•
The configuration for the IP service also has HTTP configured.
•
The appropriate access policy filters are configured for HTTP.
You specify these requirements as part of the IP configuration process, using the
BCC. For additional information about IP access control filters and how to
configure them, see Configuring IP Utilities. For general instructions about using
the BCC, see Using the Bay Command Console (BCC).
3-2
303552-A Rev 00
Chapter 4
Using the HTTP Server
This chapter describes how to use the HTTP Server to monitor the operation of
your network. If you have not configured and enabled the HTTP Server on your
router, see Chapter 1, “Starting the HTTP Server.” For specific descriptions of
how to use the information from the HTTP Server to troubleshoot the devices in
your network, refer to Troubleshooting Routers.
Topic
Page
Getting Help
4-1
Specifying a Device
4-2
Viewing Overall System Status
4-3
Getting Help
Click on the Support folder icon in the navigational frame, then on Help for help
on the HTTP Server. Alternatively, you can click on the text Support next to the
folder icon.
Other icons under the Support folder link to the Release Notes, the full Bay
Networks router documentation set online, and the Bay Networks Technical
Solutions Center.
303552-A Rev 00
4-1
Managing Your Network Using the HTTP Server
After opening one of these links, choose File > Close to return to the HTTP Server
page on the Web browser. Clicking on File > Exit shuts down the browser. The
Back button may not be available on linked pages.
Note: In the figures that follow, the background color is white for legibility.
Unless you changed your browser preferences to override the standard
settings, the background color on your windows will be gray.
Specifying a Device
To monitor the status of a device on your network, first start your Web browser. In
the Location field, enter:
http://<router IP address>
<router IP address> is an IP address on the device that you want to monitor, for
example:
http://192.168.12.54
The browser displays a summary window, similar to that in Figure 4-1.
4-2
303552-A Rev 00
Using the HTTP Server
Figure 4-1.
Initial HTTP Server Window
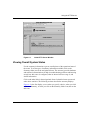
Viewing Overall System Status
Use the summary information to get an overall picture of the operational state of
the router. To see the types of summary information available, click on the
Summary folder icon in the navigational frame. The summary provides hardware
and software information that can help in troubleshooting problems and knowing
exactly how this router is configured, what its internal resource usage is, and
similar information.
Click on the other links in the navigational frame for detailed event reports and
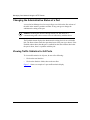
other device statistics. The following sections describe the summary displays.
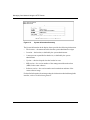
Figure 4-2 is the first display you see when you specify a device, when you click
on the text Summary, or when you click on the Summary folder icon, then on the
Info icon.
303552-A Rev 00
4-3
Managing Your Network Using the HTTP Server
Figure 4-2.
System Information Summary
The System Information in the display frame provides the following information:
•
Device name -- the mnemonic name that the system administrator assigns
•
Location -- the location, as defined by the system administrator
•
Contact person responsible for that device, as defined by the system
administrator
•
Up time -- the time elapsed since the last device reset
•
MIB version -- the version number of the management information base
(MIB) for the router software
•
Software version -- the version number and creation date and time of the
router software image
For detailed information about interpreting the information obtained through this
interface, refer to Troubleshooting Routers.
4-4
303552-A Rev 00
Using the HTTP Server
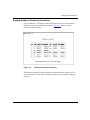
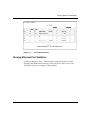
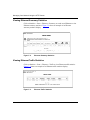
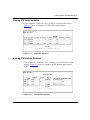
Viewing Hardware Summary Information
Click on Summary > Hardware in the navigational frame to view the summary
information for the specified hardware device. Figure 4-3 shows a sample
hardware summary display.
Figure 4-3.
Hardware Information Summary
The hardware summary lists the model name and serial number of the device, as
well as the type, revision, and serial number of the processor and link module in
each slot.
303552-A Rev 00
4-5
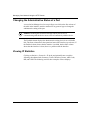
Managing Your Network Using the HTTP Server
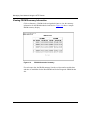
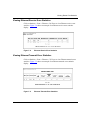
Viewing PROM Summary Information
Click on Summary > PROMs in the navigational frame to view the summary
information for the PROM modules in the device. Figure 4-4 shows a sample
PROM summary display.
Figure 4-4.
PROM Information Summary
For each router slot, the PROM summary lists the revision number and the date
and time of installation for the Boot PROM and for the Diagnostic PROM in that
slot.
4-6
303552-A Rev 00
Using the HTTP Server
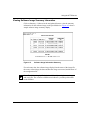
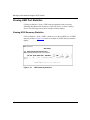
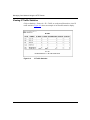
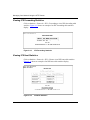
Viewing Software Image Summary Information
Click on Summary > Software in the navigational frame to view the summary
information for the software image on the specified device. Figure 4-5 shows a
sample software image summary display.
Figure 4-5.
Software Image Information Summary
For each router slot, the software image display lists the name of the image file,
the source of that image, the date and time the image was created, and the name of
the configuration file.
Note: Troubleshooting tip: Each slot should identify exactly the same image
and config file. The existence of differences indicates a possible problem that
needs attention.
303552-A Rev 00
4-7
Managing Your Network Using the HTTP Server
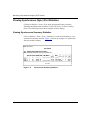
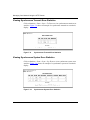
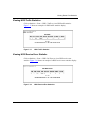
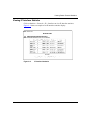
Viewing System Resource Summary Information
Click on Summary > Resources in the navigational frame to view the summary
information for the system resources on the specified hardware device. Figure 4-6
shows a sample system resources summary display.
Figure 4-6.
System Resource Summary
For each router slot, the system resources display lists the usage data for the CPU,
memory, and buffers in that slot.
4-8
303552-A Rev 00
Using the HTTP Server
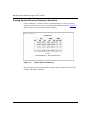
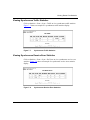
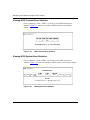
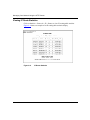
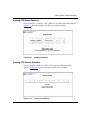
Viewing System Task Summary Information
Click on Summary > Tasks in the navigational frame to view the summary
information for the system tasks on the specified hardware device. Figure 4-7
shows a sample system tasks summary display.
Figure 4-7.
System Task Summary
The system tasks summary shows the name of each active task, providing the
usage data for the CPU, memory, and buffers, and indicating on which slots the
task is running.
303552-A Rev 00
4-9
Chapter 5
Viewing Circuit Alerts and Events
This chapter describes how to use the HTTP Server to monitor circuit alerts and
system events on a specified device. It assumes you have configured and enabled
the HTTP Server on your router, as described in Chapter 1, “Starting the HTTP
Server.” For a detailed description of how to isolate and correct problems with a
specific device, refer to Troubleshooting Routers.
Topic
Page
Displaying Circuit Alerts
5-2
Viewing the Event Log
5-2
With the HTTP Server, you can view the events and alerts generated by the
entities on the router. Clicking on Fault reveals two additional choices. You can
view:
•
All circuit alerts on the router
•
All event log messages
The following sections describe these options.
303552-A Rev 00
5-1
Managing Your Network Using the HTTP Server
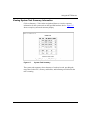
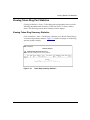
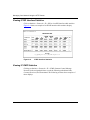
Displaying Circuit Alerts
A circuit alert indicates a condition, such as a port/interface that has been brought
down unexpectedly, that requires your immediate attention. To view any
exceptional status conditions for any interface on the router, click on Fault >
Circuit Alert in the navigational frame. Figure 5-1 shows a sample circuit alerts
display.
Figure 5-1.
Circuit Alert Display
For each index item, the circuit alerts display shows the circuit name, the
administrative state, operational state, type, MAC address, maximum transmission
unit (MTU), and line speed.
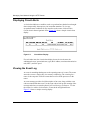
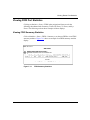
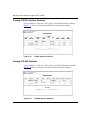
Viewing the Event Log
An event is something that happens to the operating status of a router. The router
stores the event as a single entry in a memory-resident log. The event log for a
router is the composite of all the events that occur for all the processors in the
router.
An event message provides a brief description of an event, along with the event
code associated with that event. Use the event code to look up the meaning of the
message and what you must do about it in Event Messages for Routers. To view
the events for a router, click on Fault > Events in the navigational frame.
Figure 5-2 shows a sample event log display.
5-2
303552-A Rev 00
Viewing Circuit Alerts and Events
Figure 5-2.
Event Log Display
Specifying the Contents of the Event Log Display
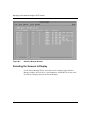
By default, the event log display shows Fault, Warning, and Info event messages.
To show other event messages, click on the check boxes to select the appropriate
message levels. You can also fill in the fields in this frame to restrict the display to
one or more specific slots or entities, separating individual entries with spaces,
and to show only events that happen after a specific date and time.
Note: All entity names are case-sensitive. For a list of entity names, refer to
Event Messages for Routers.
303552-A Rev 00
5-3
Managing Your Network Using the HTTP Server
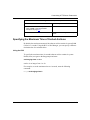
Interpreting Event Messages
Event Messages for Routers provides detailed information about interpreting
event messages and taking appropriate action. Most messages document routine
occurrences that do not require you to do anything. Table 5-1 lists the severity
levels and provides brief descriptions of them.
Table 5-1.
5-4
Event Message Severity Levels
Severity
Description
Fault
Indicates a major service disruption. A configuration, network, or
hardware problem usually causes such a disruption. The entities
involved keep restarting until the problem is resolved either by the
router itself or by you.
Warning
Indicates that a service acted in an unexpected manner.
Info
Indicates routine events. Usually, no action is required.
Trace
Provides a detailed history of everything that happens on the router.
Because of the amount of information that the Trace function records,
Bay Networks recommends viewing this type of message only when
diagnosing specific network problems.
Debug
Indicates information that Bay Networks Customer Support uses. With
few exceptions, these messages do not appear in Event Messages for
Routers.
303552-A Rev 00
Chapter 6
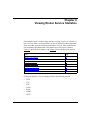
Viewing Router Service Statistics
Examining the router’s statistics along with the event log can give you a picture of
how well your router is working. When you click on Statistics in the navigational
frame, the folder opens to show three more folders: Services, Ports, and Protocols,
each containing subordinate links. This chapter shows the Services statistics.
Chapter 7 shows the Port statistics, and Chapter 8 shows the Protocols statistics.
Topic
Page
Viewing TFTP Statistics
6-2
Viewing TCP Statistics
6-3
Viewing FTP Statistics
6-4
Viewing Telnet Statistics
6-4
Viewing BootP Statistics
6-5
Viewing SNMP Statistics
6-7
Viewing HTTP Statistics
6-10
Clicking on Statistics > Services displays links to the following services:
•
•
•
•
•
•
•
303552-A Rev 00
TFTP
TCP
FTP
Telnet
BootP
SNMP
HTTP
6-1
Managing Your Network Using the HTTP Server
To get statistical information about any of these services, click on the appropriate
link in the navigational frame. The following sections show these displays.
Note: This manual presents the details of the HTTP statistics. Detailed
descriptions of statistics for the other services are in the manuals for each
service.
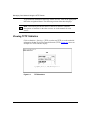
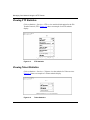
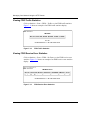
Viewing TFTP Statistics
Click on Statistics > Services > TFTP or on the text TFTP to see the statistical
information for the Trivial File Transfer Protocol (TFTP). Figure 6-1 shows an
example of a TFTP statistics display.
Figure 6-1.
6-2
TFTP Statistics
303552-A Rev 00
Viewing Router Service Statistics
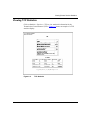
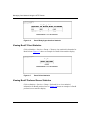
Viewing TCP Statistics
Click on Statistics > Services > TCP to view statistical information for the
Transmission Control Protocol (TCP). Figure 6-2 shows an example of a TCP
statistics display.
Figure 6-2.
303552-A Rev 00
TCP Statistics
6-3
Managing Your Network Using the HTTP Server
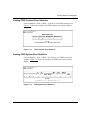
Viewing FTP Statistics
Click on Statistics > Services > FTP to view statistical information for the File
Transfer Protocol (FTP). Figure 6-3 shows an example of an FTP statistics
display.
Figure 6-3.
FTP Statistics
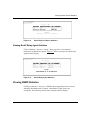
Viewing Telnet Statistics
Click on Statistics > Services > Telnet to view the statistics for Telnet services.
Figure 6-4 shows an example of a Telnet statistics display.
Figure 6-4.
6-4
Telnet Statistics
303552-A Rev 00
Viewing Router Service Statistics
Viewing BootP Statistics
Clicking on Statistics > Services > Bootp reveals several subordinate links:
Traffic, Interfaces, Clients, Preferred Srv (Servers), and Relay Agents. The
following sections show examples of these displays.
Viewing BootP Traffic Statistics
Click on Statistics > Services > Bootp > Traffic or on the text Bootp to view
statistical information for BootP traffic. Figure 6-5 shows an example of a BootP
traffic statistics display.
Figure 6-5.
BootP Traffic Statistics
Viewing BootP Interface Statistics
Click on Statistics > Services > Bootp > Interfaces to view statistical information
for BootP relay agent interfaces. Figure 6-6 shows an example of a BootP relay
agent interface statistics display.
303552-A Rev 00
6-5
Managing Your Network Using the HTTP Server
Figure 6-6.
BootP Relay Agent Interface Statistics
Viewing BootP Client Statistics
Click on Statistics > Services > Bootp > Clients to view statistical information for
BootP clients. Figure 6-7 shows an example of a BootP client statistics display.
Figure 6-7.
BootP Client Statistics
Viewing BootP Preferred Server Statistics
Click on Statistics > Services > Bootp > Preferred Srv to view statistical
information for BootP preferred servers. Figure 6-8 shows an example of a BootP
preferred servers statistics display.
6-6
303552-A Rev 00
Viewing Router Service Statistics
Figure 6-8.
BootP Preferred Server Statistics
Viewing BootP Relay Agent Statistics
Click on Statistics > Services > Bootp > Relay Agents to view statistical
information for BootP relay agents. Figure 6-9 shows an example of a BootP relay
agents statistics display.
Figure 6-9.
BootP Relay Agent Statistics
Viewing SNMP Statistics
Clicking on Statistics > Services > SNMP in the navigational frame reveals the
following subordinate links: Counters, Communities, Entity Traps, and
Exceptions. The following sections show examples of these displays.
303552-A Rev 00
6-7
Managing Your Network Using the HTTP Server
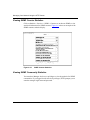
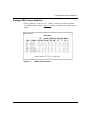
Viewing SNMP Counter Statistics
Click on Statistics > Services > SNMP > Counters or on the text SNMP to view
statistical information for SNMP counters. Figure 6-10 shows an example of the
SNMP counters statistics display.
Figure 6-10.
SNMP Counter Statistics
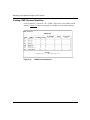
Viewing SNMP Community Statistics
You must have Manager-level access privileges to view the statistics for SNMP
communities. If you logged in with user-level privileges, HTTP prompts you to
enter the manager login name and password.
6-8
303552-A Rev 00
Viewing Router Service Statistics
Click on Statistics > Services > SNMP > Communities to view statistical
information for SNMP communities. Figure 6-11 shows an example of an SNMP
communities statistics display.
Figure 6-11.
SNMP Community Statistics
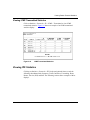
Viewing SNMP Entity Trap Statistics
Click on Statistics > Services > SNMP > Entity Traps to view SNMP entity traps.
Figure 6-12 shows an example of an SNMP entity trap statistics display with no
data.
Figure 6-12.
303552-A Rev 00
SNMP Entity Trap Statistics
6-9
Managing Your Network Using the HTTP Server
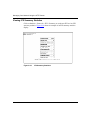
Viewing SNMP Exception Statistics
Click on Statistics > Services > SNMP > Exceptions to view SNMP exceptions
statistics. Figure 6-13 shows an example of an SNMP exceptions statistics display
with no data.
Figure 6-13.
SNMP Exception Statistics
Viewing HTTP Statistics
Clicking on Statistics > Services > HTTP in the navigational frame reveals the
following subordinate links: Configuration, Counters, Requests, and Responses.
The following sections show examples of these displays. The explanations that
follow the screens are longer than for other services, because these statistics are
not currently described elsewhere.
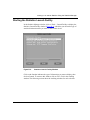
Note: HTTP Server statistics are also accessible through the Site Manager
Statistics Manager. Appendix B, “Viewing HTTP Server Statistics Using the
Statistics Manager,” shows and briefly describes the Statistics Manager
displays for the HTTP Server.
6-10
303552-A Rev 00
Viewing Router Service Statistics
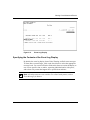
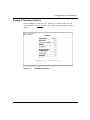
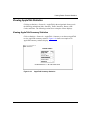
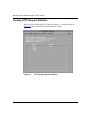
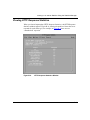
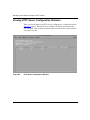
Viewing HTTP Server Configuration Statistics
Click on Statistics > Services > HTTP > Configuration to view HTTP Server
configuration statistics. Figure 6-14 shows an example of an HTTP Server
configuration statistics display.
Figure 6-14.
HTTP Server Configuration Statistics
The following is a brief description of these statistics, taken from the HTTP MIB.
303552-A Rev 00
•
State -- Whether the server is enabled or disabled.
•
Status -- Whether the server is currently up, down, initializing, or not present.
•
Port -- The port number on which this server listens to requests.
•
Max. Cache Count -- The maximum number of archives that will be cached in
system RAM. Increasing this value can improve performance for multiple
simultaneous requests at the cost of greater memory usage.
•
Max. Cache Age -- The maximum number of seconds that an archive is
cached in system RAM.
6-11
Managing Your Network Using the HTTP Server
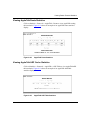
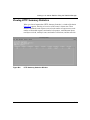
Viewing HTTP Counter Summary Statistics
Click on Statistics > Services > HTTP > Counters or on the text HTTP to view
summary statistical information for HTTP. Figure 6-15 shows an example of an
HTTP counters statistical display.
Figure 6-15.
HTTP Summary Statistics
These statistics provide the following information:
6-12
•
Total Requests Received -- The total number of requests that this entity
received.
•
Total Request Errors -- The total number of request errors that this entity
detected (as server).
•
Total Request Discards -- The total number of requests that this entity
discarded (as server).
•
Total Responses -- The total number of responses that this entity generated or
received.
•
Total In Unknowns -- The total number of unknown messages that this entity
received.
•
Total Rx Octets -- The total number of bytes that this entity received.
•
Total Tx Octets -- The total number of bytes that this entity transmitted.
•
Total Time Outs -- The total number of timeouts for this entity.
•
Start Time -- The date and time that the HTTP services were enabled.
303552-A Rev 00
Viewing Router Service Statistics
Viewing HTTP Request Statistics
Click on Statistics > Services > HTTP > Requests to view the HTTP request
statistics. Figure 6-16 shows an example of an HTTP request statistics display.
Figure 6-16.
HTTP Request Statistics
These statistics provide the following information:
303552-A Rev 00
•
Method -- The HTTP standard request method to which these statistics apply.
•
Total In -- The number of requests of this type that this entity received.
•
In Last Time -- The date and time the last request was received.
6-13
Managing Your Network Using the HTTP Server
Viewing HTTP Response Statistics
Click on Statistics > Services > HTTP > Responses to view the HTTP response
statistics. Figure 6-17 shows an example of an HTTP response statistics display.
Figure 6-17.
HTTP Response Statistics
The following is a brief description of these statistics, taken from the HTTP MIB.
6-14
•
Status -- An HTTP standard code and message description indicating the
status of the response.
•
Total Out -- The number of times this response was generated.
•
Out Last Time -- The date and time when the most recent response was sent.
303552-A Rev 00
Chapter 7
Viewing Router Port Statistics
Clicking on Statistics > Ports displays the following folders in the navigational
frame:
•
•
•
•
•
Ethernet
Sync
FDDI
HSSI
Token Ring
To get statistical information about any port type, click on the appropriate link.
Each port-type folder contains links to summary statistics, traffic (number of
packets transmitted and received) statistics, receive error statistics, and transmit
error statistics. All but Ethernet also display system error statistics. The following
sections show and briefly describe these displays.
303552-A Rev 00
Topic
Page
Changing the Administrative Status of a Port
7-2
Viewing Traffic Statistics for All Ports
7-2
Viewing Ethernet Port Statistics
7-3
Viewing Synchronous (Sync) Port Statistics
7-6
Viewing FDDI Port Statistics
7-9
Viewing HSSI Port Statistics
7-12
Viewing Token Ring Port Statistics
7-15
7-1
Managing Your Network Using the HTTP Server
Changing the Administrative Status of a Port
A user who has Manager-level access privileges can click on the first column of
the table in the summary statistics window for any port type to change the
administrative setting of the port.
Caution: Disabling the interface through which your Web browser is
communicating with a device causes a loss of connectivity with the device.
The Enabled column displays the administrative setting, but it is not a clickable
link. The State column shows the operational state of the port (up or down). If the
Enabled column shows that the port is enabled, but the State column shows that
the port is down, there is a problem with the port.
Viewing Traffic Statistics for All Ports
To view traffic statistics for all ports, do one of the following:
•
Click on the text Statistics.
•
Click on the Statistics folder, then on the text Port.
Figure 7-1 shows an example of a port traffic statistics display.
7-2
303552-A Rev 00
Viewing Router Port Statistics
Figure 7-1.
Port Traffic Statistics
Viewing Ethernet Port Statistics
Clicking on Statistics > Port > Ethernet in the navigational frame reveals the
following subordinate links: Summary, Traffic, Rx Errors, and Tx Errors. The
following sections show examples of these displays.
303552-A Rev 00
7-3
Managing Your Network Using the HTTP Server
Viewing Ethernet Summary Statistics
Click on Statistics > Ports > Ethernet > Summary or on the word Ethernet to view
Ethernet summary statistics. Figure 7-2 shows an example of an Ethernet
summary statistics display.
Figure 7-2.
Ethernet Summary Statistics
Viewing Ethernet Traffic Statistics
Click on Statistics > Ports > Ethernet > Traffic to view Ethernet traffic statistics.
Figure 7-3 shows an example of an Ethernet traffic statistics display.
Figure 7-3.
7-4
Ethernet Traffic Statistics
303552-A Rev 00
Viewing Router Port Statistics
Viewing Ethernet Receive Error Statistics
Click on Statistics > Ports > Ethernet > Rx Errors to view Ethernet receive error
statistics. Figure 7-4 shows an example of an Ethernet receive error statistics
display.
Figure 7-4.
Ethernet Receive Error Statistics
Viewing Ethernet Transmit Error Statistics
Click on Statistics > Ports > Ethernet > Tx Errors to view Ethernet transmit error
statistics. Figure 7-5 shows an example of an Ethernet transmit error statistics
display.
Figure 7-5.
303552-A Rev 00
Ethernet Transmit Error Statistics
7-5
Managing Your Network Using the HTTP Server
Viewing Synchronous (Sync) Port Statistics
Clicking on Statistics > Ports > Sync in the navigational frame reveals the
following subordinate links: Summary, Traffic, Rx Errors, Tx Errors, and Sys
Errors. The following sections show examples of these displays.
Viewing Synchronous Summary Statistics
Click on Statistics > Ports > Sync > Summary or on the word Summary to view
synchronous summary statistics. Figure 7-6 shows an example of a synchronous
summary statistics display.
Figure 7-6.
7-6
Synchronous Summary Statistics
303552-A Rev 00
Viewing Router Port Statistics
Viewing Synchronous Traffic Statistics
Click on Statistics > Ports > Sync > Traffic to view synchronous traffic statistics.
Figure 7-7 shows an example of a synchronous traffic statistics display.
Figure 7-7.
Synchronous Traffic Statistics
Viewing Synchronous Receive Error Statistics
Click on Statistics > Ports > Sync > Rx Errors to view synchronous receive error
statistics. Figure 7-8 shows an example of a synchronous receive error statistics
display.
Figure 7-8.
303552-A Rev 00
Synchronous Receive Error Statistics
7-7
Managing Your Network Using the HTTP Server
Viewing Synchronous Transmit Error Statistics
Click on Statistics > Ports > Sync > Tx Errors to view synchronous transmit error
statistics. Figure 7-9 shows an example of a synchronous transmit error statistics
display.
Figure 7-9.
Synchronous Transmit Error Statistics
Viewing Synchronous System Error Statistics
Click on Statistics > Ports > Sync > Sys Errors to view synchronous system error
statistics. Figure 7-10 shows an example of a synchronous system error statistics
display.
Figure 7-10.
7-8
Synchronous System Error Statistics
303552-A Rev 00
Viewing Router Port Statistics
Viewing FDDI Port Statistics
Clicking on Statistics > Ports > FDDI in the navigational frame reveals the
following subordinate links: Summary, Traffic, Rx Errors, Tx Errors, and Sys
Errors. The following sections show examples of these displays.
Viewing FDDI Summary Statistics
Click on Statistics > Ports > FDDI > Summary or on the text FDDI to view FDDI
summary statistics. Figure 7-11 shows an example of an FDDI summary statistics
display.
Figure 7-11.
303552-A Rev 00
FDDI Summary Statistics
7-9
Managing Your Network Using the HTTP Server
Viewing FDDI Traffic Statistics
Click on Statistics > Ports > FDDI > Traffic to view FDDI traffic statistics.
Figure 7-12 shows an example of an FDDI traffic statistics display.
Figure 7-12.
FDDI Traffic Statistics
Viewing FDDI Receive Error Statistics
Click on Statistics > Ports > FDDI > Rx Errors to view FDDI receive error
statistics. Figure 7-13 shows an example of an FDDI receive error statistics
display.
Figure 7-13.
7-10
FDDI Receive Error Statistics
303552-A Rev 00
Viewing Router Port Statistics
Viewing FDDI Transmit Error Statistics
Click on Statistics > Ports > FDDI > Tx Errors to view FDDI transmit errors.
Figure 7-14 shows an example of an FDDI transmit error statistics display.
Figure 7-14.
FDDI Transmit Error Statistics
Viewing FDDI System Error Statistics
Click on Statistics > Ports > FDDI > Sys Errors to view FDDI system error
statistics. Figure 7-15 shows an example of an FDDI system error statistics
display.
Figure 7-15.
303552-A Rev 00
FDDI System Error Statistics
7-11
Managing Your Network Using the HTTP Server
Viewing HSSI Port Statistics
Clicking on Statistics > Ports > HSSI in the navigational frame reveals the
following subordinate links: Summary, Traffic, Rx Errors, Tx Errors, and Sys
Errors. The following sections show examples of these displays.
Viewing HSSI Summary Statistics
Click on Statistics > Ports > HSSI > Summary or on the text HSSI to view HSSI
summary statistics. Figure 7-16 shows an example of a HSSI summary statistics
display.
Figure 7-16.
7-12
HSSI Summary Statistics
303552-A Rev 00
Viewing Router Port Statistics
Viewing HSSI Traffic Statistics
Click on Statistics > Ports > HSSI > Traffic to view HSSI traffic statistics.
Figure 7-17 shows an example of a HSSI traffic statistics display.
Figure 7-17.
HSSI Traffic Statistics
Viewing HSSI Receive Error Statistics
Click on Statistics > Ports > HSSI > Rx Errors to view HSSI receive error
statistics. Figure 7-18 shows an example of a HSSI receive error statistics display.
Figure 7-18.
303552-A Rev 00
HSSI Receive Error Statistics
7-13
Managing Your Network Using the HTTP Server
Viewing HSSI Transmit Error Statistics
Click on Statistics > Ports > HSSI > Tx Errors to view HSSI transmit error
statistics. Figure 7-19 shows an example of a HSSI transmit error statistics
display.
Figure 7-19.
HSSI Transmit Error Statistics
Viewing HSSI System Error Statistics
Click on Statistics > Ports > HSSI > Sys Errors to view HSSI system error
statistics. Figure 7-20 shows an example of a HSSI system error statistics display.
Figure 7-20.
7-14
HSSI System Error Statistics
303552-A Rev 00
Viewing Router Port Statistics
Viewing Token Ring Port Statistics
Clicking on Statistics > Ports > Token Ring in the navigational frame reveals the
following subordinate links: Summary, Traffic, Rx Errors, Tx Errors, and Sys
Errors. The following sections show examples of these displays.
Viewing Token Ring Summary Statistics
Click on Statistics > Ports > Token Ring > Summary or on the text Token Ring to
view token ring summary statistics. Figure 7-21 shows an example of a token ring
summary statistics display.
Figure 7-21.
303552-A Rev 00
Token Ring Summary Statistics
7-15
Managing Your Network Using the HTTP Server
Viewing Token Ring Traffic Statistics
Click on Statistics > Ports > Token Ring > Traffic to view token ring traffic
statistics. Figure 7-22 shows an example of a token ring traffic statistics display.
Figure 7-22.
Token Ring Traffic Statistics
Viewing Token Ring Receive Error Statistics
Click on Statistics > Ports > Token Ring > Rx Errors to view token ring receive
error statistics. Figure 7-23 shows an example of a token ring receive error
statistics display.
Figure 7-23.
7-16
Token Ring Receive Error Statistics
303552-A Rev 00
Viewing Router Port Statistics
Viewing Token Ring Transmit Error Statistics
Click on Statistics > Ports > Token Ring > Tx Errors to view token ring transmit
error statistics. Figure 7-24 shows an example of a token ring transmit error
statistics display.
Figure 7-24.
Token Ring Transmit Error Statistics
Viewing Token Ring System Error Statistics
Click on Statistics > Ports > Token Ring > Sys Errors to view token ring system
error statistics. Figure 7-25 shows an example of a token ring system error
statistics display.
Figure 7-25.
303552-A Rev 00
Token Ring System Error Statistics
7-17
Chapter 8
Viewing Router Protocol Statistics
Clicking on Statistics > Protocols displays the following folders in the
navigational frame:
•
•
•
IP
IPX
AppleTalk
To get statistical information about any protocol type, click on the appropriate
link. Each protocol folder contains links to summary statistics, traffic statistics
(number of packets transmitted and received), and interface statistics, as well as to
other statistics specific to that protocol. The following sections show and briefly
describe these displays.
303552-A Rev 00
Topic
Page
Changing the Administrative Status of a Port
8-2
Viewing IP Statistics
8-2
Viewing IPX Statistics
8-11
Viewing AppleTalk Statistics
8-17
8-1
Managing Your Network Using the HTTP Server
Changing the Administrative Status of a Port
A user who has Manager-level access privileges can click on the first column of
the table in the interface statistics window for any protocol type to change the
administrative setting of the port.
Caution: Disabling the IP interface through which your browser is
communicating with the device causes a loss of connectivity with the device.
The Enabled column displays the administrative setting, but it is not a clickable
link. The State column shows the operational state of the interface (up or down). If
the Enabled column shows that the interface is enabled, but the State column
shows that the interface is down, there is a problem with the interface.
Viewing IP Statistics
Clicking on Statistics > Protocols > IP in the navigational frame reveals the
following subordinate links: Summary, Traffic, Interfaces, Routes, ARP Cache,
RIP, and ICMP. The following sections show examples of these displays.
8-2
303552-A Rev 00
Viewing Router Protocol Statistics
Viewing IP Summary Statistics
Click on Statistics > Protocols > IP > Summary or on the text IP to view IP
summary statistics. Figure 8-1 shows an example of an IP summary statistics
display.
Figure 8-1.
303552-A Rev 00
IP Summary Statistics
8-3
Managing Your Network Using the HTTP Server
Viewing IP Traffic Statistics
Click on Statistics > Protocols > IP > Traffic or on the word Protocols to view IP
traffic statistics. Figure 8-2 shows an example of an IP traffic statistics display.
Figure 8-2.
8-4
IP Traffic Statistics
303552-A Rev 00
Viewing Router Protocol Statistics
Viewing IP Interface Statistics
Click on Statistics > Protocols > IP > Interfaces to view IP interface statistics.
Figure 8-3 shows an example of an IP interface statistics display.
Figure 8-3.
303552-A Rev 00
IP Interface Statistics
8-5
Managing Your Network Using the HTTP Server
Viewing IP Route Statistics
Click on Statistics > Protocols > IP > Routes to view IP routing table statistics.
Figure 8-4 shows an example of an IP routing table statistics display.
Figure 8-4.
8-6
IP Route Statistics
303552-A Rev 00
Viewing Router Protocol Statistics
Viewing IP ARP Cache Statistics
Click on Statistics > Protocols > IP > ARP Cache to view IP ARP cache statistics.
Figure 8-5 shows an example of an IP ARP cache statistics display.
Figure 8-5.
303552-A Rev 00
IP ARP Cache Statistics
8-7
Managing Your Network Using the HTTP Server
Viewing IP RIP Interface Statistics
Click on Statistics > Protocols > IP > RIP to view RIP interface table statistics.
Figure 8-6 shows an example of an IP RIP interface table statistics display.
Figure 8-6.
IP RIP Interface Statistics
Viewing IP ICMP Statistics
Clicking on Statistics > Protocols > IP > ICMP (Internet Control Message
Protocol) in the navigational frame reveals the following subordinate links:
Counters, Received, and Transmitted. The following sections show examples of
these displays.
8-8
303552-A Rev 00
Viewing Router Protocol Statistics
Viewing ICMP Counter Statistics
Click on Statistics > Protocols > IP > ICMP > Counters or on the text ICMP to
view ICMP counters statistics. Figure 8-7 shows an example of an ICMP counters
display.
Figure 8-7.
303552-A Rev 00
ICMP Counter Statistics
8-9
Managing Your Network Using the HTTP Server
Viewing ICMP Received Statistics
Click on Statistics > Protocols > IP > ICMP > Received to view ICMP received
statistics. Figure 8-8 shows an example of an ICMP received statistics display.
Figure 8-8.
8-10
ICMP Received Statistics
303552-A Rev 00
Viewing Router Protocol Statistics
Viewing ICMP Transmitted Statistics
Click on Statistics > Protocols > IP > ICMP > Transmitted to view ICMP
transmitted statistics. Figure 8-9 shows an example of an ICMP transmitted
statistics display.
Figure 8-9.
ICMP Transmitted Statistics
Viewing IPX Statistics
Clicking on Statistics > Protocols > IPX in the navigational frame reveals the
following subordinate links: Summary, Traffic, Interfaces, Forwarding, Hosts,
Routes, Services, RIP, and SAP. The following sections show examples of these
displays.
303552-A Rev 00
8-11
Managing Your Network Using the HTTP Server
Viewing IPX Summary Statistics
Click on Statistics > Protocols > IPX > Summary or on the text IPX to view IPX
summary statistics. Figure 8-10 shows an example of an IPX summary statistics
display.
Figure 8-10.
8-12
IPX Summary Statistics
303552-A Rev 00
Viewing Router Protocol Statistics
Viewing IPX Traffic Statistics
Click on Statistics > Protocols > IPX > Traffic to view IPX traffic statistics.
Figure 8-11 shows an example of an IPX traffic statistics display.
Figure 8-11.
IPX Traffic Statistics
Viewing IPX Interface Statistics
Click on Statistics > Protocols > IPX > Interfaces to view IPX interface table
statistics. Figure 8-12 shows an example of an IPX interface table statistics
display.
Figure 8-12.
303552-A Rev 00
IPX Interface Statistics
8-13
Managing Your Network Using the HTTP Server
Viewing IPX Forwarding Statistics
Click on Statistics > Protocols > IPX > Forwarding to view IPX forwarding table
statistics. Figure 8-13 shows an example of an IPX forwarding table statistics
display.
Figure 8-13.
IPX Forwarding Statistics
Viewing IPX Host Statistics
Click on Statistics > Protocols > IPX > Hosts to view IPX hosts table statistics.
Figure 8-14 shows an example of an IPX hosts table statistics display.
Figure 8-14.
8-14
IPX Host Statistics
303552-A Rev 00
Viewing Router Protocol Statistics
Viewing IPX Route Statistics
Click on Statistics > Protocols > IPX > Routes to view IPX routing table statistics.
Figure 8-15 shows an example of an IPX routes statistics display.
Figure 8-15.
IPX Route Statistics
Viewing IPX Service Statistics
Click on Statistics > Protocols > IPX > Services to view IPX service table
statistics. Figure 8-16 shows an example of an IPX services display.
Figure 8-16.
303552-A Rev 00
IPX Service Statistics
8-15
Managing Your Network Using the HTTP Server
Viewing IPX RIP Interface Statistics
Click on Statistics > Protocols > IPX > RIP to view IPX RIP interface statistics.
Figure 8-17 shows an example of an IPX RIP interface statistics display.
Figure 8-17.
IPX RIP Interface Statistics
Viewing IPX SAP Statistics
Click on Statistics > Protocols > IPX > SAP to view IPX SAP interface statistics.
Figure 8-18 shows an example of an IPX SAP interface statistics display.
Figure 8-18.
8-16
IPX SAP Interface Statistics
303552-A Rev 00
Viewing Router Protocol Statistics
Viewing AppleTalk Statistics
Clicking on Statistics > Protocols > AppleTalk in the navigational frame reveals
the following subordinate links: Summary, Traffic, Interfaces, Routes, ARP
Cache, and Zones. The following sections show examples of these displays.
Viewing AppleTalk Summary Statistics
Click on Statistics > Protocols > AppleTalk > Summary or on the text AppleTalk
to view AppleTalk summary statistics. Figure 8-19 shows an example of an
AppleTalk summary statistics display.
Figure 8-19.
303552-A Rev 00
AppleTalk Summary Statistics
8-17
Managing Your Network Using the HTTP Server
Viewing AppleTalk Traffic Statistics
Click on Statistics > Protocols > AppleTalk > Traffic to view AppleTalk traffic
statistics. Figure 8-20 shows an example of an AppleTalk traffic statistics display.
Figure 8-20.
AppleTalk Traffic Statistics
Viewing AppleTalk Interface Statistics
Click on Statistics > Protocols > AppleTalk > Interfaces to view AppleTalk
interface table statistics. Figure 8-21 shows an example of an AppleTalk interface
table statistics display.
Figure 8-21.
8-18
AppleTalk Interface Statistics
303552-A Rev 00
Viewing Router Protocol Statistics
Viewing AppleTalk Route Statistics
Click on Statistics > Protocols > AppleTalk > Routes to view AppleTalk routing
table statistics. Figure 8-22 shows an example of an AppleTalk routes statistics
display.
Figure 8-22.
AppleTalk Route Statistics
Viewing AppleTalk ARP Cache Statistics
Click on Statistics > Protocols > AppleTalk > ARP Table to view AppleTalk ARP
table statistics. Figure 8-23 shows an example of an AppleTalk ARP table
statistics display.
Figure 8-23.
303552-A Rev 00
AppleTalk ARP Table Statistics
8-19
Managing Your Network Using the HTTP Server
Viewing AppleTalk Zone Statistics
Click on Statistics > Protocols > AppleTalk > Zones to view AppleTalk zone table
statistics. Figure 8-24 shows an example of an AppleTalk zone table statistics
display.
Figure 8-24.
8-20
AppleTalk Zone Statistics
303552-A Rev 00
Chapter 9
Customizing HTTP Server Parameters
When you start the HTTP Server on the router, default values are in effect for all
parameters. Depending on the requirements of your network, you may want to
change some of these values. This chapter includes the following information:
Topic
Page
Disabling and Reenabling the HTTP Server
9-2
Specifying the Port Number for the HTTP Server
9-3
Specifying the Maximum Number of Cached Archives
9-4
Specifying the Maximum Time of Cached Archives
9-5
For a description of all Site Manager parameters for HTTP Server, see
Appendix A, “Site Manager Parameters.”
303552-A Rev 00
9-1
Managing Your Network Using the HTTP Server
Disabling and Reenabling the HTTP Server
When you start the HTTP Server on a router, the HTTP Server is enabled by
default. Using either the BCC or Site Manager, you can disable and reenable the
HTTP Server.
Using the BCC
To disable or reenable the HTTP Server, navigate to the http prompt and enter:
state state
state is enabled or disabled.
For example, to disable the HTTP Server, enter the following command:
http# state disabled
Using Site Manager
To disable or reenable the HTTP Server, complete the following tasks:
Site Manager Procedure
You do this
System responds
1. In the Configuration Manager window,
choose Protocols.
The Protocols menu opens.
2. Choose Global Protocols.
The Global Protocols menu opens.
3. Choose HTTP.
The HTTP menu opens.
4. Choose Global.
The Edit HTTP Global Parameters
window opens.
5. Set the Enable/Disable parameter.
Click on Help or see the parameter
description on page A-3.
6. Click on OK.
9-2
You return to the Configuration Manager
window.
303552-A Rev 00
Customizing HTTP Server Parameters
Specifying the Port Number for the HTTP Server
By default, the HTTP Server is enabled on port 80. Using the BCC or Site
Manager, you can specify a different port.
Using the BCC
To specify the port number on which you are enabling the HTTP Server, navigate
to the http prompt and enter:
port number
number is a value from 0 to 4096.
For example, to set the HTTP Server port number to 100, enter the following
command:
http# port 100
Using Site Manager
To specify the port number on which you are enabling the HTTP Server, complete
the following tasks:
Site Manager Procedure
You do this
System responds
1. In the Configuration Manager window,
choose Protocols.
The Protocols menu opens.
2. Choose Global Protocols.
The Global Protocols menu opens.
3. Choose HTTP.
The HTTP menu opens.
4. Choose Global.
The Edit HTTP Global Parameters
window opens.
5. Set the Port parameter.
Click on Help or see the parameter
description on page A-3.
6. Click on OK.
303552-A Rev 00
You return to the Configuration Manager
window.
9-3
Managing Your Network Using the HTTP Server
Specifying the Maximum Number of Cached Archives
By default, the HTTP Server stores in cache up to three archives on the router.
Using the BCC or Site Manager, you can specify a different maximum number of
cached archives.
Note: Increasing the default value can improve performance for multiple
simultaneous requests, but at the cost of greater memory usage.
Using the BCC
To specify the maximum number of archives cached on the router, navigate to the
http prompt and enter:
max-cached-archives number
number is an integer from 3 to 10.
For example, to set the maximum number of cached archives to 8, enter the
following command:
http# max-cached-archives 8
Using Site Manager
To specify the maximum number of archives cached on the router, complete the
following tasks:
Site Manager Procedure
You do this
System responds
1. In the Configuration Manager window,
choose Protocols.
The Protocols menu opens.
2. Choose Global Protocols.
The Global Protocols menu opens.
3. Choose HTTP.
The HTTP menu opens.
4. Choose Global.
The Edit HTTP Global Parameters
window opens.
(continued)
9-4
303552-A Rev 00
Customizing HTTP Server Parameters
Site Manager Procedure (continued)
You do this
System responds
5. Set the Max Cache Count parameter.
Click on Help or see the parameter
description on page A-3.
6. Click on OK.
You return to the Configuration Manager
window.
Specifying the Maximum Time of Cached Archives
By default, the maximum amount of time that an archive remains in system RAM
(cache) is 3 seconds. Using the BCC or Site Manager, you can specify a different
maximum time for cached archives.
Using the BCC
To specify the maximum time (in seconds) that an archive remains in system
RAM (cache), navigate to the http prompt and enter:
cache-aging-timer number
number is an integer from 1 to 10.
For example, to set the maximum time to 6 seconds, enter the following
command:
http# cache-aging-timer 6
303552-A Rev 00
9-5
Managing Your Network Using the HTTP Server
Using Site Manager
To specify the maximum time (in seconds) that an archive remains in system
RAM (cache), complete the following tasks:
Site Manager Procedure
You do this
System responds
1. In the Configuration Manager window,
choose Protocols.
The Protocols menu opens.
2. Choose Global Protocols.
The Global Protocols menu opens.
3. Choose HTTP.
The HTTP menu opens.
4. Choose Global.
The Edit HTTP Global Parameters
window opens.
5. Set the Max Cache Age (seconds)
parameter. Click on Help or see the
parameter description on page A-4.
6. Click on OK.
9-6
You return to the Configuration Manager
window.
303552-A Rev 00
Appendix A
Site Manager Parameters
This appendix contains the Site Manager parameter descriptions for the HTTP
Server. You can display the same information using Site Manager online Help.
For each parameter, this appendix provides the following information:
•
Parameter name
•
Configuration Manager menu path
•
Default setting
•
Valid parameter options
•
Parameter function
•
Instructions for setting the parameter
•
Management information base (MIB) object ID
The Technician Interface allows you to modify parameters by issuing set and
commit commands with the MIB object ID. This process is equivalent to
modifying parameters using Site Manager. For more information about using the
Technician Interface to access the MIB, see Using Technician Interface Software.
Caution: The Technician Interface does not verify the validity of your
parameter values. Entering an invalid value can corrupt your configuration.
303552-A Rev 00
A-1
Managing Your Network Using the HTTP Server
The Edit HTTP Global Parameters window (Figure A-1) contains the parameters
that you can configure for the HTTP Server.
Figure A-1.
Edit HTTP Global Parameters Window
To access the Edit HTTP Global Parameters window, complete the following
tasks:
Site Manager Procedure
A-2
You do this
System responds
1. In the Configuration Manager window,
choose Protocols.
The Protocols menu opens.
2. Choose Global Protocols.
The Global Protocols menu opens.
3. Choose HTTP.
The HTTP menu opens.
4. Choose Global.
The Edit HTTP Global Parameters
window opens.
303552-A Rev 00
Site Manager Parameters
The parameter descriptions follow.
Parameter: Enable/Disable
Path: Configuration Manager > Protocols > Global Protocols > HTTP > Global
Default: When you enable the HTTP Server, this parameter is automatically set to
Enabled.
Options: Enabled | Disabled
Function: Enables or disables the HTTP Server on this interface.
Instructions: To prohibit the use of the HTTP Server on this interface, set this parameter
to Disabled.
MIB Object ID: 1.3.6.1.4.1.18.3.5.3.22.1.1.2
Parameter: Port
Path:
Default:
Options:
Function:
Instructions:
MIB Object ID:
Configuration Manager > Protocols > Global Protocols > HTTP > Global
80
0 to 4096
Specifies the port number on which you enable the HTTP Server.
Accept the default value, 80, or specify a value from 0 to 4096.
1.3.6.1.4.1.18.3.5.3.22.1.1.4
Parameter: Max Cache Count
Path:
Default:
Options:
Function:
Configuration Manager > Protocols > Global Protocols > HTTP > Global
3
3 to 10
Specifies the maximum number of archives cached on the router. Increasing this
value can improve performance for multiple simultaneous requests, but at the
cost of greater memory usage.
Instructions: Accept the default value, 3, or specify a value from 3 to 10.
MIB Object ID: 1.3.6.1.4.1.18.3.5.3.22.1.1.5
303552-A Rev 00
A-3
Managing Your Network Using the HTTP Server
Parameter: Max Cache Age (seconds)
Path:
Default:
Options:
Function:
Configuration Manager > Protocols > Global Protocols > HTTP > Global
3
1 to 10
Specifies the maximum time (in seconds) that an archive remains in system
RAM (cache).
Instructions: Accept the default value, 3, or specify a value from 1 to 10.
MIB Object ID: 1.3.6.1.4.1.18.3.5.3.22.1.1.6
A-4
303552-A Rev 00
Appendix B
Viewing HTTP Server Statistics
Using the Statistics Manager
Statistical information for the HTTP Server is also available through the Site
Manager Statistics Manager tool. To use the Statistics Manager, click on Statistics
on the toolbar or choose Tools > Statistics Manager from the Site Manager menu.
Select the router that you want to monitor. The Statistics Manager window
appears (Figure B-1), showing the device IP address and, for each circuit on that
device, showing the slot, connector, type, and protocols.
303552-A Rev 00
B-1
Managing Your Network Using the HTTP Server
Figure B-1.
Statistics Manager Window
Selecting the Screens to Display
Use the Screen Manager Tool to select the screens to display. In the Statistics
Manager window, click on Tools > Screen Manager. Add the HTTP screens to the
list of those to display, then exit the Screen Manager.
B-2
303552-A Rev 00
Viewing HTTP Server Statistics Using the Statistics Manager
Starting the Statistics Launch Facility
In the Statistics Manager window, click on Tools > Launch Facility to display the
Statistics Launch Facility window (Figure B-2), which lets you choose the type of
statistical information that you want to view for this device.
Figure B-2.
Statistics Launch Facility Window
Click on the line that indicates the type of information you want to display, then
click on Launch. To return to this window, click on File > Exit in the resulting
window. The following sections show the resulting windows for each selection.
303552-A Rev 00
B-3
Managing Your Network Using the HTTP Server
Viewing HTTP Request Statistics
When you choose httpreq.dat (HTTP Request Statistics), a window like that in
Figure B-3 appears, showing the method and total requests.
Figure B-3.
B-4
HTTP Request Statistics Window
303552-A Rev 00
Viewing HTTP Server Statistics Using the Statistics Manager
Viewing HTTP Response Statistics
When you choose httpresp.dat (HTTP Response Statistics), the HTTP Response
Statistics window appears (Figure B-4), showing the number of times the server
responds for each status type; for example, in Figure B-4, there are two
“unauthorized” responses.
Figure B-4.
303552-A Rev 00
HTTP Response Statistics Window
B-5
Managing Your Network Using the HTTP Server
Viewing HTTP Server Configuration Statistics
When you choose httpsrv.dat (HTTP Server Configuration), a window like that in
Figure B-5 appears, showing the state (enabled or disabled), operational status,
port, maximum cache count (maximum number of stored archives), and maximum
cache age in seconds.
Figure B-5.
B-6
HTTP Server Configuration Window
303552-A Rev 00
Viewing HTTP Server Statistics Using the Statistics Manager
Viewing HTTP Summary Statistics
When you choose httpsum.dat (HTTP Summary Statistics), a window like that in
Figure B-6 appears, showing an overview of the router’s current state. These
statistics include the total requests received, total number of request errors, total
number of discarded requests, total number of responses, total unknown inputs,
total bytes received, total bytes sent, total number of timeouts, and the start time.
Figure B-6.
303552-A Rev 00
HTTP Summary Statistics Window
B-7
Index
A
acronyms, xix
E
alerts, displaying, 5-2
educational services, xxi
AppleTalk ARP cache statistics, 8-19
Enable/Disable parameter, A-3
AppleTalk interface statistics, 8-18
enabling HTTP Server, 1-1
AppleTalk statistics, 8-17
Ethernet port statistics, 7-3
AppleTalk traffic statistics, 8-18
Ethernet receive error statistics, 7-5
AppleTalk zone statistics, 8-20
Ethernet summary statistics, 7-4
ARP cache statistics, AppleTalk, 8-19
Ethernet traffic statistics, 7-4
ARP cache statistics, IP, 8-7
Ethernet transmit error statistics, 7-5
B
BCC, using to start the HTTP Server, 1-3
BootP client statistics, 6-6
event log
filtering, 5-3
interpreting, 5-4
severity levels, 5-4
viewing, 5-2
BootP interface statistics, 6-5
BootP preferred server statistics, 6-6
BootP relay agent statistics, 6-7
BootP statistics, 6-5
BootP traffic statistics, 6-5
browser requirements, 2-2
C
F
FDDI port statistics, 7-9
FDDI receive error statistics, 7-10
FDDI summary statistics, 7-9
FDDI system error statistics, 7-11
FDDI traffic statistics, 7-10
FDDI transmit error statistics, 7-11
circuit alerts, 5-2
filtering events, 5-3
configuration files, initial, 1-2
flash memory card, 1-2
conventions, text, xviii
frames, browser, 2-2
customizing HTTP Server parameters, 9-1
FTP statistics, 6-4
D
G
documentation, link to online, 4-1
GAME, 2-1
getting Help, 4-1
303552-A Rev 00
Index-1
H
M
hardware summary information, 4-5
Max Cache Age (seconds) parameter, A-4
Help, getting, 4-1
Max Cache Count parameter, A-3
HSSI port statistics, 7-12
HSSI receive error statistics, 7-13
O
HSSI system error statistics, 7-14
online documentation link, 4-1
HSSI traffic statistics, 7-13
HSSI transmit error statistics, 7-14
HTTP counter summary statistics, 6-12
HTTP request statistics, 6-13
HTTP response statistics, 6-14
HTTP Server
concepts, 2-1
customizing, 9-1
starting, 1-1
statistics, 6-10
I
ICMP statistics, IP, 8-8
install.bat script, 1-2
IP ARP cache statistics, 8-7
P
parameters, Site Manager, A-1
Port parameter, A-3
port statistics, 7-1
port, troubleshooting, 7-2, 8-2
product support, xxi
PROM summary information, 4-6
publications, Bay Networks, xx
Q
Quick-Start procedure, 1-2
R
IP ICMP statistics, 8-8
IP interface statistics, 8-5
resource summary information, 4-8
IP RIP statistics, 8-8
RIP interface statistics, IPX, 8-16
IP route statistics, 8-6
RIP statistics, IP, 8-8
IP statistics, 8-2
IP summary statistics, 8-3
S
IP traffic statistics, 8-4
severity levels, events, 5-4
IPX forwarding statistics, 8-14
Site Manager
parameter descriptions, A-1
Statistics Manager, B-1
using to start the HTTP Server, 1-4
IPX host statistics, 8-14
IPX interface statistics, 8-13
IPX RIP interface statistics, 8-16
IPX route statistics, 8-15
IPX SAP statistics, 8-16
IPX service statistics, 8-15
IPX statistics, 8-11
IPX summary statistics, 8-12
SNMP community statistics, 6-8
SNMP counter statistics, 6-8
SNMP entity trap statistics, 6-9
SNMP exception statistics, 6-10
SNMP statistics, 6-7
software image summary information, 4-7
IPX traffic statistics, 8-13
Index-2
303552-A Rev 00
starting HTTP Server, 1-1
statistics
AppleTalk, 8-17
AppleTalk ARP cache, 8-19
AppleTalk interface, 8-18
AppleTalk traffic, 8-18
AppleTalk zone, 8-20
BootP, 6-5
BootP client, 6-6
BootP interface, 6-5
BootP preferred server, 6-6
BootP relay agent, 6-7
BootP traffic, 6-5
Ethernet port, 7-3
Ethernet receive error, 7-5
Ethernet summary, 7-4
Ethernet traffic, 7-4
Ethernet transmit error, 7-5
FDDI port, 7-9
FDDI receive error, 7-10
FDDI summary, 7-9
FDDI system error, 7-11
FDDI traffic, 7-10
FDDI transmit error, 7-11
FTP, 6-4
HSSI port, 7-12
HSSI receive error, 7-13
HSSI system error, 7-14
HSSI traffic, 7-13
HSSI transmit error, 7-14
HTTP, 6-10
HTTP counter, 6-12
HTTP request, 6-13
HTTP response, 6-14
HTTP server configuration, 6-11
IP, 8-2
IP ARP cache, 8-7
IP ICMP, 8-8
IP interface, 8-5
IP RIP, 8-8
IP route, 8-6
IP summary, 8-3
IP traffic, 8-4
IPX, 8-11
IPX forwarding, 8-14
IPX host, 8-14
IPX interface, 8-13
IPX RIP interface, 8-16
303552-A Rev 00
IPX route, 8-15
IPX SAP, 8-16
IPX service, 8-15
IPX summary, 8-12
IPX traffic, 8-13
port, 7-1
SNMP, 6-7
SNMP community, 6-8
SNMP counter, 6-8
SNMP entity trap, 6-9
SNMP exception, 6-10
synchronous port, 7-6
synchronous receive error, 7-7
synchronous system error, 7-8
synchronous traffic, 7-7
synchronous transmit error, 7-8
TCP, 6-3
Telnet, 6-4
TFTP, 6-2
token ring port, 7-15
token ring receive error, 7-16
token ring summary, 7-15
token ring traffic, 7-16
token ring transmit error, 7-17
viewing, 6-1
Statistics Manager, B-1
summary information
hardware, 4-5
PROM, 4-6
resource, 4-8
software image, 4-7
system task, 4-9
support, Bay Networks, xxi
synchronous port statistics, 7-6
synchronous receive error statistics, 7-7
synchronous system error statistics, 7-8
synchronous traffic statistics, 7-7
synchronous transmit error statistics, 7-8
system resource summary information, 4-8
system task summary information, 4-9
Index-3
T
task summary information, 4-9
TCP statistics, 6-3
technical publications, xx
technical support, xxi
Telnet statistics, 6-4
text conventions, xviii
TFTP statistics, 6-2
token ring port statistics, 7-15
token ring receive error statistics, 7-16
token ring summary statistics, 7-15
token ring traffic statistics, 7-16
token ring transmit error statistics, 7-17
troubleshooting a port, 7-2, 8-2
Z
zones, AppleTalk statistics, 8-20
Index-4
303552-A Rev 00