1
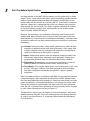
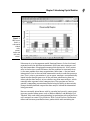
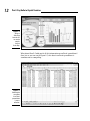
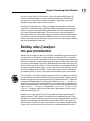
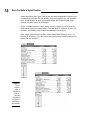
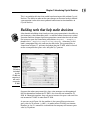
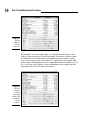
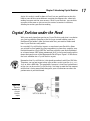
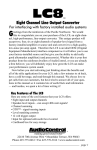
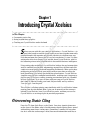
Chapter 1
AL
Introducing Crystal Xcelsius
In This Chapter
RI
䊳 Overcoming static cling
MA
䊳 Checking out Crystal Xcelsius under the hood
TE
䊳 Seeing beyond fancy graphics
S
TE
D
o here you are with this new software application — Crystal Xcelsius — in
your hand, ready to read this book, hoping to see how to make some really
cool dashboards that organize and present your data in a brilliant new way.
Little do you know that you are on the cusp of a revolution. It’s true! I sit here
writing one of the first chapters ever written about Crystal Xcelsius, which is
fast becoming a force to be reckoned with in the world of business intelligence.
CO
PY
RI
GH
Using cutting-edge technology, Crystal Xcelsius bridges the gap between data
analysis and data presentation, empowering anyone who can point and click
a mouse to create professional and compelling dashboards. Gone are the days
of deferring to the local Excel guru to help analyze your data or calling the
local PowerPoint guru to help you build your presentations. Crystal Xcelsius
simplifies even the most complex functionalities, enabling even a beginner to
play the part of the guru, creating stunning presentations with just a handful
of basic techniques. So as you sit there with your copy of Crystal Xcelsius,
don’t look so worried. Steady your hand, lift your head, and say with me,
“I am the guru. I am the guru!”
This chapter is all about gaining some familiarity with Crystal Xcelsius before
creating your first dashboard. Here, I give you an overview of the concepts
behind Crystal Xcelsius, how Crystal Xcelsius works, and how you can use
Crystal Xcelsius as an integral part of your daily operations.
Overcoming Static Cling
I love the TV show Little House on the Prairie. One of my favorite characters
on the show is Doc Baker, who is the old country doctor fighting illness armed
with nothing more than a stethoscope. (Sometimes I wonder just how effective he is with that stethoscope. I mean, how much information could he, or
8
Part I: Say Hello to Crystal Xcelsius
any other doctor in the 1880’s for that matter, possibly gather with a stethoscope?) That’s a long stretch from today, where technology provides doctors
with an unprecedented amount of data with dynamic visualizations of the
human body that are interactive, real-time, and 3-D. Visualization transforms
data into a form that is comprehensible to the eye, allowing you to analyze
data through the sense of sight. This allows surgeons and medical students
to see the breathing patterns of an asthma patient or the beating human
heart in rhythm with an EKG output.
However, these advances in visualization technology aren’t limited to the
medical field. Many industries have striven to move away from static data
environments by using interactive visualization technologies. Consider some
of the other industries that have taken advantage of interactive visualization
technology:
⻬ Aviation: In the early 1900s, pilots would spend the first weeks of flight
training in a rocking fuselage with mock instruments. Pilots today train
in flight simulators that use animation and interactive visualization to
replicate a wide array of atmospheric scenarios.
⻬ Sports: Professional athletes have the benefit of computer models that
interactively capture their movements with animation, helping them
pinpoint their problem areas and maximize their kinetic potential.
⻬ Meteorology: Meteorologists use interactive visualization systems to
model the effects of wind force from storms and hurricanes.
⻬ Toy industry: Even popular board games that are inherently visual, such
as chess, Monopoly, and Risk, have been augmented with technology
that offers imaginative animations that enhance a player’s gaming
experience.
What’s the point of all this visualization talk? Well, the question that you and
I should be asking is what happened to the business world? Although tools
like Excel and PowerPoint have brought us a long way from the days of using
paper spreadsheets and overhead projectors, by no means have they come
close to the interactive visualizations that other industries have benefited
from. We still sit through hours and hours of boring meetings where we point
to static charts like one you see here in Figure 1-1.
The question is, why are we still clinging to static technologies? Why hasn’t
anyone moved us forward? This is the same question that Santiago Becerra,
Sr., and his son Santi Becerra, Jr., asked each other before they developed
Crystal Xcelsius.
Chapter 1: Introducing Crystal Xcelsius
Figure 1-1:
Why are we
stuck in a
static world
of drab
static
spreadsheets and
dull static
charts?
Like many of us in the corporate world, Santiago Becerra, Sr. has first-hand
experience with the dull data environments that leave many managers and
key decision-makers ill-equipped to manage their businesses. In his various
roles in the business world, he knows that the problem he constantly faces
is the same problem that many organizations suffer from — that too much
information is lost in the transition between data analysis and data presentation. That is, after a presentation is put on paper, managers are automatically
boxed into the thought processes of the presenter, often forcing them to
either take the data analysis at face value or to ask for more analyses, which
naturally takes up more critical company time. The question was how to
provide a compelling presentation without losing the ability to interactively
change the direction and scope of the data analysis behind the information
being presented.
Becerra eventually joined forces with his son who had spent his career creating many popular video games such as Midtown Madness and Midnight Club.
Together, they used video game technology in conjunction with practical business concepts to create Crystal Xcelsius. With Crystal Xcelsius, the Becerra
father-and-son team provided business professionals with something few
9
10
Part I: Say Hello to Crystal Xcelsius
have had access to in the past: affordable, interactive visualization of business data that could be delivered in easy-to-create dynamic presentations.
For the first time, managers could bridge the gap between data analysis
and data presentation without the need for expensive enterprise solutions.
Figure 1-2 illustrates this bridge.
Figure 1-2:
Crystal
Xcelsius
bridges the
gap between
data analysis and data
presentation,
converting
dull spreadsheet tables
into interactive
dashboards.
More Than Just Fancy Graphics: The
Benefits of Using Crystal Xcelsius
I’ve actually met people who use Crystal Xcelsius simply for the slick look
and feel of the graphics. Face it: Many of us were initially attracted to Crystal
Xcelsius because of the sleek graphical components, such as the gauges
shown here in Figure 1-3.
And there is nothing wrong with that at all. The truth is that when many
people see the slick and easy-to-use components in Crystal Xcelsius, they
tend to lift some of the restrictions they have subconsciously placed on their
presentations. For example, before Crystal Xcelsius, I would never even have
thought about creating the gauge-based dashboard shown in Figure 1-3 because
I didn’t know how to create one in Excel or PowerPoint. Indeed, the stunning
graphics alone undoubtedly fosters ideas about new and exciting ways you
can present your data.
Chapter 1: Introducing Crystal Xcelsius
Figure 1-3:
Many
people
use Crystal
Xcelsius
for the
sleek, fluid
graphics.
Although you can easily get lost in the stunning graphics, remember that
Crystal Xcelsius is a versatile tool that allows you to do more than just
create fancy-looking presentations. Take a look at some of the other things
that you can accomplish with Crystal Xcelsius that you might not have
thought about.
Creating more robust presentations with
interactive summary and detail layers
I exported a sample dashboard into a PowerPoint file called Chapter1 Example_A, which you can find at the companion Web site for this book.
To follow along with the demonstration in this section, go to this book’s
companion Web site. (The exact address appears in the Introduction.)
Open the Chapter1 - Example_A PowerPoint presentation, found in the
C:\Xcelsius Sample Files\Chapter 1 directory, and run the slide
show. Figure 1-4 shows the interactive dashboard that you see in the slide
show. The idea is to select a Sales Rep from the list to see the key metrics
for that Sales Rep.
To run the slide show in PowerPoint, go to the menu and choose Slide Show➪
View Show. I show you how to export Crystal Xcelsius dashboards into
PowerPoint in Chapter 12.
What is the point of this demonstration? Think about how much data is contained in this one-megabyte presentation. For 14 Sales Reps, you are showing
the metrics around each rep’s actual revenue, budget target, and revenue forecast. Not for 1 month, mind you, but for 12 months! Consider how many slides
it would take to present something similar to this dashboard in a standard
slide show. You can imagine that this would take, at a minimum, 14 slides to
produce similar results — with less appealing graphics.
11
12
Part I: Say Hello to Crystal Xcelsius
Figure 1-4:
Select a
Sales Rep
from the list
to see the
metrics
for that
Sales Rep.
What about Excel? Could you fit all this information on an Excel spreadsheet?
Sure, but as you can see in Figure 1-5, this data in an Excel spreadsheet is
somehow not as compelling.
Figure 1-5:
Showing the
same data
in an Excel
spreadsheet
is not as
effective.
Chapter 1: Introducing Crystal Xcelsius
You can see that with Crystal Xcelsius, you can create multiple layers of
summary and detail data in visually appealing dashboards. And because
the average Crystal Xcelsius output is around 1.5 megabytes, you won’t
inundate clients with unnecessarily large files.
Because of Crystal Xcelsius’s ability to produce presentations in relatively
small files, you’ll likely notice something different happening in your presentations. I bet you start consolidating information that you would normally
parse into separate presentations. This not only gives your dashboards a
more robust feel, but it also allows you to present lots of data without breaking the flow of your presentation. In addition, because you can easily build
interactivity into your presentations, you won’t have to worry about showing
too much information at one time.
Building what-if analyses
into your presentations
We all have an analytical side to us that feels compelled to question and analyze what we see. Everyone is a data analyst on some level. This is usually a
good thing, but it can be a nightmare if you’re the one giving a presentation to a
roomful of inquisitive people playing the role of analyst. How many times have
you given a presentation, only to be challenged with questions about the variables that you use in the analysis? In these situations, you probably do one of
two things: fumble through papers as you try to answer the question, or turn
to the ever-embarrassing standby, “I’ll get back to you on that,” followed by
an awkward pause as you try to get back into the flow of your presentation.
Crystal Xcelsius can help you better prepare for these situations by enabling
you to build what-if analyses directly into your presentation, allowing you to
literally change your presentation on the fly. To demonstrate this, I exported
a sample dashboard into a PowerPoint file called Chapter1 - Example_B,
which you can find at the companion Web site for this book. To follow along
with the demonstration in this section, go to this book’s companion Web site.
Open Chapter1 - Example_B, found in the C:\Xcelsius Sample Files\
Chapter 1 directory, and run the slide show. Upon opening, you’ll see the
table shown in Figure 1-6.
Imagine that it’s the end of FY (fiscal year) 2004 and you’re presenting the
budget plan for FY 2005, which is based on the assumption that gross sales
will grow by 7 percent. When you present this plan, a few managers are disappointed at the fact that the planned net income for FY 2005 is less than the
net income for FY 2004, so they ask you what the net income would look like
if gross sales grew at a rate of 12 percent. In a standard presentation, this is
13
14
Part I: Say Hello to Crystal Xcelsius
where everything falls apart. Even if you are some mathematical genius who
could quickly calculate the net income at the new growth rate, you wouldn’t
have visual backup for your explanation of how the change would ripple
through the other parts of the budget.
In this situation however, I don’t worry because I used Crystal Xcelsius to
build myself a little insurance policy. Click the What If button to reveal a set
of sliders that allow you to change the makeup of the analysis.
Now simply slide the vertical Gross Sales Growth Rate slider up to 12%, as
illustrated in Figure 1-6. At this point, your presentation actually changes to
reflect the new analysis!
Figure 1-6:
Crystal
Xcelsius
makes it
possible to
make onthe-spot
changes to
the analysis
behind your
presentation.
Chapter 1: Introducing Crystal Xcelsius
This is an unbelievable feat that would have been impossible without Crystal
Xcelsius. The ability to make on-the-spot changes to the actual analysis behind
a presentation is one of the most powerful and attractive functionalities of
Crystal Xcelsius.
Building tools that help make decisions
A key benefit to building what-if analyses into your presentation is the ability to
give managers a decision-making tool — a tool that allows them to test several
scenarios and then choose the most appropriate scenario for the task at hand.
For instance, open the PowerPoint presentation Chapter1 – Example C,
found in the C:\Xcelsius Sample Files\Chapter 1 directory (at this
book’s companion Web site), and run the slide show. This presentation, as
shown here in Figure 1-7, presents the budget plan for FY 2005, which is based
on the assumption that gross sales will grow by 7 percent.
Figure 1-7:
Presenting
the budget
plan for
FY 2005 and
comparing it
with actual
revenue for
FY 2004.
Suppose that when you present this plan, a few managers are disappointed
that the planned net income for FY 2005 is less than the net income for FY
2004. In a knee-jerk reaction, they ask you to increase the gross sales until the
net income for FY 2005 is more than FY 2004.
As you can see in Figure 1-8, the problem is that you will have to increase
gross sales by 59 percent — yikes! — in order to beat FY 2004’s net income.
Needless to say, it is unrealistic to think that the company will increase gross
sales by 59 percent.
15
16
Part I: Say Hello to Crystal Xcelsius
Figure 1-8:
Use the
sliders to
present
scenarios.
The solution is to use the other sliders, in conjunction with the gross sales
slider, as levers to increase FY 2005 net income. You can test various scenarios to find one that is both realistic and conducive to your analysis. In this
case, you can set your gross sales rate to 7%, reduce the Cost of Goods Sold
to 42%, reduce Selling Expenses to 15%, and reduce General & Admin Costs to
18%. As you can see in Figure 1-9, this combination of sales growth and cost
reduction helps to beat FY 2004’s net income.
Figure 1-9:
Test scenarios to
find one
that is both
realistic and
conducive
to your
analysis.
Chapter 1: Introducing Crystal Xcelsius
Again, this analysis could be done in Excel, but you would have to take this
back to your desk to create different scenarios on different tabs, effectively
making everyone wait for your answers. With Crystal Xcelsius, you can have
everyone in the room as you test out the various scenarios in real-time,
allowing for on-the-spot decision making.
Crystal Xcelsius under the Hood
With your newly found perspective on Crystal Xcelsius and what it can do for
you, you’re probably chomping at the bit to get started building your first
dashboard. But before I show you how to do that, you need to understand
how Crystal Xcelsius really works.
In a nutshell, Crystal Xcelsius imports a snapshot of your Excel file, allows
you to build a visual model by tying components to your data, compiles your
final dashboard to a Flash SWF file, and then publishes your final dashboard
to a chosen format. SWF (often pronounced swiff) is the vector-based graphics
format designed to run in the Macromedia Flash Player. Figure 1-10 illustrates
the basic workflow for a Crystal Xcelsius report.
Remember that Crystal Xcelsius is designed to work only with Excel XLS files.
Therefore, you can not import other types of files such as text files (txt, csv,
dbf) or Access MDB files. The good news, however, is that Excel spreadsheets
of any size can be used in Crystal Xcelsius. Just keep in mind that the amount
of data that is being moved and changed in your visualization can affect the
performance of your dashboard.
Figure 1-10:
The basic
workflow for
a Crystal
Xcelsius
report.
17
18
Part I: Say Hello to Crystal Xcelsius
When you install Crystal Xcelsius, it gives you the option to install the
Macromedia Flash Plugin/Player. If you have not elected to install this and
if you do not already have Macromedia Flash Player installed on your computer, you will not be able to use Crystal Xcelsius properly. However, you
can easily get Macromedia Flash Player by downloading it free from www.
macromedia.com.
As mentioned before, the three versions of Crystal Xcelsius are
⻬ Standard: The Standard version is designed for those who are looking to
get started with interactive visual analytics. It provides the basic features of Crystal Xcelsius.
⻬ Professional: The Professional version is designed for large organizations that require dashboards that contain many layers of information.
⻬ Workgroup: The Workgroup version is designed for environments where
connections to live data are essential.
The components that are available to you depend on the version of Crystal
Xcelsius you are using.
Importing data
All Crystal Xcelsius dashboards start with an Excel spreadsheet that typically
contains data that has already gone through some analysis, massaging, and
shaping. Crystal Xcelsius takes a snapshot of the Excel spreadsheet and
imports that snapshot into memory. After the data is in memory, Crystal
Xcelsius disconnects from the Excel spreadsheet.
This method of separating the data from the actual spreadsheet ensures two
things. First, your final dashboard is a standalone object, independent of the
location or status of the original spreadsheet. Second, it ensures that the size
of your final dashboard is as small as possible, making for easy distribution.
Problems getting Crystal Xcelsius up and running?
There are three versions of Crystal Xcelsius:
Standard, Professional, and Workgroup. No
matter which version you have, getting Crystal
Xcelsius up and running is a relatively intuitive
process. However, if you find yourself having
trouble getting started, help is at hand.
The Crystal Xcelsius team has a support desk
that is willing to help you with any issues you
may have. You can contact them by phone at 858552-6674, or by e-mail at crystalxcelsius
[email protected].
Chapter 1: Introducing Crystal Xcelsius
Building the visual model
After the data you’re using is in memory, you can start building your visual
model. The visual model is essentially your dashboard in design mode. Much
like a PowerPoint slide, your visual model starts off as a blank canvas on
which you can add components. Components are those things that give your
dashboard its utility and purpose: charts, gauges, menus, tables, and so on.
The idea is to add individual components to your visual model, tying each
component to the data that you import.
Compiling and publishing the dashboard
After you’re happy with the functionality and look of your visual model,
Crystal Xcelsius is ready to compile it.
First, Crystal Xcelsius compiles your visual model to a SWF file format.
Compiling to a SWF file format ensures that your final dashboard plays back
smoothly on any screen size and across multiple platforms. In addition, this
ensures that your dashboard file size is small so as to not inundate your
users with gigantic 40MB files.
After your visual model has been compiled to a SWF file, it is then published
to a format of your choice. You can choose to publish your dashboard to
PowerPoint, Outlook, an HTML Web page, an Adobe Acrobat PDF file, or a
Macromedia Flash file. At this point, your dashboard is ready to share!
19
20
Part I: Say Hello to Crystal Xcelsius