1
Users Guide
InfoMaker®
11.5
DOCUMENT ID: DC37789-01-1150-01
LAST REVISED: September 2008
Copyright © 2008 by Sybase, Inc. All rights reserved.
This publication pertains to Sybase software and to any subsequent release until otherwise indicated in new editions or technical notes.
Information in this document is subject to change without notice. The software described herein is furnished under a license agreement,
and it may be used or copied only in accordance with the terms of that agreement.
To order additional documents, U.S. and Canadian customers should call Customer Fulfillment at (800) 685-8225, fax (617) 229-9845.
Customers in other countries with a U.S. license agreement may contact Customer Fulfillment via the above fax number. All other
international customers should contact their Sybase subsidiary or local distributor. Upgrades are provided only at regularly scheduled
software release dates. No part of this publication may be reproduced, transmitted, or translated in any form or by any means, electronic,
mechanical, manual, optical, or otherwise, without the prior written permission of Sybase, Inc.
Sybase trademarks can be viewed at the Sybase trademarks page at http://www.sybase.com/detail?id=1011207. Sybase and the marks listed
are trademarks of Sybase, Inc. ® indicates registration in the United States of America.
Java and all Java-based marks are trademarks or registered trademarks of Sun Microsystems, Inc. in the U.S. and other countries.
Unicode and the Unicode Logo are registered trademarks of Unicode, Inc.
All other company and product names mentioned may be trademarks of the respective companies with which they are associated.
Use, duplication, or disclosure by the government is subject to the restrictions set forth in subparagraph (c)(1)(ii) of DFARS 52.227-7013
for the DOD and as set forth in FAR 52.227-19(a)-(d) for civilian agencies.
Sybase, Inc., One Sybase Drive, Dublin, CA 94568.
Contents
About This Book ......................................................................................................................... xxi
PART 1
THE INFOMAKER ENVIRONMENT
CHAPTER 1
Working with InfoMaker.................................................................. 3
About InfoMaker ............................................................................... 4
What you can do using InfoMaker.................................................... 5
Reports ...................................................................................... 5
Queries ...................................................................................... 8
Forms ........................................................................................ 9
Data pipelines.......................................................................... 10
Applications ............................................................................. 11
Database management ........................................................... 11
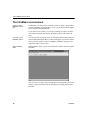
The InfoMaker environment ........................................................... 12
About the PowerBar ................................................................ 13
About wizards .......................................................................... 14
Working with libraries ..................................................................... 14
Setting the current library ........................................................ 14
Working with objects ...................................................................... 16
Creating new objects ............................................................... 16
Opening existing objects ......................................................... 17
Running or previewing objects ................................................ 18
Working in painters ........................................................................ 18
Opening painters ..................................................................... 19
Painter summary ..................................................................... 19
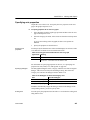
Using views in painters............................................................ 19
Displaying the view’s title bar .................................................. 20
Moving and resizing panes and views..................................... 21
Floating and docking views ..................................................... 22
Adding and removing views .................................................... 23
Saving a layout ........................................................................ 24
Using pop-up menus ............................................................... 24
Defining colors......................................................................... 25
Users Guide
iii
Contents
Working with tools ..........................................................................
Using property pages .....................................................................
Using toolbars ................................................................................
Toolbar basics .........................................................................
Drop-down toolbars .................................................................
Controlling the display of toolbars ...........................................
Moving toolbars using the mouse............................................
Customizing toolbars...............................................................
Creating new toolbars .............................................................
Using report wizards ......................................................................
Using the To-Do List ......................................................................
Using online Help ...........................................................................
About links from Help to book content.....................................
About the Sybooks CD and Web site ......................................
Windows Help files on Vista ....................................................
Customizing keyboard shortcuts ....................................................
Using the file editor ........................................................................
Setting file editing properties ...................................................
Editing activities.......................................................................
Changing fonts ...............................................................................
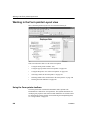
Accessing shared queries stored on a network .............................
Defining libraries for user-defined form styles................................
Using the Query Governor .............................................................
Accessing the Query Governor ...............................................
Using the Query Governor ......................................................
How your InfoMaker environment is managed...............................
About the registry ....................................................................
About the initialization file........................................................
Starting InfoMaker from the command line ....................................
CHAPTER 2
iv
26
27
29
29
29
30
31
31
36
37
38
39
40
40
41
42
44
44
45
46
46
47
48
49
50
51
51
51
53
Working with Libraries .................................................................. 55
About libraries ................................................................................ 55
About InfoMaker libraries and special files..................................... 56
Creating new libraries .................................................................... 57
About the Library painter................................................................ 58
Working with libraries ..................................................................... 59
Displaying libraries and objects............................................... 59
Using the pop-up menu ........................................................... 60
Controlling columns that display in the List view ..................... 60
Selecting objects ..................................................................... 60
Filtering the display of objects ................................................. 61
Filtering the display of libraries and folders ............................. 62
Working in the current library .................................................. 62
Changing the current library .................................................... 62
InfoMaker
Contents
Opening and previewing objects .............................................
Copying, moving, and deleting objects....................................
Setting the root ........................................................................
Moving back, forward, and up one level..................................
Modifying comments ...............................................................
Deleting libraries......................................................................
Optimizing libraries.........................................................................
Regenerating library entries ...........................................................
Rebuilding libraries..................................................................
Migrating libraries ....................................................................
Creating a library directory report...................................................
63
63
64
65
65
66
67
67
68
69
69
PART 2
WORKING WITH DATABASES
CHAPTER 3
Managing the Database ................................................................ 73
Working with database components .............................................. 73
Managing databases...................................................................... 77
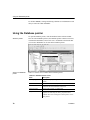
Using the Database painter............................................................ 78
Modifying database preferences ............................................. 81
Logging your work ................................................................... 82
Creating and deleting a SQL Anywhere database ......................... 83
Working with tables ........................................................................ 84
Creating a new table from scratch........................................... 84
Creating a new table from an existing table ............................ 86
Specifying column definitions .................................................. 86
Specifying table and column properties .................................. 87
Altering a table ........................................................................ 90
Cutting, copying, and pasting columns.................................... 92
Closing a table......................................................................... 92
Dropping a table ...................................................................... 93
Viewing pending SQL changes ............................................... 93
Printing the table definition ...................................................... 94
Exporting table syntax ............................................................. 95
About system tables ................................................................ 95
Creating and editing temporary tables .................................... 96
Working with keys .......................................................................... 97
Working with indexes ................................................................... 101
Working with database views....................................................... 103
Manipulating data......................................................................... 108
Retrieving data ...................................................................... 109
Modifying data ....................................................................... 109
Sorting rows .......................................................................... 110
Filtering rows ......................................................................... 112
Users Guide
v
Contents
CHAPTER 4
Viewing row information ........................................................
Importing data .......................................................................
Printing data ..........................................................................
Saving data ...........................................................................
Creating and executing SQL statements .....................................
Building and executing SQL statements ...............................
Customizing the editor...........................................................
Controlling access to the current database..................................
113
113
114
114
115
115
119
119
Working with Data Pipelines.......................................................
About data pipelines.....................................................................
Defining a data pipeline.........................................................
Piping extended attributes.....................................................
Creating a data pipeline ...............................................................
Modifying the data pipeline definition ...........................................
Choosing a pipeline operation...............................................
Dependency of modifications on pipeline operation..............
When execution stops ...........................................................
Piping blob data.....................................................................
Changing the destination and source databases ..................
Correcting pipeline errors .............................................................
Saving a pipeline ..........................................................................
Using an existing pipeline ............................................................
Pipeline examples ........................................................................
121
122
123
124
127
130
130
132
134
136
137
138
139
139
PART 3
REPORTS
CHAPTER 5
Defining Reports..........................................................................
About reports................................................................................
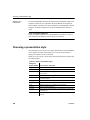
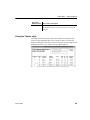
Choosing a presentation style ......................................................
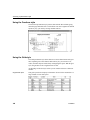
Using the Tabular style..........................................................
Using the Freeform style .......................................................
Using the Grid style ...............................................................
Using the Label style .............................................................
Using the N-Up style .............................................................
Using the Group style............................................................
Using the Composite style.....................................................
Using the Graph and Crosstab styles....................................
Using the OLE 2.0 style.........................................................
Using the RichText style........................................................
Using the TreeView style.......................................................
Building a report ...........................................................................
vi
121
143
143
144
145
146
146
147
148
150
150
151
152
152
153
153
InfoMaker
Contents
CHAPTER 6
Users Guide
Selecting a data source................................................................
Using Quick Select .......................................................................
Selecting a table ....................................................................
Selecting columns .................................................................
Specifying sorting criteria ......................................................
Specifying selection criteria ...................................................
Using SQL Select .........................................................................
Selecting tables and views ....................................................
Selecting columns .................................................................
Displaying the underlying SQL statement .............................
Joining tables ........................................................................
Using retrieval arguments .....................................................
Referencing retrieval arguments ...........................................
Specifying selection, sorting, and grouping criteria ...............
Using Query .................................................................................
Using External..............................................................................
Using Stored Procedure ...............................................................
Choosing report-wide options ......................................................
Generating and saving a report....................................................
About the extended attribute system tables and reports .......
Saving the report ...................................................................
Modifying an existing report ..................................................
Defining queries ...........................................................................
Previewing the query.............................................................
Saving the query ...................................................................
Modifying a query ..................................................................
What's next...................................................................................
154
156
157
158
159
159
165
166
168
169
170
173
174
175
180
180
182
184
185
185
187
187
188
188
189
190
190
Enhancing Reports .....................................................................
Working in the Report painter ......................................................
Understanding the Report painter Design view .....................
Using the Report painter toolbars..........................................
Using the Properties view in the Report painter ....................
Selecting controls in the Report painter ................................
Resizing bands in the Report painter Design view ................
Using zoom in the Report painter..........................................
Undoing changes in the Report painter.................................
Using the Preview view of a report...............................................
Retrieving data ......................................................................
Modifying data .......................................................................
Importing data into a report ...................................................
Using print preview ................................................................
Printing data ..........................................................................
Working in a grid report .........................................................
191
192
194
196
197
197
199
199
199
200
200
202
203
204
206
207
vii
Contents
CHAPTER 7
viii
Saving data in an external file ......................................................
Saving the data as PDF ........................................................
Saving the data in HTML Table format..................................
Working with PSR files ..........................................................
Modifying general report properties .............................................
Changing the report style ......................................................
Setting colors in a report .......................................................
Setting gradients and background pictures in a report..........
Setting transparency properties for a report..........................
Specifying properties of a grid report ....................................
Specifying pointers for a report .............................................
Defining print specifications for a report ................................
Modifying text in a report .......................................................
Naming controls in a report ...................................................
Using borders in a report.......................................................
Specifying variable-height bands in a report .........................
Modifying the data source of a report....................................
Storing data in a report using the Data view ................................
What happens at runtime ......................................................
Retrieving data .............................................................................
Prompting for retrieval criteria in a report ..............................
Retrieving rows as needed....................................................
Saving retrieved rows to disk ................................................
208
209
213
214
216
216
217
218
219
219
220
221
225
226
226
227
228
230
231
232
232
233
234
Working with Controls in Reports..............................................
Adding controls to a report ...........................................................
Adding columns to a report ...................................................
Adding text to a report ...........................................................
Adding drawing controls to a report.......................................
Adding a group box to a report..............................................
Adding pictures to a report ....................................................
Adding computed fields to a report........................................
Adding buttons to a report .....................................................
Adding graphs to a report......................................................
Adding InkPicture controls to a report ...................................
Adding OLE controls to a report ............................................
Adding reports to a report......................................................
Adding tooltips to a DataWindow control...............................
Reorganizing controls in a report .................................................
Displaying boundaries for controls in a report .......................
Using the grid and the ruler in a report..................................
Deleting controls in a report ..................................................
Moving controls in a report ....................................................
Copying controls in a report ..................................................
235
235
236
237
238
238
239
243
245
245
245
246
246
246
246
247
247
248
248
235
InfoMaker
Contents
CHAPTER 8
Users Guide
Resizing controls in a report ..................................................
Aligning controls in a report ...................................................
Equalizing the space between controls in a report ................
Equalizing the size of controls in a report..............................
Sliding controls to remove blank space in a report................
Positioning controls in a report .....................................................
Rotating controls in a report .........................................................
249
249
250
250
251
252
253
Displaying and Validating Data .................................................
About displaying and validating data............................................
Presenting the data ...............................................................
Validating data.......................................................................
About display formats...................................................................
Working with display formats .......................................................
Working with display formats in the Database painter ..........
Working with display formats in the Report painter and
Form painter ...................................................................
Defining display formats...............................................................
Number display formats ........................................................
String display formats ............................................................
Date display formats..............................................................
Time display formats .............................................................
About edit styles...........................................................................
Working with edit styles................................................................
Working with edit styles in the Database painter...................
Working with edit styles in the Form or Report painter..........
Defining edit styles .......................................................................
The Edit edit style ..................................................................
The DropDownListBox edit style ...........................................
The CheckBox edit style........................................................
The RadioButtons edit style ..................................................
The EditMask edit style .........................................................
The DropDownDataWindow edit style...................................
The RichText edit style ..........................................................
The InkEdit edit style .............................................................
Defining a code table ...................................................................
How code tables are implemented ........................................
How code tables are processed ............................................
Validating user input ..............................................................
About validation rules...................................................................
Understanding validation rules ..............................................
Working with validation rules........................................................
Defining validation rules ...............................................................
Defining a validation rule in the Database painter.................
257
257
258
259
259
260
261
262
263
265
267
267
269
270
272
272
274
274
274
275
276
277
278
281
283
283
284
284
286
286
287
288
288
289
289
ix
Contents
Defining a validation rule in the Form painter........................ 292
How to maintain extended attributes ............................................ 294
CHAPTER 9
CHAPTER 10
x
Filtering, Sorting, and Grouping Rows......................................
Filtering rows................................................................................
Sorting rows .................................................................................
Suppressing repeating values ...............................................
Grouping rows..............................................................................
Using the Group presentation style .......................................
Defining groups in an existing report.....................................
297
299
301
302
304
307
297
Highlighting Information in Reports and Forms.......................
Highlighting information................................................................
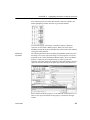
Modifying properties when designing ....................................
Modifying properties at runtime .............................................
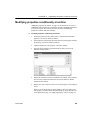
Modifying properties conditionally at runtime ...............................
Example 1: creating a gray bar effect....................................
Example 2: rotating controls..................................................
Example 3: highlighting rows of data.....................................
Example 4: changing the size and location of controls .........
Supplying property values............................................................
Background.Color..................................................................
Border....................................................................................
Brush.Color ...........................................................................
Brush.Hatch...........................................................................
Color......................................................................................
Font.Escapement (for rotating controls) ................................
Font.Height............................................................................
Font.Italic...............................................................................
Font.Strikethrough.................................................................
Font.Underline.......................................................................
Font.Weight ...........................................................................
Format ...................................................................................
Height ....................................................................................
Pen.Color ..............................................................................
Pen.Style ...............................................................................
Pen.Width..............................................................................
Pointer ...................................................................................
Protect ...................................................................................
Timer_Interval .......................................................................
Visible....................................................................................
Width .....................................................................................
X ............................................................................................
315
315
316
319
320
321
322
324
325
327
327
329
329
330
331
332
333
334
335
335
336
336
337
337
339
339
340
340
340
341
341
315
InfoMaker
Contents
CHAPTER 11
CHAPTER 12
Users Guide
X1, X2....................................................................................
Y ............................................................................................
Y1, Y2....................................................................................
Specifying colors ..........................................................................
342
342
343
343
Using Nested Reports ................................................................
About nested reports....................................................................
Creating a report using the Composite presentation style ...........
Placing a nested report in another report.....................................
Placing a related nested report in another report ..................
Placing an unrelated nested report in another report ............
Working with nested reports.........................................................
Adjusting nested report width and height ..............................
Changing a nested report from one report to another ...........
Modifying the definition of a nested report ............................
Adding another nested report to a composite report .............
Supplying retrieval arguments to relate a nested report to
its base report.................................................................
Specifying criteria to relate a nested report to its base
report ..............................................................................
Using options for nested reports ...........................................
345
345
349
351
351
354
354
355
356
356
357
Exporting and Importing XML Data ...........................................
About XML ...................................................................................
Valid and well-formed XML documents.................................
XML syntax............................................................................
XML parsing ..........................................................................
XML support in the Report painter ...............................................
The Export/Import Template view for XML...................................
Creating templates ................................................................
Saving templates...................................................................
Header and Detail sections ...................................................
Editing XML templates .................................................................
XML declaration ....................................................................
Document type declaration....................................................
Root element .........................................................................
Controls .................................................................................
InfoMaker expressions ..........................................................
Attributes ...............................................................................
Composite and nested reports ..............................................
CDATA sections ....................................................................
Comments .............................................................................
Processing instructions .........................................................
363
363
364
365
366
367
368
370
371
371
374
375
376
377
377
378
378
379
381
381
382
357
359
360
xi
Contents
Exporting to XML..........................................................................
Setting data export properties ...............................................
Importing XML ..............................................................................
Importing with a template ......................................................
Default data import ................................................................
Tracing import .......................................................................
382
383
391
391
395
399
CHAPTER 13
Working with Graphs................................................................... 401
About graphs................................................................................ 401
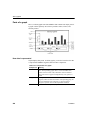
Parts of a graph..................................................................... 402
Types of graphs..................................................................... 404
Using graphs in reports ................................................................ 408
Placing a graph in a report .................................................... 409
Using the graph's Properties view ......................................... 410
Changing a graph's position and size.................................... 410
Associating data with a graph ............................................... 412
Using the Graph presentation style .............................................. 420
Defining a graph's properties ....................................................... 421
Using the General page in the graph's Properties view ........ 421
Sorting data for series and categories................................... 423
Specifying text properties for titles, labels, axes, and
legends ........................................................................... 423
Specifying overlap and spacing............................................. 426
Specifying axis properties ..................................................... 427
Specifying a pointer............................................................... 429
CHAPTER 14
Working with Crosstabs..............................................................
About crosstabs ...........................................................................
Two types of crosstabs..........................................................
Creating crosstabs .......................................................................
Associating data with a crosstab ..................................................
Specifying the information .....................................................
Viewing the crosstab .............................................................
Specifying more than one row or column ..............................
Previewing crosstabs ...................................................................
Enhancing crosstabs....................................................................
Specifying basic properties ...................................................
Modifying the data associated with the crosstab...................
Changing the names used for the columns and rows ...........
Defining summary statistics...................................................
Cross-tabulating ranges of values.........................................
Creating static crosstabs .......................................................
Using property conditional expressions.................................
xii
431
431
433
434
436
436
439
441
442
442
443
444
444
445
448
451
452
InfoMaker
Contents
CHAPTER 15
Working with TreeViews.............................................................
TreeView presentation style .........................................................
Creating a new TreeView report ..................................................
TreeView creation process ....................................................
Creating a TreeView report ...................................................
Adding and deleting TreeView levels ...........................................
Selecting a tree node and navigating the tree..............................
Sorting rows in a TreeView report ................................................
TreeView report Design view .......................................................
Setting properties for the TreeView report ...................................
Setting general TreeView properties .....................................
Setting TreeView level properties..........................................
Setting detail band properties................................................
455
455
456
457
457
461
462
463
464
465
466
467
469
CHAPTER 16
Working with Rich Text ..............................................................
About rich text ..............................................................................
Using the RichText presentation style..........................................
Creating the report ................................................................
Formatting for RichText objects within the report ..................
Previewing and printing .........................................................
Formatting keys and toolbars.......................................................
471
471
472
473
476
481
482
CHAPTER 17
Using OLE in a Report ................................................................
About using OLE in reports ..........................................................
OLE objects and the OLE presentation style ...............................
Adding an OLE object to a report ..........................................
Using the OLE presentation style..........................................
Defining the OLE object ........................................................
Specifying data for the OLE object........................................
Previewing the report ............................................................
Activating and editing the OLE object ...................................
Changing the object in the control.........................................
Using OLE columns in a report ....................................................
Creating an OLE column .......................................................
485
485
487
488
489
490
492
496
496
497
498
498
PART 4
FORMS
CHAPTER 18
Defining Forms............................................................................
About forms..................................................................................
Creating new forms ...............................................................
Freeform forms......................................................................
Grid forms..............................................................................
Users Guide
505
505
507
509
510
xiii
Contents
CHAPTER 19
CHAPTER 20
xiv
Master/Detail One-To-Many forms ........................................
Master/Detail Many-To-One forms ........................................
Creating and saving forms ...........................................................
Creating basic forms .............................................................
Creating a master/detail form ................................................
Defining data so that a form can update a database.............
Generating and saving forms ................................................
Working with forms.......................................................................
Running forms .......................................................................
Limiting the retrieved data .....................................................
Importing data into a form .....................................................
Saving data in an external file ...............................................
Printing forms ........................................................................
Actions in forms.....................................................................
Accessing and deleting forms ...............................................
511
513
514
514
516
520
521
523
523
524
525
526
527
527
530
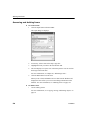
Controlling Updates in Forms ....................................................
About controlling updates.............................................................
What you can do ...................................................................
Specifying the table to update ......................................................
Specifying the unique key columns ..............................................
Specifying an identity column.......................................................
Specifying updatable columns .....................................................
Specifying the WHERE clause for update/delete.........................
Specifying update when key is modified ......................................
531
532
533
533
534
534
535
537
Enhancing Forms ........................................................................
About enhancing forms ................................................................
Working in the Form painter Layout view .....................................
Using the Form painter toolbars ............................................
Using the pop-up menus in the Form painter ........................
Using the Properties view in the Form painter ......................
Selecting controls in the Form painter...................................
Defining default colors and borders in the Form painter .......
Printing the form definition.....................................................
Reorganizing controls in the form ................................................
Using the grid in the Form painter .........................................
Deleting controls in the Form painter ....................................
Moving controls in the Form painter ......................................
Copying and pasting controls in the Form painter.................
Resizing controls in the Form painter....................................
Aligning controls in the Form painter.....................................
Equalizing the space between controls in the Form painter..
539
540
540
542
542
543
544
546
546
546
547
547
548
549
549
550
531
539
InfoMaker
Contents
Equalizing the size of controls in the Form painter................
Undoing changes in the Form painter ...................................
Sliding controls in a form .......................................................
Modifying general form properties................................................
Specifying a title for a form ....................................................
Setting colors for a form ........................................................
Specifying the display of scrollbars for a form .......................
Specifying pointers for a form................................................
Modifying text in a form .........................................................
Defining the tab order in a form.............................................
Using borders in a form .........................................................
Prompting for retrieval criteria in a form ................................
Modifying the data source of a form ......................................
Adding controls to the form ..........................................................
Adding columns to a form......................................................
Adding text to a form .............................................................
Adding computed fields to a form..........................................
Adding pictures to a form ......................................................
Adding command buttons to a form ......................................
Adding picture buttons to a form ...........................................
Adding reports to a form ........................................................
Adding drawing controls to a form.........................................
Highlighting information in a form.................................................
Displaying and validating data in a form ......................................
PART 5
APPLICATIONS
CHAPTER 21
Working with Applications .........................................................
About applications........................................................................
Creating an application ................................................................
Reusing an application.................................................................
Running an application.................................................................
Identifying your application ....................................................
Running a report, form, or pipeline........................................
Managing the toolbar.............................................................
Managing the open reports, forms, and pipelines .................
Using the query governor in an application ...........................
Using a pipeline in an application.................................................
Executing pipelines ...............................................................
Modifying the pipeline object’s definition ...............................
Starting an application from the command line ............................
Users Guide
551
551
551
553
553
553
555
555
555
556
557
558
560
561
561
561
562
565
566
568
568
569
570
571
575
575
576
582
583
585
586
587
587
587
587
588
590
593
xv
Contents
CHAPTER 22
Deploying Your Application........................................................
About deploying applications .......................................................
Installing InfoMaker runtime files..................................................
Making the data source available.................................................
Installing native database interfaces .....................................
Installing ODBC and system files ..........................................
Configuring an ODBC driver..................................................
Deploying SQL Anywhere files..............................................
OLE DB database providers..................................................
JDBC database interface ......................................................
Saving as PDF and XSL-FO ........................................................
Using the Ghostscript distiller................................................
Using the Apache FO processor ...........................................
Installing the executable application and supporting files ............
Modifying the application’s initialization file ...........................
Deploying ActiveX controls....................................................
Starting the deployed application .................................................
PART 6
REFERENCE
CHAPTER 23
Operators and Expressions........................................................
Where you use expressions .........................................................
Operators used in InfoMaker expressions ...................................
Arithmetic operators in InfoMaker expressions .....................
Relational operators in InfoMaker expressions .....................
Logical operators in InfoMaker expressions..........................
Concatenation operator in InfoMaker expressions................
Operator precedence in InfoMaker expressions ..........................
Matching text patterns..................................................................
CHAPTER 24
xvi
DataWindow Expression and InfoMaker Functions .................
Using DataWindow expression and InfoMaker functions.............
Four examples .............................................................................
Example 1: counting null values in a column ........................
Example 2: counting male and female employees................
Example 3: creating a row indicator ......................................
Example 4: displaying all data when a column allows nulls ..
Other examples .....................................................................
Alphabetical list of DataWindow expression and InfoMaker
functions .........................................................................
Abs ........................................................................................
ACos......................................................................................
595
595
597
599
599
600
600
602
604
604
607
607
609
610
610
610
611
615
615
618
619
619
623
624
625
626
629
629
630
630
632
636
638
639
640
641
641
InfoMaker
Contents
Asc ........................................................................................
AscA ......................................................................................
ASin.......................................................................................
ATan......................................................................................
Avg ........................................................................................
Bitmap ...................................................................................
Case ......................................................................................
Ceiling ...................................................................................
Char.......................................................................................
CharA ....................................................................................
Cos ........................................................................................
Count.....................................................................................
CrosstabAvg ..........................................................................
CrosstabAvgDec ...................................................................
CrosstabCount ......................................................................
CrosstabMax .........................................................................
CrosstabMaxDec...................................................................
CrosstabMin ..........................................................................
CrosstabMinDec....................................................................
CrosstabSum.........................................................................
CrosstabSumDec ..................................................................
CumulativePercent ................................................................
CumulativeSum .....................................................................
CurrentRow ...........................................................................
Date.......................................................................................
DateTime ...............................................................................
Day ........................................................................................
DayName ..............................................................................
DayNumber ...........................................................................
DaysAfter...............................................................................
Dec ........................................................................................
Describe ................................................................................
Exp ........................................................................................
Fact .......................................................................................
Fill..........................................................................................
FillA .......................................................................................
First .......................................................................................
GetRow .................................................................................
GetText..................................................................................
Hour.......................................................................................
If ............................................................................................
Int ..........................................................................................
Integer ...................................................................................
IsDate ....................................................................................
Users Guide
642
642
643
644
644
647
648
649
650
650
651
651
653
657
658
660
661
662
664
665
667
668
670
671
672
673
674
674
675
676
677
678
678
679
679
680
681
683
684
684
685
686
686
687
xvii
Contents
IsExpanded ...........................................................................
IsNull .....................................................................................
IsNumber...............................................................................
IsRowModified.......................................................................
IsRowNew .............................................................................
IsSelected..............................................................................
IsTime....................................................................................
Large .....................................................................................
Last........................................................................................
LastPos .................................................................................
Left ........................................................................................
LeftA ......................................................................................
LeftTrim .................................................................................
Len ........................................................................................
LenA ......................................................................................
Log ........................................................................................
LogTen ..................................................................................
Long ......................................................................................
LookUpDisplay ......................................................................
Lower.....................................................................................
Match.....................................................................................
Max........................................................................................
Median...................................................................................
Mid.........................................................................................
MidA ......................................................................................
Min.........................................................................................
Minute....................................................................................
Mod .......................................................................................
Mode .....................................................................................
Month ....................................................................................
Now .......................................................................................
Number..................................................................................
Page ......................................................................................
PageAbs................................................................................
PageAcross ...........................................................................
PageCount ............................................................................
PageCountAcross .................................................................
Percent ..................................................................................
Pi ...........................................................................................
Pos ........................................................................................
PosA......................................................................................
ProfileInt ................................................................................
ProfileString...........................................................................
Rand......................................................................................
xviii
688
688
689
689
690
690
691
692
694
695
696
697
698
698
699
699
700
700
701
702
702
704
706
709
710
710
713
713
714
716
716
717
718
718
719
719
720
721
723
724
725
725
727
728
InfoMaker
Contents
Real .......................................................................................
RelativeDate ..........................................................................
RelativeTime .........................................................................
Replace .................................................................................
ReplaceA...............................................................................
RGB.......................................................................................
Right ......................................................................................
RightA....................................................................................
RightTrim ...............................................................................
Round....................................................................................
RowCount..............................................................................
RowHeight .............................................................................
Second ..................................................................................
SecondsAfter.........................................................................
Sign .......................................................................................
Sin .........................................................................................
Small .....................................................................................
Space ....................................................................................
Sqrt........................................................................................
StDev.....................................................................................
StDevP ..................................................................................
String .....................................................................................
StripRTF ................................................................................
Sum .......................................................................................
Tan ........................................................................................
Time ......................................................................................
Today ....................................................................................
Trim .......................................................................................
Truncate ................................................................................
Upper.....................................................................................
Var.........................................................................................
VarP ......................................................................................
WordCap ...............................................................................
Year.......................................................................................
728
729
729
730
731
731
733
733
734
734
735
735
736
737
737
738
738
740
741
742
744
746
748
749
751
752
753
753
753
755
755
758
760
761
PART 7
APPENDIXES
AP PE ND IX A
Identifiers..................................................................................... 765
Rules ............................................................................................ 765
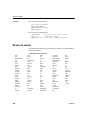
Reserved words ........................................................................... 766
Users Guide
xix
Contents
AP PE ND IX B
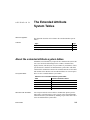
The Extended Attribute System Tables .....................................
About the extended attribute system tables .................................
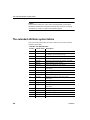
The extended attribute system tables ..........................................
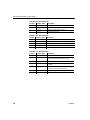
Edit style types for the PBCatEdt table ........................................
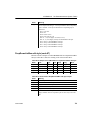
CheckBox edit style (code 85)...............................................
RadioButton edit style (code 86) ...........................................
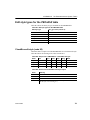
DropDownListBox edit style (code 87) ..................................
DropDownDataWindow edit style (code 88)..........................
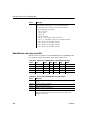
Edit edit style (code 89).........................................................
Edit Mask edit style (code 90) ...............................................
767
767
768
771
771
772
773
774
775
777
Index ........................................................................................................................................... 779
xx
InfoMaker
About This Book
Audience
This book is for anyone who is using InfoMaker® to work with data.
Although the book does not assume you have knowledge about any
particular topic, having some familiarity with relational databases and
SQL is helpful. Consult books on these topics as needed.
InfoMaker works with many DBMSs
This book describes how to use InfoMaker using a SQL Anywhere™
database for examples. You use InfoMaker with many different DBMSs,
as described in Connecting to Your Database.
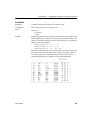
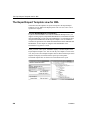
How to use this book
This book describes InfoMaker, what you use it for, and how you work in
its environment to accomplish your goals. The book shows you how to use
InfoMaker to create reports, queries, forms, data pipelines, and
applications. It also shows you how to work with databases in InfoMaker.
To help you do your work more easily, the book is divided into parts that
focus on accomplishing particular goals:
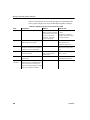
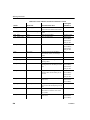
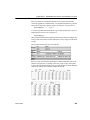
Users Guide
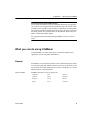
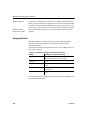
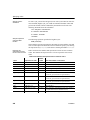
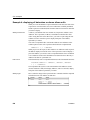
If you want to
Learn about the environment and work
with libraries
Manage databases and create data
pipelines
Create reports
Use these parts of the book
Part One, The InfoMaker Environment
Create queries
Create forms
Chapter 5, Defining Reports
Part Four, Forms
Create applications
Look up information about operators,
expressions, and InfoMaker functions
Part Five, Applications
Part Six, Reference
Look up information about identifiers
and the extended attribute system
tables
Part Seven, Appendixes
Part Two, Managing Databases
Part Three, Reports
xxi
Other sources of
information
Use the Sybase Getting Started CD, the SyBooks CD, and the Sybase Product
Manuals Web site to learn more about your product:
•
The Getting Started CD contains release bulletins and installation guides
in PDF format, and may also contain other documents or updated
information not included on the SyBooks CD. It is included with your
software. To read or print documents on the Getting Started CD, you need
Adobe Acrobat Reader, which you can download at no charge from the
Adobe Web site using a link provided on the CD.
•
The SyBooks CD contains product manuals and is included with your
software. The Eclipse-based SyBooks browser allows you to access the
manuals in an easy-to-use, HTML-based format.
Some documentation may be provided in PDF format, which you can
access through the PDF directory on the SyBooks CD. To read or print the
PDF files, you need Adobe Acrobat Reader.
Refer to the SyBooks Installation Guide on the Getting Started CD, or the
README.txt file on the SyBooks CD for instructions on installing and
starting SyBooks.
•
The Sybase Product Manuals Web site is an online version of the SyBooks
CD that you can access using a standard Web browser. In addition to
product manuals, you will find links to EBFs/Maintenance, Technical
Documents, Case Management, Solved Cases, newsgroups, and the
Sybase Developer Network.
To access the Sybase Product Manuals Web site, go to Product Manuals at
http://www.sybase.com/support/manuals/.
If you need help
xxii
Each Sybase installation that has purchased a support contract has one or more
designated people who are authorized to contact Sybase Technical Support. If
you cannot resolve a problem using the manuals or online help, please have the
designated person contact Sybase Technical Support or the Sybase subsidiary
in your area.
InfoMaker
PART
1
The InfoMaker
Environment
This part introduces you to InfoMaker and describes how
to work in and manage its environment. It also describes
how to work with databases, tables, views, and extended
attributes.
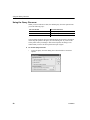
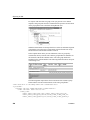
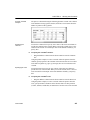
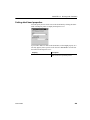
Access to the Database painter
To have access to the Database painter, select the InfoMaker
Database Write Option in the setup program.
CH A PTE R
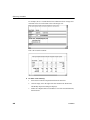
About this chapter
Contents
Before you begin
Users Guide
1
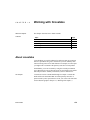
Working with InfoMaker
This chapter describes the basics of working with InfoMaker and its
painters.
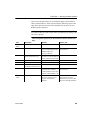
Topic
About InfoMaker
Page
4
What you can do using InfoMaker
The InfoMaker environment
5
12
Working with libraries
Working with objects
14
16
Working in painters
Working with tools
18
26
Using property pages
Using toolbars
27
29
Using report wizards
37
Using the To-Do List
Using online Help
38
39
Customizing keyboard shortcuts
Using the file editor
42
44
Changing fonts
Accessing shared queries stored on a network
46
46
Defining libraries for user-defined form styles
Using the Query Governor
47
48
How your InfoMaker environment is managed
Starting InfoMaker from the command line
51
53
If you are new to InfoMaker, you should first do the tutorial in Getting
Started. The tutorial guides you through the process of building an
InfoMaker application.
3
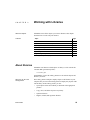
About InfoMaker
About InfoMaker
InfoMaker is a
reporting tool
InfoMaker is a powerful and easy-to-use reporting tool that lets you query
databases and create sophisticated and effective custom reports of data. When
optional painters are installed, it also lets you work with data in a database.
InfoMaker is a
personal data
assistant
InfoMaker lets you work with data in many ways—always with no
programming required.
InfoMaker provides built-in connectivity to a broad range of desktop and
server-based databases. Some versions of InfoMaker also include the powerful
SQL Anywhere database management system (DBMS) that enables you to
create your own databases and use the built-in EAS Demo DB (a Sybase SQL
Anywhere database) to create reports and other InfoMaker objects.
For information about supported DBMSs, see Connecting to Your Database.
When you work in InfoMaker, you work in a graphical environment—and
working with data in this environment means you do not need to understand
SQL, the standard programming language for talking to databases. InfoMaker
creates all SQL statements behind the scenes as you build your reports and
other objects graphically.
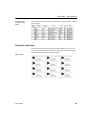
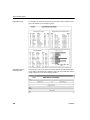
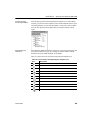
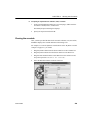
What you create in
InfoMaker
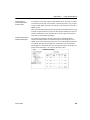
In InfoMaker, you can create the following objects:
•
Reports to view data
•
Forms to view and change data
•
Queries to automatically retrieve data for reports or forms
•
Pipelines to pipe data from one database (or DBMS) to another
•
Applications to bundle reports and forms and distribute them to users
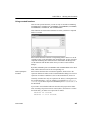
You can see many examples of the objects you create in InfoMaker in this
chapter.
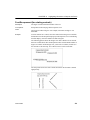
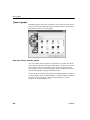
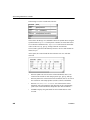
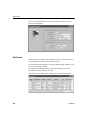
Painters
4
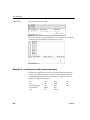
In InfoMaker, you do your work in painters. A painter is an object editor you
use to create and work with objects of a particular type. For example, in the
Report painter, you create and work with reports, and in the Data Pipeline
painter, you create and work with data pipelines.
InfoMaker
CHAPTER 1
Working with InfoMaker
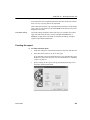
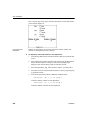
If you do not see all the available painters
If you installed InfoMaker from the PowerBuilder Enterprise setup program,
you, or others in your organization who install and set up your software, chose
to install a full set of painters (typical install) or a minimal set (compact install).
The minimal combination includes the Report painter, the Query painter, and
the Library painter. The optional painters are the Database painter, the Form
painter, and the Data Pipeline painter.
For complete information about installing InfoMaker, see the Installation
Guide.
What you can do using InfoMaker
You use InfoMaker to create reports, queries, forms, data pipelines, and
applications. You can also work with databases.
Reports
In InfoMaker, you use the Report painter to create sophisticated reports of data.
You can easily group and summarize data. You can view reports on the screen
or print them. You cannot change data in a report. To change data, you use the
Database painter or the Form painter.
Types of reports
Users Guide
InfoMaker provides a variety of report styles:
Composite
Grid
OLE 2.0
Crosstab
Freeform
Group
Label
RichText
Tabular
Graph
N-Up
TreeView
5
What you can do using InfoMaker
Here are a few sample reports:
Freeform report
Label report
6
InfoMaker
CHAPTER 1
Working with InfoMaker
Group report
Users Guide
7
What you can do using InfoMaker
TreeView report
Queries
Reports and forms both use data from your database. In InfoMaker, you use the
Query painter to define queries that specify your data requirements. When you
want to create a new report or form using that data, you can simply use the
query as the source of your data, without redefining the data.
Here is a sample query:
8
InfoMaker
CHAPTER 1
Working with InfoMaker
Forms
In InfoMaker, you use the Form painter to create and run interactive forms to
view and change data. InfoMaker provides four form styles:
Freeform
Master/Detail One-To-Many
Grid
Master/Detail Many-To-One
PowerBuilder® developers in your organization can create custom form styles
for you to use.
Here are some sample forms:
Freeform form
Users Guide
9
What you can do using InfoMaker
Master/detail
many-to-one form
Data pipelines
In InfoMaker, you use the Data Pipeline painter to create and execute data
pipeline definitions to pipe data from one or more source tables to a new or
existing destination table.
Here is a sample data pipeline:
10
InfoMaker
CHAPTER 1
Working with InfoMaker
Applications
You can use your reports, forms, and data pipelines within the InfoMaker
environment; you can also bundle them in a fully functional databasemaintenance and reporting application that can be used outside the InfoMaker
environment.
You create an application by using the Library painter to create an executable
file. You can use the application yourself; you can also distribute the executable
file and some additional files to other users, who can then run the reports and
forms in your application with aliases or shortcuts.
Database management
The data you are working with is stored in a database. In InfoMaker, you use
the Database painter to work with databases and administer them. In a
database, you can create tables (which hold the data), views (which provide an
easy way to use the data), indexes, and keys.
The Database painter provides a graphical interface that helps you work with
databases:
You can also define extended attributes for columns in tables. These extended
attributes let you store information about columns in the database for use in
reports and forms. For example, you can define an edit style and a validation
rule for a column. Once they are defined, anytime you use that column in a
form, each entry in the column is checked against the validation rule. If the
entry does not pass validation, InfoMaker tells you.
Users Guide
11
The InfoMaker environment
The InfoMaker environment
When you start
InfoMaker the first
time
In InfoMaker, you always work within the context of a library. The first time
you start InfoMaker, the default library is tutor_im.pbl, which contains sample
objects based on the EAS Demo DB.
If you want to create a library of your own for storing new objects, click the
New button on the PowerBar and use the library wizard on the Library tab
page.
If you have used
InfoMaker before
You can also select an existing library by clicking the Select Library button on
the PowerBar and using the Browse or Recent tab pages. If you select a library
that you used in an earlier version of InfoMaker, InfoMaker prompts you to
migrate the library to this version.
When InfoMaker
starts
When InfoMaker starts, it opens in a window that contains a menu bar and the
PowerBar:
You can create new objects, open existing objects, change libraries, access the
database, and perform other tasks by using menus or clicking buttons in the
PowerBar.
12
InfoMaker
CHAPTER 1
Working with InfoMaker
About the PowerBar
What it is
The PowerBar is the main control point for working in InfoMaker. From the
PowerBar you can create new objects and libraries and open existing objects.
Buttons on the
PowerBar
From left to right on the PowerBar, here are the buttons and what you can do
after you click a button:
This PowerBar
button
Lets you do this
New
Open
Create new objects
Open existing objects
Preview
Select Library
Run forms or preview reports
Select an existing library or create a new one
Library List
To-Do List
Specify libraries for user-defined form styles and shared queries
Keep track of object creation tasks and use links to quickly get
you to the place where you complete the tasks
Manage your libraries using the Library painter and create
executable versions of reports, forms, and pipelines
Library
DB Profile
Define and use named sets of parameters to connect to a
particular database
Database
Maintain databases and database tables, control user access to
databases, and manipulate data in databases using the Database
painter
Exit
Close InfoMaker
Customizing the
PowerBar
You can customize the PowerBar. For example, you can choose whether to
move the PowerBar around, add buttons for operations you perform frequently,
and display text in the buttons. For more information, see “Using toolbars” on
page 29.
About PowerTips
In the PowerBar, when you leave the mouse pointer over a button for a second
or two, InfoMaker displays a brief description of the button, called a
PowerTip. PowerTips display in InfoMaker wherever there are toolbar
buttons.
Users Guide
13
Working with libraries
About wizards
InfoMaker provides you with wizards for easy creation of libraries and reports.
❖
To access wizards:
1
Click the New button in the PowerBar, or select File>New from the menu
bar.
2
In the New dialog box, select the tab page for the wizard you need.
This tab page
Has icons for
Library
Object
A wizard for creating new libraries
Object wizards for creating reports in specific
presentation styles
Working with libraries
You can create a new library. You can also change your current library to a
different library to work on objects in that library.
Creating a new library
For information about creating a new library, see “Creating new libraries” on
page 57.
Setting the current library
Whenever InfoMaker is running, the current library determines which objects
are listed in the Open and Preview dialog boxes when you click the Open or
Preview button in the PowerBar. When you save an object, InfoMaker puts it
in the current library.
As you build up your collection of objects, you can keep them in one library or
in different libraries in different folders. When you want to work on the objects
in a particular library, you need to select that library.
14
InfoMaker
CHAPTER 1
❖
Working with InfoMaker
To set the current library:
1
Click the Select Library button in the PowerBar.
2
On the Browse or Recent tab pages of the Select Library dialog box, select
the library you want:
In the Browse tab page, you can navigate to a library or type the absolute
or relative path for a library.
About creating a new library
You can also use the New tab page in the Select Library dialog box to
create a new library and automatically set the current library to that new
library. Doing this is the same as clicking the New button on the PowerBar
and using the New dialog box’s Library tab page for creating a new library.
For information about creating a new library, see “Creating new libraries”
on page 57.
3
Click OK.
InfoMaker changes the current library and its name displays in the
InfoMaker title bar.
Users Guide
15
Working with objects
Working with objects
In InfoMaker, you can:
•
Create new objects
•
Open existing objects
•
Run or preview objects
After you create or open an object, the object displays in its painter and you
work on it there.
Creating new objects
To create new objects, you use the New button in the PowerBar.
❖
To create a new object:
1
Click the New button in the PowerBar, or select File>New from the menu
bar.
2
In the New dialog box, select the appropriate tab page for the object you
want to create.
This shows the Object tab page. You use this tab page for creating forms
and reports.
3
16
Select an icon and click OK.
InfoMaker
CHAPTER 1
Working with InfoMaker
If you chose the Object tab page and you are creating a report, at this point you
use a wizard. If you chose the Database tab page, you can create a query or a
data pipeline. The new object opens in the appropriate painter.
Objects you can
create
The New dialog box has four tab pages, two of which you use for creating new
objects:
This tab page
Has icons for
Object
Form and report wizards for creating reports in specific
presentation styles
Creating queries and data pipelines
Database
Opening existing objects
To open existing objects, you use the Open button in the PowerBar.
❖
To open existing objects:
1
Click the Open button in the PowerBar, or select File>Open from the menu
bar.
2
In the Open dialog box, select the object type from the Object Type
drop-down list and then the object you want to open.
3
Click OK.
The object opens in the appropriate painter.
Users Guide
17
Working in painters
Accessing recently
opened objects
You can quickly open recently opened objects by selecting File>Recent
Objects from the menu bar. The Recent Objects list includes the eight most
recently opened objects, but you can include up to 36 objects on the list.
❖
To modify the number of recent objects:
1
Select Tools>System Options from the menu bar.
2
In the System Options dialog box (General tab page), modify the number
for the recent objects list.
Running or previewing objects
To run a form or preview a report, use the Preview button in the PowerBar.
❖
To run or preview an object:
1
Click the Preview button in the PowerBar, or select File>Run/Preview
from the menu bar.
2
In the Run/Preview dialog box, select the object type from the Object Type
drop-down list and then the object you want to run or preview.
The Run/Preview dialog box is very similar to the Open dialog box.
3
Click OK.
The object runs or is previewed.
Working in painters
In InfoMaker, you edit objects such as reports in painters. In addition to
painters that edit objects, other painters such as the Library painter and the
Database painter provide you with the ability to work with libraries and
databases.
18
InfoMaker
CHAPTER 1
Working with InfoMaker
Opening painters
Painters that edit
objects
There are several ways to open painters that edit objects:
From here
PowerBar
Library painter
Other painters
You can
Click New (to create new objects) or Open (to open existing
objects)
Double-click an object or select Edit from the object’s pop-up
menu
Most other painters are accessible from the New dialog box. Some are also
available on the PowerBar and from the Tools menu.
Painter summary
The InfoMaker painters are listed in Table 1-1.
Table 1-1: InfoMaker painters
Painter
Report painter
What you do
Build and preview reports of data in your database
Form painter
Database painter
Build and run forms to display and change data in your database
Maintain databases, control user access to databases, manipulate
data in databases, and create tables
Transfer data from one data source to another and save a pipeline
object for reuse
Data Pipeline
painter
Library painter
Manage libraries and create executable versions of reports,
forms, and pipelines
Query painter
Graphically define and save SQL SELECT statements for reuse
with reports, forms, and pipelines
Select painter
Graphically define SQL SELECT statements for reports, forms,
and pipelines
Using views in painters
Most of the InfoMaker painters and tools have views. Each view provides a
specific way of viewing or modifying the object you are creating or a specific
kind of information related to that object. Having all these views available in a
painter window means you can work on more than one task at a time.
Users Guide
19
Working in painters
Views are displayed in panes in the painter window. Some views are stacked in
a single pane. At the bottom of the pane there is a tab for each view in the stack.
Clicking the tab for a view pops that view to the top of the stack.
Each painter has a default layout, but you can display the views you choose in
as many panes as you want to and save the layouts you like to work with. For
some painters, all available views are included in the default layout; for others,
only a few views are included.
Each pane has:
•
A title bar you can display temporarily or permanently
•
A handle in the top-left corner you can use to drag the pane to a new
location
•
Splitter bars between the pane and each adjacent pane
Displaying the view’s title bar
For most views a title bar does not permanently display at the top of a pane
(because it is often unnecessary). But you can display a title bar for any pane
either temporarily or permanently.
❖
To display a title bar:
1
Place the pointer on the splitter bar at the top of the pane.
The title bar displays.
2
To display the title bar permanently, click the pushpin at the left of the title
bar or select Pinned from its pop-up menu.
Click the pushpin again or select Pinned again on the pop-up menu to hide
the title bar.
After you display a title bar either temporarily or permanently, you can use the
title bar’s pop-up menu.
❖
To maximize a pane to fill the workspace:
•
❖
To restore a pane to its original size:
•
20
Select Maximize from the title bar’s pop-up menu or click the Maximize
button on the title bar.
Select Restore from the title bar’s pop-up menu or click the Restore button
on the title bar.
InfoMaker
CHAPTER 1
Working with InfoMaker
Moving and resizing panes and views
You can move a pane or a view to any location in the painter window. You
might find it takes a while to get used to moving panes and views around, but
if you do not like a layout, you can always revert to the default layout and start
again. To restore the default layout, select View>Layouts>Default.
To move a pane, you select and drag the title bar of the view that is at the top
of the stack. If the pane contains stacked views, all views in the stack move
together. To move one of the views out of the stack, you drag the tab for the
view you want to move.
❖
To move a pane:
1
Place the pointer anywhere on the title bar of the view at the top of the
stack, hold down the left mouse button, and start moving the pane.
A gray outline appears in the pane:
2
Drag the outline to the new location.
The outline changes size as you drag it. When the pointer is over the
middle of a pane, the outline fills the pane. As you drag the pointer toward
any border, the outline becomes a narrow rectangle adjacent to that border.
When the pointer is over a splitter bar between two panes, rows, or
columns, the outline straddles the splitter bar:
When you move the pointer to a corner
When you move the pointer to a corner, you will find that you have many
places where you can drop the outline. To see your options, move the
pointer around in all directions in the corner and see where the outline
displays as you move it.
Users Guide
21
Working in painters
3
Release the mouse button to drop the outline in the new location:
To move a pane here
Drop the outline here
Between two panes
Between a border and a pane
On the splitter bar between the panes
At the side of the pane nearest the border
Into a new row
On the splitter bar between two rows or at the
top or bottom of the painter window
On the splitter bar between two columns or at
the left or right edge of the painter window
On the middle of the pane (if the pane was not
already tabbed, tabs are created)
Into a new column
Onto a stack of panes
❖
To move a view in a stacked pane:
•
Place the pointer anywhere on the view’s tab, hold down the left mouse
button, and start moving the view.
You can now move the view as in the previous procedure. If you want to
rearrange the views in a pane, you can drag the view to the left or right
within the same pane.
❖
To resize a pane:
•
Drag the splitter bars between panes.
Floating and docking views
Panes are docked by default within a painter window, but some tasks may be
easier if you float a pane. A floating pane can be moved outside the painter’s
window or even outside the InfoMaker window.
When you open another painter
If you have a floating pane in a painter and then open another painter, the
floating pane temporarily disappears. It reappears when the original painter is
selected.
❖
To float a view in its own pane:
•
22
Select Float from the title bar’s pop-up menu.
InfoMaker
CHAPTER 1
❖
To float a view in a stacked pane:
•
❖
Working with InfoMaker
Select Float from the tab’s pop-up menu.
To dock a floating view:
•
Select Dock from the title bar’s pop-up menu.
Adding and removing views
You may want to add additional views to the painter window. If there are some
views you rarely use, you can move them into a stacked pane or remove them.
When removing a view in a stacked pane, make sure you remove the view and
not the pane.
❖
To add a new view to the painter window:
1
Select View from the menu bar and then select the view you want to add.
The view displays in a new pane in a new row.
2
Move the pane where you want it.
For how to move panes, see “Moving and resizing panes and views” on
page 21.
❖
❖
To remove a view in its own pane from the painter window:
1
If the view’s title bar is not displayed, display it by placing the pointer on
the splitter bar at the top of the pane.
2
Click the Close button on the title bar.
To remove a view in a stacked pane from the painter window:
•
❖
Users Guide
Select the tab for the view and select Close from its pop-up menu.
To remove a stacked pane from the painter window:
1
If the title bar of the top view in the stack is not displayed, display it by
placing the pointer on the splitter bar at the top of the pane.
2
Click the Close button on the title bar.
23
Working in painters
Saving a layout
When you have rearranged panes in the painter window, InfoMaker saves the
layout in the registry. The next time you open the painter window, your last
layout displays. You can also save customized layouts so that you can switch
from one to another for different kinds of activities.
❖
To save customized layouts for a painter window:
1
Select View>Layouts>Manage from the menu bar.
2
Click the New Layout button (second from the left at the top of the dialog
box).
3
Type an appropriate name in the text box and click OK.
Restoring the default layout
You can restore the default layout at any time by selecting
Views>Layout>Default.
Using pop-up menus
InfoMaker provides a context-sensitive pop-up menu that lists:
•
Actions appropriate to the currently selected object or the current position
of the pointer
•
Where appropriate, a Properties menu item for accessing the Properties
view or the Properties dialog box associated with the current object or the
current position of the pointer
The pop-up menu is available almost everywhere in InfoMaker.
24
InfoMaker
CHAPTER 1
Example
Working with InfoMaker
For example, the following screen shows the pop-up menu for a column in a
report:
❖
To display a pop-up menu:
1
Select an object, or position the pointer on an object or in a view.
2
Click the right mouse button.
Defining colors
You can define custom colors to use in most painters and in objects you create.
❖
To define custom colors:
1
In a painter that uses custom colors, select Design>Custom Colors from
the menu bar.
The Color dialog box displays:
Users Guide
25
Working with tools
2
Define your custom colors:
Area of the
Color dialog box What you do
Basic colors
Click the basic color closest to the color you want to
define to move the pointer in the color matrix and slider
on the right
Modify an existing color—click a custom color, then
modify the color matrix and slider. Define a new color—
click an empty box, define the color, and click Add to
Custom Colors
Custom colors
palette
Color matrix
Color slider
Click in the color matrix to pick a color
Move the slider on the right to adjust the color’s attributes
Add to Custom
Colors button
After you have designed the color, click this button to add
the custom color to the Custom colors palette on the left
Working with tools
InfoMaker provides you with tools to help you with your work.
Opening a tool
There are several ways to open tools.
❖
To open a tool:
•
Click a button in the PowerBar for the tool you want, or select the tool
from the Tools menu.
You can also open a tool by clicking the New button in the PowerBar, and then,
in the New dialog box’s Tool tab page, selecting the Library painter or the file
editor.
Tool summary
Table 1-2 summarizes the tools available in the PowerBar.
Table 1-2: InfoMaker tools
Tool
To-Do List
Library painter
26
What you use the tool for
Keep track of object creation tasks and create links to quickly get
you to the place where you need to complete the tasks. For
information, see “Using the To-Do List” on page 38.
Manage libraries and create executable versions of reports,
forms, and pipelines.
InfoMaker
CHAPTER 1
Working with InfoMaker
Tool
What you use the tool for
Database profile
Define and use named sets of parameters to connect to a
particular database. For information, see Connecting to Your
Database.
Set data selection and retrieval preferences. For information, see
“Using the Query Governor” on page 48.
Query governor
(available by
customizing the
PowerBar)
Using property pages
A property page is a page in a tabbed dialog box you use to set properties
associated with an object, painter, or tool by making changes in one or more
tabs in the dialog box.
About the Properties view
In the Report painter and Form painter, you set object properties in a property
page that displays in the Properties view. In other painters and tools, a separate
dialog box displays.
Example
Users Guide
For example, for a column in a report, you can set several different kinds of
properties (general, pointer, HTML, position, edit style, font, background
color, and display format) by clicking appropriate tabs in the Properties view:
27
Using property pages
How property pages
work in the Properties
view
The Properties view is dynamically updated when you select another object or
control. If you select more than one object or control, group selected
displays in the title bar, the properties common to them display, and you can set
the properties for more than one control at a time.
In the Properties view, you can use a pop-up menu to specify where the labels
for the properties display and to get Help on the properties.
The selections you make or the information you type into a box in the
Properties view is saved when you tab to another field or open a different
property page.
How other property
pages work
Properties dialog boxes that do not display in the Properties view have OK,
Cancel, Apply, and Help buttons. The Apply button is enabled when you make
a change on one tab:
Use this button
OK
Cancel
Displaying property
pages
28
To do this
Apply the properties you have set on all tabs and close the
property page
Close the window and apply no new changes
Apply
Apply the properties you have set on all tabs immediately
without closing the property page
Help
Get Help on setting properties for the tab that displays
You can display properties dialog boxes in a few ways:
•
Select View>Properties from the menu bar in some painters that edit
objects
•
If the Properties view is open, select an object or control in the Layout or
Control List views to display the properties of the object or control in the
Properties view
•
Select Properties from the pop-up menu of an object, control, library
name, or table or column name
•
Select Object>Properties, Design>Properties, or Entry>Properties from
the menu bar (depending on the painter you are working in)
•
Click the Properties button in the PainterBar
InfoMaker
CHAPTER 1
Working with InfoMaker
Using toolbars
Toolbars provide buttons for the most common tasks in InfoMaker. You can
move (dock) toolbars, customize them, and create your own.
Toolbar basics
InfoMaker uses three toolbars: the PowerBar, PainterBar, and StyleBar. You
can hide a toolbar by right-clicking in the toolbar area and clearing the check
mark text to its name. If a toolbar is not hidden, it displays as shown in Table
1-3.
Table 1-3: InfoMaker toolbars
Toolbar
PowerBar
Purpose
Opening painters and tools
Availability
Always.
PainterBar
Performing tasks in the current
painter
When a painter is open. Some
painters have more than one
PainterBar.
StyleBar
Changing the properties of text,
such as font and alignment
In appropriate painters.
Drop-down toolbars
To reduce the size of toolbars, some toolbar buttons have a down arrow on the
right that you can click to display a drop-down toolbar containing related
buttons.
For example, the down arrow next to the Text button in the Report painter
displays the Controls drop-down toolbar, which has a button for each control
you can place on a report:
Users Guide
29
Using toolbars
Default button replaced
The button you select from a drop-down toolbar replaces the default button on
the main toolbar. For example, if you select the Picture button from the
Controls drop-down toolbar, it replaces the Command button in the PainterBar.
Controlling the display of toolbars
You can control:
•
Whether to display individual toolbars and where
•
Whether to display text on the buttons
•
Whether to display PowerTips
Choosing to display text and PowerTips affects all toolbars.
❖
To control a toolbar using the pop-up menu:
1
Position the pointer on a toolbar and display the pop-up menu.
2
Click the items you want.
A check mark means the item is currently selected.
❖
To control a toolbar using the Toolbars dialog box:
1
Select Tools>Toolbars from the menu bar.
The Toolbars dialog box displays.
2
Click the toolbar you want to work with (the current toolbar is highlighted)
and the options you want.
InfoMaker saves your toolbar preferences in the registry and the InfoMaker
initialization file.
30
InfoMaker
CHAPTER 1
Working with InfoMaker
Moving toolbars using the mouse
You can use the mouse to move a toolbar.
❖
To move a toolbar with the mouse:
1
Position the pointer on the grab bar at the left of the toolbar or on any
vertical line separating groups of buttons.
2
Press and hold the left mouse button.
3
Drag the toolbar and drop it where you want it.
As you move the mouse, an outlined box shows how the toolbar will
display when you drop it. You can line it up along any frame edge or float
it in the middle of the frame.
Docking toolbars
When you first start InfoMaker, all the toolbars display one above another at
the top left of the workspace. When you move a toolbar, you can dock it:
•
At the top or bottom of the workspace, at any point from the left edge to
the right edge
•
At the left or right of the workspace, at any point from the top edge to the
bottom edge
•
To the left or right of, or above or below, another toolbar
Customizing toolbars
You can customize toolbars with InfoMaker buttons and with buttons that
invoke other applications, such as a clock or text processor.
Adding, moving, and
deleting buttons
You can add, move, and delete buttons in any toolbar.
❖
Users Guide
To add a button to a toolbar:
1
Position the pointer on the toolbar and display the pop-up menu.
2
Select Customize.
31
Using toolbars
The Customize dialog box displays.
3
Click the palette of buttons you want to use in the Select palette group.
4
Choose a button from the Selected palette box and drag it to the position
you want in the Current toolbar box.
If you choose a button from the Custom palette, another dialog box
displays so you can define the button.
For more information, see “Adding a custom button” on page 33.
Seeing what is available in the PowerBar
InfoMaker provides several buttons that do not display by default in the
PowerBar, but you can add them. To see what is available, scroll the list of
buttons and select one. InfoMaker lists the description for the selected
button.
❖
32
To move a button on a toolbar:
1
Position the pointer on the toolbar, display the pop-up menu, and select
Customize.
2
In the Current toolbar box, select the button and drag it to its new position.
InfoMaker
CHAPTER 1
❖
Resetting a toolbar
Working with InfoMaker
To delete a button from a toolbar:
1
Position the pointer on the toolbar, display the pop-up menu, and select
Customize.
2
In the Current toolbar box, select the button and drag it outside the Current
toolbar box.
You can restore the original setup of buttons on a toolbar at any time.
❖
Clearing or deleting a
toolbar
To reset a toolbar:
1
Position the pointer on the toolbar, display the pop-up menu, and select
Customize.
2
Click the Reset button, then Yes to confirm, then OK.
Whenever you want, you can remove all buttons from a toolbar. If you do not
add new buttons to the empty toolbar, the toolbar is deleted. You can delete
both built-in toolbars and toolbars you have created.
To recreate a toolbar
If you delete one of InfoMaker’s built-in toolbars, you can recreate it easily.
For example, to recreate the PowerBar, display the pop-up menu, select New,
and then select PowerBar1 in the New Toolbar dialog box. For information
about creating new toolbars and about the meaning of PowerBar1, see
“Creating new toolbars” on page 36.
❖
To clear or delete a toolbar:
1
Position the pointer on the toolbar, display the pop-up menu, and select
Customize.
2
Click the Clear button, then Yes to confirm.
The Current toolbar box in the Customize dialog box is emptied.
3
Adding a custom
button
Users Guide
Select new buttons for the current toolbar and click OK, or click OK to
delete the toolbar.
You can add a custom button to a toolbar. A custom button can:
•
Invoke an InfoMaker menu item
•
Run an executable (application) outside InfoMaker
•
Run a query or preview a report
•
Assign a display format or create a computed field in a report
33
Using toolbars
❖
To add a custom button:
1
Position the pointer on the toolbar, display the pop-up menu, and select
Customize.
2
Select Custom in the Select Palette group.
The custom buttons display in the Selected Palette box.
3
Select a custom button and drag it to where you want it in the Current
toolbar box.
The Toolbar Item Command dialog box displays. Different buttons display
in the dialog box depending on which toolbar you are customizing:
4
Fill in the dialog box as shown in Table 1-4.
Table 1-4: Toolbar Item Command dialog box
Button purpose
Action in Toolbar Item Command dialog box
Invoke an InfoMaker
menu item
Type
@MenuBarItem.MenuItem
in the Command Line box. For example, to make the
button mimic the Open item on the File menu, type
@File.Open
You can also use a number to refer to a menu item. The
first item in a drop-down/cascading menu is 1, the second
item is 2, and so on. Separator lines in the menu count as
items. Example:
@Edit.Align.4
Run an executable
outside InfoMaker
Type the name of the executable in the Command Line
box. Specify the full path name if the executable is not in
the current search path.
To search for the file name, click the Browse button.
34
InfoMaker
CHAPTER 1
Working with InfoMaker
Button purpose
Action in Toolbar Item Command dialog box
Run a query
Click the Query button and select the query from the
displayed list.
Run a report
Click the Report button and select a report from the
displayed list. You can then specify command-line
arguments in the Command Line box, as described below.
Assign a display format
to a column in a report
(Report painter only) Click the Format button to display
the Display Formats dialog box. Select a data type, then
choose an existing display format from the list or define
your own in the Format box.
Create a computed field
in a report
5
For more about specifying display formats, see Chapter 8,
“Displaying and Validating Data.”
(Report painter only) Click the Function button to display
the Function for Toolbar dialog box. Select the function
from the list.
In the Item Text box, specify the text associated with the button in two
parts separated by a comma—the text that displays on the button and text
for the button’s PowerTip:
ButtonText, PowerTip
For example:
Save, Save File
If you specify only one piece of text, it is used for both the button text and
the PowerTip.
6
Supplying arguments
with reports
In the Item MicroHelp box, specify the text to appear as MicroHelp when
the pointer is on the button.
If you define a custom button to preview a report, you can specify arguments
in the command line in the Toolbar Item Command dialog box.
Table 1-5: Arguments for running reports
Argument
Meaning
/l LibraryName
Specifies the library containing the report
Specifies the report
/o ReportName
/r
/ro
/a "Arguments"
Runs the report
Runs the report but does not provide design mode for
modifying the report
Specifies arguments to pass to the report
The default command line is: Report /o ReportName /ro.
Users Guide
35
Using toolbars
Modifying a custom button
❖
To modify a custom button:
1
Position the pointer on the toolbar, display the pop-up menu, and select
Customize.
2
Double-click the button in the Current toolbar box.
3
Make your changes, as described in “Adding a custom button” on page 33.
Creating new toolbars
InfoMaker has built-in toolbars. When you start InfoMaker, you see what is
called the PowerBar. In each painter, you also see one or more PainterBars. But
PowerBar and PainterBar are actually types of toolbars you can create to make
working in InfoMaker easier.
PowerBars and
PainterBars
A PowerBar is a toolbar that always displays in InfoMaker, unless you hide it.
A PainterBar is a toolbar that always displays in the specific painter for which
it was defined, unless you hide it. You can have up to four PowerBars, named
PowerBar1, PowerBar2, and so on. You can have up to eight PainterBars in
each painter, named PainterBar1, PainterBar2, and so forth.
Where you create
them
You can create a new PowerBar anywhere in InfoMaker, but to create a new
PainterBar, you must be in the workspace of the painter for which you want to
define the PainterBar.
❖
To create a new toolbar:
1
Position the pointer on any toolbar, display the pop-up menu, and select
New.
About the StyleBar
In painters that do not have a StyleBar, StyleBar is on the list in the New
Toolbar dialog box. You can define a toolbar with the name StyleBar, but
you can add only painter-specific buttons, not style buttons, to it.
2
Select a PowerBar name or a PainterBar name and click OK.
The Customize dialog box displays with the Current toolbar box empty.
3
36
One at a time, drag the toolbar buttons you want from the Selected palette
box to the Current toolbar box and then click OK.
InfoMaker
CHAPTER 1
Working with InfoMaker
Using report wizards
Accessing report
wizards
Report wizards help you create a report with a specific presentation style.
❖
What report wizards
do
To access a report wizard:
1
Click the New button in the PowerBar and select the Object tab page.
2
Select the icon for the report presentation style you need and click OK.
Table 1-6 summarizes what each report wizard creates.
Table 1-6: Report wizards
Wizard
Report characteristics
Composite
Includes other reports
Crosstab
Freeform
Has summary data in a spreadsheet-like grid
Has data columns going down the page and labels next to each
column
Displays data in a graph
Graph
Grid
Has data in row and column format with grid lines separating rows
and columns
Group
Label
Has data in rows that are divided into groups
Presents data as labels
N-Up
OLE 2.0
Has two or more rows of data next to each other
Is a single OLE object
RichText
Combines input fields that represent database columns with
formatted text
Has data columns going across the page and headers above each
column
Has data grouped in rows in a tree view whose nodes can be
expanded and collapsed
Tabular
TreeView
Report wizards can generate To-Do List entries to guide you through the object
development. For information about the To-Do List, see "Using the To-Do
List" next.
For information about using report wizards, see Chapter 5, “Defining
Reports.”
Users Guide
37
Using the To-Do List
Using the To-Do List
Opening the To-Do
List
The To-Do List displays a list of tasks you want to do in the current library.
❖
To open the To-Do List:
•
To-Do List entries
Click the To-Do List button in the PowerBar, or select Tools>To-Do List
from the menu bar.
You can create an entry in the To-Do List at any time to remind you about any
task you need to complete. You can create entries that are hot-linked to quickly
get you from the To-Do List to the painter and the specific object you need.
When you move the pointer over entries on the To-Do list, the pointer changes
to a hand when it is over a linked entry.
You can export or import a To-Do List by selecting Import or Export from the
pop-up menu. Doing this is useful if you want to move from one computer to
another or you need to work with To-Do Lists as part of some other system
such as a project management system.
Working with entries
on the To-Do List
Table 1-7 tells you how to work with entries on the To-Do List.
Table 1-7: The To-Do List
To do this
See linked entries
Use a linked entry to
get to a painter or
wizard
Add an entry with no
link
Add a linked entry to
a painter that edits
objects
Change an entry’s
position on the list
Edit or delete an entry
38
Do this
Move the pointer over the entries. A hand displays when the
entry you are over is linked.
Double-click the linked entry or select it and then select Go
To Link from the pop-up menu.
Select Add from the pop-up menu.
With the painter open, select Add Linked from the pop-up
menu.
Drag the entry to the position you want.
Select Edit or Delete from the pop-up menu.
InfoMaker
CHAPTER 1
Working with InfoMaker
To do this
Do this
Delete checked
entries or all entries
Select Delete Checked or Delete All from the pop-up menu.
Check or uncheck an
entry
Select an entry and then select Check/Uncheck from the
pop-up menu.
Export a To-Do List
Select Export from the pop-up menu, name the To-Do List
text file, and click Save.
Select Import from the pop-up menu, navigate to an
exported To-Do List text file, and click Open.
Import a To-Do List
Using online Help
InfoMaker has online Help that provides both reference and task-oriented
information.
How to access Help
You can get Help in any of the ways listed in Table 1-8.
Table 1-8: Accessing Help
Approach
What it does
Use the Help menu on the
menu bar
Displays the Help contents, the What’s New in
InfoMaker Help, or Help for the current painter.
In a wizard, click the Help
button [?] in the upper right
corner of the window
The pointer displays with a question mark so that you
can get context-sensitive Help. Point and click in a
field you need Help on.
In a wizard, press F1
In the Properties view in the
Report painter, select Help
from the pop-up menu on
any tab page
Context-sensitive Help for the current field displays.
Displays a Help topic from which you can get Help on
the properties, events, and functions for the object or
control whose properties are displaying in the
Properties view.
Add a Help button to the
PowerBar and use it
Displays the Help contents.
Press F1
Click the Help button in a
dialog box
Displays the Help contents.
Displays information about that dialog box.
Learning to use online
Help
To get information on using Help, press F1 anywhere within online Help.
Using the pop-up
menu
InfoMaker online Help provides a pop-up menu with shortcuts to features
available on the Help menu bar. To display the pop-up menu in online Help,
click the right mouse button.
Users Guide
39
Using online Help
About links from Help to book content
Some Help topics provide links to book content to extend online Help. The
book content is provided by a compiled HTML Help file that you install when
you install InfoMaker.
What you do to
access book content
from Help
In Help, when you see the phrase For more information, you also see an icon
that links you to book content:
If you have installed Internet Explorer and the compiled HTML Help file, the
appropriate book content displays in the Microsoft HTML Help viewer:
About the Sybooks CD and Web site
The InfoMaker documentation set is available on the Sybooks CD and on the
Sybase Web site. For more information, see “Other sources of information” on
page xxii.
40
InfoMaker
CHAPTER 1
Working with InfoMaker
Windows Help files on Vista
Windows Vista does not distribute the WinHlp32.exe file required to open
Windows Help files such as the imhlp115.hlp file used in InfoMaker. To use
.hlp files, you need to download a special Vista version of WinHlp32.exe from
the Microsoft Web site at http://go.microsoft.com/fwlink/?LinkID=82148.
Compiled HTML Help (.chm) files are supported, but you need to edit the
Windows registry to enable a Help macro that supports links from the
imhlp115.hlp file to the imman115.chm file. If you do not edit the registry, the
“For more information” links at the bottom of many topics in the Windows
Help display an error.
You also need to edit the registry if you need to run Windows Help files at a
remote location on an intranet.
Registry reflection on 64-bit Windows
64-bit versions of Windows use registry reflection to maintain a 32-bit registry
view and a 64-bit registry view. On 64-bit Windows, configuration information
related to 32-bit applications is stored in the
HKEY_LOCAL_MACHINE\Software\WOW6432node registry hive.
❖
To enable Windows Help macros and remote access on Vista:
1
Create the following registry key.
On 32-bit Windows:
HKEY_LOCAL_MACHINE\SOFTWARE\Microsoft\WinHelp
On 64-bit Windows:
HKEY_LOCAL_MACHINE\SOFTWARE\WOW6432node\Microsoft\
WinHelp
2
Add a new DWORD value with the name AllowProgrammaticMacros and
the value 1.
3
Add a new DWORD value with the name AllowIntranetAccess and the
value 1.
You can also add this support by saving the following lines in Notepad to a file
with the extension .reg and importing it into the registry.
On 32-bit Windows:
Windows Registry Editor Version 5.00
[HKEY_LOCAL_MACHINE\SOFTWARE\Microsoft\WinHelp]
Users Guide
41
Customizing keyboard shortcuts
"AllowProgrammaticMacros"=dword:00000001
"AllowIntranetAccess"=dword:00000001
On 64-bit Windows:
Windows Registry Editor Version 5.00
[HKEY_LOCAL_MACHINE\SOFTWARE\Wow6432node\Microsoft\Win
Help]
"AllowProgrammaticMacros"=dword:00000001
"AllowIntranetAccess"=dword:00000001
Microsoft prohibits the distribution of WinHlp32.exe with deployed
applications. If your application uses .hlp files, you should provide your users
with instructions on how to download WinHlp32.exe. For more information,
see the Microsoft support site at http://support.microsoft.com/kb/917607.
Customizing keyboard shortcuts
You can associate your own keyboard shortcuts with InfoMaker menu items.
Tip
Creating keyboard shortcuts means you can use the keyboard instead of the
mouse in many situations, such as changing libraries, objects, or connections,
by creating shortcuts for the File>Recent menu items.
42
InfoMaker
CHAPTER 1
❖
Working with InfoMaker
To associate a keyboard shortcut with a menu item:
1
Select Tools>Keyboard Shortcuts from the menu bar.
The keyboard shortcuts for the current menu bar display.
Keyboard shortcuts in a painter or tool
In a painter, the Keyboard Shortcuts dialog box includes both menu items
as well as additional actions that apply to the current painter or tool. These
nonmenu actions are listed under Additional Global Shortcuts and
Additional Painter Shortcuts. For example, the painter shortcuts for the
Form and Report painters include items from the Stylebar.
2
Select a menu item with no shortcut or a menu item with a default shortcut
that you want to change and then put the cursor in the Press Keys For
Shortcut textbox.
3
Press the keys you want for the shortcut; the new shortcut displays in the
textbox.
If you type a shortcut that is already being used, a message notifies you so
that you can type a different shortcut or change the existing shortcut.
Users Guide
43
Using the file editor
❖
To remove a keyboard shortcut associated with a menu item:
1
Select Tools>Keyboard Shortcuts from the menu bar.
2
Select the menu item with the shortcut you want to remove.
3
Click Remove.
You can reset keyboard shortcuts to the default shortcuts globally or only for
the current painter.
❖
To reset keyboard shortcuts to the default:
•
Click the Reset button and respond to the prompt.
Using the file editor
InfoMaker provides a text editor that is always available. Using the editor, you
can view and modify text files (such as initialization files and tab-separated
files with data) without leaving InfoMaker.
❖
To open the file editor:
1
Press Shift+F6 anywhere in InfoMaker.
Adding an Edit button
You can add an Edit button to the PowerBar. The button is available from
the PowerBar palette. For more information, see “Customizing toolbars”
on page 31.
2
Select File>Open File or click the Open icon (an open folder) on the
Painter bar to open the file you want to edit.
Setting file editing properties
The file editor has font properties and an indentation property that you can
change to make files easier to read. If you do not change any properties, files
have black text on a white background and a tab stop setting of 3 for
indentation.
44
InfoMaker
CHAPTER 1
❖
Working with InfoMaker
To specify File Editor properties:
1
Select Design>Options to display the property page.
2
Choose the tab appropriate to the property you want to specify.
Editor properties apply elsewhere
When you set properties for the file editor, the settings also apply to the
Interactive SQL view in the Database painter.
Editing activities
The file editor provides a full set of basic editing facilities including:
Using the file editor’s
PainterBar and menu
bar
•
Opening, saving, and printing files
•
Cutting, copying, pasting, and clearing selected text
•
Finding and replacing text
•
Undoing changes
•
Commenting and uncommenting lines
•
Importing and exporting text files
•
Dragging and dropping text
The file editor has a PainterBar that provides a shortcut for performing
frequently used activities. There is also a corresponding menu item (and often
a shortcut key) for each activity.
To see the shortcut keys, select Tools>Keyboard Shortcuts from the menu bar
and use the Keyboard Shortcuts dialog box.
Dragging and
dropping text
Users Guide
To move text, simply select it, drag it to its new location, and drop it. To copy
text, press the Ctrl key while you drag and drop the text.
45
Changing fonts
Changing fonts
Table 1-9 summarizes the various ways you can change the fonts used in
InfoMaker.
Table 1-9: Changing fonts
For this object or painter
Do this
A table’s data, headings, and
labels
In the Database painter, display the table’s property
page, and change the font properties on the Data,
Heading, and Label Font tabs.
Objects in the Form and
Report painters
Select objects and then modify settings in the
StyleBar, or, in the Properties view for one or more
objects, change the font properties on the Font tab.
Library painter and
MicroHelp
Select Tools>System Options from the menu bar
and change the font properties on the System or
Printer Font tab.
Interactive SQL view in the
Database painter and the file
editor (changes made for one
of these apply to both)
Select Design>Options from the menu bar to
display the editor’s property page and change the
font properties on the Editor or Printer Font tab.
Use the Printer font tab to set fonts specifically for printing. If you need to print
multilanguage characters, make sure you use a font that is installed on your
printer. Changes you make in the Tools>System Options dialog box and from
the Design>Options menu selection are used the next time you open
InfoMaker.
Accessing shared queries stored on a network
Your company may store a library (a PBL file) of queries on a network. Having
a query library is a convenient way to make carefully developed and
well-tested queries that go against corporate data available to everyone.
If you want to access a query library on a network, you must identify it as a
source of queries. Then when you create a new report, form, or pipeline, and
specify Query as your data source, InfoMaker includes the queries from the
query library in your list of available queries.
46
InfoMaker
CHAPTER 1
❖
Working with InfoMaker
To identify a query library as a source of queries:
1
Click the Library List button in the PowerBar and then select the Query
tab.
2
Enter one or more library search paths in the Library Search Path box, or
click Browse to select a library search path and then click Open to add the
library to the Library Search Path box.
3
Click OK.
InfoMaker sets the library search path for queries. This means that when
you start creating a new report, form, or pipeline, and choose Query as the
data source, your list of available queries includes all queries in all the
libraries in your search path as established in this process.
Defining libraries for user-defined form styles
InfoMaker provides four built-in form styles: Freeform, Grid, and two
Master/Detail styles. PowerBuilder developers in your organization can create
additional form styles that you can use to build forms.
To use the user-defined form styles, you identify the libraries (PBL files) that
contain them. Then when you create a new form, the user-defined form styles
display in the New Form dialog box:
Users Guide
47
Using the Query Governor
❖
To identify a library as a source of form styles:
1
Click the Library List button in the PowerBar.
2
On the Style tab page, enter one or more library search paths in the Library
Search Path box, or click Browse to select a library search path and then
click Open to add the library to the Library Search Path box.
If the page is disabled
If the Style page is disabled, close the dialog box and close any open
painters before trying again.
3
Click OK.
InfoMaker sets the library search path for user-defined form styles. When
you create a new form, the form styles defined in your organization display
in the Form Style box in the New Form dialog box.
Using the Query Governor
The Query Governor lets you set data selection and retrieval options for
InfoMaker. Then, when you select and retrieve data, the Query Governor limits
that you set apply.
Data selection options
Table 1-10 shows the data selection options you can set.
Table 1-10: Query Governor data selection options
Data selection options
Description
Specify the maximum
number of tables in a join
Specifying a maximum limits data selection.
Increasing the maximum means fewer restrictions on
data selection and longer retrieval times.
When cross products are allowed, you can have
tables not joined by the join operator. One row is
retrieved for each combination of rows in the tables.
If table A has x rows and table B has y rows, a cross
product of A and B has x times y rows, unless you
specify WHERE criteria.
When outer joins are allowed, all rows in a table are
retrieved whether or not a matching row exists in
another table.
Allow cross products
Allow outer joins
48
InfoMaker
CHAPTER 1
Data retrieval options
Working with InfoMaker
Data selection options
Description
Allow SELECT DISTINCT
statements
Usually a SELECT statement retrieves all rows
satisfying the SELECT statement. If SELECT
DISTINCT is specified, duplicate rows are not
retrieved. Retrieval time is often much longer when
DISTINCT is specified.
The data retrieval settings shown in Table 1-11 specify rows retrieved and
maximum time on the client, not the server.
Table 1-11: Query Governor data retrieval options
Data retrieval options
Description
Specify the maximum
number of rows retrieved
With no maximum set, all rows are retrieved.
Specifying a maximum number limits retrieval and
means shorter retrieval times
Specify the maximum time
for retrieval
With no maximum set, retrieval time is not limited.
Specifying a maximum time limits retrieval time
Using a shared InfoMaker initialization file
In some organizations, Query Governor options are specified in a shared
InfoMaker initialization file. For information about using a shared
initialization file, see Connecting to Your Database.
Accessing the Query Governor
The Query Governor button is not in the PowerBar when you install
InfoMaker.
❖
To access the Query Governor from the PowerBar:
1
Customize the PowerBar to add the Query Governor button.
For information about customizing toolbars, see “Customizing toolbars”
on page 31.
2
Users Guide
Click the Query Governor button in the PowerBar.
49
Using the Query Governor
Using the Query Governor
When you select and retrieve data, the default Query Governor options limit
you in the following ways:
You can do this
Join an unlimited number of tables
You cannot do this
Specify cross products
Retrieve an unlimited number of rows
Retrieve for an unlimited time
Specify outer joins
Use SELECT DISTINCT statements
You can change the Query Governor default options at any time by selecting or
deselecting the options in the Query Governor dialog box. If you are in the
Select painter when you change a data selection option, the change is not
enabled until you leave the Select painter and open it again.
❖
To use the Query Governor:
•
50
Access the Query Governor dialog box as described above and select
options:
InfoMaker
CHAPTER 1
Working with InfoMaker
How your InfoMaker environment is managed
Your InfoMaker configuration information is stored in both the IM.INI file and
the registry. When you start InfoMaker, it looks in the registry and the
InfoMaker initialization file to set up your environment.
About the registry
Some InfoMaker features require the use of the IM.INI file, but many features
use the registry to get and store configuration information. Normally, you
should not need to access or modify items in the registry.
Information related to your preferences (such as the way you have arranged
your views in the painters and the shortcut keys you have defined for
InfoMaker menu items) is stored in
HKEY_CURRENT_USER/Software/Sybase/InfoMaker/11.5.
Installation-related information is stored in
HKEY_LOCAL_MACHINE/Software/Sybase/InfoMaker/11.5.
About the initialization file
The initialization file is a text file that contains variables that specify your
InfoMaker preferences. These preferences include information such as the last
database you connected to and the PBL you are using. When you perform
certain actions in InfoMaker, InfoMaker writes your preferences to the
initialization file automatically.
Specifying
preferences
Normally, you do not need to edit the initialization file. You can specify all
your preferences by taking an action, such as resizing a window or opening a
new application, or by selecting Design>Options from one of the painters. But
sometimes a variable does not appear by default in the options sheet for the
painter. In this case, you can use a text editor to modify the variable in the
appropriate section of the initialization file.
Editing the initialization file
Do not use a text editor to edit the InfoMaker initialization file or any
preferences file while InfoMaker is running. InfoMaker caches the contents of
initialization files in memory and overwrites your edited InfoMaker
initialization file when it exits, ignoring changes.
Users Guide
51
How your InfoMaker environment is managed
Format of INI files
The InfoMaker initialization file uses the Windows INI file format. It has three
types of elements:
•
Section names, which are enclosed in square brackets
•
Keywords, which are the names of preference settings
•
Values, which are numeric or text strings, assigned as the value of the
associated keyword
A variable can be listed with no value specified, in which case the default is
used.
Some sections are always present by default, but others are created only when
you specify different preferences. If you specify preferences for another painter
or tool, InfoMaker creates a new section for it at the end of the file.
Where the
initialization file is kept
The initialization file is called IM.INI and is installed in the same directory as
the InfoMaker executable file.
Telling InfoMaker
where your
initialization file is
You can keep your initialization file in another location and tell InfoMaker
where it can find it by specifying the location in the System Options dialog box.
You might want to do this if you use more than one version of InfoMaker or if
you are running InfoMaker over a network.
❖
To record your initialization path:
1
Select Tools>System Options from the menu bar.
2
On the General tab page, enter the path of your initialization file in the
Initialization Path textbox.
InfoMaker records the path in the Windows registry.
How InfoMaker finds
the initialization file
InfoMaker looks in the Windows Registry for a path to the file, and then looks
for the file in the directory where InfoMaker is installed. If InfoMaker cannot
find the initialization file using the path in the Registry, it clears the path value.
If the initialization file
is missing
If InfoMaker does not find the initialization file when it starts up, it recreates
it. However, if you want to retain any preferences you have set, such as
database profiles, keep a backup copy of your initialization file. The recreated
file has the default preferences.
52
InfoMaker
CHAPTER 1
Working with InfoMaker
Starting InfoMaker from the command line
You can start InfoMaker from a command line (or the Windows Run dialog
box) and optionally open one of the following painters or tools:
Database painter
Library painter
Data Pipeline painter
File Editor
Query painter
Report painter
Form painter
To start InfoMaker and open a painter or tool, use the following syntax:
directory\im115.exe /P paintername
Parameter
directory
paintername
Description
The fully qualified name of the directory containing InfoMaker
The name of the painter you want to open. The default is the
window that displays when you begin a new InfoMaker session.
The painter name must uniquely identify the painter. You do not
have to enter the entire name. For example, you can enter q to
open the Query painter and datab to open the Database painter.
If you enter the full name, omit any spaces in the name (enter
DataPipeline, for example).
The painter name is not case sensitive. To open the file editor, you
could set paintername to FI or fileeditor.
Opening an object or
creating a new object
You can also add one or more of the following optional switches to the
command line to open a specific object or create a new one.
{/L libraryname} {/O objectname} {/N} {/R} {/RO} {/A arguments}
All of these switches must follow /P paintername, as shown in the examples
after the tables.
Table 1-12: InfoMaker command-line switches
Switch
/L
/O
/N
Identifies the object, such as a report, that you want to open
Creates a new report
/RO
Runs the report specified with /O and allows designing
Runs the report specified with /O but does not allow designing
/A
Provides retrieval arguments for the report specified with /O
/R
Users Guide
Description
Identifies the library that contains the object you want to open
53
Starting InfoMaker from the command line
Table 1-13: InfoMaker command-line parameters
Examples
Parameter
libraryname
Description
The name of the library that contains the object you want to open.
objectname
arguments
The name of the object you want to open.
For a report, retrieval arguments for the specified report. Arguments
must be in the correct order, separated by semicolons (;). Array
argument values must be separated by commas (,). Decimal arrays
are not supported.
The following examples use im11.5 to represent the directory where InfoMaker
is installed.
Enter this command to start InfoMaker and open the Database painter:
im11.5\im115.exe /P datab
Enter this command to start InfoMaker and open the report called
d_emp_report in the library master.pbl:
im11.5\im115.exe /P report /L master.pbl /O
d_emp_report
54
InfoMaker
CH A PTE R
2
About this chapter
Working with Libraries
InfoMaker stores all the objects you create in libraries. This chapter
describes how to work with your libraries.
Contents
Topic
About libraries
Page
55
About InfoMaker libraries and special files
Creating new libraries
56
57
About the Library painter
Working with libraries
58
59
Optimizing libraries
Regenerating library entries
67
67
Creating a library directory report
69
About libraries
InfoMaker uses libraries to hold objects. A library is a file with the file
extension PBL (pronounced pibble):
filename.pbl
In InfoMaker, you use the Library painter to work with the objects and
libraries you create.
What you can do in the
Library painter
Users Guide
The Library painter workspace displays objects in all libraries on your
computer, but you can set the Library painter to display only objects in the
current library. In the Library painter, you can:
•
Open objects in the current library to edit them in the appropriate
painters
•
Copy, move, and delete objects in any library
•
Optimize libraries
•
Migrate, rebuild, and regenerate libraries
55
About InfoMaker libraries and special files
•
Bundle reports, forms, and pipelines in an application that you and others
can use
For information about creating an application, see Chapter 21, “Working
with Applications.”
What you cannot do in
the Library painter
You cannot create a library or rename a library in the Library painter. For
information about creating a library, see “Creating new libraries” on page 57.
You cannot create new reports, forms, queries, or pipelines in the Library
painter.
You cannot open objects that are not in the current library.
About InfoMaker libraries and special files
InfoMaker uses libraries and special files.
PBL files
(PowerBuilder
libraries)
PBL files are the libraries you work with in InfoMaker. In the Library painter,
you manage the objects in these libraries. In other painters, you create and
access objects stored in PBLs.
When you open the Library painter the first time
When you open the Library painter, the Library painter has your computer as
the root. You can set the Library painter to display objects in the current library,
tutor_im.pbl. This is the default InfoMaker library that contains sample objects
based on the EAS Demo DB.
Many examples shown in this book are in tutor_im.pbl for your convenience.
You can open the objects, look at their design, and use them.
Two libraries are installed in the InfoMaker 11.5 directory when you install
InfoMaker: imstyletradition115.pbl and imstylecontemp115.pbl. These
libraries are used as templates to create new objects in InfoMaker and should
not be opened and edited. Do not set one of these libraries as your current
library. If you do, its name will not display in the Library pane in the Open,
Run, and Save dialog boxes. You must open another existing library or create
a new one to work in InfoMaker.
PSR files (Powersoft
report files)
56
PSR files contain reports. Each PSR file contains a report definition (source
and object) as well as the data contained in the report when the PSR file was
created.
InfoMaker
CHAPTER 2
Working with Libraries
Creating new libraries
When you create a new library, the new library becomes the current library.
Until you create new objects and save them, no objects exist in the current
library.
❖
To create a new library:
1
Click the New button in the PowerBar.
The New dialog box displays.
Another way to create a new library
You can also Click the Select Library button on the PowerBar and use the
New tab page in the Select Library dialog box.
2
On the Library tab page, select the Library icon and click OK.
3
Type a library name, or click the browse button to navigate to a folder and
then type a library name.
4
Click Finish.
The new library is created, it becomes the current library, and its name displays
in the InfoMaker title bar.
Users Guide
57
About the Library painter
About the Library painter
❖
To open the Library painter:
•
Views in the Library
painter
Click the Library button in the PowerBar.
The Library painter has two views that you use for displaying library files
(PBLs) and the objects they contain. The two views, which are available from
the View menu, are Tree and List.
By default, the Library painter displays one Tree view (on the left) and one List
view (on the right). When the Library painter opens, both the Tree view and the
List view display the drives that are on your computer or mapped to it.
About the Tree view
and the List view
Tree view The Tree view displays the drives and folders on the computer and
the libraries and objects they contain.
List view The List view also displays the drives and folders on the computer
and the libraries and objects they contain, but the view has columns with
headers. For libraries, the comment column displays any comment associated
with the library. For objects, the columns display the object name, modification
date, size, and any comment associated with the object. You can resize columns
by moving the splitter bar between columns. You can sort a column’s contents
by clicking the column header.
Displaying items in the
Tree view and the List
view
58
Most of the time, you select a library in the Tree view and display the objects
in that library in the List view. You can set a new root or move back and
forward in the history of your actions in the List view and the Tree view so
libraries or other items display. For information about setting the root, see
“Setting the root” on page 64. For information about moving back or forward,
see “Moving back, forward, and up one level” on page 65.
InfoMaker
CHAPTER 2
Working with Libraries
About sorting the Name column
When you click the Name column header repeatedly to sort, the sort happens
in four ways: by object type and then name in both ascending and descending
order and by object name in both ascending and descending order. You may not
easily observe the four ways of sorting if all objects of the same type have
names that begin with the same character or set of characters.
Working with libraries
You work with libraries in the Library painter.
Displaying libraries and objects
What you see in the
views
In the Tree view, you can expand items and see the folders, libraries, or objects
they contain. In the List view, you do not see expansions and contractions of
contents. The List view displays only contents. You cannot see any files that
are not in libraries.
If the Form painter and Data Pipeline painter are not installed
Even if the Form painter and the Data Pipeline painter are not installed, if a
library contains forms and pipelines, you see them in the Library painter.
❖
To expand or collapse an item in the Tree view:
•
Double-click the item.
If the item contains libraries or objects, they display in the List view.
❖
To display the contents of an item in the List view:
•
Using drag and drop
to expand items
Users Guide
Select the item in the Tree view, or double-click the item in the List view.
You can drag and drop items to expand them and see the contents:
If you drag an item
from a
And drop it in a
This happens
Tree view or List view
List view
The List view sets the item as the
root and displays the contents
Tree view or List view
Tree view
The Tree view expands to that item
59
Working with libraries
For example, you can drag a library from the Tree view and drop it in the List
view to quickly display the objects the library contains in the List view. For
information about using drag and drop to copy or move items, see “Copying,
moving, and deleting objects” on page 63.
Using the pop-up menu
Like the other painters, the Library painter has a pop-up menu that provides
menu items that apply to the selected item in the Tree view or the List view. For
example, from a library’s pop-up menu, you can delete, search, optimize, print
the directory, set the library as the working (current) library, specify the objects
that display in that library, or display library properties. From an object’s
pop-up menu, you can edit (go to the painter), copy, move, or delete the object.
Controlling columns that display in the List view
You can control whether to display the last modification date, compilation date,
size, and comments (if a comment was created when an object or library was
created) in the List view.
❖
To control the display of columns in the List view:
1
Select Design>Options from the menu bar.
2
On the General tab page, select or clear these display items: Modification
Date, Compilation Date, Sizes, and Comments.
Selecting objects
In the List view, you can select one or more libraries or objects to act on.
❖
To select multiple entries:
•
❖
To select all entries:
•
60
In the List view, use Ctrl+click (for individual entries) and Shift+click (for
a group of entries).
In the List view, select an object and then click the Select All button on the
PainterBar.
InfoMaker
CHAPTER 2
Working with Libraries
Filtering the display of objects
You can change which objects display in expanded libraries.
Settings are remembered
InfoMaker records your preferences in the Library section of the InfoMaker
initialization file so that the next time you open the Library painter, the same
objects and information are displayed.
Specifying which
objects display in all
libraries
Initially in the Tree and List views, the Library painter displays all objects in
libraries that you expand. You can specify that the Library painter display in all
libraries only specific kinds of objects and/or objects whose names match a
specific pattern. For example, you can limit the display to reports, or to reports
that begin with emp_.
❖
To restrict which objects are displayed:
1
Select Design>Options from the menu bar and select the Include tab.
2
In the Options dialog box, specify the display criteria:
3
•
To limit the display to entries that contain specific text in their names,
enter the text in the Name box. You can use the wildcard characters
question mark (?) and asterisk (*) in the string: ? represents one
character, * represents any string of characters. The default is all
entries of the selected types.
•
To limit the display to specific entry types, clear the check boxes for
the entry types that you do not want to display. The default is all
entries.
Click OK.
The Options dialog box closes.
4
Overriding the choices
you made for a
specific view
Users Guide
In the Tree view, expand libraries or select a library to display the objects
that meet the criteria.
In either the Tree view or the List view, you can override your choice of objects
that display in all libraries by selecting a library, displaying the library’s pop-up
menu, and then clearing or selecting items on the list of objects.
61
Working with libraries
Filtering the display of libraries and folders
In either the Tree view or the List view, you can control what displays when
you expand a drive or folder. An expanded drive or folder can display only
libraries, only folders, or both.
❖
To control the display of libraries and folders:
•
In either view, select a drive or folder and then select or clear Libraries
and/or Folders from the pop-up menu.
Working in the current library
In InfoMaker, you are always working in a current library. The most recent
object is the object you most recently opened.
❖
To display objects in the current library:
1
Click in the Tree view or the List view.
2
Click the Most Recent Object button in the PainterBar, or select
View>Most Recent Object from the menu bar.
The current library displays in the view you selected with the most recent
object highlighted.
Always displaying the current library
For information about setting the root to the Library List so that you can always
display the current library, see “Setting the root” on page 64.
Changing the current library
You may want to change the library you are working in.
❖
To change the current library:
•
In either view, right-click the new library you want to work in and select
Set as Working Library from the pop-up menu.
The new library’s name displays in the title bar.
62
InfoMaker
CHAPTER 2
Working with Libraries
Opening and previewing objects
You can open and preview objects in the current library.
❖
To open an object:
•
In either the Tree view or the List view, double-click the object, or select
Edit from the object’s pop-up menu.
InfoMaker takes you to the painter for that object and opens the object.
You can work on the object and save it as you work. When you close it,
you return to the Library painter.
You can run forms and preview reports from the Library painter.
❖
To preview an object in the Library painter:
•
Select Run/Preview from the object’s pop-up menu.
Copying, moving, and deleting objects
As your needs change, you may want to rearrange the objects in libraries. To
do that, you need to be able to copy and move objects between libraries or
delete objects that you no longer need.
❖
To copy or move objects using drag and drop:
1
In the Tree view or the List view, select the objects you want to copy or
move.
2
Press Shift to move the entries.
Otherwise, the objects will be copied.
3
Drag the objects to a library in either view (or if the contents of a library
are displayed in the List view, you can drop the objects there).
If copying, InfoMaker replicates the objects. If moving, InfoMaker moves
the objects and deletes them from the source library. If an object with the
same name already exists, InfoMaker prompts you and, if you allow it,
replaces the existing object with the copied or moved object.
❖
To copy or move objects using a button or menu item:
1
Users Guide
Select the objects you want to copy or move to another library.
63
Working with libraries
2
Click the Copy button or the Move button on the Painterbar, or select
Entry>Copy or Entry>Move from the menu bar.
The Select Library dialog box displays.
3
❖
Select the library to which you want to copy or move the objects and click
OK.
To delete objects:
1
Select the objects you want to delete.
2
Click the Delete button, or select Entry>Delete from the menu bar.
You are prompted to confirm the first deletion.
Being asked for confirmation
By default, InfoMaker asks you to confirm each deletion. If you do not
want to have to confirm deletions, select Design>Options to open the
Options dialog box for the Library painter and clear the Confirm on Delete
check box in the General tab page.
InfoMaker records this preference as the DeletePrompt variable in the
Library section of the IM.INI file.
3
Click Yes to delete the entry or Yes To All to delete all entries. Click No
to skip the current entry and go on to the next selected entry.
Setting the root
In either the Tree view or the List view, you can set the root location of the
view.
❖
To set the root of the current view:
1
64
In either view, select View>Set Root from the menu bar, or select Set Root
from the pop-up menu.
InfoMaker
CHAPTER 2
2
Working with Libraries
If you want the root to be a directory or library, type the path or browse to
the path.
If you set the root to the Library List in both the Tree view and the List view,
only the name of the current library displays in the Tree view and only the
objects in the current library display in the List view.
Moving back, forward, and up one level
You can also set a new root by moving back to where you were before, moving
forward to where you just were, or for the List view, moving up a level.
❖
To move back, forward, or up one level:
•
Select View>Back, View>Forward, or View>Up One Level from the
menu bar, or select Back, Forward, or Up One Level from the pop-up
menu.
The name of the location you are moving back to or forward to is appended
to Back and Forward.
Modifying comments
You can use comments to document your objects and libraries. You can
associate comments with an object when you first save it in a painter, and you
can use the Library painter to:
❖
Users Guide
•
Modify existing comments for objects
•
Add comments to objects that do not currently have any comments
•
Modify the comments for a single object
•
Modify comments for multiple objects using a shortcut
•
Modify comments for a library
To modify comments for objects:
1
In the List view, select the objects you want.
2
Select Entry>Properties from the menu bar, or select Properties from the
pop-up menu.
65
Working with libraries
InfoMaker displays the Properties dialog box. The information that
displays is for the first object you selected. You can change existing
comments, or, if there are no comments, you can enter new descriptive
text.
3
Click OK when you have finished with the first object.
If you do not want to change the comments for an object, click OK. The
next object displays.
4
Enter comments and click OK for each object until you have finished.
If you want to stop working on comments before you finish with the
objects you selected, click Cancel. The comments you have entered until
the most recent OK are retained. The new comments display in the Library
painter workspace.
❖
To modify comments for a library:
1
Select the library you want.
2
Click the Properties button, or select Library from the pop-up menu.
3
Add or modify the comments.
Deleting libraries
❖
To delete a library:
1
In either the Tree view or the List view, select the library you want to
delete.
2
Select Library>Delete from the menu bar.
Restriction
You cannot delete the current library.
The Delete Library dialog box displays, showing the library you selected.
3
Click Yes to delete the library.
The library and all its entries are deleted. You cannot get them back.
66
InfoMaker
CHAPTER 2
Working with Libraries
Optimizing libraries
You might need to optimize your libraries occasionally. Optimizing removes
gaps in libraries and defragments the storage of objects, thus improving
performance.
Optimizing affects only layout on disk; it does not affect the contents of the
objects. Objects are not recompiled when you optimize a library.
❖
To optimize a library:
1
In either Tree view or List view, choose the library you want to optimize.
2
Select Library>Optimize from the menu bar, or select Optimize from the
library’s pop-up menu.
InfoMaker reorganizes the library structure to optimize object and data
storage and index locations. Note that InfoMaker does not change the
modification date for the library entries. InfoMaker saves the unoptimized
version as a backup file in the same directory.
The optimized file is created with the default permissions for the drive
where it is stored. On some systems new files are not shareable by default.
If you see “save of object failed” or “link error” messages after optimizing,
check the permissions assigned to the PBL.
If you do not want a backup file
If you do not want to save a backup copy of the library, clear the Save
Optimized Backups check box in the Library painter’s Design>Options
tab dialog box. If you clear this option, the new setting remains in effect
until you change it.
Regenerating library entries
Occasionally you may need to update library entries. For example:
•
Users Guide
When a PowerBuilder developer modifies a form style using a window in
imstyletradition115.pbl or imstylecontemp115.pbl, the developer is
modifying an ancestor object and you should regenerate forms (the
descendants) so that they pick up the revisions to their ancestor.
67
Regenerating library entries
•
When you make extensive changes to objects, you can rebuild entire
libraries so that objects are regenerated sequentially based on
interdependence.
•
When you upgrade to a new version of InfoMaker, you need to migrate
your objects.
When you regenerate an entry, InfoMaker recompiles the source form stored in
the library and replaces the existing compiled form with the recompiled form.
❖
To regenerate library entries:
1
Select the entries you want to regenerate.
2
Click the Regen button, or select Entry>Regenerate from the menu bar.
InfoMaker uses the source to regenerate the library entry and replaces the
current compiled object with the regenerated object. The compilation date
and size are updated.
Rebuilding libraries
When you make modifications to objects and need to update one or more
libraries, you should use the Rebuild option to update all the library objects in
the correct sequence.
There are two methods to use when you rebuild an application:
❖
68
•
Incremental rebuild updates all the objects and libraries referenced by any
objects that have been changed.
•
Full rebuild updates all the objects and libraries.
To rebuild libraries:
1
Select the libraries you want to rebuild.
2
Depending on your needs, choose either Design>Incremental Build or
Design>Full Build from the menu bar.
InfoMaker
CHAPTER 2
Working with Libraries
Migrating libraries
When you upgrade to a new version of InfoMaker, your existing libraries need
to be migrated to the new version.
Make sure PBLs are writable
If you make copies of your libraries before you migrate to a new version of
InfoMaker, make sure that the libraries you will migrate are writable.
Your libraries must be migrated one at a time since a library must be the current
library for you to migrate it.
❖
To migrate libraries:
1
Select the current library and then select Design>Migrate.
The Migrate Application dialog box displays.
2
Click OK.
InfoMaker migrates all objects in the library to the current version.
Creating a library directory report
A library directory report lists all entries in the current library, showing the
following information for all objects in the library, ordered by object type:
❖
•
Name of object
•
Modification date and time
•
Size (of compiled object)
•
Comments
To create the library directory report:
1
Select the current library.
2
Select Library>Print Directory from the menu bar.
InfoMaker sends the library directory report to the printer specified under
File>Printer Setup in the menu bar.
Users Guide
69
Creating a library directory report
70
InfoMaker
PART
2
Working with Databases
This part describes how to use InfoMaker to manage your
database and how to use the Data Pipeline painter to copy
data from one database to another.
CH A PTE R
3
About this chapter
Managing the Database
This chapter describes how to manage a database from within InfoMaker.
Contents
Before you begin
Topic
Working with database components
Page
73
Managing databases
Using the Database painter
77
78
Creating and deleting a SQL Anywhere database
Working with tables
83
84
Working with keys
Working with indexes
97
101
Working with database views
Manipulating data
103
108
Creating and executing SQL statements
Controlling access to the current database
115
119
You work with relational databases in InfoMaker. If you are not familiar
with relational databases, you might want to consult an introductory text.
Working with database components
A database is an electronic storage place for data. Databases are designed
to ensure that data is valid and consistent and that it can be accessed,
modified, and shared.
A database management system (DBMS) governs the activities of a
database and enforces rules that ensure data integrity. A relational DBMS
stores and organizes data in tables.
How you work with
databases in InfoMaker
Users Guide
You can use InfoMaker to work with the following database components:
•
Tables and columns
•
Keys
73
Working with database components
Tables and columns
•
Indexes
•
Database views
•
Extended attributes
•
Additional database components
A database usually has many tables, each of which contains rows and columns
of data. Each row in a table has the same columns, but a column’s value for a
particular row could be empty or NULL if the column’s definition allows it.
Tables often have relationships with other tables. For example, in the EAS
Demo DB included with InfoMaker, the Department table has a Dept_id
column, and the Employee table also has a Dept_id column that identifies the
department in which the employee works. When you work with the Department
table and the Employee table, the relationship between them is specified by a
join of the two tables.
Keys
Relational databases use keys to ensure database integrity.
Primary keys A primary key is a column or set of columns that uniquely
identifies each row in a table. For example, two employees may have the same
first and last names, but they have unique ID numbers. The Emp_id column in
the Employee table is the primary key column.
Foreign keys A foreign key is a column or set of columns that contains
primary key values from another table. For example, the Dept_id column is the
primary key column in the Department table and a foreign key in the Employee
table.
Key icons In InfoMaker, columns defined as keys are displayed with key
icons that use different shapes and colors for primary and foreign. InfoMaker
automatically joins tables that have a primary/foreign key relationship, with the
join on the key columns.
74
InfoMaker
CHAPTER 3
Managing the Database
In the following illustration there is a join on the dept_id column, which is a
primary key for the department table and a foreign key for the employee table:
For more information, see “Working with keys” on page 97.
Indexes
An index is a column or set of columns you identify to improve database
performance when searching for data specified by the index. You index a
column that contains information you will need frequently. Primary and
foreign keys are special examples of indexes.
You specify a column or set of columns with unique values as a unique index,
represented by an icon with a single key.
You specify a column or set of columns that has values that are not unique as a
duplicate index, represented by an icon with two file cabinets.
For more information, see “Working with indexes” on page 101.
Database views
If you often select data from the same tables and columns, you can create a
database view of the tables. You give the database view a name, and each time
you refer to it the associated SELECT command executes to find the data.
Database views are listed in the Objects view of the Database painter and can
be displayed in the Object Layout view, but a database view does not physically
exist in the database in the same way that a table does. Only its definition is
stored in the database, and the view is re-created whenever the definition is
used.
Database administrators often create database views for security purposes. For
example, a database view of an Employee table that is available to users who
are not in Human Resources might show all columns except Salary.
For more information, see “Working with database views” on page 103.
Users Guide
75
Working with database components
Extended attributes
Extended attributes enable you to store information about a table’s columns in
special system tables. Unlike tables, keys, indexes, and database views (which
are DBMS-specific), extended attributes are InfoMaker-specific. The most
powerful extended attributes determine the edit style, display format, and
validation rules for the column.
For more information about extended attributes, see “Specifying column
extended attributes” on page 88. For more information about the extended
attribute system tables, see Appendix B, “The Extended Attribute System
Tables.”
Additional database
components
Depending on the database to which you are connected and on your user
privileges, you may be able to view or work with a variety of additional
database components through InfoMaker. These components might include:
Driver information
Groups
Metadata types
Procedures and functions
Users
Logins
Triggers
Events
Web services
For example, driver information is relevant to ODBC connections. It lists all
the ODBC options associated with the ODBC driver, allowing you to
determine how the ODBC interface will behave for a given connection. Login
information is listed for Adaptive Server® Enterprise database connections.
Information about groups and users is listed for several of the databases and
allows you to add new users and groups and maintain passwords for existing
users.
You can drag most items in these folders to the Object Details view to display
their properties. You can also drag procedures, functions, triggers, and events
to the ISQL view.
Trigger information is listed for Adaptive Server Enterprise and SQL
Anywhere tables. A trigger is a special form of stored procedure that is
associated with a specific database table. Triggers fire automatically whenever
someone inserts, updates or deletes rows of the associated table. Triggers can
call procedures and fire other triggers, but they have no parameters and cannot
be invoked by a CALL statement. You use triggers when referential integrity
and other declarative constraints are insufficient.
76
InfoMaker
CHAPTER 3
Managing the Database
Events can be used in a SQL Anywhere database to automate database
administration tasks, such as sending a message when disk space is low. Event
handlers are activated when a provided trigger condition is met. If any events
are defined for a SQL Anywhere connection, they display in the Events folder
for the connection in the Objects view.
Managing databases
InfoMaker supports many database management systems (DBMSs). For the
most part, you work the same way in InfoMaker for each DBMS, but because
each DBMS provides some unique features (which InfoMaker makes use of),
there are some issues that are specific to a particular DBMS. For complete
information about using your DBMS, see Connecting to Your Database.
What you can do
If you installed the Database painter, you can do the following in any DBMS
to which you have been given access by the database administrator:
•
Modify local table and column properties
•
Retrieve, change, and insert data
•
Create new local tables or modify existing tables
If you did not install the Database painter, you can report on data in tables to
which you have access, but you cannot change data, create new tables, or
modify existing tables.
Setting the database
connection
When you open a painter that communicates with the database (such as the
Database painter or DataWindow painter), InfoMaker connects you to the
database you used last if you are not already connected. If the connection to the
default database fails, the painter still opens.
If you do not want to connect to the database you used last, you can deselect
the Connect to Default Profile option in the Database Preferences dialog box.
Changing the
database connection
You can change to a different database at any time. When you connect to a
different database, the existing connection is closed. The database components
for the current connection are listed in the Objects view, and the title bars of the
painter and of views in the painter display the current connection. For more
about changing the database you are connected to, see Connecting to Your
Database.
Creating and deleting
databases
When you are connected to SQL Anywhere, you can create a new database or
delete an existing database using the Database painter.
Users Guide
77
Using the Database painter
For all other DBMSs, creating and deleting a database is an administrative task
that you cannot do within InfoMaker.
Using the Database painter
To open the Database painter, click the Database button in the PowerBar.
About the painter
Like the other InfoMaker painters, the Database painter contains a menu bar,
customizable PainterBars, and several views. All database-related tasks that
you can do in InfoMaker can be done in the Database painter.
Views in the Database
painter
Table 3-1 lists the views available in the Database painter.
Table 3-1: Database painter views
View
Description
Activity Log
Displays the SQL syntax generated by the actions you
execute.
Columns
Extended Attributes
Used to create and/or modify a table’s columns.
Lists the display formats, edit styles, and validation rules
defined for the selected database connection.
Used to build, execute, or explain SQL.
Interactive SQL
Object Details
78
Displays an object’s properties. For some objects, its
properties are read-only; for others, properties can be
modified. This view is analogous to the Properties view in
other painters.
InfoMaker
CHAPTER 3
View
Description
Object Layout
Displays a graphical representation of tables and their
relationships.
Objects
Lists database interfaces and profiles. For an active database
connection, might also list all or some of the following
objects associated with that database: groups, metadata
types, procedures and functions, tables, columns, primary
and foreign keys, indexes, users, views, driver information,
events, triggers, and utilities (the database components
listed depend on the database and your user privileges).
Displays data in a grid, table, or freeform format.
Results
Dragging and
dropping
Managing the Database
You can select certain database objects from the Objects view and drag them
to the Object Details, Object Layout, Columns, and/or ISQL views. Position
the pointer on the database object’s icon and drag it to the appropriate view.
Table 3-2: Using drag and drop in the Database painter
Database painter
tasks
Users Guide
Object
Driver, group, metadata type, procedure or function,
table, column, user, primary or foreign key, index, event
trigger
Can be dragged to
Object Details view
Table or view
Table or column
Object Layout view
Columns view
Procedure or view
ISQL view
Table 3-3 describes how to do some basic tasks in the Database painter. Most
of these tasks begin in the Objects view. Many can be accomplished by
dragging and dropping objects into different views. If you prefer, you can use
buttons or menu selections from the menu bar or from pop-up menus.
79
Using the Database painter
Table 3-3: Common tasks in the Database painter
To
Modify a database profile
Connect to a database
Create new profiles,
tables, views, columns,
keys, indexes, or groups
Modify database objects
You can use the Import and Export Profiles menu
selections to copy profiles. For more information, see
the section on importing and exporting database profiles
in Connecting to Your Database.
Highlight a database profile and then select Connect
from the File or pop-up menu or use the Connect button.
With File>Recent Connections, you can review and
return to earlier connections. You can also make
database connections using the Database Profile button.
Highlight the database object and select New from the
Object or pop-up menu or use the Create button.
Drag the object to the Object Details view.
Graphically display tables
Drag the table icon from the list in the Objects view to
the Object Layout view, or highlight the table and select
Add To Layout from the Object or pop-up menu.
Manipulate data
Highlight the table and select Grid, Tabular, or Freeform
from the Object>Data menu or the pop-up menu Edit
Data item, or use the appropriate Data Manipulation
button.
Use the ISQL view to build SQL statements. Use the
Paste SQL button to paste SELECT, INSERT, UPDATE,
and DELETE statements or type them directly into the
view’s workspace. To execute or explain SQL, select
Execute SQL and Explain SQL from the Design or
pop-up menu.
Build, execute or explain
SQL
Define or modify
extended attributes
Specify extended
attributes for a column
Access database utilities
Log your work
80
Do this
Highlight a database profile and select Properties from
the Object or pop-up menu or use the Properties button.
Select from the Object>Insert menu the type of extended
attribute you want to define or modify, or highlight the
extended attribute from the list in the Extended
Attributes view and select New or Properties from the
pop-up menu.
Drag the column to the Object Details view and select
the Extended Attributes tab.
Double-click a utility in the Objects view to launch it.
Select Design>Start Log from the menu bar. To see the
SQL syntax generated, display the Activity Log view.
InfoMaker
CHAPTER 3
Managing the Database
Modifying database preferences
To modify database preferences, select Design>Options from the menu bar.
Some preferences are specific to the database connection; others are specific to
the Database painter.
Preferences on the
General property page
The Connect To Default Profile, Shared Database Profiles, Keep Connection
Open, Use Extended Attributes, and Read Only preferences are specific to the
database connection.
The remaining preferences are specific to the Database painter. For information
about modifying these preferences, see Connecting to Your Database.
Table 3-4: Database painter preferences
Database
preference
Columns in the
Table List
SQL Terminator
Character
Refresh Table List
Preferences on the
Object Colors property
page
What InfoMaker does with the specified preference
When InfoMaker displays tables graphically, eight table
columns display unless you change the number of columns.
InfoMaker uses the semicolon as the SQL statement terminator
unless you enter a different terminator character in the box.
Make sure that the character you choose is not reserved for
another use by your database vendor. For example, using the
slash character (/) causes compilation errors with some
DBMSs.
When InfoMaker first displays a table list, InfoMaker retrieves
the table list from the database and displays it. To save time,
InfoMaker saves this list internally for reuse to avoid
regeneration of very large table lists. The table list is refreshed
every 30 minutes (1800 seconds) unless you specify a different
refresh rate.
You can set colors separately for each component of the Database painter’s
graphical table representation: the table header, columns, indexes, primary key,
foreign keys, and joins. Set a color preference by selecting a color from a
drop-down list.
You can design custom colors that you can use when you select color
preferences. To design custom colors, select Design>Custom Colors from the
menu bar and work in the Custom Colors dialog box.
Users Guide
81
Using the Database painter
Logging your work
As you work with your database, you generate SQL statements. As you define
a new table, for example, InfoMaker builds a SQL CREATE TABLE statement
internally. When you save the table, InfoMaker sends the SQL statement to the
DBMS to create the table. Similarly, when you add an index, InfoMaker builds
a CREATE INDEX statement.
You can see all SQL generated in a Database painter session in the Activity Log
view. You can also save this information to a file. This allows you to have a
record of your work and makes it easy to duplicate the work if you need to
create the same or similar tables in another database.
❖
To start logging your work:
1
Open the Database painter.
2
Select Start Log from the Design menu or the pop-up menu in the Activity
Log view.
InfoMaker begins sending all generated syntax to the Activity Log view.
❖
To stop the log:
•
Select Stop Log from the Design menu or the pop-up menu in the Activity
Log view.
InfoMaker stops sending the generated syntax to the Activity Log view.
Your work is no longer logged.
❖
To save the log to a permanent text file:
1
Select Save or Save As from the File menu.
2
Name the file and click Save. The default file extension is SQL, but you
can change that if you want to.
Submitting the log to your DBMS
You can open a saved log file and submit it to your DBMS in the ISQL view.
For more information, see “Building and executing SQL statements” on page
115.
82
InfoMaker
CHAPTER 3
Managing the Database
Creating and deleting a SQL Anywhere database
In InfoMaker you work within an existing database. With one exception,
creating or deleting a database is an administrative task that is not performed
directly in InfoMaker. The one exception is that you can create and delete a
local SQL Anywhere database from within InfoMaker.
For information about creating and deleting other databases, see your DBMS
documentation.
❖
To create a local SQL Anywhere database:
1
From the Objects view, launch the Create ASA Database utility included
with the ODBC interface.
The Create Adaptive Server Anywhere Database dialog box displays.
2
In the Database Name box, specify the file name and path of the database
you are creating.
If you do not provide a file extension, the database file name is given the
extension DB.
3
Define other properties of the database as needed.
If you are using a non-English database, you can specify a code page in the
Collation Sequence box.
For complete information about filling in the dialog box, click the Help
button in the dialog box.
4
Click OK.
When you click OK, InfoMaker does the following:
Users Guide
•
Creates a database with the specified name in the specified directory
or folder. If a database with the same name exists, you are asked
whether you want to replace it.
•
Adds a data source to the ODBC.INI key in the registry. The data
source has the same name as the database unless one with the same
name already exists, in which case a suffix is appended.
•
Creates a database profile and adds it to the registry. The profile has
the same name as the database unless one with the same name already
exists, in which case a suffix is appended.
•
Connects to the new database.
83
Working with tables
❖
To delete a local SQL Anywhere database:
1
Open the Database painter.
2
From the Objects view, launch the Delete ASA Database utility included
with the ODBC interface.
The Delete Local Database dialog box displays.
3
Select the database you want to delete and select Open.
4
Click Yes to delete the database.
When you click Yes, InfoMaker deletes the specified database.
Working with tables
When you open the Database painter, the Object view lists all tables in the
current database that you have access to (including tables that were not created
using InfoMaker). You can create a new table or alter an existing table. You can
also modify table properties and work with indexes and keys.
Creating a new table from scratch
In InfoMaker, you can create a new table in any database to which InfoMaker
is connected.
❖
To create a table in the current database:
1
Do one of the following:
•
Click the Create Table button.
•
Right-click in the Columns view and select New Table from the popup menu.
•
Right-click Tables in the Objects view and select New Table from the
pop-up menu.
•
Select Insert>Table from the Object menu.
The new table template displays in the Columns view. What you see in the
view is DBMS-dependent. You use this template to specify each column
in the table. The insertion point is in the Column Name box for the first
column.
84
InfoMaker
CHAPTER 3
2
Managing the Database
Enter the required information for this column.
For what to enter in each field, see “Specifying column definitions” on
page 86.
As you enter information, use the Tab key to move from place to place in
the column definition. After defining the last item in the column
definition, press the Tab key to display the work area for the next column.
3
Repeat step 2 for each additional column in your table.
4
(Optional) Select Object>Pending Syntax from the menu bar or select
Pending Syntax from the pop-up menu to see the pending SQL syntax.
If you have not already named the table, you must provide a name in the
dialog box that displays. To hide the SQL syntax and return to the table
columns, select Object>Pending Syntax from the menu bar.
5
Click the Save button or select Save from the File or pop-up menu, then
enter a name for the table in the Create New Table dialog box.
InfoMaker submits the pending SQL syntax statements it generated to the
DBMS, and the table is created. The new table is displayed in the Object
Layout view.
About saving the table
If you make changes after you save the table and before you close it, you
see the pending changes when you select Pending SQL again. When you
click Save again, InfoMaker submits a DROP TABLE statement to the
DBMS, recreates the table, and applies all changes that are pending.
Clicking Save many times can be time consuming when you are working
with large tables, so you might want to save only when you have finished.
6
Specify extended attributes for the columns.
For what to enter in each field, see “Specifying column extended
attributes” on page 88.
Users Guide
85
Working with tables
Creating a new table from an existing table
You can create a new table that is similar to an existing table very quickly by
using the Save Table As menu option.
❖
To create a new table from an existing table:
1
Open the existing table in the Columns view by dragging and dropping it
or selecting Alter Table from the pop-up menu.
2
Right-click in the Columns view and select Save Table As from the pop-up
menu.
The Create New Table dialog box displays.
3
Enter a name for the new table and then the owner’s name, and click OK.
The new table appears in the Object Layout view and the Columns view.
4
Make whatever changes you want to the table definition.
5
Save the table.
6
Make changes to the table’s properties in the Object Details view.
For more information about modifying table properties, see “Specifying
table and column properties” on page 87.
Specifying column definitions
When you create a new table, you must specify a definition for each column.
The fields that display for each column in the Columns view depend on your
DBMS. You might not see all of the following fields, and the values that you
can enter are dependent on the DBMS.
For more information, see your DBMS documentation.
Table 3-5: Defining columns in the Columns view in the Database
painter
Field
Column Name
What you enter
(Required) The name by which the column will be identified.
Data Type
(Required) Select a datatype from the drop-down list. All
datatypes supported by the current DBMS are displayed in the list.
For datatypes with variable widths, the number of characters in
the field.
For numeric datatypes, the number of decimal places to display.
Width
Dec
86
InfoMaker
CHAPTER 3
Field
Managing the Database
What you enter
Null
Select Yes or No from the Null drop-down list to specify whether
NULLs are allowed in the column. Specifying No means the
column cannot have null values; users must supply a value. No is
the default in a new table.
The value that will be placed in a column in a row that you insert
into a form. The drop-down list has built-in choices, but you can
type any other value. For an explanation of the built-in choices,
see your DBMS documentation.
Default
Specifying table and column properties
After you create and save a table, you can specify the properties of the table
and of any or its columns. Table properties include the fonts used for headers,
labels, and data, and a comment that you can associate with the table. Column
properties include the text used for headers and labels, display formats,
validation rules, and edit styles used for data (also known as a column’s
extended attributes), and a comment you can associate with the column.
Specifying table properties
In addition to adding a comment to associate with the table, you can choose the
fonts that will be used to display information from the table in a report or form.
You can specify the font, point size, color, and style.
❖
To specify table properties:
1
Do one of the following:
•
Highlight the table in either the Objects view or the Object Layout
view and select Properties from the Object or pop-up menu.
•
Click the Properties button.
•
Drag and drop the table to the Object Details view.
The properties for the table display in the Object Details view.
2
Users Guide
Select a tab and specify properties:
Select this tab
General
To modify this property
Comments associated with the table
Data Font
Font for data retrieved from the database and displayed in
the Results view by clicking a Data Manipulation button
87
Working with tables
Select this tab
To modify this property
Heading Font
Font for column identifiers used in grid, tabular, and n-up
reports and grid forms displayed in the Results view by
clicking a Data Manipulation button
Font for column identifiers used in freeform reports and
forms displayed in the Results view by clicking a Data
Manipulation button
Label Font
3
Right-click on the Object Details view and select Save Changes from the
pop-up menu.
Any changes you made in the Object Details view are immediately saved
to the table definition.
Specifying column extended attributes
In addition to adding a comment to associate with a column, you can specify
extended attributes for each column. An extended attribute is information
specific to InfoMaker that enhances the definition of the column.
❖
To specify extended attributes:
1
2
Do one of the following:
•
Highlight the column in either the Objects view or the Object Layout
view and select Properties from the Object or pop-up menu.
•
Click the Properties button.
•
Drag and drop the column to the Object Details view.
Select a tab and specify extended attribute values:
Select this tab
To modify these extended attributes
General
Headers
Column comments.
Label text used in free-form reports or forms.
Header text used in tabular, grid, or n-up reports or in grid
forms.
Display
88
How the data is formatted in a report or form as well as
display height, width, and position. For example, you can
associate a display format with a Revenue column so that
its data displays with a leading dollar sign and negative
numbers display in parentheses.
InfoMaker
CHAPTER 3
Managing the Database
Select this tab
To modify these extended attributes
Validation
Criteria that a value must pass to be accepted in a form. For
example, you can associate a validation rule with a Salary
column so that you can enter a value only within a
particular range.
The initial value for the column. You can select a value
from the drop-down list. The initial value must be the same
datatype as the column, must pass validation, and can be
NULL only if NULL is allowed for the column.
Edit Style
3
How the column is presented in a report or form. For
example, you can display column values as radio buttons or
in a drop-down list.
Right-click on the Column property sheet and select Save Changes from
the pop-up menu.
Any changes you made in the property sheet are immediately saved to the
table definition.
Overriding definitions
In the Report painter and Form painter, you can override the extended attributes
specified in the Database painter for a particular report or form.
How the information is
stored
Extended attributes are stored in the InfoMaker system tables in the database.
InfoMaker uses the information to display, present, and validate data in the
Database painter and in reports and forms. When you create a view in the
Database painter, the extended attributes of the table columns used in the view
are used by default.
About display formats,
edit styles, and
validation rules
In the Database painter, you create display formats, edit styles, and validation
rules. Whatever you create is then available for use with columns in tables in
the database. You can see all the display formats, edit styles, and validation
rules defined for the database in the Extended Attributes view.
For more information about defining, maintaining, and using these extended
attributes, see Chapter 8, “Displaying and Validating Data.”
About headings and
labels
Users Guide
By default, InfoMaker uses the column names as labels and headings, replacing
any underscore characters with spaces and capitalizing each word in the name.
For example, the default heading for the column Dept_name is Dept Name. To
define multiple-line headings, press Ctrl+Enter to begin a new line.
89
Working with tables
Specifying additional properties for character columns
You can also set two additional properties for character columns on the Display
property page: Case and Picture.
Specifying the
displayed case
You can specify whether InfoMaker converts the case of characters for a
column in a report or form.
❖
To specify how character data should be displayed:
•
Specifying a column
as a picture
On the Display property page, select a value in the Case drop-down list:
Value
Meaning
Any
UPPER
Characters are displayed as they are entered
Characters are converted to uppercase
lower
Characters are converted to lowercase
You can specify that a character column can contain names of picture files.
❖
To specify that column values are names of picture files:
1
On the Display property page, select the Picture check box.
When the Picture check box is selected, InfoMaker expects to find picture
file names in the column and displays the contents of the picture file—not
the name of the file—in reports and forms.
Because InfoMaker cannot determine the size of the image until runtime,
it sets both display height and display width to 0 when you select the
Picture check box.
2
Enter the size and the justification for the picture (optional).
Altering a table
After a table is created, how you can alter the table depends on your DBMS.
You can always:
•
Add or modify InfoMaker-specific extended attributes for columns
•
Delete an index and create a new index
You can never:
•
90
Insert a column between two existing columns
InfoMaker
CHAPTER 3
•
Prohibit null values for an appended column
•
Alter an existing index
Managing the Database
Some DBMSs let you do the following, but others do not:
•
Append columns that allow null values
•
Increase or decrease the number of characters allowed for data in an
existing column
•
Allow null values
•
Prohibit null values in a column that allowed null values
Database painter is DBMS aware
The Database painter grays out or notifies you about actions that your DBMS
prohibits.
For complete information about what you can and cannot do when you modify
a table in your DBMS, see your DBMS documentation.
❖
To alter a table:
1
Highlight the table and select Alter Table from the pop-up menu.
Opening multiple instances of tables
You can open another instance of a table by selecting Columns from the
View menu. Doing this is helpful when you want to use the Database
painter’s cut, copy, and paste features to cut or copy and paste between
tables.
The table definition displays in the Columns view (this screen shows the
Employee table).
Users Guide
91
Working with tables
2
Make the changes you want in the Columns view or in the Object Details
view.
3
Select Save Table or Save Changes.
InfoMaker submits the pending SQL syntax statements it generated to the
DBMS, and the table is modified.
Cutting, copying, and pasting columns
In the Database painter, you can use the Cut, Copy, and Paste buttons in the
PainterBar (or Cut, Copy, and Paste from the Edit or pop-up menu) to cut, copy,
and paste one column at a time within a table or between tables.
❖
❖
To cut or copy a column within a table:
1
Put the insertion point anywhere in the column you want to cut or copy.
2
Click the Cut or Copy button in the PainterBar.
To paste a column within a table:
1
Put the insertion point in the column you want to paste to.
If you are changing an existing table, put the insertion point in the last
column of the table. If you try to insert a column between two columns,
you get an error message. To an existing table, you can only append a
column. If you are defining a new table, you can paste a column anywhere.
2
❖
Click the Paste button in the PainterBar.
To paste a column to a different table:
1
Open another instance of the Columns view and use Alter Table to display
an existing table or click New to create a new table.
2
Put the insertion point in the column you want to paste to.
3
Click the Paste button in the PainterBar.
Closing a table
You can remove a table from a view by selecting Close or Reset View from its
pop-up menu. This action only removes the table from the Database painter
view. It does not drop (remove) the table from the database.
92
InfoMaker
CHAPTER 3
Managing the Database
Dropping a table
Dropping removes the table from the database.
❖
Deleting orphaned
table information
To drop a table:
1
Select Drop Table from the table’s pop-up menu or select Object>Delete
from the menu bar.
2
Click Yes.
If you drop a table outside InfoMaker, information remains in the system tables
about the table, including extended attributes for the columns.
❖
To delete orphaned table information from the extended attribute system
tables:
•
Select Design>Synch Extended Attributes from the menu bar and click
Yes.
If you try to delete orphaned table information and there is none, a
message tells you that synchronization is not necessary.
Viewing pending SQL changes
As you create or alter a table definition, you can view the pending SQL syntax
changes that will be made when you save the table definition.
❖
To view pending SQL syntax changes:
•
Right-click the table definition in the Columns view and select Pending
Syntax from the pop-up menu.
InfoMaker displays the pending changes to the table definition in SQL
syntax:
The SQL statements execute only when you save the table definition or
reset the view and then tell InfoMaker to save changes.
Users Guide
93
Working with tables
Copying, saving, and
printing pending SQL
changes
When you are viewing pending SQL changes, you can:
•
Copy pending changes to the clipboard
•
Save pending changes to a file
•
Print pending changes
To copy, save, or print only part of the SQL syntax
Select the part of the SQL syntax you want before you copy, save, or print.
❖
To copy the SQL syntax to the clipboard:
•
❖
In the Pending Syntax view, click the Copy button or select Select All and
then Copy from the pop-up menu.
To save SQL syntax for execution at a later time:
1
In the Pending Syntax view, Select File>Save As.
The Save Syntax to File dialog box displays.
2
Navigate to the folder where you want to save SQL, name the file, and then
click the Save button.
At a later time, you can import the SQL file into the Database painter and
execute it.
❖
To print pending table changes:
•
❖
While viewing the pending SQL syntax, click the Print button or select
Print from the File menu.
To display columns in the Columns view:
•
Select Object>Pending Syntax from the menu bar.
Printing the table definition
You can print a report of the table’s definition at any time, whether or not the
table has been saved. The Table Definition Report contains information about
the table and each column in the table, including the extended attributes for
each column.
❖
To print the table definition:
•
94
Select Print or Print Definition from the File or pop-up menu or click the
Print button.
InfoMaker
CHAPTER 3
Managing the Database
Exporting table syntax
You can export the syntax for a table to the log. This feature is useful when you
want to create a backup definition of the table before you alter it or when you
want to create the same table in another DBMS.
To export to another DBMS, you must have the InfoMaker interface for that
DBMS.
❖
To export the syntax of an existing table to a log:
1
Select the table in the Objects or Object Layout view.
2
Select Export Syntax from the Object menu or the pop-up menu.
If you selected a table and have more than one DBMS interface installed,
the DBMS dialog box displays. If you selected a view, InfoMaker
immediately exports the syntax to the log.
3
Select the DBMS to which you want to export the syntax.
4
If you selected ODBC, specify a data source in the Data Sources dialog
box.
5
Supply any information you are prompted for.
InfoMaker exports the syntax to the log. Extended attribute information
(such as validation rules used) for the selected table is also exported. The
syntax is in the format required by the DBMS you selected.
For more information about the log, see “Logging your work” on page 82.
About system tables
Two kinds of system tables exist in the database:
About InfoMaker
system tables
Users Guide
•
System tables provided by your DBMS (for more information, see your
DBMS documentation)
•
InfoMaker extended attribute system tables
InfoMaker stores extended attribute information you provide when you create
or modify a table (such as the text to use for labels and headings for the
columns, validation rules, display formats, and edit styles) in system tables.
These system tables contain information about database tables and columns.
Extended attribute information extends database definitions.
95
Working with tables
In the Employee table, for example, one column name is Emp_lname. A label
and a heading for the column are defined for InfoMaker to use in reports. The
column label is defined as Last Name:. The column heading is defined as
Last Name. The label and heading are stored in the PBCatCol table in the
extended attribute system tables.
The extended attribute system tables are maintained by InfoMaker and only
InfoMaker users can enter information into them. Table 3-6 lists the extended
attribute system tables. For more information, see Appendix B, “The Extended
Attribute System Tables.”
Table 3-6: Extended attribute system tables
This system table
PBCatCol
PBCatEdt
PBCatFmt
PBCatTbl
PBCatVld
Opening and
displaying system
tables
Stores this extended attribute information
Column data such as name, header and label for reports and
forms, and header and label positions
Edit style names and definitions
Display format names and definitions
Table data such as name, fonts, and comments
Validation rule names and definitions
You can open system tables like other tables in the Database painter.
By default, InfoMaker shows only user-created tables in the Objects view. If
you highlight Tables and select Show System Tables from the pop-up menu,
InfoMaker also displays system tables.
Creating and editing temporary tables
You can create and edit temporary tables in the Database painter, SQL Select
painter, or Report painter when you use the ASE or SYC native driver to
connect to an Adaptive Server database, or the SNC native driver to connect to
a Microsoft SQL Server 2005 database. Temporary tables persist for the
duration of a database connection, residing in a special database called
“tempdb”.
Creating temporary
tables
You add a temporary table to the tempdb database by right-clicking the
Temporary Tables icon in the Objects view and selecting New. The table is
designated as a temporary table by assigning a name that starts with the #
character. When you save the table, the Create New Temporary Table dialog
box displays. The # character is added automatically.
If there is no Temporary Tables icon in the Objects view, right-click the Tables
icon and select New. Assign a table name prefaced with the # character.
96
InfoMaker
CHAPTER 3
Managing the Database
For SNC, use # for a local temporary table or ## for a global temporary table.
Temporary tables must start with the # character. Local temporary tables are
visible only in the user’s current connection and are deleted when the user
disconnects. Global temporary tables are visible to any user connected to the
instance of SQL Server, and they are deleted when all users referencing the
table disconnect.
Working with
temporary tables
After you create a temporary table, you can create indexes and a primary key
for the table from the pop-up menu for the table in the Object Layout view. If
you define a unique index or primary key, you can perform insert, update, and
delete operations in forms.
Selecting Edit Data from the pop-up menu of a temporary table retrieves data
that you store in that table. You can also select Drop Table, Add to Layout,
Export Syntax, and properties from the pop-up menu in the Objects view.
Working with keys
If your DBMS supports primary and foreign keys, you can work with the keys
in InfoMaker.
Why you should use
keys
If your DBMS supports them, you should use primary and foreign keys to
enforce the referential integrity of your database. That way you can rely on the
DBMS to make sure that only valid values are entered for certain columns.
For example, say you have two tables called Department and Employee. The
Department table contains the column Dept_Head_ID, which holds the ID of the
department’s manager. You want to make sure that only valid employee IDs are
entered in this column. The only valid values for Dept_Head_ID in the
Department table are values for Emp_ID in the Employee table.
To enforce this kind of relationship, you define a foreign key for Dept_Head_ID
that points to the Employee table. With this key in place, the DBMS disallows
any value for Dept_Head_ID that does not match an Emp_ID in the Employee
table.
For more about primary and foreign keys, consult a book about relational
database design or your DBMS documentation.
What you can do in
the Database painter
Users Guide
You can work with keys in the following ways:
•
Look at existing primary and foreign keys
•
Open all tables that depend on a particular primary key
97
Working with keys
•
Open the table containing the primary key used by a particular foreign key
•
Create, alter, and drop keys
For the most part, you work with keys the same way for each DBMS that
supports keys, but there are some DBMS-specific issues. For complete
information about using keys with your DBMS, see your DBMS
documentation.
Viewing keys
Keys can be viewed in several ways:
•
In the expanded tree view of a table in the Objects view
•
As icons connected by lines to a table in the Object Layout view
In the following picture, the Department table has two keys:
•
A primary key (on dept_id)
•
A foreign key (on dept_head_id)
If you cannot see the lines
If the color of your window background makes it difficult to see the lines for
the keys and indexes, you can set the colors for each component of the
Database painter’s graphical table representation, including keys and indexes.
For information, see “Modifying database preferences” on page 81.
Opening related
tables
When working with tables containing keys, you can easily open related tables.
❖
❖
To open the table that a particular foreign key references:
1
Display the foreign key pop-up menu.
2
Select Open Referenced Table.
To open all tables referencing a particular primary key:
1
Display the primary key pop-up menu.
2
Select Open Dependent Table(s).
InfoMaker opens and expands all tables in the database containing foreign
keys that reference the selected primary key.
98
InfoMaker
CHAPTER 3
Defining primary keys
Managing the Database
If your DBMS supports primary keys, you can define them in InfoMaker.
❖
To create a primary key:
1
Do one of the following:
•
Highlight the table for which you want to create a primary key and
click the Create Primary Key drop-down toolbar button in
PainterBar1.
•
Select Object>Insert>Primary Key from the main menu or
New>Primary Key from the pop-up menu.
•
Expand the table’s tree view, right-click Primary Key, and select New
Primary Key from the pop-up menu.
The Primary Key properties display in the Object Details view.
2
Select one or more columns for the primary key.
Columns that are allowed in a primary key
Only a column that does not allow null values can be included as a column
in a primary key definition. If you choose a column that allows null values,
you get a DBMS error when you save the table. In DBMSs that allow
rollback for Data Definition Language (DDL), the table definition is rolled
back. In DBMSs that do not allow rollback for DDL, the Database painter
is refreshed with the current definition of the table.
3
Specify any information required by your DBMS.
Naming a primary key
Some DBMSs allow you to name a primary key and specify whether it is
clustered or not clustered. For these DBMSs, the Primary Key property
page has a way to specify these properties.
For DBMS-specific information, see your DBMS documentation.
4
Right-click on the Object Details view and select Save Changes from the
pop-up menu.
Any changes you made in the view are immediately saved to the table
definition.
Users Guide
99
Working with keys
Completing the primary key
Some DBMSs automatically create a unique index when you define a primary
key so that you can immediately begin to add data to the table. Others require
you to create a unique index separately to support the primary key before
populating the table with data.
To find out what your DBMS does, see your DBMS documentation.
Defining foreign keys
If your DBMS supports foreign keys, you can define them in InfoMaker.
❖
To create a foreign key:
1
Do one of the following:
•
Highlight the table and click the Create Foreign Key drop-down
toolbar button in PainterBar1.
•
Select Object>Insert>Foreign Key from the main menu or
New>Foreign Key from the pop-up menu.
•
Expand the table’s tree view and right-click on Foreign Keys and
select New Foreign Key from the pop-up menu.
The Foreign Key properties display in the Object Details view. Some of
the information is DBMS-specific.
2
Name the foreign key in the Foreign Key Name box.
3
Select the columns for the foreign key.
4
On the Primary Key tab page, select the table and column containing the
Primary key referenced by the foreign key you are defining.
Key definitions must match exactly
The definition of the foreign key columns must match the primary key
columns, including datatype, precision (width), and scale (decimal
specification).
5
On the Rules tab page, specify any information required by your DBMS.
For example, you might need to specify a delete rule by selecting one of
the rules listed for On Delete of Primary Table Row.
For DBMS-specific information, see your DBMS documentation.
100
InfoMaker
CHAPTER 3
6
Managing the Database
Right-click on the Object Details view and select Save Changes from the
pop-up menu.
Any changes you make in the view are immediately saved to the table
definition.
Modifying keys
You can modify a primary key in InfoMaker.
❖
To modify a primary key:
1
Do one of the following:
•
Highlight the primary key listed in the table’s expanded tree view and
click the Properties button.
•
Select Properties from the Object or pop-up menu.
•
Drag the primary key icon and drop it in the Object Details view.
2
Select one or more columns for the primary key.
3
Right-click on the Object Details view and select Save Changes from the
pop-up menu.
Any changes you make in the view are immediately saved to the table
definition.
Dropping a key
You can drop keys (remove them from the database) from within InfoMaker.
❖
To drop a key:
1
Highlight the key in the expanded tree view for the table in the Objects
view or right-click the key icon for the table in the Object Layout view.
2
Select Drop Primary Key or Drop Foreign Key from the key’s pop-up
menu.
3
Click Yes.
Working with indexes
You can create as many single- or multi-valued indexes for a database table as
you need, and you can drop indexes that are no longer needed.
Update limitation
You can update a table in a form only if it has a unique index or primary key.
Users Guide
101
Working with indexes
Creating an index
In SQL Anywhere databases
In SQL Anywhere databases, you should not define an index on a column that
is defined as a foreign key, because foreign keys are already optimized for
quick reference.
❖
To create an index:
1
Do one of the following:
•
Highlight the table for which you want to create an index and click the
Create Index drop-down toolbar button in PainterBar1.
•
Select Object>Insert>Index from the main menu or New>Index from
the pop-up menu.
•
Expand the table’s tree view, right-click on Indexes, and select New
Index from the pop-up menu.
The Index’s properties display in the Object Details view.
2
Enter a name for the index in the Index box.
3
Select whether or not to allow duplicate values for the index.
4
Specify any other information required for your database.
For example, in Adaptive Server Enterprise specify whether the index is
clustered, and in SQL Anywhere specify the order of the index.
5
Click the names of the columns that make up the index.
6
Select Save Changes from the pop-up menu.
7
Right-click on the Object Details view and select Save Changes from the
pop-up menu.
Any changes you made in the view are immediately saved to the table
definition.
Modifying an index
You can modify an index.
❖
To modify an index:
1
102
Do one of the following:
•
Highlight the index listed in the table’s expanded tree view and click
the Properties button.
•
Select Properties from the Object or pop-up menu.
•
Drag the index icon and drop it in the Object Details view.
InfoMaker
CHAPTER 3
Managing the Database
2
In the Object Details view, select or deselect columns as needed.
3
Right-click on the Object Details view and select Save Changes from the
pop-up menu.
Any changes you made in the view are immediately saved to the table
definition.
Dropping an index
Dropping an index removes it from the database.
❖
To drop an index from a table:
1
In the Database painter workspace, display the pop-up menu for the index
you want to drop.
2
Select Drop Index and click Yes.
Working with database views
A database view gives a different (and usually limited) perspective of the data
in one or more tables. Although you see existing database views listed in the
Objects view, a database view does not physically exist in the database as a
table does. Each time you select a database view and use the view’s data,
InfoMaker executes a SQL SELECT statement to retrieve the data and creates
the database view.
For more information about using database views, see your DBMS
documentation.
Using database views
in InfoMaker
You can define and manipulate database views in InfoMaker. Typically you use
database views for the following reasons:
•
To give names to frequently executed SELECT statements.
•
To limit access to data in a table. For example, you can create a database
view of all the columns in the Employee table except Salary. Users of the
database view can see and update all information except the employee’s
salary.
•
To combine information from multiple tables for easy access.
In InfoMaker, you can create single- or multiple-table database views. You can
also use a database view when you define data to create a new database view.
Users Guide
103
Working with database views
You define, open, and manipulate database views in the View painter, which is
similar to the SQL Select painter. For more information about the SQL Select
painter, see “Selecting a data source” on page 154.
Updating database views
Some database views are logically updatable and others are not. Some DBMSs
do not allow any updating of views. For the rules your DBMS follows, see your
DBMS documentation.
❖
❖
To open a database view:
1
In the Objects view, expand the list of Views for your database.
2
Highlight the view you want to open and select Add To Layout from the
pop-up menu, or drag the view’s icon to the Object Layout view.
To create a database view:
1
Click the Create View button, or select View or New View from the
Object>Insert or pop-up menu.
The Select Tables dialog box displays, listing all tables and views that you
can access in the database.
2
104
Select the tables and views from which you will create the view by doing
one of the following:
•
Click the name of each table or view you want to open in the list
displayed in the Select Tables dialog box, then click the Open button
to open them. The Select Tables dialog box closes.
•
Double-click the name of each table or view you want to open. Each
object is opened immediately. Then click the Cancel button to close
the Select Tables dialog box.
InfoMaker
CHAPTER 3
Managing the Database
Representations of the selected tables and views display in the View
painter workspace:
3
Select the columns to include in the view and include computed columns
as needed.
4
Join the tables if there is more than one table in the view.
For information, see “Joining tables” on page 106.
5
Specify criteria to limit rows retrieved (Where tab), group retrieved rows
(Group tab), and limit the retrieved groups (Having tab), if appropriate.
For information, see the section on using the SQL Select painter in
“Selecting a data source” on page 154. The View painter and the SQL
Select painter are similar.
6
When you have completed the view, click the Return button.
7
Name the view.
Include view or some other identifier in the view’s name so that you will
be able to distinguish it from a table in the Select Tables dialog box.
8
Click the Create button.
InfoMaker generates a CREATE VIEW statement and submits it to the
DBMS. The view definition is created in the database. You return to the
Database painter workspace with the new view displayed in the
workspace.
Users Guide
105
Working with database views
Displaying a database
view’s SQL statement
You can display the SQL statement that defines a database view. How you do
it depends on whether you are creating a new view in the View painter or want
to look at the definition of an existing view.
❖
To display the SQL statement from the View painter:
•
Select the Syntax tab in the View painter.
InfoMaker displays the SQL it is generating. The display is updated each
time you change the view.
❖
To display the SQL statement from the Database painter:
•
Highlight the name of the database view in the Objects view and select
Properties from the pop-up menu, or drag the view’s icon to the Object
Details view.
The completed SELECT statement used to create the database view
displays in the Definition field on the General page:
View dialog box is read-only
You cannot alter the view definition in the Object Details view. To alter a
view, drop it and create another view.
Joining tables
106
If the database view contains more than one table, you should join the tables on
their common columns. When the View painter is first opened for a database
view containing more than one table, InfoMaker makes its best guess as to the
join columns, as follows:
•
If there is a primary/foreign key relationship between the tables,
InfoMaker automatically joins them.
•
If there are no keys, InfoMaker tries to join tables based on common
column names and types.
InfoMaker
CHAPTER 3
❖
Managing the Database
To join tables:
1
Click the Join button.
2
Click the columns on which you want to join the tables.
In the following screen, the Employee and Department tables are joined on
the dept_id column:
3
To create a join other than the equality join, click the join representation in
the workspace.
The Join dialog box displays:
4
Select the join operator you want from the Join dialog box.
If your DBMS supports outer joins, outer join options also display in the
Join dialog box. For example, in the preceding dialog box (which uses the
Employee and Department tables), you can choose to include rows from
the Employee table where there are no matching departments, or rows
from the Department table where there are no matching employees.
About the Query Governor
You can use the Query Governor to set data selection and retrieval options.
If the Allow Cross Product option is set in the Query Governor, the Join
dialog box displays outer join options. For more information, see “Using
the Query Governor” on page 50.
Users Guide
107
Manipulating data
For more about outer joins, see “Using ANSI outer joins” on page 171.
Dropping a database
view
Dropping a database view removes its definition from the database.
❖
To drop a view:
1
In the Objects view, select the database view you want to drop.
2
Click the Drop Object button or select Drop View from the pop-up menu.
InfoMaker prompts you to confirm the drop, then generates a DROP VIEW
statement and submits it to the DBMS.
Exporting view syntax
You can export the syntax for a view to the log. This feature is useful when you
want to create a backup definition of the view before you alter it or when you
want to create the same view in another DBMS.
❖
To export the syntax of an existing view to a log:
1
Select the view in the painter workspace.
2
Select Export Syntax from the Object menu or the pop-up menu.
For more information about the log, see “Logging your work” on page 82.
Manipulating data
As you work on the database, you often want to look at existing data or create
some data for testing purposes. You might also want to test display formats,
validation rules, and edit styles on real data.
InfoMaker provides data manipulation for such purposes. With data
manipulation, you can:
108
•
Retrieve and manipulate database information
•
Save the contents of the database in a variety of formats (such as Excel,
PDF, or XML)
InfoMaker
CHAPTER 3
Managing the Database
Retrieving data
❖
To retrieve data:
1
In the Database painter, select the table or database view whose data you
want to manipulate.
2
Do one of the following:
•
Click one of the three Data Manipulation buttons (Grid, Tabular, or
Freeform) in the PainterBar.
•
Select Data or Edit Data from the Object or pop-up menu and choose
one of the edit options from the cascading menu that displays.
All rows are retrieved and display in the Results view. As the rows are
being retrieved, the Retrieve button changes to a Cancel button. You can
click the Cancel button to stop the retrieval.
Exactly what you see in the Results view depends on the formatting style you
picked. What you are seeing is similar to a form. In a grid display, you can drag
the mouse on a column’s border to resize the column. This window is in the
grid format:
Only a few rows of data display at a time. You can use the First, Prior, Next,
and Last buttons or the pop-up menu to move from page to page.
Modifying data
You can add, modify, or delete rows. When you have finished manipulating the
data, you can apply the changes to the database.
Users Guide
109
Manipulating data
If looking at data from a view
Some views are logically updatable and others are not. Some DBMSs do not
allow any updating of views.
For the rules your DBMS follows regarding updating of views, see your DBMS
documentation.
❖
To modify data:
1
Do one of the following:
•
To modify existing data, tab to a field and enter a new value.
•
To add a row, click the Insert Row button and enter data in the new
row.
•
To delete a row, click the Delete Row button.
When you add or modify data, the data uses the validation rules, display
formats, and edit styles that you or others have defined for the table in the
Database painter.
2
Click the Save Changes button or select Rows>Update to apply changes
to the database.
Sorting rows
You can sort the data, but any sort criteria you define are for testing only and
are not saved with the table or passed to the Report painter.
❖
To sort the rows:
1
Select Rows>Sort from the menu bar.
The Specify Sort Columns dialog box displays.
110
InfoMaker
CHAPTER 3
2
Managing the Database
Drag the columns you want to sort on from the Source Data box to the
Columns box:
A check box with a check mark in it displays under the Ascending heading
to indicate that the values will be sorted in ascending order. To sort in
descending order, clear the check box.
Precedence of sorting
The order in which the columns display in the Columns box determines the
precedence of the sorting. For example, in the preceding dialog box, rows
would be sorted by department ID. Within department ID, rows would be
sorted by state.
To change the precedence order, drag the column names in the Column
box into the order you want.
3
(Optional) Double-click an item in the Columns box to specify an
expression to sort on.
The Modify Expression dialog box displays.
4
Specify the expression.
For example, if you have two columns, Revenues and Expenses, you can
sort on the expression Revenues – Expenses.
5
Click OK to return to the Specify Sort Columns dialog box with the
expression displayed.
If you change your mind
You can remove a column or expression from the sorting specification by
simply dragging it and releasing it outside the Columns box.
6
Users Guide
When you have specified all the sort columns and expressions, click OK.
111
Manipulating data
Filtering rows
You can limit which rows are displayed by defining a filter.
The filters you define are for testing only and are not saved with the table or
passed to the Report painter.
❖
To filter the rows:
1
Select Rows>Filter from the menu bar.
The Specify Filter dialog box displays.
2
Enter a boolean expression that InfoMaker will test against each row:
If the expression evaluates to TRUE, the row is displayed. You can paste
functions, columns, and operators in the expression.
3
Click OK.
InfoMaker filters the data. Only rows meeting the filter criteria are
displayed.
❖
To remove the filter:
1
Select Rows>Filter from the menu bar.
The Specify Filter dialog box displays, showing the current filter.
2
Delete the filter expression, then click OK.
Filtered rows and updates
Filtered rows are updated when you update the database.
112
InfoMaker
CHAPTER 3
Managing the Database
Viewing row information
You can display information about the data you have retrieved.
❖
To display row information:
•
Select Rows>Described from the menu bar.
The Describe Rows dialog box displays showing the number of:
•
Rows that have been deleted in the Database painter but not yet
deleted from the database
•
Rows displayed in Preview
•
Rows that have been filtered
•
Rows that have been modified in the Database painter but not yet
modified in the database
All row counts are zero until you retrieve the data from the database or add a
new row. The count changes when you modify the displayed data or test filter
criteria.
Importing data
You can import data from an external source and then save the imported data
in the database.
❖
To import data:
1
Select Rows>Import from the menu bar.
The Select Import File dialog box displays.
2
Specify the file from which you want to import the data.
The types of files you can import into the Database painter are shown in
the Files of Type drop-down list.
3
Click Open.
InfoMaker reads the data from the file. You can click the Save Changes
button or select Rows>Update to add the new rows to the database.
Users Guide
113
Manipulating data
Printing data
You can print the data displayed by selecting File>Print from the menu bar.
Before printing, you can also preview the output on the screen.
❖
To preview printed output before printing:
1
Select File>Print Preview from the menu bar.
Preview displays the data as it will print. To display rulers around the page
borders in Print Preview, select File>Print Preview Rulers.
2
To change the magnification used in Print Preview, select File>Print
Preview Zoom from the menu bar.
The Zoom dialog box displays.
3
Select the magnification you want and click OK.
Preview zooms in or out as appropriate.
4
When you have finished looking at the print layout, select File>Print
Preview from the menu bar again.
Saving data
You can save the displayed data in an external file.
❖
To save the data in an external file:
1
Select File>Save Rows As from the menu bar.
The Save Rows As dialog box displays.
2
Choose a format for the file.
You can select from several formats, including Powersoft report (PSR),
XML, PDF, and HTML.
If you want the column headers saved in the file, select a file format that
includes headers, such as Excel With Headers. When you select a with
headers format, the names of the database columns (not the column labels)
will also be saved in the file.
For more information, see “Saving data in an external file” on page 208.
114
InfoMaker
CHAPTER 3
3
Managing the Database
For TEXT, CSV, SQL, HTML, and DIF formats, select an encoding for the
file.
You can select ANSI/DBCS, Unicode LE (Little-Endian), Unicode BE
(Big-Endian), or UTF8.
4
Name the file and save it.
InfoMaker saves all displayed rows in the file; all columns in the displayed
rows are saved. Filtered rows are not saved.
Creating and executing SQL statements
The Database painter’s Interactive SQL view is a SQL editor in which you can
enter and execute SQL statements. The view provides all editing capabilities
needed for writing and modifying SQL statements. You can cut, copy, and
paste text; search for and replace text; and create SQL statements. You can also
set editing properties to make reading your SQL files easier.
Building and executing SQL statements
You can use the Interactive SQL view to build SQL statements and execute
them immediately. The view acts as a notepad in which you can enter SQL
statements.
Creating stored procedures
You can use the Interactive SQL view to create stored procedures or triggers,
but make sure that the Database painter’s SQL statement terminator character
is not the same as the terminator character used in the stored procedure
language of your DBMS.
About the statement
terminator
By default, InfoMaker uses the semicolon as the SQL statement terminator.
You can override the semicolon by specifying a different terminator character
in the Database painter. To change the terminator character, select
Design>Options from the Database painter’s menu bar.
Make sure that the character you choose is not reserved for another use by your
database vendor. For example, using the slash character (/) causes compilation
errors with some DBMSs.
Users Guide
115
Creating and executing SQL statements
Controlling comments
By default, InfoMaker strips off comments when it sends SQL to the DBMS.
You can have comments included by clearing the check mark next to Strip
Comments in the pop-up menu of the Interactive SQL view.
Entering SQL
You can enter a SQL statement in four ways:
Pasting SQL
•
Pasting the statement
•
Typing the statement in the view
•
Opening a text file containing the SQL
•
Dragging a procedure or function from the Objects view
You can paste SELECT, INSERT, UPDATE, and DELETE statements to the view.
Depending on which kind of statement you want to paste, InfoMaker displays
dialog boxes that guide you through painting the full statement.
❖
To paste a SQL statement to the workspace:
1
Click the Paste SQL button in the PainterBar, or select Paste Special>SQL
from the Edit or pop-up menu, then the statement type (Select, Insert,
Update, or Delete).
The Select Table(s) dialog box displays.
2
Select the table(s) you will reference in the SQL statement.
You go to the Select, Insert, Update, or Delete painter, depending on the
type of SQL statement you are pasting. The Insert, Update, and Delete
painters are similar to the Select painter, but only the appropriate tabs
display in the SQL toolbox at the bottom of the workspace.
For more information about the SQL Select painter, see “Selecting a data
source” on page 154.
3
Do one of the following:
•
For a SELECT statement, define the statement exactly as in the SQL
Select painter when building a view.
You choose the columns to select. You can define computed columns,
specify sorting and joining criteria, and WHERE, GROUP BY, and
HAVING criteria. For more information, see “Working with database
views” on page 103.
116
InfoMaker
CHAPTER 3
4
Managing the Database
•
For an INSERT statement, type the values to insert into each column.
You can insert as many rows as you want.
•
For an UPDATE statement, specify the new values for the columns in
the Update Column Values dialog box. Then specify the WHERE
criteria to indicate which rows to update.
•
For a DELETE statement, specify the WHERE criteria to indicate
which rows to delete.
When you have finished creating the SQL statement, click the Return
button in the PainterBar in the Select, Insert, Update, or Delete painter.
You return to the Database painter with the SQL statement pasted into the
ISQL view.
Typing SQL
Rather than paste, you can simply type one or more SQL statements directly in
the ISQL view.
You can enter most statements supported by your DBMS. This includes
statements you can paint as well as statements you cannot paint, such as a
database stored procedure or CREATE TRIGGER statement.
You cannot enter certain statements that could destabilize the InfoMaker
development environment. These include the SET statement and the USE
database statement. However, you might want to use a SET statement to
change a default setting in the development environment, such as SET
NOCOUNT ON or SET ANSI_WARNINGS OFF. You can enable SET commands
in the ISQL view for database interfaces that support them by adding the
following line to the [Database] section in your IM.INI file:
EnableSet=1
Sybase Adaptive Server Enterprise stored procedures
When you use the Database painter to execute a Sybase Adaptive Server
Enterprise system stored procedure, you must start the syntax with the keyword
EXEC or EXECUTE. For example, enter EXEC SP_LOCK. You cannot execute
the stored procedure simply by entering its name.
Users Guide
117
Creating and executing SQL statements
Importing SQL from a
text file
You can import SQL that has been saved in a text file into the Database painter.
❖
Dragging a procedure
or function from the
Objects view
To read SQL from a file:
1
Put the insertion point where you want to insert the SQL.
2
Select Paste Special>From File from the Edit or pop-up menu.
3
Select the file containing the SQL, and click OK.
From the tree view in the Objects view, you can select an existing procedure or
function that contains a SQL statement you want to enter, and drag it to the
Interactive SQL view.
Explaining SQL
Sometimes there is more than one way to code SQL statements to obtain the
results you want. When this is the case, you can use Explain SQL on the Design
menu to help you select the most efficient method. Explain SQL displays
information about the path that InfoMaker will use to execute the statements in
the SQL Statement Execution Plan dialog box. This is most useful when you
are retrieving or updating data in an indexed column or using multiple tables.
DBMS-specific information
The information displayed in the SQL Statement Execution Plan dialog box
depends on your DBMS. For more about the SQL execution plan, see your
DBMS documentation.
Executing SQL
When you have the SQL statements you want in the workspace, you can submit
them to the DBMS.
❖
To execute the SQL:
•
Click the Execute button, or select Design>Execute SQL from the menu
bar.
If the SQL retrieves data, the data appears in grid format in the Results view. If
there is a database error, you see a message box describing the problem.
For a description of what you can do with the data, see “Manipulating data” on
page 108.
118
InfoMaker
CHAPTER 3
Managing the Database
Customizing the editor
The Interactive SQL view provides the same editing capabilities as the file
editor. It also has Script, Font, and Coloring properties that you can change to
make SQL files easier to read. With no change in properties, SQL files have
black text on a white background and a tab stop setting of 3 for indentation.
Setting Script and
Font properties
Select Design>Options from the menu bar to open the Database Preferences
dialog box. The Script and Font properties are the same as those you can set for
the file editor.
For more information, see “Using the file editor” on page 44.
Editor properties apply elsewhere
When you set Script and Font properties for the Database painter, the settings
also apply to the file editor.
Setting Coloring
properties
You can set the text color and background color for SQL styles (such as
datatypes and keywords) so that the style will stand out and the SQL code will
be more readable. You set Coloring properties on the Coloring tab page.
Enabling syntax coloring
Be sure the Enable Syntax Coloring check box is selected before you set colors
for SQL styles. You can turn off all Coloring properties by clearing the check
box.
Controlling access to the current database
The Database painter’s Design menu provides access to a series of dialog boxes
you can use to control access to the current database. In some DBMSs, for
example, you can assign table access privileges to users and groups.
Which menu items display on the Design menu and which dialog boxes display
depend on your DBMS.
For information about support for security options in your DBMS, see
Connecting to Your Database and your DBMS documentation.
Users Guide
119
Controlling access to the current database
120
InfoMaker
CH A PTE R
About this chapter
4
Working with Data Pipelines
This chapter describes how to use the Data Pipeline painter to create data
pipelines, which let you reproduce database data in various ways.
Contents
Topic
About data pipelines
Page
121
Creating a data pipeline
Modifying the data pipeline definition
124
127
Correcting pipeline errors
Saving a pipeline
137
138
Using an existing pipeline
Pipeline examples
139
139
About data pipelines
The Data Pipeline painter gives you the ability to reproduce data quickly
within a database, across databases, or even across DBMSs. To do that,
you create a data pipeline which, when executed, pipes the data as
specified in the definition of the data pipeline.
What you can do
Users Guide
With the Data Pipeline painter, you can perform some tasks that would
otherwise be very time consuming. For example, you can:
•
Pipe data (and extended attributes) from one or more tables to a table
in the same DBMS or a different DBMS
•
Pipe an entire database, a table at a time, to another DBMS (and if
needed, pipe the database’s extended attribute system tables)
•
Create a table with the same design as an existing table but with no
data
•
Pipe corporate data from a database server to a SQL Anywhere
database on your computer so you can work on the data and report on
it without needing access to the network
121
About data pipelines
Source and
destination databases
•
Upload local data that changes daily to a corporate database
•
Create a new table when a change (such as allowing or disallowing NULLs
or changing primary key or index assignments) is disallowed in the
Database painter
You can use the Data Pipeline painter to pipe data from one or more tables in a
source database to one table in a destination database.
You can pipe all data or selected data in one or more tables. For example, you
can pipe a few columns of data from one table or data selected from a
multitable join. You can also pipe from a view or a stored procedure result set
to a table.
When you pipe data, the data in the source database remains in the source
database and is reproduced in a new or existing table in the destination
database.
Although the source and destination can be the same database, they are usually
different ones, and they can even have different DBMSs. For example, you can
pipe data from an Adaptive Server Enterprise database to a SQL Anywhere
database on your computer.
Defining a data pipeline
When you use the Data Pipeline painter to create a pipeline, you define the:
•
Source database
•
Destination database
•
Source of data
•
Pipeline operation
•
Destination table
After you create a pipeline, you can execute it immediately. If you want, you
can also save it as a named object to use and reuse. Saving a pipeline enables
you to pipe the data that might have changed since the last pipeline execution
or to pipe the data to other databases later.
Datatype support
122
Each DBMS supports certain datatypes. When you pipe data from one DBMS
to another, InfoMaker makes a best guess at the appropriate destination
datatypes. You can correct InfoMaker’s best guess in your pipeline definition
as needed.
InfoMaker
CHAPTER 4
Working with Data Pipelines
The Data Pipeline painter supports the piping of columns of any datatype,
including columns with blob data. For information about piping a column that
has a blob datatype, see “Piping blob data” on page 134.
Piping extended attributes
The first time InfoMaker connects to a database, it creates five system tables
called the extended attribute system tables. These system tables initially
contain default extended attribute information for tables and columns. In
InfoMaker, you can create extended attribute definitions such as column
headers and labels, edit styles, display formats, and validation rules.
For more information about the extended attribute system tables, see Appendix
B, “The Extended Attribute System Tables.”
Piping extended
attributes
automatically
When you pipe data, you can specify that you want to pipe the extended
attributes associated with the columns you are piping. You do this by selecting
the Extended Attributes check box in the Data Pipeline painter workspace:
When the Extended Attributes check box is selected, the extended attributes
associated with the source database’s selected columns automatically go into
the extended attribute system tables of the destination database, with one
exception. When you pipe a column that has an edit style, display format, or
validation rule associated with it, the style, rule, or format is not piped if one
with the same name exists in the extended attribute system tables of the
destination database. In this situation, the column uses the style, rule, or format
already present in the destination database.
For example, for the Phone column in the Employee table, the display format
with the name Phone_format would be piped unless a display format with the
name Phone_format already exists in the destination database. If such a display
format exists, the Phone column would use the Phone_format display format in
the destination database.
Users Guide
123
Creating a data pipeline
Piping the extended
attribute system tables
Selecting the Extended Attributes check box never results in the piping of
named display formats, edit styles, and validation rules that are stored in the
extended attribute system tables but are not associated with columns in tables
you are piping. If you want such extended attribute definitions from one
database to exist in another database, you can pipe the appropriate extended
attribute system table or a selected row or rows from the table.
Piping an entire
database
If you want to reproduce an entire database, you can pipe all database tables
and extended attribute system tables, one table at a time.
Creating a data pipeline
You have a number of choices when creating a data pipeline. This section leads
you through them.
❖
To create a data pipeline:
1
Click the New button in the PowerBar and then select the Database tab
page.
2
Select Data Pipeline and click OK.
The New Data Pipeline dialog box displays.
The Source Connection and Destination Connection boxes display
database profiles that have been defined. The last database you connected
to is selected as the source. The first database on the destination list is
selected as the destination.
124
InfoMaker
CHAPTER 4
Working with Data Pipelines
If you do not see the connections you need
To create a pipeline, the databases you want to use for your source and
destination must each have a database profile defined. If you do not see
profiles for the databases you want to use, select Cancel in the New Data
Pipeline dialog box and then define those profiles. For information about
defining profiles, see “Changing the destination and source databases” on
page 136.
3
Select a data source.
The data source determines how InfoMaker retrieves data when you
execute a pipeline:
Data source
Use it if
Quick Select
The data is from tables that have a primary/foreign key
relationship and you need only to sort and limit data
SQL Select
You want more control over the SQL SELECT statement
generated for the data source or your data is from tables that
are not connected through a key
Query
Stored Procedure
The data has been defined as a query
The data is defined in a stored procedure
4
Select the source and destination connections and click OK.
5
Define the data to pipe.
How you do this depends on what data source you chose in step 3, and is
similar to the process used to define a data source for a report. For
complete information about using each data source and defining the data,
see Chapter 5, “Defining Reports.”
When you finish defining the data to pipe, the Data Pipeline painter
workspace displays the pipeline definition, which includes a pipeline
operation, a check box for specifying whether to pipe extended attributes,
and source and destination items.
Users Guide
125
Creating a data pipeline
The pipeline definition is InfoMaker’s best guess based on the source data
you specified.
6
Modify the pipeline definition as needed.
For information, see "Modifying the data pipeline definition" next.
7
(Optional) Modify the source data as needed. To do so, click the Data
button in the PainterBar, or select Design>Edit Data Source from the menu
bar.
For information about working in the Select painter, see Chapter 5,
“Defining Reports.”
When you return to the Data Pipeline painter workspace, InfoMaker
reminds you that the pipeline definition will change. Click OK to accept
the definition change.
8
If you want to try the pipeline now, click the Execute button or select
Design>Execute from the menu bar.
InfoMaker retrieves the source data and executes the pipeline. If you
specified retrieval arguments in the Select painter, InfoMaker first prompts
you to supply them.
126
InfoMaker
CHAPTER 4
Working with Data Pipelines
The role of the Query governor
Options you set in the Query Governor affect the Data Pipeline painter
when you specify the data and when data is piped. In the Query Governor,
you can set data selection options and limit the number of rows piped and
the elapsed piping time.
For more information, see Chapter 2, “Working with Libraries.”
At runtime, the number of rows read and written, the elapsed execution
time, and the number of errors display in MicroHelp. You can stop
execution yourself or InfoMaker might stop execution if errors occur.
For information about execution and how rows are committed to the
destination table, see “When execution stops” on page 132.
9
Save the pipeline definition if appropriate.
For information, see “Saving a pipeline” on page 138.
Seeing the results of piping data
You can see the results of piping data by connecting to the destination
database and opening the destination table.
Modifying the data pipeline definition
After you create a pipeline definition, you can modify it in a variety of ways.
The changes you make depend on what pipeline operation you select, the
destination DBMS, and what you are trying to accomplish by executing the
pipeline.
Users Guide
127
Modifying the data pipeline definition
Table 4-1 lists properties you can modify that apply to the destination table.
These properties display at the top of the Data Pipeline painter workspace.
Table 4-1: Pipeline properties for the destination table
Item
Table
Description
Name of the destination table.
Default
If source and destination are
different, name of first table
specified in the source data
or name of the stored
procedure. If the same,
_copy is appended.
Create - Add Table.
How to edit
For Create or Replace, enter
a name.
For Refresh, Append, or
Update, select a name from
the drop-down list.
Options
Pipeline operation: Create, Replace,
Refresh, Append, or Update.
Commit
Number of rows piped to the
destination database before InfoMaker
commits the rows to the database.
100 rows.
Select a number, All, or
None from the drop-down
list.
Key
Key name for the table in the
destination database.
If the source is only one
table, the table name is
followed by _x.
(Create or Replace only)
Enter a name.
Max Errors
Number of errors allowed before the
pipeline stops.
100 errors.
Select a number or No Limit
from the drop-down list.
Extended
Attributes
(Create and Replace only) Specifies
whether or not the extended attributes
of the selected source columns are
piped to the extended attribute system
tables of the destination database.
Not checked.
Click the check box.
128
Select an option from the
drop-down list. See
Table 4-3 on page 130.
InfoMaker
CHAPTER 4
Working with Data Pipelines
Table 4-2 lists properties that you can modify that apply to the destination
table’s columns and keys. These properties display under the properties that
apply to the table itself and most can be modified only for the Create and
Replace pipeline operations.
Column names and datatypes that cannot be modified
You cannot modify the source column names and datatypes that display at the
left of the workspace.
Table 4-2: Pipeline properties for the destination table’s columns and
keys
Item
Destination
Name
Type
Description
Column name
Default
Source column name.
How to edit
Enter a name.
Column datatype
If the DBMS is unchanged,
source column datatype. If the
DBMS is different, a
best-guess datatype.
Select a type from the
drop-down list.
Key
Whether the column is a key
column (check means yes)
Source table’s key columns (if
the source is only one table and
all key columns were selected).
Select or clear check boxes.
Width
Dec
Column width
Decimal places for the column
Source column width.
Source column decimal places.
Enter a number.
Enter a number.
Nulls
Whether NULL is allowed for
the column (check means yes)
Source column value.
Select or clear check boxes.
Initial Value
Column initial value
Select an initial value from the
drop-down list.
Default
Value
Column default value
Source column initial value. (If
no initial value, character
columns default to spaces and
numeric columns default to 0.)
None. Default values stored in
the source database are not
piped to the destination
database.
Users Guide
Select a default value from the
drop-down list or enter a
default value. Keyword values
depend on destination DBMS.
129
Modifying the data pipeline definition
Choosing a pipeline operation
When InfoMaker pipes data, what happens in the destination database depends
on which pipeline operation you choose in the Options drop-down list at the
top of the workspace.
Table 4-3: Effect of pipeline operations on the destination database
Pipeline operation
Effect on destination database
Create - Add Table
A new table is created and rows selected from the
source tables are inserted.
If a table with the specified name already exists in
the destination database, a message displays and
you must select another option or change the table
name.
Replace - Drop/Add Table
An existing table with the specified table name is
dropped, a new table is created, and rows selected
from the source tables are inserted.
If no table exists with the specified name, a table is
created.
Refresh - Delete/Insert Rows
All rows of data in an existing table are deleted,
and rows selected from the source tables are
inserted.
Append - Insert Rows
All rows of data in an existing table are preserved,
and new rows selected from the source tables are
inserted.
Rows in an existing table that match the key
criteria values in the rows selected from the source
tables are updated, and rows that do not match the
key criteria values are inserted.
Update - Update/Insert Rows
Dependency of modifications on pipeline operation
The modifications you can make in the workspace depend on the pipeline
operation you have chosen.
When using
Create or Replace
When you select the Create - Add Table option (the default) or the Replace Drop/Add Table option, you can:
•
Change the destination table definition.
Follow the rules of the destination DBMS.
130
InfoMaker
CHAPTER 4
•
Working with Data Pipelines
Specify or clear a key name and/or key columns.
Specify key columns by selecting one or more check boxes to define a
unique identifier for rows. Neither a key name nor key columns are
required.
•
Allow or disallow NULLs for a column.
If NULL is allowed, no initial value is allowed. If NULL is not allowed, an
initial value is required. The words spaces (a string filled with spaces) and
today (today’s date) are initial value keywords.
•
Modify the Commit and Max Errors values.
•
Specify an initial value and a default value.
If you have specified key columns and a key name and if the destination DBMS
supports primary keys, the Data Pipeline painter creates a primary key for the
destination table. If the destination DBMS does not support primary keys, a
unique index is created.
For Oracle databases
InfoMaker generates a unique index for Oracle databases.
If you try to use the Create option, but a table with the specified name already
exists in the destination database, InfoMaker tells you, and you must select
another option or change the table name.
When you use the Replace option, InfoMaker warns you that you are deleting
a table, and you can choose another option if needed.
When using Refresh
and Append
Users Guide
For the Refresh - Delete/Insert Rows or Append - Insert Rows options, the
destination table must already exist. You can:
•
Select an existing table from the Table drop-down list.
•
Modify the Commit and Max Errors values.
•
Change the initial value for a column.
131
Modifying the data pipeline definition
When using Update
For the Update - Update/Insert Rows option, the destination table must already
exist. You can:
•
Select an existing table from the Table drop-down list.
•
Modify the Commit and Max Errors values.
•
Change the Key columns in the destination table’s primary key or unique
index, depending on what the DBMS supports. Key columns must be
selected; the key determines the UPDATE statement’s WHERE clause.
•
Change the initial value for a column.
Bind variables and the Update option
If the destination database supports bind variables, the Update option takes
advantage of them to optimize pipeline execution.
When execution stops
Execution of a pipeline can stop for any of these reasons:
•
You click the Cancel button
During the execution of a pipeline, the Execute button in the PainterBar
changes to a Cancel button.
•
The error limit is reached
•
The Query Governor’s row or elapsed-time limit is reached
If there are rows that cannot be piped to the destination table for some reason,
those error rows display once execution stops. You can correct error rows or
return to the workspace to change the pipeline definition and then execute it
again. For information, see “Correcting pipeline errors” on page 137.
Whether rows are committed
When rows are piped to the destination table, they are first inserted and then
either committed or rolled back. Whether rows are committed depends on:
132
•
What the Commit and Max Errors values are
•
When errors occur during execution
•
Whether you click the Cancel button or InfoMaker stops execution
InfoMaker
CHAPTER 4
When you stop
execution
Working with Data Pipelines
When you click Cancel or a Query Governor limit is reached, if the Commit
value is a number, every row that was piped is committed. If the Commit value
is All or None, every row that was piped is rolled back.
For example, if you click the Cancel button when the 24th row is piped and the
Commit value is 20, then:
1
20 rows are piped and committed.
2
3 rows are piped and committed.
3
Piping stops.
If the Commit value is All or None, 23 rows are rolled back.
When InfoMaker stops
execution
InfoMaker stops execution if the error limit is reached. Table 4-4 shows how
the Commit and Max Errors values affect the number of rows that are piped and
committed.
Table 4-4: Rows committed when InfoMaker stops execution
Commit value
A number n
Max Errors value
No limit or a number
m
All or None
No limit
All or None
A number n
Result
Rows are piped and committed n
rows at a time until the Max Errors
value is reached.
Every row that pipes without error is
committed.
If the number of errors is less than n,
all rows are committed.
If the number of errors is equal to n,
every row that was piped is rolled
back. No changes are made.
For example, if an error occurs when the 24th row is piped and the Commit
value is 10 and the Max Errors value is 1, then:
1
10 rows are piped and committed.
2
10 rows are piped and committed.
3
3 rows are piped and committed.
4
Piping stops.
If the Commit value is All or None, 23 rows are rolled back.
Users Guide
133
Modifying the data pipeline definition
About transactions
A transaction is a logical unit of work done by a DBMS, within which either
all the work in the unit must be completed or none of the work in the unit must
be completed. If the destination DBMS does not support transactions or is not
in the scope of a transaction, each row that is inserted or updated is committed.
About the All and
None commit values
In the Data Pipeline painter, the Commit values All and None have the same
meaning.
Piping blob data
Blob data is data that is a binary large-object such as a Microsoft Word
document or an Excel spreadsheet. A data pipeline can pipe columns
containing blob data.
The name of the datatype that supports blob data varies by DBMS. Table 4-5
shows some examples.
Table 4-5: Examples of datatypes that support blob data
DBMS
Datatypes that support blob data
Sybase SQL Anywhere
LONG BINARY,
LONG VARCHAR (if more than 32 KB)
Sybase Adaptive Server
Enterprise
Microsoft SQL Server
IMAGE,
TEXT
IMAGE,
TEXT
RAW,
LONG RAW
BYTE,
TEXT
Oracle
Informix
For information about the datatype that supports blob data in your DBMS, see
your DBMS documentation.
134
InfoMaker
CHAPTER 4
Adding blob columns
to a pipeline definition
Working with Data Pipelines
When you select data to pipe, you cannot select a blob column as part of the
data source because blobs cannot be handled in a SELECT statement. After the
pipeline definition is created, you add blob columns, one at a time, to the
definition.
❖
To add a blob column to a pipeline definition:
1
Select Design>Database Blob from the menu bar.
If the Database Blob menu item is disabled
The Database Blob menu item is disabled if the pipeline definition does
not contain a unique key for at least one source table, or if the pipeline
operation is Refresh, Append, or Update and the destination table has no
blob columns.
The Database Binary/Text Large Object dialog box displays. The Table
box has a drop-down list of tables in the pipeline source that have a
primary key and contain blob columns.
2
In the Table box, select the table that contains the blob column you want
to add to the pipeline definition.
For example, in the EAS Demo DB, the ole table contains a blob column
named Object with the large binary datatype.
3
In the Large Binary/Text Column box, select a column that has a blob
datatype.
4
In the Destination Column box, change the name of the destination column
for the blob if you want to.
If you want to add the column and see changes you make without closing
the dialog box, click Apply after each change.
5
❖
To edit the source or destination name of the blob column in the pipeline
definition:
•
❖
Display the blob column’s pop-up menu and select Properties.
To delete a blob column from the pipeline definition:
•
Users Guide
When you have specified the blob source and destination as needed, click
OK.
Display the blob column’s pop-up menu and select Clear.
135
Modifying the data pipeline definition
Executing a pipeline
with blob columns
After you have completed the pipeline definition by adding one or more blob
columns, you can execute the pipeline. When you do, rows are piped a block
at a time, depending on the Commit value. For a given block, Row 1 is inserted,
then Row 1 is updated with Blob 1, then Row 1 is updated with Blob 2, and so
on. Then Row 2 is inserted, and so on until the block is complete.
If a row is not successfully piped, the blob is not piped. Blob errors display, but
the blob itself does not display. When you correct a row and execute the
pipeline, the pipeline pipes the blob.
Changing the destination and source databases
Changing the
destination
When you create a pipeline, you can change the destination database. If you
want to pipe the same data to more than one destination, you can change the
destination database again and re-execute.
❖
To change the destination database:
•
Changing the source
Click the Destination button in the PainterBar, or select File>Destination
Connect from the menu bar.
Normally you would not change the source database, because your pipeline
definition is dependent on it, but if you need to (perhaps because you are no
longer connected to that source), you can.
❖
To change the source database:
•
Select File>Source Connect from the menu bar.
Source changes when active profile changes
When you open a pipeline in the Data Pipeline painter, the source database
becomes the active connection. If you change the active connection in the
Database painter when the Data Pipeline painter is open, the source database in
the Data Pipeline painter changes to the new active connection automatically.
Working with
database profiles
At any time in the Data Pipeline painter, you can edit an existing database
profile or create a new one.
❖
To edit or create a database profile:
•
Click the Database Profile button in the PainterBar and then click the Edit
button or the New button.
For information about how to edit or define a database profile, see
Connecting to Your Database.
136
InfoMaker
CHAPTER 4
Working with Data Pipelines
Correcting pipeline errors
If the pipeline cannot pipe certain rows to the destination table for some reason,
InfoMaker displays the following information for the error rows:
•
Name of the table in the destination database
•
Pipeline operation you chose in the Option box
•
Error messages to identify the problem with each row
•
Data values in the error rows
•
Source and destination column information
The following screen shot displays this information:
What you can do
You can correct the error rows by changing one or more of their column values
so the destination table will accept them, or you can ignore the error rows and
return to the Data Pipeline painter workspace. If you return to the workspace,
you cannot redisplay the error rows without re-executing the pipeline.
Before you return to the workspace
You might want to print the list of errors or save them in a file. Select File>Print
or File>Save As from the menu bar.
❖
To return to the Data Pipeline painter workspace without correcting
errors:
•
Users Guide
Click the Design button.
137
Saving a pipeline
❖
To correct pipeline errors:
1
Change data values for the appropriate columns in the error rows.
2
Click the Update DB button, or select Design>Update Database from the
menu bar.
InfoMaker pipes rows in which errors were corrected to the destination
table and displays any remaining errors.
3
Repeat steps 1 and 2 until all errors are corrected.
The Data Pipeline painter workspace displays.
Viewing an error
message
Sometimes you cannot see an entire error message because the column is not
wide enough. Move the pointer to the error message and press the Right Arrow
key to scroll through it. You can also drag the Error Message column border to
the width needed.
Making the error messages shorter
For ODBC data sources, you can set the MsgTerse database parameter in the
destination database profile to make the error messages shorter. If you type
MsgTerse = 'Yes', then the SQLSTATE error number does not display. For
more information on the MsgTerse parameter, see the online Help.
Saving a pipeline
When you have generated a pipeline definition in the Data Pipeline painter
workspace, you should save the pipeline. You can then reuse it later.
❖
To save a pipeline:
•
For a new pipeline
Click the Save button, or select File>Save from the menu bar.
When you save a pipeline for the first time, you must specify a name. The name
can be any valid identifier with up to 80 characters. A common convention is
to prefix the name with the string pipe_.
InfoMaker saves the pipeline in the current library. For information about
changing the current library, see “Working with libraries” on page 14.
138
InfoMaker
CHAPTER 4
Working with Data Pipelines
Using an existing pipeline
If you save a pipeline, you can modify and execute it any time. You can also
pipe data that might have changed since the last pipeline execution or pipe data
to other databases.
❖
To use an existing pipeline:
1
Click the Open button in the PowerBar.
2
In the Open dialog box, select the Pipelines object type in the Object Type
drop-down list, select the pipeline you want to execute, and click OK.
If you do not see the pipeline you want in the Open dialog box, close the
dialog box and change the current library.
3
If you want to change the pipeline operation, select a new option from the
Options drop-down list in the workspace.
4
Modify the pipeline definition as needed.
5
Execute and/or save the pipeline.
Pipeline examples
Updating data in a
destination table
You might want to pipe data and then update the data often.
❖
To update a destination table:
1
Click the Pipeline button, select an existing pipeline that you executed
before, and click OK.
The pipeline definition displays. Since this pipeline has been executed
before, the table exists in the destination database.
2
Select the Update option in the pipeline definition.
3
Execute the pipeline.
The destination table is updated with current data from the source
database.
Users Guide
139
Pipeline examples
Reproducing a table
definition with no data
You can force a pipeline to create a table definition and not pipe data. To do
this, you must use Quick Select, SQL Select, or Query as the data source. It is
easiest to do it using SQL Select.
❖
To reproduce a table definition with no data:
1
Click the Pipeline button, click New, select SQL Select as the data source
and specify the source and destination databases, and click OK.
2
In the Select painter, open the table you want to reproduce and select all
columns.
3
On the Where tab page, type an expression that will never evaluate to true,
such as 1 = 2.
4
Click the SQL Select button to create the pipeline definition.
5
Select the Extended Attributes check box.
6
Click the Execute button to execute the pipeline.
The table definition is piped to the destination database, but no rows of
data are piped. You can open the new table in the Database painter and
then click the Grid, Table, or Freeform button to view the data. As
specified, there is no data.
If you use a data source other than SQL Select, you can follow the previous
procedure, but you need to edit the data source of the pipeline to open the Select
painter in step 2.
Piping a table to many
databases
In the Data Pipeline painter workspace, you can execute a pipeline many times
with a different destination database each time.
❖
140
To pipe a table to many databases:
1
Select File>Destination Connect from the menu bar to change the
destination to the database you want.
2
Execute the pipeline.
3
Repeat steps 1 and 2 for each database you want.
InfoMaker
PART
3
Reports
This part introduces you to the many styles of reports
available in InfoMaker and describes how to create and
work with reports.
CH A PTE R
5
About this chapter
Contents
Defining Reports
The reports you create are centered around your organization’s data. This
chapter describes how to define reports to display the data.
Topic
About reports
Page
143
Choosing a presentation style
Building a report
144
153
Selecting a data source
Using Quick Select
154
156
Using SQL Select
Using Query
165
180
Using External
Using Stored Procedure
180
182
Choosing report-wide options
184
Generating and saving a report
Defining queries
185
188
What's next
190
About reports
Reports provide many ways for you to present data. You might want a
tabular report with rows and columns of information. Sometimes a graph
or a crosstab is a better way to present the data.
Reports can also be mailing labels or many reports nested together on the
same page. Freeform reports let you place text, data, lines, boxes, and
pictures anywhere you want.
Reports versus
DataWindow objects
Users Guide
Reports are the same as the DataWindow objects that PowerBuilder users
can create in the PowerBuilder DataWindow painter, except that they
cannot be updated. When you create a report in the Report painter, you are
actually creating a nonupdatable DataWindow object.
143
Choosing a presentation style
About the term
DataWindow
The terms DataWindow and report are often used interchangeably. Many of the
examples in this book were captured in the PowerBuilder environment. In
these examples, the title bar of a report includes the word DataWindow instead
of Report. Sometimes dialog boxes use the word DataWindow instead of
report.
If you need update capabilities
If you need update capabilities, use the InfoMaker Form painter to create a
form. Forms are for updating, whereas reports are read-only.
Choosing a presentation style
The presentation style you select for a report determines the format InfoMaker
uses to display the report in the Design view. You can use the format as
displayed or modify it to meet your needs.
When you create a report, you can choose from the presentation styles listed in
the following table.
Table 5-1: Report presentation styles
144
Using this
Report wizard
You create a new report
Composite
Crosstab
That includes other reports
With summary data in a spreadsheet-like grid
Freeform
With the data columns going down the page and labels next to
each column
Graph
Grid
Group
With data displayed in a graph
With data in row and column format with grid lines separating
rows and columns
With data in rows that are divided into groups
Label
N-Up
That presents data as labels
With two or more rows of data next to each other
OLE 2.0
RichText
That is a single OLE object
That combines input fields that represent database columns with
formatted text
Tabular
With data columns going across the page and headers above each
column
InfoMaker
CHAPTER 5
Using this
Report wizard
TreeView
Defining Reports
You create a new report
With data grouped in rows in a TreeView; the TreeView displays
the data hierarchically in a way that allows you to expand and
collapse it
Using the Tabular style
The Tabular presentation style presents data with the data columns going
across the page and headers above each column. As many rows from the
database will display at one time as can fit in the report. You can reorganize the
default layout any way you want by moving columns and text:
Users Guide
145
Choosing a presentation style
Using the Freeform style
The Freeform presentation style presents data with the data columns going
down the page and labels next to each column. You can reorganize the default
layout any way you want by moving columns and text.
Using the Grid style
The Grid presentation style shows data in row-and-column format with grid
lines separating rows and columns. With other styles, you can move text,
values, and other objects around freely in designing the report. With the grid
style, the grid lines create a rigid structure of cells.
An advantage of the Grid style is that you can reorder and resize columns at
runtime.
Original Grid report
146
This grid report shows employee information. Several of the columns have a
large amount of extra white space:
InfoMaker
CHAPTER 5
Grid report with
modified column
widths
Defining Reports
This grid report was created from the original one by decreasing the width of
some columns:
Using the Label style
The Label presentation style shows data as labels. With this style you can
create mailing labels, business cards, name tags, index cards, diskette labels,
file folder labels, and many other types of labels.
Mailing labels
Users Guide
147
Choosing a presentation style
Business cards
Name tags
Specifying label
properties
If you choose the Label style, you are asked to specify the properties for the
label after specifying the data source. You can choose from a list of predefined
label types or enter your own specifications manually.
Where label
definitions come from
InfoMaker gets the information about the predefined label formats from a
preferences file called pblab115.ini.
Using the N-Up style
The N-Up style presents two or more rows of data next to each other. It is
similar to the Label style in that you can have information from several rows
in the database across the page. However, the information is not meant to be
printed on labels. The N-Up presentation style is useful if you have periodic
data; you can set it up so that each period repeats in a row.
After you select a data source, you are asked how many rows to display across
the page.
For each column in the data source, InfoMaker defines n columns in the report
(column_1 to column_n), where n is the number of rows you specified.
148
InfoMaker
CHAPTER 5
Table example
Defining Reports
For a table of daily stock prices, you can define the report as five across, so
each row in the report displays five days’ prices (Monday through Friday).
Suppose you have a table with two columns, day and price, that record the
closing stock price each day for three weeks.
In the following n-up report, 5 was selected as the number of rows to display
across the page, so each line in the report shows five days’ stock prices. A
computed field was added to get the average closing price in the week:
About computed fields in n-up reports
You use subscripts, such as price[0], to refer to particular rows in the detail
band in n-up reports.
For more information, see Chapter 6, “Enhancing Reports.”
Here is the report in the Preview view:
Users Guide
149
Choosing a presentation style
Another way to get multiple-column reports
In an n-up report, the data is displayed across and then down. If you want your
data to go down the page and then across in multiple columns, as in a phone
list, you should create a standard tabular report, then specify newspaper
columns.
For more information on newspaper columns, see Chapter 6, “Enhancing
Reports.”
Using the Group style
The Group presentation style provides an easy way to create grouped reports,
where the rows are divided into groups, each of which can have statistics
calculated for it. Using this style generates a tabular report that has grouping
properties defined.
This Group style report groups by department and lists employees and salaries.
It also includes a subtotal and a grand total for the salary column:
For more about the Group presentation style, see Chapter 9, “Filtering,
Sorting, and Grouping Rows.”
Using the Composite style
The Composite presentation style allows you to combine multiple reports in the
same object. It is particularly handy if you want to print more than one report
on a page.
150
InfoMaker
CHAPTER 5
Defining Reports
This composite report consists of three nested tabular reports. One of the
tabular reports includes a graph:
For more about the Composite presentation style, see Chapter 11, “Using
Nested Reports.”
Using the Graph and Crosstab styles
In addition to the (preceding) text-based presentation styles, InfoMaker
provides two styles that allow you to display information graphically: Graph
and Crosstab.
Users Guide
151
Choosing a presentation style
There is a graph report in the composite report in “Using the Composite style”
on page 150. This crosstab report counts the number of employees that fit into
each cell. For example, there are three employees in department 100 who make
between $30,000 and $39,999:
For more information about these two presentation styles, see Chapter 13,
“Working with Graphs,” and Chapter 14, “Working with Crosstabs.”
Using the OLE 2.0 style
The OLE presentation style lets you link or embed an OLE object in a report.
For information about the OLE 2.0 presentation style, see Chapter 17, “Using
OLE in a Report.”
Using the RichText style
The RichText presentation style lets you combine input fields that represent
database columns with formatted text.
For more information about the RichText presentation style, see Chapter 16,
“Working with Rich Text.”
152
InfoMaker
CHAPTER 5
Defining Reports
Using the TreeView style
The TreeView presentation style provides an easy way to create reports that
display hierarchical data in a TreeView, where the rows are divided into groups
that can be expanded and collapsed. Icons (+ or –) show whether the state of a
group in the TreeView is expanded or collapsed, and lines connect parents and
their children.
This TreeView style report groups by manager ID and state and lists employee
information and salaries:
For more about the TreeView presentation style, see Chapter 15, “Working
with TreeViews.”
Building a report
You use a wizard to build a new report. To create a report or use the Report
painter, you must be connected to the database whose data you will be
accessing. When you open the Report painter or select a data source in the
wizard, InfoMaker connects you to the DBMS and database you used last. If
you need to connect to a different database, do so before working with a report.
Users Guide
153
Selecting a data source
Column limit
There is a limit of 1000 on the number of columns in a report.
For information about changing your database connection, see Connecting to
Your Database.
❖
To create a new report:
1
Select File>New from the menu bar and select the Object tab.
2
Choose a presentation style for the report.
The presentation style determines how the data is displayed. See
“Choosing a presentation style” on page 144. When you choose the
presentation style, the appropriate report wizard starts.
3
If you want data to be retrieved in the Preview view when the report opens,
select the Retrieve on Preview check box.
4
Define the data source.
See “Selecting a data source” on page 154.
5
Choose options for the report and click Next.
See “Choosing report-wide options” on page 184.
6
Review your specifications and click Finish.
The report displays in the Design view.
7
Save the report in a library.
Selecting a data source
The data source you choose determines how you select the data that will be
used in the report.
About the term data source
The term data source used here refers to how you use the Report painter to
specify the data to retrieve into the report. Data source can also refer to where
the data comes from, such as a SQL Anywhere data source (meaning a database
file) or an XML data source (meaning an XML file). Connecting to Your
Database uses the term data source in this second sense.
154
InfoMaker
CHAPTER 5
InfoMaker data
sources
Defining Reports
InfoMaker has five data sources. All five can be used for reports, but only a
subset of the possible data sources can be used for forms and data pipelines:
Data source
Reports
Forms
Pipelines
Quick Select
SQL Select
X
X
X
X
X
X
Query
External
X
X
X
X
Stored Procedure
If the DBMS supports
stored procedures that
return result sets
X
You cannot create a form for data that is not stored in a database. A form allows
you to display and change data in a database.
About stored procedures
The Stored Procedure data source icon displays only if the DBMS you are
currently connected to supports stored procedures that return result sets.
To specify the data for a report, choose one of the data sources from Table 5-2.
Table 5-2: Data source choices for data from a database
Data source
Quick Select
SQL Select
Query
Use when
The data is from a single table (or from tables that are related
through foreign keys) and you only need to choose columns,
selection criteria, and sorting.
You want more control over the SQL SELECT statement
generated for the data source or your data is from tables that
are not connected through a key. For example, you need to
specify grouping, computed columns or retrieval arguments
within the SQL SELECT statement.
The data has been defined as a query.
External
The data is coming from text file (TXT) or dBASE II or
dBASE III file (DBF).
Stored Procedure
The data is defined in a stored procedure.
After you choose a data source in the various Report wizards, you specify the
data. The data source you choose determines what displays in the wizards and
how you define the data.
Users Guide
155
Using Quick Select
Using Quick Select
The easiest way to define a data source is using Quick Select.
❖
To define the data using Quick Select:
1
Click Quick Select in the Choose Data Source dialog box in the wizard and
click Next.
2
Select the table that you will use in the report.
For more information, see “Selecting a table” next.
3
Select the columns to be retrieved from the database.
For more information, see “Selecting columns” on page 158.
4
(Optional) Sort the rows before you retrieve data.
For more information, see “Specifying sorting criteria” on page 159.
5
(Optional) Select what data to retrieve.
For more information, see “Specifying selection criteria” on page 159.
6
Click the OK button in the Quick Select dialog box.
You return to the wizard to complete the definition of the report.
Quick Select
limitations
When you choose Quick Select as your data source, you cannot:
•
Specify grouping before rows are retrieved
•
Include computed columns
•
Specify retrieval arguments for the SELECT statement that are supplied at
runtime.
To use these options when you create a report, choose SQL Select as your data
source. If you decide later that you want to use retrieval arguments, you can
define them by modifying the data source. For more information, see Chapter
6, “Enhancing Reports.”
156
InfoMaker
CHAPTER 5
Defining Reports
Selecting a table
When you choose Quick Select, the Quick Select dialog box displays. The
Tables box lists tables and views in the current database.
Displaying table comments
To display a comment about a table, position the pointer on the table and click
the right mouse button or select the table.
Which tables and
views display?
The DBMS determines what tables and views display. For some DBMSs, all
tables and views display, whether or not you have authorization. If you select
a table or view you are not authorized to access, the DBMS issues a message.
For ODBC databases, the tables and views that display depend on the driver for
the data source. SQL Anywhere does not restrict the display, so all tables and
views display, whether or not you have authorization.
Tables with key
relationships
Users Guide
When you select a table, the table’s column names display in the Columns box,
and any tables having a key relationship with the selected table display in the
Tables box. These tables are indented and marked with an arrow to show their
relationship to the selected table. You can select any of these related tables if
you want to include columns from them in the report.
157
Using Quick Select
Meaning of the up and
down arrows
An arrow displays next to a table to indicate its relationship to the selected
table. The arrow always points in the many direction of the relationship—
toward the selected table (up) if the selected table contains a foreign key in the
relationship and away from the selected table (down) if the selected table
contains a primary key in the relationship:
In this preceding illustration, the selected table is sales_order. The Up arrows
indicate that a foreign key in the sales_order table is mapped to the primary key
in the customer and fin_code tables. The Down arrow indicates that the
sales_order_items table contains a foreign key mapped to the primary key in
the sales_order table.
How columns from
additional tables
display
The column names of selected tables display in the Columns box. If you select
more than one table, the column names are identified as:
tablename.columnname
For example, department.dept_name and employee.emp_id display when the
Employee table and the Department table are selected.
To return to the original table list
Click the table you first selected at the top of the table list.
Selecting columns
You can select columns from the primary table and from its related tables.
Select the table whose columns you want to use in the Tables box, and add
columns from the Columns box:
158
•
To add a column, select it in the Columns box.
•
To add all the columns that display in the Columns box, click Add All.
•
To remove a column, deselect it in the Columns box.
•
To view comments that describe a table or column, position the pointer on
a table or column name, and press and hold the right mouse button.
InfoMaker
CHAPTER 5
Defining Reports
As you select columns, they display in the grid at the bottom of the dialog box
in the order in which you select them. If you want the columns to display in a
different order in the report, select a column name you want to move in the grid
and drag it to the new location.
Specifying sorting criteria
In the grid at the bottom of the Quick Select dialog box, you can specify if you
want the retrieved rows to be sorted. As you specify sorting criteria, InfoMaker
builds an ORDER BY clause for the SELECT statement.
❖
To sort retrieved rows on a column:
1
Click in the Sort row for the column you want to sort on.
InfoMaker displays a drop-down list:
2
Multilevel sorts
Select the sorting order for the rows: Ascending or Descending.
You can specify as many columns for sorting as you want. InfoMaker processes
the sorting criteria left to right in the grid: the first column with Ascending or
Descending specified becomes the highest level sorting column, the next
column with Ascending or Descending specified becomes the next level
sorting column, and so on.
If you want to do a multilevel sort that does not match the column order in the
grid, drag the columns to the correct order and then specify the columns for
sorting.
Specifying selection criteria
You can enter selection criteria in the grid to specify which rows to retrieve.
For example, instead of retrieving data about all employees, you might want to
limit the data to employees in Sales and Marketing, or to employees in Sales
who make more than $80,000.
As you specify selection criteria, InfoMaker builds a WHERE clause for the
SELECT statement.
Users Guide
159
Using Quick Select
❖
To specify selection criteria:
1
Click the Criteria row below the first column for which you want to select
the data to retrieve.
2
Enter an expression, or if the column has an edit style, select or enter a
value.
If the column is too narrow for the criterion, drag the grid line to enlarge
the column. This enlargement does not affect the column size in a report.
3
Enter additional expressions until you have specified the data you want to
retrieve.
About edit styles
If a column has an edit style associated with it in the extended attribute system
tables (that is, the association was made in the Database painter), if possible,
the edit style is used in the grid. Drop-down list boxes are used for columns
with code tables and columns using the CheckBox and RadioButton edit styles.
SQL operators
supported in Quick
Select
You can use these SQL relational operators in the retrieval criteria:
Table 5-3: SQL relational operators used in retrieval criteria
Operator
=
Meaning
Is equal to (default operator)
>
<
Is greater than
Is less than
<>
>=
Is not equal to
Is greater than or equal to
<=
LIKE
Is less than or equal to
Matches this pattern
NOT LIKE
IN
Does not match this pattern
Is in this set of values
NOT IN
Is not in this set of values
Because = is the default operator, you can enter the value 100 instead of = 100,
or the value New Hampshire instead of = New Hampshire.
160
InfoMaker
CHAPTER 5
Comparison operators
Defining Reports
You can use the LIKE, NOT LIKE, IN, and NOT IN operators to compare
expressions.
Use LIKE to search for strings that match a predetermined pattern. Use NOT
LIKE to find strings that do not match a predetermined pattern. When you use
LIKE or NOT LIKE, you can use wildcards:
•
The percent sign (%), like the wildcard asterisk (*) used in many
applications, matches multiple characters. For example, Good% matches all
names that begin with Good.
•
The underscore character (_) matches a single character. For example,
Good _ _ _ matches all seven-letter names that begin with Good.
Use IN to compare and include a value that is in a set of values. Use NOT IN to
compare and include values that are not in a set of values. For example, the
following clause selects all employees in department 100, 200, or 500:
SELECT * from employee
WHERE dept_id IN (100, 200, 500)
Using NOT IN in this clause would exclude employees in those departments.
Connection operators
You can use the OR and AND logical operators to connect expressions.
InfoMaker makes some assumptions based on how you specify selection
criteria. When you specify:
•
Criteria for more than one column on one line
InfoMaker assumes a logical AND between the criteria. A row from the
database is retrieved if all criteria in the line are met.
•
Two or more lines of selection criteria
InfoMaker assumes a logical OR. A row from the database is retrieved if
the criterion in any of the lines is met.
To override these defaults, begin an expression with the AND or OR operator:
Operator
OR
Meaning
The row is selected if one expression OR another expression is true
AND
The row is selected if one expression AND another expression are true
This technique is particularly handy when you want to retrieve a range of
values in a column. See example 6 below.
Users Guide
161
Using Quick Select
SQL expression examples
The first six examples in this section all refer to a grid that contains three
columns from the employee table: emp_id, dept_id, and salary.
Example 1
The expression <50000 in the Criteria row in the salary column in the grid
retrieves information for employees whose salaries are less than $50,000.
The SELECT statement that InfoMaker creates is:
SELECT employee.emp_id,
employee.dept_id,
employee.salary
FROM employee
WHERE employee.salary < '50000'
Example 2
The expression 100 in the Criteria row in the DeptId column in the grid
retrieves information for employees who belong to department 100.
The SELECT statement that InfoMaker creates is:
SELECT employee.emp_id,
employee.dept_id,
employee.salary
FROM employee
WHERE employee.dept_id ='100'
Example 3
162
The expression >300 in the Criteria row in the EmpId column and the
expression <50000 in the Criteria row in the Salary column in the grid retrieve
information for any employee whose employee ID is greater than 300 and
whose salary is less than $50,000.
InfoMaker
CHAPTER 5
Defining Reports
The SELECT statement that InfoMaker creates is:
SELECT employee.emp_id,
employee.dept_id,
employee.salary
FROM employee
WHERE (employee.emp_id >'300') AND
employee.salary <'50000'
Example 4
The expressions 100 in the Criteria row and >300 in the Or row for the DeptId
column, together with the expression <50000 in the Criteria row in the Salary
column, retrieve information for employees who belong to:
•
Department 100 and have a salary less than $50,000
or
•
A department whose ID is greater than 300, no matter what their salaries
The SELECT statement that InfoMaker creates is:
SELECT employee.emp_id,
employee.dept_id,
employee.salary
FROM employee
WHERE (employee.dept_id = '100') AND
(emplyee.salary < '50000')OR
(employee.dept_id > '300')
Example 5
The expression IN(100,200) in the Criteria row in the DeptId column in the
grid retrieves information for employees who are in department 100 or 200.
The SELECT statement that InfoMaker creates is:
SELECT employee.emp_id,
employee.dept_id,
employee.salary
FROM employee
WHERE employee.dept_id IN ('100,200')
Users Guide
163
Using Quick Select
Example 6
This example shows the use of the word AND in the Or criteria row. In the
Criteria row, >=500 is in the EmpId column and >=30000 is in the Salary
column. In the Or row, AND <=1000 is in the EmpId column and AND <=50000
is in the Salary column. These criteria retrieve information for employees who
have an employee ID from 500 to 1000 and a salary from $30,000 to $50,000.
The SELECT statement that InfoMaker creates is:
SELECT employee.emp_id,
employee.dept_id,
employee.salary
FROM employee
WHERE (((employee.emp_id >='500') AND
(employee.salary >='30000') AND
(employee.emp_id <='1000') AND
(employee.salary <='50000')))
Example 7
In a grid with three columns: emp_last_name, emp_first_name, and salary, the
expressions LIKE C% in the Criteria row and LIKE G% in the Or row in the
emp_last_name column retrieve information for employees who have last
names that begin with C or G.
The SELECT statement that InfoMaker creates is:
SELECT employee.emp_last_name,
employee.emp_first_name,
employee.salary
FROM employee
WHERE (((employee.emp_last_name LIKE 'C%'))OR
((employee.emp_last_name LIKE 'G%')))
164
InfoMaker
CHAPTER 5
Defining Reports
Using SQL Select
In specifying data for a report, you have more options for specifying complex
SQL statements when you use SQL Select as the data source. When you choose
SQL Select, you go to the SQL Select painter, where you can paint a SELECT
statement that includes the following:
•
More than one table
•
Selection criteria (WHERE clause)
•
Sorting criteria (ORDER BY clause)
•
Grouping criteria (GROUP BY and HAVING clauses)
•
Computed columns
•
One or more arguments to be supplied at runtime
Saving your work as a query
While in the SQL Select painter, you can save the current SELECT statement
as a query by selecting File>Save As from the menu bar. Doing so allows you
to easily use this data specification again in other reports.
For more information about queries, see “Defining queries” on page 188.
❖
To define the data using SQL Select:
1
Click SQL Select in the Choose Data Source dialog box in the wizard and
click Next.
The Select Tables dialog box displays.
2
Select the tables and/or views that you will use in the report.
For more information, see “Selecting tables and views” next.
3
Select the columns to be retrieved from the database.
For more information, see “Selecting columns” on page 168.
4
Join the tables if you have selected more than one.
For more information, see “Joining tables” on page 170.
5
Select retrieval arguments if appropriate.
For more information, see “Using retrieval arguments” on page 173.
Users Guide
165
Using SQL Select
6
Limit the retrieved rows with WHERE, ORDER BY, GROUP BY, and
HAVING criteria, if appropriate.
For more information, see “Specifying selection, sorting, and grouping
criteria” on page 175.
7
If you want to eliminate duplicate rows, select Distinct from the Design
menu. This adds the DISTINCT keyword to the SELECT statement.
8
Click the Return button on the PainterBar.
You return to the wizard to complete the definition of the report.
Selecting tables and views
After you have chosen SQL Select, the Select Tables dialog box displays in
front of the Table Layout view of the SQL Select painter. What tables and
views display in the dialog box depends on the DBMS. For some DBMSs, all
tables and views display, whether or not you have authorization. Then, if you
select a table or view you are not authorized to access, the DBMS issues a
message.
For ODBC databases, the tables and views that display depend on the driver for
the data source. SQL Anywhere does not restrict the display, so all tables and
views display, whether or not you have authorization.
❖
To select the tables and views:
•
Do one of the following:
•
Click the name of each table or view you want to open.
Each table you select is highlighted. (To deselect a table, click it
again.) Click the Open button to close the Select Tables dialog box.
•
Double-click the name of each table or view you want to open.
Each object opens immediately behind the Select Tables dialog box.
Click the Cancel button to close the Select Tables dialog box.
Representations of the selected tables and views display. You can move or size
each table to fit the space as needed.
166
InfoMaker
CHAPTER 5
Defining Reports
Below the Table Layout view, several tabbed views also display by default.
You use the views (for example, Compute, Having, Group) to specify the SQL
SELECT statement in more detail. You can turn the views on and off from the
View menu on the menu bar.
Specifying what is
displayed
You can display the label and datatype of each column in the tables (the label
information comes from the extended attribute system tables). If you need
more space, you can choose to hide this information.
❖
To hide or display comments, datatypes, and labels:
1
Position the pointer on any unused area of the Table Layout view and
select Show from the pop-up menu.
A cascading menu displays.
2
Colors in the SQL
Select painter
Select or clear Datatypes, Labels, or Comments as needed.
The colors used by the SQL Select painter to display the Table Layout view
background and table information are specified in the Database painter. You
can also set colors for the text and background components in the table header
and detail areas.
For more information about specifying colors in the Database painter, see
“Modifying database preferences” on page 81.
Adding and removing
tables and views
You can add tables and views to your Table Layout view at any time.
Table 5-4: Adding tables and views in the SQL Select painter
To do this
Add tables or views
Do this
Click the Tables button in the PainterBar and select
tables or views to add
Remove a table or view
Remove all tables and views
Display its pop-up menu and select Close
Select Design>Undo All from the menu bar
You can also remove individual tables and views from the Table Layout view,
or clear them all at once and begin selecting a new set of tables.
How InfoMaker joins
tables
If you select more than one table in the SQL Select painter, InfoMaker joins
columns based on their key relationship.
For information about joins, see “Joining tables” on page 170.
Users Guide
167
Using SQL Select
Selecting columns
You can click each column you want to include from the table representations
in the Table Layout view. InfoMaker highlights selected columns and places
them in the Selection List at the top of the SQL Select painter.
❖
To reorder the selected columns:
•
❖
To select all columns from a table:
•
❖
Drag a column in the Selection List with the mouse. Release the mouse
button when the column is in the proper position in the list.
Move the pointer to the table name and select Select All from the pop-up
menu.
To include computed columns:
1
Click the Compute tab to make the Compute view available (or select
View>Compute if the Compute view is not currently displayed).
Each row in the Compute view is a place for entering an expression that
defines a computed column.
2
Enter one of the following:
•
An expression for the computed column. For example: salary/12
•
A function supported by your DBMS. For example, the following is a
SQL Anywhere function:
substr("employee"."emp_fname",1,2)
You can display the pop-up menu for any row in the Compute view. Using
the pop-up menu, you can select and paste the following into the
expression:
•
Names of columns in the tables used in the report, form, or pipeline
•
Any retrieval arguments you have specified
•
Functions supported by the DBMS
About these functions
The functions listed here are provided by your DBMS. They are not
InfoMaker functions. This is so because you are now defining a
SELECT statement that will be sent to your DBMS for processing.
168
InfoMaker
CHAPTER 5
3
Defining Reports
Press the Tab key to get to the next row to define another computed
column, or click another tab to make additional specifications.
InfoMaker adds the computed columns to the list of columns you have
selected.
About computed
columns and
computed fields
Computed columns you define in the SQL Select painter are added to the SQL
statement and used by the DBMS to retrieve the data. The expression you
define here follows your DBMS’s rules.
You can also choose to define computed fields, which are created and
processed dynamically by InfoMaker after the data has been retrieved from the
DBMS. There are advantages to doing this. For example, work is offloaded
from the database server, and the computed fields update dynamically as data
changes in the report. (If you have many rows, however, this updating can
result in slower performance.) For more information, see Chapter 6,
“Enhancing Reports.”
Displaying the underlying SQL statement
As you specify the data for the report in the SQL Select painter, InfoMaker
generates a SQL SELECT statement. It is this SQL statement that will be sent
to the DBMS when you retrieve data into the report. You can look at the SQL
as it is being generated while you continue defining the data for the report.
❖
To display the SQL statement:
•
Click the Syntax tab to make the Syntax view available, or select
View>Syntax if the Syntax view is not currently displayed.
You may need to use the scroll bar to see all parts of the SQL SELECT
statement. This statement is updated each time you make a change.
Editing the SELECT
statement
syntactically
Instead of modifying the data source graphically, you can directly edit the
SELECT statement in the SQL Select painter.
Converting from syntax to graphics
If the SQL statement contains unions or the BETWEEN operator, it may not be
possible to convert the syntax back to graphics mode. In general, once you
convert the SQL statement to syntax, you should maintain it in syntax mode.
Users Guide
169
Using SQL Select
❖
To edit the SELECT statement:
1
Select Design>Convert to Syntax from the menu bar.
InfoMaker displays the SELECT statement in a text window.
2
Edit the SELECT statement.
3
Do one of the following:
•
Select Design>Convert to Graphics from the menu bar to return to the
SQL Select painter.
•
Click the Return button to return to the wizard if you are building a
new report, or to the Report painter if you are modifying an existing
report.
Joining tables
If the report will contain data from more than one table, you should join the
tables on their common columns. If you have selected more than one table,
InfoMaker joins columns according to whether they have a key relationship:
•
Columns with a primary/foreign key relationship are joined automatically.
•
Columns with no key relationship are joined, if possible, based on
common column names and types.
InfoMaker links joined tables in the SQL Select painter Table Layout view.
InfoMaker joins can differ depending on the order in which you select the
tables, and sometimes the InfoMaker best-guess join is incorrect, so you may
need to delete a join and manually define a join.
❖
To delete a join:
1
Click the join operator connecting the tables.
The Join dialog box displays.
2
❖
170
Click Delete.
To join tables:
1
Click the Join button in the PainterBar.
2
Click the columns on which you want to join the tables.
3
To create a join other than an equality join, click the join operator in the
Table Layout view.
InfoMaker
CHAPTER 5
Defining Reports
The Join dialog box displays:
4
Select the join operator you want and click OK.
If your DBMS supports outer joins, and the Allow Cross Product option is
set in the Query Governor, outer join options also display in the Join dialog
box.
About the Query Governor
You can use the Query Governor to set data selection and retrieval options.
For more information about the Query Governor, see “Using the Query
Governor” on page 48.
Using ANSI outer joins
All InfoMaker database interfaces provide support for ANSI SQL-92 outer join
SQL syntax generation. InfoMaker supports both left and right outer joins in
graphics mode in the SQL Select painter, and full outer and inner joins in
syntax mode. Depending on your database interface, you might need to set the
OJSyntax DBParm to enable ANSI outer joins. For more information, see
OJSyntax in the online Help.
The syntax for ANSI outer joins is generated according to the following BNF
(Backus Naur form):
OUTER-join ::=
table-reference {LEFT | RIGHT} OUTER JOIN table-reference ON
search-condition
table-reference ::=
table_view_name [correlation_name] | OUTER-join
Users Guide
171
Using SQL Select
Order of evaluation
and nesting
In ANSI SQL-92, when nesting joins, the result of the first outer join
(determined by order of ON conditions) is the operand of the outer join that
follows it. In InfoMaker, an outer join is considered to be nested if the
table-reference on the left of the JOIN has been used before within the same
outer join nested sequence.
The order of evaluation for ANSI syntax nested outer joins is determined by
the order of the ON search conditions. This means that you must create the
outer joins in the intended evaluation order and add nested outer joins to the
end of the existing sequence, so that the second table-reference in the outer join
BNF above will always be a table_view_name.
Nesting example
For example, if you create a left outer join between a column in Table1 and a
column in Table2, then join the column in Table2 to a column in Table3, the
product of the outer join between Table1 and Table2 is the operand for the outer
join with Table3.
For standard database connections, the default generated syntax encloses the
outer joins in escape notation {oj ...} that is parsed by the driver and
replaced with DBMS-specific grammar:
SELECT Table1.col1, Table2.col1, Table3.col1
FROM {oj {oj Table1 LEFT OUTER JOIN Table2 ON Table1.col1 =
Table2.col1}
LEFT OUTER JOIN Table3 ON Table2.col1 = Table3.col1}
Table references
Table references are considered equal when the table names are equal and there
is either no alias (correlation name) or the same alias for both. Reusing the
operand on the right is not allowed, because ANSI does not allow referencing
the table_view_name twice in the same statement without an alias.
Determining left and
right outer joins
When you create a join condition, the table you select first in the painter is the
left operand of the outer join. The table that you select second is the right
operand. The condition you select from the Joins dialog box determines
whether the join is a left or right outer join.
For example, suppose you select the dept_id column in the employee table, then
select the dept_id column in the department table, then choose the following
condition:
employee.dept_id = department.dept_id and rows from
department that have no employee
The syntax generated is:
SELECT employee.dept_id, department.dept_id
FROM {oj "employee" LEFT OUTER JOIN "department" ON
"employee"."dept_id" = "department"."dept_id"}
172
InfoMaker
CHAPTER 5
Defining Reports
If you select the condition with rows from department that have no
employee, you create a right outer join instead.
Equivalent statements
The syntax generated when you select table A then table B and create a left
outer join is equivalent to the syntax generated when you select table B then
table A and create a right outer join.
For more about outer joins, see your DBMS documentation.
Using retrieval arguments
If you want a report, form, or pipeline to prompt for criteria to determine which
rows to retrieve when you preview the report, run the form, or execute the
pipeline, you can use retrieval arguments in the SQL SELECT statement. If
you define the data source without defining retrieval arguments and decide
later that you need arguments, you can return to the Select painter to define the
arguments.
Another way to prompt for retrieval criteria
You can select View>Column Specifications from the menu bar. In the Column
Specification view, a column of check boxes next to the columns in the data
source lets you identify the columns to be prompted for. This, like the Retrieval
Arguments prompt, calls the Retrieve method.
See Chapter 6, “Enhancing Reports,” and Chapter 20, “Enhancing Forms.”
For example, suppose you are creating a report that provides information about
any employee. When you are defining the report in the Report painter, you pass
the employee ID as an argument (placeholder). When you run the report, you
are prompted for the employee ID, you supply the ID number, and the report
displays information about that employee.
❖
Users Guide
To define retrieval arguments:
1
Make sure you are in the Select painter (from the Report painter or the
Form painter, select Design>Data Source from the menu bar).
2
In the SQL Select painter, select Design>Retrieval Arguments from the
menu bar.
173
Using SQL Select
3
Enter a name and datatype for each argument.
The first character must be alphabetic (a–z); subsequent characters can be
alphanumeric (a–z, 1–9), an underscore ( _ ), or a dollar sign ($).
4
Specifying an array as
a retrieval argument
Click the Add button to define additional arguments as needed, and click
OK when done.
You can specify an array of values as your retrieval argument. For example,
suppose you want a report that shows employee names and IDs for a few
departments and prompts you to enter the IDs when you preview the report.
In the Specify Retrieval Arguments dialog box, choose the type of array from
the Type drop-down list. For the case of department IDs, the array is a number
array.
Referencing retrieval arguments
After you define retrieval arguments, you must reference the arguments in the
Where view or Having view in the Select painter.
To reference an argument means to refer to the argument in an expression so
that InfoMaker can use it as a placeholder until you provide the actual value.
For example, if a report is retrieving all rows from the Department table where
the DeptID matches a value provided, the WHERE clause looks something like
this:
WHERE DeptID = :Entered_id
where Entered_id was defined previously as a retrieval argument in the Specify
Retrieval Arguments dialog box.
How retrieval arguments are referenced
In SQL statements, variables (called host variables) are always prefaced with
a colon to distinguish them from column names.
A retrieval argument is a variable. To reference the retrieval argument
Entered_id in a SQL statement, enter:
:Entered_id
Referencing an array
174
To reference an array, use the IN operator and reference the retrieval argument
in the WHERE or HAVING clause.
InfoMaker
CHAPTER 5
Defining Reports
For the case of the array defined as deptarray, the expression in the Where view
will look like the following expression. You can paste the :deptarray argument
using the pop-up menus in the value area of the Where view:
Supplying values for
an array argument
When you preview the report, you are prompted to supply the department
values. InfoMaker retrieves rows that match one of the set of values that you
supply. For example, if you supply the department IDs 100, 200, and 500 as
shown, your report displays information about these departments:
Specifying selection, sorting, and grouping criteria
In the SELECT statement associated with a report, you can add selection,
sorting, and grouping criteria that are added to the SQL statement and
processed by the DBMS as part of the retrieval.
Table 5-5: Adding selection, sorting, and grouping criteria to the
SELECT statement
Users Guide
To do this
Use this clause
Limit the data that is retrieved from the database
Sort the retrieved data before it is brought into the report
WHERE
Group the retrieved data before it is brought into the
report
Limit the groups specified in the GROUP BY clause
GROUP BY
ORDER BY
HAVING
175
Using SQL Select
Dynamically selecting, sorting, and grouping data
Selection, sorting, and grouping criteria that you define in the SQL Select
painter are added to the SQL statement and processed by the DBMS as part of
the retrieval. You can also define selection, sorting, and grouping criteria that
are created and processed dynamically by InfoMaker after data has been
retrieved from the DBMS.
For more information, see Chapter 9, “Filtering, Sorting, and Grouping
Rows.”
Defining WHERE
criteria
You can limit the rows that are retrieved into the report by specifying selection
criteria that correspond to the WHERE clause in the SELECT statement.
For example, if you are retrieving information about employees, you can limit
the employees to those in Sales and Marketing, or to those in Sales and
Marketing who make more than $50,000.
❖
To define WHERE criteria:
1
Click the Where tab to make the Where view available (or select
View>Where if the Where view is not currently displayed).
Each row in the Where view is a place for entering an expression that
limits the retrieval of rows.
2
Click in the first row under Column to display columns in a drop-down
list, or select Columns from the pop-up menu.
3
Select the column you want to use in the left-hand side of the expression.
The equality (=) operator displays in the Operator column.
Using a function or retrieval argument in the expression
To use a function, select Functions from the pop-up menu and click a listed
function. These are the functions provided by the DBMS.
To use a retrieval argument, select Arguments from the pop-up menu. You
must have defined a retrieval argument already.
4
(Optional) Change the default equality operator.
Enter the operator you want, or click to display a list of operators and
select an operator.
176
InfoMaker
CHAPTER 5
5
6
Defining Reports
Under Value, specify the right-hand side of the expression. You can:
•
Type a value.
•
Paste a column, function, or retrieval argument (if there is one) by
selecting Columns, Functions, or Arguments from the pop-up menu.
•
Paste a value from the database by selecting Value from the pop-up
menu, then selecting a value from the list of values retrieved from the
database. (It may take some time to display values if the column has
many values in the database.)
•
Define a nested SELECT statement by selecting Select from the popup menu. In the Nested Select dialog box, you can define a nested
SELECT statement. Click Return when you have finished.
Continue to define additional WHERE expressions as needed.
For each additional expression, select a logical operator (AND or OR) to
connect the multiple boolean expressions into one expression that
InfoMaker evaluates as true or false to limit the rows that are retrieved.
Defining ORDER BY
criteria
7
Define sorting (Sort view), grouping (Group view), and limiting (Having
view) criteria as appropriate.
8
Click the Return button to return to the Report painter.
You can sort the rows that are retrieved into the report by specifying columns
that correspond to the ORDER BY clause in the SELECT statement.
For example, if you are retrieving information about employees, you can sort
on department, and then within each department, you can sort on employee ID.
❖
To define ORDER BY criteria:
1
Click the Sort tab to make the Sort view available (or select View>Sort if
the Sort view is not currently displayed).
The columns you selected display in the order of selection. You might
need to scroll to see your selections.
2
Drag the first column you want to sort on to the right side of the Sort view.
This specifies the column for the first level of sorting. By default, the
column is sorted in ascending order. To specify descending order, clear the
Ascending check box.
Users Guide
177
Using SQL Select
3
Continue to specify additional columns for sorting in ascending or
descending order as needed.
You can change the sorting order by dragging the selected column names
up or down. With the following sorting specification, rows will be sorted
first by department ID, then by employee ID:
Defining GROUP BY
criteria
4
Define limiting (Where view), grouping (Group view), and limiting
groups (Having view) criteria as appropriate.
5
Click the SQL Select button to return to the Report painter.
You can group the retrieved rows by specifying groups that correspond to the
GROUP BY clause in the SELECT statement. This grouping happens before the
data is retrieved into the report. Each group is retrieved as one row into the
report.
For example, if in the SELECT statement you group data from the Employee
table by department ID, you will get one row back from the database for every
department represented in the Employee table. You can also specify computed
columns, such as total and average salary, for the grouped data. This is the
corresponding SELECT statement:
SELECT dept_id, sum(salary), avg(salary)
FROM employee
GROUP BY dept_id
If you specify this with the Employee table in the EAS Demo DB, you get five
rows back, one for each department.
For more about GROUP BY, see your DBMS documentation.
178
InfoMaker
CHAPTER 5
❖
Defining Reports
To define GROUP BY criteria:
1
Click the Group tab to make the Group view available (or select
View>Group if the Group view is not currently displayed).
The columns in the tables you selected display in the left side of the Group
view. You might need to scroll to see your selections.
2
Drag the first column you want to group onto the right side of the Group
view.
This specifies the column for grouping. Columns are grouped in the order
in which they are displayed in the right side of the Group view.
3
Continue to specify additional columns for grouping within the first
grouping column as needed.
To change the grouping order, drag the column names in the right side to
the positions you want.
Defining HAVING
criteria
4
Define sorting (Sort view), limiting (Where view), and limiting groups
(Having view) criteria as appropriate.
5
Click the Return button to return to the Report painter.
If you have defined groups, you can define HAVING criteria to restrict the
retrieved groups. For example, if you group employees by department, you can
restrict the retrieved groups to departments whose employees have an average
salary of less than $50,000. This corresponds to:
SELECT dept_id, sum(salary), avg(salary)
FROM employee
GROUP BY dept_id
HAVING avg(salary) < 50000
If you specify this with the Employee table in the EAS Demo DB, you will get
three rows back, because there are three departments that have average salaries
less than $50,000.
Users Guide
179
Using Query
❖
To define HAVING criteria:
•
Click the Having tab to make the Having view available (or select
View>Having if the Having view is not currently displayed).
Each row in the Having view is a place for entering an expression that
limits which groups are retrieved. For information on how to define
criteria in the Having view, see the procedure in “Defining WHERE
criteria” on page 176.
Using Query
When you choose Query as the data source, you select a predefined SQL
SELECT statement (a query) as specifying the data for your report.
❖
To define the data using Query:
1
While using any of the report wizards, click Query in the Choose Data
Source dialog box, and click Next.
The Select Query dialog box displays.
2
Type the name of a query or use the Browse button to find the query, then
click Next.
3
Finish interacting with the report wizard as needed for the presentation
style you are using.
To learn how to create queries, see “Defining queries” on page 188.
Using External
If the data for the report does not come from a database (either through a native
Sybase database interface or through a standard database interface), specify
External as the data source. You then specify the data columns and their types
so InfoMaker can build the appropriate report to hold the data. These columns
make up the result set. InfoMaker places the columns you specified in the result
set in the report.
180
InfoMaker
CHAPTER 5
Defining Reports
Using ODBC drivers instead of External
If you have an ODBC dBASE driver and an ODBC text driver on your
computer and you configure ODBC data sources for them, you can access data
that resides in a dBASE file or a tab-separated text file. To configure data
sources, use the ODBC Administrator, a Windows utility that is accessible
from within the Utilities folder in the Database painter.
Accessing data by means of the ODBC drivers is easier than using External as
your data source, because External requires you to specify your data as a result
set. In other words, to use External you have to know your data.
For information on ODBC drivers, see Connecting to Your Database.
❖
To define the data using External:
1
Click External in the Choose Data Source dialog box in the wizard and
click Next.
The Define Result Set dialog box displays for you to specify the first
column in the result set.
2
Enter the name and type of the column.
Available datatypes are listed in the drop-down list. The number datatype
is equivalent to the InfoMaker double datatype.
3
Click Add to enter the name and type of any additional columns you want
in the result set.
4
Click Next when you have added all the columns you want.
Now you must import the data values from the file into the report. This is
similar to retrieving data from the database.
❖
To import the data values from an external file:
1
Make sure the Preview view of the report is selected.
2
Select Rows>Import from the menu bar.
The Select Import File dialog box displays.
Users Guide
3
Select the type of files to list from the List Files of Type drop-down list (an
XML, CSV, TXT, or DBF file).
4
Enter the name of the import file and click OK.
181
Using Stored Procedure
Alternatively, you can select the name from the file list. Use the Drives
drop-down list and the Directories box as needed to display the list of files
that includes the one you want.
Using Stored Procedure
A stored procedure is a set of precompiled and preoptimized SQL statements
that performs some database operation. Stored procedures reside where the
database resides, and you can access them as needed.
Defining data using a
stored procedure
You can specify a stored procedure as the data source for a report if your
DBMS supports stored procedures.
For information on support for stored procedures, see your database
documentation.
If the Stored Procedure icon is not displayed
The icon for the Stored Procedure data source displays in the Choose Data
Source dialog box in the report wizards only if the database to which you are
connected supports stored procedures.
❖
To define the data using Stored Procedure:
1
Select Stored Procedure in the Choose Data Source dialog box in the
wizard and click Next.
The Select Stored Procedure dialog box displays a list of the stored
procedures in the current database.
2
Select a stored procedure from the list.
To list system procedures, select the System Procedure check box.
The syntax of the selected stored procedure displays below the list of
stored procedures.
3
Specify how you want the result set description built:
•
To build the result set description automatically, clear the Manual
Result Set check box and click Next.
InfoMaker executes the stored procedure and builds the result set
description for you.
182
InfoMaker
CHAPTER 5
•
Defining Reports
To define the result set description manually, select the Manual Result
Set check box and click Next.
In the Define Stored Procedure Result Set dialog box:
•
Enter the name and type of the first column in the result set.
•
To add additional columns, click Add.
Your preference is saved
InfoMaker records your preference for building result set descriptions for
stored procedure reports in the variable Stored_Procedure_Build in the
InfoMaker initialization file. If this variable is set to 1, InfoMaker will
automatically build the result set; if the variable is set to 0, you are
prompted to define the result set description.
4
Continue in the Report wizard as needed for the presentation style you are
using.
When you have finished interacting with the wizard, you go to the Report
painter with the columns specified in the result set placed in the report.
For information about defining retrieval arguments for reports, see
Chapter 6, “Enhancing Reports.”
Editing a result set
description
After you create a result set that uses a stored procedure, you can edit the result
set description from the Report painter.
❖
To edit the result set description:
1
Select Design>Data Source from the menu bar.
This displays the Column Specification view if it is not already displayed.
2
Select Stored Procedure from the Column Specification view’s pop-up
menu.
The Modify Stored Procedure dialog box displays.
3
Edit the Execute statement, select another stored procedure, or add
arguments.
The syntax is:
execute sp_procname;num arg1 = :arg1, arg2 = :arg2..., argn =:argn
where sp_procname is the name of the stored procedure, num is the stored
procedure group suffix, and arg1, arg2, and argn are the stored
procedure’s arguments.
Users Guide
183
Choosing report-wide options
The group suffix is an optional integer used in some DBMSs to group
procedures of the same name so that they can be dropped together with a
single DROP PROCEDURE statement. For other DBMSs the number is
ignored.
4
When you have defined the entire result set, click OK.
You return to the Report painter with the columns specified in the result
set placed in the report.
For information about defining retrieval arguments for reports, see
Chapter 6, “Enhancing Reports.”
Choosing report-wide options
You can set the default options, such as colors and borders, that InfoMaker uses
in creating the initial draft of a report.
Report generation options are for styles that use a layout made up of bands,
which include Freeform, Grid, Label, N-Up, Tabular, Group, TreeView, and
Crosstab. InfoMaker maintains a separate set of options for each of these
styles.
When you first create any of these style reports, you can choose options in the
wizard and save your choices as the future defaults for the style.
❖
To specify default colors and borders for a style:
1
Select Design>Options from the menu bar.
The Report Options dialog box displays.
2
Select the Generation tab page if it is not on top.
3
Select the presentation style you want from the Presentation Style dropdown list.
The values for properties shown on the page are for the currently selected
presentation style.
4
184
Change one or more of the following properties:
Property
Background color
Meaning for the report
The default color for the background.
Text border and color
The default border and color used for labels and
headings.
InfoMaker
CHAPTER 5
Defining Reports
Property
Meaning for the report
Column border and color
Wrap Height (Freeform
only)
The default border and color used for data values.
The height of the detail band.
When the value is None, the number of columns
selected determines the height of the detail band.
The columns display in a single vertical line.
When the value is set to a number, the detail band
height is set to the number specified and columns
wrap within the detail band.
5
Click OK.
About color selections
If you select Window Background, Application Workspace, Button Face, or
Window Text from the Color drop-down list, the report uses the colors
specified in the Windows Control Panel on the computer on which the report
is running.
Your choices are
saved
InfoMaker saves your generation option choices as the defaults to use when
creating a report with the same presentation style.
Generating and saving a report
When you have finished interacting with the wizard, InfoMaker generates the
report and opens the Report painter.
When generating the report, InfoMaker might use information from a set of
tables called the extended attribute system tables. If this information is
available, InfoMaker uses it.
About the extended attribute system tables and reports
The extended attribute system tables are a set of tables maintained by the
Database painter. They contain information about database tables and
columns. Extended attribute information extends database definitions by
recording information that is relevant to using database data in screens and
reports.
Users Guide
185
Generating and saving a report
Extended attribute information applies to forms, too
InfoMaker uses extended attribute information when generating a form the
same way it uses it when generating a report.
For example, labels and headings you defined for columns in the Database
painter are used in the generated report. Similarly, if you associated an edit
style with a column in the Database painter, that edit style is automatically used
for the column in the report.
When generating a report, InfoMaker uses the following information from the
extended attribute system tables:
For
InfoMaker uses
Tables
Columns
Fonts specified for labels, headings, and data
Text specified for labels and headings
Display formats
Column widths, heights, and justifications
Edit styles
If there is no extended attribute information for the database tables and
columns you are using, you can set the text for headings and labels, the fonts,
and the display formats in the Report painter. The difference is that you have
to do this individually for every report that you create using the data.
If you want to change something that came from the extended attribute system
tables, you can change it in the Report painter. The changes you make in the
Report painter apply only to the report you are working on.
The advantage of using the extended attribute system tables is that it saves time
and ensures consistency. You only have to specify the information once, in the
database. Since InfoMaker uses the information whenever anyone creates a
new report with the data, it is more likely that the appearance and labels of data
items will be consistent.
If you have installed InfoMaker without the Database painter
You cannot create extended attribute information if you have installed
InfoMaker without the Database painter. An InfoMaker user with the Database
painter or a PowerBuilder user can add extended attribute information to the
database for you, or you can change the extended attributes individually in each
report.
186
InfoMaker
CHAPTER 5
Defining Reports
For more information about the extended attribute system tables, see Chapter
3, “Managing the Database,” and Appendix B, “The Extended Attribute
System Tables.”
Saving the report
When you have created a report, you should save it. The first time you save it
you give it a name. As you work, you should save your report frequently so that
you do not lose changes.
❖
To save the report:
1
Select File>Save from the menu bar.
If you have previously saved the report, InfoMaker saves the new version
in the same library and returns you to the Report painter.
If you have not previously saved the report, InfoMaker displays the Save
Report dialog box.
2
(Optional) Enter comments in the Comments box to describe the report.
3
Enter a name for the report in the Reports box and click OK.
Naming the report
The report name can be any valid InfoMaker identifier up to 255 contiguous
characters. A common convention is to prefix the name of the report with d_.
For information about InfoMaker identifiers, see Appendix A, “Identifiers.”
Modifying an existing report
❖
To modify an existing report:
1
Select File>Open from the menu bar.
The Open dialog box displays.
2
Select the object type and the library.
InfoMaker lists the reports in the current library.
Users Guide
187
Defining queries
3
Select the object you want.
InfoMaker opens the Report painter and displays the report. You can also
open a report by double-clicking it in the System Tree, or, if it has been
placed in a window or visual user object, selecting Modify DataWindow
from the control’s pop-up menu.
To learn how you can modify an existing report, see Chapter 6,
“Enhancing Reports.”
Defining queries
A query is a SQL SELECT statement created in the Query painter and saved
with a name so that it can be used repeatedly as the data source for a report.
Queries save time, because you specify all the data requirements just once. For
example, you can specify the columns, which rows to retrieve, and the sorting
order in a query. Whenever you want to create a report using that data, simply
specify the query as the data source.
❖
To define a query:
1
Select File>New from the menu bar.
2
In the New dialog box, select the Database tab.
3
Select the Query icon and click OK.
4
Select tables in the Select Tables dialog box and click Open.
You can select columns, define sorting and grouping criteria, define
computed columns, and so on, exactly as you do when creating a report
using the SQL Select data source.
For more about defining the SELECT statement, see “Using SQL Select” on
page 165.
Previewing the query
While creating a query, you can preview it to make sure it is retrieving the
correct rows and columns.
❖
To preview a query:
1
188
Select Design>Preview from the menu bar.
InfoMaker
CHAPTER 5
Defining Reports
InfoMaker retrieves the rows satisfying the currently defined query in a
grid-style report.
2
Manipulate the retrieved data as you do in the Database painter in the
Output view.
You can sort and filter the data, but you cannot insert or delete a row or
apply changes to the database. For more about manipulating data, see
Chapter 3, “Managing the Database.”
3
When you have finished previewing the query, click the Close button in
the PainterBar to return to the Query painter.
Saving the query
❖
To save a query:
1
Select File>Save Query from the menu bar.
If you have previously saved the query, InfoMaker saves the new version
and returns you to the Query painter. If you have not previously saved the
query, InfoMaker displays the Save Query dialog box.
2
Enter a name for the query in the Queries box (see “Naming the query”
next).
3
(Optional) Enter comments to describe the query, and click OK.
These comments display in the Library painter. It is a good idea to use
comments to remind yourself and others of the purpose of the query.
Naming the query
Users Guide
The query name can be any valid InfoMaker identifier up to 255 characters.
When you name queries, use a unique name to identify each one. A common
convention is to use a two-part name: a standard prefix that identifies the object
as a query (such as q_) and a unique suffix. For example, you might name a
query that displays employee data q_emp_data. For information about
InfoMaker identifiers, see Appendix A, “Identifiers.”
189
What's next
Modifying a query
❖
To modify a query:
1
Select File>Open from the menu bar.
2
Select the Queries object type and then the query you want to modify, and
click OK.
3
Modify the query as needed.
What's next
After you have generated your report, you will probably want to preview it to
see how it looks. After that, you might want to enhance the report in the Report
painter before using it. InfoMaker provides many ways for you to make a
report easier to use and more informative. See Chapter 6, “Enhancing
Reports,” next.
190
InfoMaker
CH A PTE R
About this chapter
Contents
Related topics
6
Enhancing Reports
After InfoMaker generates a basic report, you can further enhance its
appearance and content. You do that in the Report painter. This chapter
describes basic enhancements you can make to a report.
Topic
Working in the Report painter
Page
192
Using the Preview view of a report
Saving data in an external file
200
208
Modifying general report properties
Storing data in a report using the Data view
216
230
Retrieving data
232
Other ways to enhance reports are covered in later chapters:
Chapter
Explains how to
Chapter 7, “Working with Controls
in Reports”
Add controls to a report and reorganize,
position, and rotate them
Chapter 19, “Controlling Updates
in Forms”
Chapter 8, “Displaying and
Validating Data”
Chapter 9, “Filtering, Sorting, and
Grouping Rows”
Control update capabilities
Chapter 10, “Highlighting
Information in Reports and Forms”
Chapter 11, “Using Nested
Reports”
Chapter 13, “Working with Graphs”
Users Guide
Specify display formats, edit styles, and
validation rules for column data
Limit which rows are displayed, the
order in which they are displayed, and
whether they are divided into groups
Highlight data by using conditional
expressions to modify the properties of
controls in reports
Place reports inside reports
Use graphs to visually present
information retrieved in a report
191
Working in the Report painter
Chapter
Explains how to
Chapter 14, “Working with
Crosstabs”
Use crosstabs to present analyses of data
retrieved in a report
Chapter 15, “Working with
TreeViews”
Use TreeViews to group data and display
it hierarchically in a way that allows you
to expand and collapse it
Working in the Report painter
The Report painter provides views related to the report you are working on.
Interacting with these views is how you work in the Report painter.
The following picture shows a report in the Report painter with the default
layout.
Design view
192
The Design view at the top left shows a representation of the report and its
controls. You use this view to design the layout and appearance of the report.
Changes you make are immediately shown in the Preview view and the
Properties view.
InfoMaker
CHAPTER 6
Enhancing Reports
Preview view
The Preview view in the middle on the left shows the report with data as it will
appear at runtime. If the Print Preview toggle (File>Print Preview) is selected,
you see the report as it would appear when printed with an optional blue outline
that shows where the page margins are located.
Export/Import
Template view
for XML
The Export/Import Template view for XML at the bottom left shows a default
template for exporting and importing data in XML format. You can define
custom templates for import and export. The templates are saved with the
report. For more information, see Chapter 12, “Exporting and Importing XML
Data.”
Export Template view
for XHTML
The Export/Import Template view for XHTML is designed for use with the
Web DataWindow feature in PowerBuilder. This view, and the Web Generation
and JavaScript Generation tab pages in the Properties view, are not used in
InfoMaker.
Properties view
The Properties view at the top right displays the properties for the currently
selected control(s) in the report, for the currently selected band in the report, or
for the report itself. You can view and change the values of properties in this
view.
Control List view
The Control List in the stacked pane at the bottom right view lists all controls
in the report. Selecting controls in this view selects them in the Design view
and the Properties view. You can also sort controls by Control Name, Type, or
Tag.
Data view
The Data view in the stacked pane at the bottom right displays the data that can
be used to populate a report and allows manipulation of that data.
Column Specifications
view
The Column Specifications view in the stacked pane at the bottom right shows
a list of the columns in the data source. For the columns, you can add, modify,
and delete initial values, validation expressions, and validation messages. You
can also specify that you want a column to be included in a prompt for retrieval
criteria during data retrieval. To add a column to the report, you can drag and
drop the column from the Column Specifications view to the Design view. For
external or stored procedure data sources, you can add, delete, and edit
columns (column name, type, and length).
Users Guide
193
Working in the Report painter
Understanding the Report painter Design view
For most presentation styles, the Report painter Design view is divided into
areas called bands. Each band corresponds to a section of the displayed report.
reports with these presentation styles are divided into four bands: header,
detail, summary, and footer. Each band is identified by a bar containing the
name of the band above the bar and an Arrow pointing to the band.
These bands can contain any information you want, including text, drawing
controls, graphs, and computed fields containing aggregate totals.
The following picture shows the Design view for a tabular report.
Table 6-1: Bands in the Report painter Design view
Band
Header
Detail
Used to display
Information at the top of every screen or page, such as the name of the
report or current date
Data from the database or other data source
Summary
Summary information that displays after all the data, such as totals and
counts
Footer
Information displayed at the bottom of every page or screen, such as
page number and page count
The header band
The header band contains heading information that is displayed at the top of
every screen or page. The presentation style determines the contents of the
header band:
194
•
If the presentation style is Tabular, Grid, or N-Up, the headings defined for
the columns in the Database painter display in the header band and the
columns display on a single line across the detail band
•
If the presentation style is Freeform, the header band is empty and labels
display in the detail band next to each column
InfoMaker
CHAPTER 6
Enhancing Reports
You can specify additional heading information (such as a date) in the header
band and you can include pictures, graphic controls, and color to enhance the
appearance of the band.
Displaying the current date
To include the current date in the header, you place a computed field that uses
the Today InfoMaker expression function in the header band. For information,
see “Adding computed fields to a report” on page 239.
The detail band
The detail band displays the retrieved data. The number of rows of data that
display in the report at one time is determined by the following expression:
(Height of the report – Height of headers and footers) /
Height of the detail band
The presentation style determines the contents of the detail band:
•
If the presentation style is Tabular, Grid, N-Up, or Label, the detail band
displays column names, representing the columns
•
If the presentation style is Freeform, the labels defined for the columns in
the Database painter display in the detail band with boxes for the data to
the right
How InfoMaker names the columns in the Design view
If the report uses one table, the names of the columns in the Design view are
the same as the names in the table.
If the report uses more than one table, the names of the columns in the Design
view are tablename_columnname. InfoMaker prefaces the name of the column
with the table name to prevent ambiguity, since different tables can have
columns with the same name.
When you design the detail band of a report, you can specify display
information for each column of the report and add other controls, such as text,
pictures, graphs, and drawing controls.
Users Guide
195
Working in the Report painter
The summary and footer bands
You use the summary and footer bands of the report the same way you use
summary pages and page footers in a printed report:
•
The contents of the summary band display at the end, after all the detail
rows; this band often summarizes information in the report
•
The contents of the footer band display at the bottom of each screen or
page of the report; this band often displays the page number and name of
the report
Using the Report painter toolbars
The Report painter contains three customizable PainterBars and a StyleBar.
For more information about using toolbars, see “Using toolbars” on page 29.
PainterBars
The PainterBars include buttons for standard operations (such as Save, Print,
and Undo on PainterBar1), for common formatting operations (such as
Currency, Percent, and Tab Order on PainterBar2), and for database operations
(such as Retrieve and Insert Row on PainterBar3).
They also include six drop-down toolbars, which are indicated by a small black
triangle on the right part of a button. Table 6-2 lists the drop-down toolbars that
are available. The Controls toolbar is on PainterBar1. The other drop-down
toolbars are on PainterBar2.
Table 6-2: Drop-down toolbars in the Report painter
StyleBar
196
Toolbar
Background Color
Used to
Specify the background color of one or more selected controls.
Borders
Controls
Specify borders for one or more selected controls.
Specify controls to add to a report.
Foreground Color
Specify the foreground color of one or more selected controls.
In a text control, the foreground color specifies the color of the
text.
Layout
Slide
Specify the alignment, sizing, and spacing of selected controls.
Specify sliding for controls.
The StyleBar includes buttons for applying properties (such as bold) to selected
text elements.
InfoMaker
CHAPTER 6
Enhancing Reports
Using the Properties view in the Report painter
Each part of the report (such as text, columns, computed fields, bands, graphs,
even the report itself) has a set of properties appropriate to the part. The
properties display in the Properties view.
You can use the Properties view to modify the parts of the report.
❖
To use the Properties view to modify the parts of the report:
1
Position the mouse over the part you want to modify.
2
Display the part’s pop-up menu and select Properties.
If it is not already displayed, the Properties view displays. The view
displays the properties of the currently selected control(s), the band, or the
report itself. The contents of the Properties view change as different
controls are selected (made current).
For example, the Properties view for a column has tabbed property pages of
information that you access by clicking the appropriate tab. If you want to
choose an edit style for the column, you click the Edit tab. This brings the Edit
page to the front of the Properties view.
Selecting controls in the Report painter
The Report painter provides several ways to select controls to act on. You can
select multiple controls and act on all the selected controls as a unit. For
example, you can move all of them or change the fonts used to display text for
all of them.
Lasso selection
Use lasso selection when possible because it is fast and easy. Lasso selection is
another name for the method described below for selecting neighboring
multiple controls.
❖
To select one control in a report in the Design view:
•
Click it.
The control displays with handles on it. Previously selected controls are no
longer selected.
Users Guide
197
Working in the Report painter
❖
To select neighboring multiple controls in a report in the Design view
(lasso selection):
1
Press and hold the left mouse button at one corner of the neighboring
controls.
2
Drag the mouse over the controls you want to select.
A bounding box (the lasso) displays.
3
Release the mouse button.
All the controls in the bounding box are selected.
❖
To select non-neighboring multiple controls in a report in the Design
view:
1
Click the first control.
2
Press and hold the Ctrl key and click additional controls.
All the controls you click are selected.
❖
To select controls by type in the report:
•
❖
198
•
Select Edit>Select>Select All to select all controls
•
Select Edit>Select>Select Text to select all text
•
Select Edit>Select>Select Columns to select all columns
To select controls by position in the report:
•
❖
Do one of the following:
Do one of the following:
•
Select Edit>Select>Select Above to select all controls above the
currently selected control
•
Select Edit>Select>Select Below to select all controls below it
•
Select Edit>Select>Select Left to select all controls to the left of it
•
Select Edit>Select>Select Right to select all controls to the right of it
To select controls in a report in the Control List view:
1
Select View>Control List from the menu bar.
2
Click a control in the list.
3
Press and hold the Ctrl key and click additional controls if desired.
InfoMaker
CHAPTER 6
Displaying information
about the selected
control
Enhancing Reports
The name, x and y coordinates, width, and height of the selected control are
displayed in the MicroHelp bar. If multiple controls are selected, Group
Selected displays in the Name area and the coordinates and size do not display.
Resizing bands in the Report painter Design view
You can change the size of any band in the report.
❖
To resize a band in the Report painter Design view:
•
Position the pointer on the bar representing the band and drag the bar up
or down to shrink or enlarge the band.
Using zoom in the Report painter
You can zoom the display in and out in four views in the Report painter: the
Design view, Preview view, Data View, and Column Specifications view. For
example, if you are working with a large report, you can zoom out the Design
view so you can see all of it on your screen, or you can zoom in on a group of
controls to better see their details.
❖
To zoom the display in the Report painter:
1
Select the view you want to zoom (click in the view).
You can zoom the Design view, Preview view, Data View, and Column
Specifications view.
2
Select Design>Zoom from the menu bar.
3
Select a built-in zoom percentage, or set a custom zoom percentage by
typing an integer in the Custom box.
Undoing changes in the Report painter
You can undo your change by pressing Ctrl+Z or selecting Edit>Undo from the
menu bar. Undo requests affect all views.
Users Guide
199
Using the Preview view of a report
Using the Preview view of a report
You use the Preview view of a report to view it as it will appear with data and
test the processing that takes place in it.
❖
To display the Preview view of a report open in the Report painter:
1
If the Preview view is not already displayed, select View>Preview from
the menu bar.
In the Preview view, the bars that indicate the bands do not display, and, if
you selected Retrieve on Preview in the report wizard, InfoMaker retrieves
all the rows from the database. You are prompted to supply arguments if
you defined retrieval arguments.
In external reports
If the report uses the External data source, no data is retrieved. You can
import data, as described in “Importing data into a report” on page 203.
In reports that have stored data
If the report has stored data in it, no data is retrieved from the database.
As the rows are being retrieved, the Retrieve button in the PainterBar
changes to a Cancel button. You can click the Cancel button to stop the
retrieval.
2
Select File>Print Preview from the menu bar and evaluate your report.
For example, scroll the page and page down to new pages to review the
layout and content of the report.
Retrieving data
Where InfoMaker gets
data
200
InfoMaker follows this order of precedence to supply the data in your report:
1
If you have saved data in the report, InfoMaker uses the saved rows from
the report and does not retrieve data from the database.
2
InfoMaker uses the data in the cache, if there is any.
3
If there is no data in the cache yet, InfoMaker retrieves data from the
database automatically, with one exception. If the Retrieve on Preview
option is off, you have to request retrieval explicitly, as described next.
InfoMaker
CHAPTER 6
Previewing without
retrieving data
Enhancing Reports
If you do not want InfoMaker to retrieve data from the database automatically
when the Preview view opens, you can clear the Retrieve on Preview option.
The Preview view shows the report without retrieving data.
❖
To be able to preview without retrieving data automatically:
1
Select Design>Options from the menu bar.
The Report Options dialog box displays.
2
Clear the Retrieve on Preview check box on the General page.
When this check box is cleared, your request to preview the report does
not result in automatic data retrieval from the database.
Retrieve on Preview check box is available in the Report wizards
During the initial creation of a report, you can set the Retrieve on Preview
option.
InfoMaker uses data
caching
When InfoMaker first retrieves data, it stores the data internally. When it
refreshes the Preview view, InfoMaker displays the stored data instead of
retrieving rows from the database again. This can save you a lot of time, since
data retrieval can be time consuming.
How using data from
the cache affects you
Because InfoMaker accesses the cache and does not automatically retrieve data
every time you preview, you might not have what you want when you preview.
The data you see in preview and the data in the database can be out of sync.
For example, if you are working with live data that changes frequently or with
statistics based on changing data and you spend time designing the report, the
data you are looking at may no longer match the database. In this case, retrieve
again just before printing.
Explicitly retrieving
data
You can explicitly request retrieval at any time.
❖
To retrieve rows from the database:
•
Users Guide
Do one of the following:
•
Click the Retrieve button in the PainterBar.
•
Select Rows>Retrieve from the menu bar.
•
Select Retrieve from the Preview view’s pop-up menu.
201
Using the Preview view of a report
Supplying argument values or criteria
If the report has retrieval arguments or is set up to prompt for criteria, you
are prompted to supply values for the arguments or to specify criteria.
InfoMaker retrieves the rows. As InfoMaker retrieves, the Retrieve button
changes to a Cancel button. You can click the Cancel button to stop the
retrieval at any time.
Sharing data with the
Data view
The Data view displays data that can be used to populate a report. When the
ShareData pop-up menu item in the Data view is checked, changes you make
in the Data view are reflected in the Preview view and vice versa.
Other options that
affect retrieval
These other options can affect retrieval:
•
Query Governor Lets you (or a database administrator) set certain
restrictions on data retrieval. For example, the Query Governor can limit
the number of rows that are retrieved.
For information, see “Using the Query Governor” on page 50.
•
Lets you specify that only the rows needed
to display the current portion of the report should be retrieved. When you
scroll downward, additional rows are retrieved. This can speed up
reporting in certain situations.
Retrieve Rows As Needed
See “Retrieving rows as needed” on page 233.
•
Retrieve Rows to Disk Lets you specify that InfoMaker should save
retrieved data on your hard disk in a temporary file rather than keep the
data in memory. When you preview the report, InfoMaker swaps rows of
data from the temporary file into memory as needed.
For information, see “Saving retrieved rows to disk” on page 234.
Modifying data
You can add, modify, or delete rows in the Preview view. When you have
finished manipulating the data, you can apply the changes to the database.
If looking at data from a view or from more than one table
By default, you cannot update data in a report that contains a view or more than
one table. For more about updating forms, see Chapter 19, “Controlling
Updates in Forms.”
202
InfoMaker
CHAPTER 6
❖
Enhancing Reports
To modify existing data:
•
Tab to the field and enter a new value.
The Preview view uses validation rules, display formats, and edit styles
that you have defined for the columns, either in the Database painter or in
this particular report.
To save the changes to the database, you must apply them, as described next.
❖
To add a row:
1
Click the Insert Row button.
InfoMaker creates a blank row.
2
Enter data for a row.
To save the changes to the database, you must apply them, as described below.
❖
To delete a row:
•
Click the Delete Row button.
InfoMaker removes the row from the display.
To save the changes to the database, you must apply them, as described below.
❖
To apply changes to the database:
•
Click the Update Database button.
InfoMaker updates the table with all the changes you have made.
Importing data into a report
You can import and display data from an external source and view the data or
save the data in an external format.
Importing is not available in a report packaged in an executable file
When you create an InfoMaker application (which is an executable file), you
can include reports. When you run a report from the executable file, you cannot
import data.
Users Guide
203
Using the Preview view of a report
❖
To import data into a report:
1
Select Rows>Import from the menu bar.
2
Specify the file from which you want to import the data.
The types of files that you can import into the painter display in the List
Files of Type drop-down list.
3
Click Open.
InfoMaker reads the data from the file into the Report painter. You can
view the data and save the data in an external file.
Data from file must match report definition
When importing data from a file, the datatypes of the data must match, column
for column, all the columns in the report definition (the columns specified in
the SELECT statement), not just the columns that are displayed in the report.
For information about importing XML data, see Chapter 12, “Exporting and
Importing XML Data.”
Using print preview
You can print the data displayed in the Preview view. Before printing, you can
preview the output on the screen. Your computer must have a default printer
specified, otherwise properties handled by the printer driver, such as page
orientation, are ignored.
❖
To preview printed output before printing:
•
Be sure the Preview view is selected (current) and then select File>Print
Preview from the menu bar.
Print Preview displays the report as it will print.
Using the IntelliMouse pointing device
Using the IntelliMouse pointing device, you can scroll a report by rotating the
wheel. You can also zoom a report larger or smaller by holding down the Ctrl
key while rotating the wheel.
204
InfoMaker
CHAPTER 6
Controlling the display
of rulers
Enhancing Reports
You can choose whether to display rulers around page borders.
❖
To control the display of rulers in Print Preview:
•
Changing margins
Select/deselect File>Print Preview Rulers from the menu bar.
You can dynamically change margins while previewing a report.
❖
To change the margins in Print Preview:
•
Drag the margin boundaries on the rulers.
The following picture shows the left and top margin boundaries. There are also
boundaries for the right and bottom margins. The picture shows the outline of
the margin. If you do not want to see the outline, clear the Print Preview Shows
Outline check box on the Print Specifications page in the Properties view.
Zooming the page
You can reduce or enlarge the amount of the page that displays in the Print
Preview view. This does not affect the printed output.
❖
To zoom the page on the display screen:
1
Select File>Print Preview Zoom from the menu bar.
2
Select the magnification you want and click OK.
The display of the page zooms in or out as appropriate. The size of the
contents of the page changes proportionately as you zoom. This type of
zooming affects your display but does not affect printing.
Zooming the contents
In addition to zooming the display on the screen, you can also zoom the
contents, affecting the amount of material that prints on a page.
❖
To zoom the contents of a report with respect to the printed page:
1
Select Design>Zoom from the menu bar.
2
Select the magnification you want and click OK.
The contents of the page zooms in or out as appropriate. If you enlarge the
contents so they no longer fit, InfoMaker creates additional pages as
needed.
Users Guide
205
Using the Preview view of a report
Printing data
You can print a report while the Preview view is displayed. You can print all
pages, a range of pages, only the current page, or only odd or even pages. You
can also specify whether you want multiple copies, collated copies, and
printing to a file.
Avoiding large rows
To avoid multiple blank pages and other anomalies in printed reports, no row
in the report should be larger than the size of the target page. The page
boundary is often reached in long text columns with AutoSizeHeight on. It can
also be reached when detail rows are combined with page and group headers
and trailers, or when they contain multiple nested reports or a column that has
been resized to be larger than the page.
When a row contains large multiline edit columns, it can be broken into a series
of rows, each containing one text line. These text lines become the source for
a nested report. The nested report determines how many of its rows fit in the
remaining page space.
Page break before
last row
The summary band in a report is always printed on the same page as the last
row of data. This means that you sometimes find a page break before the last
row of data even if there is sufficient space to print the row. If you want the last
row to print on the same page as the preceding rows, the summary band must
be made small enough to fit on the page as well.
To change printers or
settings before
printing
You can choose File>Printer Setup from the menu bar.
❖
To print a report:
1
Select File>PrintReport from the menu bar to display the Print dialog box.
2
Specify the number of copies to print.
3
Specify the pages: select All or Current Page, or type page numbers and/or
page ranges in the Pages box.
4
Specify all pages, even pages, or odd pages in the Print drop-down list.
5
If you want to print to a file rather than to the printer, select the Print to
File check box.
6
If you want to change the collating option, clear or select the Collate
Copies check box and click OK.
If you specified print to file, the Print to File dialog box displays.
7
206
Enter a file name and click OK.
InfoMaker
CHAPTER 6
Enhancing Reports
The extension PRN indicates that the file is prepared for the printer.
Change the drive, the directory, or both, if you want.
Working in a grid report
If you are viewing a grid-style report in the Preview view, you can make the
following changes. Whatever you do in the Preview view is reflected in the
Design view:
❖
•
Resize columns
•
Reorder columns
•
Copy data to the clipboard
To resize a column in a grid report:
1
Position the mouse pointer at a column boundary in the header.
The pointer changes to a two-headed arrow.
❖
2
Press and hold the left mouse button and drag the mouse to move the
boundary.
3
Release the mouse button when the column is the correct width.
To reorder columns in a grid report:
1
Press and hold the left mouse button on a column heading.
InfoMaker selects the column and displays a line representing the column
border:
❖
2
Drag the mouse left or right to move the column.
3
Release the mouse button.
To copy data to the clipboard from a grid report:
1
Users Guide
Select the cells whose data you want to copy to the clipboard:
•
To select an entire column, click its header.
•
To select neighboring columns, press and hold Shift, then click the
headers.
207
Saving data in an external file
•
To select non-neighboring columns, press and hold Ctrl, then click the
headers.
•
To select cells, press the left mouse button on the bottom border of a
cell and drag the mouse.
Selected cells are highlighted.
2
Select Edit>Copy from the menu bar.
The contents of the selected cells are copied to the clipboard. If you copied
the contents of more than one column, the data is separated by tabs.
Saving data in an external file
While previewing, you can save the data retrieved in an external file. Note that
the data and headers (if specified) are saved. Information in the footer or
summary bands is not saved unless you are saving as PDF or as a PSR file.
❖
To save the data in a report in an external file:
1
Select File>Save Rows As from the menu bar.
The Save As dialog box displays.
2
Choose a format for the file from the Save As Type drop-down list.
If you want the column headers saved in the file, select a file format that
includes headers (such as Excel With Headers). When you select a with
headers format, the names of the database columns (not the column labels)
are also saved in the file.
When you choose a format, InfoMaker supplies the appropriate file
extension.
3
For TEXT, CSV, SQL, HTML, and DIF formats, select an encoding for the
file.
You can select ANSI/DBCS, Unicode LE (Little-Endian), Unicode BE
(Big-Endian), or UTF8.
4
Name the file and click Save.
InfoMaker saves all displayed rows in the file; all columns in the displayed
rows are saved. Filtered rows are not saved.
208
InfoMaker
CHAPTER 6
Enhancing Reports
The rest of this section provides more information about saving data in PDF,
HTML, and PSR formats.
For more information about saving data as XML, see Chapter 12, “Exporting
and Importing XML Data.”
Saving the data as PDF
InfoMaker provides two ways to save a report or DataStore in Portable
Document Format (PDF).
Using Ghostscript
By default, when you select File>Save Rows As and select PDF as the file type,
the data is printed to a PostScript file and automatically distilled to PDF using
Ghostscript. This option provides a robust solution that can save most types of
reports.
Installing Ghostscript and PostScript drivers
For licensing reasons, Ghostscript and the PostScript drivers required to use the
distill method are not installed with InfoMaker. You (and your users) must
download and install them before you can use this technique. See “System
requirements for the distill method” on page 210.
Using XSL-FO and
Java printing
Building on the ability to save data as XML, InfoMaker can also save the
report’s data and presentation to PDF by generating XSL Formatting Objects
(XSL-FO). This option provides a platform-independent solution by rendering
the report using a Java process rather than the Microsoft GDI. It also offers the
possibility of customizing the PDF file at the XSL-FO stage.
The XSL (Extensible Stylesheet Language) W3C Recommendation has two
parts, XSLT and XSL-FO. XSLT provides the transformation typically used to
present XML documents as HTML in a browser. XSL-FO provides extensive
formatting capabilities that are not dependent on the output format.
For more information about XSL, see the latest version of the Extensible
Stylesheet Language (XSL) at http://www.w3.org/TR/xsl/.
Limitations
Users Guide
The Ghostscript method currently does not support OLE and RichText reports.
The XSL-FO method currently does not support OLE, RichText, graph, and
composite reports.
209
Saving data in an external file
Saving as PDF using the distill method
If you want to save to PDF using the distill method, you do not need to change
any properties. The distill method is used by default when you select Save
Rows As from the File menu in the Report painter and select PDF as the file
type, or when you use the SaveAs method with PDF! as the file type.
InfoMaker uses a PostScript printer driver specifically designed for distilling
purposes to configure the PDF output. You can choose to use a different
PostScript printer driver if you want to customize your PostScript settings for
generating PDF.
In the Report painter
To use a custom PostScript printer driver, you must set some properties.
❖
System requirements
for the distill method
To save customized distilled PDF output in the Report painter:
1
Select the Data Export tab in the Properties view for the report.
2
Select PDF from the Format to Configure drop-down list, select Distill!
from the Method drop-down list, and select the Distill Custom PostScript
check box.
3
Select the Print Specifications tab and specify the name of the printer
whose settings you want to use in the Printer Name box.
4
Save the report, then select File>Save Rows As, select PDF as the Save As
Type, specify a file name, and click Save.
Users must have administrative privileges to create a PDF file.
To support saving as PDF using Ghostscript, you must download and install
Ghostscript files on your system as described in “Using the Ghostscript
distiller” on page 607. You also need to install PostScript driver files.
If you have installed a PostScript printer on your computer, the PostScript
driver files required to create PDF files, PSCRIPT5.DLL, PS5UI.DLL, and
pscript.ntf, are already installed, typically in
C:\WINDOWS\system32\spool\drivers\w32x86 on Windows XP or
C:\Windows\System32\DriverStore\FileRepository\ntprint.inf_1a216484\Amd
64 on a 64-bit Vista system. You must use the version of these files that is
appropriate to the operating system where the PDF file is created. You should
copy the files to the Sybase\Shared\PowerBuilder\drivers directory.
If you have never installed a PostScript printer, use the Printers and Faxes
option in the Windows control panel to install a generic PostScript printer. If
the Pscript5.dll has never been installed, you may be prompted to insert the
Windows install CD.
Other related files are installed in Sybase\Shared\PowerBuilder\drivers.
210
InfoMaker
CHAPTER 6
Enhancing Reports
Saving as PDF fails at runtime on Windows 2003 Server. This is caused by a
Group Policy that by default disallows installation of printers that use
kernel-mode drivers. Kernel-mode drivers have access to system-wide
memory, and poorly written drivers can cause system failures. To allow
installation of kernel-mode drivers, follow these steps:
1
Select Run from the Windows Start menu.
2
In the Open box, type gpedit.msc and click OK.
3
In the Group Policy console, expand Computer Configuration,
Administrative Templates, and Printers.
4
Disable “Disallow Installation of Printers Using Kernel-Mode Drivers.”
When you deploy applications that use the ability to save as PDF with the
distill method, you must make sure your users have installed Ghostscript and
have access to the drivers directory.
See “Using the Ghostscript distiller” on page 607 for more information about
redistributing these files.
Saving as PDF using XSL-FO
If you want to save to PDF using XSL-FO, you must set one or more properties
before saving.
In the Report painter
In the Report painter, you set PDF export properties on the Data Export page
in the Properties view.
❖
Users Guide
To save PDF output using XSL-FO in the Report painter:
1
Select the Data Export tab in the Properties view for the report.
2
Select PDF from the Format to Configure drop-down list and select
XSLFOP! from the Method drop-down list.
3
(Optional) If you want simultaneously to send the output directly to a
printer using the Java printing option of the Apache FOP processor, select
the Print Using XSLFOP check box.
211
Saving data in an external file
4
Save the report, then select File>Save Rows As, select PDF as the Save As
Type, specify a file name, and click Save.
InfoMaker saves the data in the report to the file you specified. If you
selected the Print Using XSLFOP check box, it also sends the PDF file to
the default printer for your system.
Saving as XSL-FO
You can also save a report as XSL-FO, then use the processor of your choice
to convert the XSL-FO string to the format you want, applying your own
customizations to the conversion. Processors such as the Apache XSL
Formatting Objects processor (FOP) can convert XSL-FO documents into
several output formats including PDF, PCL, and AWT.
In the Report painter, select File>Save Rows As and select XSL-FO as the file
type.
For a report named dwemp, the following command lines show the FOP syntax
for producing a PDF, a print preview rendered on screen (-awt), and printable
output rendered and sent to a printer (-print):
Fop dwemp.fo dwemp.pdf
Fop dwemp.fo -awt
Fop dwemp.fo -print
For more information about using FOP, see the FOP page of the Apache XML
Project Web site at http://xml.apache.org/fop/.
System requirements for XSL-FO
The Apache XSL Formatting Objects processor (FOP) and the Sun JDK are
installed with InfoMaker to support saving as XSL-FO, saving as PDF using
XSL-FO, and Java printing. Both are installed in the
Sybase\Shared\PowerBuilder directory.
When you deploy applications that use XSL-FO or Java printing, your users
must have the FOP directory and the Java Runtime Environment installed on
their computers. For more information, see “Using the Apache FO processor”
on page 609.
On Windows DBCS platforms, you also need to install a file that supports
DBCS characters to the Windows font directory, for example,
C:\WINDOWS\fonts. To use these fonts, the userconfig.xml file in the FOP conf
directory must be modified to give the full path name of the files you use, for
example:
212
InfoMaker
CHAPTER 6
Enhancing Reports
<font metricsfile="C:\Program%20Files\Sybase\Shared\PowerBuilder\fo
p-0.20.4\conf\cyberbit.xml" kerning="yes" embedfile="C:\WINNT\Fonts\Cyberbit.ttf">
For more information about configuring fonts, see the Apache Web site at
http://xml.apache.org/fop.
Saving the data in HTML Table format
HTML Table format is one of the formats in which you can choose to save data.
When you save in HTML Table format, InfoMaker saves a style sheet along
with the data. If you use this format, you can open the saved file in a browser
such as Internet Explorer. Once you have the file in HTML Table format, you
can continue to enhance the file in HTML.
About the results
Some presentation styles translate better into HTML than others. The Tabular,
Group, Freeform, Crosstab, and Grid presentation styles produce good results.
The Composite, RichText, OLE 2.0, and Graph presentation styles and nested
reports produce HTML tables based on the result set (data) only and not on the
presentation style. Reports with overlapping controls in them might not
produce the results you want.
❖
To save a report as an HTML table:
1
Open a report.
2
Open the Preview view if it is not already open.
3
Select File>Save Rows As from the menu bar.
4
Choose the HTML Table format for the file from the Save As Type
drop-down list.
5
Name the file.
InfoMaker creates a file using the name you supplied and the extension
htm.
Users Guide
6
Open a Web browser.
7
Use the browser’s file open command to open the HTML file.
213
Saving data in an external file
Working with PSR files
A PSR file is a special file with the extension PSR created by PowerBuilder,
InfoMaker, or DataWindow Designer.
Windows and PSR files
When InfoMaker is installed, the PSR file type is registered with Windows.
A PSR file contains a report definition (source and object) as well as the data
contained in the report when the PSR file was created.
Figure 6-1: PSR file
About reports
A report is the same as a nonupdatable DataWindow object. For more
information, see “About reports” on page 143.
You can use a PSR file to save a complete report (report design and data). This
can be especially important if you need to keep a snapshot of data taken against
a database that changes frequently.
How PSR files are
created
InfoMaker creates a PSR file when you:
•
Mail a report to an InfoMaker user using electronic mail
See “Mailing reports” on page 215.
•
Save data in the Powersoft report file format
See “Saving data in an external file” on page 208.
Opening a PSR file
214
When you open a PSR file, InfoMaker displays the report in the Report painter.
If InfoMaker is not already running, opening a PSR file automatically starts
InfoMaker. You can open a PSR file in File Manager or Explorer, in a mail
message, and using the File menu in the Report painter.
InfoMaker
CHAPTER 6
❖
Enhancing Reports
To open a PSR file in InfoMaker using Explorer or File Manager or from a
mail message:
•
Double-click the PSR file name.
InfoMaker displays the report.
❖
To open a PSR file from the menu bar in the Report painter:
1
Select File>Open File from the menu bar.
The Select a File Name dialog box displays.
2
Select the PSR file you want. Change drives and directories if needed.
The Report painter displays the report in the Design view.
3
PSR files and retrieval
Select View>Preview to preview the report.
When you are previewing a PSR file, you see the data that was saved in the file
when it was created. This is true until you explicitly retrieve data again using
the Retrieve button or Rows>Retrieve from the menu bar.
If you attempt to retrieve data with a PSR file, you must be sure that you are
properly connected to the right database. Otherwise, you will receive a
database error message.
If you retrieve new data while previewing a PSR file, you cannot go back to the
old data contained in the file. To go back to the old data, you must leave the
PSR file without saving and then reopen the PSR file.
Mailing reports
While previewing in the Report painter, you can mail a report as a PSR file to
an InfoMaker user who is using a MAPI-compliant mail system such as
Microsoft Exchange. (MAPI stands for messaging application program
interface and is one of the programming interfaces to mail systems.)
❖
To mail a report:
1
While previewing a report in the Report painter, select File>Send from the
menu bar.
If you are not logged on to your mail system, you will be prompted for
your password.
2
Enter your password and click OK.
A form for mailing the report displays. InfoMaker creates and attaches the
appropriate PSR file (which holds the report and data).
3
Users Guide
Complete the form and send the message.
215
Modifying general report properties
InfoMaker mails the PSR file. The recipient can open the report by doubleclicking it if InfoMaker is installed.
Modifying general report properties
This section describes the general report properties that you can modify.
Changing the report style
The general style properties for a report include:
•
The unit of measure used in the report
•
A timer interval for events in the report
•
A background color for the report
InfoMaker assigns defaults when it generates the basic report. You can change
the defaults.
❖
To change the default style properties:
1
Position the pointer in the background of the report, display the pop-up
menu, and select Properties.
The Properties view displays with the General page on top.
2
Click the unit of measure you want to use to specify distances when
working with the report:
•
PowerBuilder units (PBUs) Normalized units
•
Pixels (smallest element on the display monitor)
•
Thousandths of an inch
•
Thousandths of a centimeter
Choosing the unit of measure
If you plan to print the contents of the report at runtime, change the unit of
measure to inches or centimeters to make it easier to specify the margin
measurements.
216
InfoMaker
CHAPTER 6
3
Enhancing Reports
Specify the number of milliseconds you want between internal timer
events in the report.
This value determines how often InfoMaker updates the time fields in the
report. (Enter 60,000 milliseconds to specify one minute.)
4
If the DataWindow contains buttons, set the ShowBackColorOnXP
property to make sure that the background color you select for the buttons
displays on systems using the XP style.
5
On the Background page, select a background color from the Color dropdown list. The default color is the window background color.
Setting colors in a report
You can set different colors for each element of a report to enhance the display
of information.
❖
❖
To set a solid background color in a report:
1
Position the mouse on an empty spot in the report, display the pop-up
menu, and select Properties.
2
On the Background page in the Properties view for the report, select Solid
from the Brush Mode drop-down list and a color from the Color dropdown list.
To set a solid color for a band in a report:
1
Position the mouse pointer on the bar that represents the band, display the
pop-up menu, then select Properties.
2
On the Background page in the Properties view, select Solid from the
Brush Mode drop-down list and a color from the Color drop-down list.
The choice you make here overrides the background color for the report.
❖
To set solid colors in controls in a report:
•
Position the mouse pointer on the control, display the pop-up menu, then
select Properties.
You can set colors in the Background page in the Properties view.
For controls that use text, you can set colors for text on the Font page in
the Properties view. For drawing controls, you can set colors on the
General or Background page in the Properties view.
Users Guide
217
Modifying general report properties
Setting gradients and background pictures in a report
You can use the background effects to give the report more visual interest. For
example, you can set a vertical gradient on a header band to differentiate it
from the other bands in the report:
❖
❖
218
To set a gradient background in a report:
1
Position the mouse on an empty spot in the report, display the pop-up
menu, and select Properties.
2
On the Background page in the Properties view for the report, select a type
of gradient from the Brush Mode drop-down list.
3
Select the primary (background) color from the Color drop-down list.
4
Select the secondary (gradient) color from the Gradient group Color
drop-down list.
To set a picture as the background in a report:
1
Position the mouse on an empty spot in the report, display the pop-up
menu, and select Properties.
2
On the Background page in the Properties view for the report, select
Picture from the Brush Mode drop-down list.
3
Specify the image file in the File field in the Picture group.
InfoMaker
CHAPTER 6
4
Enhancing Reports
From the Tile Mode drop-down list, select the style you want to use.
Selections from the drop-down list allow you to display the picture in its
original size, stretch the picture in different directions, or tile multiple
copies of the picture in a variety of possible patterns.
Setting transparency properties for a report
You can change the transparency settings for colors and pictures.
❖
To set the transparency of a gradient in a report:
1
Position the mouse on an empty spot in the report, display the pop-up
menu, and select Properties.
2
On the Background page in the Properties view for the report, locate the
Gradient group.
3
Move the Gradient group Transparency slider until the gradient
(secondary) color is set to the desired transparency.
You can see the appearance in the Design view. The more transparent the
gradient color is, the more you will see the primary (background) color.
❖
To set the transparency of a background picture in a report:
1
Position the mouse on an empty spot in the report, display the pop-up
menu, and select Properties.
2
On the Background page in the Properties view for the report, locate the
Picture group.
3
Move the Picture group Transparency slider until the image is set to the
desired transparency.
You can see the appearance in the Design view.
Specifying properties of a grid report
In grid reports, you can specify:
Users Guide
•
When grid lines are displayed
•
How you can interact with the report at runtime
219
Modifying general report properties
❖
To specify basic grid report properties:
1
Position the mouse pointer on the background in a grid report, display the
pop-up menu, and select Properties.
2
Select the options you want in the Grid section on the General page in the
Properties view as described in Table 6-3.
Table 6-3: Options for grid reports
Option
On
Result
Grid lines always display
Off
Display Only
Grid lines never display (you cannot resize columns at runtime)
Grid lines display only when the report displays online
Print Only
Grid lines display only when the contents of the report are
printed
Column Moving
Columns can be moved at runtime
Mouse Selection
Data can be selected at runtime (and, for example, copied to the
clipboard)
Row Resize
Rows can be resized at runtime
Specifying pointers for a report
Just as with colors, you can specify different pointers to use when the mouse is
over a particular area of the report.
❖
To change the mouse pointer used at runtime:
1
Position the mouse over the element of the report whose pointer you want
to define, display the pop-up menu, and select Properties to display the
appropriate Properties view.
You can set a pointer for the entire report, specific bands, and specific
controls.
2
Select the Pointer tab.
3
Either choose the pointer from the Stock Pointers list or, if you have a file
containing pointer definitions (CUR files), enter a pointer file name.
You can use the Browse button to search for the file.
4
220
Click OK.
InfoMaker
CHAPTER 6
Enhancing Reports
Defining print specifications for a report
When you are satisfied with the look of the report, you can define its print
specifications.
❖
To define print specifications for a report:
1
In the Report painter, select Properties from the report’s pop-up menu.
2
In the Units box on the General page, select a unit of measure.
It is easier to specify the margins when the unit of measure is inches or
centimeters.
3
Select the Print Specifications tab.
The Print Specifications properties use the units of measure you specified
on the General page.
4
Specify print specifications for the current report.
See Table 6-4 for more information.
Users Guide
221
Modifying general report properties
Table 6-4: Setting print specifications for reports
Setting
Document Name
Printer Name
Margins
Paper Orientation
Description
Specify a name to be used in the print queue to identify the
report.
Specify the name of a printer to which this report should be
sent. If this box is empty, the report is sent to the default
system printer. If the specified printer cannot be found, the
report is sent to the default system printer if the Can Use
Default Printer check box is selected. If the specified
printer cannot be found and the Can Use Default Printer
check box is not selected, an error is returned.
Specify top, bottom, left, and right margins. You can also
change margins in the Preview view while you are actually
looking at data. If you change margins in the Preview view,
the changes are reflected here on the Print Specifications
page.
Choose one of the following:
• Default: Uses the default printer setup.
• Portrait: Prints the contents of the report across the
width of the paper.
Paper Size
Paper Source
Prompt Before Printing
Can Use Default
Printer
Display Buttons - Print
Preview
222
• Landscape: Prints the contents of the report across the
length of the paper.
Choose a paper size or leave blank to use the default.
Choose a paper source or leave blank to use the default.
Select to display the standard Print Setup dialog box each
time you make a print request.
Clear this check box if a printer has been specified in the
Printer Name box and you do not want the report to be sent
to the default system printer if the specified printer cannot
be found. This box is checked by default if a printer name
is specified.
Select to display Button controls in Print Preview. The
default is to hide them.
Display Buttons - Print
Select to display Button controls when you print the report.
The default is to hide them.
Clip Text
Select to clip static text to the dimensions of a text field
when the text field has no visible border setting. The text is
always clipped if the text field has visible borders.
Collate Copies
Select to collate copies when printing. Collating increases
print time because the print operation is repeated to
produce collated sets.
InfoMaker
CHAPTER 6
Enhancing Reports
Setting
Description
Print Preview Shows
Outline
Select to display a blue outline to show the location of the
margins.
Print Shows
Background
Whether the background settings of the DataWindow and
controls are included when the DataWindow is printed.
Preview Shows
Background
Newspaper Columns
Across and Width
Whether the background settings of the DataWindow and
controls display in the print preview.
If you want a multiple-column report where the data fills
one column on a page, then the second, and so on, as in a
newspaper, select the number and width of the columns in
the Newspaper Columns box. See “Printing with
newspaper-style columns” next.
Printing with newspaper-style columns
When you define a report, you can specify that it print in multiple columns
across the page, like a newspaper. A typical use of newspaper-style columns is
a phone list, where you want to have more than one column of names on a
printed page.
Use Print Preview to see the printed output
Newspaper-style columns are used only when the report is printed. They do not
appear when a report runs (or in Preview). Therefore, to see them in InfoMaker,
use Print Preview in the Report painter.
❖
Example
Users Guide
To define newspaper-style columns for a report:
1
Build a tabular report with the data you want.
2
Select Properties from the report’s pop-up menu.
3
Select the Print Specifications tab.
4
Specify the number of columns across the page and the width of columns
in the Newspaper Columns Across and Newspaper Columns Width
properties.
5
For each control in the report that you do not want to have appear multiple
times on the page (such as headers), select Properties from the control’s
pop-up menu and select the HideSnaked check box on the General page in
the Properties view.
This example describes how to create a newspaper-style report using the
Employee table in the EAS Demo DB.
223
Modifying general report properties
1
Create a tabular report, selecting the last name, first name, and phone
number columns, and add a title, page number, and date.
The Emp_Fname column and the text control holding a comma are defined
as Slide Left, so they display just to the right of the Emp_Lname column.
2
On the Print Specifications page of the report’s Properties view, specify
two columns across and a column width of 3.5 inches in the Newspaper
Columns boxes. (Make sure that Units is set to inches on the General
property page.)
3
To view the report as it will be printed, place the pointer in the Preview
view and select File>Print Preview.
The report displays the result set in two columns. Everything above the
column headers (which includes page number, title, and date) also shows
twice because of the 2-column specification. This information should
appear only once per page.
4
224
To specify that page number, title, and date appear only once on the page,
you need to suppress printing after the first column. For each of these
controls, select Properties from the control’s pop-up menu. Then set the
HideSnaked property.
InfoMaker
CHAPTER 6
Enhancing Reports
The finished report has one set of page heading information and two columns
of column header and detail information.
Modifying text in a report
When InfoMaker initially generates the basic report, it uses the following
attributes and fonts:
•
For the text and alignment of column headings and labels, InfoMaker uses
the extended column attributes made in the Database painter.
•
For fonts, InfoMaker uses the definitions made in the Database painter for
the table.
You can override any of these defaults in a particular report.
❖
To change text in a report:
1
Select the text.
The first box in the StyleBar is now active.
2
Type the new text.
Use ~n~r to embed a newline character in the text.
❖
Users Guide
To change the text properties for a text control in a report:
1
Select the text control.
2
Do one of the following:
225
Modifying general report properties
•
Change the text properties in the StyleBar.
•
Select the Font page in the control’s Properties view and change the
properties there.
Naming controls in a report
You use names to identify columns and other controls in filters and in
InfoMaker expression functions.
The Report painter automatically generates names for all controls in a report.
To name columns, labels, and headings, the Report painter uses database and
extended attribute information. To name all other controls, it uses a system of
prefixes. You can control the prefixes used for automatic name generation and
you can specify the name of any control explicitly.
❖
❖
To specify prefixes for naming controls systematically in a report:
1
Select Design>Options from the menu bar and then select the Prefixes tab.
2
Change prefixes as desired and click OK.
To specify a name of a control in a report:
1
Select Properties from the control’s pop-up menu and then select the
General tab in the Properties view.
2
Type the name in the Name box.
Using borders in a report
You can place borders around text, columns, graphs, and crosstabs to enhance
their appearance. InfoMaker provides six types of borders: Underline, Box,
ResizeBorder, ShadowBox, Raised, and Lowered:
Border appearance varies
Changing the border style may not have the same effect on all Windows
operating systems and display settings.
226
InfoMaker
CHAPTER 6
❖
Enhancing Reports
To add a border to a control in a report:
1
Select one or more controls.
2
Select the border you want from the Border drop-down toolbar in the
PainterBar.
InfoMaker places the border around the selected controls.
You can also specify a border for one or more controls in the Properties view
on the General page.
Specifying variable-height bands in a report
Sometimes reports contain columns whose data is of variable length. For
example, a Memo column in a table might be a character column that can take
up to several thousand characters. Reserving space for that much information
for the column in the detail band would make the detail band’s height very
large, meaning you could see few rows at a time.
The detail band can resize based on the data in the Memo column. If the Memo
column has only one line of text, the detail band should be one line. If the
Memo column has 20 lines of text, the detail band should be 20 lines high.
To provide a band that resizes as needed, specify that the variable-length
columns and the band have Autosize Height. All bands in the report can be
resized, but nested report overflow is supported only in the Detail band. If
autosizing would preclude the display of at least one Detail band row per page,
other bands cannot be autosized. Autosizing is not supported with the Graph,
RichText, OLE, or Label presentation styles.
❖
To create a resizable band in a report:
1
Select Properties from the pop-up menu of a column that should resize
based on the amount of data.
2
Select the Autosize Height check box on the Position page.
3
Clear the Auto Horizontal Scroll check box on the Edit page.
InfoMaker wraps text in the Preview view instead of displaying text on
one scrollable line.
Users Guide
4
Repeat steps 1 to 3 for any other columns that should resize.
5
Select Properties from the band’s pop-up menu.
6
Select the Autosize Height check box on the General page.
227
Modifying general report properties
In the Preview view, the band resizes based on the contents of the columns you
defined as having their height sized automatically.
Using the RowHeight
function with Autosize
Height
When a detail band has Autosize Height set to “true”, you should avoid using
the RowHeight InfoMaker expression function to set the height of any element
in the row. Doing so can result in a logical inconsistency between the height of
the row and the height of the element. If you need to use RowHeight, you must
set the Y coordinate of the element to 0 on the Position page in the Properties
view, otherwise the bottom of the element might be clipped. You must do this
for every element that uses such an expression. If you move any elements in
the band, make sure that their Y coordinates are still set to 0.
You should not use an expression whose runtime value is greater than the value
returned by RowHeight. For example, you should not set the height of a column
to rowheight() + 30. Such an expression produces unpredictable results at
runtime.
Clipping columns
You can have Autosize Height columns without an Autosize Height detail
band. If such a column expands beyond the size of the detail band in the
Preview view, it is clipped.
Modifying the data source of a report
When modifying a report, you might realize that you have not included all the
columns you need, or you might need to define retrieval arguments. You can
modify the data source from the Report painter. How you do it depends on the
data source.
Modifying SQL SELECT statements
If the data source is SQL (such as Quick Select, SQL Select, or Query), you can
graphically modify the SQL SELECT statement.
❖
To modify a SQL data source:
1
Select Design>Data Source from the menu bar.
InfoMaker returns you to the SQL Select painter. (If you used Quick
Select to define the data source, this might be the first time you have seen
the SQL Select painter.)
228
InfoMaker
CHAPTER 6
2
Enhancing Reports
Modify the SELECT statement graphically using the same techniques as
when creating it.
For more information, see “Using SQL Select” on page 165.
Modifying the statement syntactically
Select Design>Convert to Syntax from the menu bar to modify the
SELECT statement syntactically.
3
Click the Return button to return to the painter.
Changing the table
If you change the table referenced in the SELECT statement, InfoMaker
maintains the columns in the Design view (now from a different table) only if
they match the datatypes and order of the columns in the original table.
Modifying the retrieval
arguments
You can add, modify, or delete retrieval arguments when modifying your data
source.
❖
To modify the retrieval arguments:
1
In the SQL Select painter, select Design>Retrieval Arguments from the
menu bar.
The Specify Retrieval Arguments dialog box displays, listing the existing
arguments.
2
Add, modify, or delete the arguments.
3
Click OK.
You return to the SQL Select painter, or to the text window displaying the
SELECT statement if you are modifying the SQL syntactically.
4
Reference any new arguments in the WHERE or HAVING clause of the
SELECT statement.
For more information about retrieval arguments, see Chapter 5, “Defining
Reports.”
Users Guide
229
Storing data in a report using the Data view
Modifying the result set
If the data source is External or Stored Procedure, you can modify the result set
description.
❖
If the data source is a
stored procedure
To modify a result set:
1
If the Column Specification view is not open, select View>Column
Specifications from the menu bar.
2
Review the specifications and make any necessary changes.
If you are modifying the result set for a report whose data source is a stored
procedure, the pop-up menu for the Column Specification view contains the
menu item Stored Procedure.
Select Stored Procedure from the Column Specification view’s pop-up menu
to edit the Execute statement, select another stored procedure, or add retrieval
arguments. For more information about editing the Execute statement, see
“Using Stored Procedure” on page 182.
Storing data in a report using the Data view
Usually you retrieve data into a report from the database, because the data is
changeable and you want the latest information. However, sometimes the data
you display in a report never changes (as in a list of states or provinces), and
sometimes you need a snapshot of the data at a certain point in time. In these
situations, you can store the data in the report itself. You do not need to go out
to the database or other data source to display the data.
The most common reason to store data in a report is for use as a drop-down
DataWindow where the data is not coming from a database. For example, you
might want to display a list of postal codes for entering values in a State or
Province column in a form. You can store those codes in a report and use the
DropDownDataWindow edit style for the column.
For more information about using the DropDownDataWindow edit style, see
Chapter 8, “Displaying and Validating Data.”
230
InfoMaker
CHAPTER 6
❖
Enhancing Reports
To store data in a report:
1
If the Data view is not already displayed, select View>Data from the menu
bar.
In the default layout for the Report painter, the Data view displays in a
stacked pane under the Properties view. All columns defined for the report
are listed at the top.
2
Do any of the following:
•
Click the Insert Row button in the PainterBar to create an empty row
and type a row of data. You can enter as many rows as you want.
•
Click the Retrieve button in the PainterBar to retrieve all the rows of
data from the database. You can delete rows you do not want to save
or manually add new rows.
•
Click the Delete button in the PainterBar to delete unwanted rows.
Data changes are local to the report
Adding or deleting data here does not change the data in the database. It
only determines what data will be stored with the report when you save it.
The Update DB button is disabled.
3
When you have finished, save the report.
When you save the report, the data is stored in the report.
Sharing data with the
Preview view
To see changes you make in the Data view reflected in the Preview view, select
ShareData from the pop-up menu in the Data view. The Preview view shows
data from the storage buffer associated with the Data view.
What happens at runtime
When you run a report with stored data, the data is already there. InfoMaker
does not retrieve data.
InfoMaker never retrieves data into a drop-down DataWindow that already
contains data. For all other reports, if you retrieve data into a report stored with
data, InfoMaker handles it the same as a report that is not stored with data:
InfoMaker gets the latest data by retrieving rows from the database.
Users Guide
231
Retrieving data
Retrieving data
In a report, you can prompt for retrieval criteria, retrieve rows as needed, and
save retrieved rows to disk.
Prompting for retrieval criteria in a report
You can define your report so that it always prompts for retrieval criteria just
before it retrieves data.
❖
To prompt for retrieval criteria in a report:
1
If the Column Specifications view is not already displayed, select
View>Column Specifications from the menu bar.
In the default layout for the Report painter, the Column Specifications
view displays in a stacked pane under the Properties view. All columns
defined for the report are listed in the view.
2
Select the Prompt check box next to each column for which you want to
specify retrieval criteria at runtime.
When you specify prompting for criteria, InfoMaker displays the Specify
Retrieval dialog box just before a retrieval is to be done.
Each column you selected in the Column Specification view displays in the
grid. You can specify criteria here exactly as in the grid in the Quick Select
dialog box. Criteria specified here are added to the WHERE clause for the SQL
SELECT statement defined for the report.
Testing in InfoMaker
You can test the prompting for criteria by retrieving data in the Preview view
of the report.
232
InfoMaker
CHAPTER 6
Using edit styles
Enhancing Reports
If a column uses a code table or the RadioButton, CheckBox, or
DropDownListBox edit style, an arrow displays in the column header and you
can select a value from a drop-down list when specifying criteria:
If you do not want the drop-down list used for a column for specifying retrieval
criteria to display, select the Override Edit check box on the General page of
the column’s Properties view.
Forcing the entry of
criteria
If you have specified prompting for criteria for a column, you can force the
entry of criteria for the column by selecting the Equality Required check box
on the Behavior page of the column’s Properties view. InfoMaker underlines
the column header in the grid during prompting. Selection criteria for the
specified column must be entered, and the = operator must be used.
For more information
The section “Using Quick Select” on page 156 describes in detail how you can
specify selection criteria in the grid.
Retrieving rows as needed
If a report retrieves hundreds of rows, there can be a noticeable delay while all
the rows are retrieved. For these reports, InfoMaker can retrieve only as many
rows as it has to before displaying data.
For example, if a report displays only 10 rows at a time, InfoMaker only needs
to retrieve 10 or more rows before presenting the data. Then, as you page
through the data, InfoMaker continues to retrieve what is necessary to display
the new information. There may be slight pauses while InfoMaker retrieves the
additional rows, but these pauses are usually preferable to waiting a long time
to start working with data.
❖
To specify that a report retrieve only as many rows as it needs to:
•
Select Rows>Retrieve Options>Rows As Needed from the menu bar.
With this setting, InfoMaker presents data and returns control to you when
it has retrieved enough rows to display in the report.
Users Guide
233
Retrieving data
Retrieve Rows As Needed is overridden if you have specified sorting or have
used aggregate functions, such as Avg and Sum, in the report. This is because
InfoMaker must retrieve every row before it can sort or perform aggregates.
In a multiuser situation, Retrieve Rows As Needed might lock other people out
of the tables.
Saving retrieved rows to disk
If you want to maximize the amount of memory available to InfoMaker and
other running applications, InfoMaker can save retrieved data on your hard
disk in a temporary file rather than keep the data in memory. InfoMaker swaps
rows of data from the temporary file into memory as needed to display data.
❖
To maximize available memory by saving retrieved rows to disk:
•
Select Rows>Retrieve Options>Rows to Disk from the menu bar.
With this setting, when displaying data, InfoMaker swaps rows of data
from the temporary file into memory instead of keeping all the retrieved
rows of data in memory.
234
InfoMaker
CH A PTE R
About this chapter
Contents
7
Working with Controls in Reports
One of the ways you can enhance a report is to add controls, such as
columns, drawing objects, buttons, and computed fields. You can also
change the layout of the report by reorganizing, positioning, and rotating
controls. This chapter shows you how.
Topic
Adding controls to a report
Page
235
Reorganizing controls in a report
Positioning controls in a report
246
252
Rotating controls in a report
253
Adding controls to a report
This section describes adding controls to enhance your report.
Adding columns to a report
You can add columns that are included in the data source to a report. When
you first create a report, each of the columns in the data source is
automatically placed in the report. Typically, you would add a column to
restore one that you had deleted from the report, or to display the column
more than once in the report.
Adding columns not previously retrieved to the data source
To specify that you want to retrieve a column not previously retrieved
(that is, add a column to the data source), you must modify the data source.
See “Modifying the data source of a report” on page 228.
Users Guide
235
Adding controls to a report
❖
To add a column from the data source to a report:
1
Select Insert>Control>Column from the menu bar.
2
Click where you want to place the column.
The Select Column dialog box displays, listing all columns included in the
data source of the report.
3
Insert columns instead
of copying them
Select the column and click OK.
If you want to add a column from the DataWindow definition to a
DataWindow, always use Insert>Control>Column. You might see unexpected
results if you copy a column from one report to another if they both reference
the same column but the column order is different. This is because copying a
column copies a reference to the column’s id in the DataWindow definition.
Suppose d_first and d_second both have first_name and last_name columns, but
first_name is column 1 in d_first and column 2 in d_second. If you delete the
first_name column in d_second and paste column 1 from d_first in its place,
both columns in d_second display the last_name column in the Preview view,
because both columns now have a column id of 1.
Adding text to a report
When InfoMaker generates a basic report from a presentation style and data
source, it places columns and their headings in the Report painter. You can add
text anywhere you want to make the report easier to understand.
❖
To add text to a report:
1
Select Insert>Control>Text from the menu bar.
2
Click where you want the text.
InfoMaker places the text control in the Design view and displays the word
text.
236
3
Type the text you want.
4
(Optional) Change the font, size, style, and alignment for the text using the
StyleBar.
InfoMaker
CHAPTER 7
Working with Controls in Reports
Displaying an ampersand character
If you want to display an ampersand character, type a double ampersand in the
Text field. A single ampersand causes the next character to display with an
underscore because it is used to indicate accelerator keys.
Adding drawing controls to a report
You can add the following drawing controls to a report to enhance its
appearance:
Rectangle
RoundRectangle
Line
Oval
❖
To place a drawing control in a report:
1
Select the drawing control from the Insert>Control menu.
2
Click where you want the control to display.
3
Resize or move the drawing control as needed.
4
Use the drawing control’s Properties view to change its properties as
needed.
For example, you might want to specify a fill color for a rectangle or
thickness for a line.
Users Guide
237
Adding controls to a report
Adding a group box to a report
To visually enhance the layout of a report, you can add a group box. A group
box is a static frame used to group and label a set of controls in a report. The
following example shows two group boxes in a report. The Address group box
groups address information and the Phone/Fax group box groups telephone
numbers.
❖
To add a group box to a report:
1
Select Insert>Control>GroupBox from the menu bar and click in the
Design view.
2
Click where you want the control to display.
3
With the group box selected, type the text to display in the frame in.
4
Move and resize the group box as appropriate.
Adding pictures to a report
You can place pictures, such as your company logo, in a report to enhance its
appearance. If you place a picture in the header, summary, or footer band of the
report, the picture displays each time the content of that band displays. If you
place the picture in the detail band of the report, it displays in each row.
❖
To place a picture in a report:
1
Select Insert>Control>Picture from the menu bar.
2
Click where you want the picture to display.
The Select Picture dialog box displays.
3
238
Use the Browse button to find the file or enter a file name in the File Name
box. Then click Open.
InfoMaker
CHAPTER 7
Working with Controls in Reports
The picture must be a bitmap (BMP), runlength-encoded (RLE), Windows
metafile (WMF), Graphics Interchange Format (GIF), or Joint
Photographic Experts Group (JPEG) file.
4
Display the pop-up menu and select Original Size to display the image in
its original size.
You can use the mouse to change the size of the image in the Report
painter.
5
Tips for using pictures
Select the Invert Image check box on the Appearance page in the
Properties view to display the picture with its colors inverted.
To display a different picture for each row of data, retrieve a column containing
picture file names from the database. For more information, see “Specifying
additional properties for character columns” on page 90.
To compute a picture name at runtime, use the Bitmap function in the
expression defining a computed field. If you change the image in the Picture
control in a report, you need to reset the original size property. The property
automatically reverts to the default setting when you change the image.
Adding computed fields to a report
You can use computed fields in any band of the report. Typical uses with
examples include:
•
Calculations based on column data that change for each retrieved row
If you retrieve yearly salary, you can define a computed field in the detail
band that displays monthly salary: Salary / 12.
•
Summary statistics of the data
In a grouped report, you can use a computed field to calculate the totals of
a column, such as salary, for each group: sum (salary for group 1).
•
Concatenated fields
If you retrieve first name and last name, you can define a computed field
that concatenates the values so they appear with only one space between
them: Fname + " " + Lname.
•
System information
You can place the current date and time in a report’s header using the
built-in functions Today() and Now() in computed fields.
Users Guide
239
Adding controls to a report
Computed columns versus computed fields
When creating a report, you can define computed columns and computed fields
as follows:
The difference
between the two ways
•
In the SQL Select painter, you can define computed columns when you are
defining the SELECT statement that will be used to retrieve data into the
report.
•
In the Report painter, you can define computed fields after you have
defined the SELECT statement (or other data source).
When you define the computed column in the SQL Select painter, the value is
calculated by the DBMS when the data is retrieved. The computed column’s
value does not change until data has been updated and retrieved again.
When you define the computed field in the Report painter, the value of the
column is calculated in the report after the data has been retrieved.
Defining a computed field in the Report painter Design view
❖
To define a computed field in the Report painter Design view:
1
Select Insert>Control>Computed Field from the menu bar.
2
Click where you want to place the computed field.
If the calculation is to be based on column data that changes for each row,
make sure you place the computed field in the detail band.
The Modify Expression dialog box displays, listing:
•
InfoMaker expression functions you can use in the computed field
•
The columns in the report
•
Operators and parentheses
3
Enter the expression that defines the computed field as described in
“Entering the expression” next.
4
(Optional) Click Verify to test the expression.
InfoMaker analyzes the expression.
5
Entering the
expression
240
Click OK.
You can enter any valid InfoMaker expression when defining a computed field.
You can paste operators, columns, and InfoMaker expression functions into the
expression from information in the Modify Expression dialog box. Use the +
operator to concatenate strings.
InfoMaker
CHAPTER 7
Working with Controls in Reports
InfoMaker expressions
You are entering an InfoMaker expression, not a SQL expression processed by
the DBMS, so the expression follows the rules for InfoMaker expressions. For
complete information about InfoMaker expressions, see Chapter 23,
“Operators and Expressions.”
Referring to next and
previous rows
You can refer to other rows in a computed field. This is particularly useful in
N-Up reports when you want to refer to another row in the detail band. Use this
syntax:
ColumnName[x]
where x is an integer. 0 refers to the current row (or first row in the detail band),
1 refers to the next row, –1 refers to the previous row, and so on.
Examples
Table 7-1 shows some examples of computed fields.
Table 7-1: Computed field examples
To display
Current date at top of each page
Enter this expression
Current time at top of each page
Current page at bottom of each page
Now()
Page()
Header
Footer
Total page count at bottom of each
page
PageCount()
Footer
Concatenation of Fname and Lname
columns for each row
Monthly salary if Salary column
contains annual salary
Four asterisks if the value of the
Salary column is greater than $50,000
Average salary of all retrieved rows
Fname + " " + Lname
Detail
Salary / 12
Detail
IF(Salary> 50000,
"****", "")
Detail
Avg(Salary)
Summary
Count of retrieved rows, assuming
each row contains a value for EmpID
Count(EmpID)
Summary
Today()
In this band
Header
For complete information about the functions you can use in computed fields
in the Report painter, see Chapter 24, “DataWindow Expression and
InfoMaker Functions”.
Menu options and
buttons for common
functions
Users Guide
InfoMaker provides a quick way to create computed fields that summarize
values in the detail band, display the current date, or show the current page
number.
241
Adding controls to a report
❖
To summarize values:
1
Select one or more columns in the DataWindow object’s detail band.
2
Select one of the options at the bottom of the cascading menu: Average,
Count, or Sum.
The same options are available at the bottom of the Controls drop-down
toolbar on the PainterBar.
InfoMaker places a computed field in the summary band or in the group
trailer band if the report is grouped. The band is resized automatically to
hold the computed field. If there is already a computed field that matches
the one being generated, it is skipped.
❖
To insert a computed field for the current date or page number:
1
Select Insert>Control from the menu bar.
2
Select Today() or Page n of n from the options at the bottom of the
cascading menu.
The same options are available at the bottom of the Controls drop-down
toolbar on the PainterBar.
3
Click anywhere in the DataWindow object.
If you selected Today, InfoMaker inserts a computed field containing this
expression: Today(). For Page n of n, the computed field contains this
expression: 'Page ' + page() + ' of ' + pageCount().
Adding custom
buttons that place
computed fields
You can add buttons to the PainterBar in the Report painter that place computed
fields using any of the aggregate functions, such as Max, Min, and Median.
❖
To customize the PainterBar with custom buttons for placing computed
fields:
1
Place the mouse pointer over the PainterBar and select Customize from the
pop-up menu.
The Customize dialog box displays.
2
Click Custom in the Select palette group to display the set of custom
buttons.
3
Drag a custom button into the Current toolbar group and release it.
The Toolbar Item Command dialog box displays.
4
Click the Function button.
The Function For Toolbar dialog box displays.
242
InfoMaker
CHAPTER 7
5
Working with Controls in Reports
Select a function and click OK.
You return to the Toolbar Item Command dialog box.
6
Specify text and microhelp that displays for the button, and click OK.
InfoMaker places the new button in the PainterBar. You can click it to add
a computed field to your report the same way you use the built-in Sum
button.
Adding buttons to a report
The Button control is a command or picture button that can be placed in a
report. When clicked at runtime, the button activates the action you assign to it.
For example, you can place a button in a report and specify that clicking it
opens the Filter dialog box, where you can specify a filter to be applied to the
currently retrieved data.
❖
To add a button to a report:
1
Select Insert>Control>Button from the menu bar.
2
Click where you want the button to display.
You may find it useful to put a Delete button or an Insert button in the
detail band. Clicking a Delete button in the detail band will delete the row
next to the button clicked. Clicking an Insert button in the detail band will
insert a row following the current row.
Be careful when putting buttons in the detail band
Buttons in the detail band repeat for every row of data, which is not always
desirable. Buttons in the detail band are not visible during retrieval, so a
Cancel button in the detail band would be unavailable when needed.
3
With the button still selected, type the text to display on the button in the
PainterBar or on the General page of the Properties view.
4
Select the action you want to assign to the button from the Action
drop-down list on the General page of the Properties view.
For information about actions, see “Actions assignable to buttons in
reports” on page 244.
5
Users Guide
If you want to add a picture to the button, select the Action Default Picture
check box or enter the name of the Picture file to display on the button.
243
Adding controls to a report
Controlling the display of buttons in print preview and in printed output
You can choose whether to display buttons in print preview or in printed
output. You control this in the Properties view for the report (not the Properties
view for the button).
❖
To control the display of buttons in a report in print preview and on
printed output:
1
Display the report’s Properties view with the Print Specification page on
top.
2
Select the Display Buttons – Print check box.
The buttons are included in the printed output when the report is printed.
3
Select the Display Buttons – Print Preview check box.
The buttons display on the screen when viewing the report in print
preview.
Actions assignable to buttons in reports
Table 7-2 shows the actions you can assign to a button in a report.
Table 7-2: Actions that can be assigned to buttons in a report
Action
Cancel
What it does
Cancels a retrieval that has been started with the option to yield.
Filter
Page First
Displays Filter dialog box and filters as specified.
Scrolls to the first page.
Page Last
Page Next
Scrolls to the last page.
Scrolls to the next page.
Page Prior
Preview With
Rulers
Scrolls to the prior page.
Toggles between rulers on and off.
Print
Retrieve
Prints one copy of the DataWindow object.
Retrieves rows from the database. The option to yield is not
automatically turned on.
Retrieves rows from the database. Before retrieval actually
occurs, option to yield is turned on; this will allow the Cancel
action to take effect during a long retrieve.
Displays Save As dialog box and saves rows in the format
specified.
Displays Sort dialog box and sorts as specified.
Retrieve (Yield)
Save Rows As
Sort
244
InfoMaker
CHAPTER 7
Working with Controls in Reports
Adding graphs to a report
Graphs are one of the best ways to present information. For example, if your
report displays sales information over the course of a year, you can easily build
a graph in a report to display the information visually.
InfoMaker offers many types of graphs and provides you with the ability to
control the appearance of a graph to best meet your application’s needs.
For information on using graphs, see Chapter 13, “Working with Graphs.”
Adding InkPicture controls to a report
The InkPicture control is designed for use on a Tablet PC and provides the
ability to capture ink input from users of Tablet PCs. The control displays
signatures, drawings, and other annotations that do not need to be recognized
as text.
You use an InkPicture control with a table that has a blob column to store the
ink data, and optionally a second blob column to provide a background image.
The InkPicture control behaves like a Picture control that can contain
annotation. You can associate a picture with the control to display annotations
that have been saved with the picture. If the control contains signatures, you
usually do not associate a picture with it.
To add an InkPicture control to a report, select Insert>Control>InkPicture from
the menu. A dialog box displays to let you specify a blob column to store the
ink data and another to use as a background image. After you specify the
columns in the dialog box, the InkPicture control displays in the DataWindow
and its Properties view includes a Definition tab page where you can view or
change the column definitions.
Adding OLE controls to a report
You can add the following to a report:
•
A column that contains a database binary large object (a blob object) using
OLE 2.0
•
OLE 2.0 objects
For information on using OLE in a report, see Chapter 17, “Using OLE in a
Report.”
Users Guide
245
Reorganizing controls in a report
Adding reports to a report
You can nest reports (nonupdatable DataWindow objects) in a report.
For information on nesting reports, see Chapter 11, “Using Nested Reports.”
Adding tooltips to a DataWindow control
Tooltips display text when the pointer pauses over a DataWindow column or
control. This text can be used to explain the purpose of the column or control.
To use this feature, select the column or control for which you want to create a
tooltip and then select the Tooltip tab in the Properties view. You can use the
tab to specify:
•
Text for the tooltip
•
Title for the tooltip
•
Color of the background and text
•
Icon for the tooltip
•
Delay before the tooltip appears and disappears
•
Whether the tooltip appears as a rectangle or callout bubble
For more information, see Tooltip.property in the online Help.
Reorganizing controls in a report
You can change the layout and appearance of the controls in a report.
Displaying boundaries for controls in a report
When reorganizing controls in the Design view, it is sometimes helpful to see
how large all the controls are. That way you can easily check for overlapping
controls and make sure that the spacing around controls is what you want.
❖
To display control boundaries in a report:
1
Select Design>Options from the menu bar.
The Report Options dialog box displays.
246
InfoMaker
CHAPTER 7
2
Working with Controls in Reports
Select the Show Edges check box.
InfoMaker displays the boundaries of each control in the report.
Boundaries display only in the Design view
The boundaries displayed for controls are for use only in the Design view. They
do not display in a running report or in a printed report.
Using the grid and the ruler in a report
The Report painter provides a grid and a ruler to help you align controls.
❖
To use the grid and the ruler:
1
Select Design>Options from the menu bar.
The Report Options dialog box displays. The Alignment Grid box contains
the alignment grid options.
2
Use the options as needed:
Option
Meaning
Snap to Grid
Make controls snap to a grid position when you place them
or move them.
Show Grid
X
Show or hide the grid when the workspace displays.
Specify the size (width) of the grid cells.
Y
Show Ruler
Specify the size (height) of the grid cells.
Show a ruler. The ruler uses the units of measurement
specified in the Style dialog box. See “Changing the report
style” on page 216.
Your choices for the grid and the ruler are saved and used the next time you
start InfoMaker.
Deleting controls in a report
❖
Users Guide
To delete controls in a report:
1
Select the controls you want to delete.
2
Select Edit>Delete from the menu bar or press the Delete key.
247
Reorganizing controls in a report
Moving controls in a report
In all presentation
styles except Grid
In all presentation styles except Grid, you can move all the controls (such as
headings, labels, columns, graphs, and drawing controls) anywhere you want.
❖
In grid reports
To move controls in a report:
1
Select the controls you want to move.
2
Do one of the following:
•
Drag the controls with the mouse.
•
Press an arrow key to move the controls in one direction.
You can reorder columns in a grid report at runtime.
See “Working in a grid report” on page 207.
Copying controls in a report
You can copy controls within a report and to other reports. All properties of the
controls are copied.
❖
To copy a control in a report:
1
Select the control.
2
Select Edit>Copy from the menu bar.
The control is copied to a private InfoMaker clipboard.
3
Copy (paste) the control to the same report or to another one:
•
To copy the control within the same report, select Edit>Paste from the
menu bar.
•
To copy the control to another report, open the desired report and
paste the control.
InfoMaker pastes the control at the same location as in the source report.
If you are pasting into the same report, you should move the pasted control
so it does not cover the original control. InfoMaker displays a message box
if the control you are pasting is not valid in the destination report.
248
InfoMaker
CHAPTER 7
Working with Controls in Reports
Resizing controls in a report
You can resize a control using the mouse or the keyboard. You can also resize
multiple controls to the same size using the Layout drop-down toolbar on
PainterBar2.
Using the mouse
To resize a control using the mouse, select it, then grab an edge and drag it with
the mouse.
Using the keyboard
To resize a control using the keyboard, select it and then do the following:
In grid reports
To make the control
Wider
Press
Shift+Right Arrow
Narrower
Taller
Shift+Left Arrow
Shift+Down Arrow
Shorter
Shift+Up Arrow
You can resize columns in grid reports.
❖
To resize a column in a grid report:
1
Position the mouse pointer at a column boundary.
The pointer changes to a two-headed arrow.
2
Press and hold the left mouse button and drag the mouse to move the
boundary.
3
Release the mouse button when the column is the correct width.
Aligning controls in a report
Often you want to align several controls or make them all the same size. You
can use the grid to align the controls or you can have InfoMaker align them for
you.
❖
To align controls in a report:
1
Select the control whose position you want to use to align the others.
InfoMaker displays handles around the selected control.
2
Extend the selection by pressing and holding the Ctrl key and clicking the
controls you want to align with the first one.
All the controls have handles on them.
3
Users Guide
Select Format>Align from the menu bar.
249
Reorganizing controls in a report
4
From the cascading menu, select the dimension along which you want to
align the controls.
For example, to align the controls along the left side, select the first choice
on the cascading menu. You can also use the Layout drop-down toolbar on
PainterBar2 to align controls.
InfoMaker moves all the selected controls to align with the first one.
Equalizing the space between controls in a report
If you have a series of controls and the spacing is fine between two of them but
wrong for the rest, you can easily equalize the spacing around all the controls.
❖
To equalize the space between controls in a report:
1
Select the two controls whose spacing is correct.
To do so, click one control, then press Ctrl and click the second control.
2
Select the other controls whose spacing match that of the first two
controls. To do so, press Ctrl and click each control.
3
Select Format>Space from the menu bar.
4
From the cascading menu, select the dimension whose spacing you want
to equalize.
You can also use the Layout drop-down toolbar on PainterBar2 to space
controls.
Equalizing the size of controls in a report
Suppose you have several controls in a report and want their sizes to be the
same. You can accomplish this manually or by using the Format menu.
❖
250
To equalize the size of controls in a report:
1
Select the control whose size is correct.
2
Press Ctrl and click to select the other controls whose size should match
that of the first control.
3
Select Format>Size from the menu bar.
4
From the cascading menu, select the dimension whose size you want to
equalize.
InfoMaker
CHAPTER 7
Working with Controls in Reports
You can also use the Layout drop-down toolbar on PainterBar2 to size
controls.
Sliding controls to remove blank space in a report
You can specify that you want to eliminate blank lines or spaces in a report by
sliding columns and other controls to the left or up if there is blank space. You
can use this feature to remove blank lines in mailing labels or to remove extra
spaces between fields (such as first and last name).
Slide is used by default in nested reports
InfoMaker uses slide options automatically when you nest a report to ensure
that the reports are positioned properly.
❖
To use sliding columns or controls in a report:
1
Select Properties from the control’s pop-up menu and then select the
Position tab in the Properties view.
2
Select the Slide options you want:
Option
Description
Slide Left
Slide the column or control to the left if there is nothing
to the left. Be sure the control does not overlap the
control to the left. Sliding left will not work if the
controls overlap.
Slide the column or control up if there is nothing in the
row above. The row above must be completely empty
for the column or control to slide up.
Slide Up - All Above
Slide Up - Directly
Above
Slide the column or control up if there is nothing
directly above it in the row above.
You can also use the drop-down toolbar on PainterBar2 to slide controls.
If you are sliding columns up
Even blank columns have height; if you want columns to slide up, you need to
specify as Autosize Height all columns above them that might be blank and that
you want to slide other columns up through.
Example
Users Guide
In a mailing label that includes first and last names, as well as address
information, you can use sliding to combine the columns appropriately.
251
Positioning controls in a report
In the following label, emp_lname, the comma, state, and zip_code are
specified as slide left. Edges are shown to indicate the spacing between the
columns. Notice that there is a small amount of space between controls. This
space is necessary for Slide Left to work properly:
When you preview (run) the report, the last name, comma, state, and zip code
slide left to remove the blank space:
Positioning controls in a report
Table 7-3 shows the properties for each control in a report that determine how
it is positioned within the report.
Table 7-3: Position properties for controls in a report
Property
Meaning
Background
Control is behind other controls. It is not restricted to one band. This
is useful for adding a watermark (such as the word
CONFIDENTIAL) to the background of a report.
Control is placed within one band. It cannot extend beyond the
band’s border.
Band
Foreground
Moveable
Resizable
HideSnaked
252
Control is in front of other controls. It is not restricted to one band.
Control can be moved at runtime and in preview. This is useful for
designing layout.
Control can be resized at runtime and in preview. This is useful for
designing layout.
Control appears only in the first column on the page; in subsequent
columns the control does not appear. This is only for newspaper
columns, where the entire report snakes from column to column (set
on the General page of the Properties view).
InfoMaker
CHAPTER 7
Default positioning
Working with Controls in Reports
InfoMaker uses the defaults shown in Table 7-4 when you place a new control
in a report.
Table 7-4: Default position properties for controls in a report
❖
Control
Graph
Default positioning
Foreground, movable, resizable
All other controls
Band, not movable, not resizable
To change the position of a control in a report:
1
Select Properties from the control’s pop-up menu and then select the
Position tab.
2
From the Layer option drop-down list, select Background, Band, or
Foreground.
3
Select Resizable or Moveable as appropriate.
Rotating controls in a report
Controls that display text such as text controls and computed fields can be
rotated from the original baseline of the text. The Escapement property on the
Font property page for the control lets you specify the amount of rotation, also
known as escapement.
Several other properties of a rotated control affect its final placement when the
report runs. The location of the control in Design view, the amount of rotation
specified for it, and the location of the text within the control (for example,
centered text as opposed to left-aligned text) all contribute to what you see in
the report Preview view.
The following procedure includes design practices that help ensure that you get
the final results you want. As you become more experienced, you can drop or
alter some of the steps. The procedure recommends making the control
movable in the Preview view, which is often helpful.
❖
Users Guide
To rotate a control in a report:
1
Select the control in the Design view.
2
Make it movable (Position property page>Moveable check box).
3
In Design view, enlarge the area in which the control is placed.
253
Rotating controls in a report
For example, in a grid report, make the band deeper and move the control
down into the center of the band.
4
Display the Modify expression dialog box for the Escapement property.
(Click the button next to the Escapement property on the Font property
page.)
5
Specify the amount of rotation you want as an integer in tenths of a degree.
(For example, 450 means 45 degrees of rotation; 0 means horizontal or no
rotation.)
The origin of rotation is the center of the top border of the box containing
the text. It is often helpful to use left-aligned text (General property
page>Alignment>Left) because it makes it easier to position the control
correctly. This example shows left-aligned text within two controls, a text
control and a computed field.
If the box that contains the text overlaps the border of the page or the
border of a label in a report with the Label presentation style, the origin of
rotation is the center of the portion of the top border that is within the page
or label, and the portion that is outside the page or label is cut off. This can
cause the text in the box to run to a second line when it is rotated. If you
want the text to display close to the border, you can add one or more line
breaks (“~r~n”) before the text and adjust the size of the box.
6
254
To display the current rotation in Preview, close the Preview view and
reopen it (View>Preview on the menu bar).
InfoMaker
CHAPTER 7
Working with Controls in Reports
7
Drag and drop the control in the Design view until it is where you want it.
8
In the Design view, select the control that is being rotated and deselect the
Moveable check box.
If you are using a conditional expression for rotation
If you are specifying different rotations depending on particular conditions,
you might need to add conditions to the x and y properties for the control to
move the control conditionally to match the various amounts of rotation. An
alternative to moving the control around is to have multiple controls positioned
exactly as you want them, taking into account the different amounts of rotation.
Then you can add a condition to the visible property of each control to ensure
that the correctly rotated control shows.
Users Guide
255
Rotating controls in a report
256
InfoMaker
CH A PTE R
About this chapter
Contents
8
Displaying and Validating Data
This chapter describes how to customize your report or form by modifying
the display values in columns and specifying validation rules.
Topic
About displaying and validating data
Page
257
About display formats
Working with display formats
259
260
Defining display formats
About edit styles
263
270
Working with edit styles
Defining edit styles
272
274
Defining a code table
About validation rules
284
287
Working with validation rules
288
Defining validation rules
How to maintain extended attributes
289
294
About displaying and validating data
When InfoMaker generates a basic report or form, it uses the extended
attributes defined for the data and stored in the extended attribute system
tables.
For more information about the extended attribute system tables, see
Appendix B, “The Extended Attribute System Tables.”
In the Database painter, you can create the extended attribute definitions
that specify a column’s display format, edit style, and validation rules.
In the Report painter or Form painter, you can override these extended
attribute definitions for a column in a report or form. These overrides do
not change the information stored with the column definition in the
extended attribute system tables.
Users Guide
257
About displaying and validating data
Database painter is required
You must have the Database painter installed to define display formats and edit
styles in your database.
Presenting the data
When you generate a new report or form, InfoMaker presents the data
according to the properties already defined for a column, such as a column’s
display format and edit style.
Display formats
Display formats embellish data values while still displaying them as letters,
numbers, and special characters. Using display formats, for example, you can:
•
Change the color of numbers to display a negative value
•
Add parentheses and dashes to format a telephone number
•
Add a dollar sign and period to indicate a currency format
For information, see “About display formats” on page 259.
Edit styles
Edit styles usually take precedence over display formats and specify how
column data is presented. For example, using edit styles, you can:
•
Display valid values in a drop-down list
•
Indicate that a single value is selected by a check box
•
Indicate which of a group of values is selected with radio buttons
In the Report painter, an edit style is simply a way of presenting data. You can
change data in a form; you cannot change data in a report. In the Database
painter and in the Form painter, an edit style enables you to change data in the
database by means of an edit mechanism, such as a check box or radio buttons.
For more information, see “About edit styles” on page 270.
About display format
masks and EditMask
masks
258
The differences between display format masks and EditMask masks can be
confusing. A display format mask determines the appearance of the column
when the focus is off the column, or when the report is in print preview mode.
When you apply an EditMask edit style, the mask you use determines the
appearance of the column when focus is on the column.
InfoMaker
CHAPTER 8
Displaying and Validating Data
If you want data to display differently depending on whether the focus is on or
off the column, specify an edit mask (on the Edit property page for the column)
as well as a display format (on the Format property page for the column), then
check the Use Format check box on the Format property page. The Use Format
check box displays only when an edit mask has been specified.
If you want the data to display in the same way whether focus is on or off the
column and you have defined an edit mask, you do not need to define a display
format. The edit mask is used for display if the Use Format box is not checked
(the default).
Validating data
When data is entered in the Database painter or in a form, InfoMaker evaluates
the data against validation rules defined for that column. If the data is valid,
InfoMaker accepts the entry; otherwise, InfoMaker displays an error message
and does not accept the entry.
For more information, see “About validation rules” on page 287.
About display formats
You can use display formats to customize the display of column data in a report
or form. Display formats are masks in which certain characters have special
significance. For example, you can display currency values preceded by a
dollar sign, show dates with month names spelled out, and use a special color
for negative numbers. InfoMaker comes with many predefined display
formats. You can use them as is or define your own.
Here the Phone, Salary, and Start Date columns use display formats so the data
is easier to interpret:
Users Guide
259
Working with display formats
Display formats not used for data entry
When you tab to a column containing a display format, InfoMaker removes the
display format and displays the raw value for you to edit.
If you want to provide formatting used for data entry, you need to specify edit
masks, as described in “The EditMask edit style” on page 278.
Working with display formats
You work with display formats in the Database painter, the Form painter, and
the Report painter.
What you do in the
Database painter
In the Database painter, you can:
•
Create, modify, and delete named display formats
The named display formats are stored in the extended attribute system
tables. When you have defined a display format, it can be used by any
column of the appropriate datatype in the database.
•
Assign display formats to columns and remove them from columns
These formats are used by default when you place the column in a report
in the Report painter or a form in the Form painter.
What you do in the
Form and Report
painters
Display formats and
the extended attribute
system tables
260
In the Form and Report painters, you can:
•
Accept the default display format assigned to a column in the Database
painter
•
Override the default display format with another named format stored in
the extended attribute system tables
•
Create an ad hoc, unnamed format to use with one specific column
When you have placed a column in a report or form and have given it a display
format (either the default format from the assignment made in the Database
painter for the column or a format assigned in the Form or Report painter),
there is no longer any link to the named format in the extended attribute system
tables.
InfoMaker
CHAPTER 8
Displaying and Validating Data
If the definition of the display format later changes in the extended attribute
system tables, the format for the column in a report or form does not change. If
you want to use the modified format, you can reapply it to the column in the
Form or Report painter.
Working with display formats in the Database painter
Typically, you define display formats and associate them with columns in the
Database painter, because display formats are properties of the data itself. Once
you have associated a display format with a column in the Database painter, it
is used by default each time the column is placed in a report or form.
Edit style takes precedence
If a column has an associated edit style, the edit style takes precedence over a
display format unless you use an EditMask edit style and check the Use Format
box on the Format property page.
For more information, see “About edit styles” on page 270.
❖
To create a new display format:
1
In the Database painter, open the Extended Attributes view, right-click
Display Formats, and select Add from the pop-up menu.
The Display Format view displays.
2
Name the display format and specify a datatype.
3
Define the display format using masks.
For information, see “Defining display formats” on page 263.
You can use this display format with any column of the appropriate datatype in
the database.
❖
To modify an existing display format:
1
In the Database painter, open the Extended Attributes view.
2
In the Extended Attributes view, open the list of display formats.
3
Position the pointer on the display format you want to modify, display the
pop-up menu, and select Properties.
4
In the Display Format view, modify the display format as desired.
For information, see “Defining display formats” on page 263.
Users Guide
261
Working with display formats
❖
To associate a display format with a column in the Database painter:
1
In the Database painter Objects view, position the pointer on the column,
select Properties from the pop-up menu, and select the Display tab in the
Properties view.
2
Select a format from the list in the Display Format box.
The column now has the selected format associated with it in the extended
attribute system tables.
❖
To remove a display format from a column in the Database painter:
1
In the Database painter Objects view, position the pointer on the column,
select Properties from the pop-up menu, and select the Display tab in the
Properties view.
2
Select (None) from the list in the Display Format box.
The display format is no longer associated with the column.
Working with display formats in the Report painter and Form
painter
Display formats you assign to a column in the Database painter are used by
default when you place the column in a report or form. You can override the
default format in the Report painter or Form painter by choosing another
format from the extended attribute system tables or defining an ad hoc format
for one specific column.
About computed fields
You can assign display formats to computed fields using the same techniques
as for columns in a table.
❖
To specify a display format for a column in the Report painter or Form
painter:
1
In the Report painter or Form painter, move the pointer to the column,
select Properties from the column’s pop-up menu, and then select the
Format tab.
Information appropriate to the datatype of the selected column displays.
The currently used format displays in the Format box. All formats for the
datatype defined in the extended attribute system tables are listed in the
pop-up list (displayed by clicking the button).
262
InfoMaker
CHAPTER 8
2
Displaying and Validating Data
Do one of the following:
•
Delete the display format.
•
Select a format in the extended attribute system tables from the
pop-up list.
•
Create a format for the column by typing it in the Format box. For
more information, see “Defining display formats” next.
Format not saved in the extended attribute system tables
If you create a format here, it is used only for the current column and is not
saved in the extended attribute system tables.
Shortcuts in the Report painter
To assign the Currency or Percent display format to a numeric column in a
report, select the column, then click the Currency or Percent button in the
PainterBar or select Format>Currency or Format>Percent from the menu bar.
Customizing the
toolbar
You can add buttons to the PainterBar that assign a specified display format to
selected columns in reports and forms.
For more information, see “Customizing toolbars” on page 31.
Defining display formats
Display formats are represented through masks, where certain characters have
special significance. InfoMaker supports four kinds of display formats, each
using different mask characters:
Numbers
Strings
Dates
Times
For example, in a string format mask, each @ represents a character in the
string and all other characters represent themselves. You can use the following
mask to display phone numbers:
(@@@) @@@-@@@@
Users Guide
263
Defining display formats
Combining formats
You can include different types of display format masks in a single format. Use
a space to separate the masks. For example, the following format section
includes a date and time format:
mmmm/dd/yyyy h:mm
Using sections
Each type of display format can have multiple sections, with each section
corresponding to a form of the number, string, date, or time. Only one section
is required; additional sections are optional and should be separated with
semicolons (;). You cannot use sections in edit masks. Semicolons can be used
only in display formats.
The following format specifies different displays for positive and negative
numbers—negative numbers are displayed in parentheses:
$#,##0;($#,##0)
Using keywords
Enclose display format keywords in square brackets. For example, you can use
the keyword [General] when you want InfoMaker to determine the appropriate
format for a number.
Using colors
You can define a color for each display format section by specifying a color
keyword before the format. The color keyword is the name of the color, or a
number that represents the color, enclosed in square brackets: [RED] or [255].
The number is usually used only when a color is required that is not provided
by name. The named color keywords are:
[BLACK]
[BLUE]
[CYAN]
[GREEN]
[MAGENTA]
[RED]
[WHITE]
[YELLOW]
The formula for combining primary color values into a number is:
256*256*blue + 256*green + red=number
where the amount of each primary color is specified as a value from 0 to 255.
For example, to specify cyan, substitute 255 for blue, 255 for green, and 0 for
red. The result is 16776960.
If you want to add text to a numeric display format and use a color attribute,
you must include the escape character (\) before each literal in the mask. For
example:
[red]\D\e\p\t\: ###
264
InfoMaker
CHAPTER 8
Displaying and Validating Data
Table 8-1 lists the blue, green, and red values you can use in the formula to
create other colors.
Table 8-1: Numeric values used to create colors
Using special
characters
Blue
0
Green
0
Red
255
Number
255
Color
Red
0
0
255
128
0
0
65280
32768
Green
Dark green
255
0
0
255
0
255
16711680
65535
Blue
Yellow
0
255
128
255
128
0
32896
16776960
Brown
Cyan
192
192
192
12632256
Light gray
To include a character in a mask that has special meaning in a display format,
such as [, precede the character with a backslash (\). For example, to display a
single quotation mark, enter \'.
Number display formats
A number display format can have up to four sections. Only the first is
required. The three other sections determine how the data displays if its value
is negative, zero, or NULL. The sections are separated by semi-colons:
Positive-format;negative-format;zero-format;null-format
Special characters
Table 8-2 lists characters that have special meaning in number display formats.
Table 8-2: Characters with special meaning in display formats
Character
Meaning
#
0
A number
A required number; a number will display for every 0 in the mask
Percent signs, decimal points, parentheses, and spaces display as entered in the
mask.
Users Guide
265
Defining display formats
Use at least one 0
In general, a number display format should include at least one 0. If you enter
0 in a field with the mask ###, the field will appear to be blank if you do not
provide a zero-format section. If the mask is ###.##, only the period displays.
If you want two decimal places to display even if both are 0, use the mask
##0.00.
Number keywords
You can use the following keywords as number display formats when you want
InfoMaker to determine an appropriate format to use:
•
[General]
•
[Currency]
Note that [Currency(7)] and [Currency(n)] are legal edit masks, but they are not
legal display formats.
Percentages
Use caution when defining an edit mask for a percentage. When you enter a
number in a column with a percent edit mask and tab off the column,
InfoMaker divides the number by 100 and stores the result in the buffer. For
example, if you enter 23, InfoMaker passes .23 to the buffer. When you retrieve
from the database, InfoMaker multiplies the number by 100 and, if the mask is
##0%, displays 23%.
The datatype for the column must be numeric or decimal to handle the result of
a division by 100. If the column has an integer datatype, a percentage entered
as 333 is retrieved from the database as 300, and 33 is retrieved as 0.
If you use an edit mask with decimals, such as ##0.00%, the datatype must
have enough decimal places to handle the division. For example, if you enter
33.33, the datatype for the column must have at least four decimal places
because the result of the division is .3333. If the datatype has only three
decimal places, the percentage is retrieved as 33.30.
Examples
Table 8-3 shows how the values 5, –5, and .5 display when different format
masks are applied.
Table 8-3: Number display format examples
266
Format
[General]
5
5
-5
-5
.5
0.5
0
0.00
5
5.00
-5
-5.00
1
0.50
#,##0
#,##0.00
5
5.00
-5
-5.00
1
0.50
$#,##0;($#,##0)
$5
($5)
$1
InfoMaker
CHAPTER 8
Displaying and Validating Data
Format
5
-5
.5
$#,##0;-$#,##0
$#,##0;[RED]($#,##0)
$5
$5
-$5
($5)
$1
$1
[Currency]
$#,##0.00;($#,##0.00)
$5.00
$5.00
($5.00)
($5.00)
$0.50
$0.50
$#,##0.00;[RED]($#,##0.00)
##0%
$5.00
500%
($5.00)
-500%
$0.50
50%
##0.00%
0.00E+00
500.00%
5.00E+00
-500.00%
-5.00E+00
50.00%
5.00E-01
String display formats
String display formats can have two sections. The first is required and contains
the format for strings; the second is optional and specifies how to represent
NULLs:
string-format;null-format
In a string format mask, each at-sign (@) represents a character in the string
and all other characters represent themselves.
Special characters for string edit masks
String edit masks use different special characters. See “The EditMask edit
style” on page 278.
Example
This format mask:
[red](@@@) @@@-@@@@
displays the string 800YESCELT in red as:
(800) YES-CELT
Date display formats
Date display formats can have two sections. The first is required and contains
the format for dates; the second is optional and specifies how to represent
NULLs:
date-format;null-format
Users Guide
267
Defining display formats
Special characters
Table 8-4 shows characters that have special meaning in date display formats.
Table 8-4: Characters with special meaning in data display formats
Character
d
Meaning
Day number with no leading zero
Example
9
dd
ddd
Day number with leading zero if appropriate
Day name abbreviation
09
Mon
dddd
m
Day name
Month number with no leading zero
Monday
6
mm
mmm
Month number with leading zero if appropriate 06
Month name abbreviation
Jun
mmmm
yy
Month name
Two-digit year
June
97
yyyy
Four-digit year
1997
Colons, slashes, and spaces display as entered in the mask.
About 2-digit years
If you specify a 2-digit year in a report or form, InfoMaker assumes the date is
the 20th century if the year is greater than or equal to 50. If the year is less than
50, InfoMaker assumes the 21st century. For example:
Date keywords
•
1/1/85 is interpreted as January 1, 1985.
•
1/1/40 is interpreted as January 1, 2040.
You can use the following keywords as date display formats when you want
InfoMaker to determine an appropriate format to use:
•
[ShortDate]
•
[LongDate]
The format used is determined by the regional settings for date in the registry.
Note that [Date] is not a valid display format.
Examples
268
Table 8-5 shows how the date Friday, January 30, 1998, displays when
different format masks are applied.
InfoMaker
CHAPTER 8
Displaying and Validating Data
Table 8-5: Date display format examples
Format
[red]m/d/yy
Displays
1/30/98 in red
d-mmm-yy
dd-mmmm
30-Jan-98
30-January
mmm-yy
dddd, mmm d, yyyy
Jan-98
Friday, Jan 30, 1998
Time display formats
Time display formats can have two sections. The first is required and contains
the format for times; the second is optional and specifies how to represent
NULLs:
time-format;null-format
Special characters
Table 8-6 shows characters that have special meaning in time display formats.
Table 8-6: Characters with special meaning in time display formats
Character
h
Meaning
Hour with no leading zero (for example, 1)
hh
m
Hour with leading zero if appropriate (for example, 01)
Minute with no leading zero (must follow h or hh)
mm
s
Minute with leading zero if appropriate (must follow h or hh)
Second with no leading zero (must follow m or mm)
ss
ffffff
Second with leading zero (must follow m or mm)
Microseconds with no leading zeros. You can enter one to six f’s; each
f represents a fraction of a second (must follow s or ss)
AM/PM
am/pm
Two-character, uppercase abbreviation (AM or PM as appropriate)
Two-character, lowercase abbreviation (am or pm as appropriate)
A/P
a/p
One-character, uppercase abbreviation (A or P as appropriate)
One-character, lowercase abbreviation (a or p as appropriate)
Colons, slashes, and spaces display as entered in the mask.
24-hour format is the default
Times display in 24-hour format unless you specify AM/PM, am/pm, A/P, or
a/p.
Users Guide
269
About edit styles
Time keyword
You can use the following keyword as a time display format to specify the
format specified in the Windows control panel:
•
Examples
[Time]
Table 8-7 shows how the time 9:45:33:234567 PM displays when different
format masks are applied.
Table 8-7: Time display format examples
Format
h:mm AM/PM
Displays
9:45 PM
hh:mm A/P
09:45 P
h:mm:ss am/pm 9:45:33 pm
h:mm
h:mm:ss
21:45
21:45:33
h:mm:ss:f
h:mm:ss:fff
21:45:33:2
21:45:33:234
h:mm:ss:ffffff
m/d/yy h:mm
21:45:33:234567
1/30/98 21:45
About edit styles
You can define edit styles for columns. Edit styles specify how column data is
presented in reports and forms. Unlike display formats, edit styles do not only
affect the display of data; they also affect how you interact with the data. Once
you define an edit style, it can be used by any column of the appropriate
datatype in the database.
When edit styles are
used
If both a display format and an edit style have been assigned to a column, the
edit style is always used, with one exception. When you assign an EditMask
edit style to a column, you can check the Use Format check box on the Format
property page for the column to use the edit mask format when focus is on the
column, and the display format mask when focus is off the column.
In the Report painter, you usually do not need to assign an edit style to a
column, because the column is never editable. Assigning a display format is
more appropriate. However, edit styles are used in the Report painter for some
specific uses. For example, the DropDownDataWindow edit style can be
assigned to a column to display a state name instead of its identifier.
270
InfoMaker
CHAPTER 8
Displaying and Validating Data
An EditMask edit style is assigned automatically to some numeric and
currency columns. To use a different display format for these columns, make
sure you check the Use Format check box on the Format property page.
Edit styles
Table 8-8 shows the available edit styles.
Table 8-8: Edit styles
Edit style
Edit box (default)
What the edit style does
Displays a value in the box
Example
For data entry, type a value
DropDownListBox
Displays a value from the
drop-down list
For data entry, select or enter
a value
CheckBox
Displays a check box selected
or cleared
For data entry, select or clear
the check box
RadioButtons
EditMask
Displays radio buttons, one of
which is selected
For data entry, select one of
the radio buttons
Displays formatted data
For data entry, type a value
DropDownDataWindow
Displays a value from a
drop-down DataWindow
For data entry, select a value
RichText
Allows display of data in rich
text formats.
InkEdit
On Tablet PCs, displays an
InkEdit control so the user can
enter data with the stylus.
For example, suppose you have a column Status that takes one of three values:
the letters A, T, and L, each representing a status (Active, Terminated, or On
Leave). If you assign it the RadioButton edit style, you can simply click a
button instead of having to type A, T, or L. You do not have to create a
validation rule to validate typed input.
Users Guide
271
Working with edit styles
Working with edit styles
You work with edit styles in the Database painter, Form painter, and Report
painter.
What you do in the
Database painter
In the Database painter, you can:
•
Create, modify, and delete named edit styles
The edit styles are stored in the extended attribute system tables. Once you
define an edit style, it can be used by any column of the appropriate
datatype in the database.
•
Assign edit styles to columns
These styles are used by default when you place the column in a report in
the Report painter or in a form in the Form painter.
What you do in the
Form and Report
painters
Edit styles and the
extended attribute
system tables
In the Form and Report painters, you can:
•
Accept the default edit style assigned to a column in the Database painter
•
Override the default edit style with another named style stored in the
extended attribute system tables
•
Create an ad hoc, unnamed edit style to use with one specific column
When you have placed a column in a form or report and have given it an edit
style (either the default style from the assignment made in the Database painter
for the column or a style assigned in the Report painter or Form painter),
InfoMaker records the name and definition of the edit style in the form or
report.
However, if the definition of the edit style later changes in the extended
attribute system tables, the edit style for the column in a form or report will not
change automatically. You can update the column by reassigning the edit style
to it in the form or report.
Working with edit styles in the Database painter
Typically, you define edit styles in the Database painter, because edit styles are
properties of the data itself. Once defined in the Database painter, the styles are
used by default each time the column is placed in a report or form.
272
InfoMaker
CHAPTER 8
❖
Displaying and Validating Data
To create a new edit style:
1
In the Database painter, select Object>Insert>Edit Style from the menu
bar.
2
In the Object Details view, select the edit style type from the Style
drop-down list.
3
Specify the properties of the edit style.
For information, see “Defining edit styles” on page 274.
You can use the new edit style with any column of the appropriate datatype
in the database.
❖
To modify an existing edit style:
1
In the Database painter, open the Extended Attributes view.
2
In the Extended Attributes view, open the list of edit styles.
3
Position the pointer on the Edit style you want to modify, display the
pop-up menu, then select Properties.
4
In the Object Details view, modify the edit style as desired and click OK.
For information, see “Defining edit styles” on page 274.
You can use the modified edit style with any column of the appropriate
datatype in the database.
❖
To associate an edit style with a column in the Database painter:
1
In the Database painter (Objects view), position the pointer on the column,
select Properties from the pop-up menu, then select the Edit Style tab in
the Properties view.
2
Select a style for the appropriate datatype from the list in the Style Name
box.
InfoMaker associates the selected edit style with the column in the
extended attribute system tables.
❖
To remove an edit style from a column in the Database painter:
1
In the Database painter (Objects view), position the pointer on the column,
select Properties from the pop-up menu, then select the Edit Style tab in
the Properties view.
2
Select (None) from the list in the Style Name box.
The edit style is no longer associated with the column.
Users Guide
273
Defining edit styles
Working with edit styles in the Form or Report painter
An edit style you assign to a column in the Database painter is used by default
when you place the column in a form or report. You can override the edit style
in the Form or Report painter by choosing another edit style from the extended
attribute system tables or defining an ad hoc style for one specific column.
❖
To specify an edit style for a column:
1
In the Form or Report painter, move the pointer to the column, select
Properties from the column’s pop-up menu, and then select the Edit tab.
2
Select the type of edit style you want from the Style Type drop-down list.
The information in the Edit page changes to be appropriate to the type of
edit style you selected.
3
Do one of the following:
•
Select an edit style from the Style Name list.
•
Create an ad hoc edit style for the column, as described in “Defining
edit styles” next.
Defining edit styles
This section describes how to specify each type of edit style.
The Edit edit style
By default, columns use the Edit edit style, which displays data in an edit
control. You can customize the appearance and behavior of the edit control by
modifying a column’s Edit edit style.
To do so, select Edit in the Style Type drop-down list and specify the properties
for that style:
274
•
To restrict the number of characters you can enter, enter a value in the
Limit box.
•
To convert the case of characters upon display, enter an appropriate value
in the Case box.
InfoMaker
CHAPTER 8
Displaying and Validating Data
•
To have entered values display as asterisks for sensitive data, check the
Password box.
•
To allow you to tab to the column but not change the value, check the
Display Only box.
•
To define a code table to determine which values are displayed and which
values are stored in the database, check the Use Code Table box and enter
display and data values for the code table.
See “Defining a code table” on page 284.
❖
To use the Edit edit style:
1
Select Edit from the Style Type list, if it is not already selected.
2
Select the properties you want.
Date columns and regional settings
Using the Edit edit style, or no edit style, with a date column can cause serious
data entry and validation problems if a user’s computer is set up to use a
nonstandard date style, such as yyyy/dd/mm. For example, if you enter
2001/03/05 in the Retrieval Arguments dialog box for a date column when the
mask is yyyy/dd/mm, the date is interpreted as March 5 instead of May 3. To
ensure that the order of the day and month is interpreted correctly, use an
EditMask edit style.
The DropDownListBox edit style
You can use the DropDownListBox edit style to have columns display as
drop-down lists when you run a form:
Typically, this edit style is used with code tables, where you can specify display
values (which you see) and shorter data values (which are stored in the
database).
In the DropDownListBox edit style, the display values of the code table display
in the ListBox portion of the DropDownListBox. The data values are the values
that are sent to the database when it is updated.
Users Guide
275
Defining edit styles
In the preceding example, when you see the value Business Services, the
corresponding data value could be 200.
❖
To use the DropDownListBox edit style:
1
Select DropDownListBox from the Style Type list.
2
Select the appropriate properties.
3
Enter the value you want to have appear in the Display Value box and the
corresponding data value in the Data Value box.
For more about code tables, see “Defining a code table” on page 284.
The CheckBox edit style
If a column can take only one of two (or perhaps three) values, you might want
to display the column as a check box; you can select or clear the check box to
specify a value. In the following entry from a form, you can simply check or
clear a box to indicate whether an employee has health insurance:
❖
To use the CheckBox edit style:
1
Select CheckBox from the Style Type list and specify properties for that
style.
2
In the Text box, enter the text you want displayed next to the check box.
Using accelerator keys
If the CheckBox has an accelerator key, enter an ampersand (&) before the
letter in the text that represents the accelerator key.
3
In the Data Value For boxes, enter the values you want to store in the
database when the CheckBox is checked (on) or unchecked (off).
If you selected the 3 States box, an optional third state box (other) appears,
for the case when the condition is neither on nor off.
What happens
The value you enter in the Text box becomes the display value, and values
entered for On, Off, and Other become the data values.
When you check or clear the check box to modify the data, InfoMaker enters
the appropriate data value in its buffer. When you save your changes,
InfoMaker sends the corresponding data values to the database.
276
InfoMaker
CHAPTER 8
Centering check
boxes without text
Displaying and Validating Data
You may find it useful to center check boxes used for columns of information.
First make the text control used for the column header and the column control
the same size and left aligned. Then you can center the check boxes and the
column header.
❖
To center check boxes without text:
1
In the Edit property page for the column, make sure the Left Text check
box is not selected and that the Text box where you specify associated text
is empty.
2
In the General property page, specify centering (Alignment>Center) or
specify centering using the StyleBar.
The RadioButtons edit style
If a column can take one of a small number of values, you might want to
display the column as radio buttons:
❖
To use the RadioButtons edit style:
1
Select RadioButtons from the Style Type list and specify properties for
that style.
2
Specify how many radio buttons will display in the Columns Across box.
3
Eenter a set of display and data values for each button you want to display.
The display values you enter become the text of the buttons; the data
values are stored in the database.
Using accelerator keys
To use an accelerator key on a radio button, enter an ampersand (&) in the
Display Value before the letter that will be the accelerator key.
What happens
Users Guide
You select values by clicking a radio button. When you save your changes,
InfoMaker sends the corresponding data values to the database.
277
Defining edit styles
The EditMask edit style
Sometimes you need to enter data that has a fixed format. For example, in
North America phone numbers have a 3-digit area code, followed by three
digits, followed by four digits. You can define an edit mask that specifies the
format to make it easier for you to enter values:
Edit masks consist of special characters that determine what can be entered in
the column. They can also contain punctuation characters to aid you.
For example, to make it easier for you to enter phone numbers in the proper
format, specify this mask:
(###) ###-####
When you insert a row in a form, the punctuation characters display in the box
and the cursor jumps over them as you type:
Special characters
and keywords
Most edit masks use the same special characters as display formats, and there
are special considerations for using numeric, string, date, and time masks. For
information, see “Defining display formats” on page 263.
The special characters you can use in string edit masks are different from those
you can use in string display formats.
Table 8-9: Special characters for string edit masks
Character
Meaning
!
^
Uppercase – displays all characters with letters in uppercase
Lowercase – displays all characters with letters in lowercase
#
a
Number – displays only numbers
Alphanumeric – displays only letters and numbers
X
Any character – displays all characters
If you use the “#” or “a” special characters in a mask, Unicode characters,
spaces, and other characters that are not alphanumeric do not display.
Semicolons invalid in EditMask edit styles
In a display format, you can use semicolons to separate sections in number,
date, time, and string formats. You cannot use semicolons in an EditMask edit
style.
278
InfoMaker
CHAPTER 8
Keyboard behavior
Displaying and Validating Data
Note the following about how certain keystrokes behave in edit masks:
•
Both Backspace and Shift + Backspace delete the preceding character.
•
Delete deletes everything that is selected.
•
Non-numeric edit masks treat any characters that do not match the mask
pattern as delimiters.
Also, note certain behavior in Date edit masks:
•
Entering zero for the day or month causes the next valid date to be entered.
For example, if the edit mask is DD/MM/YY, typing 00/11/01 results in
01/11/01. You can override this behavior in the development
environment by adding the following lines to your IM.INI file:
[Edit Mask Behaviors]
AutocompleteDates=no
•
You cannot use a partial mask, such as dd or mmm, in a date edit mask.
Any mask that does not include any characters representing the year will
be replaced by a mask that does.
•
The strings 00/00/00 or 00/00/0000 are interpreted as the NULL value for
the column.
Using the Mask
pop-up menu
Click the button to the right of the Mask box on the Mask property page to
display a list that contains complete masks that you can click to add to the mask
box, as well as special characters that you can use to construct your own mask.
For example, the menu for a Date edit mask contains complete masks such as
mm/dd/yy and dd/mmm/yyyy. It also has components such as dd and jjj (for a
Julian day). You might use these to construct a mask like dd-mm-yy, typing in
the hyphens as separators.
Using masks with “as
is” characters
You can define a mask that contains “as is” characters that always appear in the
control or column. For example, you might define a numeric mask such as
Rs0000.00 to represent Indian rupees in a currency column.
However, you cannot enter a minus sign to represent negative numbers in a
mask that contains “as is” characters, and the # special character is treated as a
0 character. As a result, if you specify a mask such as ###,##0.00EUR, a value
such as 45,000 Euros would display with a leading zero: 045,000.00EUR. Note
that you must always specify a mask that has enough characters to display all
possible data values. If the mask does not have enough characters, for example
if the mask is #,##0.00 and the value is 45000, the result is unpredictable.
Users Guide
279
Defining edit styles
The preferred method of creating a currency editmask is to use the predefined
[currency(7)] - International mask. You can change the number in
parentheses, which is the number of characters in the mask including two
decimal places. When you use this mask, InfoMaker uses the currency symbol
and format defined in the regional settings section of the Windows control
panel. You can enter negative values in a column that uses a currency mask.
Using spin controls
You can define an edit mask as a spin control, a box that contains up and down
arrows that you can click to cycle through fixed values. For example, you can
set up a code table that provides the valid entries in a column; you simply click
an arrow to select an entry. Used this way, a spin control works like a dropdown list that displays one value at a time:
For more about code tables, see “Defining a code table” on page 284.
❖
To use an EditMask edit style:
1
Select EditMask in the Style Type box if it is not already selected.
2
Define the mask in the Mask box. Click the special characters in the
pop-up menu to use them in the mask. To display the pop-up menu, click
the button to the right of the Mask box.
3
Specify other properties for the edit mask.
When you use your EditMask, check its appearance and behavior. If
characters do not appear as you expect, you might want to change the font
size or the size of the EditMask.
Using a drop-down
calendar
280
You can use a drop-down calendar option on any report column with an
EditMask edit style and a Date, DateTime, or TimeStamp datatype. The
DDCalendar EditMask property allows for separate selections of the calendar
month, year, and date. This option can be set in a check box on the Edit page
of the Report painter Properties view when a column with the EditMask edit
style is selected.
InfoMaker
CHAPTER 8
Displaying and Validating Data
The DropDownDataWindow edit style
Sometimes another data source determines which data is valid for a column.
Consider this situation: the Department table includes two columns, Dept_id
and Dept_name, to record your company’s departments. The Employee table
records your employees. The Department column in the Employee table can
have any of the values in the Dept_id column in the Department table.
As new departments are added to your company, you want the form containing
the Employee table to automatically provide the new departments as choices
when you enter values in the Department column.
In situations such as these, you can specify the DropDownDataWindow edit
style for a column: it is populated from another report. When you go to the
column, the contents of the DropDownDataWindow display, showing the latest
data:
❖
To use the DropDownDataWindow edit style:
1
Create a report that contains the columns in the detail band whose values
you want to use in the column.
You will often choose at least two columns: one column that contains
values that the user sees and another column that contains values to be
stored in the database. In the example above, you would create a report
containing the dept_id and dept_name columns in the Department table.
Assume this report is named d_dddw_dept.
2
For the column in a second DataWindow getting its data from the
d_dddw_dept report, select the DropDownDW edit style.
Users Guide
281
Defining edit styles
In the example, you would specify the DropDownDataWindow edit style
for the dept_id column that you want to display with the department name
as well as the department ID:
What happens
3
Click the browse button next to the DataWindow box and select the report
that contains the data for the column from the list (in the example,
d_dddw_dept). The list includes all the reports in the current library.
4
In the Display Column box, select the column containing the values that
will display in the report or form (in the example, dept_name).
5
In the Data Column box, select the column containing the values that will
be stored in the database (in the example, dept_id).
6
Specify other properties for the edit style.
When you preview a table’s data (or run a form) and data is retrieved, a column
with the DropDownDataWindow edit style is populated, providing data to the
DropDownDataWindow.
When you run a form, go to the column, and drop it down, the entire report
displays. When you select a display value and update the database, the
corresponding data value is stored in the database.
282
InfoMaker
CHAPTER 8
Displaying and Validating Data
Limit on size of data value
The data value for a column that uses the DropDownDataWindow edit style is
limited to 511 characters.
The RichText edit style
You can use the RichText edit style to display column data in a rich text format,
and to use different fonts and colors in the same data field.
Columns that you format with the RichText edit style require considerably
more storage space than columns with plain text edit styles. Therefore you
should set a minimum of 1 KB for the column width. Otherwise, you can use
the RichText edit style with columns that have large text datatypes.
By default, whenever a column with the RichText edit style is edited in the
Preview view or at runtime, a font toolbar displays. The font toolbar disappears
when the column loses focus. The following picture shows the default font
toolbar available for columns with the RichText edit style:
You can modify the RichTextToolbarActivation constant on a report to display
the font toolbar whenever a report containing columns with the RichText edit
style has focus—whether or not this type of column is selected. You can also
modify the constant so that the font toolbar never appears.
For more information, see RichTextToolbarActivation in the online Help.
The RichText edit style is not available for columns in a report with the Graph,
OLE, or RichText presentation styles.
The InkEdit edit style
The InkEdit edit style is designed for use on a Tablet PC and provides the
ability to capture ink input from users of Tablet PCs. This edit style is useful in
the Form painter in InfoMaker.
You can specify InkEdit as a style type on the Edit page in the Properties view
for columns. When the column gets focus, an InkEdit control displays so that
the user can enter text with the stylus or mouse. The text is recognized and
displayed, then sent back to the database when the column loses focus.
Users Guide
283
Defining a code table
The InkEdit edit style is fully functional on Tablet PCs. On other computers, it
behaves like the Edit edit style.
For more information about ink controls and the Tablet PC, and to download
the Tablet PC SDK, go to the Microsoft Tablet PC Web site at
http://msdn.microsoft.com/en-us/library/ms950406.aspx.
Defining a code table
To reduce storage needs, frequently you might want to store short, encoded
values in the database, but these encoded values might not be meaningful to
users. To make reports and forms easy to use, you can define code tables.
Each row in a code table is a pair of corresponding values: a display value and
a data value. The display values are those you see in a report and in a form. The
data values are those that are saved in the database.
Limit on size of data value
The data value you specify for the Checkbox, DropDownListBox, Edit,
EditMask, and RadioButtons edit styles is limited to 255 characters.
How code tables are implemented
You can define a code table as a property of the following column edit styles:
Edit
DropDownListBox
RadioButtons
DropDownDataWindow
EditMask, using spin control
The steps to specify the code table property for each edit style are similar: you
begin by defining a new edit style in the Database painter. Once you select an
edit style, use the specific procedure that follows to define the code table
property.
For how to create an edit style, see “About edit styles” on page 270.
284
InfoMaker
CHAPTER 8
Displaying and Validating Data
Allowing null values
An internal InfoMaker code, NULL!, indicates null values are allowed. To use
this code, specify NULL! as the data value, then specify a display format for
nulls for the column.
❖
To define a code table as a property of the Edit edit style:
1
Select the Use Code Table check box.
2
Enter the display and data values for the code table.
3
If you want to restrict input in the column to values in the code table, select
the Validate check box.
For more information, see “Validating user input” on page 286.
❖
To define a code table as a property of the DropDownListBox edit style:
1
Enter the display and data values for the code table.
2
If you want to restrict input in the column to values in the code table, clear
the Allow Editing check box.
For more information, see “Validating user input” on page 286.
❖
To define a code table as a property of the RadioButtons edit style:
•
❖
❖
Users Guide
Enter the display and data values for the code table.
To define a code table as a property of the DropDownDataWindow edit
style:
1
Specify the column that provides the display values in the Display Column
box.
2
Specify the column that provides the data values in the Data Column box.
3
If you want to restrict input in the column to values in the code table, clear
the Allow Editing check box.
To define a code table as a property of the EditMask edit style:
1
Select the Spin Control check box.
2
Select the Code Table check box.
3
Enter the display and data values for the code table.
285
Defining a code table
How code tables are processed
When data is retrieved into a report or form column with a code table,
processing begins at the top of the data value column. If the data matches a data
value, the corresponding display value displays. If there is no match, the actual
value displays.
Consider the example in Table 8-10.
Table 8-10: Data values and display values
Display values
Data values
Massachusetts
Massachusetts
MA
ma
ma
Mass
MA
MA
Rhode Island
RI
RI
RI
If the data is MA or ma, the corresponding display value (Massachusetts)
displays. If the data is Ma, there is no match, so Ma displays.
Case sensitivity
Code table processing is case sensitive.
If the code table is in a DropDownListBox edit style, and if the column has a
code table that contains duplicate display values, then each value displays only
once. Therefore, if this code table is defined for a column in a form that has a
DropDownListBox edit style, Massachusetts and Rhode Island display in the
ListBox portion of the DropDownListBox.
Validating user input
When you enter data into a column in a form, processing begins at the top of
the display value column of the associated code table.
If the data matches a display value, the corresponding data value is put in the
internal buffer. For each display value, the first data value is used. Using the
sample code table, if you enter Massachusetts, ma, or Mass, the data value is
MA.
You can specify that only the values in the code table are acceptable:
•
286
For a column using the Edit edit style, select the Validate check box.
InfoMaker
CHAPTER 8
•
Displaying and Validating Data
For the DropDownListBox and DropDownDataWindow edit styles, clear
the Allow Editing check box: you cannot type a value.
Although users cannot type a value when Allow Editing is false, they can
search for a row in the drop-down list or DataWindow by typing in the
initial character for the row display value. The search is case sensitive. For
the DropDownDataWindow edit style, the initial character for a search
cannot be an asterisk or a question mark. This restriction does not apply to
the DropDownListBox edit style.
Code table data
The data values in the code table must pass validation for the column and must
have the same datatype as the column.
About validation rules
When you enter data in a form, you want to be sure the data is valid before
using it to update the database. Validation rules provide one way to do this.
You usually define validation rules in the Database painter. To use a validation
rule, you associate it with a column in the Database painter or Report painter.
InfoMaker uses validation rules when you enter data:
•
Directly in the database using the Database painter
•
In a form
Another technique
You can also perform data validation through code tables, which are
implemented through a column’s edit style.
For more information, see “About edit styles” on page 270.
Users Guide
287
Working with validation rules
Understanding validation rules
Validation rules are criteria that a form uses to validate data entered into a
column. They are InfoMaker-specific and therefore not enforced by the
DBMS. Validation rules apply to forms (which support updating) but not to
reports.
Validation rules assigned in the Database painter are used by default when you
place columns in a form. You can override the default rules in the Report
painter.
A validation rule is an expression that evaluates to either “true” or “false”. If
the expression evaluates to “true” for an entry into a column, InfoMaker
accepts the entry. If the expression evaluates to “false”, the entry is not
accepted and an error message is displayed. You can customize the message
displayed when a value is rejected.
Working with validation rules
You work with validation rules in the Database painter and Report painter.
What you do in the
Database painter
In the Database painter, you can:
•
Create, modify, and delete named validation rules
The validation rules are stored in the extended attribute system tables.
Once you define a validation rule, it can be used by any column of the
appropriate datatype in the database.
•
Assign validation rules to columns and remove them from columns
These rules are used by default when you place the column in a form in the
Report painter.
What you do in the
Form painter
Validation rules and
the extended attribute
system tables
In the Form painter, you can:
•
Accept the validation rule assigned to a column in the Database painter
•
Create an ad hoc, unnamed rule to use with one specific column
Once you have placed a column that has a validation rule from the extended
attribute system tables in a form, there is no longer any link to the named rule
in the extended attribute system tables.
If the definition of the validation rule later changes in the extended attribute
system tables, the rule for the column in a form will not change.
288
InfoMaker
CHAPTER 8
Displaying and Validating Data
Defining validation rules
Typically, you define validation rules in the Database painter, because
validation rules are properties of the data itself. Once defined in the Database
painter, the rules are used by default each time the column is placed in a form.
You can also define a validation rule in the Report painter that overrides the
rule defined in the Database painter.
Defining a validation rule in the Database painter
This section describes the ways you can manipulate validation rules in the
Database painter.
❖
To create a new validation rule
1
In the Extended Attributes view in the Database painter, right-click
Validation Rules and select New from the pop-up menu.
The Validation Rule view displays in the Properties view.
2
Assign a name to the rule, select the datatype of the columns to which it
applies, and customize the error message (if desired).
For information, see “Customizing the error message” on page 291.
3
Click the Definition tab and define the expression for the rule.
For information, see “Defining the expression” on page 290.
You can use this rule with any column of the appropriate datatype in the
database.
Users Guide
289
Defining validation rules
❖
To modify a validation rule:
1
In the Database painter, open the Extended Attributes view.
2
In the Extended Attributes view, open the list of validation rules.
3
Double-click the validation rule you want to modify.
4
In the Validation Rule view, modify the validation rule as desired.
For information, see “Defining the expression” on page 290 and
“Customizing the error message” on page 291.
❖
To associate a validation rule with a column in the Database painter:
1
In the Database painter (Objects view), position the pointer on the column,
select Properties from the column’s pop-up menu, and select the
Validation tab.
2
Select a validation rule from the Validation Rule drop-down list.
The column now has the selected validation rule associated with it in the
extended attribute system tables. Whenever you use this column in a form,
it will use this validation rule unless you override it in the Form painter.
❖
To remove a validation rule from a column in the Database painter:
1
In the Database painter (Objects view), position the pointer on the column,
select Properties from its pop-up menu, and select the Validation tab in the
Properties view.
2
Select (None) from the list in the Validation Rule drop-down list.
The validation rule is no longer associated with the column.
Defining the expression
A validation rule is a boolean expression. InfoMaker applies the boolean
expression to an entered value. If the expression returns “true”, the value is
accepted. Otherwise, the value is not accepted and an error message displays.
What expressions can
contain
You can use any valid InfoMaker expression in validation rules.
Validation rules can include most InfoMaker expression functions. InfoMaker
expression functions are displayed in the Functions list and can be pasted into
the definition.
For information about these functions, see Chapter 24, “DataWindow
Expression and InfoMaker Functions.”
290
InfoMaker
CHAPTER 8
Displaying and Validating Data
Use the notation @placeholder (where placeholder is any group of characters)
to indicate the current column in the rule. When you define a validation rule in
the Database painter, InfoMaker stores it in the extended attribute system
tables with the placeholder name. At runtime, InfoMaker substitutes the value
of the column for placeholder.
Pasting the
placeholder
The @col can be easily used as the placeholder. A button in the Paste area is
labeled with @col. You can click the button to paste the @col into the
validation rule.
An example
For example, to make sure that both Age and Salary are greater than zero using
a single validation rule, define the validation rule as follows:
@col > 0
Then associate the validation rule with both the Age and Salary columns. At
runtime, InfoMaker substitutes the appropriate values for the column data
when the rule is applied.
Using match values for character columns
If you are defining the validation rule for a character column, you can use the
Match button on the Definition page of the Validation Rule view. This button
lets you define a match pattern for matching the contents of a column to a
specified text pattern (for example, ^[0-9]+$ for all numbers and ^[A-Za-z]+$
for all letters).
❖
To specify a match pattern for character columns:
1
Click the Match button on the Definition page of the Validation Rule view.
The Match Pattern dialog box displays.
2
Enter the text pattern you want to match the column to, or select a
displayed pattern.
3
(Optional) Enter a test value and click the Test button to test the pattern.
4
Click OK when you are satisfied that the pattern is correct.
For more on the Match function and text patterns, see Chapter 24,
“DataWindow Expression and InfoMaker Functions.”
Customizing the error message
When you define a validation rule, InfoMaker automatically creates the error
message that displays by default when you enter an invalid value:
Users Guide
291
Defining validation rules
'Item ~'' + @Col + '~' does not pass validation test.'
You can edit the string expression to create a custom error message.
Different syntax in the
Report painter
If you are working in the Report painter, you can enter a string expression for
the message, but you do not use the @ sign for placeholders. For example, this
is the default message:
'Item ~'' + ColumnName + '~' does not pass validation test.'
A validation rule for the Salary column in the Employee table might have the
following custom error message associated with it:
Please enter a salary greater than $10,000.
If you enter a salary less than or equal to $10,000, the custom error message
displays.
Specifying initial values
As part of defining a validation rule, you can supply an initial value for a
column.
❖
To specify an initial value for a column in the Database painter:
1
Select Properties from the column’s pop-up menu and select the Validation
tab.
2
Specify a value in the Initial Value box.
Defining a validation rule in the Form painter
Validation rules you assign to a column in the Database painter are used by
default when you place the column in a form. You can override the validation
rule in the Report painter by defining an ad hoc rule for one specific column.
❖
292
To specify a validation rule for a column in the Form painter:
1
In the Form painter, select Properties from the column’s pop-up menu,
then select the Validation tab in the Properties view.
2
Create or modify the validation expression, as described next. To help you
work on the expression, you can use the button to the right of the
Validation expression box to display the Modify Expression dialog box.
InfoMaker
CHAPTER 8
3
Displaying and Validating Data
(Optional) Enter a string or string expression to customize the validation
error message.
For more information, see “Customizing the error message” on page 291.
Specifying the expression
Since a user might have just entered a value in the column, validation rules
refer to the current data value, which you can obtain through the GetText
InfoMaker expression function.
Using GetText ensures that the most recent data entered in the current column
is evaluated.
InfoMaker does the conversion for you
If you have associated a validation rule for a column in the Database painter,
InfoMaker automatically converts the syntax to use GetText when you place the
column in a form.
GetText returns a string. Be sure to use a data conversion function (such as
Integer or Real) if you want to compare the entered value with a datatype other
than string.
For more on the GetText function and text patterns, see Chapter 24,
“DataWindow Expression and InfoMaker Functions.”
Referring to other
columns
You can refer to the values in other columns by specifying their names in the
validation rule. You can paste the column names in the rule using the Columns
box.
Examples
Here are some examples of validation rules.
Example 1 To check that the data entered in the current column is a positive
integer, use this validation rule:
Integer(GetText( )) > 0
Example 2 If the current column contains the discounted price and the
column named Full_Price contains the full price, you could use the following
validation rule to evaluate the contents of the column using the Full_Price
column:
Match(GetText( ),"^[0-9]+$") AND
Real(GetText( )) < Full_Price
Users Guide
293
How to maintain extended attributes
To pass the validation rule, the data must be all digits (must match the text
pattern ^[0-9]+$) and must be less than the amount in the Full_Price column.
Notice that to compare the numeric value in the column with the numeric value
in the Full_Price column, the Real function was used to convert the text to a
number.
In your company, a product price and a sales commission are
related in the following way:
Example 3
•
If the price is greater than or equal to $1000, the commission is between
10 percent and 20 percent
•
If the price is less than $1000, the commission is between 4 percent and 9
percent
The Sales table has two columns, Price and Commission. The validation rule for
the Commission column is:
(Number(GetText( )) >= If(price >= 1000, .10, .04))
AND
(Number(GetText( )) <= If(price >= 1000, .20, .09))
A customized error message for the Commission column is:
"Price is " + if(price >= 1000,
"greater than or equal to","less than") +
" 1000. Commission must be between " +
If(price >= 1000,".10", ".04") + " and " +
If(price >= 1000, ".20.", ".09.")
How to maintain extended attributes
InfoMaker provides facilities you can use to create, modify, and delete display
formats, edit styles, and validation rules independently of their association with
columns. The following procedure summarizes how you do this.
❖
To maintain display formats, edit styles, and validation rules:
1
Open the Database painter.
2
Select View>Extended Attributes.
The Extended Attributes view displays listing all the entities in the
extended attribute system tables.
294
InfoMaker
CHAPTER 8
3
Displaying and Validating Data
Do one of the following:
•
To create a new entity, display the pop-up menu for the type you want
to add, then select New.
•
To modify an entity, display its pop-up menu, then select Properties.
•
To delete an entity, display its pop-up menu, then select Delete.
Caution
If you delete a display format, edit style, or validation rule, it is removed
from the extended attribute system tables. Columns in the database are no
longer associated with the entity.
Users Guide
295
How to maintain extended attributes
296
InfoMaker
CH A PTE R
9
About this chapter
Filtering, Sorting, and Grouping
Rows
This chapter describes how you can customize your report by doing the
following in the Report painter:
•
Defining filters to limit which of the retrieved rows are displayed in
the report
•
Sorting rows after they have been retrieved from the database
•
Displaying the rows in groups and calculating statistics on each group
Contents
Topic
Filtering rows
Page
297
Sorting rows
Grouping rows
299
302
Filtering rows
You can use WHERE and HAVING clauses and retrieval arguments in the
SQL SELECT statement for the report to limit the data that is retrieved
from the database. This reduces retrieval time and space requirements at
runtime.
However, you may want to further limit the data that displays in the report.
For example, you might want to:
Users Guide
•
Retrieve many rows and initially display only a subset
•
Limit the data that is displayed using InfoMaker expression functions
(such as If) that are not valid in the SELECT statement
297
Filtering rows
Using filters
In the Report painter, you can define filters to limit the rows that display at
runtime. Filters can use most InfoMaker expression functions.
Filters do not affect which rows are retrieved
A filter operates against the retrieved data. It does not re-execute the SELECT
statement.
Defining a filter
❖
To define a filter:
1
In the Report painter, select Rows>Filter from the menu bar.
The Specify Filter dialog box displays:
2
In the Specify Filter dialog box, enter a boolean expression that InfoMaker
will test against each retrieved row.
If the expression evaluates to true, the row is displayed. You can specify
any valid expression in a filter. You can paste commonly used functions,
names of columns, computed fields, retrieval arguments, and operators
into the filter.
International considerations
The formatting that you enter for numbers and currency in filter
expressions display the same way in any country. Changing the regional
settings of the operating system does not modify the formatting displayed
for numbers and currency at runtime.
3
298
(Optional) Click Verify to make sure the expression is valid.
InfoMaker
CHAPTER 9
4
Filtering, Sorting, and Grouping Rows
Click OK.
Only rows meeting the filter criteria are displayed in the Preview view.
Filtered rows and updates
Modifications of filtered rows are applied to the database when you issue
an update request.
Removing a filter
❖
Examples of filters
To remove a filter:
1
Select Rows>Filter from the menu bar.
2
Delete the filter expression from the Specify Filter dialog box, then click
OK.
Assume that a report retrieves employee rows and three of the columns are
Salary, Status, and Emp_Lname. Table 9-1 shows some examples of filters you
might use.
Table 9-1: Sample filters
To display these rows
Employees with salaries over $50,000
Use this filter
Active employees
Active employees with salaries over
$50,000
Employees whose last names begin
with H
Status = 'A'
Salary > 50000
Salary > 50000 AND Status = 'A'
left(Emp_Lname, 1) = 'H'
Sorting rows
You can use an ORDER BY clause in the SQL SELECT statement for the report
to sort the data that is retrieved from the database. If you do this, the DBMS
itself does the sorting and the rows are brought into InfoMaker already sorted.
However, you might want to sort the rows after they are retrieved. For example,
you might want to:
Users Guide
•
Offload the processing from the DBMS
•
Sort on an expression, which might not be allowed in the SELECT
statement but is allowed in InfoMaker
299
Sorting rows
❖
To sort the rows:
1
Select Rows>Sort from the menu bar.
2
Drag to the Columns box the columns on which you want to sort the rows,
and specify whether you want to sort in ascending or descending order.
The order of the columns determines the precedence of the sort. To reorder
the columns, drag them up or down in the list. To delete a column from the
sort columns list, drag the column outside the dialog box.
3
You can also specify expressions to sort on: for example, if you have two
columns, Revenues and Expenses, you can sort on the expression
Revenues – Expenses.
To specify an expression to sort on, double-click a column name in the
Columns box, modify the expression in the Modify Expression dialog box,
and click OK.
You return to the Specify Sort Columns dialog box with the expression
displayed.
If you change your mind
You can remove a column or expression from the sorting specification by
simply dragging it and releasing it outside the Columns box.
4
300
Click OK when you have specified all the sort columns and expressions.
InfoMaker
CHAPTER 9
Filtering, Sorting, and Grouping Rows
Suppressing repeating values
When you sort on a column, there might be several rows with the same value
in one column. You can choose to suppress the repeating values in that column.
When you suppress a repeating value, the value displays at the start of each
new page and, if you are using groups, each time a value changes in a higher
group.
For example, if you have sorted employees by department ID, you can suppress
all but the first occurrence of each department ID in the report:
❖
To suppress repeating values:
1
Select Rows>Suppress Repeating Values from the menu bar.
The Specify Repeating Value Suppression List dialog box displays:
2
Users Guide
Drag the columns whose repeated values you want to suppress from the
Source Data box to the Suppression List box, and click OK.
301
Grouping rows
If you change your mind
You can remove a column from the suppression list simply by dragging it
and releasing it outside the Suppression List box.
Grouping rows
You can group related rows together and, optionally, calculate statistics for
each group separately. For example, you might want to group employee
information by department and get total salaries for each department.
How groups are
defined
Each group is defined by one or more report columns. Each time the value in a
grouping column changes, a break occurs and a new section begins.
For each group, you can:
Grouping example
302
•
Display the rows in each section
•
Specify the information you want to display at the beginning and end of
each section
•
Specify page breaks after each break in the data
•
Reset the page number after each break
The following report retrieves employee information. It has one group defined,
Dept_ID, so it groups rows into sections according to the value in the Dept_ID
column. In addition, it displays:
•
Department ID before the first row for that department
•
Totals and averages for salary and salary plus benefits (a computed
column) for each department
•
Grand totals for the company at the end
InfoMaker
CHAPTER 9
Filtering, Sorting, and Grouping Rows
The following screenshot shows the report.
How to do it
Users Guide
You can create a grouped report in three ways:
•
Use the Group presentation style to create a grouped report from scratch
(“Using the Group presentation style” next).
•
Take an existing tabular report and define grouping (“Defining groups in
an existing report” on page 307).
•
Use the TreeView presentation style (Chapter 15, “Working with
TreeViews”).
303
Grouping rows
Using the Group presentation style
One of the report presentation styles, Group, is a shortcut to creating a grouped
report. It generates a tabular report that has one group level and some other
grouping properties defined. You can then further customize the report.
❖
To create a basic grouped report using the Group presentation style:
1
Select File>New from the menu bar.
The New dialog box displays.
2
Choose the Object tab page and the Group presentation style, and click
OK.
3
Choose a data source and define the data.
You are prompted to define the grouping column(s).
4
Drag the column(s) you want to group on from the Source Data box to the
Columns box.
Multiple columns and multiple group levels
You can specify more than one column, but all columns apply to group
level one. You can define one group level at this point. Later you can
define additional group levels.
In the following example, grouping will be by department, as specified by
the dept_id column:
If you want to use an expression, you can define it when you have
completed the wizard. See “Using an expression for a group” on page 306.
304
InfoMaker
CHAPTER 9
5
Filtering, Sorting, and Grouping Rows
Click Next.
InfoMaker suggests a header based on your data source. For example, if
your data comes from the Employee table, InfoMaker uses the name
Employee in the suggested header.
6
Specify the Page Header text.
7
If you want a page break each time a grouping value changes, select the
New Page On Group Break box.
8
If you want page numbering to restart at 1 each time a grouping value
changes, select the Reset Page Number On Group Break box and the New
Page On Group Break box.
9
Click Next.
10 Select Color and Border settings and click Next.
11 Review your specification and click Finish.
The report displays with the basic grouping properties set.
This is an example of a Group style report:
What InfoMaker does
Users Guide
As a result of your specifications, InfoMaker generates a tabular report and:
•
Creates group header and trailer bands
•
Places the column you chose as the grouping column in the group header
band
•
Sorts the rows by the grouping column
305
Grouping rows
•
Places the page header and the date (as a computed field) in the header
band
•
Places the page number and page count (as computed fields) in the footer
band
•
Creates sum-computed fields for all numeric columns (the fields are
placed in the group trailer and summary bands)
Here is the preceding report in the Preview view:
Using an expression
for a group
If you want to use an expression for one or more column names in a group, you
can enter an expression as the Group Definition on the General page in the
Properties view after you have finished using the Group wizard.
❖
To use an expression for a group:
1
Open the Properties view and select the group header band in the Design
view.
2
Click the ellipsis button next to the Group Definition box on the General
page to open the Specify Group Columns dialog box.
3
In the Columns box, double-click the column that you want to use in an
expression.
The Modify Expression dialog box opens. You can specify more than one
grouping item expression for a group. A break occurs whenever the value
concatenated from each column/expression changes.
306
InfoMaker
CHAPTER 9
What you can do
Filtering, Sorting, and Grouping Rows
You can use any of the techniques available in a tabular report to modify and
enhance the grouped report, such as moving controls, specifying display
formats, and so on. In particular, see “Defining groups in an existing report”
next to learn more about the bands in a grouped report and how to add features
especially suited for grouped reports (for example, add a second group level,
define additional summary statistics, and so on).
Defining groups in an existing report
Instead of using the Group presentation style to create a grouped report from
scratch, you can take an existing tabular report and define groups in it.
❖
To add grouping to an existing report:
1
Start with a tabular report that retrieves all the columns you need.
2
Specify the grouping columns.
3
Sort the rows.
4
(Optional) Rearrange the report.
5
(Optional) Add summary statistics.
6
(Optional) Sort the groups.
Steps 2 through 6 are described next.
Specifying the grouping columns
❖
To specify the grouping columns:
1
In the Report painter, Select Rows>Create Group from the menu bar.
The Specify Group Columns dialog box displays.
Creating subgroups
Users Guide
2
Specify the group columns, as described in “Using the Group presentation
style” on page 304.
3
Set the Reset Page Count and New Page on Group Break properties on the
General page in the Properties view.
After defining your first group, you can define subgroups, which are groups
within the group you just defined.
307
Grouping rows
❖
To define subgroups:
1
Select Rows>Create Group from the menu bar and specify the
column/expression for the subgroup.
2
Repeat step 1 to define additional subgroups if you want.
You can specify as many levels of grouping as you need.
How groups are
identified
InfoMaker assigns each group a number (or level) when you create the group.
The first group you specify becomes group 1, the primary group. The second
group becomes group 2, a subgroup within group 1, and so on.
For example, suppose you define two groups. The first group uses the dept_id
column and the second group uses the status column.
The rows are grouped first by department (group 1). Within department, rows
are grouped by status (group 2). If you specify page breaks for the groups, a
page break will occur when any of these values changes.
You use the group’s number to identify it when defining summary statistics for
the group. This is described in “Adding summary statistics” on page 310.
Sorting the rows
InfoMaker does not sort the data when it creates a group. Therefore, if the data
source is not sorted, you must sort the data by the same columns (or
expressions) specified for the groups.
For example, if you are grouping by dept_id then status, select Rows>Sort from
the menu bar and specify dept_id and then status as sorting columns:
You can also sort on additional rows. For example, if you want to sort by
employee ID within each group, specify emp_id as the third sorting column.
For more information about sorting, see “Sorting rows” on page 299.
308
InfoMaker
CHAPTER 9
Filtering, Sorting, and Grouping Rows
Rearranging the report
When you create a group, InfoMaker creates two new bands for each group:
•
A group header band
•
A group trailer band
The bar identifying the band contains:
•
The number of the group
•
The name of the band
•
The name of each column that defines the group
•
An arrow pointing to the band
You can include any control in the report (such as columns, text, and computed
fields) in the header and trailer bands of a group.
Using the group
header band
The contents of the group header band display at the top of each page and after
each break in the data.
Typically, you use this band to identify each group. You might move the
grouping column from the detail band to the group header band, since it now
serves to identify one group rather than each row.
For example, if you group the rows by department and include the department
in the group header, the department will display before the first line of data
each time the department changes.
Users Guide
309
Grouping rows
At runtime, you see this:
Suppressing group
headers
If you do not want a group header to display at the top of each page when you
print or display a report, select the Suppress Group Header check box on the
General property page for the header. If none of the headers are suppressed,
they all display at the top of each page. When a page break coincides with a
group break, the group header and any group headers that follow it display
even if the Suppress Group Header property is set, but higher level headers are
suppressed if the property is set for those headers.
For example, suppose a report has three groups: division, sales region, and
sales manager. If all three group headers are suppressed, and a sales region
group break coincides with a page break, the division header is suppressed but
the sales region and sales manager headers display.
Using the group trailer
band
The contents of the group trailer display after the last row for each value that
causes a break.
In the group trailer band, you specify the information you want displayed after
the last line of identical data for each value in the group. Typically, you include
summary statistics here, as described next.
Adding summary statistics
One of the advantages of creating a grouped report is that you can have
InfoMaker calculate statistics for each group. To do that, you place computed
fields that reference the group. Typically, you place these computed fields in
the group’s trailer band.
❖
310
To add a summary statistic:
1
Select Insert>Control>Computed Field from the menu bar.
2
Click in the Design view where you want the statistic.
InfoMaker
CHAPTER 9
Filtering, Sorting, and Grouping Rows
The Modify Expression dialog box displays.
3
Specify the expression that defines the computed field (see below).
4
Click OK.
A shortcut to sum values
If you want to sum a numeric column, select the column in Design view and
click the Sum button in the Controls drop-down toolbar. InfoMaker
automatically places a computed field in the appropriate band.
Specifying the
expression
Typically, you use aggregate and other functions in your summary statistic.
InfoMaker lists functions you can use in the Functions box in the Modify
Expression dialog box. When you are defining a computed field in a group
header or trailer band, InfoMaker automatically lists forms of the functions that
reference the group:
You can paste these templates into the expression, then replace the #x that is
pasted in as the function argument with the appropriate column or expression.
For example, to count the employees in each department (group 1), specify this
expression in the group trailer band:
Count( Emp_Id for group 1 )
To get the average salary of employees in a department, specify:
Avg( Salary for group 1 )
To get the total salary of employees in a department, specify:
Sum( Salary for group 1 )
Users Guide
311
Grouping rows
The group trailer band in this example shows the average and total salary for
the group.
At runtime, the average and total salaries are calculated and displayed:
Sorting the groups
You can sort the groups in a report. For example, in a report showing employee
information grouped by department, you might want to sort the departments
(the groups) by total salary.
Typically, this involves aggregate functions, as described in “Adding summary
statistics” on page 310. In the department salary example, you would sort the
groups using the aggregate function Sum to calculate total salary in each
department.
❖
312
To sort the groups:
1
Place the mouse pointer on the group header bar (not inside the band) until
the pointer becomes a double-headed arrow.
2
Click.
InfoMaker
CHAPTER 9
Filtering, Sorting, and Grouping Rows
The General property page for the group displays in the Properties view.
3
Click the ellipsis button next to the Group Sort property.
The Specify Sort Columns dialog box displays.
4
Drag the column you want to sort the groups by from the Source Data box
into the Columns box.
If you chose a numeric column, InfoMaker uses the Sum function in the
expression; if you chose a non-numeric column, InfoMaker uses the Count
function.
For example, if you chose the Salary column, InfoMaker specifies that the
groups will be sorted by the expression sum(salary for group 1):
5
Select ascending or descending sort as appropriate.
6
If you want to modify the expression to sort on, double-click the column
in the Columns box.
The Modify Expression dialog box displays.
Users Guide
313
Grouping rows
7
Specify the expression to sort on.
For example, to sort the department group (the first group level) on
average salary, specify avg(salary for group 1).
8
Click OK.
You return to the Specify Sort Columns dialog box with the expression
displayed.
9
Click OK again.
At runtime, the groups will be sorted on the expression you specified.
314
InfoMaker
CH A PTE R
About this chapter
Contents
1 0
Highlighting Information in
Reports and Forms
This chapter describes how you modify the way information displays in
reports and forms based on the conditions you specify. The conditions are
usually related to data values, which are not available until runtime.
Topic
Highlighting information
Page
315
Modifying properties conditionally at runtime
Supplying property values
319
325
Specifying colors
343
Highlighting information
Every control in a report has a set of properties that determines what the
control looks like and where it is located. For example, the values in a
column of data display in a particular font and color, in a particular
location, with or without a border, and so on.
Everything in this chapter applies to both reports and forms
Most of the discussions in this chapter focus on reports and the Report
painter. The techniques described also apply to forms and the Form
painter.
Modifying properties when designing
You define the appearance and behavior of controls in reports in the
Report painter. As you do that, you are specifying the controls’ properties.
For example, when you place a border around a column, you are setting
that column’s Border property.
Users Guide
315
Highlighting information
In most cases, the appearance and behavior of controls is fixed; you do not
want them to change at runtime. When you make headings bold when
designing them, you want them to be bold at all times.
In the following report, the Salary Plus Benefits column has a Shadow box
border around every data value in the column. To display the border, you set
the border property for the column:
Modifying properties at runtime
In some cases, however, you might want some properties of controls in reports
to be driven by the data, which is not known when you are defining the report
in the painter. For these situations you can define property conditional
expressions, which are expressions that are evaluated at runtime.
You can use these expressions to conditionally and dynamically modify the
appearance and behavior of your report at runtime. The results of the
expressions set the values of properties of controls in the report.
316
InfoMaker
CHAPTER 10
Highlighting Information in Reports and Forms
In the following report, the Salary Plus Benefits column has a Shadow box
border highlighting each data value that is greater than $60,000:
To control the display of the border, you define a property conditional
expression for the column’s Border property. When you run the report,
InfoMaker changes the border of individual data values based on the condition
(value greater than $60,000).
Defining an
expression
The following illustration shows the Salary_Plus_Benefits column selected in
the Design view. To the right of the Design view, the Properties view shows
properties for the column, including the Border property. Next to the Border
property is a button for accessing the dialog box where you enter the
expression. The button displays an equals sign with a slash through it when no
expression has been entered, and an equals sign without a slash when it has.
In this example the Border property is set to NoBorder in the Properties view.
However, the expression defined for the property overrides that setting at
runtime.
Users Guide
317
Highlighting information
A closer look at the
expression
The expression you enter almost always begins with If. Then you specify three
things: the condition, what happens if it is true, and what happens if it is false.
Parentheses surround the three things and commas separate them:
If( expression, true, false )
The following expression is used in the example. Because the expression is for
the Border property, the values for true and false indicate particular borders.
The value 1 means Shadow box border and the value 0 means no border:
If(salary_plus_benefits > 60000, 1, 0)
When you run the report, InfoMaker checks the value in the computed column
called salary_plus_benefits to see if it is greater than 60,000. If it is (true),
InfoMaker displays the value with the Shadow box border. If not (false),
InfoMaker displays the value with no border.
About specifying
properties
Usually you specify a number to indicate what you want for a particular
property. For example, the following list shows all of the borders you can
specify and the numbers you use. If you want the border property to be Shadow
box, you specify 1 in the If statement, for either true or false.
0—None
1—Shadow box
2—Box
3—Resize
4—Underline
5—3D Lowered
6—3D Raised
In the Properties view, the list of choices for setting a property includes the
values that correspond to choices in parentheses. This makes it easier to define
an expression for a property; you do not need to look up the values. For
example, if you want to specify the ResizeBorder in your expression, you use
the number 3, as shown in the drop-down list.
For details on the values of properties that can be set using expressions, see
“Supplying property values” on page 325.
318
InfoMaker
CHAPTER 10
Highlighting Information in Reports and Forms
Modifying properties conditionally at runtime
“Modifying properties at runtime” on page 316 described how you can use
conditional expressions that are evaluated at runtime to highlight information
in a form or a report. This section presents a procedure for modifying
properties at runtime and some examples.
❖
To modify properties conditionally at runtime:
1
Position the pointer on the control, band, or report background whose
properties you want to modify at runtime.
2
Select Properties from the pop-up menu, then select the page that contains
the property you want to modify at runtime.
3
Click the button next to the property you want to change.
4
Scroll the list of functions in the Functions box until you see the IF
function, and then select it:
5
Replace the b (boolean) with your condition (for example, salary>40000).
You can select columns and functions and use the buttons to add the
symbols shown on them.
6
Replace the t (true) with the value to use for the property if the condition
is true.
Values to use for properties are usually numbers. They are different for
each property. For more information about property values that can be set
on the Expressions page, see “Supplying property values” on page 325.
Users Guide
319
Modifying properties conditionally at runtime
Set Font.Weight property to 700 for bold
Font properties such as Italic, Strikethrough, and Underline take a boolean
value, but to specify a value for bold, you use the Font.Weight property,
which takes a range of values. For values and an example, see
“Font.Weight” on page 335.
7
Replace the f (false) with the value to use for the property if the condition
is false.
8
Click OK.
For examples, see “Example 1: creating a gray bar effect” next, “Example 2:
rotating controls” on page 321, “Example 3: highlighting rows of data” on
page 322, and “Example 4: changing the size and location of controls” on page
324.
Example 1: creating a gray bar effect
The following report shows alternate rows with a light gray bar. The gray bars
make it easier to track data values across the row:
To create the gray bar effect:
1
Add a rectangle control to the detail band and size it so that it surrounds
the controls you want highlighted.
To make sure that you have selected the detail band, select the Position tab
in the Properties view and select Band from the Layer drop-down list.
2
320
To make it easier to see what you are doing in the Design view, select the
General tab and set the Brush Color to White and the Pen Color to Black.
A narrow black line forms a boundary around the rectangle.
InfoMaker
CHAPTER 10
Highlighting Information in Reports and Forms
3
Select Send to Back from the rectangle’s pop-up menu.
4
To hide the border of the rectangle, set the Pen Style to No Visible Line.
5
Click the button next to the Brush Color property on the General page.
6
In the Modify Expression dialog box, enter the following expression for
the Brush.Color property:
If(mod(getrow(),2 )=1, rgb(255, 255, 255 ), rgb(240,
240, 240 ))
The mod function takes the row number (getrow()), divides it by 2, then
returns the remainder. The remainder can be either 0 or 1. If the row
number is odd, mod returns 1; if the row number is even, mod returns 0.
The expression mod(getrow(),2)=1 distinguishes odd rows from even
rows.
The rgb function specifies maximum amounts of red, green, and blue: rgb
(255, 255, 255). Specifying 255 for red, green, and blue results in the
color white.
If the row number is odd (the condition evaluates as true), the rectangle
displays as white. If the row number is even (the condition evaluates as
false), the rectangle displays as light gray (rgb (240, 240, 240)).
Example 2: rotating controls
The following report shows the column headers for Health Insurance, Life
Insurance, and Day Care rotated 45 degrees.
To rotate each of these three text controls:
1
Users Guide
Select one of the controls, then use Ctrl + click to select the other two
controls.
321
Modifying properties conditionally at runtime
The Properties view changes to show the properties that are common to all
selected controls.
2
On the Font page in the Properties view, click the button next to the
Escapement property.
3
Enter the number 450 in the Modify Expression dialog box and click OK.
The value entered for font escapement is in tenths of degrees, so the
number 450 means 45 degrees. You do not have to specify a condition.
Typically, you do not specify a condition for control rotation.
The rotation of the controls does not change in the Design view.
4
To see the change, close and reopen the Preview view.
Example 3: highlighting rows of data
The following report is an employee phone list for a company in
Massachusetts. Out-of-state (not in Massachusetts) employees are shown in
bold and preceded by two asterisks (**):
This report uses newspaper columns. To understand how to create this report
without highlighting data, see “Printing with newspaper-style columns” on
page 223.
In the Design view, the detail band includes four controls: the employee last
name, a comma, the employee first name, and the phone number:
322
InfoMaker
CHAPTER 10
Highlighting Information in Reports and Forms
To make these controls display in bold with two asterisks if the employee is not
from Massachusetts:
1
Select one of the controls, then use Ctrl + click to select the other three
controls.
The Properties view changes to show the properties that are common to all
selected controls.
2
On the Font page in the Properties view, click the button next to the Bold
property.
3
Enter the following expression in the Modify Expression dialog box and
click OK:
If(state = 'MA', 400, 700)
The expression states that if the value of the state column is MA, use 400
as the font weight. This means employees from Massachusetts display in
the normal font. For any state except MA, use 700 as the font weight. This
means all other employees display in bold font.
Logic that relies on the state column
To use logic that relies on the state column, you need to include the column
in the data source. You can add the column after creating the report by
modifying the data source. Notice that the state column does not actually
appear anywhere in the report. Values must be available but do not need to
be included in the report.
4
To insert two asterisks (**) in front of the employee name if the employee
is not from Massachusetts, add a text control to the left of the employee
name with the two asterisks in bold.
5
With the text control selected, click the button next to its Visible property
on the General page in the Properties view.
6
In the Modify Expression dialog box that displays, enter the following
expression and click OK:
If(state = 'MA', 0, 1)
This expression says that if the state of the employee is MA (the true
condition), the Visible property of the ** control is off (indicated by 0). If
the state of the employee is not MA (the false condition), the Visible
property of the ** control is on (indicated by 1). The asterisks are visible
next to that employee’s name.
Users Guide
323
Modifying properties conditionally at runtime
Tip
You can use underlines, italics, strikethrough, borders, and colors to
highlight information.
Example 4: changing the size and location of controls
The following report shows city and state columns enclosed in a rectangle and
underlined. The columns change location if the current row contains data for a
customer from the state of New York. The rectangle and the line change both
location and size.
This example shows how to move the rectangle and line. The process for
columns is similar.
In the Design view, the rectangle and line display in one location, with a single
set of dimensions. The expressions you specify are used only in Preview view
and at runtime and all have the following syntax:
If ( state='NY', true value, false value )
The false value is the same as the value in Design view. All of the values used
in this example are in PowerBuilder Units (PBUs), the default unit of measure
used for the report.
324
InfoMaker
CHAPTER 10
Highlighting Information in Reports and Forms
To change properties of the rectangle and the line for rows with the state
column equal to New York:
1
2
Select the rectangle, display the Position page in the Properties view, and
specify expressions for the following properties:
Property
Expression
X
Width
if (state = 'NY', 2890, 1865)
Height
if (state = 'NY', 160, 120)
Select the line, display the Position page in the Properties view, and
specify expressions for the following properties:
Property
X1
3
if (state = 'NY', 500, 1000)
Expression
if (state = 'NY', 2890, 1865)
Y1
X2
if (state = 'NY', 168, 132)
Y2
if (state = 'NY', 168, 132)
if (state = 'NY', 3400, 2865)
On the General page for the line, specify this expression for Pen Width:
if (state = 'NY', 10, 4)
At runtime, the rectangle is taller and narrower, and the line is shorter and
has a wider pen width.
Supplying property values
Each property has its own set of property values that you can use to specify the
true and false conditions in the If expression. Usually you specify a number to
indicate what you want. For example, if you are working with the Border
property, you use the number 0, 1, 2, 3, 4, 5, or 6 to specify a border.
Table 10-1 summarizes the properties available. A detailed description of each
property follows the table. For a complete list of properties for each control,
see the online Help.
Users Guide
325
Supplying property values
Valid values of properties are shown in parentheses in the Properties
view wherever possible.
For example, the drop-down list showing border selections includes the correct
number for specifying each border in parentheses after the name of the border
(ShadowBox (1), Underline (4)).
Table 10-1: Properties for controls in the Report painter
Property
Painter option in
Properties view
Description
Background.Color
Background Color on
Background page or Font page
Border
Border on General page
Border of a control
Brush.Color
Brush.Hatch
Brush Color on General page
Brush Hatch on General page
Color of a graphic control
Pattern used to fill a graphic control
Color
Text Color on Font page; Color
on General page; Line Color on
General page
Escapement on Font page
Color of text for text controls, columns, and computed
fields; background color for the report; line color for
graphs
Rotation of a control
Font.Height
Font.Italic
Size on Font page
Italic on Font page
Height of text
Use of italic font for text
Font.Strikethrough
Font.Underline
Strikeout on Font page
Underline on Font page
Use of strikethrough for text
Use of underlining for text
Font.Weight
Format
Bold on Font page
Format on Format page
Weight (for example, bold) of text font
Display format for columns and computed fields
Height
Pen.Color
Height on Position page
Pen Color on General page
Height of a control
Color of a line or the line surrounding a graphic control
Pen.Style
Pen.Width
Pen Style on General page
Pen Width on General page
Style of a line or the line surrounding a graphic control
Width of a line or the line surrounding a graphic control
Pointer
Protect
Pointer on Pointer page
Protect on General page
Image to be used for the pointer
Whether a column can be edited
Timer_Interval
Visible
Timer Interval on General page
Visible on General page
How often time fields are to be updated
Whether a control is visible
Width
X
Width on Position page
X on Position page
Width of a control
X position of a control
X1, X2
Y
X1, X2 on Position page
Y on Position page
Y1, Y2
Y1, Y2 on Position page
X coordinates of either end of a line
Y position of a control relative to the band in which it is
located
Y coordinates of either end of a line
Font.Escapement
(for rotating controls)
326
Background color of a control
InfoMaker
CHAPTER 10
Highlighting Information in Reports and Forms
Background.Color
Description
Setting for the background color of a control.
In the painter
Background Color on the Background page or Font page in the Properties view.
Value
A number that specifies the control’s background color.
For information on specifying colors, see “Specifying colors” on page 343.
The background color of a line is the color that displays between the segments
of the line when the pen style is not solid.
If Background.Mode is transparent (1), Background.Color is ignored.
Example
The following statement specifies that if the person represented by the current
row uses the day care benefit, the background color of the control is set to light
gray (15790320). If not, the background color is set to white (16777215):
If(bene_day_care = 'Y', 15790320, 16777215)
In this example, the condition is applied to the Background.Color property for
three controls: the emp_id column, the emp_fname column, and the emp_lname
column.
The following is a portion of the resulting report. Notice that the employee ID,
first name, and last name have a gray background if the employee uses the day
care benefit:
Border
Description
The type of border for the control.
In the painter
Border on the General page in the Properties view.
Users Guide
327
Supplying property values
Value
A number that specifies the type of border. Values are:
0—None
1—Shadow box
2—Box
3—Resize
4—Underline
5—3D Lowered
6—3D Raised
Example
The following statement specifies that if the person represented by the current
row has a status of L (on leave), the status column displays with a Shadow box
border:
If(status = 'L', 1, 0)
In this example, the condition is applied to the Border property of the status
column.
The following is a portion of the resulting report. Notice that the status On
Leave displays with a Shadow box border:
About the value L and the value On Leave
The status column uses an edit style. The internal value for on leave is L and
the display value is On Leave. The conditional expression references the
internal value L, which is the actual value stored in the database. The report
shows the value On Leave, which is the display value assigned to the value L
in the code table for the Status edit style.
328
InfoMaker
CHAPTER 10
Highlighting Information in Reports and Forms
Brush.Color
Description
Setting for the fill color of a graphic control.
In the painter
Brush Color on the General page in the Properties view.
Value
A number that specifies the color that fills the control.
For information on specifying colors, see “Specifying colors” on page 343.
Example
See the example for “Brush.Hatch” next.
Brush.Hatch
Description
Setting for the fill pattern of a graphic control.
In the painter
Brush Hatch on the General page in the Properties view.
Value
A number that specifies the pattern that fills the control. Values are:
0—Horizontal
1—Bdiagonal (lines from lower left to upper right)
2—Vertical
3—Cross
4—Fdiagonal (lines from upper left to lower right)
5—DiagCross
6—Solid
7—Transparent
8—Background (use the values on the Background tab)
Example
In this example, statements check the employee’s start date to see if the month
is the current month or the month following the current month. Properties of a
rectangle control placed behind the row of data are changed to highlight
employees with months of hire that match the current month or the month
following the current month.
The Design view includes columns of data and a rectangle behind the data. The
rectangle has been changed to black in the following picture to make it stand
out:
Users Guide
329
Supplying property values
The following statement is for the Brush.Color property of the rectangle. If the
month of the start date matches the current month or the next one, Brush.Color
is set to light gray (12632256). If not, it is set to white (16777215), which
means it will not show:
If(month( start_date ) = month(today())
or month( start_date ) = month(today())+1
or (month(today()) = 12 and month(start_date)=1),
12632256, 16777215)
The following statement is for the Brush.Hatch property of the rectangle. If the
month of the start date matches the current month or the next one, Brush.Hatch
is set to Bdiagonal (1). If not, it is set to Transparent (7), which means it will
not show:
If(month( start_date ) = month(today())
or month( start_date ) = month(today())+1
or (month(today()) = 12 and month(start_date)=1),
1, 7)
Expressions are also provided for Pen.Color and Pen.Style.
For more about these properties and a picture, see “Pen.Style” on page 337.
Color
Description
The color of text for text controls, columns, and computed fields; background
color for the report; line color for graphs.
In the painter
In the Properties view, Text Color on the Font property page; Color on the
Background property page; Line Color on the General property page.
Value
A number that specifies the color used for text.
For information on specifying colors, see “Specifying colors” on page 343.
Example
The following statement is for the Color property of the emp_id, emp_fname,
emp_lname, and emp_birth_date columns:
If(month(birth_date) = month (today()), 255, 0)
If the employee has a birthday in the current month, the information for the
employee displays in red (255). Otherwise, the information displays in black
(0).
The Font.Underline property has the same conditional expression defined for
it so that the example shows clearly on paper when printed in black and white.
330
InfoMaker
CHAPTER 10
Highlighting Information in Reports and Forms
Font.Escapement (for rotating controls)
Description
The angle of rotation from the baseline of the text.
In the painter
Escapement on the Font page in the Properties view.
Value
An integer in tenths of degrees. For example, 450 means 45 degrees. 0 is
horizontal.
Example
To enter rotation for a control, select the control in the Design view and click
the button next to the Escapement property in the Properties view. In the dialog
box that displays, enter the number of tenths of degrees.
The following picture shows the Design view with a number of text controls.
Each text control shows the Font.Escapement value entered and the number of
degrees of rotation. In the Design view, you do not see rotation; it looks as if
the controls are all mixed up. Two controls seem to overlie each other:
The next picture shows the same controls at runtime. Each control is rotated
appropriately:
Users Guide
331
Supplying property values
How to position controls that are rotated
Make the controls movable. To do so, display each control and select the
Moveable check box in the Position page. Then in the Preview view, click the
rotated text control until a gray box displays (try the center of the text). Drag
the rotated control where you want it. In the Design view, the controls will be
wherever you dragged them. They may look incorrectly positioned in the
Design view, but they will be correctly positioned when you run the report.
When you are satisfied with the positioning, you can clear the Moveable check
box for the controls to ensure that they stay where you want them.
Font.Height
Description
The height of the text.
In the painter
Size on the Font page in the Properties view.
Value
An integer in the unit of measure specified for the report. Units of measure
include PowerBuilder units, thousandths of an inch (1000 = 1 inch),
thousandths of a centimeter (1000 = 1 centimeter), or pixels. To specify size in
points, specify a negative number.
Example
The following statement is specified for the Font.Height property of a text
control. Note that the report is defined as using thousandths of an inch as its
unit of measure. The statement says that if the control is in the first row, show
the text 1/2-inch high (500 1/1000ths of an inch) and if it is not the first, show
the text 1/5-inch high (200 1/1000ths of an inch):
If(GetRow() = 1, 500, 200)
The boundaries of the control might need to be extended to allow for the
increased size of the text. At runtime, the first occurrence of the text control is
big (1/2 inch); subsequent ones are small (1/5 inch).
332
InfoMaker
CHAPTER 10
Highlighting Information in Reports and Forms
Font.Italic
Description
A number that specifies whether the text should be italic.
In the painter
Italic on the Font page in the Properties view.
Value
Values are:
0—Not italic
1—Italic
Example
The following statements are specified for the Font.Italic, Font.Underline, and
Font.Weight properties, respectively. If the employee has health insurance, the
employee’s information displays in italics. If not, the employee’s information
displays in bold and underlined:
If(bene_health_ins = 'Y', 1, 0)
If(bene_health_ins = 'N', 1, 0)
If(bene_health_ins = 'N', 700, 400)
Statements are specified in this way for four controls: the emp_id column, the
emp_fname column, the emp_lname column, and the emp_salary column. In
the resulting report, those with health insurance display in italics. Those
without health insurance are emphasized with bold and underlining:
Users Guide
333
Supplying property values
Font.Strikethrough
Description
A number that specifies whether the text should be crossed out.
In the painter
Strikeout on the Font page in the Properties view.
Value
Values are:
0—Not crossed out
1—Crossed out
Example
The following statement is for the Font.Strikethrough property of the emp_id,
emp_fname, emp_lname, and emp_salary columns. The status column must be
included in the data source even though it does not appear in the report itself.
The statement says that if the employee's status is L, which means On Leave,
cross out the text in the control:
If(status = 'L', 1, 0)
An extra text control is included to the right of the detail line. It becomes visible
only if the status of the row is L (see “Visible” on page 340).
The following is a portion of the resulting report. It shows two employees who
are On Leave. The four columns of information show as crossed out:
334
InfoMaker
CHAPTER 10
Highlighting Information in Reports and Forms
Font.Underline
Description
A number that specifies whether the text should be underlined.
In the painter
Underline on the Font page in the Properties view.
Value
Values are:
0—Not underlined
1—Underlined
Example
The following statement, when applied to the Font.Underline property of
columns of employee information, causes the information to be underlined if
the employee does not have health insurance:
If(bene_health_ins = 'N', 1, 0)
For pictures of this example, see “Font.Italic” on page 333.
Font.Weight
Description
The weight of the text.
In the painter
Bold on the Font page in the Properties view.
Value
Values are:
100—Thin
200—Extra light
300—Light
400—Normal
500—Medium
600—Semibold
700—Bold
800—Extrabold
900—Heavy
Most commonly used values
The most commonly used values are 400 (Normal) and 700 (Bold). Your
printer driver might not support all of the settings.
Example
The following statement, when applied to the Font.Weight property of columns
of employee information, causes the information to be displayed in bold if the
employee does not have health insurance:
If(bene_health_ins = 'N', 700, 400)
For pictures of this example, see “Font.Italic” on page 333.
Users Guide
335
Supplying property values
Format
Description
The display format for a column.
In the painter
Format on the Format page in the Properties view.
Values
A string specifying the display format.
Example
The following statement, when applied to the Format property of the Salary
column, causes the column to display the word Overpaid for any salary
greater than $60,000 and Underpaid for any salary under $60,000:
If(salary>60000, 'Overpaid', 'Underpaid')
Edit Mask edit style change
The Edit Mask edit style assigned to the salary column had to be changed.
Because edit styles take precedence over display formats, it was necessary to
change the edit style assigned to the salary column (an Edit Mask edit style) to
the Edit edit style.
Height
Description
The height of the column or other control.
In the painter
Height on the Position page in the Properties view.
Value
An integer in the unit of measure specified for the report. Units of measure
include PowerBuilder units, thousandths of an inch (1000 = 1 inch),
thousandths of a centimeter (1000 = 1 centimeter), or pixels.
Example
The following statement causes the height of a rectangle to be 160
PowerBuilder units if the state column for the row has the value NY.
Otherwise, the rectangle is 120 PowerBuilder units high:
if (state = 'NY', 160, 120)
For more details and pictures, see “Example 4: changing the size and location
of controls” on page 324.
336
InfoMaker
CHAPTER 10
Highlighting Information in Reports and Forms
Pen.Color
Description
The color of the line or the outline of a graphic control.
In the painter
Pen Color on the General page in the Properties view.
Value
A number that specifies the color of the line or outline.
For information on specifying colors, see “Specifying colors” on page 343.
Example
See the example for the Pen.Style property, next.
Pen.Style
Description
The style of the line or the outline of a graphic control.
In the painter
Pen Style on the General page in the Properties view.
Value
Values are:
0—Solid
1—Dash
2—Dotted
3—Dash-dot pattern
4—Dash-dot-dot pattern
5—Null (no visible line)
Example
In this example, statements check the employee’s start date to see if the month
is the current month or the month following the current month. Properties of a
rectangle control placed behind the row of data are changed to highlight
employees with months of hire that match the current month or the month
following the current month.
The Design view includes columns of data and a rectangle behind the data. The
rectangle has been changed to black in the following picture to make it stand
out:
Users Guide
337
Supplying property values
The following statement is for the Pen.Color property of the line around the
edge of the rectangle. If the month of the start date matches the current month
or the next one, Pen.Color is set to light gray (12632256). If not, it is set to
white (16777215), which means it will not show:
If(month( start_date ) = month(today())
or month( start_date ) = month(today())+1
or (month(today()) = 12 and month(start_date)=1),
12632256, 16777215)
The following statement is for the Pen.Style property of the rectangle. If the
month of the start date matches the current month or the next one, Pen.Style is
set to Solid (0). If not, it is set to NULL (5), which means it will not show:
If(month( start_date ) = month(today())
or month( start_date ) = month(today())+1
or (month(today()) = 12 and month(start_date)=1),
0, 5)
Expressions are also defined for Brush.Color and Brush.Hatch.
For more about these properties, see “Brush.Hatch” on page 329.
The following is a portion of the resulting report. A rectangle with light gray
cross-hatching highlights employees whose reviews are due soon. The line
enclosing the rectangle is Light Gray and uses the pen style Solid (0):
338
InfoMaker
CHAPTER 10
Highlighting Information in Reports and Forms
Pen.Width
Description
The width of the line or the outline of a graphic control.
In the painter
Pen Width on the General page in the Properties view.
Value
An integer in the unit of measure specified for the report. Units of measure
include PowerBuilder units, thousandths of an inch (1000 = 1 inch),
thousandths of a centimeter (1000 = 1 centimeter), or pixels.
Example
The following statement causes the width of a line to be 10 PowerBuilder units
if the state column for the row has the value NY. Otherwise, the line is 4
PowerBuilder units wide:
If(state = 'NY', 10, 4)
For more details and pictures, see “Example 4: changing the size and location
of controls” on page 324.
Pointer
Description
The image used for the mouse pointer when the pointer is over the specified
control.
In the painter
Pointer on the Pointer page in the Properties view.
Value
A string that specifies a value of the Pointer enumerated data type or the name
of a cursor file (CUR) used for the pointer.
Values of the Pointer enumerated data type are:
Arrow!
Cross!
HourGlass!
IBeam!
Icon!
Size!
SizeNESW!
SizeNS!
SizeNWSE!
SizeWE!
UpArrow!
Users Guide
339
Supplying property values
Example
The following condition, entered for the Pointer property of every control in a
row of expense data, changes the pointer to a column every time the value in
the expense column exceeds $100,000. Note that the pointer has no meaning in
a printed report. The pointer is for use on the screen display of a report:
If(expense 100000, 'pbcolumn.cur', 'arrow!')
Protect
Description
The protection setting of a column.
In the painter
Protect on the General page in the Properties view.
Value
Values are:
0—False, the column is not protected
1—True, the column is protected
Timer_Interval
Description
The number of milliseconds between the internal timer events.
In the painter
Timer Interval on the General page in the Properties view.
Value
The default is 0 (which is defined to mean 60,000 milliseconds or one minute).
Visible
Description
Whether the control is visible in the report.
In the painter
Visible on the General page in the Properties view.
Value
Values are:
0—Not visible
1—Visible
Example
The following statement is for the Visible property of a text control with the
words On Leave located to the right of columns of employee information. The
statement says that if the current employee’s status is L, which means On
Leave, the text control is visible. Otherwise, it is invisible:
If(status = 'L', 1, 0)
340
InfoMaker
CHAPTER 10
Highlighting Information in Reports and Forms
The status column must be retrieved
The status column must be included in the data source even though it does not
appear in the report itself.
The Design view includes the text control at the right-hand end of the detail
line. The text control is visible at runtime only if the value of the status column
for the row is L.
In the resulting report, the text control is visible only for the two employees on
leave. For a picture, see “Font.Strikethrough” on page 334.
Width
Description
The width of the control.
In the painter
Width on the Position page in the Properties view.
Value
An integer in the unit of measure specified for the report. Units of measure
include PowerBuilder units, thousandths of an inch (1000 = 1 inch),
thousandths of a centimeter (1000 = 1 centimeter), or pixels.
Example
The following statement causes the width of a rectangle to be 500
PowerBuilder units if the state column for the row has the value NY.
Otherwise, the rectangle is 1000 PowerBuilder units wide:
if (state = 'NY', 500, 1000)
For more details and pictures, see “Example 4: changing the size and location
of controls” on page 324.
X
Description
The distance of the control from the left edge of the report. At runtime, the
distance from the left edge of the report is calculated by adding the margin to
the x value.
In the painter
X on the Position page in the Properties view.
Value
An integer in the unit of measure specified for the report. Units of measure
include PowerBuilder units, thousandths of an inch (1000 = 1 inch),
thousandths of a centimeter (1000 = 1 centimeter), or pixels.
Users Guide
341
Supplying property values
Example
The following statement causes a rectangle to be located 6.250 inches from the
left if the state column for the row has the value NY. Otherwise, the rectangle
is 4.000 inches from the left:
If(state = 'NY', 6250, 4000)
For more details and pictures, see “Example 4: changing the size and location
of controls” on page 324.
X1, X2
Description
The distance of each end of the line from the left edge of the report as measured
in the Design view. At runtime, the distance from the left edge of the report is
calculated by adding the margin to the x1 and x2 values.
In the painter
X1, X2 on the Position page in the Properties view.
Value
Integers in the unit of measure specified for the report. Units of measure
include PowerBuilder units, thousandths of an inch (1000 = 1 inch),
thousandths of a centimeter (1000 = 1 centimeter), or pixels.
Example
The following statements for the X1 and X2 properties of a line cause the line
to extend from 6.250 to 7.150 inches from the left if the state column for the
row has the value NY. Otherwise, the line extends from 4.000 to 6.000 inches
from the left:
If(state = 'NY', 6250, 4000)
If(state = 'NY', 7150, 6000)
For more details and pictures, see “Example 4: changing the size and location
of controls” on page 324.
Y
Description
The distance of the control from the top of the band in which the control is
located.
In the painter
Y on the Position page in the Properties view.
Value
An integer in the unit of measure specified for the report. Units of measure
include PowerBuilder units, thousandths of an inch (1000 = 1 inch),
thousandths of a centimeter (1000 = 1 centimeter), or pixels.
Example
For information, see “Example 4: changing the size and location of controls”
on page 324.
342
InfoMaker
CHAPTER 10
Highlighting Information in Reports and Forms
Y1, Y2
Description
The distance of each end of the specified line from the top of the band in which
the line is located.
In the painter
Y1, Y2 on the Position page in the Properties view.
Value
Integers in the unit of measure specified for the report. Units of measure
include PowerBuilder units, thousandths of an inch (1000 = 1 inch),
thousandths of a centimeter (1000 = 1 centimeter), or pixels.
Example
The following statements for the Y1 and Y2 properties of a line cause the line
to be located .400 inches (Y1 and Y2 equal .400 inches) from the top of the
detail band, if the state column for the row has the value NY. Otherwise, the
line is located .250 inches (Y1 and Y2 equal .250 inches) from the top of the
detail band:
If(state = 'NY', 400, 250)
If(state = 'NY', 400, 250)
For more details and pictures, see “Example 4: changing the size and location
of controls” on page 324.
Specifying colors
You specify a color by specifying a number that represents the color. You can
specify the number explicitly or by using an expression that includes the RGB
(r, g, b) function.
For the numbers and expressions that specify common colors, see Table 10-2
on page 344.
How the number is
calculated
The formula for combining color values into a number is:
red + 256*green + 256*256*blue
where the amount of each primary color (red, green, and blue) is specified as a
value from 0 to 255.
The RGB function calculates the number from the amounts of red, green, and
blue specified.
Users Guide
343
Specifying colors
Sample numeric
calculation
To create cyan, you use blue and green, but no red. If you wanted to create the
most saturated (bright) cyan, you would use maximum amounts of blue and
green in the formula, which is indicated by the number 255 for each. The
following statements show the calculation:
red + 256*green + 256*256*blue
0 + 256*255 + 256*256*255
0 + 65280 + 16711680
16776960
Sample expression
using the RGB
function
The following expression specifies the brightest cyan:
RGB (0,255,255)
Notice that the expression specifies the maximum for green and blue (255) and
0 for red. The expression returns the value 16776960. To specify cyan, entering
the expression RGB(0, 255, 255) is the same as entering the number 16776960.
Numbers and
expressions to enter
for the common colors
Table 10-2 shows the numbers and expressions to enter for some common
colors. The number and expression for a color are equivalent. You can use
either.
Table 10-2: Numbers and expressions for common colors
Color
Black
Expression to enter
RGB (0, 0, 0)
Number
to enter
0
How the number is calculated
0 (no color)
Blue
Cyan
RGB (0, 0, 255)
RGB (0, 255, 255)
16711680
16776960
256*256*255 (blue only)
256*255 + 256*256*255 (green and blue)
Dark Green
Green
RGB (0, 128, 0)
RGB (0, 255, 0)
32768
65280
256*128 (green only)
256*255 (green only)
Light Gray
RGB (192, 192, 192)
12632256
192 + 256*192 + 256*256*192
(some red, green, and blue in equal amounts)
Lighter Gray
RGB (224, 224, 224)
14737632
224 + 256*224 + 256*256*224
(some red, green, and blue in equal amounts)
Lightest Gray
RGB (240, 240, 240)
15790320
Magenta
RGB (255, 0, 255)
16711935
240 + 256*240 + 256*256*240
(some red, green, and blue in equal amounts)
255 + 256*256*255 (red and blue)
Red
White
RGB (255, 0, 0)
RGB (255, 255, 255)
255
16777215
Yellow
RGB (255, 255, 0)
65535
344
255 (red only)
255 + 256*255 + 256*256*255 (red, green, and blue
in equal amounts at the maximum of 255)
255 + 256*255 (red and green)
InfoMaker
CH A PTE R
About this chapter
11
Using Nested Reports
This chapter provides information about creating reports that have other
reports nested in them.
Contents
About reports and
DataWindow objects
Topic
About nested reports
Page
345
Creating a report using the Composite presentation style
Placing a nested report in another report
349
351
Working with nested reports
354
A report is the same as a nonupdatable DataWindow object.
About nested reports
A nested report is a report within another report.
There are two ways to create reports containing nested reports:
About creating a
composite report
•
Create a composite report using the Composite presentation style
•
Place a nested report in another report
You can choose the Composite presentation style to create a new report
that consists entirely of one or more nested reports. This type of report is
called a composite report. A composite report is a container for other
reports.
You can use composite reports to print more than one report on a page.
Users Guide
345
About nested reports
Composite report
For example, the following composite report consists of three tabular reports.
One of the tabular reports includes a graph:
Composite report in
the Design view
In the Design view, you see three boxes that represent the individual tabular
reports that are included in the composite report. The only additional controls
in this example are a title, date, and page number:
346
InfoMaker
CHAPTER 11
About placing a
nested report within
another report
Using Nested Reports
You can place one or more reports within another report. The report you place
is called the nested report. You can place a nested report in any type of report
except crosstab. Most of the time you will place nested reports in freeform or
tabular reports.
Often, the information in the nested report depends on information in the report
in which it is placed (the base report). The nested report and the base report are
related to each other by some common data. The base report and the nested
report have a master/detail relationship.
Freeform report with a
related nested report
Users Guide
For example, the following freeform report lists all information about a
customer and then includes a related nested report (which happens to be a
tabular report). The related nested report lists every order that the customer has
ever placed. The base report supplies the customer ID to the nested report,
which requires a customer ID as a retrieval argument. This is an example of a
master/detail relationship—one customer has many orders:
347
About nested reports
What you see in the
Design view
In the Design view, you see everything in the base report plus a box that
represents the related nested report:
The difference
between nested and
composite reports
There are two important differences between nesting using the Composite style
and nesting a report within a base report.
Data sources The composite report does not have a data source—it is just a
container for nested reports. In contrast, a base report with a nested report in it
has a data source. The nested report has its own data source.
Related nesting The composite report cannot be used to relate reports to
each other in the database sense. One report cannot feed a value to another
report, which is what happens in a master/detail report. If you want to relate
reports to each other so that you can create a master/detail report, you need to
place a nested report within a base report.
How retrieval works
When you preview (run) a composite report, InfoMaker retrieves all the rows
for one nested report, and then for another nested report, and so on until all
retrieval is complete. Your computer must have a default printer specified,
because composite reports are actually displayed in print preview mode.
When you preview (run) a report with another related report nested in it,
InfoMaker retrieves all the rows in the base report first. Then InfoMaker
retrieves the data for all nested reports related to the first row. Next, InfoMaker
retrieves data for nested reports related to the second row, and so on, until all
retrieval is complete for all rows in the base report.
For information about efficiency and retrieval, see “Supplying retrieval
arguments to relate a nested report to its base report” on page 357.
348
InfoMaker
CHAPTER 11
Limitations on nesting
reports
Using Nested Reports
For the most part you can nest the various types of report styles. However,
limitations apply to two of them.
Crosstabs You cannot place a crosstab with retrieval arguments within
another report as a related nested report. However, you can include a crosstab
in a Composite report.
RichText reports You cannot nest a RichText report in any way. You cannot
place a RichText report in another report, and you cannot include a RichText
report in a Composite report.
Creating a report using the Composite presentation
style
❖
To create a report using the Composite presentation style:
1
Select File>New from the menu bar.
The New Report dialog box displays.
2
Choose the Object tab page and the Composite presentation style, and
click OK.
The wizard displays all reports (DataWindow objects) that are in the
current library.
3
Click the reports you want to include in the composite report and then
click Next.
The wizard lists your choices.
4
Click Finish.
InfoMaker places boxes for the selected reports in the Design view. In this
example, you see three reports:
Users Guide
349
Creating a report using the Composite presentation style
5
Select File>Save from the menu bar and assign a name to the composite
report.
6
Look at the Preview view of the report:
Working with composite reports
Many of the options available for working with reports, such as
Rows>Filter, Rows>Import, and Rows>Sort, are disabled for a composite
report. If you want to use any of these options, you need to access the
nested report(s), where these options are available.
7
350
Continue to enhance the composite report (for example, add a date and
title).
InfoMaker
CHAPTER 11
Using Nested Reports
Placing a nested report in another report
When you place a nested report in another report, the two reports can be
independent of each other, or they can be related in the database sense by
sharing some common data such as a customer number or a department
number. If the reports are related, you need to do some extra things to both the
base report and the related nested report.
Usually, when you place a report within a report rather than create a composite
report, you want to relate the reports. Those instructions are first.
Placing a related nested report in another report
Typically, a related nested report provides the details for a master report. For
example, a master report might provide information about customers. A related
nested report placed in the master report could provide information about all
the orders that belong to each customer.
❖
To place a related nested report in another report:
1
Create the nested report that you plan to place in the base report.
2
Define a retrieval argument for the nested report.
For example, suppose the nested report lists orders and you want to list
orders for a particular customer. To define a retrieval argument, you
would:
3
Users Guide
•
Select Design>Data Source to go to the SQL Select painter.
•
Select Design>Retrieval Arguments from the menu bar in the SQL
Select painter.
•
Define a retrieval argument in the Specify Retrieval Arguments
dialog box. In the example, customerID is the name assigned to the
retrieval argument.
Specify the retrieval argument in a WHERE clause for the SELECT
statement.
351
Placing a nested report in another report
The WHERE clause in this example tells the DBMS to retrieve rows where
the value in the column cust_id equals the value of the argument
:customerid:
At this point, when you run the report to retrieve data, you are prompted
to enter a value for :customerid. Later in these steps, you will specify that
the base report supply the values for :customerid instead of prompting for
values.
4
Open or create the report you want to have as the base report.
In the example, the base report is one that lists customers and has a place
for the order history of each customer:
5
Select Insert>Control>Report from the menu bar.
6
In the Design view, click where you want to place the report.
The Select Report dialog box displays, listing defined reports in the
current library.
7
Select the report you want, and click OK.
A box representing the report displays in the Design view.
352
InfoMaker
CHAPTER 11
8
Using Nested Reports
With the report still selected, select the General page of the Properties
view.
The Arguments box lists arguments defined for the nested report and
provides a way for you to specify how information from the base report
will be used to supply the values of arguments to the nested report.
9
Supply the base report column or the expression that will supply the
argument’s value. To do this, click the button in the Expression column.
The Modify Expression dialog box displays. In this dialog box, you can
easily select one of the columns or develop an expression. In the example,
the column named id from the base report will supply the value for the
argument :customerid in the nested report.
10 Select File>Save from the menu bar and assign a name to the report.
11 In the Preview view, you can see what your report looks like:
Users Guide
353
Working with nested reports
Placing an unrelated nested report in another report
When you place an unrelated nested report in a base report, the entire nested
report appears with each row of the base report.
❖
To place an unrelated nested report in another report:
1
Create or open the report you want as the base report.
2
Select Insert>Control>Report from the menu bar.
3
In the Design view, click where you want to place the report.
The Select Report dialog box displays, listing defined reports in the
current library.
4
Select the report you want to nest in the base report, and click OK.
A box representing the nested report displays in the Design view.
5
Select File>Save from the menu bar and if the base report is newly created,
assign a name to it.
Working with nested reports
When you use nested reports either in composite reports or in other base
reports, several enhancements and options are available. An easy way to see
what you can do is to select the nested report and look at the Properties view
for it.
Many of the options in the Properties view are described in Chapter 6,
“Enhancing Reports.” For example, using borders on nested reports is like
using borders on any control.
This section describes activities that apply only to nested reports or that have
special meaning for nested reports. It covers:
354
•
“Adjusting nested report width and height” next
•
“Changing a nested report from one report to another” on page 356
•
“Modifying the definition of a nested report” on page 356
•
“Adding another nested report to a composite report” on page 357
InfoMaker
CHAPTER 11
Using Nested Reports
•
“Supplying retrieval arguments to relate a nested report to its base report”
on page 357
•
“Specifying criteria to relate a nested report to its base report” on page
359
•
“Using options for nested reports” on page 360
Adjusting nested report width and height
When you preview a report with nested reports, the width of the nested report
may be unacceptable. This can happen, for example, if you change the design
of the nested report or if you use newspaper columns in a nested report. The
width of the nested report is not adjusted to fit its contents at runtime; if the
report is too narrow, some columns may be truncated. For example, if the size
of the nested report is set to 6 inches wide in the parent report, columns in the
nested report that exceed that width are not displayed in the parent report.
❖
To adjust report width:
1
In the Design view, position the pointer near a vertical edge of the nested
report and press the left mouse button.
2
Drag the edge to widen the nested report.
3
Check the new width in the Preview view.
When you Print preview a report that contains a nested N-Up report with
newspaper columns across the page, you might find that blank pages display
(and print) when the nested report in the detail band fills the page. This is
because any white space at the bottom of the band is printed to a second page.
You can usually solve this problem by dragging up the detail band to eliminate
the white space between the nested report and the band, or even to overlap the
bottom of the representation of the nested report.
Users Guide
355
Working with nested reports
Changing a nested report from one report to another
You can change the nested report that is used. For example, you may work on
several versions of a nested report and need to update the version of the nested
report that the composite or base report uses.
❖
To change the nested report to a different report:
1
Select the nested report in the Design view.
2
In the Properties view, General property page, click the button next to the
Report box.
3
Select the report you want to use, and click OK.
The name of the report that displays in the box in the Design view changes
to the new one.
Modifying the definition of a nested report
You can modify the definition of the nested report. You can do this directly
from the composite report or base report that contains the nested report.
❖
To modify the definition of a nested report from the composite report or
base report:
1
Position the pointer on the nested report whose definition you want to
modify, and display the pop-up menu.
2
Select Modify Report from the pop-up menu.
The nested report opens and displays in the painter. Both the composite or
base report and the nested report are open.
3
Modify the report.
4
Select File>Close from the menu bar.
You are prompted to save your changes.
5
Click OK.
You return to the composite report or to the base report that includes the
nested report.
356
InfoMaker
CHAPTER 11
Using Nested Reports
Adding another nested report to a composite report
After you have created a composite report, you might want to add another
report. The following procedure describes how. For information on adding a
nested report to a report that is not a composite report, see “Placing a related
nested report in another report” on page 351 or “Placing an unrelated nested
report in another report” on page 354.
❖
To add another nested report to a composite report:
1
Open the composite report.
2
Select Insert>Control>Report from the menu bar.
3
Click in the Design view where you want to place the report.
The Select Report dialog box displays, listing defined reports in the
current library.
4
Select the report you want and click OK.
A box representing the report displays in the Design view.
Supplying retrieval arguments to relate a nested report to its base
report
The most efficient way to relate a nested report to its base report is to use
retrieval arguments. If your nested report has arguments defined, you use the
procedure described in this section to supply the retrieval argument value from
the base report to the nested report. (The procedure described is part of the
whole process covered in “Placing a related nested report in another report”
on page 351.)
Why retrieval
arguments are
efficient
Some DBMSs have the ability to bind input variables in the WHERE clause of
the SELECT statement. When you use retrieval arguments, a DBMS with this
capability sets up placeholders in the WHERE clause and compiles the SELECT
statement once. InfoMaker retains this compiled form of the SELECT statement
for use in subsequent retrieval requests.
Requirements for
reusing the compiled
SELECT statement
To enable InfoMaker to retain and reuse the compiled SELECT statement:
Users Guide
•
The database interface must support binding of input variables.
•
You must enable binding support by setting the DisableBind database
parameter to 0, which is the default.
357
Working with nested reports
•
You must enable caching in the database profile. Set the SQLCache
database parameter to the number of levels of nesting plus 5.
For more information, see the description of the SQLCache and
DisableBind database parameters in the online Help.
Nested reports in composite reports
If the base report is a composite report, you need to define retrieval arguments
for the composite report before you can supply them to the nested report.
In the Properties view for the composite report, select the General page. Then
define the retrieval arguments that the nested report needs, taking care to
specify the correct type.
❖
To supply a retrieval argument value from the base report to the nested
report:
1
Make sure that the nested report has been set up to take one or more
retrieval arguments.
See “Placing a nested report in another report” on page 351.
2
Select the nested report and then select the General page of the Properties
view.
The Arguments box lists arguments defined for the nested report and
provides a way for you to specify how information from the base report
will supply the value of the argument to the nested report.
3
358
Supply the base report column or the expression that will supply the
argument’s value. To do this, click the button in the Expression column.
InfoMaker
CHAPTER 11
Using Nested Reports
The Modify Expression dialog box displays. In this dialog box, you can
easily select one of the columns or develop an expression. In the example,
the column named id from the base report will supply the value for the
argument :customerid in the nested report.
When you run the report now, you are not prompted for retrieval argument
values for the nested report. The base report supplies the retrieval
argument values automatically.
Specifying criteria to relate a nested report to its base report
If you do not have arguments defined for the nested report and if database
efficiency is not an issue, you can place a nested report in another report and
specify criteria to pass values to the related nested report.
How the DBMS
processes SQL if you
use the specify criteria
technique
If you use the specify criteria technique, the DBMS repeatedly recompiles the
SELECT statement and then executes it. The recompilation is necessary for
each possible variation of the WHERE clause.
❖
To specify criteria to relate a nested report to its base report:
1
Select the nested report and then select the Criteria page in the Properties
view.
The Criteria property page provides a way for you to specify how
information from the base report will supply the retrieval criteria to the
nested report.
2
Click the button next to the criteria box.
The Specify Retrieval Criteria dialog box displays.
3
Enter the retrieval criteria and click OK.
The rules for specifying criteria are the same as for specifying criteria in
the Quick Select data source. Multiple criteria in one line are ANDed
together. Criteria entered on separate lines are ORed together.
In this example, the customer ID (the id column) is the retrieval criterion
being supplied to the nested report.
Users Guide
359
Working with nested reports
Notice that the id column is preceded by a colon (:), which is required:
When you run the report now, InfoMaker retrieves rows in the nested
report based on the criteria you have specified. In the example, the
customer ID column in the base report determines which rows from the
sales_order table are included for each customer.
Using options for nested reports
Using the Autosize
Height option
Autosize Height should be on for all nested reports except graphs. This option
ensures that the height of the nested report can change to accommodate the
rows that are returned.
This option is on by default for all nested reports except graphs. Usually there
is no reason to change it. If you do want to force a nested report to have a fixed
height, you can turn this option off.
Note that all bands in the report also have an Autosize Height option. The
option is off by default and must be on for the Autosize Height option for the
nested report to work properly.
❖
To change the Autosize Height option for a nested report:
1
In the Design view, select the nested report.
2
In the Properties view, select the Position properties page.
3
Select/clear the Autosize Height check box.
Handling large rows
To avoid multiple blank pages or other anomalies in printed reports, never
create a report with a data row greater than the size of the target page. To handle
large text-string columns, break the large string into a series of small strings.
The smaller strings are used to populate individual data rows within a nested
report instead of using a single text column with an autosized height.
360
InfoMaker
CHAPTER 11
Using the Slide
options
Using Nested Reports
InfoMaker determines the appropriate Slide options when positioning the
nested report(s) and assigns default values. Usually, you should not change the
default values:
•
The Slide Left option is on by default for grid and crosstab style reports
and off by default for all others. Having Slide Left on for grid and crosstab
ensures that these reports break horizontally on whole columns and not in
the middle of a column.
•
The Slide Up All Above and Directly Above options ensure that the nested
report uses just as much vertical space as it needs. One of these options is
on by default for all nested reports.
For more information, see “Sliding controls to remove blank space in a report”
on page 251.
Using the New Page
option (composite
only)
The New Page option forces a new page for a nested report used in a composite
report. By default, this option is off.
❖
Using the Trail Footer
option (composite
only)
1
In the Design view, select the nested report.
2
In the Properties view, select the General properties page.
3
Select the New Page check box.
The Trail Footer option controls the placement of the footer for the last page of
a nested report in a composite report. By default, this option is on. The footer
appears directly under the contents of the nested report and not at the bottom
of the page.
❖
Users Guide
To specify that a nested report in a composite report should begin on a
new page:
To specify that the footer should appear at the bottom of the page:
1
In the Design view, select the nested report.
2
In the Properties view, select the General properties page.
3
Clear the Trail Footer check box.
4
The footer appears at the bottom of the page on all pages of the nested
report, including the last page. Note that if another nested report begins on
the same page, the footer from the earlier report might be misleading or
confusing.
361
Working with nested reports
362
InfoMaker
CH A PTE R
1 2
About this chapter
Contents
Exporting and Importing XML
Data
The row data in a report can be exported and imported in the Extensible
Markup Language (XML). This chapter describes how to create and use
templates that control the export and import of data in XML format.
Topic
About XML
Page
363
XML support in the Report painter
The Export/Import Template view for XML
367
368
Editing XML templates
Exporting to XML
374
382
Importing XML
391
About XML
Like Hypertext Markup Language (HTML), Extensible Markup
Language (XML) is a subset of Standardized General Markup Language
(SGML) and has been designed specifically for use on the Web. XML is
defined in the W3C Recommendation published by the World Wide Web
Consortium. The latest version of this document is available at
http://www.w3.org/TR/REC-xml.
XML is more complete and disciplined than HTML, and it is also a
framework for creating markup languages—it allows you to define your
own application-oriented markup tags.
XML provides a set of rules for structuring data. Like HTML, XML uses
tags and attributes, but the tags are used to delimit pieces of data, allowing
the application that receives the data to interpret the meaning of each tag.
These properties make XML particularly suitable for data interchange
across applications, platforms, enterprises, and the Web. The data can be
structured in a hierarchy that includes nesting.
Users Guide
363
About XML
An XML document is made up of declarations, elements, comments, character
references, and processing instructions, indicated in the document by explicit
markup.
The simple XML document that follows contains an XML declaration
followed by the start tag of the root element, <d_dept_list>, nested row and
column elements, and finally the end tag of the root element. The root element
is the starting point for the XML processor.
<?xml version="1.0">
<d_dept_list>
<d_dept_list_row>
<dept_id>100</dept_id>
<dept_name>R &D</dept_name>
<dept_head_id>501</dept_head_id>
</d_dept_list_row>
...
</d_dept_list>
This section contains a brief overview of XML rules and syntax. For a good
introduction to XML, see XML in 10 points at http://www.w3.org/XML/1999/XMLin-10-points. For more detailed information, see the W3C XML page at
http://www.w3.org/XML/, the XML Cover Pages at
http://xml.coverpages.org/xml.html, or one of the many books about XML.
Valid and well-formed XML documents
An XML document must be valid, well-formed, or both.
Valid documents
To define a set of tags for use in a particular application, XML uses a separate
document named a document type definition (DTD). A DTD states what tags
are allowed in an XML document and defines rules for how those tags can be
used in relation to each other. It defines the elements that are allowed in the
language, the attributes each element can have, and the type of information
each element can hold. Documents can be verified against a DTD to ensure that
they follow all the rules of the language. A document that satisfies a DTD is
said to be valid.
If a document uses a DTD, the DTD must immediately follow the declaration.
364
InfoMaker
CHAPTER 12
Exporting and Importing XML Data
XML Schema provides an alternative mechanism for describing and validating
XML data. It provides a richer set of datatypes than a DTD, as well as support
for namespaces, including the ability to use prefixes in instance documents and
accept unknown elements and attributes from known or unknown namespaces.
For more information, see the W3C XML Schema page at
http://www.w3.org/XML/Schema.
Well-formed
documents
The second way to specify XML syntax is to assume that a document is using
its language properly. XML provides a set of generic syntax rules that must be
satisfied, and as long as a document satisfies these rules, it is said to be
well-formed. All valid documents must be well-formed.
Processing well-formed documents is faster than processing valid documents
because the parser does not have to verify against the DTD or XML schema.
When valid documents are transmitted, the DTD or XML schema must also be
transmitted if the receiver does not already possess it. Well-formed documents
can be sent without other information.
XML documents should conform to a DTD or XML schema if they are going
to be used by more than one application. If they are not valid, there is no way
to guarantee that various applications will be able to understand each other.
XML syntax
There are a few more restrictions on XML than on HTML; they make parsing
of XML simpler.
Tags cannot be
omitted
Unlike HTML, XML does not allow you to omit tags. This guarantees that
parsers know where elements end.
The following example is acceptable HTML, but not XML:
<table>
<tr>
<td>Dog</td>
<td>Cat
<td>Mouse
</table>
To change this into well-formed XML, you need to add all the missing end
tags:
<table>
<tr>
<td>Dog</td>
<td>Cat</td>
Users Guide
365
About XML
<td>Mouse</td>
</tr>
</table>
Representing empty
elements
Empty elements cannot be represented in XML in the same way they are in
HTML. An empty element is one that is not used to mark up data, so in HTML,
there is no end tag. There are two ways to handle empty elements:
•
Place a dummy tag immediately after the start tag. For example:
<img href="picture.jpg"></img>
•
Use a slash character at the end of the initial tag:
<img href="picture.jpg"/>
This tells a parser that the element consists only of one tag.
XML is case sensitive
XML is case sensitive, which allows it to be used with non-Latin alphabets.
You must ensure that letter case matches in start and end tags: <MyTag> and
</Mytag> belong to two different elements.
White space
White space within tags in XML is unchanged by parsers.
All elements must be
nested
All XML elements must be properly nested. All child elements must be closed
before their parent elements close.
XML parsing
There are two major types of application programming interfaces (APIs) that
can be used to parse XML:
•
Tree-based APIs map the XML document to a tree structure. The major
tree-based API is the Document Object Model (DOM) maintained by
W3C. A DOM parser is particularly useful if you are working with a
deeply-nested document that must be traversed multiple times.
For more information about the DOM parser, see the W3C Document
Object Model page at http://www.w3c.org/DOM.
•
Event-based APIs use callbacks to report events, such as the start and end
of elements, to the calling application, and the application handles those
events. These APIs provide faster, lower-level access to the XML and are
most efficient when extracting data from an XML document in a single
traversal.
For more information about the best-known event-driven parser, SAX
(Simple API for XML), see the SAX page at http://sax.sourceforge.net/.
366
InfoMaker
CHAPTER 12
Xerces parser
Exporting and Importing XML Data
InfoMaker includes software developed by the Apache Software Foundation
(http://www.apache.org/). The XML services for reports are built on the Apache
Xerces-C++ parser, which conforms to both DOM and SAX specifications. For
more information about SAX, see the Xerces C++ Parser page at
http://xerces.apache.org/xerces-c/index.html.
XML support in the Report painter
InfoMaker supports both the export and import of XML in reports using XML
template objects. You construct XML templates for export and import
graphically in the Export/Import Template view for XML. Each template you
create is encapsulated in the report. A template enables you to specify the XML
logical structure of how the row data iterates inside the root element of the
XML document.
Export templates
An XML export template lets you customize the XML that is generated.
You can specify optional XML and document type declarations that precede
the root element in the exported XML, as well as the logical structure and
nesting level of iterative report row data inside the root element. The children
of the root element can contain elements, character references, and processing
instructions as well as the row data, using explicit markup. For more
information, see “Header and Detail sections” on page 371.
If the exported XML is used by different applications or processes, you can
define a separate export template for each use.
Import templates
You need to create an import template if you want to import data that does not
match the report column definition or is associated with a schema, or if you
want to import attribute values.
Only the mapping of column names to element and attribute names is used for
import. All other information in the template is ignored.
Users Guide
367
The Export/Import Template view for XML
The Export/Import Template view for XML
You define and edit templates for export and import in the Export/Import
Template view for XML in the Report painter. The view uses a tree view to
represent the template.
Using the Web DataWindow in PowerBuilder
If you are both an InfoMaker user and a PowerBuilder Enterprise user, you
might be creating reports (nonupdatable DataWindows) in InfoMaker and then
using PowerBuilder to work with your DataWindows. For information about
using the Web DataWindow and the Export Template view for XHTML to
customize the generation of the XML Web DataWindow and the XHTML Web
DataWindow, see the chapter on using the Web DataWindow in the
DataWindow Programmer’s Guide.
When you create a new report, InfoMaker displays a default template in the
Export/Import Template view. You can edit only one template at a time in the
view, but you can create multiple templates and save them with the report. Each
template is uniquely associated with the report open in the painter.
The default template has one element for each column in the report.
368
InfoMaker
CHAPTER 12
Exporting and Importing XML Data
Creating, opening,
and saving templates
From the pop-up menu for the Export/Import Template view (with nothing
selected), you can create new templates with or without default contents, open
an existing template, save the current template, or delete the current template.
You can only open and edit templates that are associated with the current
report.
Representing tree
view items
Each item in the template displays as a single tree view item with an image and
font color that denotes its type. The end tags of elements and the markup
delimiters used in an XML document do not display.
Table 12-1 shows the icons used in the Export/Import Template view.
Table 12-1: Icons used in the Export/Import Template view
Icon
Description
XML declaration or document type declaration
Root or child element
Group header element
Report column reference
Static text control reference
Computed field or InfoMaker expression reference
Literal text
Comment
Processing instruction
CDATA section
Nested report
Users Guide
369
The Export/Import Template view for XML
Creating templates
To create a template, select the New menu item or the New Default menu item
from the pop-up menu in the Export/Import Template view.
Creating new base
templates
The New menu item creates a template that is empty except for the XML
declaration, the root element, and the first element of the row data section,
referred to as the Detail Start element. The name of the root element is the same
as the name of the report, and the default name for the Detail Start element is
the name of the root element with _row appended.
For example, if the report is named d_name, the default template has this
structure:
<?xml version="1.0"?>
<d_name>
<d_name_row>
</d_name_row>
</d_name>
Creating new default
templates
The New Default menu item creates a template with the same contents as the
New menu item, as well as a flat structure of child elements of the Detail Start
element. A child element is created for each report column name, in the order
in which the columns appear in the SELECT statement, with the exception of
blob and computed columns. The default tag for the element is the column’s
name.
If the names of the column and the control are the same, the content of the child
element displays with a control reference icon. If there is no control name that
matches the column name, the content of the child element displays using the
InfoMaker expression icon. For example, consider a report in which the dept_id
column is used as a retrieval argument and does not display:
370
InfoMaker
CHAPTER 12
Exporting and Importing XML Data
The SQL syntax is:
SELECT "employee"."dept_id",
"employee"."emp_lname",
"employee"."emp_fname",
"employee"."salary"
FROM "employee"
WHERE employee.dept_id = :deptnum
ORDER BY "employee"."emp_lname" ASC
In the default template, dept_id uses the InfoMaker expression icon. All the
other columns used the column control reference icon.
Saving templates
To save a new template, select Save from the pop-up menu in the
Export/Import Template view, and give the template a name and optionally a
comment that identifies its use.
The template is stored inside the report in the PBL.
Header and Detail sections
An XML template has a Header section and a Detail section, separated
graphically by a line across the tree view.
The items in the Header section are generated only once when the report is
exported to XML, unless the report is a group report. For group reports, you
can choose to generate the contents of the header section iteratively for each
group. For more information, see “Generating group headers” on page 384.
Users Guide
371
The Export/Import Template view for XML
The Detail section contains the row data, and is generated iteratively for each
row in the report.
The Detail Start
element
A line across the Export/Import Template view separates the Header section
from the Detail section. The first element after this line, d_dept_list_row in the
previous screenshot, is called the Detail Start element.
There can be only one Detail Start element, and it must be inside the
document’s root element. By default, the first child of the root element is the
Detail Start element. It usually wraps a whole row, separating columns across
rows. When the report is exported to XML, this element and all children and/or
siblings after it are generated iteratively for each row. Any elements in the root
element above the separator line are generated only once, unless the report is a
group report and the Iterate Group Headers check box has been selected.
The Detail Start element can be a nested (or multiply-nested) child of an
element from the Header section, permitting a nested detail.
Moving the separator
You can change the location of the separator line by selecting the element that
you want as the Detail Start element and selecting Starts Detail from its pop-up
menu. The separator line is redrawn above the new Detail Start element. When
you export the data, the Detail Start element and the children and siblings after
it are generated iteratively for each row.
If no Detail Start element is specified (that is, if the Starts Detail option has
been deselected), the template has only a Header section. When you export the
data, only one iteration of row data is generated.
372
InfoMaker
CHAPTER 12
Exporting and Importing XML Data
Header section
The Header section can contain the items listed in Table 12-2. Only the root
element is required:
Table 12-2: Items permitted in the Header section of an XML document
Item
Details
XML declaration
This must be the first item in the tree view if it exists. See
“XML declaration” on page 375.
If there is an XML declaration, the document type
declaration must appear after the XML declaration and
any optional processing instructions and comments, and
before the root element. Otherwise, this must be the first
item in the tree view. See “Document type declaration”
on page 376.
Document type
declaration
Comments
See “Comments” on page 381.
Processing instructions
Root element (start tag)
See “Processing instructions” on page 382.
See “Root element” on page 377.
Group header elements
Child elements
See “Generating group headers” on page 384.
Child elements in the Header section cannot be iterative
except in the case of group reports.
Detail section in root element
The root element displays in the Header section, but the entire content of the
Detail section is contained in the root element.
Detail section
The Detail section, which holds the row data, can contain the items listed in
Table 12-3.
Table 12-3: Items permitted in the Detail section of an XML document
Users Guide
Item
Detail Start element
Details
See “The Detail Start element” on page 372.
Child or sibling elements
to the Detail Start
element
To add a sibling to the Detail Start element, add a child to
its parent (the root element by default).
Control references
These references are in text format and can include
references to column, text, computed field, and report
controls. See “Controls” on page 377. Nested report
controls can only be referenced as child elements. See
“Composite and nested reports” on page 379.
373
Editing XML templates
Item
Details
InfoMaker expressions
Literal text
See “InfoMaker expressions” on page 378.
Literal text does not correspond to a control in the report.
Comments
Processing instructions
See “Comments” on page 381.
See “Processing instructions” on page 382.
CDATA sections
Attributes
See “CDATA sections” on page 381.
You can assign attributes to all element types. See
“Attributes” on page 378.
Editing XML templates
Using templates for data import
If you use a template created for data export, InfoMaker expressions, text,
comments, and processing instructions are ignored when data is imported. If
you are creating a template specifically for import, do not add any of these
items. You need only map column names to element and attribute names.
Every item in the Export/Import Template view has a pop-up menu from which
you can perform actions appropriate to that item, such as editing or deleting the
item, adding or editing attributes, adding child elements or other items, and
inserting elements, processing instructions, CDATA sections, and so forth,
before the current item.
If an element has no attributes, you can edit its tag in the Export/Import
Template view by selecting it and left-clicking the tag or pressing F2. Literal
text nodes can be edited in the same way. You can delete items (and their
children) by pressing the Delete key.
374
InfoMaker
CHAPTER 12
Exporting and Importing XML Data
The examples in this section show the delimiters used in the XML document.
When you edit the template in dialog boxes opened from the Export/Import
Template view for XML, you do not need to type these delimiters in text boxes.
The rest of this section describes some of the items in the template. For more
information, see the XML specification at http://www.w3.org/TR/REC-xml.
XML declaration
The XML declaration specifies the version of XML being used. You may need
to change this value for a future version of XML. It can also contain an
encoding declaration and a standalone document declaration. From the pop-up
menu, you can edit the declaration, and, if the document is well-formed, delete
it. If you have deleted the XML declaration, you can insert one from the Insert
Before item on the pop-up menu for the next item in the template.
Encoding declaration
The encoding declaration specifies the character-set encoding used in the
document, such as UTF-16 or ISO-10646-UCS-4.
If there is no encoding declaration, the value defaults to UTF-16LE encoding
in ASCII environments. In DBCS environments, the default is the default
system encoding on the computer where the XML document is generated. This
ensures that the document displays correctly as a plain text file. However, since
the DBCS data is serialized to Unicode, XML documents that use UTF-16LE,
UTF-16 Big Endian, or UTF-16 Little Endian can all be parsed or generated
correctly on DBCS systems.
Several other encodings are available, including ASCII, UCS4 Big Endian,
UCS4 Little Endian, EBCDIC code pages IBM037 and IBM1140, ISO Latin-1,
and Latin 1 Windows (code page 1252). You can select these values from a
drop-down list box in the XML Declaration dialog box.
Standalone document
declaration
The standalone document declaration specifies whether the document contains
no external markup that needs to be processed and can therefore stand alone
(Yes), or that there are, or might be, external markup declarations in the
document (No). The value in the default template is No, and if there is no
standalone document declaration, the value is assumed to be No.
Example
This is an XML declaration that specifies XML version 1.0, UTF-16LE
encoding, and that the document can stand alone:
<?xml version="1.0" encoding="UTF-16LE"
standalone="yes"?>
Users Guide
375
Editing XML templates
Document type declaration
The document type declaration contains or points to markup declarations that
provide a grammar for a class of documents. This grammar is known as a
document type definition, or DTD. The document type declaration defines
constraints on the sequence and nesting of tags, attribute values, names and
formats of external references, and so forth. You can edit the document type
declaration to change its name, but the name must always be the same as the
name of the root element. Changing the name in either the document type
declaration or the root element automatically changes the name in the other.
Adding DTDs
You can add an identifier pointing to an external DTD subset, and you can add
an internal DTD subset. If you supply both external and internal subsets, entity
and attribute-list declarations in the internal subset take precedence over those
in the external subset.
Public identifiers
An external identifier can include a public identifier that an XML processor
can use to generate an alternative URI. If an alternative URI cannot be
generated, the URI provided in the system identifier is used. External
identifiers without a public identifier are preceded by the keyword SYSTEM.
External identifiers with a public identifier are preceded by the keyword
PUBLIC.
Exporting metadata
If you specify a system or public identifier and/or an internal subset in the
Document Type Declaration dialog box, a DTD cannot be generated when the
data is exported to XML. A MetaDataType of XMLDTD! is ignored. For more
information about the properties that control the export of metadata, see
“Exporting metadata” on page 387.
Examples
These are examples of valid document type declarations.
An external system identifier:
<!DOCTYPE d_dept_listing SYSTEM "d_dept_listing.dtd">
An external system identifier with a public identifier:
<!DOCTYPE d_test PUBLIC "-//MyOrg//DTD Test//EN"
"http://www.mysite.org/mypath/mytest.dtd">
An external system identifier with an internal DTD. The internal DTD is
enclosed in square brackets:
<!DOCTYPE d_orders
SYSTEM "http://www.acme.com/dtds/basic.dtd"[
<!ELEMENT Order (Date, CustID, OrderID, Items*)>
376
InfoMaker
CHAPTER 12
<!ELEMENT
<!ELEMENT
<!ELEMENT
<!ELEMENT
<!ELEMENT
<!ELEMENT
Exporting and Importing XML Data
Date (#PCDATA)>
CustID (#PCDATA)>
OrderID (#PCDATA)>
Items (ItemID, Quantity)>
ItemID (#PCDATA)>
Quantity (#PCDATA)>
]>
Root element
You can change the name of the root element, add attributes and children, and
insert comments, instructions, and, if they do not already exist, XML and/or
document type declarations before it.
Changing the name of the root element changes the name of its start and end
tags. You can change the name using the Edit menu item, or in the Element
Attributes dialog box. Changing the name of the document type declaration, if
it exists, also changes the name of the root element, and vice versa. The root
element name is always the same as the document type declaration name.
You can add the following kinds of children to the root element:
•
Elements
•
Text
•
Control references
•
InfoMaker expressions (including column references)
•
CDATA sections
•
Comments
•
Processing instructions
Controls
Adding a control reference opens a dialog box containing a list of the columns,
computed fields, report controls, and text controls in the document.
Control references can also be added to empty attribute values or element
contents using drag-and-drop from the Control List view. Column references
can also be added using drag-and-drop from the Column Specifications view.
Users Guide
377
Editing XML templates
Drag-and-drop cannot replace
You cannot drag-and-drop an item on top of another item to replace it. For
example, if you want to replace one control reference with another control
reference, or with an InfoMaker expression, you first need to delete the control
reference you want to replace.
InfoMaker expressions
Adding an InfoMaker expression opens the Modify Expression dialog box.
This enables you to create references to columns from the data source of the
report. One use of this feature is to return a fragment of XML to embed,
providing another level of dynamic XML generation.
Using Date and
DateTime with strings
If you use a control reference or an InfoMaker expression that does not include
a string to represent Date and DateTime columns in a template, the XML
output conforms to ISO 8601 date and time formats. For example, consider a
date that displays as 12/27/2004 in the report, using the display format
mm/dd/yyyy. If the export template does not use an expression that includes a
string, the date is exported to XML as 2004-12-27.
However, if the export template uses an expression that combines a column
with a Date or DateTime datatype with a string, the entire expression is
exported as a string and the regional settings in the Windows registry are used
to format the date and time.
Using the previous example, if the short date format in the registry is
MM/dd/yy, and the InfoMaker expression is: "Start Date is " +
start_date, the XML output is Start Date is 12/27/04.
Attributes
Controls or expressions can also be referenced for element attribute values.
Select Edit/Add Attribute from the pop-up menu for elements to edit an
existing attribute or add a new one.
378
InfoMaker
CHAPTER 12
Exporting and Importing XML Data
For each attribute specified, you can select a control reference from the
drop-down list or enter a literal text value. A literal text value takes precedence
over a control reference. You can also use the expression button to the right of
the Text box to enter an expression.
The expression button and entry operates similarly to report properties in the
Properties view. The button shows an equals sign if an expression has been
entered, and a not-equals sign if not. A control reference or text value specified
in addition to the expression is treated as a default value. In the template, this
combination is stored with the control reference or text value, followed by a
tab, preceding the expression. For example:
attribute_name=~"text_val~~tdw_expression~"
Composite and nested reports
Report controls can be referenced in the Detail section of export templates as
children of an element.
Nested reports supported for XML export only
Import does not support nested reports. If you attempt to import data in any
format, including XML, CSV, DBF, and TXT, that contains a nested report, the
nested report is not imported and the import may fail with errors.
Users Guide
379
Editing XML templates
Composite reports
For composite reports that use the Composite presentation style, the default
template has elements that reference each of its nested reports.
If a composite report contains two reports that have columns with identical
names, you must use the procedure that follows if you want to generate an
XML document with a DTD or schema. If you do not follow the procedure, you
will receive a parsing error such as “Element ‘identical_column_name’ has
already been declared.”
1
Create a template in the first report and select this template in the Use
Template list on the Data Export property page.
2
Create a template in the second report.
3
If any element name is used in the template in the first report, change it to
another name in the template in the second report.
4
Select the template for the second report in the Use Template list.
5
Generate the XML document.
These steps are necessary because you cannot use a given element name more
than once in a valid DTD or schema.
Nested reports
For report controls added to the detail band of a base report that is related to the
inserted report with retrieval arguments or criteria, the report control is
available to the export template in two ways:
•
Select an element in the template or add a new element, then select Add
Child>DataWindow Control Reference. Any report controls inserted in
the detail band are available for selection in the dialog box that displays.
•
Drag a report control from the Control List view and drop it on an existing
empty element.
When you export XML using a template that has a reference to a report control,
the export template assigned to the nested report with the Use Template
property is used, if it exists, to expand the XML for the nested report. If no
template is specified for the nested report, the default template is used.
The relationship between the nested report and the base report, for example a
Master/Detail relationship, is reflected in the exported XML.
380
InfoMaker
CHAPTER 12
Exporting and Importing XML Data
CDATA sections
You can export the name of a column in a CDATA section using the syntax
<![CDATA[columnname]]>. You can export the value of a column using the
syntax <![CDATA[~t columnname]]>. The ~t is used to introduce an
expression. You can also use an expression such as ~t
columnname*columnname to export a computed value to the XML.
You can import a value into a column using the syntax <![CDATA[
columnname]]>. Note that this syntax in a template has different results for
import and export: it imports the column value but exports the column name.
You cannot import an XML file that has a ~t expression in a CDATA section.
Everything else inside a CDATA section is ignored by the parser. If text
contains characters such as less than or greater than signs (< or >) or
ampersands (&) that are significant to the parser, it should be defined as a
CDATA section. A CDATA section starts with <![CDATA[ and ends with ]]>.
CDATA sections cannot be nested, and there can be no white space characters
inside the ]]> delimiter—for example, you cannot put a space between the two
square brackets.
Example
<![CDATA[
do not parse me
]]>
This syntax in an export template exports the value of the column emp_salary:
<![CDATA[~t emp_salary]]>
This syntax in an import template imports the value of the column emp_salary:
<![CDATA[emp_salary]]>
Comments
Comments can appear anywhere in a document outside other markup. They
can also appear within the document type declaration in specific locations
defined by the XML specification.
Comments begin with <!-- and end with -->. You cannot use the string -(a double hyphen) in a comment, and parameter entity references are not
recognized in comments.
Example
Users Guide
<!-- this is a comment -->
381
Exporting to XML
Processing instructions
Processing instructions (PIs) enable you to provide information to the
application that uses the processed XML. Processing instructions are enclosed
in <? and ?> delimiters and must have a name, called the target, followed by
optional data that is processed by the application that uses the XML. Each
application that uses the XML must process the targets that it recognizes and
ignore any other targets.
The XML declaration at the beginning of an XML document is an example of
a processing instruction. You cannot use the string xml as the name of any other
processing instruction target.
Example
In this example, usething is the name of the target, and thing=this.thing
is the data to be processed by the receiving application:
<?usething thing=this.thing?>
Exporting to XML
You can export the data in a report to XML using the Save Rows As menu item
in the Report painter when the Preview view is open and is the last view
touched. When you export data, InfoMaker uses an export template to specify
the content of the generated XML.
Default export format
If you have not created or assigned an export template, InfoMaker uses a
default export format. This is the same format used when you create a new
default export template. See “Creating templates” on page 370.
OLE reports cannot be exported using a template. You must use the default
format.
382
InfoMaker
CHAPTER 12
Exporting and Importing XML Data
Setting data export properties
The Data Export page in the Properties view lets you set properties for
exporting data to XML.
The Use Template property
The names of all templates that you create and save for the current report
display in the Use Template drop-down list.
The template you select from the list is used to conform the XML to the
specifications defined in the named template.
When you open a report, the Export/Import Template view displays the
template specified in the report’s Use Template property. (If the view is not
visible in the current layout, select View>Export/Import Template>XML from
the menu bar.) If the property has not been set, the first saved template displays
or, if there are no saved templates, the default structured template displays as a
basis for editing.
Template used when
saving
When the report is saved as XML, InfoMaker uses the template specified in the
Use Template property. If the property has not been set, InfoMaker uses the
default template.
When you are working on a template, you might want to see the result of your
changes. The template specified in the Use Template property might not be the
template currently displayed in the Export/Import Template view, so you
should check the value of the Use Template property to be sure you get the
results you expect.
Users Guide
383
Exporting to XML
❖
To save to XML using the current template:
1
Right-click in the Export/Import template view and select Save or Save As
from the pop-up menu to save the current template.
2
On the Data Export page in the properties view, select the current template
from the Use Template drop-down list.
3
Select File>Save Rows As, select XML from the Files of Type drop-down
list, enter a file name, and click Save.
Generating group headers
To generate the contents of the header section iteratively for each group in a
group report, check the Iterate Header for Groups check box. This property is
on by default.
For example, consider a group report that includes the columns sales_order_id
and sales_order_order_date. The following screenshot shows the template for
this report:
The root element in the Header section of the template, Orders, has a child
element, Order. Order has an id attribute whose value is a control reference to
the column sales_order_id. Order also has a child element, OrderDate, that
contains a column reference to the sales_order_order_date column. These
elements make up the header section that will be iterated for each group.
The Detail Start element, Item, has an id attribute whose value is a control
reference to the column sales_order_items_line_id. It also has three child
elements that contain column references to the line items for product ID,
quantity, and ship date.
When the report is exported with the Iterate Header for Groupsproperty on, the
order ID and date iterate for each group. The following XML output shows the
first three iterations of the group header:
<?xml version="1.0" encoding="UTF-16LE"
standalone="no"?>
384
InfoMaker
CHAPTER 12
Exporting and Importing XML Data
<Orders>
<Order id="2001">
<OrderDate>2002-03-14</OrderDate>
<Item id="1">
<Product>300</Product>
<Quantity>12</Quantity>
<ShipDate>2005-09-15</ShipDate>
</Item>
<Item id="2">
<Product>301</Product>
<Quantity>12</Quantity>
<ShipDate>2005-09-14</ShipDate>
</Item>
<Item id="3">
<Product>302</Product>
<Quantity>12</Quantity>
<ShipDate>2005-09-14</ShipDate>
</Item>
</Order>
<Order id="2002">
<OrderDate>2002-03-18</OrderDate>
<Item id="2">
<Product>401</Product>
<Qty>24</Qty>
<ShipDate>2002-09-18</ShipDate>
</Item>
<Item id="1">
<Product>400</Product>
<Qty>24</Qty>
<ShipDate>2002-09-18</ShipDate>
</Item>
</Order>
<Order id="2003">
<OrderDate>2002-03-21</OrderDate>
<Item id="3">
<Product>400</Product>
<Qty>12</Qty>
<ShipDate>2002-09-23</ShipDate>
</Item>
...
Users Guide
385
Exporting to XML
For reports with more than one group, when you generate a new default
template, each group after the first is identified with a special icon and a check
on the pop-up menu next to the Starts Group Header item.
When the Iterate Header for Groups check box is selected, each XML fragment
in the header section between a Group Header element and the next Group
Header element or Detail Start element is iterated.
In the template shown in the previous illustration, sales are grouped by
customer ID, then by order ID. The customer group header has attributes for
the customer’s ID and first and last names. The order group header has
attributes for the order ID and date. The following illustration shows the report
in the Design view:
The following XML output shows the first iteration of the customer group
header and the first and second iterations of the order group header:
<?xml version="1.0" encoding="UTF-16LE" standalone="no"?>
<d_customer>
<customer id="101" fname="Michaels" lname="Devlin">
<order id="2001" date="1996-03-14">
<order_item>
<sales_order_items_line_id>1</sales_order_items_line_id>
<sales_order_items_prod_id>300</sales_order_items_prod_id>
<sales_order_items_quantity>12</sales_order_items_quantity>
386
InfoMaker
CHAPTER 12
Exporting and Importing XML Data
</order_item>
<order_item>
<sales_order_items_line_id>2</sales_order_items_line_id>
<sales_order_items_prod_id>301</sales_order_items_prod_id>
<sales_order_items_quantity>12</sales_order_items_quantity>
</order_item>
<order_item>
<sales_order_items_line_id>3</sales_order_items_line_id>
<sales_order_items_prod_id>302</sales_order_items_prod_id>
<sales_order_items_quantity>12</sales_order_items_quantity>
</order_item>
</order>
<order id="2005" date="1996-03-24">
<order_item>
<sales_order_items_line_id>1</sales_order_items_line_id>
<sales_order_items_prod_id>700</sales_order_items_prod_id>
<sales_order_items_quantity>12</sales_order_items_quantity>
</order_item>
</order>
Formatting the exported XML
By default, the XML is exported without formatting. If you want to view or
verify the exported XML in a text editor, check the Include Whitespace check
box. Turning this property on causes the export process to insert tabs, carriage
returns, and linefeed characters into the XML so that it is easier to read. Most
of the examples in this chapter were exported with this property turned on.
Do not import formatted XML
You should not try to import XML formatted with white space characters,
because the white space between data element tags is considered to be part of
the element.
Exporting metadata
You can specify that metadata in the form of a DTD or schema should be
exported when you save the report. You can choose to save the metadata with
the XML or in a separate file.
If you export metadata as a schema, you can associate it with a namespace. See
“Associating a namespace with an exported schema” on page 390.
Users Guide
387
Exporting to XML
To specify how metadata should be saved, select a value from the Meta Data
Type drop-down list. The possible values are:
•
XMLNone!—No metadata is generated
•
XMLSchema!—An XML schema is generated
•
XMLDTD!—A DTD is generated
If the data item for a column is null or an empty string, an empty element is
created. If you select XMLSchema!, child elements with null data items are
created with the content "xsi:nil='true'".
The metadata is saved into the exported XML itself or into an associated file,
depending on the setting in the SaveMeta Data drop-down list. The possible
values are:
Example: internal
metadata
•
MetaDataInternal!—The metadata is saved into the generated XML
document or string. To save metadata using the .Data.XML expression
syntax, you must use this value.
•
MetaDataExternal!—The metadata is saved as an external file with the
same name as the XML document but with the extension .xsd (for a
schema) or .dtd (for a DTD). A reference to the name of the metadata file
is included in the output XML document.
For example, if you select XMLDTD! and MetaDataInternal!, the header and
first row of the exported XML would look like this for a simple grid report for
the contact table in the EAS Demo DB. The Include Whitespace property has
also been selected and the file name is dtdinternal.xml:
<?xml version="1.0" encoding="UTF-16LE"
standalone="yes"?>
<!DOCTYPE dtdinternal [<!ELEMENT dtdinternal
(dtdinternal_row*)>
<!ELEMENT dtdinternal_row (id, last_name, first_name,
title, street, city, state, zip, phone, fax)>
<!ELEMENT id (#PCDATA)>
<!ELEMENT last_name (#PCDATA)>
<!ELEMENT first_name (#PCDATA)>
<!ELEMENT title (#PCDATA)>
<!ELEMENT street (#PCDATA)>
<!ELEMENT city (#PCDATA)>
<!ELEMENT state (#PCDATA)>
<!ELEMENT zip (#PCDATA)>
<!ELEMENT phone (#PCDATA)>
<!ELEMENT fax (#PCDATA)>
]>
388
InfoMaker
CHAPTER 12
Exporting and Importing XML Data
<dtdinternal>
<dtdinternal_row>
<id>1</id>
<last_name>Hildebrand</last_name>
<first_name>Jane</first_name>
<title>ma</title>
<street>1280 Washington St.</street>
<city>Emeryville</city>
<state>MI</state>
<zip>94608</zip>
<phone>5105551309</phone>
<fax>5105554209</fax>
</dtdinternal_row>
Example: external
metadata
If you select MetaDataExternal! instead, the generated XML in
dtdexternal.xml looks like this:
<?xml version="1.0" encoding="UTF-16LE"?>
<!DOCTYPE dtdexternal SYSTEM "dtdexternal.dtd">
<dtdexternal>
<dtdexternal_row>
<id>1</id>
<last_name>Hildebrand</last_name>
<first_name>Jane</first_name>
<title>ma</title>
<street>1280 Washington St.</street>
<city>Emeryville</city>
<state>MI</state>
<zip>94608</zip>
<phone>5105551309</phone>
<fax>5105554209</fax>
</dtdexternal_row>
The DTD is in dtdexternal.dtd:
<?xml version="1.0" encoding="UTF-16LE"?><!ELEMENT
dtdexternal (dtdexternal_row*)>
<!ELEMENT dtdexternal_row (id, last_name, first_name,
title, street, city, state, zip, phone, fax)>
<!ELEMENT id (#PCDATA)>
<!ELEMENT last_name (#PCDATA)>
<!ELEMENT first_name (#PCDATA)>
<!ELEMENT title (#PCDATA)>
<!ELEMENT street (#PCDATA)>
<!ELEMENT city (#PCDATA)>
<!ELEMENT state (#PCDATA)>
<!ELEMENT zip (#PCDATA)>
<!ELEMENT phone (#PCDATA)>
Users Guide
389
Exporting to XML
<!ELEMENT fax (#PCDATA)>
Associating a
namespace with an
exported schema
If you export metadata in the form of a schema, you can associate a namespace
with the schema. To do so, right-click the root element in the Export/Import
template view and select Schema Options from the pop-up menu. In the dialog
box, specify the namespace prefix and URI.
When the Meta Data Type property is XMLSchema! and the Save Meta Data
property is MetaDataInternal!, so that the XML schema is generated inline, you
can specify a name for the root element. If the root element name is specified,
it appears in the generated XML.
In the following example, the root element name is Contacts, the namespace
prefix is po, and the URI is http://www.example.com/PO1.
The example shows the header and the first row of the generated XML:
<?xml version="1.0" encoding="UTF-16LE"
standalone="no"?>
<Contacts>
<xs:schema xmlns:po="http://www.example.com/PO1"
xmlns:xs="http://www.w3.org/2001/XMLSchema"
targetNamespace="http://www.example.com/PO1"
elementFormDefault="qualified"
attributeFormDefault="unqualified">
<xs:element name="d_contact_list">
<xs:complexType>
<xs:sequence>
<xs:element ref="d_contact_list_row"
maxOccurs="unbounded" minOccurs="0"/>
</xs:sequence>
</xs:complexType>
</xs:element>
<xs:element name="d_contact_list_row">
<xs:complexType>
<xs:sequence>
<xs:element ref="id"/>
<xs:element ref="last_name"/>
<xs:element ref="first_name"/>
<xs:element ref="city"/>
<xs:element ref="state"/>
</xs:sequence>
</xs:complexType>
</xs:element>
<xs:element name="id" type="xs:int"/>
<xs:element name="last_name" type="xs:string"/>
<xs:element name="first_name" type="xs:string"/>
<xs:element name="city" type="xs:string"/>
390
InfoMaker
CHAPTER 12
Exporting and Importing XML Data
<xs:element name="state" type="xs:string"/>
</xs:schema>
<po:d_contact_list xmlns:po=
"http://www.example.com/PO1" xmlns:xsi=
"http://www.w3.org/2001/XMLSchema-instance">
<po:d_contact_list_row>
<po:id>1</po:id>
<po:last_name>Hildebrand</po:last_name>
<po:first_name>Jane</po:first_name>
<po:city>Emeryville</po:city>
<po:state>MI</po:state>
</po:d_contact_list_row>
By default, the generated XML is not associated with a namespace.
Importing XML
You can select XML as a file type in the dialog box that displays when you
select Rows>Import in the Report painter. (The Preview view must be open to
enable the Rows>Import menu item.)
Data can be imported with or without a template. To import data without a
template, the data must correspond to the report column definition. The text
content of the XML elements must match the column order, column type, and
validation requirements of the report columns.
Composite, OLE, and Graph reports
Composite, OLE, and Graph reports cannot be imported using a template. You
must use the default format.
Importing with a template
If the XML document or string from which you want to import data does not
correspond to the report column definition, or if you want to import attribute
values, you must use a template.
If a schema is associated with the XML to be imported, you must create a
template that reflects the schema.
Users Guide
391
Importing XML
For complex, nested XML with row data in an iterative structure, you may need
to design a structure that uses several linked report definitions to import the
data. Each report must define the structure of a block of iterative data with
respect to the root element. Importing the data into the reports would require
multiple import passes using different import templates.
Defining import
templates
The XML import template can be defined in the Export/Import Template view
for XML. If you are defining a template for use only as an import template, do
not include InfoMaker expressions, text, comments, and processing
instructions. These items are ignored when data is imported.
Only mappings from report columns to XML elements and attributes that
follow the Starts Detail marker in the template are used for import. Element and
attribute contents in the header section are also ignored. If the Starts Detail
marker does not exist, all element and attribute to column mappings within the
template are used for import. For more information about the Starts Detail
marker, see “The Detail Start element” on page 372.
Matching template
structure to XML
An XML import template must map the XML element and attribute names in
the XML document to report column names, and it must reflect the nesting of
elements and attributes in the XML.
The order of elements and attributes with column reference content in the
template does not have to match the order of columns within the report,
because import values are located by name match and nesting depth within the
XML. However, the order of elements and attributes in the template must
match the order in which elements and attributes occur in the XML. Each
element or attribute that has column reference content in the template must
occur in each row in the XML document or string. The required elements and
attributes in the XML can be empty.
If an element or attribute does not occur in the XML document, the report
import column remains empty.
The data for the report is held in the columns of the data table. Some data
columns, such as those used for computed fields, may not have an associated
control. To import data into a column that has no control reference, add a child
InfoMaker expression that contains the column name.
Remove tab characters
When you select a column name in the InfoMaker expression dialog box, tab
characters are added before and after the name. You should remove these
characters before saving the expression.
392
InfoMaker
CHAPTER 12
Importing data with
group headers
Exporting and Importing XML Data
For XML import using a template, element and attribute contents in the header
section are ignored. However, if the Starts Detail marker does not exist, all
element and attribute to column mappings within the template are used for
import. This has the following implications for reports with group headers:
•
If data is imported to a Group report using a template that has a Starts
Detail marker, the group header data is not imported because import starts
importing from the Starts Detail location.
•
If the Group report has one group and the import template has no Starts
Detail marker, all the data is imported successfully.
Nested groups cannot be imported
If the Group report has nested groups, the data cannot be imported successfully
even if the Starts Detail marker in the import template is turned off.
Restrictions
Report columns cannot be referenced twice for import. A second column
reference to a report column within an XML import template is ignored.
An XML element or attribute name whose content references a report column
for import must be unique within the level of nesting. It cannot occur twice in
the template at the same nesting level.
Setting the import
template
The names of all templates for the current report display in the Use Template
drop-down list on the Data Import page in the Properties view.
Using export templates for import
If you have already defined an export template for a report, you can use it as an
import template, but only the mapping of column names to element attribute
names is used for import. All other information in the template is ignored.
The template you select in the list box is used to conform the XML imported
to the specifications defined in the named template.
The Data Import page also contains a property that enables you to create a trace
log of the import. See “Tracing import” on page 399.
Users Guide
393
Importing XML
Example
This example uses a report that includes the columns emp_id, emp_fname,
emp_lname, and dept_id. The template used in this example includes only these
columns. Any other columns in the report remain empty when you import
using this template.
To illustrate how template import works, create a new template that has one
element in the header section, called before_detail_marker. This element
contains a column reference to the emp_id column.
The Detail Start element, employee, has an attribute, dept_id, whose value is a
control reference to the column dept_id. It also has three children:
•
The emp_id element contains a column reference to the emp_id column.
•
The emp_fname element contains static text.
•
The name element has two children, emp_fname and emp_lname, that
contain column references to those columns.
The template exports and imports the dept_id report column using the attribute
of the employee element. It exports and imports the emp_id, emp_fname, and
emp_lname columns using the column references in the elements. The
following shows the beginning of the XML exported using this template:
<?xml version="1.0" encoding="UTF-16LE"
standalone="no"?>
<employee_list>
<before_detail_marker>102</before_detail_marker>
<employee dept_id="100">
<emp_id>102</emp_id>
<emp_fname>static text content</emp_fname>
<name>
<emp_fname>Fran</emp_fname>
<emp_lname>Whitney</emp_lname>
394
InfoMaker
CHAPTER 12
Exporting and Importing XML Data
</name>
</employee>
<employee dept_id="100">
<emp_id>105</emp_id>
<emp_fname>static text content</emp_fname>
<name>
<emp_fname>Matthew</emp_fname>
<emp_lname>Cobb</emp_lname>
</name>
</employee>
...
The exported XML can be reimported into the report columns dept_id, emp_id,
emp_fname, and emp_lname. Before importing, you must set the import
template on the Data Import page in the Properties view.
The following items are exported, but ignored on import:
•
The before_detail_marker element is ignored because it is in the header
section.
•
The first occurrence of the element tag name emp_fname is ignored
because it does not contain a mapping to a report column name.
If you change the nesting of the emp_fname and emp_lname elements inside
the name element, the import fails because the order of the elements and the
nesting in the XML and the template must match.
Default data import
When there is no import template assigned to a report with the UseTemplate
property, InfoMaker attempts to import the data using the default mechanism
described in this section.
Elements that contain
text
The text between the start and end tags for each element can be imported if the
XML document data corresponds to the report column definition. For example,
this is the case if the XML was exported from InfoMaker using the default
XML export template.
The text content of the XML elements must match the column order, column
type, and validation requirements of the report columns.
All element text contents are imported in order of occurrence. Any possible
nesting is disregarded. The import process ignores tag names of the elements,
attributes, and any other content of the XML document.
Users Guide
395
Importing XML
Empty elements
Empty elements (elements that have no content between the start and end tags)
are imported as empty values into the report column. If the element text
contains only white space, carriage returns, and new line or tab characters, the
element is treated as an empty element.
Any attributes of empty elements are ignored.
Elements with
non-text content
If the element has no text content, but does contain comments, processing
instructions, or any other content, it is not regarded as an empty element and is
skipped for import.
Example with no empty elements
The three XML documents that follow all show the same result when you
select Rows>Import in the Report painter. The Preview view must be open and
selected to enable the Rows>Import menu item.
The report has five columns: emp_id, emp_fname, emp_lname, phone, and
birth_date.
Example 1
This example contains two rows, each with five elements that match the
column order, type, and validation requirements for the report.
<?xml version="1.0"?>
<d_emp_birth_listing>
<d_emp_birth_row>
<element_1>105</element_1>
<element_2>Matthew</element_2>
<element_3>Cobb</element_3>
<element_4>6175553840</element_4>
<element_5>04/12/1960</element_5>
</d_emp_birth_row>
<d_emp_birth_row>
<element_1>148</element_1>
396
InfoMaker
CHAPTER 12
Exporting and Importing XML Data
<element_2>Julie</element_2>
<element_3>Jordan</element_3>
<element_4>6175557835</element_4>
<element_5>11/12/1951</element_5>
</d_emp_birth_row>
</d_emp_birth_listing>
Example 2
In this example, the elements are not contained in rows, but they still match the
report.
<?xml version="1.0"?>
<root_element>
<element_1>105</element_1>
<element_2>Matthew</element_2>
<element_3>Cobb</element_3>
<element_4>6175553840</element_4>
<element_5>04/12/1960</element_5>
<element_6>148</element_6>
<element_7>Julie</element_7>
<element_8>Jordan</element_8>
<element_9>6175557835</element_9>
<element_10>11/12/1951</element_10>
</root_element>
Example 3
The comments and processing instructions in this example are not imported.
The nesting of the <first> and <last> elements within the <Name> element is
ignored.
<?xml version="1.0"?>
<root_element>
<!-- some comment -->
<row_element><?process me="no"?>105<name Title="Mr">
<first>Matthew</first>
<last>Cobb</last>
</name>
<!-- another comment -->
<phone>6175553840</phone>
<birthdate>04/12/1960</birthdate>
</row_element>
<row_element>148<name Title="Ms">
<first>Julie</first>
<last>Jordan</last>
</name>
<phone>6175557835</phone>
<birthdate>11/12/1951</birthdate>
</row_element>
</root_element>
Users Guide
397
Importing XML
Result
All three XML documents produce this result:
emp_id
emp_fname
emp_lname
phone
birth_date
105
148
Matthew
Julie
Cobb
Jordan
6175553840
6175557835
04/12/1960
11/12/1951
Example with empty elements
Example 4
This example uses the same report, but there are two empty elements in the
XML document. The first has no content, and the second has an attribute but
no content. Both are imported as empty elements.
<?xml version="1.0"?>
<root_element>
<!-- some comment -->
<row_element>
<?process me="no"?>105<name Title="Mr">
<first>Matthew</first>
<!-- another comment -->
<last>Cobb</last>
</name>
<empty></empty>
<birthdate>04/12/1960</birthdate>
</row_element>
<row_element>148<name Title="Ms">
<empty attribute1 = "blue"></empty>
<last>Jordan</last>
</name>
<phone>6175557835</phone>
<birthdate>11/12/1951</birthdate>
</row_element>
</root_element>
Result
The XML document produces this result:
emp_id
105
148
398
emp_fname
Matthew
emp_lname
Cobb
phone
birth_date
04/12/1960
Jordan
6175557835
11/12/1951
InfoMaker
CHAPTER 12
Exporting and Importing XML Data
Tracing import
When you import data from XML with or without a template, you can create a
trace log to verify that the import process worked correctly. The trace log
shows whether a template was used and if so which template, and it shows
which elements and rows were imported.
To create a trace log, select the Trace XML Import check box on in the Data
Import page in the Properties view and specify the name and location of the log
file in the Trace File Name box. If you do not specify a name for the trace file,
InfoMaker generates a trace file with the name pbxmtrc.log in the current
directory.
Example: default
import
The following trace log shows a default import of the department table in the
EAS Demo database:
/*--------------------------------------------------*/
/*
09/10/2005 18:26
*/
/*--------------------------------------------------*/
CREATING SAX PARSER.
NO XML IMPORT TEMPLATE SET - STARTING XML DEFAULT
IMPORT.
DATAWINDOW ROWSIZE USED FOR IMPORT: 3
ELEMENT:
ELEMENT:
ELEMENT:
--- ROW
ELEMENT:
ELEMENT:
ELEMENT:
--- ROW
ELEMENT:
ELEMENT:
ELEMENT:
--- ROW
ELEMENT:
ELEMENT:
ELEMENT:
--- ROW
ELEMENT:
ELEMENT:
ELEMENT:
--- ROW
Users Guide
dept_id: 100
dept_name: R & D
dept_head_id: 501
dept_id: 200
dept_name: Sales
dept_head_id: 902
dept_id: 300
dept_name: Finance
dept_head_id: 1293
dept_id: 400
dept_name: Marketing
dept_head_id: 1576
dept_id: 500
dept_name: Shipping
dept_head_id: 703
399
Importing XML
Example: template
import
The following trace log shows a template import of the department table. The
template used is named t_1. Notice that the report column dept_id is referenced
twice, as both an attribute and a column. The second occurrence is ignored for
the template import, as described in “Restrictions” on page 393. The Detail
Start element has an implicit attribute named __pbband which is also ignored.
/*---------------------------------------------------*/
/*
09/10/2005 18:25
*/
/*---------------------------------------------------*/
CREATING SAX PARSER.
USING XML IMPORT TEMPLATE: t_1
XML NAMES MAPPING TO DATAWINDOW IMPORT COLUMNS:
ATTRIBUTE: /d_dept/d_dept_row NAME: '__pbband'
>>> RESERVED TEMPLATE NAME - ITEM WILL BE IGNORED
ATTRIBUTE: /d_dept/d_dept_row/dept_id_xml_name NAME: 'dept_id'
DATAWINDOW COLUMN: 1, NAME: 'dept_id'
ELEMENT: /d_dept/d_dept_row/dept_id_xml_name
>>> DUPLICATE DATAWINDOW COLUMN REFERENCE: 1, NAME: 'dept_id' - ITEM WILL
BE IGNORED
ELEMENT: /d_dept/d_dept_row/dept_head_id
DATAWINDOW COLUMN: 3, NAME: 'dept_head_id'
ELEMENT: /d_dept/d_dept_row/dept_name
DATAWINDOW COLUMN: 2, NAME: 'dept_name'
ATTRIBUTE: /d_dept/d_dept_row/dept_id_xml_name NAME:
ELEMENT: /d_dept/d_dept_row/dept_head_id: 501
ELEMENT: /d_dept/d_dept_row/dept_name: R & D
--- ROW
ATTRIBUTE: /d_dept/d_dept_row/dept_id_xml_name NAME:
ELEMENT: /d_dept/d_dept_row/dept_head_id: 902
ELEMENT: /d_dept/d_dept_row/dept_name: Sales
--- ROW
ATTRIBUTE: /d_dept/d_dept_row/dept_id_xml_name NAME:
ELEMENT: /d_dept/d_dept_row/dept_head_id: 1293
ELEMENT: /d_dept/d_dept_row/dept_name: Finance
--- ROW
ATTRIBUTE: /d_dept/d_dept_row/dept_id_xml_name NAME:
ELEMENT: /d_dept/d_dept_row/dept_head_id: 1576
ELEMENT: /d_dept/d_dept_row/dept_name: Marketing
--- ROW
ATTRIBUTE: /d_dept/d_dept_row/dept_id_xml_name NAME:
ELEMENT: /d_dept/d_dept_row/dept_head_id: 703
ELEMENT: /d_dept/d_dept_row/dept_name: Shipping
--- ROW
400
'dept_id': 100
'dept_id': 200
'dept_id': 300
'dept_id': 400
'dept_id': 500
InfoMaker
CH A PTE R
1 3
About this chapter
Contents
Working with Graphs
This chapter describes how to build and use graphs in InfoMaker.
Topic
About graphs
Page
401
Using graphs in reports
Using the Graph presentation style
408
420
Defining a graph's properties
421
About graphs
Often the best way to display information is graphically. You can add a
graph to a report and work with it there, or use the Graph presentation style
to create a standalone graph. You can use graphs to supplement the
numbers in a report, or you can replace numbers with a graph.
InfoMaker provides many types of graphs and allows you to customize
your graphs in many ways. Probably most of your use of graphs will be in
a report. The source of the data for your graphs will be the database.
Users Guide
401
About graphs
Parts of a graph
Here is a column graph created in InfoMaker that contains most major parts of
a graph. It shows quarterly sales of three products: Stellar, Cosmic, and
Galactic printers:
How data is represented
Graphs display data points. To define graphs, you need to know how the data
is represented. InfoMaker organizes data into three components.
Table 13-1: Components of a graph
Component
Meaning
Series
Each set of related data points makes up one
series. In the preceding graph, there is a series for Stellar sales,
another series for Cosmic sales, and another series for Galactic
sales. Each series in a graph is distinguished by color, pattern, or
symbol.
The major divisions of the data Series data are divided into
categories, which are often non-numeric. In the preceding graph, the
series are divided into four categories: Q1, Q2, Q3, and Q4.
Categories represent values of the independent variable(s).
The values for the data points (dependent variables).
Categories
Values
402
A set of data points
InfoMaker
CHAPTER 13
Working with Graphs
Organization of a graph
Table 13-2 lists the parts of a typical graph.
Table 13-2: Organization of a graph
Part of graph
What it is
Title
An optional title for the graph. The title appears at the top of the
graph.
The axis of the graph along which the values of the dependent
variable(s) are plotted. In a column graph, as shown in the
preceding graph, the Value axis corresponds to the y axis in an XY
presentation. In other types of graphs, such as a bar graph, the
Value axis can be along the x dimension.
The axis along which are plotted the major divisions of the data,
representing the independent variable(s). In the preceding graph,
the Category axis corresponds to the x axis. It plots four categories:
Q1, Q2, Q3, and Q4. These form the major divisions of data in the
graph.
Value axis
Category axis
Series
Series axis
Legend
Users Guide
A set of data points. There are three series in the preceding graph:
Stellar, Cosmic, and Galactic. In bar and column charts, each series
is represented by bars or columns of one color or pattern.
The axis along which the series are plotted in three-dimensional
(3D) graphs.
An optional listing of the series. The preceding graph contains a
legend that shows how each series is represented in the graph.
403
About graphs
Types of graphs
InfoMaker provides many types of graphs for you to choose from. You choose
the type on the Define Graph Style page in the report wizard or in the General
page in the Properties view for the graph.
Area, bar, column, and line graphs
Area, bar, column, and line graphs are conceptually very similar. They differ
only in how they physically represent the data values—whether they use areas,
bars, columns, or lines to represent the values. All other properties are the
same. Typically you use area and line graphs to display continuous data and use
bar and column graphs to display noncontinuous data.
The only difference between a bar graph and a column graph is the orientation:
in column graphs, values are plotted along the y axis and categories are plotted
along the x axis. In bar graphs, values are plotted along the x axis and
categories are plotted along the y axis.
404
InfoMaker
CHAPTER 13
Working with Graphs
Pie graphs
Pie graphs typically show one series of data points with each data point shown
as a percentage of a whole. The following pie graph shows the sales for Stellar
printers for each quarter. You can easily see the relative values in each quarter.
(InfoMaker automatically calculates the percentages of each slice of the pie.)
You can have pie graphs with more than one series if you want; the series are
shown in concentric circles. Multiseries pie graphs can be useful in comparing
series of data.
Scatter graphs
Scatter graphs show xy data points. Typically you use scatter graphs to show
the relationship between two sets of numeric values. Non-numeric values, such
as string and DateTime datatypes, do not display correctly.
Scatter graphs do not use categories. Instead, numeric values are plotted along
both axes—as opposed to other graphs, which have values along one axis and
categories along the other axis.
For example, the following data shows the effect of speed on the mileage of a
sedan:
Users Guide
Speed
10
Mileage
12
20
30
18
21
40
50
23
26
60
26
405
About graphs
Speed
Mileage
70
80
24
20
Here is the data in a scatter graph:
You can have multiple series of data in a scatter graph. You might want to plot
mileage versus speed for several makes of cars in the same graph.
Three-dimensional graphs
Traditional 3D graphs
406
You can also create 3-dimensional (3D) graphs of area, bar, column, line, and
pie graphs. In 3D graphs (except for 3D pie graphs), series are plotted along a
third axis (the Series axis) instead of along the Category axis. You can specify
the perspective to use to show the third dimension:
InfoMaker
CHAPTER 13
DirectX 3D graphs
Working with Graphs
DirectX 3D rendering allows you to display the 3D graphs (Pie3D, Bar3D,
Column3D, Line3D, and Area3D) with a more sophisticated look. You can use
data item or series transparency with the DirectX graph styles to improve the
presentation of data.
The DirectX graph rendering style is supported for standalone graph controls
and for graph controls in a DataWindow object. PowerBuilder uses the
following functions to support the DirectX graph styles:
GetDataLabelling
SetDataLabelling
GetDataTransparency
GetSeriesLabelling
SetDataTransparency
SetSeriesLabelling
GetSeriesTransparency
SetSeriesTransparency
The DirectX 3D rendering depends on the DirectX runtime.
The first time you select the Render3D check box on the General tab of the
Properties view for a 3D graph, PowerBuilder launches the DirectX installer.
If you opt out of the installation, the Render3D property is ignored. End users
of PowerBuilder applications must also have the DirectX runtime installed on
their computers.
DirectX runtime
If you install DirectX on the runtime computer, but selecting the Render3D
check box does not change the appearance of the graph, it is possible that the
graphics card does not support DirectX.
You can check whether DirectX is supported by running dxdiag.exe. This file
is typically installed in the Windows\System32 directory. The Display tab of the
DirectX Diagnostic Tool that opens when you run dxdiag.exe indicates whether
Direct3D is enabled.
Users Guide
407
Using graphs in reports
Stacked graphs
In bar and column graphs, you can choose to stack the bars and columns. In
stacked graphs, each category is represented as one bar or column instead of as
separate bars or columns for each series:
Using graphs in reports
Graphs in reports are
dynamic
Graphs in reports are tied directly to the data that is in the report. As the data
changes, the graph is automatically updated to reflect the new values.
Two techniques
You can use graphs in reports in two ways:
•
By including a graph as a control in a report
The graph enhances the display of information in a report, such as a tabular
or freeform report. This technique is described in “Placing a graph in a
report” next.
•
By using the Graph presentation style
The entire report is a graph. The underlying data is not visible. This
technique is described in “Using the Graph presentation style” on page
420.
408
InfoMaker
CHAPTER 13
Working with Graphs
Placing a graph in a report
❖
To place a graph in a report:
1
Open or create the report that will contain the graph.
2
Select Insert>Control>Graph from the menu bar.
3
Click where you want the graph.
InfoMaker displays the Graph Data dialog box:
4
Specify which columns contain the data and the type of graph you want,
and click OK.
For more information, see “Associating data with a graph” on page 412.
The Design view now contains a representation of the graph:
5
Users Guide
Specify the graph’s properties in the Properties view.
409
Using graphs in reports
Using the graph's Properties view
A graph has a Properties view in which you can specify the data as well as the
other properties of the graph.
❖
To display the graph’s Properties view:
•
Select Properties from the graph’s pop-up menu.
The Properties view for a graph has several property pages in which you
specify information about the graph. Table 13-3 lists the property pages that
contain properties that are specific to graphs, and describes what each property
page specifies.
Table 13-3: Property page for graphs
Property page
What it specifies
Axis
Labels, scale, information about major and minor divisions for
the category axes.
Where to get the graph's data.
Data
General
Various general graph properties, including border, graph colors,
whether to size the graph to the full screen display, suppression in
newspaper columns.
Graph type, title, legend location.
For 3D graphs, perspective, rotation, elevation, and render3D.
For bar graphs, overlap, spacing and depth of bars.
Pointer
Position
The pointer to use when the mouse is positioned over the graph.
The x,y location of the upper left corner of the graph, its width
and height, sliding options, the layer in which the graph is to be
positioned.
Whether the graph can be resized and moved at runtime.
Text
Other
Text properties for text controls that display on the graph,
including title, axis text, axis label, and legend.
Text properties include font, font style, font size, alignment,
rotation, color, display expression, display format.
Descriptions and label for use by assistive technology tools.
Changing a graph's position and size
When you first place a graph in a report, it is in the foreground—it sits above
the bands in the report. Unless you change this setting, the graph displays in
front of any retrieved data.
410
InfoMaker
CHAPTER 13
Working with Graphs
The initial graph is also moveable and resizable, so you have complete
flexibility as to the size and location of a graph at runtime. You can change
these properties.
❖
To specify a graph’s position and size:
1
Select Properties from the graph’s pop-up menu and then select the
Position page or the General page in the Properties view.
2
Select the settings for the following options on the Position property page:
Table 13-4: Settings on the Position property page for graphs
Setting
Meaning
Layer
Background — The graph displays behind other elements in
the report.
Band — The graph displays in one particular band. If you
choose this setting, you should resize the band to fit the graph.
Often you will want to place a graph in the Footer band. As
you scroll through rows in the report, the graph remains at the
bottom of the screen as part of the footer.
Foreground — (Default) The graph displays above all other
elements in the report. Typically, if you choose this setting,
you also make the graph movable so it will not obscure data
while you display the report.
3
Moveable
Resizable
The graph can be moved in the Preview view and at runtime.
The graph can be resized in the Preview view and at runtime.
Slide Left,
Slide Up
The graph slides to the left or up to remove extra white space.
For more information, see “Sliding controls to remove blank
space in a report” on page 251.
X, Y
Width, Height
The location of the upper-left corner of the graph.
The width and height of the graph.
Select the settings for the following options on the General property page:
Table 13-5: Size and position settings on the General property page
Setting
Meaning
Size To Display The graph fills the report and resizes when you resize the
report. This setting is used with the Graph presentation style.
HideSnaked
Do not repeat graph after the first column in a report using
newspaper-style columns.
Users Guide
411
Using graphs in reports
Associating data with a graph
When using a graph in a report, you associate axes of the graph with columns
in the report.
The only way to get data into a graph in a report is through columns in the
report. You cannot add, modify, or delete data in the graph except by adding,
modifying, or deleting data in the report.
You can graph data from any columns retrieved into the report. The columns
do not have to be displayed.
About the examples
The process of specifying data for a graph is illustrated below using the Printer
table in the EAS Demo DB.
❖
To specify data for a graph:
1
If you are creating a new graph, the Graph Data dialog box displays.
Otherwise, select Properties from the graph’s pop-up menu and select the
Data page in the Properties view.
2
Fill in the boxes as described in the sections that follow, and click OK.
Specifying which rows to include in a graph
The Rows drop-down list allows you to specify which rows of data are graphed
at any one time:
Table 13-6: Specifying which rows to include in a graph
Setting
Meaning
All
Graphs the data from all the rows that have been retrieved but not filtered
or deleted (that is, the rows in the primary buffer of the report)
Graphs only the data from the rows that are currently displayed on the
page
Graphs only the data in the specified group (in a grouped report)
Page
Group n
If you select Group
If you are graphing data in the current group in a grouped report and have
several groups displayed at the same time, you should localize the graph in a
group-related band in the Design view. This makes clear which group the graph
represents. Usually, the group header band is the most appropriate band.
412
InfoMaker
CHAPTER 13
Working with Graphs
Specifying the categories
Specify the column or expression whose values determine the categories. In the
Graph Data page in the Graph dialog box and on the Data page in the Properties
view, you can select a column name from a drop-down list.
There is an entry along the Category axis for each different value of the column
or expression you specify.
Using display values of data
If you are graphing columns that use code tables, when data is stored with a
data value but displayed to you with more meaningful display values, by
default the graph uses the column’s data values. To have the graph use a
column's display values, use the LookupDisplay InfoMaker expression function
when specifying Category or Series. LookupDisplay returns a string that
matches the display value for a column:
LookupDisplay ( column )
For more about code tables, see “Defining a code table” on page 284. For more
about LookupDisplay, see LookUpDisplay on page 701.
Specifying the values
InfoMaker populates the Value drop-down list. The list includes the names of
all the retrieved columns as well as the following aggregate functions:
•
Count for all non-numeric columns
•
Sum for all numeric columns
Select an item from the drop-down list or type an expression (in the Properties
view). For example, if you want to graph the sum of units sold, you can specify:
sum(units for graph)
Users Guide
413
Using graphs in reports
To graph 110 percent of the sum of units sold, you can specify:
sum(units*1.1 for graph)
Specifying the series
Graphs can have one or more series.
Single-series graphs
If you want only one series (that is, if you want to graph all retrieved rows as
one series of values), leave the Series box empty.
Multiple-series graphs
If you want to graph more than one series, select the Series check box and
specify the column that will provide the series values. You can select column
names from the drop-down list.
There is a set of data points for each different value of the column you specify
here. For example, if you specify a column that has 10 values, then your graph
will have 10 series: one set of data points for each different value of the
column.
Using expressions
You can also specify expressions for Series (on the Data page of the Properties
view). For example, you could specify the following for Series:
Units / 1000
In this case, if a table had unit values of 10,000, 20,000, and 30,000, the graph
would show series values of 10, 20, and 30.
Specifying multiple
entries
You can specify more than one of the retrieved columns to serve as series.
Separate multiple entries by commas.
You must specify the same number of entries in the Value box as you do in the
Series box. The first value in the Value box corresponds to the first series
identified in the Series box, the second value corresponds to the second series,
and so on. The example about graphing actual and projected sales in
“Examples” on page 415 illustrates this technique.
414
InfoMaker
CHAPTER 13
Working with Graphs
Examples
This section shows how to specify the data for several different graphs of the
data in the Printer table in the EAS Demo DB. The table records quarterly unit
sales of three printers by three sales representatives.
Table 13-7: The Printer table in the EAS Demo DB
Graphing total sales
Rep
Quarter
Product
Units
Simpson
Jones
Q1
Q1
Stellar
Stellar
12
18
Perez
Simpson
Q1
Q1
Stellar
Cosmic
15
33
Jones
Perez
Q1
Q1
Cosmic
Cosmic
5
26
Simpson
Q1
Galactic
6
Jones
Perez
Q1
Q1
Galactic
Galactic
2
1
…
Simpson
…
Q4
…
Stellar
…
30
Jones
Perez
Q4
Q4
Stellar
Stellar
24
36
Simpson
Jones
Q4
Q4
Cosmic
Cosmic
60
52
Perez
Simpson
Q4
Q4
Cosmic
Galactic
48
3
Jones
Perez
Q4
Q4
Galactic
Galactic
3
6
To graph total sales of printers in each quarter, retrieve all the columns into a
report and create a graph with the following settings on the Data page in the
Properties view:
•
Set Rows to All
•
Set Category to quarter
•
Set Value to sum(units for graph)
Leave the Series check box and text box empty.
Users Guide
415
Using graphs in reports
The Quarter column serves as the category. Because the Quarter column has
four values (Q1, Q2, Q3, and Q4), there will be four categories along the
Category axis. You want only one series (total sales in each quarter), so you can
leave the Series box empty, or type a string literal to identify the series in a
legend. Setting Value to sum(units for graph) graphs total sales in each
quarter.
Here is the resulting column graph. InfoMaker automatically generates the
category text based on the data in the table:
In the preceding graph, there is one set of data points (one series) across four
quarters (the category values).
The following is a pie graph, which has exactly the same properties as the
preceding column graph except for the type, which is Pie:
In pie graphs, categories are shown in the legend.
416
InfoMaker
CHAPTER 13
Graphing unit sales of
each printer
Working with Graphs
To graph total quarterly sales of each printer, retrieve all the columns into a
report and create a graph with the following settings on the Data page in the
Properties view:
•
Set Rows to All
•
Set Category to quarter
•
Set Value to sum(units for graph)
•
Select the Series check box
•
Set Series to product
You want a different series for each printer, so the column Product serves as the
series. Because the Product column has three values (Cosmic, Galactic, and
Stellar), there will be three series in the graph. As in the first example, you want
a value for each quarter, so the Quarter column serves as the category, and you
want to graph total sales in each quarter, so the Value box is specified as
sum(units for graph).
Here is the resulting graph. InfoMaker automatically generates the category
and series labels based on the data in the table. The series labels display in the
graph’s legend:
Graphing unit sales by
representative
Users Guide
To graph quarterly sales made by each representative, create a graph with the
following settings on the Data page in the Properties view:
•
Set Rows to All
•
Set Category to quarter
•
Set Value to sum(units for graph)
•
Select the Series check box
•
Set Series to rep
417
Using graphs in reports
Here is the resulting graph:
Graphing unit sales by
representative and
total sales
To graph quarterly sales made by each representative, plus total sales for each
printer, create a graph with the following settings on the Data page in the
Properties view:
•
Set Rows to All
•
Set Category to quarter, "Total"
•
Set Value to sum(units for graph), sum(units for graph)
•
Select the Series check box
•
Set Series to rep, rep
Here you have two types of categories: the first is Quarter, which shows
quarterly sales, as in the previous graph. You also want a category for total
sales. There is no corresponding column in the report, so you can simply type
the literal “Total” to identify the category. You separate multiple entries with a
comma.
For each of these category types, you want to graph the sum of units sold for
each representative, so the Value and Series values are repeated.
418
InfoMaker
CHAPTER 13
Working with Graphs
Here is the resulting graph:
Notice that InfoMaker uses the literal “Total” supplied in the Category box in
the Graph Data window as a value in the Category axis.
Graphing actual and
projected sales
To graph total quarterly sales of all printers and projected sales for next year,
create a graph with the following settings on the Data page in the Properties
view (you assume that sales will increase by 10% next year):
•
Set Rows to All
•
Set Category to quarter
•
Set Value to sum(units for graph), sum(units*1.1 for graph)
•
Select the Series check box
•
Set Series to 'Actual','Projected'
You are using labels to identify two series, Actual and Projected. Note the
single quotation marks around the literals. For Values, you enter the
expressions that correspond to Actual and Projected sales. For Actual, you use
the same expression as in the examples above, sum(units for graph). For
Projected sales, you multiply each unit sale by 1.1 to get the 10 percent
increase. Therefore, the second expression is sum(units*1.1 for graph).
Users Guide
419
Using the Graph presentation style
Here is the resulting graph. InfoMaker uses the literals you typed for the series
as the series labels in the legend:
Using the Graph presentation style
Instead of embedding a graph in a report, you can use the Graph presentation
style to create a report that is only a graph—the underlying data is not
displayed.
❖
To use the Graph presentation style:
1
Select File>New from the menu bar.
The New dialog box displays.
2
Select the Object tab.
3
Select the Graph presentation style, then click OK.
4
On the Choose Data Source for Graph DataWindow page, specify the data
you want retrieved into the report.
For more information, see Chapter 5, “Defining Reports.”
5
On the Define Graph Data page, enter the definitions for the series,
categories, and values, as described in “Associating data with a graph” on
page 412, and click Next.
Note that when using the Graph presentation style, the graph always
graphs all rows; you cannot specify page or group.
6
420
On the Define Graph Style page, enter a title for the graph, select a graph
type, and click Next.
InfoMaker
CHAPTER 13
7
Working with Graphs
On the Ready to Create Graph DataWindow page, review your
specifications and click Finish.
A model of the graph displays in the Design view.
8
Specify the properties of the graph, as described in “Defining a graph's
properties” next.
9
Save the report in a library.
Defining a graph's properties
This section describes properties of a graph. To define the properties of a graph,
you use the graph’s Properties view. For general information about the
property pages, see “Using the graph's Properties view” on page 410.
Using the General page in the graph's Properties view
You name a graph and define its basic properties on the General page in the
graph’s Properties view.
❖
To specify the basic properties of a graph:
•
About the model
graph in the Design
view
Select Properties from the graph’s pop-up menu and then select the
General page in the Properties view.
As you modify a graph’s properties, InfoMaker updates the model graph shown
in the Design view so that you can get an idea of the graph’s basic layout:
•
InfoMaker uses the graph title and axis labels you specify.
•
InfoMaker uses sample data (not data from your report) to illustrate series,
categories, and values.
In Preview view, InfoMaker displays the graph with data.
Naming a graph
Typically, you do not need to name a graph (the name is used to refer to the
graph in PowerBuilder scripts).
❖
To name a graph:
•
Users Guide
On the General properties page for the graph, assign a meaningful name to
the graph in the Name box.
421
Defining a graph's properties
Defining a graph's title
The title displays at the top of the graph.
❖
To specify a graph's title:
•
On the General properties page for the graph, enter a title in the Title box.
Multiline titles
You can force a new line in a title by embedding ~n.
For information about specifying properties for the title text, see “Specifying
text properties for titles, labels, axes, and legends” on page 423.
Specifying the type of
graph
You can change the graph type at any time
❖
To specify the graph type:
•
Using legends
On the General properties page for the graph, select a graph type from the
Graph Type drop-down list.
A legend provides a key to your graph’s series.
❖
To include a legend for a series in a graph:
•
On the General properties page for the graph, specify where you want the
legend to appear by selecting a value in the Legend drop-down list.
For information on specifying text properties for the legend, see “Specifying
text properties for titles, labels, axes, and legends” on page 423.
Specifying point of
view in 3D graphs
If you are defining a 3D graph, you can specify the point of view that
InfoMaker uses when displaying the graph.
❖
To specify a 3D graph’s point of view:
1
2
422
On the General properties page for the graph, adjust the point of view
along the three dimensions of the graph:
•
To change the perspective, move the Perspective slider.
•
To rotate the graph, move the Rotation slider.
•
To change the elevation, move the Elevation slider.
Define the depth of the graph (the percent the depth is of the width of the
graph) by using the Depth slider.
InfoMaker
CHAPTER 13
Working with Graphs
Sorting data for series and categories
You can specify how to sort the data for series and categories. By default, the
data is sorted in ascending order.
❖
To specify how to sort the data for series and categories in a graph:
1
Select Properties from the graph’s pop-up menu and then select the Axis
page in the Properties view.
2
Select the axis for which you want to specify sorting.
3
Scroll to Sort, the last option on the Axis page, and select Ascending,
Descending, or Unsorted.
Specifying text properties for titles, labels, axes, and legends
A graph can have four text elements:
Title
Labels for the axes
Text that shows the values along the axes
Legend
You can specify properties for each text element.
❖
To specify text properties for the title, labels, axis values, and legend of
a graph:
1
Users Guide
Select Properties from the graph’s pop-up menu and then select the Text
page in the Properties view.
423
Defining a graph's properties
Using Auto Size
2
Select a text element from the list in the Text Object drop-down list.
3
Specify the font and its characteristics.
With Auto Size in effect, InfoMaker resizes the text appropriately whenever
the graph is resized. With Auto Size disabled, you specify the font size of a text
element explicitly.
❖
❖
Rotating text
To have InfoMaker automatically size a text element in a graph:
1
On the Text properties page for the graph, select a text element from the
list in the Text Object drop-down list.
2
Select the Autosize check box (this is the default).
To specify a font size for a text element in a graph:
1
On the Text properties page for the graph, select a text element from the
list in the Text Object drop-down list.
2
Clear the Autosize check box.
3
Select the Font size in the Size drop-down list.
For all the text elements, you can specify the number of degrees by which you
want to rotate the text.
❖
To specify rotation for a text element in a graph:
1
On the Text properties page for the graph, select a text element from the
list in the Text Object drop-down list.
2
Specify the rotation you want in the Escapement box using tenths of a
degree (450 means 45 degrees).
Changes you make here are shown in the model graph in the Design view and
in the Preview view.
424
InfoMaker
CHAPTER 13
Working with Graphs
Using display formats
❖
Modifying display
expressions
To use a display format for a text element in a graph:
1
On the Text properties page for the graph, select a text element from the
list in the Text Object drop-down list.
2
Type a display format in the Format box or choose one from the pop-up
menu. To display the pop-up menu, click the button to the right of the
Format box.
You can specify an expression for the text that is used for each graph element.
The expression is evaluated at execution time.
❖
To specify an expression for a text element in a graph:
1
On the Text properties page for the graph, select a text element from the
list in the Text Object drop-down list.
2
Click the button next to the Display Expression box.
The Modify Expression dialog box displays.
3
Specify the expression.
You can paste functions, column names, and operators. Included with
column names in the Columns box are statistics about the columns, such
as counts and sums.
4
Example
Click OK to return to the graph’s Properties view.
By default, when you generate a pie graph, InfoMaker puts the title at the top
and labels each slice of the pie with the percentage each slice represents of the
whole. Percentages are accurate to two decimal places.
The following graph has been enhanced as follows:
Users Guide
•
The current date displays in the title
•
The percentages are rounded to integers
•
The raw data for each slice is shown in addition to the percentages
425
Defining a graph's properties
To accomplish this, the display expressions were modified for the title and pie
graph labels:
Element
Title
Pie graph
labels
Original expression
Modified expression
title
title + " as of " +
date(today())
if(seriescount > 1,
series, string
(percentofseries,
"0.00%"))
if(seriescount > 1, series,
string(percentofseries,"0%
") + " (" + value + ")" )
Specifying overlap and spacing
With bar and column charts, you can specify the properties in Table 13-8.
Table 13-8: Overlap and spacing properties for bar and column charts
❖
426
Property
Overlap
Meaning
The percentage by which bars or columns overlap each other.
The default is 0 percent, meaning no overlap.
Spacing
The amount of space to leave between bars or columns. The
default is 100 percent, which leaves a space equal to the width of
a bar or column.
To specify overlap and spacing for the bars or columns in a graph:
1
Select Properties from the graph’s pop-up menu and then select the Graph
tab.
2
Specify a percentage for Overlap (% of width) and Spacing (% of width).
InfoMaker
CHAPTER 13
Working with Graphs
Specifying axis properties
Graphs have two or three axes. You specify the axes’ properties in the Axis
page in the graph’s Properties view.
❖
To specify properties for an axis of a graph:
1
Select Properties from the graph’s pop-up menu and then select the Axis
page in the Properties view.
2
Select the Category, the Value, or the Series axis from the Axis drop-down
list.
If you are not working with a 3D graph, the Series Axis options are
disabled.
3
Specifying text
properties
Specify the properties as described next.
You can specify the characteristics of the text that displays for each axis. Table
13-9 shows the two kinds of text associated with an axis.
Table 13-9: Text types associated with each axis of a graph
Type of text Meaning
Text
Text that identifies the values for an axis.
Label
Text that describes the axis. You specify the label text in a painter.
You can use ~n to embed a new line within a label.
For information on specifying properties for the text, see “Specifying text
properties for titles, labels, axes, and legends” on page 423.
Specifying datatypes
The data graphed along the Value, Category, and Series axes has an assigned
datatype. The Series axis always has the datatype String. The Value and
Category axes can have the datatypes listed in Table 13-10.
Table 13-10: Datatypes for Value and Category axes
Axis
Possible datatypes
Both axes (for scatter graph) Number, Date, Time
Value (other graph types)
Number, Date, DateTime, Time
Category (other graph types)
String, Number, Date, DateTime, Time
InfoMaker automatically assigns the datatypes based on the datatype of the
corresponding column; you do not specify them.
Scaling axes
You can specify the properties listed in Table 13-11 to define the scaling used
along numeric axes.
Users Guide
427
Defining a graph's properties
Table 13-11: Properties for scaling on numeric axes
Property
Autoscale
RoundTo,
RoundToUnit
Meaning
If selected (the default), InfoMaker automatically assigns a
scaling for the numbers along the axis.
Specifies how to round the end points of the axis (note that this
just rounds the range displayed along the axis; it does not round
the data itself).
You can specify a number and a unit. The unit is based on the
datatype; you can specify Default as the unit to have InfoMaker
decide for you. For example, if the Value axis is a Date column,
you can specify that you want to round the end points of the axis
to the nearest five years. In this case, if the largest data value is
the year 1993, the axis extends up to 1995, which is 1993 rounded
to the next highest five-year interval.
Using major and
minor divisions
MinimumValue,
MaximumValue
ScaleType
The smallest and largest numbers to appear on the axis (disabled
if you have selected Autoscale).
Specifies linear or logarithmic scaling (common or natural).
ScaleValue
Specifies whether values are displayed as actual values or as a
cumulative value, a percentage, or a cumulative percentage.
You can divide axes into divisions. Each division is identified by a tick mark,
which is a short line that intersects an axis. In the Sales by Printer graphs shown
in “Examples” on page 415, the graph’s Value axis is divided into major
divisions of 50 units each. InfoMaker divides the axes automatically into major
divisions.
❖
To define divisions for an axis of a graph:
1
To divide an axis into a specific number of major divisions, type the
number of divisions you want in the MajorDivisions box.
Leave the number 0 to have InfoMaker automatically create divisions.
InfoMaker labels each tick mark in major divisions. If you do not want
each tick mark labeled, enter a value in the DisplayEveryNLabels box. For
example, if you enter 2, InfoMaker labels every second tick mark for the
major divisions.
2
To use minor divisions, which are divisions within each major division,
type the appropriate number in the MinorDivisions box. To use no minor
divisions, leave the number 0.
When using logarithmic axes
If you want minor divisions, specify 1; otherwise, specify 0.
428
InfoMaker
CHAPTER 13
Representing
divisions with grid and
drop lines
Working with Graphs
You can specify lines to represent the divisions as described in Table 13-12 and
illustrated in Figure 13-1.
Table 13-12: Representing graph divisions with grid and drop lines
Line
Grid line
Drop line
Meaning
A line that extends from a tick mark across the graph. Grid lines make
graphs easier to read.
A line that extends vertically from a data point to its axis (not available
for all graph types).
Figure 13-1: Grid and drop lines in a graph
Using line styles
You can define line styles for the components of a graph listed in Table 13-13.
Table 13-13: Components of a graph that can have line styles
Component
Meaning
PrimaryLine
SecondaryLine
The axis itself
The axis parallel to and opposite the primary axis
OriginLine
Frame
A grid line that represents the value zero
The frame for the axis in 3D graphs (disabled for 2D graphs)
Specifying a pointer
You can specify a pointer to use when the mouse is over a graph while
displaying the report.
❖
Users Guide
To specify a pointer for a graph:
1
Select Properties from the graph’s pop-up menu and then select the Pointer
page in the Properties view.
2
Select a stock pointer from the list, or select a CUR file containing a
pointer.
429
Defining a graph's properties
430
InfoMaker
CH A PTE R
1 4
About this chapter
Contents
Working with Crosstabs
This chapter describes how to build crosstabs.
Topic
About crosstabs
Page
431
Creating crosstabs
Associating data with a crosstab
434
436
Previewing crosstabs
Enhancing crosstabs
442
442
About crosstabs
Cross tabulation is a useful technique for analyzing data. By presenting
data in a spreadsheet-like grid, a crosstab lets you view summary data
instead of a long series of rows and columns. For example, in a sales report
you might want to summarize the quarterly unit sales of each product.
In InfoMaker, you create crosstabs by using the Crosstab presentation
style. When data is retrieved into the report, the crosstab processes all the
data and presents the summary information you have defined for it.
An example
Users Guide
Crosstabs are easiest to understand through an example. Consider the
Printer table in the EAS Demo DB. It records quarterly unit sales of
printers made by sales representatives in one year. (This is the same data
used to illustrate graphs in Chapter 13, “Working with Graphs.”)
431
About crosstabs
Table 14-1: The Printer table in the EAS Demo DB
Rep
Simpson
Quarter
Q1
Product
Stellar
Units
12
Jones
Perez
Q1
Q1
Stellar
Stellar
18
15
Simpson
Jones
Q1
Q1
Cosmic
Cosmic
33
5
Perez
Simpson
Q1
Q1
Cosmic
Galactic
26
6
Jones
Perez
Q1
Q1
Galactic
Galactic
2
1
.
.
.
.
.
.
.
.
.
Simpson
.
Q4
.
Stellar
.
30
Jones
Perez
Q4
Q4
Stellar
Stellar
24
36
Simpson
Jones
Q4
Q4
Cosmic
Cosmic
60
52
Perez
Simpson
Q4
Q4
Cosmic
Galactic
48
3
Jones
Perez
Q4
Q4
Galactic
Galactic
3
6
This information can be summarized in a crosstab. Here is a crosstab that
shows unit sales by printer for each quarter:
432
InfoMaker
CHAPTER 14
Working with Crosstabs
The first-quarter sales of Cosmic printers displays in the first data cell. (As you
can see from the data in the Printer table shown before the crosstab, in Q1
Simpson sold 33 units, Jones sold 5 units, and Perez sold 26 units—totaling 64
units.) InfoMaker calculates each of the other data cells the same way.
To create this crosstab, you only have to tell InfoMaker which database
columns contain the raw data for the crosstab, and InfoMaker does all the data
summarization automatically.
What crosstabs do
Crosstabs perform two-dimensional analysis:
•
The first dimension is displayed as columns across the crosstab.
In the preceding crosstab, the first dimension is the quarter, whose values
are in the Quarter column in the database table.
•
The second dimension is displayed as rows down the crosstab.
In the preceding crosstab, the second dimension is the type of printer,
whose values are in the Product column in the database table.
Each cell in a crosstab is the intersection of a column (the first dimension) and
a row (the second dimension). The numbers that appear in the cells are
calculations based on both dimensions. In the preceding crosstab, it is the sum
of unit sales for the quarter in the corresponding column and printer in the
corresponding row.
Crosstabs also include summary statistics. The preceding crosstab totals the
sales for each quarter in the last row and the total sales for each printer in the
last column.
How crosstabs are
implemented in
InfoMaker
Crosstabs in InfoMaker are implemented as grid reports. Because crosstabs are
grid reports, you can resize and reorder columns when you run the crosstab.
Running a crosstab
You can run a crosstab by previewing it in the Report painter and by running it
from an executable file.
Two types of crosstabs
There are two types of crosstabs:
Users Guide
•
Dynamic
•
Static
433
Creating crosstabs
Dynamic crosstabs
With dynamic crosstabs, InfoMaker builds all the columns and rows in the
crosstab dynamically when you run the crosstab. The number of columns and
rows in the crosstab match the data that exists at runtime.
Using the preceding crosstab as an example, if a new printer was added to the
database after the crosstab was saved, there would be an additional row in the
crosstab when it is run. Similarly, if one of the quarter’s results was deleted
from the database after the crosstab was saved, there would be one less column
in the crosstab when it is run.
By default, crosstabs you build are dynamic.
Static crosstabs
Static crosstabs are quite different from dynamic crosstabs. With static
crosstabs, InfoMaker establishes the columns in the crosstab based on the data
in the database when you define the crosstab. (It does this by retrieving data
from the database when you initially define the crosstab.) No matter what
values are in the database when you later run the crosstab, the crosstab always
has the same columns as when you defined it.
Using the preceding crosstab as an example, if there were four quarters in the
database when you defined and saved the crosstab, there would always be four
columns (Q1, Q2, Q3, and Q4) in the crosstab at runtime, even if the number
of columns changed in the database.
Advantages of
dynamic crosstabs
Dynamic crosstabs are used more often than static crosstabs, for the following
reasons:
•
You can define dynamic crosstabs very quickly because no database
access is required at definition time.
•
Dynamic crosstabs always use the current data to build the columns and
rows in the crosstab. Static crosstabs show a snapshot of columns as they
were when the crosstab was defined.
•
Dynamic crosstabs are easy to modify: all properties for the dynamically
built columns are replicated at runtime automatically. With static
crosstabs, you must work with one column at a time.
Creating crosstabs
❖
To create a crosstab:
1
434
Select File>New from the menu bar.
InfoMaker
CHAPTER 14
Working with Crosstabs
The New dialog box displays.
2
Select the Object tab.
3
Select the Crosstab presentation style, then click OK.
4
On the Choose Data Source for Crosstab DataWindow page, specify the
data you want retrieved into the report.
For more information, see Chapter 5, “Defining Reports.”
5
In the Define Crosstab Rows, Columns, Values page, enter the definitions
for the columns, rows, and cell values in the crosstab.
See “Associating data with a crosstab” on page 436.
6
Click Next.
7
Choose Color and Border settings and click Next.
8
Review your specifications and click Finish.
InfoMaker creates the crosstab.
9
(Optional) Specify other properties of the crosstab.
See “Enhancing crosstabs” on page 442.
10 Save the report in a library.
Users Guide
435
Associating data with a crosstab
Associating data with a crosstab
You associate crosstab columns, rows, and cell values with columns in a
database table or other data source.
❖
To associate data with a crosstab:
1
If you are defining a new crosstab, the Define Crosstab Rows, Columns,
Values dialog box displays after you specify the data source.
2
Specify the database columns that will populate the columns, rows, and
values in the crosstab, as described below.
3
To build a dynamic crosstab, make sure the Rebuild columns at runtime
check box is selected.
For information about static crosstabs, see “Creating static crosstabs” on
page 451.
4
Click Next.
Specifying the information
To define the crosstab, drag the column names from the Source Data box in the
Crosstab Definition dialog box (or Wizard page) into the Columns, Rows, or
Values box, as appropriate.
If you change your mind or want to edit the report later, select Design>Crosstab
from the menu bar and drag the column name out of the Columns, Row, or
Values box and drop it. Then specify a different column.
436
InfoMaker
CHAPTER 14
Working with Crosstabs
Dynamic crosstab
example
The process is illustrated using the following dynamic crosstab. The columns
in the database are Rep, Quarter, Product, and Units. The crosstab shows the
number of printers sold by Quarter:
Specifying the
columns
You use the Columns box to specify one or more of the retrieved columns to
provide the columns in the crosstab. When you run the crosstab, there is one
column in the crosstab for each unique value of the database column(s) you
specify here.
❖
To specify the crosstab’s columns:
•
Drag the database column from the Source Data box into the Columns
box.
Using the printer example, to create a crosstab where the quarters form the
columns, specify Quarter as the Columns value. Because there are four values
in the table for Quarter (Q1, Q2, Q3, and Q4), there are four columns in the
crosstab.
Specifying the rows
You use the Rows box to specify one or more of the retrieved columns to
provide the rows in the crosstab. When you run the crosstab, there is one row
in the crosstab for each unique value of the database column(s) you specify
here.
❖
To specify the crosstab’s rows:
•
Drag the database column from the Source Data box into the Rows box.
Using the printer example, to create a crosstab where the printers form the
rows, specify Product as the Rows value. Because there are three products
(Cosmic, Galactic, and Stellar), at runtime there are three rows in the crosstab.
Users Guide
437
Associating data with a crosstab
Columns that use code tables
If you specify columns in the database that use code tables, where data is stored
with a data value but displayed with more meaningful display values, the
crosstab uses the column’s display values, not the data values. For more
information about code tables, see Chapter 8, “Displaying and Validating
Data.”
Specifying the values
Each cell in a crosstab holds a value. You specify that value in the Values box.
Typically you specify an aggregate function, such as Sum or Avg, to summarize
the data. At runtime, each cell has a calculated value based on the function you
provide here and the column and row values for the particular cell.
❖
To specify the crosstab’s values:
1
Drag the database column from the Source Data box into the Values box.
InfoMaker displays an aggregate function for the value. If the column is
numeric, InfoMaker uses Sum. If the column is not numeric, InfoMaker
uses Count.
2
If you want to use an aggregate function other than the one suggested by
InfoMaker, double-click the item in the Values box and edit the
expression. You can use any of the other aggregate functions supported in
the Report painter, such as Max, Min, and Avg.
Using the printer example, you would drag the Units column into the Values
box and accept the expression sum(units for crosstab).
Using expressions
Instead of simply specifying database columns, you can use any valid
InfoMaker expression to define the columns, rows, and values used in the
crosstab. You can use any InfoMaker expression function in the expression.
For example, say a table contains a date column named SaleDate, and you want
a column in the crosstab for each month. You could enter the following
expression for the Columns definition:
Month(SaleDate)
The Month function returns the integer value (1–12) for the specified month.
Using this expression, you get columns labeled 1 through 12 in the crosstab.
Each database row for January sales is evaluated in the column under 1, each
database row for February sales is evaluated in the column under 2, and so on.
438
InfoMaker
CHAPTER 14
❖
Working with Crosstabs
To specify an expression for columns, rows, or values:
1
In the Crosstab Definition dialog box (or wizard page), double-click the
item in the Columns, Rows, or Values box.
The Modify Expression dialog box displays.
2
Specify the expression and click OK.
Viewing the crosstab
After you have specified the data for the crosstab’s columns, rows, and values,
InfoMaker displays the crosstab definition in the Design view.
For example, to create the dynamic crosstab shown as the “Dynamic crosstab
example” on page 437, you would:
Users Guide
1
Drag the quarter column from the Source Data box to the Columns box.
2
Drag the product column from the Source Data box to the Rows box.
3
Drag the units column from the Source Data box to the Values box and
accept the expression sum(units for crosstab).
4
Select the Rebuild columns at runtime check box.
439
Associating data with a crosstab
In the Design view, the crosstab looks like this:
Notice that in the Design view, InfoMaker shows the quarter entries using the
symbolic notation @quarter (with dynamic crosstabs, the actual data values
are not known at definition time). @quarter is resolved into the actual data
values (in this case, Q1, Q2, Q3, and Q4) when the crosstab runs.
The crosstab is generated with summary statistics: the rows and columns are
totaled for you.
At this point, the crosstab looks like this in the Preview view with data
retrieved:
440
•
Because quarter was selected as the Columns definition, there is one
column in the crosstab for each unique quarter (Q1, Q2, Q3, and Q4).
•
Because product was selected as the Rows definition, there is one row in
the crosstab for each unique product (Cosmic, Galactic, and Stellar).
•
Because sum(units for crosstab) was selected as the Values
definition, each cell contains the total unit sales for the corresponding
quarter (the Columns definition) and product (the Rows definition).
•
InfoMaker displays the grand totals for each column and row in the
crosstab.
InfoMaker
CHAPTER 14
Working with Crosstabs
Specifying more than one row or column
Typically you specify one database column as the Columns definition and one
database column for the Rows definition, as in the printer crosstab. But you can
specify as many columns (or expressions) as you want.
For example, consider a crosstab that has the same specification as the crosstab
in “Viewing the crosstab” on page 439, except that two database columns,
quarter and rep, have been dragged to the Columns box.
InfoMaker displays this in the Design view:
This is what you see at runtime:
For each quarter, the crosstab shows sales of each printer by each sales
representative.
Users Guide
441
Previewing crosstabs
Previewing crosstabs
When you have defined the crosstab, you can see it with data in the Preview
view.
❖
To preview the crosstab:
1
If the Preview view is not open, select View>Preview from the menu bar
to display the Preview view.
2
Click on the Preview view to be sure it is current.
3
Select Rows>Retrieve from the menu bar.
InfoMaker retrieves the rows and performs the cross tabulation on the
data.
Retrieve on Preview makes retrieval happen automatically
If the crosstab definition specifies Retrieve on Preview, retrieval happens
automatically when the Preview view first displays.
4
Continue enhancing your report and retrieve again when necessary to see
the results of your enhancements.
Enhancing crosstabs
When you have provided the data definitions, the crosstab is functional, but
you can enhance it before using it. Because a crosstab is a grid report, you can
enhance a crosstab using the same techniques you use in other reports. For
example, you can:
•
Sort or filter rows
•
Change the column headers
•
Specify fonts and borders
•
Specify column display formats
For more on these and the other standard enhancements you can make to
reports, see Chapter 6, “Enhancing Reports.”
442
InfoMaker
CHAPTER 14
Working with Crosstabs
The rest of this section covers topics either unique to crosstabs or especially
important when working with crosstabs:
•
“Specifying basic properties” next
•
“Modifying the data associated with the crosstab” on page 444
•
“Changing the names used for the columns and rows” on page 444
•
“Defining summary statistics” on page 445
•
“Cross-tabulating ranges of values” on page 448
•
“Creating static crosstabs” on page 451
•
“Using property conditional expressions” on page 452
Specifying basic properties
Crosstabs are implemented as grid reports, so you can specify the following
grid properties for a crosstab:
❖
•
When grid lines are displayed
•
What is allowed when you run the report
To specify the crosstab’s basic properties:
1
In the Properties view, select the General tab.
2
Specify basic crosstab properties.
Table 14-2 lists basic crosstab properties.
Table 14-2: Basic properties for crosstabs
Option
Display
Result
On – Grid lines always display.
Off – Grid lines never display (columns cannot be resized at
runtime).
Display Only – Grid lines display only when the crosstab
displays online.
Print Only – Grid lines display only when the contents of the
crosstab are printed.
Column Moving
Mouse Selection
Row Resize
Users Guide
Columns can be moved at runtime.
Data can be selected at runtime (and, for example, copied to
the clipboard).
Rows can be resized at runtime.
443
Enhancing crosstabs
Modifying the data associated with the crosstab
When you initially define the crosstab, you associate the crosstab rows and
columns with columns in a database table or other data source. You can change
the associated data at any time in the Crosstab Definition dialog box.
❖
To open the Crosstab Definition dialog box:
1
Position the mouse below the footer band in the workspace and display the
pop-up menu.
2
Select Crosstab from the pop-up menu.
The Crosstab Definition dialog box displays.
❖
To modify the data associated with a crosstab:
1
In the Crosstab Definition dialog box, fill in the boxes for Columns, Rows,
and Values as described in “Associating data with a crosstab” on page
436.
2
Click OK.
Changing the names used for the columns and rows
Sometimes names of columns in the database might not be meaningful. You
can change the names that are used to label rows and columns in crosstabs so
that the data is easier to understand.
❖
To change the names used in crosstabs:
1
In the Crosstab Definition dialog box, double-click the name of the
column in the Source Data box.
The New Name dialog box displays:
2
Specify the name you want used to label the corresponding column. You
can have multiple-word labels by using underscores: underscores are
replaced by spaces in the Design view and at runtime.
3
Click OK.
InfoMaker changes the column name in the Source Data box and
anywhere else the column is used.
Example
444
For example, if you want the product column to be labeled Printer Model,
double-click product in the Crosstab Definition dialog box and specify
printer_model in the New Name dialog box.
InfoMaker
CHAPTER 14
Working with Crosstabs
When the crosstab runs, you see this:
Defining summary statistics
When you generate a crosstab, the columns and rows are automatically totaled
for you. You can include other statistical summaries in crosstabs as well. To do
that, you place computed fields in the workspace.
❖
To define a column summary:
1
Enlarge the summary band to make room for the summaries.
2
Select Insert>Control>Computed Field from the menu bar.
3
Click the cell in the summary band where you want the summary to
display.
The Modify Expression dialog box displays.
4
Define the computed field.
For example, if you want the average value for a column, specify
avg(units for all), where units is the column providing the values in
the crosstab.
Users Guide
445
Enhancing crosstabs
For example, this is a crosstab that has been enhanced to show averages and
maximum values for each column. This is the Design view:
This is the crosstab at runtime:
❖
To define a row summary:
1
Select Insert>Control>Computed Field from the menu bar.
2
Click the empty cell to the right of the last column in the detail band.
The Modify Expression dialog box displays.
3
446
Define the computed field. You should use one of the crosstab functions,
described next.
InfoMaker
CHAPTER 14
Working with Crosstabs
Using crosstab functions
There are nine special functions you can use only in crosstabs: CrosstabAvg,
CrosstabAvgDec, CrosstabCount, CrosstabMax, CrosstabMaxDec, CrosstabMin,
CrosstabMinDec, CrosstabSum, and CrosstabSumDec.
These functions are listed in the Functions box when you define a computed
field in a crosstab:
Each of these functions returns the corresponding statistic about a row in the
crosstab (average, count, maximum value, minimum value, or sum). You place
computed fields using these functions in the detail band in the Design view.
Use the functions with the Dec suffix when you want to return a decimal
datatype.
By default, InfoMaker places CrosstabSum and CrosstabSumDec in the detail
band, which returns the total for the corresponding row.
How to specify the
functions
Each of these functions takes one numeric argument, which refers to the
expression defined for Values in the Crosstab Definition dialog box. The first
expression for Values is numbered 1, the second is numbered 2, and so on.
Generally, crosstabs have only one expression for Values, so the argument for
the crosstab functions is 1. So, for example, if you defined sum(units for
crosstab) as your Values expression, InfoMaker places CrosstabSum(1) in
the detail band.
If you want to cross-tabulate both total unit sales and a projection of future
sales, assuming a 20 percent increase in sales (that is, sales that are 1.2 times
the actual sales), you define two expressions for Values:
sum(units for crosstab)
sum(units * 1.2 for crosstab)
Users Guide
447
Enhancing crosstabs
Here CrosstabSum(1) returns the total of sum(units for crosstab) for
the corresponding row. CrosstabSum(2) returns the total for sum(units *
1.2 for crosstab).
For more information
For complete information about defining computed fields, see Chapter 6,
“Enhancing Reports.”
For more about the crosstab functions, see Chapter 24, “DataWindow
Expression and InfoMaker Functions.”
Cross-tabulating ranges of values
You can build a crosstab where each row tabulates a range of values, instead
of one discrete value, and you can make each column in the crosstab
correspond to a range of values.
For example, in cross-tabulating departmental salary information, you might
want one row in the crosstab to count all employees making between $30,000
and $40,000, the next row to count all employees making between $40,000 and
$50,000, and so on.
❖
To cross-tabulate ranges of values:
1
Determine the expression that results in the raw values being converted
into one of a small set of fixed values.
Each of those values will form a row or column in the crosstab.
2
Specify the expression in the Columns or Rows box in the Crosstab
Definition dialog box.
You choose the box depending on whether you want the columns or rows
to correspond to the range of values.
3
Example
In the Values column, apply the appropriate aggregate function to the
expression.
This is best illustrated with an example.
You want to know how many employees in each department earn between
$30,000 and $40,000, how many earn between $40,000 and $50,000, how
many earn between $50,000 and $60,000, and so on. To do this, you want a
crosstab where each row corresponds to a $10,000 range of salary.
448
InfoMaker
CHAPTER 14
Working with Crosstabs
The first step is to determine the expression that, given a salary, returns the next
smaller salary that is a multiple of $10,000. For example, given a salary of
$34,000, the expression would return $30,000, and given a salary of $47,000,
the expression would return $40,000. You can use the Int function to
accomplish this, as follows:
int(salary/10000) * 10000
That expression divides the salary by 10,000 and takes the integer portion, then
multiplies the result by 10,000. So for $34,000, the expression returns $30,000,
as follows:
34000/10000 = 3.4
int(3.4) = 3
3 * 10000 = 30000
With this information you can build the crosstab. The following uses the
Employee table in the EAS Demo DB:
1
Build a crosstab and retrieve the dept_id and salary columns.
2
In the Crosstab Definition dialog box, drag the dept_id column to the
Columns box.
3
Drag the salary column to the Rows box and to the Values box and edit the
expressions.
In the Rows box, use:
int(salary/10000) * 10000
In the Values box, use:
count(int(salary/10000) * 10000 for crosstab)
For more on providing expressions in a crosstab, see “Using expressions”
on page 438.
4
Users Guide
Click OK.
449
Enhancing crosstabs
This is the result in the Design view:
This is the crosstab at runtime:
You can see, for example, that 2 people in department 400 and 5 in department
500 earn between $20,000 and $30,000.
Displaying blank
values as zero
450
In the preceding crosstab, several of the cells in the grid are blank. There are
no employees in some salary ranges, so the value of those cells is null. To make
the crosstab easier to read, you can add a display format to fields that can have
null values so that they display a zero.
InfoMaker
CHAPTER 14
❖
Working with Crosstabs
To display blank values in a crosstab as zero:
1
Select the column you want to modify and click the Format tab in the
Properties view.
2
Replace [General] in the Format box with ###0;###0;0;0.
The fourth section in the mask causes a null value to be represented as
zero.
Creating static crosstabs
By default, crosstabs are dynamic: when you run them, InfoMaker retrieves the
data and dynamically builds the columns and rows based on the retrieved data.
For example, if you define a crosstab that computes sales of printers and a new
printer type is entered in the database after you define the crosstab, you want
the new printer to be in the crosstab. That is, you want InfoMaker to build the
rows and columns dynamically based on current data, not the data that existed
when the crosstab was defined.
Occasionally, however, you might want a crosstab to be static. That is, you
want its columns to be established when you define the crosstab. You do not
want additional columns to display in the crosstab at runtime; no matter what
the data looks like, you do not want the number of columns to change. You
want only the updated statistics for the predefined columns. The following
procedure shows how to do that.
❖
What happens
Users Guide
To create a static crosstab:
1
In the wizard page or in the Crosstab Definition dialog box, clear the
Rebuild columns at runtime check box.
2
Define the data for the crosstab as usual, and click OK.
With the check box cleared, instead of immediately building the crosstab’s
structure, InfoMaker first retrieves the data from the database. Using the
retrieved data, InfoMaker then builds the crosstab structure and displays the
workspace. It places all the values for the column specified in the Columns box
in the workspace. These values become part of the crosstab’s definition.
451
Enhancing crosstabs
For example, in the following screenshot, the four values for Quarter (Q1, Q2,
Q3, and Q4) are displayed in the Design view:
At runtime, no matter what values are in the database for the column, the
crosstab shows only the values that were specified when the crosstab was
defined. In the printer example, the crosstab always has the four columns it had
when it was first defined.
Making changes
You can modify the properties of any of the columns in a static crosstab. You
can modify the properties of each column individually, since each column is
displayed in the workspace as part of the crosstab’s definition. For example, in
the printer crosstab you can directly modify the way values are presented in
each individual quarter, since each quarter is represented in the Design view.
(The values are shown as units, units_1, units_2, and units_3.)
Using property conditional expressions
As with other reports, you can specify property conditional expressions to
modify properties at runtime. You can use them with either dynamic or static
crosstabs. With dynamic crosstabs, you specify an expression once for a
column or value, and InfoMaker assigns the appropriate properties when it
builds the individual columns at runtime. With static crosstabs, you have to
specify an expression for each individual column or value, because the
columns are already specified at definition time.
452
InfoMaker
CHAPTER 14
Example
Working with Crosstabs
In the following crosstab, an expression has been specified for Units:
The expression is for the Font.Weight property of the units column:
if (units > 100, 700, 400)
The expression specifies to use bold font (weight = 700) if the number of units
is greater than 100. Otherwise, use normal font (weight = 400).
This is the crosstab at runtime:
Values larger than 100 are shown in bold.
For more information about property conditional expressions, see Chapter 10,
“Highlighting Information in Reports and Forms.”
Users Guide
453
Enhancing crosstabs
454
InfoMaker
CH A PTE R
About this chapter
Contents
1 5
Working with TreeViews
This chapter describes how to build and use reports in InfoMaker using the
TreeView presentation style.
Topic
TreeView presentation style
Page
455
Creating a new TreeView report
Adding and deleting TreeView levels
456
461
Selecting a tree node and navigating the tree
Sorting rows in a TreeView report
462
463
TreeView report Design view
Setting properties for the TreeView report
464
465
TreeView presentation style
The TreeView presentation style provides an easy way to create reports
that display hierarchical data in a TreeView, where the rows are divided
into groups that can be expanded and collapsed. A TreeView report
displays a hierarchy of nodes, similar to the way the left pane of Windows
Explorer displays folders and files.
In the TreeView report, each parent node contains other nodes called child
nodes. You can display parent nodes—nodes that contain child nodes—in
expanded or collapsed form.
With the TreeView report presentation style, you can group data in a
hierarchy that allows users to browse the data and expand nodes to view
details. Each TreeView level or node has an icon that users can click to
expand or collapse the node.
You use the TreeView report wizard to create a TreeView report. For
information, see “Creating a new TreeView report” on page 456.
Users Guide
455
Creating a new TreeView report
Example
This sample TreeView report uses the department and employee tables in the
EAS Demo DB database and has two TreeView levels. The first level is the
department name. The second level is the city where each employee resides.
The detail data for each employee is grouped in TreeView leaf nodes under
these two levels.
Similarities to the
Group presentation
style
Creating and using a TreeView report is similar to creating and using a Group
report. However, with the TreeView report, you can click the state icon to
expand and collapse nodes.
The state icon in a TreeView DataWindow is a plus sign (+) when the node is
collapsed and a minus sign (-) when the node is expanded. When a node is
expanded, connecting lines display by default to show more detail and indicate
how the parent data connects with the child data. When a node is collapsed,
only the parent data displays; the detail data does not.
Creating a new TreeView report
You use the TreeView wizard and the Report painter to create a TreeView
report.
456
InfoMaker
CHAPTER 15
Working with TreeViews
TreeView creation process
A TreeView report has multiple levels, each of which is a node in the TreeView.
You use the TreeView wizard to create a TreeView report, but the wizard
produces a DataWindow that includes only the top level of the TreeView.
Creating a complete TreeView report involves three steps:
1
Using the TreeView report wizard to create the top level (level 1) of the
TreeView report.
2
Using the Report painter to add additional levels to the TreeView report.
3
Setting TreeView report properties to customize the TreeView style.
For information about adding and deleting TreeView levels, see “Adding and
deleting TreeView levels” on page 461. For information about setting
properties in the report painter, see “Setting properties for the TreeView
report” on page 465.
Creating a TreeView report
❖
To create a TreeView report:
1
Select File>New from the menu bar and select the Object tab.
2
Choose the TreeView presentation style for the report and click OK.
3
Select the data source you want to use.
You are prompted to specify the data.
Users Guide
457
Creating a new TreeView report
4
Define the tables and columns you want to use.
You are prompted to specify the TreeView grouping columns.
Multiple columns and multiple TreeView levels
You can specify more than one column, but all columns apply to TreeView
level one. At this point, you can define only one TreeView level. You
define additional levels later.
In the following example, TreeView grouping will be by department, as
specified by the dept_id column:
If you want to use an expression, you can define it when you have
completed the wizard. See “Using an expression for a column name” on
page 460.
The sample report shown in “Example” on page 456 uses the department
and employee tables in the EAS Demo DB database.
5
Specify the column or columns that will be at the top level (level 1) of the
TreeView report.
The sample report uses the department name as the top level. If you want
to display both the department ID and department name, you specify that
both columns are at the top level.
6
If you want the TreeView report to display grid lines, select the Grid Style
check box.
When you select the Grid Style check box, the TreeView report displays
grid lines for rows and columns. You can drag the grid lines to resize rows
and columns.
458
InfoMaker
CHAPTER 15
Working with TreeViews
7
Click Next.
8
Modify the default color and border settings if needed, and then click
Next.
9
Review the TreeView report characteristics.
10 Click Finish.
The report painter Design view displays. For information about the Design
view, see “TreeView report Design view” on page 464. For information about
adding additional levels, see “Adding and deleting TreeView levels” on page
461.
What InfoMaker does
As a result of your specifications, InfoMaker generates a TreeView report and
creates:
•
A TreeView header band with controls that include the heading text of the
detail band columns
•
The first TreeView level band with the TreeView level columns you chose
in the wizard
•
The detail (leaf node) band that includes all the column controls except for
first-level columns you selected in the wizard
•
A level 1 trailer band.
•
A summary band, and a footer band.
Here is the sample TreeView report in the Design view:
Users Guide
459
Creating a new TreeView report
If you selected the Grid Style check box, vertical and horizontal grid lines
display:
Here is the sample TreeView report in the Preview view:
Using an expression
for a column name
If you want to use an expression for one or more column names in a TreeView,
you can enter it as the TreeView definition on the General page in the
Properties view after you finish using the TreeView wizard.
❖
To use an expression for a TreeView column name:
1
Open the Properties view and click the TreeView level band in the Design
view.
2
Click the ellipsis button next to the TreeView Level Definition box on the
General page in the Properties view to open the Specify Group Columns
dialog box.
3
In the Columns box, double-click the column you want to use in an
expression.
The Modify Expression dialog box opens. You can specify more than one
grouping item expression for a group. A break occurs whenever the value
concatenated from each column/expression changes.
460
InfoMaker
CHAPTER 15
What you can do
Working with TreeViews
All of the techniques available in a tabular report, such as moving controls and
specifying display formats, are available for modifying and enhancing
TreeView reports. See “Adding and deleting TreeView levels” next to read
more about the bands in a TreeView report and see how to add features
especially suited for TreeView reports, such as additional TreeView levels or
summary statistics.
Report is not updatable by default
When you generate a report using the TreeView presentation style, InfoMaker
makes it not updatable by default. If you want to be able to update the database
through the TreeView report, you must modify its update characteristics. For
more information, see Chapter 19, “Controlling Updates in Forms.”
Adding and deleting TreeView levels
You add and delete TreeView levels using the Rows menu in the Report
painter.
❖
To create an additional level in a TreeView report:
1
Open the TreeView report if it is not already open.
2
Select Rows>Create TreeView Level from the menu bar.
The Specify Group Columns dialog box displays.
3
Specify the columns you want to set as the next TreeView level by
dragging them from the Source Data pane to the Columns pane.
In the sample report shown in “Example” on page 456, the second level
has a single column, the employee_city column.
Users Guide
461
Selecting a tree node and navigating the tree
4
Click OK.
The new TreeView level and a Trailer band for that level are created in the
TreeView Design view. For information on how to set properties for a
TreeView level, see “Setting TreeView level properties” on page 467.
❖
To delete a level in a TreeView report:
1
Select Rows>Delete TreeView Level from the menu bar.
2
Select the number of the level to delete from the list of levels that displays.
The level in the TreeView report is deleted immediately.
If you delete a level by mistake
If you unintentionally delete a level, close the TreeView report without
saving changes, then reopen it and continue working.
Selecting a tree node and navigating the tree
You can select a tree node in the TreeView report by setting the Select Node By
Mouse property to “true” and clicking a tree node to select it with the mouse.
After you select a tree node in the TreeView report, you can navigate the tree
using the up, down, left, and right keys.
462
Use this key
To do this
Up
Down
Select a tree node prior to the currently selected node.
Select a tree node next to the currently selected node.
Left
Collapse the currently selected node. If the current tree node is a
leaf node or the node has been collapsed, the report just scrolls to
the left, which is its normal behavior.
Right
Expand the currently selected node. If the current tree node is a leaf
node or the node has been expanded, the report just scrolls to the
right, which is its normal behavior.
InfoMaker
CHAPTER 15
Working with TreeViews
Sorting rows in a TreeView report
❖
To sort the rows within levels in a TreeView report:
1
Select Rows>Sort from the menu bar.
2
Drag the columns that you want to sort the rows on from the Source Data
box to the Columns box.
The order of the columns determines the precedence of the sort. The sort order
is ascending by default. To sort in descending order, clear the Ascending check
box.
For example, the sample report shown in “Example” on page 456 has
department name as the first level and the employee’s city of residence as the
second level.
Other actions you can
take
Users Guide
To reorder the columns, drag them up or down in the list. To delete a column
from the sort columns list, drag the column outside the dialog box. To specify
an expression to sort on, double-click a column name in the Columns box and
modify the expression in the Modify Expression dialog box.
463
TreeView report Design view
TreeView report Design view
The Design view for the TreeView report differs from the traditional Design
view for most report presentation styles.
The Design view has a header band, a TreeView level band for each added
level, a detail band, a Trailer band for each level, a summary band, and a footer
band.
By default, the controls in the header band are the heading text of the detail
band columns, and the controls in the detail (leaf node) band are all the column
controls except for the first-level columns (in the 1:Treeview level band) that
you selected when you used the TreeView wizard. Columns that you specify as
additional levels remain in the detail band.
The minimum height of each TreeView level band is the height of the tree node
icon.
Icons in the Design
view
464
There are three icons in the Design view that represent the locations of nodes,
icons, and connecting lines in the tree to help you design the report. Columns
must always display to the right of the state and tree node icons:
•
A square icon with a plus sign (+) in each TreeView level band represents
the position of the state icon, the icon that indicates whether a node is
expanded or collapsed. On the XP platform, the plus (+) and minus (-)
icons have the Windows XP style.
•
A shaded square icon in the detail band and in each TreeView level band
represents the position of the image you specify as a tree node icon.
InfoMaker
CHAPTER 15
•
Working with TreeViews
When there is no tree node icon specified, a shaded square icon in the
detail band and in each TreeView level band represents where the
connecting line ends.
The position of all the icons changes when you change the indent value.
For more information about specifying icons and the indent value, see “Setting
properties for the TreeView report.”
Setting properties for the TreeView report
You can set three types of properties for the TreeView report:
Specifying images for
tree node icons
•
General properties
•
TreeView level properties
•
Detail band properties
In the sample report shown in “Creating a new TreeView report” on page 456,
different tree node icons display for collapsed and expanded levels. The icons
are also different for each level. You specify images for these icons as
TreeView level band properties.
The sample report also displays a tree node icon next to every row in the detail
band. You specify an image for this icon as a detail band property.
Tree node icons do not display by default. After specifying images for icons,
select the Use Tree Node Icon general property.
Users Guide
465
Setting properties for the TreeView report
Setting general TreeView properties
You set most TreeView report properties on the General page in the Properties
view for the report.
The properties that are specific to a TreeView report are the TreeView
properties and the Grid properties. The grid-related properties display only if
you select the Grid Style check box when you define the TreeView report.
Property
Display
Description
On – Grid lines always display.
Off – Grid lines never display (columns cannot be
resized at runtime).
Display Only – Grid lines display only when the
report displays online.
Print Only – Grid lines display only when the
contents of the report are printed.
466
Column Moving
Mouse Selection
Columns can be moved at runtime.
Data can be selected at runtime and, for example,
copied to the clipboard.
Row Resize
Rows can be resized at runtime.
InfoMaker
CHAPTER 15
Working with TreeViews
Property
Description
Indent Value
The indent value of the child node from its parent in
the units specified for the report. The indent value
defines the position of the state icon. The X position
of the state icon is the X position of its parent plus the
indent value.
Expand To Level By Default
State Icon Align Mode
Expand to TreeView level 1, 2, or 3.
Align the state icon in the middle (0), at the top (1),
or at the bottom (2).
Whether lines display that connect parent nodes and
child nodes. If you want to display lines that connect
the rows in the detail band to their parent, select
Connect Leaf Nodes.
Show Lines
Connect Leaf Nodes
Use Tree Node Icon
Select Node By Mouse
Whether lines display that connect the leaf nodes in
the detail band rows.
Whether an icon for the tree node displays. This
applies to icons in the level and detail bands. For how
to specify icon images, see “Setting TreeView level
properties” and “Setting detail band properties”
next.
Whether a Tree node is selected by clicking the Tree
node with the mouse.
Setting TreeView level properties
In the Properties view for a band, you can specify expanded and collapsed
icons for each TreeView level. You access the Properties view by clicking the
bar identifying the band for that level in the Design view in the report painter.
You can also access the Properties view from the Rows menu, or by clicking
any of the icons in the Design view that represent the locations of nodes, icons,
and connecting lines. (See “Icons in the Design view” on page 464.)
❖
To modify properties for a level in a TreeView report:
1
Users Guide
Select Rows>Edit TreeView Level from the menu bar and then select the
number of the level from the list of levels, or click the bar identifying the
band for that level or any of the icons in that band.
467
Setting properties for the TreeView report
2
Use the report TreeView Level properties view that displays to edit the
properties for the level you selected.
The properties that are specific to a TreeView level band are at the bottom of
the Properties view:
Property
Tree Node Icon File
Collapsed Tree Node Icon
File
Description
The file name of the tree node icon in a TreeView
level band when it is in the expanded state.
The file name of the tree node icon in a TreeView
level band when it is in the collapsed state.
You set the tree node icon file name separately for each TreeView level band.
You can use a quoted expression for the tree node icon file.
468
InfoMaker
CHAPTER 15
Working with TreeViews
Setting detail band properties
You can specify an icon for the rows in the detail band by clicking the detail
band in the Report painter to display the Properties view.
If you want to hide tree nodes in the detail band, set the Height property to 0.
The only property that is specific to the TreeView DataWindow is located at
the bottom of the Properties view:
Users Guide
Property
Description
Tree Node Icon File
The file name of the tree node icon in the detail
band. You can use a quoted expression.
469
Setting properties for the TreeView report
470
InfoMaker
CH A PTE R
1 6
About this chapter
Working with Rich Text
This chapter explains how to create reports using the RichText
presentation style.
Contents
Topic
About rich text
Page
471
Using the RichText presentation style
Formatting keys and toolbars
472
482
About rich text
Rich text format (RTF) is a standard for specifying formatting instructions
and document content in a single ASCII document. An editor that supports
rich text format interprets the formatting instructions and displays
formatted content. If you look at rich text in a plain ASCII editor, you see
complex instructions that are not very readable. The actual text of the
document is obscured by the formatting instructions:
{\par}\pard\ql{\f2\fs18\cf0\up0\dn0 A RichText
piece of text}
The same sample displayed without the commands looks like this:
A RichText piece of text
Elements of rich text
Users Guide
Rich text in InfoMaker can have:
•
Margins and tab settings for each paragraph
•
Character formatting such as italic, bold, underline, or superscripts
for each character
•
Named input fields associated with database columns or other data
•
Bitmaps
•
A header and footer for the document
471
Using the RichText presentation style
You can use toolbars, editing keys, and a pop-up menu to specify formatting.
A print preview lets you view a reduced image of the document to see how it
fits on the page.
What is not supported
InfoMaker supports version 1.6 of the RTF standard, except for the following
features:
Formatted tables
Drawing objects
Using the RichText presentation style
The RichText presentation style allows you to combine input fields that
represent database columns with formatted text. This presentation style is
useful for display-only reports, especially mail-merge documents.
In the Design view, you see the text along with placeholders called input fields:
{FNAME} {LNAME}
{COMPANY_NAME}
{ADDRESS}
{CITY}, {STATE} {ZIP}
Dear {FNAME}:
. . .
In the Preview view, the text is the same, but InfoMaker replaces the input
fields with values from the database:
Beth Reiser
AMF Corp.
1033 Whippany Road
New York, NY 10154
Dear Beth:
. . .
Document template
The formatted text acts like a document template. There is only one copy of the
text. As the user scrolls from row to row, the data for the current row is inserted
in the input fields and the user sees the document with the current data. If the
user edits the text, the changes show up in every row of data.
Input fields
In the RichText presentation style, an input field is associated with a column or
computed field. It gets its value from the retrieved data or from the computed
field’s expression.
472
InfoMaker
CHAPTER 16
Working with Rich Text
If an input field is not a computed field and its name does not match a column,
there is no way to specify data for the input field.
There can be more than one copy of an input field in the rich text. In the sample
above, there are two instances of the field FNAME. Each instance of the field
displays the same data.
Unavailable settings
Not all the settings available in other report styles are available. You cannot
apply code tables and edit styles, such as a DropDownDataWindow or
EditMask, to input fields. You cannot use slide left and slide up settings to
reposition input fields automatically.
Creating the report
❖
To create a RichText report:
1
In the New dialog box, select RichText from the Object tab and click OK.
2
Select data for the report as you do for any report.
If you want data to be retrieved into the Preview view automatically, select
the Retrieve on Preview check box. For more information, see “Building
a report” on page 153.
3
Users Guide
Specify settings for the report on the Specify RichText Settings screen,
click Next, and then click Finish.
473
Using the RichText presentation style
Available settings
Table 16-1 describes the types of settings you can make for the RichText report
in the wizard.
Table 16-1: Wizard settings for RichText reports
You can specify
Tools available
Whether there will be a header and footer for
the printed report
Editing the content
With these settings
Rich text bars: Tool, Status, Ruler,
and PopUp Menu
Header/Footer
Whether you are prevented from editing input
fields and text
Display Only
Colors for the whole background and the
background of input fields
Background Color: General and
Input Field
After you click Finish in the wizard, you see input fields with their labels in the
detail band in the Design view:
You can:
474
•
Begin editing text in the detail, header, or footer bands, building a report
around the input fields. You can delete, move, copy, and paste text and
input fields as needed.
•
Include a rich text file you have already prepared. If you include a rich text
file created in PowerBuilder that contains input fields, those names should
match the columns selected in the report.
•
Add computed fields that will appear as input fields in the report and
whose values come from the computed field expression.
InfoMaker
CHAPTER 16
Working with Rich Text
This sample shows how you might rearrange the input fields in a sales letter:
Editing text
You can add text by typing directly in the Design view. You do not have to
create text objects as you do for other report styles. The Report painter’s
StyleBar lets you apply formatting to selected text. The RichText toolbars are
not available in the painter.
Preview mode and editing text
You cannot edit text in the Preview view, but you can edit it when you preview
the report by selecting File>Run/Preview from the menu bar. It may seem
convenient to edit text in Preview mode because the toolbars are available.
However, any changes you make to the text when previewing are temporary.
They are discarded as soon as you return to the Design view.
Inserting a file
If you have a rich text file, you can include it in the report. In the Design view,
you can insert text from a file into the detail, header, or footer band.
❖
To insert a file:
1
Click in the text in any band to set the insertion point for the file.
2
Right-click in the Design view and select Insert File from the pop-up
menu.
3
In the file selection dialog box, select the file you want to insert.
Only the body of the file is used. If the file has a header or footer, it is ignored.
Users Guide
475
Using the RichText presentation style
Headers and footers
You decide whether your RichText report has a header and footer by checking
Header/Footer in the wizard or Rich Text Object dialog box (described in
"Formatting for RichText objects within the report" next). The decision to
include a header and footer must be made at design time; it cannot be changed
at runtime.
To display a page number or a date in the header or footer, you can insert the
predefined computed fields Page n of n or Today().
Formatting for RichText objects within the report
Each type of object in a RichText report has its own dialog box. When you
select Properties from the pop-up menu, the dialog box you get depends on
what is selected.
Properties and Control List views
The Properties and Control List views are not available for RichText reports.
The painter uses the same property sheets as are available to users when they
run the report, and controls in RichText reports cannot be manipulated in the
same way as in other reports.
Most of the objects in a RichText report correspond to familiar objects like
bitmaps, columns, and computed fields. You can also specify formatting for a
temporary selected text object. In a RichText report, the objects are:
•
The whole document
•
Selected text and paragraphs
•
Input fields (associated with columns or computed fields)
•
Pictures
This section describes how to select each type of object and access its dialog
box. The user can access the property sheets too if you enable the Popup Menu
option on the Rich Text Object’s General dialog box.
476
InfoMaker
CHAPTER 16
Working with Rich Text
The whole RichText report
Settings for the whole RichText report include the values you specified in the
wizard, as well as:
•
Whether pictures are displayed or represented by empty frames
•
Whether newly entered text will wrap within the display
•
Whether various nonprinting characters, such as tabs, returns, and spaces,
are visible
•
Standard report settings such as units of measurement and the pointer
•
Print specifications
Use the following procedure to change settings:
❖
To set values for the RichText report:
1
Make sure nothing is selected in the Design view by clicking to set the
insertion point.
2
Right-click in the Design view and select Properties from the pop-up
menu.
3
Click Help to get more information about a specific setting.
Selected text and paragraphs
You can specify detailed font formatting for selected text. The selected text can
be one character or many paragraphs.
If an input field is part of the selection, the font settings apply to it, too. A
picture that is part of the selection ignores settings for the selected text object.
❖
To specify formatting for selected text:
1
Select the text you want to format.
2
Right-click in the Design view and select Properties from the pop-up
menu.
The Selected Text Object dialog box displays. You can set:
•
Paragraph alignment The alignment setting on the Selected Text
page applies to all paragraphs in the selection.
•
Users Guide
Settings on the Font page apply to text in the
selection, including input fields.
Font formatting
477
Using the RichText presentation style
Paragraphs
There are also settings for selected paragraphs. You can display the Paragraph
dialog box by pressing Ctrl+Shift+S. The user can double-click the ruler bar or
press the key combination to display the same dialog box.
Default font
You can change the default font by double-clicking on the toolbar or pressing
Ctrl+Shift+D. You cannot change the default font in the painter.
Input fields
An input field can be either a column or a computed field. Before you retrieve
data, its value is shown as two question marks (??).
The text can include many copies of a named input field. The same data will
appear in each instance of the input field.
Column input fields
The columns you select for the report become input fields in the rich text.
Because the input field’s name matches the column name, InfoMaker displays
the column’s data in the input field.
If an input field exists in the text, you can copy and paste it to create another
copy. If you need to recreate a column input field that you deleted, use this
procedure.
❖
To insert a column input field in the text:
1
Select Insert>Control>Column from the menu bar.
2
Click in the text where you want the column input field to appear.
InfoMaker displays a list of the columns selected for the report.
3
Properties for input
fields
Select a column for the input field.
You select an input field by clicking inside it. A computed input field is
selected when the whole field is highlighted.
❖
To set properties for an input field:
1
Click in the input field in Design view.
2
Display the pop-up menu and select Properties.
3
On the Font page, specify text formatting.
4
On the Format page, specify a display format.
If there are multiple copies of an input field, the format settings apply to all the
copies. Background color on the Font page applies to all input fields. Other
settings on the Font page apply to individual instances.
478
InfoMaker
CHAPTER 16
Working with Rich Text
Computed field input fields When you display the dialog box for a
computed field, the settings are a little different. You can specify the input field
name and its expression on the Compute page.
Computed fields
Computed fields have an expression that specifies the value of the computed
field. In rich text, they are represented as input fields, too. You specify a name
and an expression. The data value comes from evaluating the expression and
cannot be edited.
❖
To define a computed field:
1
Select Insert>Control>Computed Field.
Predefined computed fields
You can also select one of the predefined computed fields at the bottom of
the menu. InfoMaker provides several predefined computed fields, but in
a RichText report, only the page number (Page n of n) and today’s date
(Today()) are available.
2
Click in the text where you want the computed field to appear.
If you do not select a predefined computed field, InfoMaker displays the
dialog box for the computed field:
Users Guide
3
On the Compute page, name the computed field and specify its expression.
4
(Optional) On the Font page, specify text formatting.
5
(Optional) On the Format page, specify a display format.
479
Using the RichText presentation style
If there are multiple copies of a computed field input field, the expression and
format settings apply to all the copies. Font settings apply to individual
instances. For more about computed field expressions and display formats, see
Chapter 6, “Enhancing Reports.”
Pictures
Inserting a picture
You can include bitmaps (BMP, GIF, JPG, RLE, or WMF files) in a RichText
DataWindow.
❖
To insert a picture in the rich text:
1
Select Insert>Control>Picture from the menu bar.
2
Click in the text where you want the picture to appear.
InfoMaker displays the Select Picture dialog box.
3
Specifying picture size
Select the file containing the picture.
A picture is selected when you can see a dashed outline in Design or Preview
view. When the picture is part of a text selection, it displays with inverted
colors.
You can change the size of a picture as a percentage of the original picture size.
The allowable range for a size percent change is between 10 and 250 percent.
❖
To specify size settings for the picture:
1
Click on the picture in the Design or Preview view so you see its
dashed-outline frame.
2
Right-click in the Design or Preview view and select Properties from the
pop-up menu.
The Rich Text - Picture Object dialog box displays.
3
Change the percent of the original picture size in the Width and Height text
boxes.
The picture expands or contracts according to the size percentage you
selected.
480
InfoMaker
CHAPTER 16
Working with Rich Text
Previewing and printing
To see what the RichText report looks like with data, you can preview it in the
Preview view or in preview mode.
❖
To preview the report in preview mode:
1
Select File>Run/Preview from the menu bar, or click the Run/Preview
button on the PowerBar.
2
Select Rows>Retrieve from the menu bar.
Retrieve on Preview
If the RichText definition specifies Retrieve on Preview, data is retrieved
automatically when you open the Preview view or preview the report in
preview mode.
Data While previewing the report in preview mode, or when focus is in the
Changes in preview
Preview view, you can use the scroll buttons in the Preview toolbar to move
from row to row, and you can change data in the input fields. The changes you
make, however, do not affect the data in the database.
Text Any changes you make to the rich text in the Preview view will not be
reflected in the Design view. Any changes that you want to keep must be made
in the Design view, not in preview.
If the Display Only setting is checked, you cannot change text or data in the
Preview view.
Print Preview
Print Preview displays a reduced view of one row of data as it would appear
when printed.
❖
To see the report in Print Preview:
1
Click in the Preview view to make it the current view.
2
Select File>Print Preview.
In Print Preview, you can test different margin settings and scroll through the
pages of the document.
You cannot scroll to view other rows of data.
Any changes you make to settings in Print Preview are discarded when you
return to the Design view.
Users Guide
481
Formatting keys and toolbars
Setting margins
To specify permanent margin settings for the RichText report, use the Print
Specifications page of the Rich Text Object dialog box.
Formatting keys and toolbars
When the toolbar is visible, you can use its buttons to format text. The changes
you make in preview are temporary.
The keystrokes listed in the following tables also assign formatting to selected
text.
Keyboard shortcuts do not work in the painter
These keystrokes work only when you are running the report. In InfoMaker,
only keyboard shortcuts defined for menu items in the painter can be used.
Table 16-2: Keyboard shortcuts for RichText reports
Category
Action
Key
Using the
clipboard
Cut
Paste
Copy
Ctrl+X
Ctrl+V,
Shift+Insert
Ctrl+C
Undo
Bold
Ctrl+Z
Ctrl+B
Italic
Underline
Ctrl+I
Ctrl+U
Subscript
Superscript
Ctrl+=
Ctrl+Shift+=
Strikeout
Change font
Ctrl+U
Ctrl+Shift+U
Single space
Double space
Ctrl+1
Ctrl+2
One and a half space
Ctrl+5
Assigning font
attributes
Setting line
spacing
482
InfoMaker
CHAPTER 16
Category
Action
Key
Aligning text
Justify
Center
Ctrl+J
Ctrl+E
Left
Right
Ctrl+L
Ctrl+R
Set paragraph formatting
Insert a new paragraph
Ctrl+Shift+S
Enter
Insert an empty line
Delete character to right of insertion point
Ctrl+N
Delete
Delete character to left of insertion point
Select the input field at the insertion point
Backspace
Enter
Activate the input field at the insertion point
When input field is active, accept data and exit
field
When input field is active, exit field without
changing data
Space
Enter
Move to next input field
Move to previous input field
Ctrl+Tab
Shift+Ctrl+Tab
Select All
Print
Ctrl+A
Ctrl+P
Undo
Toggle display of nonprinting characters
Ctrl+Z
Ctrl+*
Toggle preview mode
Ctrl+F2
Editing
Input fields
Miscellaneous
Navigating and
selecting text
Esc
Table 16-3: Keyboard shortcuts for navigating and selecting text
Move or select
A character to the right or left
Navigating key
Right Arrow or
Left Arrow
Ctrl+Right Arrow or
Ctrl+Left Arrow
Selection key
Shift+Right Arrow or
Shift+Left Arrow
Ctrl+Shift+Right Arrow or
Ctrl+Shift+Left Arrow
A line up or down
Up Arrow or
Down Arrow
Shift+Up Arrow or
Shift+Down Arrow
To start of line
To end of line
Home
End
Shift+Home
Shift+End
To start of document
To end of document
Ctrl+Home
Ctrl+End
Ctrl+Shift+Home
Ctrl+Shift+End
To next input field
To previous input field
Ctrl+Tab
Shift+Ctrl+Tab
A word to the right or left
Users Guide
Working with Rich Text
483
Formatting keys and toolbars
484
InfoMaker
CH A PTE R
About this chapter
1 7
Using OLE in a Report
This chapter describes how to use OLE in reports.
Contents
Topic
About using OLE in reports
Page
485
OLE objects and the OLE presentation style
Using OLE columns in a report
487
498
About using OLE in reports
A report can include a control that is a container for an OLE object. The
container stores information about the application that created the object
and it can launch the application to display or modify the OLE object.
The container can fill the whole report, when you create a new report
using the OLE presentation style, or it can exist alongside other controls
in a report, when you add an OLE object to an existing report. You can also
read OLE data from a blob column in a database and display the objects
in the report.
You can use OLE objects in reports in the following ways:
•
Users Guide
The OLE object is displayed in its
container control with the report data and other controls, such as
bitmaps or text. You can associate it with data in a particular row, the
rows on a page, or with all rows. You choose which columns in the
report are transferred to the OLE object. You can add an OLE
container control to a report that uses any presentation style that
supports multiple reports. (This does not include the graph and
RichText presentation styles.)
OLE object in a report
485
About using OLE in reports
The OLE presentation style is similar to an
OLE object in a report. The difference is that the OLE container is the only
control in the report. The underlying data is not presented in column
controls and there are no other controls, such as bitmaps or text. The OLE
object is always associated with all the rows in the report.
•
OLE presentation style
•
OLE database blob column
OLE objects that are stored in the database
in a blob column are displayed in each row of the report.
You can also add ActiveX controls (also called OLE custom controls or OCXs)
to reports. ActiveX controls range from simple visual displays, such as meters
and clocks, to more complex controls that perform spell checking or image
processing.
Activating OLE
objects
When you are working in the Report painter, you can start the server
application for an OLE object by selecting Open from the pop-up menu. Once
the server application has started, you can use the tools provided by the server
to edit the initial presentation of the object.
When you preview a report that has one or more OLE objects associated with
it, you cannot activate the OLE objects. When you preview a report, InfoMaker
retrieves data from the database and displays the report as it will appear when
printed. For this reason, activation is not possible.
To activate an OLE object, you first need to add the report that contains the
object to a form. Once you have done this, you can activate the server
application.
If the OLE object is associated with all rows retrieved and is in the foreground
or background layer, not the band layer, users can activate the object. If the
object is associated with a single row or page or is in the band layer, users can
see the object but cannot activate it. Reports created using the OLE
presentation style are always associated with all rows.
Unlike OLE objects, ActiveX controls are always active. They do not contain
objects that need to be opened or activated.
What's next
486
Whether you are inserting an OLE object into a report or using the OLE
presentation style, you use the same procedures to define, preview, and specify
data for the OLE object. Because of their similarities, the next section discusses
both OLE objects in reports and the OLE presentation style. The last section
discusses OLE database blob columns.
InfoMaker
CHAPTER 17
Using OLE in a Report
OLE objects and the OLE presentation style
Whether you insert an OLE object into a report or create a new report using the
OLE presentation style, you are working with an OLE container object within
the report.
Similarities
Differences
They have these characteristics in common:
The report can display the OLE object as an icon, or
it can display an image of the contents when display of contents is
supported by the server.
•
Icon or contents
•
Data from the report
You specify which report columns you want to
transfer to the OLE object. The data that is sent to the OLE server replaces
the OLE object template specified in the painter.
The OLE object in a report and the OLE presentation style have these main
differences:
•
When the OLE object is added to a
report, you can associate it with individual rows, groups of rows, or all
rows. In the presentation style, the OLE object is always associated with
all rows.
•
Properties view The Properties view for an OLE object has different
Associating the object with rows
pages and some different properties from the OLE report. For example, the
Properties view for an OLE object in a report does not contain detailed
print specification settings because these are set in the report’s own
Properties view. However, it does have settings related to the position of
the OLE object within the report.
Not all servers are appropriate
The features of the OLE server application determine whether it can provide
useful information in a report.
If the server does not support display of contents, it is not useful for objects
associated with rows. The user sees only the icon. Some servers support the
display of contents, but the view is scaled too small to be readable even when
the object is activated.
Users Guide
487
OLE objects and the OLE presentation style
In this section
This section includes procedures for:
•
Adding an OLE object to a report
•
Using the OLE presentation style
•
Defining the OLE object
•
Previewing the report
•
Specifying report data for the OLE object
Adding an OLE object to a report
To add an OLE object to a report, you begin by specifying where you want the
OLE object and opening the Insert Object dialog box so you can define the
OLE object.
Adding an ActiveX control
Adding an ActiveX control to a report is similar to adding an OLE object. Both
exist within the report with other controls, such as columns, computed fields,
and text controls. Use the following procedure whether you want to add an
OLE object or an ActiveX control to an existing report.
❖
To place an OLE object in a report:
1
Open the report that will contain the OLE object.
2
Select Insert>Control>OLE Object from the menu bar, or from the toolbar,
click the Object drop-down arrow and select the OLE button (not OLE
Database Blob).
3
Click where you want to place the OLE object.
InfoMaker displays the Insert Object dialog box.
To use the Insert Object dialog box, see “Defining the OLE object” on
page 490.
488
InfoMaker
CHAPTER 17
Using OLE in a Report
Using the OLE presentation style
Use the OLE presentation style to create a report that consists of a single OLE
object. The following procedure creates the new report and opens the Insert
Object dialog box.
❖
To create a new report using the OLE presentation style:
1
In the New dialog box, select OLE 2.0 from the Object tab and click OK.
2
Select data for the report as you do for any report.
For more information about selecting data, see Chapter 5, “Defining
Reports.”
3
Specify how the OLE object will use the report’s data on the Specify OLE
Data page:
You can drag the columns you want the OLE object to use to the Target
Data box. You can also control the grouping of data and edit the expression
for a column. If necessary, you can change these specifications later.
For more information, see “Specifying data for the OLE object” on page
492.
4
Click Next, and then click Finish.
InfoMaker displays the Insert Object dialog box in which you define the
OLE object.
To use the Insert Object dialog box, see "Defining the OLE object" next.
Users Guide
489
OLE objects and the OLE presentation style
Defining the OLE object
You define the OLE object in the Insert Object dialog box. It has three tab
pages:
If you want to
Embed an OLE server object in the report
Select this tab page
Create New
Link or embed the contents of an existing file as an OLE
object so that it can be activated using the application that
created it
Create From File
Insert an ActiveX control in the report
Insert Control
This section contains procedures for each of these selections.
Create New
Use the following procedure if you want to embed a new OLE server object.
❖
To embed a new OLE server object using the Create New tab:
1
Select the Create New tab.
2
In the Object Type box, highlight the OLE server you want to use.
You can click Browse to get information about the server from the registry.
3
4
Optionally display the OLE object as an icon by doing one of the
following:
•
Check Display as Icon to display the server application’s default icon
in the control.
•
Check Display as Icon and then select Change Icon to supply a
nondefault icon and icon label.
Click OK.
The OLE object is inserted in your report and the OLE server is activated.
Depending on the OLE server and whether or not you have already
specified how the OLE object will use the report’s data, the object may be
empty or may show an initial presentation of the OLE object. Close the
server application and, if you are inserting an OLE object in a report,
specify the object’s properties (see “Specifying properties for OLE
objects” on page 492).
490
InfoMaker
CHAPTER 17
Create From File
Using OLE in a Report
Use the following procedure if you want to link or embed the contents of an
existing file as an OLE object so that it can be activated using the application
that created it. Most of the steps in this procedure are the same as those for
embedding a new OLE server object.
A server application must be available
You (and the user) must have an application that can act as a server for the type
of object you link or embed. For example, if you insert a BMP file, it displays
because an application that can handle bitmaps is installed with Windows. If
you insert a GIF or JPEG file, it displays only if you have a third-party graphics
application installed.
❖
To link or embed an existing object using the Create From File tab:
1
Select the Create From File tab.
2
Specify the file name in the File Name box. If you do not know the name
of the file, click the Browse button and select a file in the dialog box.
3
To create a link to the file, rather than embed a copy of the object in the
control, select the Link check box.
4
Click OK.
The OLE object is inserted in your report and the OLE server is activated.
Depending on the OLE server and whether or not you have already
specified how the OLE object will use the report’s data, the object might
be empty or might show an initial presentation of the OLE object. Close
the server application and, if you are inserting an OLE object in a report,
specify the object’s properties (see “Specifying properties for OLE
objects” on page 492).
Insert Control
Use the following procedure if you want to insert an ActiveX control (OLE
custom control) in the report.
❖
To insert an ActiveX control using the Insert Control tab:
1
Select the Insert Control tab.
2
In the Control Type box, highlight the ActiveX control you want to use, or,
if the ActiveX control you want has not been registered, click Register
New.
If you select an existing ActiveX control, you can click Browse to get
more information about it. ActiveX controls are self documenting.
InfoMaker gets the property, event, and function information from the
ActiveX control itself from the registry.
Users Guide
491
OLE objects and the OLE presentation style
If you click Register New, you are prompted for the file that contains the
registration information for the ActiveX control.
3
Click OK.
4
If you did not specify how the OLE object will use the report’s data when
you created the report, do so on the Data property page.
If you have inserted an ActiveX control that does not display data, such as
the Clock control, you do not need to transfer data to it.
For more information, see “Specifying data for the OLE object” on page
492.
Specifying properties
for OLE objects
For OLE objects, you need to specify how the OLE object will use the report’s
data. If you used the OLE presentation style, you did this when you created the
report.
If you are inserting an OLE object in an existing report, you can also associate
the object with the current row. If you are using the OLE presentation style, the
OLE object is always associated with all rows.
❖
To specify properties for an OLE object:
1
Select the Data property page in the Properties view.
2
Specify how the OLE object will use the report's data.
For more information, see "Specifying data for the OLE object" next.
3
(Optional) To associate the object with the current row, select the Position
property page and change the value in the Layer box to Band.
4
Click OK when you have finished.
Specifying data for the OLE object
You set data specifications for an OLE object in a report on the Data property
page in the Properties view. You can also use the Data property page to modify
the data specifications you made in the wizard for a report using the OLE
presentation style.
What the data is for
492
When an OLE object is part of a report, you can specify that some or all of the
data the report retrieves be transferred to the OLE object too. You can specify
expressions instead of the actual columns so that the data is grouped,
aggregated, or processed in some way before being transferred.
InfoMaker
CHAPTER 17
Using OLE in a Report
The way the OLE object uses the data depends on the server. For example, data
transferred to Microsoft Excel is displayed as a spreadsheet. Data transferred
to Microsoft Graph populates its datasheet, which becomes the data being
graphed.
Some ActiveX controls do not display data, so you would not transfer any data
to them.
Group By and Target
Data boxes
Two boxes on the Data property page list data columns or expressions:
•
Group By Specifies how InfoMaker groups the data it transfers to the
OLE object. Aggregation functions in the target data expressions use the
groupings specified here.
•
Target Data
Specifies the data that you want to transfer to the OLE
object.
Populating the Group
By and Target Data
boxes
If you are using the OLE presentation style, you populated the Group By and
Target Data boxes when you created the report. If you placed an OLE object in
an existing report, the boxes are empty. You use the browse buttons next to the
Group By and Target Data boxes to open dialog boxes where you can select the
data you want to use or modify your selections.
Modifying source data
You cannot modify the source data for the report on the Data property page.
Select Design>Data Source from the menu bar if you need to modify the data
source.
❖
To select or modify how data will be grouped in the OLE object:
1
Click the Browse button next to the Group By box.
2
In the Modify Group By dialog box, drag one or more columns from the
Source Data box to the Group By box.
You can rearrange columns and specify an expression instead of the
column name if you need to. For more information, see the next procedure.
❖
To select or modify which data columns display in the OLE object:
1
Click the Browse button next to the Target Data box.
2
In the Modify Target Data dialog box, drag one or more columns from the
Source Data box to the Target Data box.
The same source column can appear in both the Group By and Target Data
box.
Users Guide
493
OLE objects and the OLE presentation style
3
If necessary, change the order of columns by dragging them up or down
within the Target Data box.
The order of the columns and expressions is important to the OLE server.
You need to know how the server will use the data to choose the order.
4
Double-click an item in the Target Data box to specify an expression
instead of a column.
In the Modify Expression dialog box, you can edit the expression or use
the Functions or Columns boxes and the operator buttons to select
elements of the expression. For example, you may want to specify an
aggregation function for a column. Use the range for object if you use
an aggregation function; for example, sum (salary for object).
For more information about using operators, expressions, and functions,
see Part 6, “Reference.”
Example of a completed Data property page This example of the Data
property page specifies two columns to transfer to Microsoft Graph: city and
salary. Graph expects the first column to be the categories and the second
column to be the data values. The second column is an aggregate so that the
graph will show the sum of all salaries in each city:
Specifying a value for
Rows
494
The last setting on the Data property page specifies how the OLE object is
associated with rows in the report. The selection (all rows, current row, or page)
usually corresponds with the band where you placed the OLE object, as
explained in this table. If you used the OLE presentation style to create the
report, this setting does not display on the property page: the OLE object is
always associated with all the rows in the report.
InfoMaker
CHAPTER 17
Using OLE in a Report
Table 17-1: Associating an OLE object with rows in the report
Range of rows
All
When to use it
When the OLE object is in the summary, header, or footer band,
or the foreground or background layer.
Rows must be All and Layer must be Foreground or Background
if you want the user to be able to activate the object.
Current Row
Target data for all rows is transferred to the object.
When the OLE object is in the detail band.
There is an instance of the OLE object for every row. Target data
for a single row is transferred to each object.
Page
Because ActiveX controls must be in the foreground or
background layer, they cannot be associated with individual rows
in the detail band.
When the OLE object is in the group header or trailer,
foreground, or background.
Target data for the rows on the current page is transferred to the
OLE object.
Range of rows and activating the object
When the range of rows is Current Row or Page, the user cannot activate the
OLE object. The user can see contents of the object in the form of an image
presented by the server but cannot activate it.
If you want the user to activate the object, Rows must be set to All and Layer
on the Position property page must be Foreground or Background.
Additional settings in
the Properties view
The Options property page in the OLE object’s Properties view has some
additional settings. These settings display on the General property page for
OLE reports. Table 17-2 describes the settings you can make.
Table 17-2: Settings on the OLE object’s Options property page
Property
Effect
Client Name
A name for the OLE object that some server applications use
in the title bar of their window.
Activation
How the OLE object is activated
• Double click When the user double-clicks on the object,
the server application is activated.
Corresponds to the ClientName report property.
Activation is possible only when the report that contains
the OLE object is embedded in a form.
Users Guide
495
OLE objects and the OLE presentation style
Property
Effect
Contents
Whether the object in the OLE container is linked or
embedded. The default is Any, which allows either method.
Display Type
What the OLE container displays. You can choose:
• Manual Display a representation of the object, reduced
to fit within the container.
• Icon Display the icon associated with the data. This is
usually an icon provided by the server application.
Link Update
When the object in the OLE container is linked, the method
for updating link information. Choices are:
• Automatic If the link is broken and InfoMaker cannot
find the linked file, it displays a dialog box in which the
user can specify the file.
• Manual If the link is broken, the object cannot be
activated.
Previewing the report
Previewing the report lets you see how the OLE object displays the data from
the report. You can preview in the Preview view or in preview mode
❖
To preview the report with the OLE object in preview mode:
1
Select File>Run/Preview from the menu bar, or click the Run/Preview
button on the PowerBar.
2
Select Rows>Retrieve from the menu bar.
The report retrieves rows from the database and replaces the initial
presentation of the OLE object with an image of the data that the OLE
server provides.
Activating and editing the OLE object
In the Design view
496
InfoMaker stores an initial presentation of the OLE object that it displays
before data is retrieved and in newly inserted rows. When you activate the OLE
object in the Design view, you are editing the initial presentation of the OLE
object. Any changes you make and save affect only this initial presentation.
After rows are retrieved and data transferred to the OLE object, an object built
using the data replaces the initial presentation.
InfoMaker
CHAPTER 17
In preview
Using OLE in a Report
InfoMaker displays the initial presentation of the OLE object while it is
retrieving rows and then replaces it with the retrieved data.
You cannot activate the OLE object when you preview the report. If you add
the report to a form, you can activate the OLE object when you run the form.
For more information, see “Activating OLE objects” on page 486.
Saving as a PSR
You can save the object with its data by saving the report as a Powersoft report
(PSR). Select File>Save As File or File>Save Rows As from the menu bar.
❖
To activate the OLE object in the container in the Design view:
•
Select Open from the container’s pop-up menu.
Selecting Open from an ActiveX control’s pop-up menu has no effect.
ActiveX controls are always active.
Changing the object in the control
In the Report painter, you can change or remove the OLE object in the OLE
container object.
❖
To delete the OLE object in the container:
•
Select Delete from the container’s pop-up menu.
The container object is now empty and cannot be activated.
❖
To change the OLE object in the container:
1
Select Insert from the container’s pop-up menu.
InfoMaker displays the Insert Object dialog box.
Users Guide
2
Choose one of the tabs and specify the type of object you want to insert,
as you did when you defined the object.
3
Click OK.
497
Using OLE columns in a report
Using OLE columns in a report
You can create OLE columns in a report. An OLE column allows you to
retrieve blob (binary large-object) data from a database into a report.
Database support for OLE columns
If your database supports a blob datatype, then you can implement OLE
columns in a report. The name of the datatype that supports blob data varies.
For information on which datatypes your DBMS supports, see your DBMS
documentation.
Creating an OLE column
This section describes how to create an OLE column in a report. The steps are
illustrated using a table that you can create in the Database painter. It must
contain at least two columns, id and object:
❖
•
The id column is an integer and serves as the table’s key.
•
The object column is a blob datatype and contains OLE objects associated
with several OLE servers.
To create the database table:
1
In the Database painter, create a table to hold the blob (binary large-object)
data.
The table must have at least two columns: a key column and a column with
the blob datatype. The actual datatype you choose depends on your DBMS.
For example, in SQL Anywhere, choose long binary as the datatype for the
blob column. For information about datatypes, see your DBMS
documentation.
2
Adding a blob column
to the report
The following procedure describes how to add a blob column to a report.
❖
To add a blob column to a new report:
1
498
Define the blob columns as allowing NULLs (this allows you to store a row
that does not contain a blob).
Create a new report.
InfoMaker
CHAPTER 17
2
Using OLE in a Report
Specify the table containing the blob as the data source for the report.
Be sure to include the key column in the data source. You cannot include
the blob column in the data source; if you try, a message tells you that its
datatype requires the use of an embedded SQL statement. You add the blob
column later in the Report painter workspace. (If you use Quick Select, the
blob column is not listed in the dialog box.)
3
Select Insert>Control>OLE Database Blob and click where you want the
blob column in the Design view.
The Database Binary/Text Large Object dialog box displays:
Setting properties for
the blob column
The following procedure describes the properties you need to set for the blob
column.
❖
To set properties for a blob column:
1
(Optional) Enter the client class in the Client Class box. The default is
DataWindow.
This value is used in some OLE server applications to build the title that
displays at the top of the server window.
2
(Optional) Enter the client name in the Client Name box. The default is
Untitled.
This value is used in some OLE server applications to build the title that
displays in the title bar of the server window.
Users Guide
499
Using OLE columns in a report
3
In the Table box, select the database table that contains the blob database
column you want to place in the report.
The names of the columns in the selected table display in the Large
Binary/Text Columns list.
4
In the Large Binary/Text Columns box, select the column that contains the
blob datatype from the list.
5
If necessary, change the default key clause in the Key Clause box.
InfoMaker uses the key clause to build the WHERE clause of the SELECT
statement used to retrieve and update the blob column in the database. It
can be any valid WHERE clause.
Use colon variables to specify report columns. For example, if you enter
this key clause:
id = :id
the WHERE clause will be:
WHERE id = :id
6
Identify the OLE server application by doing one of the following:
•
If you always want to open the same file in the OLE server
application, enter the name of the file in the File Template box.
For example, to specify a particular Microsoft Word document, enter
the name of the DOC file. If the file is not on the current path, enter
the fully qualified name.
Use the Browse button to find the file
If you do not know the name of the file you want to use, click the
Browse button to display a list of available files. Select the file you
want from the resulting window.
•
If you do not want to open the same file each time, select an OLE
server application from the OLE Class: Description drop-down list.
When the server does not match the OLE blob data
If you specify a server that does not match the OLE blob object or if
your database contains objects belonging to different servers, the
OLE mechanism can usually handle the situation. It looks for the
server specified in the object and starts it instead of the server you
specified.
500
InfoMaker
CHAPTER 17
7
Using OLE in a Report
Enter text or an expression that evaluates to a string in the Client Name
Expression box.
The server might use this expression in the title of the window in the OLE
server application. The expression you specify can identify the current row
in the report.
Use an expression to make sure the name is unique
To make sure the name is unique, you should use an expression. For
example, you might enter the following expression to identify a document
(where id is the integer key column):
"Document " + String(id)
8
Click OK.
InfoMaker closes the dialog box. The blob column is represented by a box
labeled Blob in the Design view.
9
Save the report.
The following screenshot shows what a completed Definition page for a Blob
object in a table called ole looks like in the Properties view:
Making the blob
column visible
If the blob column is invisible in the report until you activate the OLE server,
you can make it easy to find the blob column by adding a border to the object.
Previewing an OLE
column
Before using the report in an application, you should preview it in the Preview
view or in preview mode to see how it works.
Users Guide
501
Using OLE columns in a report
502
InfoMaker
PART
4
Forms
This part describes how to use forms to display and
change information in your database
Access to the Form painter
To have access to the Form painter, you must use the typical or
custom install. The InfoMaker form component is not included in
the compact install.
CH A PTE R
1 8
About this chapter
Defining Forms
You use forms to add data to your database easily and efficiently. This
chapter introduces InfoMaker forms and provides basic information about
working with forms.
Contents
Topic
About forms
Page
505
Creating and saving forms
Working with forms
514
523
About forms
An InfoMaker form is an electronic document you use to enter data in a
database. The form displays existing data from your database. You can
change the existing data and add new data. You can also print a form. Each
form has procedures associated with it, which include common database
tasks such as delete, insert, and update.
Why use a form for data
entry
In InfoMaker, you can enter data in your database in two ways:
•
In the Database painter, you can preview a table, change data or insert
a new row of data, and update the database
•
In the Form painter, you can run a form, change data or insert a new
row of data, and update the database
If you need to add or change data in your database frequently, making
changes directly in the database tables is inefficient and time-consuming.
A form is designed to make data entry easier and faster.
You can design a form so that you can see all columns of data on your
screen. Your design can make data easy to view on the screen and easy to
read if printed. And you can create edit styles and display formats to make
it easier to enter and view data.
Users Guide
505
About forms
The following illustration shows the Employee table in the EAS Demo DB,
which has 20 columns of data for 75 employees. When you view it in the
Database painter, you can see only a few rows and columns of data at a time:
Changing data or entering data for a new employee directly in the Employee
table is difficult. To see other columns, you need to scroll (or InfoMaker scrolls
for you as you tab from column to column), and you can never see all the data
for an employee at one time.
Instead, you could use the following form to enter or change employee data.
The form uses the Freeform form style of InfoMaker. When you run the form,
here is a sample of how it looks:
You can use this form to change data easily. You can also insert data for a new
employee, click the Insert button, and a blank form displays. You can see all
the data for each employee at one time, and with additional enhancements, the
presentation of the data can be improved for printing.
506
InfoMaker
CHAPTER 18
Defining Forms
Forms in InfoMaker and in an InfoMaker application
After you design a form, you can use it within InfoMaker. You can also take
the form, package it in an InfoMaker application with other forms and reports
you have created, and distribute your application.
For example, you could create an Employee Data application that includes the
Employee Data form and many employee reports that are important to your
organization. When users run the application, they get up-to-date reports and
they can update the Employee database.
For information about creating InfoMaker applications, see Chapter 21,
“Working with Applications”.
About the PainterBar
of the Form painter
The PainterBar of the Form painter provides buttons for performing common
activities you might do when creating or altering a form definition. There is
also a menu item corresponding to most buttons.
Creating new forms
When you create a new form with InfoMaker, you always specify the data
source and form style of the form. Then you define the data for the form, and
InfoMaker generates the basic form.
Once you have the basic form, you can name the form and save it. Then you
can continue to enhance the form to make it easier to use.
The following discussion introduces you to a few form concepts and terms.
When you are ready to create a particular type of form, you can follow the steps
for the type.
New Form dialog box
Users Guide
You specify the data source and form style in the New Form dialog box:
507
About forms
Data sources
The data source you use determines how InfoMaker retrieves data for your
form. You can select one of three data sources when you create a form:
Data source
Pick this data source when
Quick Select
SQL Select
The data is from tables that are connected through a key, and you
need only to sort and limit the data.
The data is from tables that are not connected through a key, or you
want more control over the SQL SELECT statement generated for
the data source.
Query
The data has been defined as a query.
For master/detail forms
You always use the Quick Select data source for master/detail forms.
For complete information about data sources, see “Selecting a data source” on
page 154.
Form styles
A form style is a predefined way of presenting and processing information in
a form. Each form you build in InfoMaker is based on an existing form style.
InfoMaker provides four built-in form styles:
Form
What it shows
Freeform
Grid
One row of data at a time
Rows of data in a grid
Master/Detail One-To-Many
One item in a freeform area at the top and a grid
with details about the item at the bottom
Master/Detail Many-To-One
Many items in a grid at the top and a freeform area
with details about an item at the bottom
In addition to the built-in form styles, PowerBuilder developers in your
organization can develop custom form styles to meet your organization’s
needs. Custom form styles also display in the New Form dialog box.
For information about creating custom form styles, talk to PowerBuilder
developers in your organization.
Actions in a form style
508
Each form style has a set of predefined actions. An action is a procedure you
can attach to buttons you place in a form. Usually a style includes the common
database actions (insert, update, and delete rows). Each of the built-in form
styles of InfoMaker has these database actions and additional actions that are
useful and appropriate to the form style.
InfoMaker
CHAPTER 18
Defining Forms
For example, you can place a button in a form and then attach the Print action
to it. After you run the form, you can print the current data by clicking the
button:
Actions are also available through the toolbar and menu items when you run a
form.
Freeform forms
You use freeform forms for basic data maintenance. In freeform forms, you see
one row of data at a time. You can arrange the information any way you want.
When you run the form, you can add, modify, and delete rows of data.
For example, the following form is a freeform form that allows you to view and
update customer information. This form uses all columns in the Customer table
in the EAS Demo DB.
Users Guide
509
About forms
After a few enhancements have been made to the basic form, here is the
freeform form with data:
Grid forms
You use grid forms for basic data maintenance where you want to be able to
view and update more than one row of data at a time.
The data in a grid form displays in a rigid grid. When running a grid form, you
can resize and reorder columns.
For example, the following form is a grid form that allows you to view
information for many customers at a time.
This form uses all columns in the Customer table in the EAS Demo DB:
510
InfoMaker
CHAPTER 18
Defining Forms
Working in a grid form
When you design and run a grid form, you can resize and reorder columns.
❖
To resize a column:
1
Position the pointer at a column boundary.
The pointer changes shape to a 2-headed arrow.
❖
2
Drag the mouse to move the boundary.
3
Release the mouse button when the column is the correct width.
To reorder columns:
1
Select a column heading.
InfoMaker selects the column and displays a line representing the column
border:
2
Drag the column left or right.
3
Release the mouse button to drop the column into place.
Master/Detail One-To-Many forms
Frequently, you may have data in one table that is related to data in another
table in a one-to-many relationship. For example:
Users Guide
•
You maintain information about departments and their employees. In one
department there are many employees. That is, there is a one-to-many
relationship between departments and employees.
•
You maintain information about your customers and their orders. One
customer typically has many orders. There is a one-to-many relationship
between customers and orders.
511
About forms
You may want to display this type of relationship in a form. Such a form is
called a master/detail one-to-many form.
For example, the following form displays information about one department at
the top and all of the employees of that department at the bottom:
About the ID column
Note the ID of the department in the master table at the top of the form.
Although you cannot see the ID of the department in the detail table at the
bottom of the form, it is there. The ID has been hidden by moving grid
boundaries to cover the ID column. Since all the ID values are the same, hiding
the values is useful.
If the detail table did not include the ID, the form would not be updatable. If
you forget to include necessary columns, InfoMaker prompts you.
The following illustration shows the database tables that handle the data on this
form: the Department table and the Employee table in the EAS Demo DB. The
Department table is the master table, and the Employee table is the detail table.
512
InfoMaker
CHAPTER 18
Defining Forms
Note that there is a primary/foreign key relationship between the tables: the
Dept_id column in the Employee table has the same values as the Dept_id
column in the Department table:
Master/Detail Many-To-One forms
You might have a lot of information about a particular class of entities, such as
customers, employees, or parts. You might want to be able to scroll easily
through a list of the entities (the many), then see the details for one of them.
You do that in a master/detail many-to-one form.
Typically, you select one or two columns for the master table (enough for you
to identify the entity, such as customer or employee) and the rest of the columns
pertaining to the entity for the detail table.
Selecting columns for the master and detail areas
In a master/detail many-to-one form, you usually pick one or two columns for
the master area and many columns for the detail area, and you change data or
insert new data in the detail area only. The data in the master area is usually
updated with a different form. To be able to insert new rows in the master area
or detail area, you must include all columns that have been defined in the
database as requiring values.
For information about defining data so that a form can update a database, see
“Defining data so that a form can update a database” on page 520.
Users Guide
513
Creating and saving forms
For example, the following form lists all customers at the top (the master area)
and the details for the selected customer at the bottom (the detail area):
Both the master and detail areas use the Customer table in the EAS Demo DB.
The Company_name and Id columns were chosen for the master table, and all
columns were chosen for the detail table.
About the Id column
Since the Id column is the primary key, you must select the Id column to make
the detail part for the form updatable, but you can delete it from the detail part.
Creating and saving forms
The first step in designing a form is to create a basic form. The procedure is
similar for most forms whether you are using a built-in style or a custom form
style developed in your organization using PowerBuilder.
Creating basic forms
A basic form is like a draft that you refine until you have exactly what you
want. After you create the basic form, you enhance the form to make data entry
fast and to present the data usefully.
514
InfoMaker
CHAPTER 18
❖
Defining Forms
To create a basic form:
1
Click the New button in the PowerBar.
2
Select the Object tab, the Form icon, and click OK.
The New Form dialog box displays the data sources and form styles you
can choose.
3
Choose the data source for the form:
Data source
Pick this data source when
Quick Select
The data is from tables that are connected through a key,
and you need only to sort and limit data.
Your data is from tables that are not connected through a
key, or you want more control over the SQL SELECT
statement generated for the data source.
The data has been defined as a query.
SQL Select
Query
For complete information about using each data source and defining the
data for the form, see “Selecting a data source” on page 154.
4
Choose a form style, then click OK.
You can choose one of the built-in form styles of InfoMaker or a custom
form style developed in your organization using PowerBuilder.
5
Define the data, then click OK.
If you are told the form is not updatable
After defining the data for the form, you might see a message box telling
you that the form is not updatable. For information about these situations,
see “Defining data so that a form can update a database” on page 520.
Users Guide
515
Creating and saving forms
InfoMaker generates the basic form and displays it in the Form painter
Layout view. The following illustration shows the basic form for the
freeform form using all columns in the Customer table:
6
Save the form.
For information, see “Saving the form” on page 522.
7
Run the form.
For information, see “Running forms” on page 523.
At this point, you can enhance the form. For more information, see Chapter 20,
“Enhancing Forms”.
Creating a master/detail form
The following steps and screens show how to create a master/detail one-tomany or master/detail many-to-one form.
❖
To create a master/detail one-to-many or master/detail many-to-one
form:
1
Click the New button in the PowerBar.
The New dialog box displays.
2
Select the Object tab, the Form icon, and click OK.
The New Form dialog box displays.
3
516
Select Quick Select and either of the master/detail styles, then click OK.
InfoMaker
CHAPTER 18
Defining Forms
You must use Quick Select
You must use Quick Select and you can select only one master table and
one detail table when creating the form. After the master/detail form is
created, if you want to add data from another table, you can modify the
data source and add new columns.
For information about modifying the data source, see Chapter 20,
“Enhancing Forms”.
The Select Master Table dialog box displays.
4
Select the master table.
For a master/detail one-to-many form, this is the table whose data displays
one row at a time at the top of the form. For a master/detail many-to-one
form, this is the table whose data displays in a list at the top of the form.
In the example, it is the Department table.
5
Users Guide
Select some or all of the columns in the master table, then click OK:
517
Creating and saving forms
If you are told the data is not updatable
After selecting the columns, you might see a message box telling you that
the data is not updatable. For information about these situations, see
“Defining data so that a form can update a database” on page 520.
The Select Detail Table dialog box displays.
6
Select the detail table.
This is the table that is related to the master table and whose data displays
at the bottom of the form. For a master/detail one-to-many form, the data
displays many rows at a time. For a master/detail many-to-one form, the
data displays one row at a time. In the example, it is the Employee table.
7
Select some or all of the columns in the detail table, then click OK.
The Select Master/Detail Relationship dialog box displays. It lists
primary/foreign key relationships between the master and detail tables:
8
Specify the relationship between the master and detail tables.
To do this, you identify which column or columns in the detail table have
the same values as the column or columns in the master table.
InfoMaker needs this information so that it knows which detail rows to
display when you display a row in the master table.
518
•
If there is a primary/foreign key relationship, select it and click OK.
•
If there is no primary/foreign key relationship, click More to specify
the relationship. Select one or more columns from the master table
and the column or columns in the detail table that contain matching
values, and click OK.
InfoMaker
CHAPTER 18
Defining Forms
When the master table and the detail table are the same table, the complete
Select Master/Detail Relationship dialog box displays automatically and
you specify the relationship:
InfoMaker generates the basic form and displays it in the Form painter
workspace. The following illustration shows a master/detail one-to-many
form:
9
Users Guide
Size the master area if necessary and click the Run button to run the form.
519
Creating and saving forms
When you run the form, the form displays with data:
At this point, you can enhance the form. To do so, you first click the Close
button to return to the Form painter Layout view.
For information about how to enhance the form, see Chapter 20, “Enhancing
Forms”.
Defining data so that a form can update a database
If you want to be able to use a form to update data in a database, you must
include all columns that make up a table’s unique key when you define the data
for the form. This is how InfoMaker identifies rows in the database.
For example, if you are using Quick Select and have not selected all columns
in a unique key of a table, you see the following dialog box:
You can have InfoMaker add the needed columns automatically by clicking .
If you click No and proceed with the ones you originally selected, you will not
be able to update data in the database unless you modify the data source after
you generate the form.
If you are using SQL Select and do not select all the key columns, you are
warned, but you cannot add the columns automatically; you can edit the data
source after the basic form has been generated.
520
InfoMaker
CHAPTER 18
Defining Forms
About the master/detail form styles
The master/detail one-to-many and master/detail many-to-one form styles each
have two sources of data, one for the master area and one for the detail area.
The data for both the master area and the detail area can be updatable.
If you want to be able to insert new rows in a form, you must include all
columns that have been defined in the database as requiring values.
For example, if you are using Quick Select and have not selected all columns
that allow null values, InfoMaker displays a message box:
If you want to be able to insert new rows in the form, you can have InfoMaker
add the required rows by clicking Yes. You receive this warning only when
using the Quick Select data source.
For information about controlling updates, see Chapter 19, “Controlling
Updates in Forms.”
Generating and saving forms
When you finish supplying information about the form style and data source,
InfoMaker generates the form and takes you to the Form painter Layout view.
Here is the Layout view for a freeform form that uses 12 columns of data from
the Employee table:
Users Guide
521
Creating and saving forms
These 12 columns were selected because in the database these columns were
defined as requiring values. By selecting these columns, you can use the form
to insert new data in the Employee table.
For information about updating data in a form, see “Defining data so that a
form can update a database” on page 520.
When generating the basic form, InfoMaker uses the information from the
extended attribute system tables.
About the extended attribute system tables and forms
The extended attribute system tables are a set of tables maintained by the
Database painter in InfoMaker or PowerBuilder. The extended attribute system
tables contain information about database tables and columns. Extended
attribute information extends database definitions.
When creating a form, InfoMaker uses the following information from the
extended attribute system tables:
For
Tables
Columns
InfoMaker uses
Fonts specified for labels, headings, and data
Text specified for labels and headings
Display formats
Edit styles
For example, labels and headings you defined for columns in the Database
painter are used in the generated form. Similarly, if you associated an edit style
with a column in the Database painter, that edit style is automatically used for
the column in the form.
For more information about the repository, see Chapter 3, “Managing the
Database” and Appendix B, “The Extended Attribute System Tables.”
At this point, you have a functioning form. You should save it before making
any changes.
Saving the form
When you have generated a form, you should save it. The first time you save
the form, you give it a name. As you work, you should save your form
frequently so that you do not lose changes.
522
InfoMaker
CHAPTER 18
❖
Defining Forms
To save the form:
1
Do one of the following:
•
Click the Save button.
•
Select File>Save from the menu bar.
If you have previously saved the form, InfoMaker saves the new version.
If you have not previously saved the form, InfoMaker displays the Save
Form dialog box.
2
Name the form in the Forms box.
The form name can be any valid identifier up to 40 characters. For
information about InfoMaker identifiers, see Appendix A, “Identifiers.”
3
Enter comments to describe the form.
4
Click OK.
InfoMaker saves the form in the current library.
Working with forms
Once you have created a basic form, you can run it, import data into it, save its
data in an external file, and print it. You can also assign actions to buttons you
place in the form.
Running forms
You run forms to display and change information in the database. You can run
a form at any time after InfoMaker has generated a basic form.
❖
To run a form you are not currently working on:
•
❖
To run a form you are currently working on:
•
Users Guide
Click the Preview button in the PowerBar, select the form in the
Run/Preview dialog box, then click OK.
Click the Run button in the PainterBar.
523
Working with forms
What happens
You are now running the form. Command buttons and picture buttons you have
placed in the form are now active. For information about adding controls to a
form, see Chapter 20, “Enhancing Forms.”
Exactly what you can do when you run the form depends on the form style. It
is the form style that determines the menu items that display in the menu bar
and the buttons that display in the PainterBar when you run a form.
Typically when you run a form, InfoMaker retrieves the data from the database
and displays it to you; then you can scroll through existing data and add,
modify, and delete rows in the database.
You (and your users) can add or modify data in a form in multiple input
languages. If you use multiple input languages, you can display a Language bar
on your desktop to change the current input language. In a form, the input
language in effect the first time a column gets focus becomes the default input
language for that column. If you subsequently change the input language when
that column has focus, the new input language becomes the default for that
column. This behavior does not apply to columns that have the RightToLeft
property set.
When you change data using a form
If you change data and you do not click the Update button before closing the
form, InfoMaker prompts you to save data in the database before closing the
form.
For complete information about what you can do when running forms that use
InfoMaker’s built-in form styles, see “Actions in forms” on page 527.
If you need information about running forms using a style developed by a
PowerBuilder user at your site, see the developer.
Limiting the retrieved data
After you run a form, you can specify criteria that limit the rows of data and
cause a re-retrieval of rows.
❖
To specify criteria to limit the data:
1
524
Do one of the following:
•
Click the Criteria button in the toolbar.
•
Select Rows>Specify Criteria from the menu bar.
InfoMaker
CHAPTER 18
Defining Forms
InfoMaker clears all the data.
2
Specify the criteria.
In master/detail forms, you specify the criteria in the form’s master area,
which is a freeform area for master/detail one-to-many forms and a grid
area for master/detail many-to-one forms. Both are like the grid you use
when defining data using the Quick Select data source.
Use expressions and operators in the blank spaces of the grid to specify
criteria.
To specify a second set of criteria in a master/detail one-to-many form,
press Page Down to get a new entry form and specify the criteria in the
new master area. The second set of criteria will be ORed with the first set;
data is retrieved if one set or the other set is true.
For information about expressions, see “Using Quick Select” on page 156,
and Chapter 23, “Operators and Expressions.”
3
Do one of the following:
•
Click the Apply button.
•
Select Rows>Apply Criteria from the menu bar.
InfoMaker retrieves rows based on the criteria.
4
If you want to modify the criteria, repeat steps 1 through 3.
Importing data into a form
When you run a form, you can import data from a file and save it in the
database.
For freeform and grid forms only
You can import data only in freeform and grid forms. You cannot import data
in master/detail forms.
❖
To import data:
1
Select Rows>Import from the menu bar.
The Select Import File dialog box displays.
Users Guide
525
Working with forms
2
Navigate to the folder you want and select the file from which you want to
import the data.
The types of files that you can import into the form are shown in the Files
of Type drop-down list.
3
Click Open.
InfoMaker reads the data from the file. You can view the data and save it
in an external file.
Data from a file must match retrieved columns
When importing data from a file, the data must match all the columns in the
retrieved data (the columns specified in the SELECT statement), not just the
columns that are displayed in the form.
Saving data in an external file
When you run a form, you can save the data retrieved (and optionally the
headers) in an external file.
❖
To save data in an external file:
1
Select File>Save Rows As from the menu bar.
The Save As dialog box displays.
2
Choose a format for the file from the Save As Type drop-down list.
When you choose a format, InfoMaker supplies the appropriate file
extension.
If you want the column headers saved in the file, select a file format that
includes headers, for example Excel With Headers. When you select a with
headers format, the names of the database columns (not the column
labels), are also saved in the file.
Saving the data as a PDF document, HTML table, or Powersoft report
For information about saving data in PDF, HTML Table, and PSR formats,
see “Saving data in an external file” on page 208 in the chapter on
enhancing reports.
3
526
Name the file.
InfoMaker
CHAPTER 18
4
Defining Forms
Click Save.
InfoMaker saves all rows in the file; all columns in the rows are saved.
Printing forms
Although forms are primarily used for data entry, after you run a form, you can
print it. Printing a freeform form is particularly helpful because each page
displays the data one row at a time.
❖
To print a form:
•
Do one of the following:
•
Select File>Print from the menu bar.
•
Add a command button to a form, associate the print action with the
button, and click the button.
For information about adding a command button and associating an action with
a button, see Chapter 20, “Enhancing Forms.”
Actions in forms
You can assign the actions in Table 18-1 to buttons you place in a form. Many
actions are also available in the toolbar and menu when you run a form.
Because all data is visible in Grid style forms, there are no First, Last, Next,
and Prior buttons/actions as there are in the Freeform, Master/Detail One-ToMany, and Master/Detail Many-To-One styles.
For information about placing buttons in a form, see Chapter 20, “Enhancing
Forms.”
Users Guide
527
Working with forms
Table 18-1: Cross reference of actions to buttons in a form
Action
Menu item
What the action does
Apply_Criteria
Rows>Apply Criteria
Cancel_Updates
Rows>Cancel Changes
Clear_Filter
None
Validates the selection criteria, then reretrieves the rows based on the criteria
Discards changes made since the last
update
Clears the current filter
Clear_Detail_Filter
None
Clears the detail filter
Clear_Master_Filter
None
Clears the master filter
Form styles
available in
All
All
Freeform, Grid
Master/Detail
One-To-Many,
Master/Detail
Many-To-One
Master/Detail
One-To-Many,
Master/Detail
Many-To-One
Close
File>Close
Closes the form (in the InfoMaker
environment, returns you to design
mode)
All
Delete_Row
Filter_Dialog
Rows>Delete (Ctrl+D)
None
All
Freeform, Grid
Filter_Detail_Dialog
None
Deletes the current row in the form
Displays the Filter dialog box for
defining a filter
Displays the Filter dialog box for
defining a filter for the detail part of the
form
Displays the Filter dialog box for
defining a filter for the master part of
the form
Master/Detail
One-To-Many,
Filter_Master_Dialog
None
First_Row
Rows>First
Scrolls to the first retrieved row (in the
master area)
Import_File
Rows>Import
Insert_Row
Rows>Insert (Ctrl+I)
Displays the Select Import File dialog
box to select a file for importing rows of
data
Inserts a new row (in the master area)
and scrolls to it with the cursor in the
first column
Last_Row
Rows>Last
528
Scrolls to the last row in the form (in the
master area)
Master/Detail
One-To-Many,
Master/Detail
Many-To-One
Master/Detail
Many-To-One
Freeform,
Master/Detail
One-To-Many
Freeform, Grid
All
Freeform,
Master/Detail
One-To-Many
InfoMaker
CHAPTER 18
Form styles
available in
Freeform,
Master/Detail
One-To-Many
All
Action
Next_Row
Menu item
Rows>Next
Print
File>Print
Prints the retrieved data
Print_Dialog
Print_Setup
None
File>Print Setup
Displays the Windows Print dialog
Opens the Windows Printer Setup
dialog box allowing you to change the
printer or its settings
Freeform, Grid
All
Prior_Row
Rows>Get Prior
Scrolls to the previous row in the master
area
Freeform,
Master/Detail
One-To-Many
Retrieve
Rows>Retrieve
Retrieves rows from the database and
prompts you for criteria if Prompt for
Criteria was specified in the workspace
All
Save_As
File>Save Rows As
Saves rows of data in a selected file
format, including text format or a
Powersoft report
Freeform, Grid
Sort_Dialog
None
Displays the Sort dialog box for
defining sorting
Freeform, Grid
Sort_Detail_Dialog
None
Displays the Sort dialog box for
defining sorting for the detail part of the
form
Master/Detail
One-To-Many,
Sort_Master_Dialog
Specify_Criteria
None
Rows>Specify Criteria
What the action does
Scrolls to the next row
Defining Forms
Displays the Sort dialog box for
defining sorting for the master part of
the form
Updates the database, then clears the
form to allow you to specify selection
criteria for the rows
Master/Detail
Many-To-One
Master/Detail
One-To-Many,
Master/Detail
Many-To-One
All
For information, see “Limiting the
retrieved data” on page 524
Update_Row
Update_Rows
Users Guide
Rows>Update
Rows>Update (Ctrl+U)
Updates the current row in the database Freeform
Updates all modified rows in the
Grid,
database
Master/Detail
One-To-Many,
Master/Detail
Many-To-One
529
Working with forms
Accessing and deleting forms
❖
To access a form:
1
Click the Open button in the PowerBar.
The Open dialog box displays:
2
If necessary, select Forms in the Object Type box.
3
Highlight the form you want in the list and click OK.
4
The form displays in Layout view in the Form painter. You can work on
the design of the form there.
For more information, see Chapter 20, “Enhancing Forms”.
5
Click the Run button to run the form.
When you run a form, InfoMaker retrieves data from the database and
displays the form so that you can view and change information in the
database. For more information, see “Running forms” on page 523.
❖
To delete a form:
•
Use the Library painter.
For more information, see “Copying, moving, and deleting objects” on
page 63.
530
InfoMaker
CH A PTE R
About this chapter
1 9
Controlling Updates in Forms
When InfoMaker generates the basic form, it defines whether the data is
updatable. This chapter describes the default settings and how you can
modify them.
Contents
Topic
About controlling updates
Page
531
Specifying the table to update
Specifying the unique key columns
533
533
Specifying an identity column
Specifying updatable columns
534
534
Specifying the WHERE clause for update/delete
Specifying update when key is modified
535
537
About controlling updates
When InfoMaker generates the basic form, it defines whether the data is
updatable by default as follows:
•
If the form contains columns from a single table and includes that
table’s key columns, InfoMaker defines all columns as updatable and
specifies a nonzero tab order for each column, allowing you to tab to
the columns.
•
If the form contains columns from two or more tables or from a view,
InfoMaker defines all columns as not being updatable and sets all tab
orders to zero, preventing you from tabbing to them.
You can accept the default settings or modify the update characteristics for
a form.
Data sources in the master/detail styles
The master/detail styles have a data source for the master area and a data
source for the detail area. Each of the data sources can be updatable.
Users Guide
531
About controlling updates
What you can do
You can:
•
Allow updates in a form associated with multiple tables or a view; you can
define one of the tables as being updatable
•
Prevent updates in a form associated with one table
•
Prevent updates to specific columns in a form that is associated with an
updatable table
•
Specify which columns uniquely identify a row to be updated
•
Specify which columns will be included in the WHERE clause of the
UPDATE or DELETE statement InfoMaker generates to update the database
•
Specify whether InfoMaker generates an UPDATE statement, or a DELETE
then an INSERT statement, to update the database when you modify the
values in a key column
Updatability of views
Some views are logically updatable; some are not. For the rules your DBMS
follows for updating views, see your DBMS documentation.
❖
To specify update characteristics for a form:
1
Select Design>Update Properties from the menu bar.
2
If the form is a master/detail style, select the data source as prompted.
The Specify Update Properties dialog box displays.
3
To prevent updates to the data, make sure the Allow Updates box is not
selected.
To allow updates, select the Allow Updates box and specify the other
settings as described below.
4
Changing tab values
Click OK.
InfoMaker does not change the tab values associated with columns after you
change the update characteristics of the form. If you have allowed updates to a
table in a multitable form, you should change the tab values for the updatable
columns so that you can tab to them.
For more information, see “Defining the tab order in a form” on page 556.
532
InfoMaker
CHAPTER 19
Controlling Updates in Forms
Specifying the table to update
Each form can update one table, which you select from the Table to Update box
in the Specify Update Properties dialog box.
Specifying the unique key columns
The Unique Key Columns box in the Specify Update Properties dialog box
specifies which columns InfoMaker uses to identify a row being updated.
InfoMaker uses the column or columns you specify here as the key columns
when generating the WHERE clause to update the database (as described
below):
The key columns you select here must uniquely identify a row in the table.
They can be the table’s primary key, though they don’t have to be.
Using the primary key
Clicking the Primary Key button cancels any changes in the Unique Key
Columns box and highlights the primary key for the updatable table.
Users Guide
533
Specifying an identity column
Specifying an identity column
Many DBMSs allow you to specify that the value for a column in a new row is
to be automatically assigned by the DBMS. This kind of column is called an
identity column. Different DBMSs provide different types of identity columns.
For example, some DBMSs allow you to define autoincrement columns so that
the column for a new row is automatically assigned a value one greater than
that of the previous highest value. You could use this feature to specify that an
order number be automatically incremented when someone adds a new order:
By specifying an identity column in the Specify Update Properties dialog box,
you tell InfoMaker to bring back the value of a new row’s identity column after
an insert in the form so that you can see it.
For information about identity columns in your DBMS, see your DBMS
documentation.
Specifying updatable columns
You can make all or some of the columns in a table updatable.
Updatable columns are displayed highlighted. Click a nonupdatable column to
make it updatable. Click an updatable column to make it nonupdatable.
Changing tab values
534
If you have changed the updatability of a column, you should change its tab
value. If you have allowed a column to be updated, you should change its tab
value to a nonzero number so you can tab to it.
InfoMaker
CHAPTER 19
Controlling Updates in Forms
Specifying the WHERE clause for update/delete
Sometimes multiple users are accessing the same tables at the same time. In
these situations, you need to decide when to allow your form to update the
database. If you allow your form to always update the database, it could
overwrite changes made by other users:
You can control when updates succeed by specifying which columns
InfoMaker includes in the WHERE clause in the UPDATE or DELETE statement
used to update the database:
UPDATE table...
SET column = newvalue
WHERE col1 = value1
AND col2 = value2 ...
DELETE
FROM table
WHERE col1 = value1
AND col2 = value2 ...
Using timestamps
Some DBMSs maintain timestamps so you can ensure that you are working
with the most current data. If the SELECT statement for the form contains a
timestamp column, InfoMaker includes the key column and the timestamp
column in the WHERE clause for an UPDATE or DELETE statement regardless
of which columns you specify in the Where Clause for Update/Delete box.
If the value in the timestamp column changes (possibly due to another user
modifying the row), the update fails.
To see whether you can use timestamps with your DBMS, see Connecting to
Your Database.
Choose one of the options in Table 19-1 in the Where Clause for Update/Delete
box. The results are illustrated by an example following the table.
Users Guide
535
Specifying the WHERE clause for update/delete
Table 19-1: Specifying the WHERE clause for UPDATE and DELETE
Option
Key Columns
Result
The WHERE clause includes the key columns only. These are the
columns you specified in the Unique Key Columns box.
The values in the originally retrieved key columns for the row are
compared against the key columns in the database. No other
comparisons are done. If the key values match, the update
succeeds.
Caution
Be very careful when using this option. If you tell InfoMaker only
to include the key columns in the WHERE clause and someone else
modified the same row after you retrieved it, their changes will be
overwritten when you update the database (see the example
following this table).
Key and
Updatable
Columns
Key and
Modified
Columns
Example
Use this option only with a single-user database or if you are using
database locking. In other situations, choose one of the other two
options described in this table.
The WHERE clause includes all key and updatable columns.
The values in the originally retrieved key columns and the
originally retrieved updatable columns are compared against the
values in the database. If any of the columns have changed in the
database since the row was retrieved, the update fails.
The WHERE clause includes all key and modified columns.
The values in the originally retrieved key columns and the modified
columns are compared against the values in the database. If any of
the columns have changed in the database since the row was
retrieved, the update fails.
Consider this situation: a form is updating the Employee table, whose key is
Emp_ID; all columns in the table are updatable. Suppose you have changed the
salary of employee 1001 from $50,000 to $65,000. This is what happens with
the different settings for the WHERE clause columns:
•
If you choose Key Columns for the WHERE clause, the UPDATE statement
looks like this:
UPDATE Employee
SET Salary = 65000
WHERE Emp_ID = 1001
536
InfoMaker
CHAPTER 19
Controlling Updates in Forms
This statement will succeed regardless of whether other users have
modified the row since your form retrieved the row. For example, if
another user had modified the salary to $70,000, that change will be
overwritten when your form updates the database.
•
If you choose Key and Modified Columns for the WHERE clause, the
UPDATE statement looks like this:
UPDATE Employee
SET Salary = 65000
WHERE Emp_ID = 1001
AND Salary = 50000
Here the UPDATE statement is also checking the original value of the
modified column in the WHERE clause. The statement will fail if another
user changed the salary of employee 1001 since your form retrieved the
row.
•
If you choose Key and Updatable Columns for the WHERE clause, the
UPDATE statement looks like this:
UPDATE Employee
SET Salary = 65000
WHERE Emp_ID = 1001
AND Salary = 50000
AND Emp_Fname = original_value
AND Emp_Lname = original_value
AND Status = original_value
...
Here the UPDATE statement is checking all updatable columns in the
WHERE clause. This statement will fail if any of the updatable columns for
employee 1001 have been changed since your form retrieved the row.
Specifying update when key is modified
The Key Modification property determines the SQL statements InfoMaker
generates whenever a key column—a column you specified in the Unique Key
Columns box—is changed. The options are:
Users Guide
•
Use DELETE then INSERT (default)
•
Use UPDATE
537
Specifying update when key is modified
How to choose a
setting
538
Consider the following when choosing the Key Modification setting:
•
If multiple rows are changed, DELETE and INSERT always work. In some
DBMSs, UPDATE fails if the user modifies two keys and sets the value in
one row to the original value of the other row.
•
You might choose the setting here based on your DBMS triggers. For
example, if there is an Insert trigger, select Use Delete then Insert.
•
If only one row can be modified by the user before the database is updated,
use UPDATE because it is faster.
InfoMaker
CH A PTE R
2 0
About this chapter
Enhancing Forms
Before using a form, you might want to enhance it to make it easier to use
and interpret data. This chapter describes enhancements you can make to
a form.
Contents
Topic
About enhancing forms
Page
539
Working in the Form painter Layout view
Reorganizing controls in the form
540
546
Modifying general form properties
Adding controls to the form
553
561
Highlighting information in a form
Displaying and validating data in a form
570
571
About enhancing forms
InfoMaker provides you with a variety of ways to enhance a form to make
it easier to enter data and to interpret data. You can customize the display
of the data. You can also place controls such as command buttons and
pictures in a form.
You enhance a form in the Layout view and then you run the form to see
if it is usable and what it looks like with data. You can repeat this process
many times until you have exactly what you want.
❖
Users Guide
To enhance a form:
1
Create the basic form and click the Run button to see the form with
data.
2
Click the Close button to return to the Form painter Layout view,
where you can enhance the form.
539
Working in the Form painter Layout view
Working in the Form painter Layout view
Here is the Form painter Layout view for a Freeform form style:
This section describes how to work in the Form painter
•
“Using the Form painter toolbars” next
•
“Using the pop-up menus in the Form painter” on page 542
•
“Using the Properties view in the Form painter” on page 542
•
“Selecting controls in the Form painter” on page 543
•
“Defining default colors and borders in the Form painter” on page 544
•
“Printing the form definition” on page 546
Using the Form painter toolbars
The Form painter has customizable PainterBars and a StyleBar. The
PainterBars have buttons for form operations. The StyleBar has buttons for
modifying text properties such as the font and whether the text is bold or italic.
For information on using toolbars, and customizing and manipulating them,
see “Using toolbars” on page 29.
540
InfoMaker
CHAPTER 20
Enhancing Forms
About the PainterBars
The Form painter PainterBars have buttons for operations such as Save, Close,
and Run. They also have five drop-down toolbars, which have a small black
triangle on the right side of the button:
•
Controls – shows the controls you can add to a form. For example, to place
a computed field in the form, click the Compute button on the Controls
drop-down toolbar, then click the location in the form where you want the
computed field to appear.
•
Layout – has alignment, sizing, and spacing options you can choose for
selected controls.
•
Foreground Color – has foreground colors that you can choose for one or
more selected controls. In a text control, the foreground color specifies the
color of the text.
•
Background Color – has background colors that you can choose for one or
more selected controls.
•
Borders – has borders you can choose for one or more selected controls.
When you click the triangle, the drop-down toolbar displays and you can click
a button in the toolbar. The following illustration shows the Background Color
drop-down toolbar:
About the StyleBar
The Form painter also has a toolbar called the StyleBar, which you can use to
modify text properties in the form:
Like other toolbars, the StyleBar can be moved and placed wherever it is
convenient for you.
Users Guide
541
Working in the Form painter Layout view
Using the pop-up menus in the Form painter
Each element of the form (such as text, columns, computed fields, buttons,
even the form itself) has a pop-up menu you can use to perform appropriate
actions and display the associated properties in the Properties view.
❖
To use a pop-up menu in the Form painter Layout view:
1
Position the pointer over the control or the background of the form.
2
Press the right mouse button.
Here is the pop-up menu for a column of data or a text control in a freeform
form:
3
Click the menu item you want.
To display the control properties in the Properties view, you select Properties
from the pop-up menu. To perform an action, for example Cut, you select the
action.
Using the Properties view in the Form painter
All controls in a form (such as text, columns, computed fields, buttons, and so
on) and the form itself have properties you can use to modify the form. The
properties that display in the Properties view are appropriate to the control you
have selected.
❖
To use the Properties view in the Form painter:
1
Position the pointer over the part you want to modify.
2
Display the pop-up menu and select Properties.
The appropriate properties display in the Properties view.
542
InfoMaker
CHAPTER 20
Enhancing Forms
Here is the Properties view for the column employee_street. It has several
tabbed property pages of information, which you access by clicking one of the
tabs. For example, to choose an edit style for a column, you click the Edit tab:
When you want to modify part of a form, select the part and use the Properties
view. Click the various tabs to change pages.
Selecting controls in the Form painter
The Form painter provides several ways for you to select controls to act on.
You can select multiple controls and can perform some actions on all the
selected controls as a unit. For example, you can move all of them or change
the fonts used to display text for all of them.
❖
To select one control in a form:
•
Click it.
The control displays with handles on it. Previously selected controls are no
longer selected.
Users Guide
543
Working in the Form painter Layout view
❖
To select neighboring multiple controls in a form:
1
Press and hold the left mouse button at one corner of the neighboring
controls.
2
Drag the mouse over the controls you want to select.
InfoMaker displays a bounding box.
3
Release the mouse button.
All the controls in the region are selected.
❖
To select non-neighboring multiple controls in a form:
1
Click the first control.
2
Press and hold the Ctrl key and click additional controls.
All the controls are selected.
❖
To select all controls in a form:
•
Select Edit>Select All from the menu bar.
Displaying information about selected controls in a form
To help you move and resize controls, InfoMaker displays information about
the position of selected controls.
❖
To display information about the position of a control:
•
Select the control.
InfoMaker displays the control name, x and y coordinates, width, and
height in MicroHelp:
If you select more than one control, InfoMaker displays Group Selected in the
Name area, and coordinates and size do not display.
Defining default colors and borders in the Form painter
For Freeform and Grid style forms, you can specify the default colors and
borders that InfoMaker uses when generating a basic form. Each style can have
its own defaults. You can override the defaults for a style for a particular form.
544
InfoMaker
CHAPTER 20
❖
Enhancing Forms
To specify default colors and borders for a Freeform or Grid style form:
1
Select Design>Options from the menu bar and then select the Generation
page:
2
Select the style whose defaults you want to change from the Presentation
Style drop-down list.
3
Change one or more of the following properties:
Property
Meaning
Background color
Text border and color
The default color for the background of the form
The default border and color used for labels and
headings in the form
The default border and color used for data
values in the draft form
Column border and color
4
Click OK.
From now on, when you create a new form using the style, InfoMaker uses the
defaults you just specified for colors and borders when generating the basic
form.
For more information about colors, see “Setting colors for a form” on page
553. For more information about borders, see “Using borders in a form” on
page 557.
Users Guide
545
Reorganizing controls in the form
Printing the form definition
At any point when you are working on a form, you can print a document that
lists all controls in the form and their properties.
❖
To print a document describing the controls in the form:
•
Select File>Print Form Definition from the menu bar.
InfoMaker prints the form definition on the default printer.
❖
To select a different printer:
•
Select File>Printer Setup from the menu bar and select the printer.
Reorganizing controls in the form
This section describes how you can change the layout of any of the controls in
a form.
Using the grid in the Form painter
The Form painter provides a grid to help you align controls.
About the grid
The Form painter grid is invisible. You cannot see it in the Layout view, but
your controls can snap to the grid as you move them.
❖
546
To use the grid in the Form painter:
1
Select Design>Options from the menu bar.
2
Use the options on the General page to:
•
Make controls snap to a grid position when you place them or move
them in a form
•
Specify the size (height and width) of the grid cells
InfoMaker
CHAPTER 20
Enhancing Forms
The options are:
Option
Meaning
Snap to Grid
X
If selected, controls snap to the grid when you place or move
them
The width of each cell in the grid in pixels
Y
The height of each cell in the grid in pixels
Deleting controls in the Form painter
❖
To delete controls in the Form painter:
1
Select the controls you want to delete.
2
Do one of the following:
•
Click the Clear button.
•
Select Edit>Delete from the menu bar.
•
Press the Delete key.
Moving controls in the Form painter
In all form styles
except Grid
In all form styles except grid, you can move all the controls (such as headings,
labels, columns, and drawing controls) anywhere you want.
❖
In grid forms
1
Select the controls you want to move.
2
Drag the controls with the mouse, or press an arrow key to move the
controls in one direction.
If you are working in a grid style form, you can reorder columns.
❖
Users Guide
To move controls in the Form painter:
To reorder columns in the Form painter:
1
If grid lines do not show in the column heading, select Grid Lines from the
column heading pop-up menu.
2
Select a column heading.
547
Reorganizing controls in the form
InfoMaker selects the column and displays a line representing the column
border:
3
Drag the column left or right.
4
Release the mouse button to drop the column into position.
Copying and pasting controls in the Form painter
You can copy controls within a form and to other forms. All properties of the
control are copied.
❖
To copy a control in the Form painter:
1
Select the control in the Layout view.
2
Select Edit>Copy from the menu bar or press Ctrl+C.
The control is copied to the clipboard.
3
Paste the control.
To paste the control within the same form, select Edit>Paste from the
menu bar or press Ctrl+V.
To paste the control in another form, open the Form painter again, open the
desired form, and paste the control.
InfoMaker pastes the control at the same location as in the source form. If
you are pasting into the same form, you should move the pasted control so
that it does not overlay the original control. InfoMaker displays a message
box if the control you are pasting is not valid in the destination form.
Cutting controls
You can also select one or more controls and cut the controls by selecting
Edit>Cut from the menu bar.
548
InfoMaker
CHAPTER 20
Enhancing Forms
Resizing controls in the Form painter
You can resize a control using the mouse or the keyboard.
Using the mouse
To resize a control using the mouse, select it, then grab an edge and drag it with
the mouse.
Using the keyboard
To resize a control using the keyboard, select the control and do the following:
In grid forms
To make the control
Wider
Press
Shift+Right Arrow
Narrower
Taller
Shift+Left Arrow
Shift+Down Arrow
Shorter
Shift+Up Arrow
You can resize columns in grid forms.
❖
To resize a column in the Form painter:
1
Position the pointer at a column boundary.
The pointer changes shape to a two-headed arrow.
2
Press and hold the left mouse button and drag the boundary to resize the
column.
3
Release the mouse button when the column is the correct width.
Aligning controls in the Form painter
Often you need to align several controls or make them all the same size. You
can use the grid to align the controls, or have InfoMaker align them for you.
❖
To align controls in the Form painter:
1
Select the control whose position you want to use to align the others.
InfoMaker displays handles around the selected control.
2
Extend the selection by pressing and holding the Ctrl key and clicking the
controls you want to align with the first one.
All the controls have handles on them.
Users Guide
549
Reorganizing controls in the form
Avoid lasso selection for aligning controls
Avoid selecting controls by dragging the mouse to put a bounding box
around multiple controls. You cannot control which control is used as the
basis for aligning the other controls.
3
Use the Layout drop-down toolbar in the PainterBar, or select
Format>Align from the menu bar.
4
Select the dimension along which you want to align the controls.
For example, to align the controls along the left side, click the
Align L button in the Layout drop-down toolbar or select the first choice
in the cascading menu.
InfoMaker moves all the selected controls to align with the first one.
Equalizing the space between controls in the Form painter
If you have a series of controls and the spacing is fine between two of them but
the spacing is wrong for the rest, you can easily equalize the spacing around all
the controls.
❖
To equalize the space between controls in the Form painter:
1
Select the two controls whose spacing is correct.
To do this, click one control, then press Ctrl and click the second control.
2
Select the other controls whose spacing you want to have the same as the
first two controls by pressing Ctrl and clicking.
3
Use the Layout drop-down toolbar in the PainterBar, or select
Format>Space from the menu bar.
4
Select the dimension whose spacing you want to equalize.
For example, to equalize the vertical spacing of the controls, click the
Space V button in the Layout drop-down toolbar or select the second
choice in the cascading menu.
550
InfoMaker
CHAPTER 20
Enhancing Forms
Equalizing the size of controls in the Form painter
Say you have several controls in a form and want their sizes to be the same.
You can accomplish this manually or by using the Edit menu.
❖
To equalize the size of controls in the Form painter:
1
Select the control whose size is correct.
2
Select the other controls whose size you want to match to the first control
by pressing Ctrl and clicking the controls.
3
Use the Layout drop-down toolbar in the PainterBar, or select
Format>Size from the menu bar.
4
Select the dimension whose size you want to equalize.
For example, to equalize the width of the controls, click the Size W button
in the Layout drop-down toolbar or select the first choice in the cascading
menu.
Undoing changes in the Form painter
You can undo your changes to a form.
❖
To undo changes in the Form painter:
•
Select Edit>Undo.
Sliding controls in a form
You can specify that you want to eliminate blank lines or spaces in a form by
sliding columns and other controls to the left or up if there is blank space. You
can use this feature to remove extra spaces between fields (such as first name
and last name) when you run the form.
Users Guide
551
Reorganizing controls in the form
❖
To use sliding columns or controls:
1
Select Properties from the pop-up menu of the controls and then select the
Position tab in the Properties view:
2
Select the Slide options you want.
Option
Slide Left
Description
Slide the column or control to the left if there is
nothing to the left. Be sure the control does not overlap
the control to the left. Sliding left does not work if the
controls overlap.
Slide Up - All Above
Slide the column or control up if there is nothing in the
row above (the row above must be completely empty
for the column or control to slide up).
Slide the column or control up if there is nothing
directly above it in the row above.
Slide Up - Directly
Above
If you are sliding columns up
Even blank columns have height, so if you want columns to slide up, you need
to specify as Autosize Height all columns above that might be blank and that
you want to slide other columns up through. You also specify Autosize Height
on the Position property page.
552
InfoMaker
CHAPTER 20
Enhancing Forms
Modifying general form properties
This section describes the general form properties you can modify.
Specifying a title for a form
You can specify a title that displays in the title bar of a form when you run the
form:
❖
To specify a title for a form:
1
Display the pop-up menu of the form and select Properties.
2
On the General page of the Properties view, specify the title in the Title
box.
To change a form's name in the current library (PBL)
To change a name of a form in the current library, select File>Save As from the
menu bar, name the form, add a comment, and click OK.
Setting colors for a form
You can set different colors for each element of a form to enhance the display
of information.
Users Guide
553
Modifying general form properties
❖
To set colors for a form:
•
Do one of the following:
To set colors for Do this
The form’s
background
A control
Position the pointer on an empty spot in the form, display
the pop-up menu, then select Properties. On the General
page of the Properties view, select a color from the Color
drop-down list.
Select the control and use the Foreground Color dropdown toolbar and the Background Color drop-down
toolbar.
Alternatively, you can position the mouse pointer on the
control, display the pop-up menu, then select Properties.
For controls that use text, you can set colors for
background and text on the Font page of the Properties
view. For drawing controls, you can set colors on the
General page of the Properties view.
Defining your own colors
You can define your own custom colors for use in forms and reports.
❖
To maintain your custom colors:
1
Select Design>Custom Colors from the menu bar.
The Color dialog box displays:
2
Define your custom colors.
For information about working in the Color dialog box to define custom
colors, see “Defining colors” on page 25.
554
InfoMaker
CHAPTER 20
Enhancing Forms
Specifying the display of scrollbars for a form
You can specify whether your form has scrollbars when you run it.
❖
To specify scrollbars for a form:
1
Display the form’s pop-up menu and select Properties.
2
On the General page of the Properties view, select the type of scrollbar you
want.
Specifying pointers for a form
You can specify a particular pointer image to display when the mouse pointer
is over a specific area of a form.
❖
To change the mouse pointer used while running the form:
1
Position the pointer over the element of the form whose pointer you want
to define, display the pop-up menu, and select Properties.
You can set a pointer for the entire form and for specific controls.
2
Select the Pointer page in the Properties view.
3
Choose the pointer from the Pointers list, or, if you have files containing
pointer definitions (CUR files), enter a pointer file name.
You can use the Browse button to search for the file.
Modifying text in a form
When InfoMaker initially generates the basic form, it uses the following:
•
For the text and alignment of column headings and labels, InfoMaker uses
the column’s extended attributes—definitions created in the Database
painter.
•
For fonts, InfoMaker uses the properties of the table—definitions created
in the Database painter.
You can override any of these defaults in a particular form.
Users Guide
555
Modifying general form properties
❖
To modify text in a form:
1
Select the text.
The first box in the StyleBar is now active:
2
Type the new text.
Use ~n~r to start a new line in the text. For example, typing
Employee~n~rFirst Name places First Name on the next line.
❖
To change the text properties for a control in a form:
1
Select the control.
2
Change the text properties in one of the following ways:
•
Using the StyleBar.
•
Using the Properties view, Font page.
Defining the tab order in a form
When InfoMaker generates the basic form, it assigns controls (including data
columns) to a default tab order, the default sequence in which focus moves
from control to control when you press the tab key when running the form.
InfoMaker assigns tab values in increments of 1,0 in left-to-right and top-tobottom order.
Tab order is not used in the Layout view
Tab order is used only when a form is run, not in the Layout view.
You can change the tab order.
❖
To change the tab order in a form:
1
Click the Tab Order button in the PainterBar, or select Format>Tab Order
from the menu bar
The current tab order displays.
556
2
Use the mouse or press the tab key to select the tab value you want to
change.
3
Enter a new tab value (0-9999).
InfoMaker
CHAPTER 20
Enhancing Forms
The value 0 removes the control from the tab order so that you cannot tab
to the control. It does not matter what value you use (other than 0); all that
matters is a relative value. For example, if you want to tab to column B
after column A but before column C, set the tab value for column B so that
it is between the value for column A and the value for column C.
4
Repeat the procedure until you have the tab order you want.
5
Click the Tab Order button in the PainterBar again, or select Format>Tab
Order from the menu bar again.
InfoMaker saves the tab order and the tab-order display turns off.
Each time you select Tab Order, InfoMaker reassigns tab values to include any
controls that have been added to the form and to allow space for inserting new
controls in the tab order.
Using borders in a form
You can place borders around controls to enhance their appearance. InfoMaker
provides six types of borders in forms: Shadow box, Box, Resize, Underline,
3D Raised, 3D Lowered.
❖
To add a border to a control in a form:
1
Select the controls you want to add a border to.
2
Click the button for the border you want in the Borders drop-down toolbar
in the PainterBar or select the Border from the drop-down list on the
General page in the Properties view.
InfoMaker places the border around the selected controls. For example, to
add a raised border to the controls, click the Raised button in the Borders
drop-down toolbar or select Raised in the drop-down list.
Users Guide
557
Modifying general form properties
Prompting for retrieval criteria in a form
You can define your form so that it always prompts you for retrieval criteria
just before it retrieves data. In this way, you limit the data retrieved.
❖
To prompt for retrieval criteria in a form:
1
Select Design>Prompt for Criteria from the menu bar.
The Prompt for Criteria dialog box displays, listing all columns in the
form:
What happens
2
Select the columns for which you want to specify retrieval criteria when
you run the form.
3
Click OK.
If you have specified prompting for criteria, InfoMaker displays the Specify
Retrieval Criteria dialog box when you run the form—just before the retrieval
is done.
Each column you selected in the Prompt for Criteria dialog box displays in the
grid. For example, if you selected the State column and the Salary column, you
can specify criteria so that only data for employees in Massachusetts with
salaries greater than $50,000 is retrieved:
You specify criteria exactly as you do in the grid with the Quick Select data
source. Criteria specified are added to the WHERE clause for the SQL SELECT
statement defined for the form.
558
InfoMaker
CHAPTER 20
Using edit styles
Enhancing Forms
If a column uses a code table or the RadioButton, CheckBox, or
DropDownListBox edit style, an arrow displays in the column header, and you
can select a value from a drop-down list when you run the form.
If you do not want the drop-down list used for a column when you specify
retrieval criteria, select Properties from the column’s pop-up menu and select
the Override Edit check box on the General page in the Properties view:
Forcing the entry of
criteria
If you have specified prompting for criteria for a column, you have the option
of entering criteria when you run the form. If you want, you can make the entry
of criteria a requirement rather than an option. For example, you might have a
departmental form that requires the selection of a department.
You can force the entry of criteria for a column by selecting the Equality
Required check box on the General page in the Properties view.
When you run the form, InfoMaker underlines the column header in the grid.
You must enter criteria for the column. If the column values are presented in a
drop-down list, you must pick one. If the column values are numeric, you must
use the = operator and not other operators, such as < or >=.
For information about how you can specify selection criteria in the grid, see
“Specifying selection criteria” on page 159.
Users Guide
559
Modifying general form properties
Modifying the data source of a form
When modifying a form, you might realize that you have not included all the
columns you need, or you might need to define retrieval arguments. You can
modify the data source from the Form painter by graphically modifying the
SQL SELECT statement.
❖
To modify the form’s data source:
1
Select Design>Edit Data Source from the menu bar, or select Edit Data
Source from the form’s pop-up menu.
If your form style is Master/Detail
For a master/detail many-to-one or one-to-many form, the Select Data
Source dialog box displays. Select the data source you want to modify: the
master or the detail.
InfoMaker returns you to the Select painter.
If you used Quick Select to define the data source, this might be the first
time you have seen the Select painter.
For information, see “Using SQL Select” on page 165.
2
Modify the SELECT statement graphically using the same techniques you
used when creating it.
3
Click the Return button to return to the Form painter, or select File>Return
to Form Painter from the menu bar.
Changing the table
If you change the table referenced in the SELECT statement, InfoMaker
maintains the columns in the Layout view (now from a different table) only if
they match the datatypes and order of the columns in the original table.
Adding columns
You can add columns to the SELECT statement. However, the column does not
automatically display in the Layout view. You need to add columns manually,
one at a time.
❖
560
To use a new column in a form:
1
Click the Column button in the Controls drop-down toolbar, or select
Insert>Column from the menu bar.
2
Click where you want to place the column.
3
In the Select Column dialog box, select the new column and click OK.
InfoMaker
CHAPTER 20
Enhancing Forms
Adding controls to the form
The topics in this section describe how to enhance a form by adding controls:
Adding columns to a form
You can add columns to a form: you can restore columns you have deleted or
add columns after you have modified the data source to include more columns.
❖
To add a column to a form:
1
Click the Column button in the Controls drop-down toolbar, or select
Insert>Column from the menu bar.
2
Click where you want to place the column.
The Select Column dialog box displays, listing columns not currently in
the form.
3
Select the column and click OK.
The column is added. No header or label is added, but you can create a header
or label by adding a text control to the form.
Adding text to a form
When InfoMaker generates a basic form from a form style and data source, it
places columns and their headings in the Layout view. You can add text
anywhere to make the form easier to understand.
❖
To add text to a form:
1
Click the Text button in the PainterBar, or select Insert>StaticText from
the menu bar.
2
Click where you want the text.
InfoMaker places the text control in the Layout view, and displays the
word text on the control, in the Text box in the StyleBar, and on the
General page in the Properties view.
Users Guide
3
Type the new text.
4
(Optional) Change the font, size, style, and alignment for the text by using
the StyleBar or changing the properties on the Font page in the Properties
view.
561
Adding controls to the form
Adding computed fields to a form
You can use computed fields to perform calculations in the form. Typical uses
of computed fields include:
•
Calculations based on column data that change for each retrieved row
For example, if you are retrieving yearly salary, you could define a
computed field that displays monthly salary (defined as Salary / 12).
•
Summary statistics
For example, you can use a computed field to calculate the average salary
of all the retrieved rows.
•
Concatenated fields
For example, if you are retrieving first name and last name, you can define
a computed field that concatenates the values so that they appear with only
one space between them (defined as Fname + " " + Lname).
•
System information
For example, you can place the current date and time in a form by using
computed fields (defined as Today( ) and Now( ) ).
About defining computed columns and computed fields
When creating a form, you can define computed columns and computed fields:
The difference
between the two ways
•
In the Select painter, you can define computed columns when you are
defining the SELECT statement that will be used to retrieve data into the
form
•
In the Form painter, you can define computed fields after you have defined
the SELECT statement
When you define a computed column in the Select painter, the column’s
definition is part of the SELECT statement and the value is calculated by the
DBMS when the data is retrieved. The computed column’s value does not
change until data has been updated and retrieved again.
When you define a computed field in the Form painter, the value of the column
is calculated by InfoMaker in the form after the data has been retrieved. The
value changes dynamically as the data in the form changes.
Recommendation
562
If you want your DBMS to do the calculations on the server before bringing
data down and you do not care about dynamically updating the computed
values, define computed columns as part of the SELECT statement.
InfoMaker
CHAPTER 20
Enhancing Forms
If you want computed values to change dynamically, define computed fields in
the Form painter, as described next.
Defining a computed field
❖
To add a computed field to a form:
1
Click the Compute button in the Controls drop-down toolbar, or select
Insert>Computed Field from the menu bar.
2
Click where you want the computed field.
The computed properties of the field display in the Properties view:
3
Users Guide
Do one of the following:
•
In the Compute Expression box, enter an expression to define the
computed field.
•
Click the button to the right of the box to display the Modify
Expression dialog box. In this dialog box, you can easily enter a
complicated expression. When you have finished, you can verify it
and click OK.
563
Adding controls to the form
About the Modify
Expression dialog box
The Modify Expression dialog box provides you with lists and buttons to help
you create the computed field:
The Modify Expression dialog box contains:
Entering the
expression
•
A Functions box with a list of built-in functions you can use in the
computed field
•
A Columns box with a list of columns, named computed fields, and
retrieval arguments in the form
•
Buttons for adding operators and parentheses
You can enter any valid expression when defining a computed field. You can
paste operators, columns, existing computed fields, retrieval arguments, and
functions into the expression from information in the Modify Expression
dialog box. You can use the + operator to concatenate strings.
InfoMaker expression
The expression you are entering is an InfoMaker expression; it is not a SQL
expression processed by the DBMS. The expression follows InfoMaker rules.
For complete information about expressions, see Chapter 23, “Operators and
Expressions.”
Examples
564
Here are some examples of computed fields:
To display
Enter this expression
Current date
Current time
Today( )
Concatenation of Fname and Lname
columns for each row
Fname + " " + Lname
Now( )
InfoMaker
CHAPTER 20
Enhancing Forms
To display
Enter this expression
Monthly salary if Salary column contains
annual salary
Salary / 12
Four asterisks if the value of the Salary
column is greater than $50,000
IF(Salary> 50000, "****", "")
Average salary of all retrieved rows
Count of retrieved rows, assuming each
row contains a value for EmpID
Avg(Salary)
Count(EmpID)
For more information about the functions you can use in computed fields in the
Form painter, see Chapter 24, “DataWindow Expression and InfoMaker
Functions” and online Help.
Adding pictures to a form
You can place pictures, such as your company logo, in a form to enhance its
appearance.
Tips for using pictures
To display a different picture for each row of data, retrieve a column containing
picture file names from the database. For more information, see the section on
character columns in “Specifying additional properties for character columns”
on page 90.
To compute a picture name when a form is run, use the Bitmap function in the
expression defining a computed field. For information about the Bitmap
function, see Chapter 24, “DataWindow Expression and InfoMaker
Functions” and online Help.
❖
To add a picture to a form:
1
Click the Picture button in the Controls drop-down toolbar, or select
Insert>Picture from the menu bar.
2
Click where you want the picture to display.
The container for the picture displays in the Layout view.
3
In the Properties view, enter a file name in the File Name box, or click the
Browse button next to the FileName box to display the Select Picture
dialog box and navigate to find the picture file.
The picture must be a BMP, RLE, WMF, GIF, or JPEG file.
Users Guide
565
Adding controls to the form
Adding command buttons to a form
You can add command buttons to a form. Command buttons are used to carry
out an action. For example, you can add a button that prints the current form.
❖
To add a button to a form:
1
Click the Button button in the Controls drop-down toolbar, or select
Insert>CommandButton from the menu bar.
2
Click where you want to place the command button.
A button with the text none displays. The text none also displays in the text
box in the StyleBar and on the General page of the Properties view.
3
Type the new text.
4
(Optional) Specify the command button as a default or cancel button.
For more information, see “Specifying default and cancel buttons” on
page 567.
Making the command button work
To make the button do something when it is clicked when you run a form, you
associate an action with it. Each form style has its own set of actions you can
choose from for a button.
566
InfoMaker
CHAPTER 20
❖
Enhancing Forms
To associate an action with a button:
1
Move the pointer to the button you added to the form, display the pop-up
menu, and select Action.
The Select Action dialog box displays the actions that are provided with
the form style you are using:
2
Select the action from the list.
3
If the action takes parameters, click the Parameters button and supply the
parameters.
4
Click OK.
You return to the Form painter Layout view.
For information about the actions provided with the built-in form styles, see
“Actions in forms” on page 527. If you need information about actions
provided by a style defined in your organization, talk with the style’s developer.
Specifying default and cancel buttons
You can define a button as the default button in a form and you can define a
Cancel button.
Default button
behavior
If you define a default button, pressing the Enter key when the focus is not on
another button is the same as clicking the default button. If the focus is on
another button, pressing enter is the same as clicking the button that has focus.
InfoMaker places a bold border around the default button (or the button with
focus if you explicitly tab to a button).
Cancel button
behavior
If you define a cancel CommandButton, pressing the Escape key is the same as
clicking the cancel button.
❖
To define a default or cancel button:
•
Users Guide
Select Properties from the command button’s pop-up menu and then select
the Default or Cancel check box on the General page.
567
Adding controls to the form
Adding picture buttons to a form
Picture buttons are identical to command buttons in their functionality. The
only difference is that you can specify a bitmap (BMP), runlength-encoded
(RLE), Windows metafile (WMF), CompuServe Graphics Interchange (GIF),
or JPEG file to display in the button. Use these controls when you want to be
able to represent the purpose of a button using a picture instead of just text.
❖
To add a picture button to a form:
1
Click the PictureButton button in the Controls drop-down toolbar, or select
Insert>PictureButton from the menu bar.
2
Click where you want the picture button to display.
A picture button displays in the Layout view.
3
In the Properties view, General page, type the new text (if you want any)
in the Text box.
4
Click the Browse button next to PictureName to display the Select Picture
dialog box and navigate to find the picture file, or enter a file name in the
PictureName box.
5
Specify other properties of the button as needed.
For information about associating the picture button with an action, see
“Making the command button work” on page 566. The procedure is the same.
Adding reports to a form
You can add reports that you created in the Report painter to a form. The reports
must be in the current library.
❖
To add a report to a form:
1
Click the Report button in the Controls drop-down toolbar, or select
Insert>Report from the menu bar.
2
Click where you want the report to display.
A report control displays in the Layout view.
568
InfoMaker
CHAPTER 20
3
Enhancing Forms
In the Properties view, supply the name of the report to show in the control.
You can use the browse button to search for the report.
InfoMaker places the report in the form (you see everything but the data,
which is displayed when you run the form).
At this point, you may want to resize the report or change some of its other
properties. For example, you may want to make the report itself resizable.
Adding drawing controls to a form
You can add the following drawing controls to a form to enhance its
appearance: Line, Oval, Rectangle, and RoundRectangle.
❖
To add a drawing control to a form:
1
Click the drawing control in the Controls drop-down toolbar, or select one
of the following from the menu bar: Insert>Line, Insert>Oval,
Insert>Rectangle, or Insert>RoundRectangle.
2
Click where you want the control to display.
3
Resize or move the drawing control as needed.
4
Change the drawing control’s properties as needed in the Properties view.
For example, you might want to specify a fill color for a rectangle or
thickness for a line. To do so, you work on the General page in the Property
view for the rectangle or line control.
Using drawing
controls for grouping
Drawing controls are useful for grouping controls in a form or providing design
highlights. For example, to group some controls you can place a colored
rectangle behind them by selecting Send To Back from the rectangle’s pop-up
menu.
Here are some controls grouped with a round rectangle and a text label:
Users Guide
569
Highlighting information in a form
❖
To group controls with a round rectangle and text in the Form painter:
1
Select Insert>RoundRectangle from the menu bar and add a round
rectangle to the Layout view.
2
Size the rectangle and place it over the controls you want to group.
3
Select Send To Back from the rectangle’s pop-up menu to place the
rectangle behind the group of controls.
4
Click the Text button in the Controls drop-down list, add a text control to
the Layout view, and place it on the round rectangle.
5
Select a background color for the text control from the Background Color
drop-down toolbar and select the color, in this case gray to match the
rectangle.
6
Position all controls as needed.
Highlighting information in a form
Every control in a form has a set of properties that determine basically what the
control looks like and where it is located. For example, the values in a column
of data display in a particular font and color, in a particular location, with or
without a border, and so on.
This chapter thus far has described how you modify various properties of
controls in the Layout view. These modifications are static. They do not change
when you run the form.
In contrast, you can also tell InfoMaker to modify some of these properties
when you run the form based on conditions you specify. These modifications
are dynamic. They are based on information available only when you run the
form.
For example, you can tell InfoMaker to show salaries greater than $30,000 in
red. When you run the form, salaries greater than $30,000 display in red. When
you enter new salary data in the form, a salary greater than $30,000 displays in
red after you enter the salary and then move the pointer to or tab to another
column of data.
570
InfoMaker
CHAPTER 20
Enhancing Forms
You modify properties based on conditions you specify by entering an
expression in the Properties view for the control. In this example, the
expression for the salary column's color property is:
if( employee_salary > 30000, 255, 0 )
For more information
For information on modifying properties based on conditions you specify, see
Chapter 10, “Highlighting Information in Reports and Forms.” The technique
works the same way in forms and reports.
Displaying and validating data in a form
Some of the most important ways to enhance forms are to create:
•
Display formats to specify how values are formatted
•
Edit styles to specify styles in which values are presented and entered
•
Validation rules to ensure that values entered in forms are valid
Display formats, edit styles, and validation rules are usually created in the
Database painter (if you have access to the database). In the Form painter, the
database definitions apply to the data unless you override them with new
definitions. The new definitions you create in the Form painter do not affect the
definitions in the database; the definitions are used only in the form.
For more information, see Chapter 8, “Displaying and Validating Data.”
Users Guide
571
Displaying and validating data in a form
572
InfoMaker
PART
5
Applications
This part describes how to create and deploy InfoMaker
applications.
CH A PTE R
2 1
About this chapter
Contents
Working with Applications
You can bundle reports, forms, and data pipelines into a package to create
a reporting and database-maintenance application. This chapter describes
how to create an InfoMaker application.
Topic
About applications
Page
575
Creating an application
Reusing an application
576
582
Running an application
Using a pipeline in an application
583
587
Starting an application from the command line
593
About applications
When you have completed reports, forms, or data pipelines, you can
bundle them in an executable file to create a reporting and databasemaintenance application. The reports, forms, and pipelines in an
application are usually related by topic, but they need not be. You can
bundle any reports, forms, and pipelines you want.
Where you create an
application
In InfoMaker, you create applications using a wizard accessed in the
Library painter. The wizard prompts you for the reports, forms, and
pipelines you want to include and for other aspects of the application such
as the icon to be used to represent the application.
No queries
InfoMaker applications do not include queries, which also display in the
Library painter.
Users Guide
575
Creating an application
Identifying an
application
Most applications can be identified by selecting Help>About to display
information about the application, such as its name, name of the company
producing the application, version, and so on. After you create an application,
you can modify the application’s initialization file so that your users see
customized information.
For information about identifying your application, see “Identifying your
application” on page 585.
Running an
application
You can run the application the same way you run other Windows applications.
After you start the application, you can run the reports and forms and pipelines
included in the application.
Using pipelines in an
application
Having the ability to execute pipelines in an application is particularly useful
for mobile users working on laptops that are often not connected to a corporate
database. You can pipe a corporate database to the laptop, use forms to update
the database, and run reports against the local database. Then you can pipe the
local data to the corporate database.
For information about executing a pipeline in an application and modifying the
pipeline definition from the application, see “Using a pipeline in an
application” on page 587.
Distributing an
application
An application can be for your personal use only, but you can also distribute it
to others to use. Users can run your application outside the InfoMaker
environment. Having InfoMaker installed is not required.
The requirements for distributing an application with a pipeline differ from the
requirements for distributing an application with only forms and reports
because pipelines can modify the database by adding and dropping tables.
For information about distributing InfoMaker applications to others, see
Chapter 22, “Deploying Your Application.”
Creating an application
When you create an application, all the reports, forms, and pipelines you
include must be in one library (PBL). In the Library painter, you can move or
copy reports, forms, and pipelines from one library to another as needed.
For information about moving or copying objects, see Chapter 2, “Working
with Libraries.”
576
InfoMaker
CHAPTER 21
❖
Working with Applications
To create an application:
1
Connect to the database that the executable will use.
2
Open the Library painter and the library containing the objects you want
to include in the application.
3
Select Design>Create Executable from the menu bar.
If you are creating your first application in the current library, the Create
Executable dialog box displays.
If you have created applications in the current library before, a message
box displays asking whether you want to reuse the objects in the most
recently created application and avoid starting from scratch.
For information, see “Reusing an application” on page 582.
4
Enter a title that will be used in the title bar of the running application.
5
Name your application’s executable file by filling in the Executable File
Name box.
The file name you supply is the name of the executable file that will be
created. You can use a short or long file name with or without spaces. Be
sure to retain the EXE file extension.
6
Users Guide
Specify your own values for the Product Version and File Version fields
associated with the executable file.
577
Creating an application
The values you specify become part of the Version resource associated
with the executable file. The names you enter on the right display on the
Version tab page of the Properties dialog box for the executable file in
Windows Explorer. For example, with the settings shown in the
illustration in step 9, the Properties dialog box for the executable file looks
like this:
The File and Product Version numeric fields, on the left in the painter, are
used by Microsoft Installer to determine whether a file needs to be updated
when a product is installed. They must have the format:
N,N,N,N
The four numbers can be used to represent the major version, minor
version, point release, and build number of your product. They must all be
present. If your file versioning system does not use all these components,
you can replace the unused numbers with zeroes. For example, 3,1,333
causes an error message to display when you attempt to save or build the
project, but 3,1,333,0 does not. The maximum value for any of the
numbers in the string is 65535.
7
578
To specify the location of the executable file, click the Browse button and
navigate to the correct folder.
InfoMaker
CHAPTER 21
8
Working with Applications
Click the Browse button next to the Executable Icon box to assign an icon
to the executable file.
The Select Icon dialog box displays.
9
Navigate to an ICO file and click Open.
The icon you choose will be used if you create a shortcut for the executable
file and when you minimize the executable.
You return to the Create Executable dialog box. The following example
shows the dialog box filled in.
10 Select New Visual Style Controls if you want the application to use the
Windows XP style when a user runs the application on Windows XP with
the Windows XP style for controls set in the control panel.
11 Click Next.
The Select Items dialog box displays listing all the reports, forms, and
pipelines in the library you are using for your application.
Users Guide
579
Creating an application
12 Select the reports, forms, and pipelines you want to package in the
application.
13 Click Next.
The Executable Items dialog box displays, listing all reports, forms, and
pipelines you have selected for the executable file.
In the Executable Items dialog box, you can define the properties of a
toolbar button for any of the items in the executable. Then in the
application you can run the report, form, or pipeline by simply clicking the
toolbar button.
By default, InfoMaker creates an Objects menu in the application that lists
all reports, forms, and pipelines. If you do not specify button text for an
object, the object name displays in the Objects menu.
InfoMaker also creates a File menu in the application. You can select
File>Open Form, File>Open Report, or File>Open Pipeline and then
select a form, report, or pipeline from the list that displays.
You can choose from two styles for menus and toolbars. The traditional
style is similar to the style used in Microsoft Office 2000, and the
contemporary style is similar to the style used in Microsoft Office 2003.
The contemporary style is shown in the illustration in “What happens
when you run an application” on page 584.
14 Select the menu and toolbar style you want to use in your application.
580
InfoMaker
CHAPTER 21
Working with Applications
To quickly prototype an application
The remaining steps describe how to define text, MicroHelp, and pictures
for the application’s toolbar buttons. You can create an application quickly
by clicking Finish now. After you test your prototype, you can reuse the
application definition and finish the remaining steps (which define the
toolbar buttons).
15 If you want a toolbar button for a report, form, or pipeline, specify a
picture for the button, the text you want to show on the button, and
MicroHelp text that displays when the button is clicked:
1
Select the report, form, or pipeline in the Executable Items dialog box.
2
In the Picture drop-down list, select the picture you want to display in
the button for the report, form, or pipeline. The image you choose
displays next to the list.
3
In the Text box, type the text you want to display in the button for the
report, form, or pipeline. Up to 14 characters will display on a button.
4
In the MicroHelp box, type the MicroHelp text you want to display
when the user of the executable selects the button:
Most of the time you should provide text for a button. If no button text
is provided, the object name displays as the button text and in the list
of objects in the Objects menu.
Users Guide
581
Reusing an application
16 If you want to omit a report from the list of reports in the generated
application so that users cannot run it as a standalone report, select the
report and then select the Hide Report check box. This is useful for reports
that have been included only to support a:
•
DropDownDataWindow edit style
•
Report added to a form
•
Report nested in another report
17 When you have defined all the toolbar items, click Finish.
What happens
InfoMaker creates two files:
•
The executable file with the name you supplied.
•
An initialization file with the same name. For example, if you created the
executable file sales.exe, InfoMaker also creates a file named sales.ini.
The initialization file records which database is used by the executable
file.
For information about running an application, see “Running an application” on
page 583.
Identifying your
application
By default, InfoMaker includes brand information to identify your application
when a user displays the Help>About window. You can modify the
application’s initialization file to customize the information that identifies your
application.
For information, see “Identifying your application” on page 585.
An application
includes a query
governor
InfoMaker includes a query governor in an InfoMaker application
automatically. The query governor lets you specify the maximum number of
rows to be retrieved and the maximum time for retrieval.
For more information, see “Using the query governor in an application” on
page 587.
Reusing an application
When you initiate the creation of an application, InfoMaker checks to see
whether an application was previously created using the current library. If so,
InfoMaker retains the specifications for the most recent one. You can start
afresh or reuse the most recent application.
582
InfoMaker
CHAPTER 21
❖
Working with Applications
To reuse the most recent application associated with a library:
1
Connect to the database, open the library, and select Design>Create
Executable from the menu bar.
If an application has been created previously for the current library,
InfoMaker displays the following dialog box:
2
Select Yes or No:
If you want to
Do this
InfoMaker does this
Start from scratch
Click No
Use or start with the objects in
the most recent application
Click Yes
Includes the new selections you
make in a new application
Includes the reports, forms, and
pipelines you selected with your
most recent application along
with all the toolbar properties you
defined for them
When you click Yes, the Create Executable dialog box displays with your
most recent application's title, file name, and icon. You can modify the
entries if you want, and continue to define the application.
Running an application
You can run your application the same way you run other Windows
applications. For example, you can double-click the executable file in Explorer
or you can create an application shortcut on the desktop and double-click the
shortcut.
If you create an application shortcut, before you can run your application by
double-clicking the shortcut, you need to modify the shortcut’s Start In
property.
Users Guide
583
Running an application
❖
To modify the Start In property of the application shortcut:
1
Position the pointer on the icon, display the pop-up menu, and select
Properties.
InfoMaker displays the shortcut’s property sheet.
2
Select the Shortcut tab and type the location of the PowerBuilder runtime
files in the Start In box.
About the location of PowerBuilder runtime files
When you install InfoMaker, the installation process puts the files in the
\Sybase\Shared\PowerBuilder folder in the install location you choose.
You must specify the name of the drive. If you specify a relative path
name, the application will be unable to locate the runtime files.
3
Click OK.
Now you can double-click the application shortcut to run the application.
What happens when
you run an application
When you run the application, the application reads information in the
application’s initialization file and connects to the database to access the data.
Then the application’s main window displays with a menu bar and toolbar:
The application toolbar always has an Exit button and optionally has a Reports
button, a Pipelines button, and a Forms button. If the application does not have
any reports, the toolbar does not have a Reports button (similarly for forms and
pipelines). If you defined toolbar buttons for individual reports, forms, or
pipelines when you created the application, the toolbar contains these buttons.
584
InfoMaker
CHAPTER 21
Working with Applications
Identifying your application
Most applications can be identified by selecting Help>About to display
information about the application such as its name, name of the company
producing the application, version, and so on. By default, InfoMaker includes
the application name and Sybase brand information to identify your
application.
You can modify the application’s initialization file so that your users see
customized information about you and your company.
❖
To customize the application-identity information users see in the
Help>About window:
1
Open the application’s initialization file and create an About section by
adding the following line:
[About]
2
Include some lines like the following in the About section:
[About]
developer_name = Sandy Johnson
software_version = 2.0.3 Build 3456
company_logo = C:\work\beach.bmp
email_address = [email protected]
web_address = www.abcnut.com
phone_number = 1-800-8ABCNUT
3
Save the initialization file.
Now when you open the Help About window, you see the customized
information in the Help>About window:
Users Guide
585
Running an application
Running a report, form, or pipeline
To run a report, form, or pipeline, you can do any of the following:
•
Click its button in the toolbar if you defined a toolbar item for the object.
•
Select it from the Objects menu, which lists all reports, forms, or pipelines
in the executable.
If you specified a toolbar button and button text for a report, form, or
pipeline, this text displays instead of the report, form, or pipeline object
name in the Objects menu.
•
What happens when
you run a report or
form
Click the Reports, Forms, or Pipelines button in the toolbar and select the
item in the resulting dialog box.
Running a report or form in an executable file is the same as running a report
or a form in InfoMaker.
When a report is retrieving data
The number of rows retrieved displays in MicroHelp and the Retrieve button
changes to a Cancel button. You can click the Cancel button at any time to stop
retrieval.
What happens when
you run a pipeline
When you run a pipeline in an application, the Pipeline window displays. You
can then execute the pipeline manually or specify delayed execution.
Advanced users of the application can redefine a pipeline object if you provide
them information about how to do this.
For information about executing a pipeline and redefining a pipeline object in
the application, see “Using a pipeline in an application” on page 587.
For more information
For information about previewing reports, see “Using the Preview view of a
report” on page 200.
For information about running forms that use built-in InfoMaker form styles,
see “Working with forms” on page 523.
For information about running forms using a style created by a PowerBuilder
developer at your organization, see the developer.
586
InfoMaker
CHAPTER 21
Working with Applications
Managing the toolbar
You can move the toolbar and suppress the display of text in the toolbar by
selecting items from the pop-up menu.
Managing the open reports, forms, and pipelines
You can manage the display of reports, forms, and pipelines you have opened
by selecting items from the Window menu, which InfoMaker automatically
provides in the executable.
Using the query governor in an application
When an InfoMaker application (executable file) is created, a query governor
is included automatically.
❖
To access and use the query governor in an application:
1
In the running InfoMaker application, select File>Query Governor from
the menu bar.
The Query Governor dialog box displays:
2
To specify the maximum number of rows to be retrieved and the maximum
time for retrieval, select the appropriate check box, change the limit, and
click OK.
Using a pipeline in an application
When you include a pipeline in an application and run it, the Pipeline window
displays. As the window is displaying, messages are written to the Pipeline Log
box to indicate connection to the source and destination databases, when these
connections are occurring, and the elapsed time.
Users Guide
587
Using a pipeline in an application
You can print the log or save the log to any report format. Users may need to
send the log to you to use for debugging a pipeline. You can empty the log at
any time by clicking the Reset Log button.
Executing pipelines
A pipeline in an application executes when you execute it manually or when
you set a delayed execution mode to automatically execute the pipeline.
The execution mode (Manual by default) shows in the Execution Mode box. If
you set a delayed execution mode, the time settings and a countdown clock
display in the When box.
Manual execution
You can manually execute a pipeline anytime, even if you have set a delayed
execution mode.
❖
To execute the pipeline manually:
•
Delayed execution
Click the Execute button.
You can specify delayed automatic execution of the pipeline. This setting
remains in effect until you close the Pipeline window.
❖
To delay the execution of the pipeline:
1
Select Actions>Delayed Execution from the menu bar.
The Delayed Execution dialog box displays.
2
588
Select the Delayed radio button if it is not already selected:
InfoMaker
CHAPTER 21
3
Working with Applications
In the Start boxes, specify the execution date and time.
The day, month, numerical day, and year for the date you specify display
under the Start boxes. You should verify that this date is the date you want,
because the date is based on the operating system’s short date setting. For
example, a date of 04/12/06 could mean April 12, 2006, or December 6,
2004.
4
Click OK.
The pipeline will execute at the specified date and time.
Delayed/Recurring
execution
You can specify delayed and recurring automatic execution of the pipeline.
This setting remains in effect until you close the Pipeline window.
❖
To delay and repeat the execution of the pipeline at specified intervals:
1
Select Actions>Delayed Execution from the menu bar.
The Delayed Execution dialog box displays.
2
Select the Delayed/Recurring radio button.
3
In the Start boxes, specify the execution date and time.
The day, month, numerical day, and year for the date you specify display
under the Start boxes.
4
In the Every boxes, specify the time delay for subsequent executions of the
pipeline.
5
Click OK.
The pipeline will execute at the specified start time and then execute
repeatedly.
If execution errors
occur
If execution errors occur, the errors display in the Pipeline Errors box. You can
print the errors or save the errors to any report format. You can sometimes
correct errors in the Pipeline Errors box.
Users of the application usually should not repair pipeline execution errors.
Users should contact you if execution errors occur and send the error log to you
for debugging of the pipeline. Usually you should modify the pipeline object
in InfoMaker to fix errors and redeploy the application.
At times, you may want users to fix execution errors by modifying the pipeline
definition from the application. Advanced users of the application can modify
the application’s initialization file to allow them to change the pipeline object’s
definition from the application. You can tell users how to do this if needed.
Users Guide
589
Using a pipeline in an application
For information about adding a [Pipe] section to the initialization file, see
“Modifying the pipeline object’s definition” on page 590.
Repairing execution
errors
When a pipeline executes and has execution errors, the error messages display
in the Pipeline Errors box in the workspace and instructions for repairing the
errors display in a message box.
❖
To repair pipeline errors:
1
In the Pipeline Errors box, look at the Error Message column to identify
errors.
2
Change the data values for the appropriate columns in the error rows.
You can extend the column borders to resize the column to the width
needed to see error messages and column data.
3
Click the Repair button to execute the pipeline.
If errors have been corrected, the pipeline executes and the Pipeline Errors
box clears.
Modifying the pipeline object’s definition
By default, you can execute a pipeline in an application, but you cannot modify
the pipeline object’s definition.
If you are deploying your application to advanced users, however, you may
want to give users the ability to modify the pipeline object from the application.
Allowing users to modify pipelines means that you do not have to modify the
pipeline object in InfoMaker, recreate the application, and deploy it
immediately. However, since the pipeline object definition is not saved when
you modify a pipeline in an application, you should redeploy the application
later.
What you can allow
users to modify
590
To modify a pipeline definition, either you or your users must add a new
section to the application’s initialization file. Users can change the type of
pipeline operation and the Commit and Max Errors values. Depending on the
quality of the network connection (particularly if users are connecting by
telephone from laptops), lowering the Commit and Max Errors values could
result in more efficient committing of rows to the database. For example,
committing all rows when the database connection is through a 28.8 Kb/sec
modem could take a long time and your phone connection could fail. It may be
better to change the Commit value to 10.
InfoMaker
CHAPTER 21
❖
Working with Applications
To enable users to modify the pipeline’s definition:
1
Open the application’s initialization file and create a Pipe section by
adding the following line:
[Pipe]
2
Include these lines in the Pipe section:
[Pipe]
AllowTypeChange = 1
AllowRunTimeChange = 1
This keyword
Allows the user to change the
AllowTypeChange
Type of pipeline operation: Create, Refresh,
Replace, Append, and Update
AllowRunTimeChange
Commit value, Max Errors value, and whether to
pipe extended attributes
Omitting lines in the [Pipe] section
If you do not want users to change the pipeline type, you can omit the
AllowTypeChange line in the [Pipe] section. You cannot omit the
AllowRunTimeChange line.
3
Save the initialization file.
Now when you select the Actions menu in a pipeline, you see new menu
items that enable you to change the pipeline type, the Commit value, the
Max Errors value, and whether the pipeline copies extended attributes:
Modifying the pipeline
definition
After a user’s application initialization file has been modified to include the
[Pipe] section, the user can use items on the Actions menu to modify the
pipeline definition.
For complete information about pipeline types, the Commit value, and the Max
Errors value, see Chapter 4, “Working with Data Pipelines.”
Users Guide
591
Using a pipeline in an application
❖
To modify the pipeline type:
1
Select Actions>Pipeline Type from the menu bar.
A menu of pipeline types displays.
2
❖
Select the pipeline type:
To modify the Commit value:
1
Select Actions>Pipeline Commit After from the menu bar.
A menu of Commit values displays.
2
❖
Select the Commit value:
To modify the Max Errors value:
1
Select Actions>Pipeline Max Errors Allowed from the menu bar.
A menu of Max Errors values displays.
592
InfoMaker
CHAPTER 21
2
❖
Working with Applications
Select the Max Errors value:
To specify whether or not to pipe extended attributes:
•
Select or clear the Actions>Pipeline Copy Extended Attributes menu item:
Starting an application from the command line
You or your users can start an InfoMaker application from a command line (or
the Windows Run dialog box) and pass parameters to perform actions on
reports, forms, and pipelines.
To start an InfoMaker application, use the following syntax:
directory\yourapplication.exe
Users Guide
593
Starting an application from the command line
Opening an object or
creating a new object
Examples
You can also add one or more of the following optional parameters to the
command line to perform a specific action:
Parameter
Description
/R reportname
/RP reportname
Run the specified report
Run and print the specified report
/RPC reportname
/A arg1;arg2;argN
Run and print the specified report and close the application
Provides a list of retrieval arguments for a report specified by
one of the /R parameters. The arguments must be in the
correct order, separated by semi-colons. If a retrieval
argument is an array, its argument values must be separated
by commas. Decimal arrays are not supported
/F formname
/FP formname
Run the specified form
Run and print the specified form
/FPC formname
/P pipelinename
Run and print the specified form and close the application
Run the specified pipeline
/PC pipelinename
Run the specified pipeline and close the application
This command line opens the Employee application and runs and prints the
report called r_employee_list. The report requires two retrieval arguments: a
department number and a date:
c:\myapp\emp.exe /RP r_employee_list/A 100;12/01/07
This command line opens the Employee application, runs and prints the form
called f_employees_in_department, and closes the application:
c:\myapp\emp.exe /FPC f_employees_in_department
This command line opens the Employee application, runs the p_dailypipe
pipeline, and closes the application:
c:\myapp\emp.exe /PC p_daily_pipe
594
InfoMaker
CH A PTE R
About this chapter
Contents
2 2
Deploying Your Application
This chapter provides information required for deploying applications to
users’ computers.
Topic
About deploying applications
Page
595
Installing InfoMaker runtime files
Making the data source available
597
599
Saving as PDF and XSL-FO
Installing the executable application and supporting files
607
610
Starting the deployed application
611
About deploying applications
Creating an executable version of an application means packaging an
application that can run on its own, outside the InfoMaker environment.
Users of your application do not need InfoMaker to run the application.
When you create an application, InfoMaker generates an executable file
and an initialization file for your application. To deploy an application
however, you must distribute other files in addition to the executable file
and the initialization file. Exactly what you distribute depends on whether
users have InfoMaker installed or not.
Users Guide
595
About deploying applications
Figure 22-1: Deploying an InfoMaker application
To set up a user’s machine to run your application, you need to copy all the
runtime files and database interface files you need to the right places. If you are
using a SQL Anywhere database, the SQL Anywhere files needed to run your
application must also be installed.
When you deploy an InfoMaker application, what you install on a user’s
computer depends on whether the user has InfoMaker installed.
If the user does not have InfoMaker installed, you need to install the following
files:
Table 22-1: Files required on the user’s computer
What to install
Notes
Runtime DLLs
You need install only the runtime files that your application
uses
If your database is an ODBC database, install the ODBC
database driver
If your database is a native database, install the native
database driver
Check with your database vendor for information about
additional files you need to deploy and the licensing issues
ODBC drivers
Native database
drivers
Additional files
If the user has InfoMaker installed, you need to install only ODBC drivers (if
your database is an ODBC database).
❖
596
To deploy an application, do the following:
1
Create a folder for the application on the user’s computer.
2
Copy the application executable and initialization files to the application
folder.
3
Install the runtime files required.
4
Distribute your data source.
InfoMaker
CHAPTER 22
Deploying Your Application
5
Install the database runtime files on the user’s computer.
6
Configure your ODBC drivers, system path, and registry files.
Installing InfoMaker runtime files
When you install InfoMaker, shared files that are used by both PowerBuilder
and InfoMaker are installed in the Shared\PowerBuilder directory. You need to
deploy a subset of these files with your application.
The following table indicates which feature each file is required to support. For
example, PBVM115.DLL, PBSHR115.DLL, LIBJCC.DLL, and
LIBJUTILS.DLL are required for all deployed applications. You need not
install some other files unless your application uses the features indicated. You
should install the runtime files in the same directory as the application or in a
directory on the system path.
Database connections
The runtime files needed to enable database connections are described in
"Making the data source available" next.
Table 22-2: Runtime files
Users Guide
Required for
Name
All
Reports and forms
PBVM115.DLL, PBSHR115.DLL, LIBJCC.DLL,
LIBJUTILS.DLL
PBDWE115.DLL
Data pipelines
Java VM
PBDPL115.DLL
PBJVM115.DLL
Rich Text
PBRTC115.DLL, tp13.dll, tp13_bmp.flt, tp13_css.dll,
tp13_doc.dll, tp13_gif.flt, tp13_htm.dll, tp13_ic.dll,
tp13_ic.ini, tp13_jpg.flt, tp13_obj.dll, tp13_pdf.dll,
tp13_png.flt, tp13_rtf.dll, tp13_tif.flt, tp13_tls.dll,
tp13_wmf.flt, tp13_wnd.dll, tp4ole13.ocx
DataWindow plug-in
DataWindow Web
Control for ActiveX
Label report presentation
style predefined formats
NPDWE115.DLL
psdwc115.cab, pbjdbc12115.jar
PBLAB115.INI
597
Installing InfoMaker runtime files
Microsoft files
Required for
Name
Accessibility (Section
508) support
PBACC115.DLL
Database connection
tracing
PBTRA115.DLL
When you deploy the core InfoMaker runtime files, you must also deploy the
msvcr71.dll and msvcp71.dll Microsoft Visual C++ runtime libraries and the
Microsoft .NET Active Template Library (ATL) module, atl71.dll, if they are
not present on the user’s computer. The InfoMaker runtime files have a runtime
dependency on these files.
Microsoft Windows GDI+ is the subsystem of the Windows XP operating
system or Windows Server 2003 that implements enhanced graphic
capabilities for screens and printers. The InfoMaker runtime files have a
runtime dependency on gdiplus.dll. If you deploy your InfoMaker application
to the Windows 2000 platform, you must make sure that gdiplus.dll is available
on the target computer.
Localized runtime files
Localized runtime files are provided for French, German, Italian, Spanish,
Dutch, Danish, Norwegian, and Swedish. These files are usually available
shortly after the general release of a new version of InfoMaker.
The localized runtime files let you deploy InfoMaker applications with
standard runtime dialog boxes in the local language. They handle languagespecific data when the application runs, including:
598
The DayName function returns a
name in the language of the runtime files available on the machine where
the application is run.
•
DayName function manipulation
•
DateTime manipulation When you use the String function to format a
date and the month is displayed as text (for example, the display format
includes “mmm”), the month is in the language of the runtime files
available when the application is run.
•
Error messages InfoMaker error messages are translated into the
language of the runtime files.
InfoMaker
CHAPTER 22
Deploying Your Application
Making the data source available
Your users need access to the DBMS and to the database your application uses.
You need to:
•
If necessary, install the DBMS runtime files in the application directory or
in a directory on the system path.
Follow the instructions and licensing rules specified by the vendor.
•
Make sure each user has access to the database the application uses.
If your application uses a local database, install the database and any
associated files, such as a log file, on the user’s computer.
If your application uses a server database, make sure the user’s computer
is set up to access the database. This may be the task of a database
administrator.
•
Install any native database interfaces your application uses on the user’s
computer.
•
If your application uses the ODBC interface, configure the ODBC
database drivers and data sources, as described in “Configuring an ODBC
driver” on page 600.
Installing native database interfaces
You need to install the database interface drivers your application requires,
such as the ODBC interface and native database interfaces.
The files for the native database interfaces your application uses belong in the
same directory as the application or in a directory on the system path. When
you install InfoMaker, these files are installed in the Shared\PowerBuilder
directory. The first two characters of the file name are PB, the next three
characters identify the database, and the last two identify the version of
InfoMaker. For example, PBO90115.DLL is the Oracle9i database interface
and PBSYC115.DLL is the Sybase CT-LIB database interface.
Users Guide
599
Making the data source available
Installing ODBC and system files
If your application uses ODBC drivers, each user’s computer needs three types
of files:
•
Install
PBODB115.DLL in the application directory or a directory on the system
path. The PBODB115.INI file must be in a directory defined by the
HKEY_CURRENT_USER\Software\Sybase\InfoMaker\11.5\InitPath
registry setting or, in the absence of that key, in the same directory as the
DLL file. In most cases, the target deployment machine will not have the
registry setting and, therefore, the INI file should be in the same directory
as the DLL file.
PowerBuilder ODBC interface and driver syntax files
For information about adding sections or functions to the PBODB115.INI
file, see Connecting to Your Database.
•
Microsoft ODBC driver and DLLs The Microsoft ODBC Driver
Manager (ODBC32.DLL) and supporting files are usually already
installed in the user’s Windows system directory.
•
ODBC database drivers and supporting files Sybase provides ODBC
database drivers for SQL Anywhere.
Configuring an ODBC driver
To use an ODBC data source in your application, the ODBC configuration
must include:
ODBC.INI
•
An entry for the data source in ODBC.INI with instructions on how to start
the database
•
An entry for the DBMS driver in ODBCINST.INI
To allow the user to connect to a particular data source, your installation
program must provide a definition for that data source in the ODBC.INI key in
the registry on the computer that accesses the data source, in
HKEY_CURRENT_USER for a user DSN or in HKEY_LOCAL_MACHINE for
a system DSN. The data source definition specifies the name and location of
the database driver as well as the command required to start the database
engine. The data source in the ODBC Data Sources key must also be listed in
ODBC.INI.
The following shows typical registry entries for a data source called MyApp DB
that uses SQL Anywhere. Registry keys are enclosed in square brackets and are
followed by string values for that key in the format "Name"="Value":
600
InfoMaker
CHAPTER 22
Deploying Your Application
[HKEY_CURRENT_USER\SOFTWARE\ODBC\ODBC.INI\MyApp DB]
"Driver"="C:\Program Files\SQL Anywhere 11\
Bin32\dbodbc11.dll"
"Start"="C:\Program Files\SQL Anywhere 11\Bin32\
dbeng11.exe"
"UID"="dba"
"PWD"="sql"
"Description"="Database for my application"
"DatabaseFile"="C:\Program Files\myapps\myapp.db"
"AutoStop"="Yes"
[HKEY_CURRENT_USER\SOFTWARE\ODBC\ODBC.INI\
ODBC Data Sources]
"MyApp DB"="SQL Anywhere 11.0"
You might use one of the following ways to make the modifications to
ODBC.INI:
•
Use Microsoft’s ODBC Administrator control panel, if the control panel is
available on the user’s system.
•
Use a software distribution application that includes ODBC configuration
instructions to do your installation.
For more information about the contents of the registry entries for ODBC
drivers and data sources, see Connecting to Your Database.
ODBCINST.INI
Your installation program needs to make two types of entry in the
ODBCINST.INI key in HKEY_LOCAL_MACHINE\SOFTWARE\ODBC for
each driver that your deployed application uses:
•
Add a string value with the name of the driver and the data value
"Installed" to the ODBC DRIVERS key in ODBCINST.INI
•
Add a new key for each driver to the ODBCINST.INI key with string
values for Driver and Setup
Some drivers require additional string values in ODBCINST.INI.
If the ODBC database driver files are not located in a directory on the system
path, you also need to add their location to the App Paths key for the executable
file in the registry.
If you are using ODBC drivers obtained from a vendor, you can use the driver’s
setup program to install the driver and create registry entries.
The following shows typical registry entries for SQL Anywhere. Registry keys
are enclosed in square brackets and are followed by string values for that key
in the format "Name"="Value":
[HKEY_LOCAL_MACHINE\SOFTWARE\Microsoft\Windows\
Users Guide
601
Making the data source available
CurrentVersion\App Paths\myapp.exe]
"Default"="C:\Program Files\myapps\MYAPP.EXE"
"Path"="Program Files\sybase\shared\PowerBuilder;
C:\Program Files\SQL Anywhere 11\Bin32\;"
[HKEY_LOCAL_MACHINE\SOFTWARE\ODBC\ODBCINST.INI\
ODBC Drivers]
"SQL Anywhere 11"="Installed"
[HKEY_LOCAL_MACHINE\SOFTWARE\ODBC\ODBCINST.INI\
SQL Anywhere 11]
"Driver"="C:\Program Files\SQL Anywhere 11\
Bin32\dbodbc11.dll"
"Setup"="C:\Program Files\SQL Anywhere 11\
win32\dbodbc11.dll"
For more information about the contents of the registry entries for ODBC
drivers and data sources, see Connecting to Your Database.
Database profiles
Connecting to Your Database includes information about database profiles,
which are defined in the Windows registry. They provide the information
necessary to connect to data sources from the development environment. Your
users do not need database profiles.
Deploying SQL Anywhere files
If your InfoMaker application uses a SQL Anywhere database, you need to
deploy the SQL Anywhere database as well as SQL Anywhere’s ODBC
database drivers.
Restrictions
InfoMaker includes SQL Anywhere for use during the development process.
However, this product cannot be deployed royalty-free to your users.
If your application requires the data definition language (DDL), a transaction
log, stored procedures, or triggers, see your Sybase sales representative.
602
InfoMaker
CHAPTER 22
Deploying Your Application
If your application uses a standalone database, you can deploy the SQL
Anywhere Desktop Runtime System to users’ computers without incurring
additional license fees. The runtime system allows the user to retrieve and
modify data in the database, but does not allow modifications to the database
schema. It does not support transaction logs, stored procedures, or triggers.
A full installation for the SQL Anywhere driver, runtime engine, and
supporting files is available in the Support\SA10Runtime directory on the
CD. Table 22-3 lists some of the files that are installed. For more information
see the RuntimeEdition.html file in the installed directory.
Table 22-3: SQL Anywhere files
Name
DBODBC11.DLL
Description
SQL Anywhere ODBC driver
DBBACKUP.EXE
DBCON11.DLL
SQL Anywhere backup utility
Connection dialog box, required if you do not provide your
own dialog box and your end users are to create their own
data sources, if they need to enter user IDs and passwords
when connecting to the database, or if they need to display
the Connection dialog box for any other purpose
DBISQLC.EXE
DBLGEN11.DLL
DBLIB11.DLL
Interactive SQL utility
Language-specific string library (EN indicates the English
version)
Interface library
DBTOOL11.DLL
DBUNLSPT.EXE
SQL Anywhere database tools
SQL Anywhere unload utility
DBVALID.EXE
DBENG11.EXE
SQL Anywhere validation utility
Restricted runtime engine
DBCTRS11.DLL
DBSERV11.DLL
Performance utility
Server utility
In addition to deploying database files and drivers, you need to do the
following for your users:
•
Make your application’s data source available
•
Configure ODBC to access the data source
For more information about deploying SQL Anywhere databases and
applications, see the SQL Anywhere documentation.
Users Guide
603
Making the data source available
OLE DB database providers
If your application uses OLE DB to access data, you must install Microsoft’s
Data Access Components software on each user’s computer if it is not installed
already.
The InfoMaker OLE DB interface requires the functionality of the Microsoft
Data Access Components (MDAC) version 2.8 or higher software. Version 2.8
is distributed with Windows XP Service Pack 2 and Windows Server 2003.
To check the version of MDAC on a computer, users can download and run the
MDAC Component Checker utility from the MDAC Downloads page at
http://msdn.microsoft.com/en-us/data/aa937730.aspx.
On the Windows Vista operating system, the Windows Data Access
Components (DAC) version 6.0 includes some changes to work with Vista but
is otherwise functionally equivalent to MDAC 2.8.
OLE DB data providers installed with MDAC
Several Microsoft OLE DB data providers are automatically installed with
MDAC, including the providers for SQL Server (SQLOLEDB) and ODBC
(MSDASQL).
PowerBuilder OLE DB
interface files
The PowerBuilder OLE DB interface file is required if your application uses
OLE DB. The ODBC initialization file is required if you have used it to
customize OLE DB settings:
Table 22-4: PowerBuilder OLE DB interface files
Name
Description
pbole115.dll
pbodb115.ini
PowerBuilder OLE DB interface
PowerBuilder ODBC initialization file
JDBC database interface
The PowerBuilder JDB interface supports the Sun Java Runtime Environment
(JRE) versions 1.2 and later.
If your application or component uses JDBC connections, you must deploy the
JDB driver as well as the appropriate Java package for the Java VM you are
using. The Java virtual machine and a vendor-supplied JDBC-compliant driver,
such as Sybase jConnect® for JDBC, must also be installed and configured on
the computer that accesses the data source.
For more information about the Java VM, see "Java support" next.
604
InfoMaker
CHAPTER 22
Deploying Your Application
Table 22-5: PowerBuilder JDB interface files
Name
PBJDB115.DLL
Description
PowerBuilder JDBC Driver (JDB) for JRE 1.2 or later
pbjdbc12115.jar
Java package for PowerBuilder JDB driver and JRE 1.2 or
later
Java support
You must deploy the pbjvm115.dll file with any applications or components
that use the Java Runtime Environment (JRE), and there must be a JRE
installed on the target computer. The JRE is required for JDBC connections.
You can copy the JRE installed with InfoMaker to the same directory as the
PowerBuilder runtime files on the target computer, or use an existing JRE
whose location is defined in the user’s system PATH environment variable.
Locating the Java VM
When an InfoMaker application requires a Java VM, the runtime searches for
the jvm.dll file in a subdirectory of the directory where pbjvm115.dll is installed
on the user’s computer. The jvm.dll file is installed in the JRE\bin\client
directory of JDK 1.4 and later installations, and in the JRE\bin\classic directory
in JDK 1.2 and 1.3 installations.
InfoMaker adds the location of jvm.dll to the beginning of the path currently
being used by the PowerBuilder application. This path is a copy of the path
defined in the user’s PATH system environment variable. InfoMaker does not
modify the environment variable maintained in the Windows registry.
To locate the jvm.dll, InfoMaker first determines where pbjvm115.dll is
installed. Suppose pbjvm115.dll is installed in
C:\Sybase\Shared\PowerBuilder.
Then InfoMaker uses this search procedure to add the location of the jvm.dll to
the path currently in use:
Users Guide
1
Search for the directory structure JRE\bin\client (for JDK 1.4 or later) in
C:\Sybase\Shared\PowerBuilder\ and, if found, add it to the beginning of
the path.
2
If not found, search for a JDK directory structure that contains
JRE\bin\client in C:\Sybase\Shared\PowerBuilder\ and, if found, add it to
the beginning of the path.
3
If not found, search for the directory structure JRE\bin\classic (for JDK
1.2 or 1.3) in C:\Sybase\Shared\PowerBuilder\ and, if found, add it to the
beginning of the path.
605
Making the data source available
If none of these directory structures is found, InfoMaker uses the first jvm.dll
whose location is defined in the user’s PATH environment variable. If no
jvm.dll is found, the Java VM does not start.
The runtime Java VM
classpath
Overriding the runtime
static registry
classpath
When an InfoMaker application starts a Java VM, the Java VM uses internal
path and classpath information to ensure that required Java classes are always
available. At runtime, the Java VM uses a classpath constructed by
concatenating these paths:
•
The InfoMaker runtime static registry classpath. This is a path built into
the pbjvm115.dll file that corresponds to the path in the Windows Registry
that is used when you are developing an application in InfoMaker. It
contains classes required at runtime for features that use a Java VM.
•
The system CLASSPATH environment variable.
•
The current directory.
If necessary, you can override the JVM settings and properties defined for
runtime use in the static registry. InfoMaker uses the following algorithm to
locate configuration information:
1
When the first request is made for a JVM, InfoMaker looks for registry
entries for the configuration information and properties to be passed to the
function that creates the JVM.
2
If InfoMaker finds a registry entry for the configuration information, it
uses it instead of the static registry. If it does not find a registry entry, it
uses the static registry.
3
If InfoMaker finds a registry entry for custom properties to be passed to
the JVM, it uses those instead of the static registry. If it does not find a
registry entry, it uses the static registry entries
To override the default settings, create a new key named PBRTConfig in the
HKEY_LOCAL_MACHINE\Software\Sybase\InfoMaker\11.5\Java key, then
add either or both of the following subkeys: PBJVMconfig and PBJVMprops.
To duplicate the static registry entries, add the same string values to these
subkeys that you see in the PBIDEConfig key, that is:
606
Subkey
PBJVMconfig
String value name
Count
String value data
1
PBJVMprops
0
java.compiler
-verbose:jni,class
NONE
InfoMaker
CHAPTER 22
Deploying Your Application
You can override either the configuration or properties entries or both. If you
make incorrect entries, InfoMaker attempts to recover by defaulting to the
static registry. However, you should be cautious about making any changes
since you can cause incorrect behavior in the JVM if you do not configure it
correctly.
Saving as PDF and XSL-FO
If your application includes a report or form that has a button that displays the
Save As dialog box, you need to deploy some files that enable users to save as
PDF or XSL-FO. To save as PDF using the distill method, users also need to
download and install Ghostscript.
For more information about saving as PDF and XSL-FO, see “Saving the data
as PDF” on page 209 and “Saving as XSL-FO” on page 212. For more
information about assigning button actions, see “Actions assignable to buttons
in reports” on page 244.
Using the Ghostscript distiller
In order for users to save data as PDF with the distiller, they must first
download and install Ghostscript on their computers as described in the
procedure that follows.
The use of GPL Ghostscript is subject to the terms and conditions of the GNU
General Public License (GPL). Users should be asked to read the GPL before
installing GPL Ghostscript on their computers. A copy of the GPL is available
on the GNU Project Web server at http://www.gnu.org/licenses/gpl.html.
The use of AFPL Ghostscript is subject to the terms and conditions of the
Aladdin Free Public License (AFPL). Commercial distribution of AFPL
Ghostscript generally requires a written commercial license. For more
information, see the Ghostscript Web site at http://www.ghostscript.com/awki.
Users Guide
607
Saving as PDF and XSL-FO
❖
To install Ghostscript:
1
Into a temporary directory on your computer, download the self-extracting
executable file for the version of Ghostscript you want from one of the
sites listed on the Ghostscript Web site at http://www.ghostscript.com/awki.
See the release bulletin for the version of Ghostscript that was used for
testing.
2
Run the executable file to install Ghostscript on your system.
The default installation directory is C:\Program Files\gs. You can select a
different directory and/or choose to install shortcuts to the Ghostscript
console and readme file.
After installing Ghostscript, you should read the readme.htm file in the doc
subdirectory in the Ghostscript installation directory to find out more about
using Ghostscript and distributing it with your application.
Location of files
When you save a report object as PDF using the distill method, InfoMaker
searches in the following locations for an installation of GPL or AFPL
Ghostscript:
•
The Windows registry
•
The relative path of the pbdwe115.dll file (typically
Sybase\Shared\PowerBuilder)
•
The system PATH environment variable
If GPL or AFPL Ghostscript is installed using the Ghostscript executable file,
the path is added to the Windows registry.
If the Ghostscript files are in the relative path of the pbdwe115.dll file, they
must be installed in this directory structure:
dirname\pbdwe115.dll
dirname\gs\gsN.NN
dirname\gs\fonts
where dirname is the directory that contains the runtime DLLs and N.NN
represents the release version number for Ghostscript.
PostScript printer
drivers
608
If your users have installed a PostScript printer on their computers, the
PostScript driver files required to create PDF files are already installed. If they
have never installed a PostScript printer, they can use the Printers and Faxes
option in the Windows control panel to install a generic PostScript printer. If
the Microsoft Pscript5.dll has never been installed, they may be prompted to
insert the Windows install CD.
InfoMaker
CHAPTER 22
Deploying Your Application
You must also deploy the related files that are installed in
Sybase\Shared\PowerBuilder\drivers. These files can be copied to or installed
on users’ computers. They must be located in this directory structure:
dirname\pbdwe115.dll
dirname\drivers
PostScript printer
profile
Each user’s computer must have a PostScript printer profile called Sybase
DataWindow PS. This profile is added to your development computer
automatically when you save a DataWindow’s rows to a PDF file in the
DataWindow painter.
Users can add the profile manually using the Windows Add Printer wizard. In
the wizard, click the Have Disk button and browse to the Adist5.inf file
installed in the Shared\PowerBuilder\drivers directory, or to another
PostScript driver file.
Using the Apache FO processor
If your application uses the Apache processor to save as PDF or XSL-FO, you
must deploy the fop-0.20.4 directory and the Java Runtime Environment (JRE)
with your application.
They must be deployed in the same directory as the PowerBuilder runtime
files. For example, if you deploy your application and pbvm115.dll and the
other PowerBuilder runtime files in a directory called MyApplication, the
Apache processor and the JRE must be deployed in MyApplication/fop-0.20.4
and MyApplication/jre. However, you do not need to place a copy of the JRE
in this location if the full JDK is installed on the target computer and is in the
classpath.
The following JAR files must be in the user’s classpath:
fop-0.20.4\build\fop.jar
fop-0.20.4\lib\batik.jar
fop-0.20.4\lib\xalan-2.3.1.jar
fop-0.20.4\lib\xercesImpl-2.1.0.jar
fop-0.20.4\lib\xml-apis.jar
fop-0.20.4\lib\avalon-framework-cvs-20020315.jar
For more information about the JRE, see “Java support” on page 605.
On Windows DBCS platforms, you also need to deploy a file that supports
DBCS characters to the Windows font directory on the target computer, for
example, C:\WINNT\fonts. For more information about configuring fonts, see
the Apache Web site at http://xml.apache.org/fop/fonts.html.
Users Guide
609
Installing the executable application and supporting files
Installing the executable application and supporting
files
When you install your application on a user’s machine, make sure you include
any supporting files, such as dynamic libraries, resources such as BMP and
ICO files, online Help files, and initialization files.
Modifying the application’s initialization file
In your application’s initialization file, remove your name from the line that
reads:
UserID=YourID
An InfoMaker application’s initialization file specifies the data source that is
used by the reports and forms that were included in the application.
When InfoMaker generated the initialization file, it included your User ID.
When users run your application, they will be prompted to supply their user ID
and password if:
•
Your data source is not an ODBC data source
•
Your data source is an ODBC data source and the user ID and password
are not in the application’s initialization file
Deploying ActiveX controls
If your application uses ActiveX controls, OLE controls, or OCX controls you
must:
•
Deploy the control files with your application
•
Make sure each control is registered
•
Make sure required files are in the target computer’s system directory
If your application uses a control that is not self-registering, your setup
program needs to register it manually on each user’s computer. To find out
whether a control is self-registering, see the documentation provided with the
control. Depending on the development and deployment platforms and the
controls you are deploying, you might need to copy additional DLLs or license
files to the Windows system directories on the target computer.
610
InfoMaker
CHAPTER 22
Deploying Your Application
Starting the deployed application
Your users can run your application the same way they run other Windows
applications. For example, they can double-click the executable file in
Explorer or create an application shortcut on the desktop and double-click the
shortcut.
If users create a shortcut, the Target textbox on the Shortcut properties page
should specify the path to the executable, and the Start In textbox should
specify the location of the runtime files. For information about modifying an
application shortcut’s properties and running an application, see “Running an
application” on page 583.
Users Guide
611
Starting the deployed application
612
InfoMaker
PART
6
Reference
This part describes using operators and expressions and
InfoMaker expression functions.
CH A PTE R
About this chapter
Contents
2 3
Operators and Expressions
You use an expression to request that InfoMaker perform a computational
operation. This chapter explains how expressions work and how to write
them.
Topic
Where you use expressions
Page
615
Operators used in InfoMaker expressions
Operator precedence in InfoMaker expressions
618
625
Matching text patterns
626
Where you use expressions
An InfoMaker expression is a combination of data, operators, and
functions that, when evaluated, results in a value. An expression can
include column names, operators, functions, and constants such as
numbers and text strings.
For information about functions that you can use in expressions, see
“Using DataWindow expression and InfoMaker functions” on page 629,
or look up the function you want in online Help.
Users Guide
615
Where you use expressions
In painters, you use expressions in these ways:
Table 23-1: Using expressions in InfoMaker painters
In this painter
Report painter
Form painter
Database painter
Expressions are used in
Computed fields
Conditional expressions for property values
Filters
Sorting
Series and values in graphs
Columns, rows, and values in crosstabs
Computed fields
Conditional expressions for property values
Validation rules
Validation rules
Other types of expressions you use
You also use expressions in Quick Select, SQL Select, and the Query painter
to specify selection criteria, and in SQL Select and the Query painter to create
computed columns. In these painters you are using SQL operators and
DBMS-specific functions, not operators and functions, to create expressions.
Some of the specific places where you use expressions are described here.
In computed fields
Expressions for computed fields can evaluate to any value. The datatype of the
expression becomes the datatype of the computed field:
Table 23-2: Using expressions in computed fields
Expression
Description
Today ( )
Salary/12
Displays the date using the Today function
Computes the monthly salary
Sum (Salary for group 1)
Computes the salary for the first group using the Sum
aggregate function
Price*Quantity
Computes the total cost
Expressions for graphs and crosstabs
You can use similar expressions for series and values in graphs and for
columns, rows, and values in crosstabs.
616
InfoMaker
CHAPTER 23
In filters
Operators and Expressions
Filter expressions are boolean expressions that must evaluate to true or false:
Table 23-3: Using expressions with filters
Expression
Academics = "*****" AND
Cost = "$$$"
Emp_sal < 50000
Description
Displays data only for colleges with both a 5-star
academic rating and a $$$ cost rating
Displays data for employees with salaries less
than $50,000
Salary > 50000 AND Dept_id
BETWEEN 400 AND 700
Displays data for employees in departments 400,
500, 600, and 700 with salaries greater than
$50,000
Displays data for people with birth dates in
September or February
Month(Bdate) = 9 OR
Month(Bdate) = 2
Match ( Lname, "[ ^ABC ]" )
In validation rules for
table columns
Displays data for people whose last name begins
with A, B, or C
Validation rules are boolean expressions that compare column data with values
and that use relational and logical operators. When the validation rule evaluates
to false, the data in the column is rejected.
When you specify a validation rule in the Form painter,
you should validate the newly entered value. To refer to the newly entered
value, use the GetText function. Because GetText returns a string, you also need
a data conversion function (such as Integer or Real) if you compare the value
to other types of data.
In the Form painter
If you include the column name in the expression, you get the value that
already exists for the column instead of the newly entered value that needs
validating.
In the Database painter When you specify the validation rule in the
Database painter, you are defining a general rule that can be applied to any
column. Use @placeholder to stand for the newly entered value. The name
you use for @placeholder is irrelevant. You can assign the rule to any column
that has a datatype appropriate for the comparison.
When you define a form, a validation rule assigned to a column is brought into
the form and converted to form syntax. @placeholder is converted to GetText
and the appropriate datatype conversion function.
Users Guide
617
Operators used in InfoMaker expressions
You can refer to values in other columns for the
current row by specifying their names in the validation rule:
Other columns in the rule
Table 23-4: Using expressions with values from other columns
Expression in
Database painter
@column >= 10000
Expression in Form
painter
Integer(GetText())>=
10000
@column IN (100,
200, 300)
Integer(GetText()) IN
(100, 200, 300)
@salary > 0
Long(GetText()) > 0
Match(@disc_price,
"^[0-9]+$") and
@disc_price <
Full_Price
Match(GetText( ),
"^[0-9]+$") and
Real(GetText()) <
Full_Price
Description
If a user enters a salary below
$10,000, an error message
displays.
If a user does not enter a
department ID of 100, 200, or
300, an error message displays.
If a user does not enter a positive
number, an error message
displays.
If a user enters any characters
other than digits, or the resulting
number is greater than or equal
to the value in the Full_Price
column, an error message
displays.
Operators used in InfoMaker expressions
An operator is a symbol or word in an expression that performs an arithmetic
calculation or logical operation; compares numbers, text, or values; or
manipulates text strings.
Four types of operators are available:
618
for numeric datatypes. See “Arithmetic operators in
InfoMaker expressions” on page 619.
•
Arithmetic
•
Relational for all datatypes. See “Relational operators in InfoMaker
expressions” on page 619.
•
Logical
•
Concatenation for string datatypes. See “Concatenation operator in
InfoMaker expressions” on page 624.
for all datatypes. See “Logical operators in InfoMaker
expressions” on page 623.
InfoMaker
CHAPTER 23
Operators and Expressions
Arithmetic operators in InfoMaker expressions
When you write an expression, you can use the following arithmetic operators:
Table 23-5: Using expressions with arithmetic operators
Multiplication and
division
Operator
Meaning
Example
+
-
Addition
Subtraction
SubTotal + Tax
Price - Discount
*
/
Multiplication
Division
Quantity * Price
Discount / Price
^
Exponentiation
Rating ^ 2.5
Multiplication and division are carried out to full precision (16–18 digits).
Values are rounded:
Table 23-6: Value rounding in InfoMaker expressions
Calculations with null
Expression
20.0/3
Value
6.666666666666667
3*(20.0/3)
Truncate(20.0/3,4)
20
6.6666
When you form an arithmetic expression that contains a null value, the
expression becomes null. Thinking of null as undefined makes this easier to
understand. For example, when a null column is multiplied by 5, the entire
expression also evaluates to null. Use the IsNull function to explicitly check for
the null value.
Boolean expressions that contain a null value evaluate to false rather than to
null. For more information, see “Relational operators in InfoMaker
expressions” next.
Relational operators in InfoMaker expressions
You use relational operators to compare a value with other values. The result is
a boolean expression whose value is always true or false.
Since the result of a boolean expression is always true or false, a relational
operator that compares a value to null evaluates to false. For example, the
expression “column > 5” evaluates to false (and “NOT column > 5” evaluates
to true) when the column value is null.
Users Guide
619
Operators used in InfoMaker expressions
When you write an expression, you can use the following relational operators
(more information about LIKE, IN, and BETWEEN follows the table):
Table 23-7: Using expressions with relational operators
Operator
=
Meaning
Is equal to
Example
Price = 100
>
<
Is greater than
Is less than
Price > 100
Price < 100
<>
>=
Is not equal to
Greater than or equal to
Price <> 100
Price >= 100
<=
NOT =
Less than or equal to
Is not equal to
Price <= 100
Price NOT= 100
LIKE
Matches this specified
pattern.
Is in this set of values.
Emp_lname LIKE 'C%' OR
Emp_lname LIKE 'G%'
Dept_id IN (100, 200, 500)
Is within this range of
values. The range includes
the first and last values.
Does not match this
specified pattern.
Price BETWEEN 1000 AND
3000
IN
BETWEEN
NOT LIKE
Special characters for
operations with strings
NOT IN
Is not in this set of values.
NOT BETWEEN
Is outside this range of
values. The range includes
the first and last values.
Emp_lname NOT LIKE 'C%'
AND Emp_lname NOT LIKE
'G%'
Dept_id NOT IN (100, 200, 500)
Price NOT BETWEEN 1000
AND 2000
You can use the following special characters with relational operators that take
string values:
Table 23-8: Special characters for use in expressions with relational
operators
LIKE and NOT LIKE
operators
620
Special character
Meaning
Example
% (percent)
Matches any group of
characters.
Good% matches all names that
begin with Good.
_ (underscore)
Matches any single
character.
Good _ _ _ matches all 7-letter
names that begin with Good.
Use LIKE to search for strings that match a predetermined pattern. Use NOT
LIKE to search for strings that do not match a predetermined pattern. When
you use LIKE or NOT LIKE, you can use the % or _ characters to match
unknown characters in a pattern.
InfoMaker
CHAPTER 23
Operators and Expressions
For example, the following expression for the Background.Color property of
the Salary column displays salaries in red for employees with last names
beginning with F and displays all other salaries in white:
If(emp_lname LIKE'F%',RGB(255,0,0),RGB(255,255,255))
Escape keyword
If you need to use the % or _ characters as part of the string, you can use the
escape keyword to indicate that the character is part of the string. For example,
the _ character in the following filter string is part of the string to be searched
for, but is treated as a wildcard:
comment LIKE ~'%o_a15progress%~'
The escape keyword designates any character as an escape character (do not
use a character that is part of the string you want to match). In the following
example, the asterisk (*) character is inserted before the _ character and
designated as an escape character, so that the _ character is treated as part of
the string to be matched:
comment like ~'%o*_a15progress%~' escape ~'*~'
BETWEEN and NOT
BETWEEN operators
Use BETWEEN to check if a value is within a range of values. Use NOT
BETWEEN to check if a value is not in a range of values. The range of values
includes the boundary values that specify the range.
For example, the following expression for the Background.Color property of
the Salary column displays salaries in red when an employee’s salary is
between $50,000 and $100,000 and displays all other salaries in white:
If(salary BETWEEN 50000 AND 100000, RGB(255,0,0),
RGB(255,255,255))
You can use the BETWEEN and NOT BETWEEN operators with string
values. For example, if the following expression is used for the Visual property
of a column, column values display only for departments listed alphabetically
between Finance and Sales:
If(dept_name BETWEEN 'Finance' AND 'Sales',1,0)
The % or _ characters can be used when you are using string values with the
BETWEEN and NOT BETWEEN operators. This example might include
more department listings than the previous example:
If(dept_name BETWEEN 'F%' AND 'S%',1,0)
You can also use the BETWEEN and NOT BETWEEN operators with
methods. For example:
GetRow( ) BETWEEN 5 AND 8
Users Guide
621
Operators used in InfoMaker expressions
IN and NOT IN
operators
Use IN to check if a value is in a set of values. Use NOT IN to check if a value
is not in a set of values.
For example, the following expression for the Background.Color property of
the Salary column displays salaries in red for employees in department 300 or
400 having a salary between $50,000 and $100,000, and displays all other
salaries in white:
If(dept_id IN (300,400) and salary BETWEEN 50000 AND
100000, RGB(255,0,0), RGB(255,255,255))
Comparing strings in InfoMaker expressions
When you compare strings, the comparison is case sensitive. Leading blanks
are significant, but trailing blanks are not.
Case-sensitivity
examples
Assume City1 is “Austin” and City2 is “AUSTIN”. Then:
City1=City2
returns false.
To compare strings regardless of case, use the Upper or Lower function. For
example:
Upper(City1)=Upper(City2)
returns true.
For information about these functions, see “Using DataWindow expression
and InfoMaker functions” on page 629.
Blanks examples
Assume City1 is "Austin" and City2 is " Austin ". Then the expression:
City1=City2
returns false. InfoMaker removes the trailing blank before making the
comparison, but it does not remove the leading blank.
To prevent leading blanks from affecting a comparison, remove them with one
of the trim functions: Trim or LeftTrim.
For example:
Trim(City1)=Trim(City2)
returns true.
622
InfoMaker
CHAPTER 23
Operators and Expressions
To compare strings when trailing blanks are significant, use an expression such
as the following to ensure that any trailing blanks are included in the
comparison:
City1 + ">" = City2 + ">"
For information about these functions, see “Using DataWindow expression
and InfoMaker functions” on page 629.
Logical operators in InfoMaker expressions
You use logical operators to combine boolean expressions into a larger boolean
expression. The result is always true or false:
Table 23-9: Using expressions with logical operators
Operator
NOT
Meaning
Logical negation.
Example
NOT Price = 100
AND
If A is true, NOT A is false. If A is false,
NOT A is true.
Logical and.
Tax > 3 AND Ship < 5
OR
A AND B is true if both are true. A AND B
is false if either is false.
Logical or.
Tax > 3 OR Ship < 5
A OR B is true if either is true or both are
true. A OR B is false only if both are false.
When you combine two or more boolean expressions to form a new expression,
the new expression is either true or false. The following truth table shows how
true and false expressions are evaluated to form an expression that is either true
or false.
For example, if “My dog has fleas” is true and “My hair is brown” is false, then
“My dog has fleas OR my hair is brown” is true, and “My dog has fleas AND
my hair is brown” is false:
Table 23-10: Combining expressions with logical operators
Users Guide
If one expression
has this value
TRUE
And the
logical
operator is
AND
And if another
expression has
this value
TRUE
The resulting
expression has
this value
TRUE
TRUE
FALSE
AND
AND
FALSE
TRUE
FALSE
FALSE
623
Operators used in InfoMaker expressions
If one expression
has this value
And the
logical
operator is
And if another
expression has
this value
The resulting
expression has
this value
FALSE
TRUE
AND
OR
FALSE
TRUE
FALSE
TRUE
TRUE
FALSE
OR
OR
FALSE
TRUE
TRUE
TRUE
FALSE
NOT TRUE
OR
AND
FALSE
TRUE
FALSE
FALSE
NOT TRUE
NOT FALSE
AND
AND
FALSE
TRUE
FALSE
TRUE
NOT FALSE
AND
FALSE
FALSE
NOT TRUE
NOT TRUE
OR
OR
TRUE
FALSE
TRUE
FALSE
NOT FALSE
NOT FALSE
OR
OR
TRUE
FALSE
TRUE
TRUE
If you use a logical operator with a boolean function that returns null, the term
with the null return value is evaluated as false. If you use the NOT logical
operator with a boolean function that returns null, the complete term evaluates
to true. For example, NOT gf_boolean () evaluates to true when gf_boolean
returns null.
Concatenation operator in InfoMaker expressions
The concatenation operator joins the contents of two variables of the same type
to form a longer value. You can concatenate strings and blobs.
To concatenate values, you use the plus sign (+) operator.
Table 23-11: Using expressions with concatenation operator
String expression
"over" + "stock"
Value
overstock
Lname + ', ' + Fname
If Lname is Hill and Fname is Craig, then "Hill, Craig"
Using quotes
You can use either single or double quotes in string expressions. For example,
the expression "over" + "stock" is equivalent to the expression 'over' +
'stock'.
624
InfoMaker
CHAPTER 23
Operators and Expressions
Operator precedence in InfoMaker expressions
To ensure predictable results, operators in InfoMaker expressions are evaluated
in a specific order of precedence. When operators have the same precedence,
they are evaluated from left to right.
The following table lists the operators in descending order of precedence:
Table 23-12: Operator precedence in InfoMaker expressions
Overriding the
precedence order
Operator
Purpose
()
^
Grouping
Exponentiation
*, /
+, -
Multiplication and division
Addition and subtraction; string concatenation
IN,LIKE,BETWEEN
SQL SELECT statement conditions
=, >, <, <=, >=, <>
AND,OR
Relational operators
Logical and and logical or
NOT
Logical negation
Since expressions in parentheses are evaluated first, to override the precedence
order, enclose expressions in parentheses. You can also use parentheses to
clarify the order of evaluation. Within each set of parentheses, precedence
order applies.
In the expression x+y*a+b, y is first multiplied by a (because multiplication
has a higher precedence than addition). The result of the multiplication is then
added to x and this result is then added to b (because the + operators are
evaluated left to right).
To force evaluation in a different order, group expressions with parentheses.
For example, in the expression x+(y*(a+b)), a+b is evaluated first. The sum
a+b is then multiplied by y, and this product is added to x.
Users Guide
625
Matching text patterns
Matching text patterns
A text pattern is an expression that you can use to evaluate whether a string
contains a particular pattern of characters. Text patterns consist of
metacharacters, which have special meaning, and characters
(nonmetacharacters). The way the metacharacters and normal characters are
combined specify the pattern you are looking for.
Metacharacters
Valid metacharacters are:
•
^ (caret)
•
$ (dollar sign)
•
. (period)
•
\ (backslash)
•
[ ] (brackets)
•
* (asterisk)
•
+ (plus)
•
? (question mark)
Nonmetacharacters
In a text pattern, you can also use characters that are not metacharacters. One
or more nonmetacharacters in a text pattern (such as letters) match the
characters themselves. For example, A matches A, and ABC matches ABC.
Examples
Text patterns are needed in all expressions that use the Match function. Text
patterns are used in validation rules in the Form painter (in a column object’s
Validation property page) and the Database painter (in the Match Pattern dialog
box). For information about the Match function, see Match on page 702.
The following table shows various text patterns and sample text that matches
each pattern:
Table 23-13: Matching text patterns in InfoMaker expressions
This pattern
AB
B*
AB*C
AB+C
626
Matches
Any string that contains AB; for example, ABA, DEABC,
graphAB_one.
Any string that contains 0 or more Bs; for example, AC, B, BB,
BBB, ABBBC, and so on.
Any string containing the pattern AC or ABC or ABBC, and so
on (0 or more Bs).
Any string containing the pattern ABC or ABBC or ABBBC,
and so on (1 or more Bs).
InfoMaker
CHAPTER 23
Users Guide
Operators and Expressions
This pattern
Matches
ABB*C
Any string containing the pattern ABC or ABBC or ABBBC,
and so on (1 B plus 0 or more Bs).
^AB
AB?C
Any string starting with AB.
Any string containing the pattern AC or ABC (0 or 1 B).
^[ABC]
[^ABC]
Any string starting with A, B, or C.
A string containing any characters other than A, B, or C.
^[^abc]
^[^a-z]$
[A-Z]+
A string that begins with any character except a, b, or c.
Any single-character string that is not a lowercase letter (^ and
$ indicate the beginning and end of the string).
Any string with one or more uppercase letters.
^[0-9]+$
Any string consisting only of digits.
^[0-9][0-9][0-9]$
^([0-9][0-9][0-9])$
Any string consisting of exactly three digits.
Any string consisting of exactly three digits enclosed in
parentheses.
627
Matching text patterns
628
InfoMaker
CH A PTE R
2 4
About this chapter
Contents
DataWindow Expression and
InfoMaker Functions
This chapter provides syntax, descriptions, and examples of the functions
you can use in expressions in the DataWindow painter and in InfoMaker’s
Report painter and Form painter.
Topic
Using DataWindow expression and InfoMaker functions
Page
629
Four examples
630
Alphabetical list of DataWindow expression and InfoMaker functions 640
Using DataWindow expression and InfoMaker
functions
DataWindow expression functions and InfoMaker functions are the same
functions. In the DataWindow painter (in PowerBuilder and other
environments) and in InfoMaker’s Report and Form painters, you can use
DataWindow expression functions in expressions for computed fields,
filters, validation rules, and graphed data, with some exceptions.
The dialog boxes in which you define expressions include a list box that
lists the available functions and their arguments. The dialog boxes make
it easy to insert a function into the expression.
Return values for functions
and expressions
DataWindow expression and InfoMaker functions can return the
following datatypes:
Double
Decimal
String
DateTime
Time
Users Guide
629
Four examples
Within an expression, a function can return other datatypes (such as boolean,
date, or integer), but the final value of an expression is converted to one of
these datatypes.
Restrictions for
aggregate functions
An aggregate function is a function (such as Avg, Max, StDev, and Sum) that
operates on a range of values in a column. When you use an aggregate function,
some restrictions apply. You cannot use an aggregate function:
•
In a filter
•
In a validation rule
•
As an argument for another aggregate function
When you use aggregate functions, they cancel the effect of setting Retrieve
Rows As Needed. To do the aggregation, the report always retrieves all rows.
Formatting for the
locally correct display
of numbers
No matter what country you are creating objects and developing an application
in, you must use U.S. number notation in numbers or number masks in display
formats, edit masks, and DataWindow and InfoMaker expressions. This means
that when you specify a number or number mask, use a comma as the
thousands delimiter and period for the decimal place.
Numbers display appropriately in whatever countries you deploy applications
in. At runtime, the locally correct symbols for numbers display (because the
international Control Panel settings are used) when numbers are interpreted.
For example, in countries where comma represents the decimal place and
period represents thousands, users see numbers in those formats at runtime.
For information about the locally correct display of dates and day names, see
String on page 746 and DayName on page 674.
Four examples
Example 1: counting null values in a column
A null value is a marker used to fill a place in a column where data is missing
for any reason. The value might not be applicable, or it might be missing or
unknown. When a database table is created, each column in the table either
allows null values or does not allow them. The column or set of columns that
define the primary key cannot allow null values. Sometimes it is useful to know
how many null values there are in a particular column.
630
InfoMaker
CHAPTER 24
What you want to do
DataWindow Expression and InfoMaker Functions
Suppose you are working with the Fin_code table in the Enterprise Application
Sample Database. The Fin_code table has three columns:
Table 24-1: Columns in the Fin_code table
Column
What the column is
Allows null
values?
Code
Type
Unique financial identifier (primary key)
Code type: expense or revenue
No
No
Description
Code description: the department incurring
the expense or getting the revenue
Yes
You create a report using the Code and Description columns. You want to know
the number of null values in the Description column.
How to do it
In the report, you create a computed field that uses functions to display the
number of null values in the Description column.
For the sake of demonstrating the use of functions, the following computed
fields are created in the Summary band of the report (with text objects that tell
you what information each computed field is providing):
Count(description for all)
counts the number of descriptions (that are not null);
Sum(If(IsNull(description), 1, 0))
returns a 1 if the description column is null, a 0 if the description column is not
null, and then adds the total;
Count(id for all)
counts the number of IDs (which is also the number of rows);
Sum(If(IsNull(description), 1, 1))
adds the number of nulls and not nulls in the description column (which is the
total number of rows) and should match the result of the
Count( id for all ) function; and
IsNull(description)
evaluates whether the last row in the table has a description that is null. The
return value of the IsNull function is true or false.
Users Guide
631
Four examples
What you get
Here is the design for the report.
Here is the report showing eight descriptions, three of which are null and five
of which are not null. The last description for Id=8 is null.
Example 2: counting male and female employees
Example 1 demonstrates the use of the Sum and Count functions. Sum and
Count are two examples of a class of functions called aggregate functions.
An aggregate function is a function that operates on a range of values in a
column. The aggregate functions are:
Avg
632
Large
Mode
Sum
Count
Last
Percent
Var
CumulativePercent
Max
Small
VarP
CumulativeSum
Median
StDev
First
Min
StDevP
InfoMaker
CHAPTER 24
DataWindow Expression and InfoMaker Functions
About crosstab functions
Although the crosstab functions (CrosstabAvg, CrosstabAvgDec,
CrosstabCount, CrosstabMax, CrosstabMaxDec, CrosstabMin, CrosstabMinDec,
CrosstabSum, and CrosstabSumDec) behave like aggregate functions, they are
not included on the list because they are for crosstabs only and are designed to
work in the crosstab matrix.
A few restrictions apply to the use of aggregate functions. You cannot use an
aggregate function:
•
In a filter
•
In a validation rule
•
As an argument for another aggregate function
This example demonstrates the use of the Sum aggregate function.
What you want to do
Using the employee table in the EAS Demo DB as the data source, you create
a report using at least the Emp_id and the Sex columns. You want the report to
display the number of male employees and female employees in the company.
How to do it
In the summary band in the workspace, add two computed fields to the report
that use the Sum and If functions:
Sum(If(sex = "M", 1, 0))
counts the number of males in your company;
Sum(If(sex = "F", 1, 0))
counts the number of females in your company.
By clicking the Page computed field button, you can also add a Page computed
field in the footer band to display the page number and total pages at the bottom
of each page of the report.
What you get
Users Guide
Here is what the design of the report looks like.
633
Four examples
Here is the last page of the report, with the total number of males and females
in the company displayed.
If you want more
information
What if you decide that you also want to know the number of males and
females in each department in the company?
❖
To display the males and females in each department:
1
Select Design>Data Source from the menu bar so that you can edit the data
source.
2
Select Design>Select tables from the menu bar and open the Department
table in the Select painter workspace, which currently displays the
Employee table with the Emp_id and Sex columns selected.
3
Select the department_dept_name column to add it to your data source.
4
Select Rows>Create Group from the menu bar to create a group and group
by department name.
5
In the trailer group band, add two additional computed fields:
Sum(If(sex = "M", 1, 0) for group 1)
counts the number of males in each department;
Sum(If(sex = "F", 1, 0) for group 1)
counts the number of females in each department.
634
InfoMaker
CHAPTER 24
DataWindow Expression and InfoMaker Functions
Here is what the design of the grouped report looks like.
Here is the last page of the report with the number of males and females in the
shipping department displayed, followed by the total number of males and
females in the company.
Users Guide
635
Four examples
Example 3: creating a row indicator
This example demonstrates the use of several functions: Bitmap, Case,
CurrentRow, GetRow, and RGB.
The example is presented in the DataWindow painter, which is the same as
InfoMaker’s Report painter. You can use all the functions shown in the
example in the Report painter. However, because you can change the current
row and change data in a DataWindow object (which you cannot do in a
report), the example is more interesting to consider in a DataWindow object.
What you want to do
Using the Employee table in the Enterprise Application Sample Database, you
create a DataWindow object using the Emp_id, Emp_fname, Emp_lname, and
Salary columns.
In the painter, you want to display a number of items such as the number of the
current row, an arrow that is an indicator of the current row, and the salary for
an employee with a background color that depends on what the salary is.
How to do it
In the workspace, add the following:
•
A computed field CurrentRow( ), which displays the number of the current
row.
•
A picture object, which is a right-arrow, for which you define an
expression for the arrow’s visible property:
If(CurrentRow()= GetRow(), 1, 0)
The expression causes an arrow to display in the current row and no arrow
to display in other rows.
•
A computed field using the If, CurrentRow, and GetRow functions:
If(CurrentRow() = GetRow(),"Current","Not current")
displays the word “Current” when the row is the current row and “Not
current” for all other rows.
•
A computed field (typed on one line) using the Bitmap, CurrentRow, and
GetRow functions:
Bitmap(If(CurrentRow()= GetRow(),
"c:\sampl\ex\code\indicatr.bmp", " "))
displays an arrow bitmap for the current row and no bitmap for all other
rows.
636
InfoMaker
CHAPTER 24
•
DataWindow Expression and InfoMaker Functions
An expression for the Background.Color property of the salary column:
Case(salary WHEN IS >60000 THEN RGB(192,192,192)
WHEN IS >40000 THEN RGB(0,255,0) ELSE
RGB(255,255,255))
The expression causes a salary above $40,000 to display in green, a salary
above $60,000 to display in gray, and all other salaries to display in white.
What you get
Here is what the design of the report looks like:
Here is what the data looks like with the second row current.
Notice that the number of the current row is 2; the first row and the third row
are "Not current" (and therefore display no bitmap); and the second row, which
is the current row, displays the arrow row indicator.
On your screen, the salary in the first row has a green background because it is
more than $40,000; the salary in the second row has a gray background because
it is more than $60,000; and the salary in the third row has a white background,
which matches the background of the report.
Users Guide
637
Four examples
Example 4: displaying all data when a column allows nulls
When you create an arithmetic expression that has a null value, the value of the
expression is null. This makes sense, since null means essentially undefined
and the expression is undefined, but sometimes this fact can interfere with what
you want to display.
What you want to do
A table in your database has four columns: Id, Corporation, Address1, and
Address2. The Corporation, Address1, and Address2 columns allow null
values. Using this table as the data source, you create a report using the four
columns. You now want the report to display both parts of the address,
separated by a comma.
You create a computed field to concatenate Address1 and Address2 with a
comma separator. Here is the expression that defines the computed field:
address1 + ", " + address2
When you preview the report, if either Address1 or Address2 is null, no part of
the address displays because the value of the expression is null. To display a
part of the address, you need to create a computed field that forces evaluation
even if Address2 is null. Note that Address2 is assumed to have data only if
Address1 has data for a particular row.
How to do it
In the detail band, create a computed field that uses the If and IsNull functions:
If(IsNull(address1 + address2), address1, address1
+ ", " + address2)
The computed field says this: if the concatenation of the addresses is null
(because address2 is null), then display address1, and if it is not null, display
both parts of the address separated by a comma.
What you get
638
Here is what the design of the report looks like. It includes both the computed
field that does not work and the one that does.
InfoMaker
CHAPTER 24
DataWindow Expression and InfoMaker Functions
When you preview the report, notice that the first computed field displays null
for ABC Corporation and XYZ Corporation. The second computed field
displays the first part of the address, which is not null.
Other examples
In InfoMaker, to see some examples of using functions, examine the reports
and forms in TUTOR_IM.PBL, which is InfoMaker’s sample library. The
reports and forms were created using data in the EAS Demo DB.
Look carefully at the reports whose names begin with attrib_. Each report is a
good example of the use of functions in expressions. And look at the design of
each report and form in the sample library to see the use of functions in other
ways.
For more information
For examples of using expressions to control the value of properties at
execution time, see the chapter on highlighting information in reports in the
Users Guide.
For an example of the use of each InfoMaker function, see the function
descriptions that follow.
Users Guide
639
Alphabetical list of DataWindow expression and InfoMaker functions
Alphabetical list of DataWindow expression and
InfoMaker functions
The list of DataWindow expression and InfoMaker functions follows in
alphabetical order.
640
InfoMaker
CHAPTER 24 DataWindow Expression and InfoMaker Functions
Abs
Description
Calculates the absolute value of a number.
Syntax
Abs ( n )
Argument
n
Description
The number for which you want the absolute value
Return value
The datatype of n. Returns the absolute value of n.
Examples
This expression counts all the product numbers where the absolute value of the
product number is distinct:
Count(product_number for All DISTINCT Abs
(product_number))
Only data with an absolute value greater than 5 passes this validation rule:
Abs(value_set) > 5
See also
Count
ACos
Description
Calculates the arc cosine of an angle.
Syntax
ACos ( n )
Argument
Description
n
The ratio of the lengths of two sides of a triangle for which you want
a corresponding angle (in radians). The ratio must be a value
between -1 and 1.
Return value
Double. Returns the arc cosine of n if it succeeds.
Examples
This expression returns 0:
ACos(1)
This expression returns 3.141593 (rounded to six places):
ACos(-1)
This expression returns 1.000000 (rounded to six places):
ACos(.540302)
See also
Users Guide
Cos
ASin
ATan
641
Asc
Asc
Description
Converts the first character of a string to its Unicode code point. A Unicode
code point is the numerical integer value given to a Unicode character.
Syntax
Asc ( string )
Argument
string
Description
The string for which you want the code point value of the first
character
Return value
Unsigned integer. Returns the code point value of the first character in string.
Usage
Use Asc to test the case of a character or manipulate text and letters.
To find out the case of a character, you can check whether its code point value
is within the appropriate range.
Examples
This expression for a computed field returns the string in code_id if the code
point value of the first character in code_id is A (65):
If (Asc(code_id) = 65, code_id, "Not a valid code")
This expression for a computed field checks the case of the first character of
lname and if it is lowercase, makes it uppercase:
IF (Asc(lname) > 64 AND Asc(lname) < 91, lname,
WordCap(lname))
See also
Char
WordCap
AscA
Description
Converts the first character of a string to its ASCII integer value.
Syntax
AscA ( string )
Argument
Description
string
The string for which you want the ASCII value of the first character
Return value
Integer. Returns the ASCII value of the first character in string.
Usage
Use AscA to test the case of a character or manipulate text and letters.
To find out the case of a character, you can check whether its ASCII value is
within the appropriate range.
642
InfoMaker
CHAPTER 24 DataWindow Expression and InfoMaker Functions
Examples
This expression for a computed field returns the string in code_id if the ASCII
value of the first character in code_id is A (65):
If (AscA(code_id) = 65, code_id, "Not a valid code")
This expression for a computed field checks the case of the first character of
lname and if it is lowercase, makes it uppercase:
IF (AscA(lname) > 64 AND AscA(lname) < 91, lname,
WordCap(lname))
See also
CharA
WordCap
ASin
Description
Calculates the arc sine of an angle.
Syntax
ASin ( n )
Argument
n
Description
The ratio of the lengths of two sides of a triangle for which you want
a corresponding angle (in radians). The ratio must be a value
between -1 and 1.
Return value
Double. Returns the arc sine of n if it succeeds.
Examples
This expression returns .999998 (rounded to six places):
ASin(.84147)
This expression returns .520311 (rounded to six places):
ASin(LogTen (Pi (1)))
This expression returns 0:
ASin(0)
See also
Users Guide
Sin
ACos
ATan
Pi
643
ATan
ATan
Description
Calculates the arc tangent of an angle.
Syntax
ATan ( n )
Argument
n
Description
The ratio of the lengths of two sides of a triangle for which you want
a corresponding angle (in radians)
Return value
Double. Returns the arc tangent of n if it succeeds.
Examples
This expression returns 0:
ATan(0)
This expression returns 1.000 (rounded to three places):
ATan(1.55741)
This expression returns 1.267267 (rounded to six places):
ATan(Pi(1))
See also
Tan
ASin
ACos
Avg
Description
Calculates the average of the values of the column.
Syntax
Avg ( column { FOR range { DISTINCT { expres1 {, expres2 {, ... } } } } } )
Argument
column
644
Description
The column for which you want the average of the data values.
Column can be the column name or the column number preceded
by a pound sign (#). Column can also be an expression that includes
a reference to the column. The datatype of column must be numeric.
InfoMaker
CHAPTER 24 DataWindow Expression and InfoMaker Functions
Argument
Description
FOR range
(optional)
The data that will be included in the average. For most presentation
styles, values for range are:
• ALL – (Default) The average of all values in column.
• GROUP n – The average of values in column in the specified
group. Specify the keyword GROUP followed by the group
number: for example, GROUP 1.
• PAGE – The average of the values in column on a page.
For Crosstabs, specify CROSSTAB for range:
• CROSSTAB – (Crosstabs only) The average of all values in
column in the crosstab.
For Graph and OLE objects, specify one of the following:
• GRAPH – (Graphs only) The average of values in column in the
range specified for the Rows option.
• OBJECT – (OLE objects only) The average of values in column
in the range specified for the Rows option.
DISTINCT
(optional)
expresn
(optional)
Causes Avg to consider only the distinct values in column when
calculating the average. For a value of column, the first row found
with the value is used and other rows that have the same value are
ignored.
One or more expressions that you want to evaluate to determine
distinct rows. Expresn can be the name of a column, a function, or
an expression.
Return value
The numeric datatype of the column. Returns the average of the values of the
rows in range.
Usage
If you specify range, Avg returns the average value of column in range. If you
specify DISTINCT, Avg returns the average value of the distinct values in
column, or if you specify expresn, the average of column for each distinct value
of expresn.
For graphs and OLE objects, you do not select the range when you call the
function. The range has already been determined by the Rows setting on the
Data property page (the Range property), and the aggregation function uses
that range. Settings for Rows include the following:
•
For the Graph or OLE presentation style, Rows is always All.
•
For Graph controls, Rows can be All, Page, or Group.
•
For OLE controls, Rows can be All, Current Row, Page, or Group. The
available choices depend on the layer the control occupies.
In calculating the average, null values are ignored.
Users Guide
645
Avg
Not in validation rules or filter expressions
You cannot use this or other aggregate functions in validation rules or filter
expressions.
Using an aggregate function cancels the effect of setting Retrieve Rows As
Needed in the painter. To do the aggregation, a report always retrieves all rows.
Examples
This expression returns the average of the values in the column named salary:
Avg(salary)
This expression returns the average of the values in group 1 in the column
named salary:
Avg(salary for group 1)
This expression returns the average of the values in column 5 on the current
page:
Avg(#5 for page)
This computed field returns Above Average if the average salary for the page
is greater than the average salary:
If(Avg(salary for page) > Avg(salary), "Above Average",
" ")
This expression for a graph value sets the data to the average value of the
sale_price column:
Avg(sale_price)
This expression for a graph value sets the data value to the average value of the
sale_price column for the entire graph:
Avg(sale_price for graph)
Assuming a report displays the order number, amount, and line items for each
order, this computed field returns the average of the order amount for the
distinct order numbers:
Avg(order_amt for all DISTINCT order_nbr)
See also
646
Median
Mode
InfoMaker
CHAPTER 24 DataWindow Expression and InfoMaker Functions
Bitmap
Description
Displays the specified bitmap.
For computed fields only
You can use the Bitmap function only in a computed field.
Syntax
Bitmap ( string )
Argument
string
Description
A column containing bitmap files, a string containing the name of
an image file (a BMP, GIF, JPEG, RLE, or WMF file), or an
expression that evaluates to a string containing the name of an
image file
Return value
The special datatype bitmap, which cannot be used in any other function.
Usage
Use Bitmap to dynamically display a bitmap in a computed field. When string
is a column containing bitmap files, a different bitmap can display for each
row.
Examples
These examples are all expressions for a computed field.
This expression dynamically displays the bitmap file contained in the column
named employees:
Bitmap(employees)
If the employees column is column 3, this next expression gives the same result
as the expression above:
Bitmap(#3)
This expression displays the bitmap tools.bmp:
Bitmap("TOOLS.BMP")
This expression tests the value in the column named password and then uses
the value to determine which bitmap to display:
Bitmap(If(password = "y", "yes.bmp", "no.bmp"))
See also
Users Guide
“Example 3: creating a row indicator” on page 636
647
Case
Case
Description
Tests the values of a column or expression and returns values based on the
results of the test.
Syntax
Case ( column WHEN value1 THEN result1 { WHEN value2 THEN result2
{ ... } } { ELSE resultelse } )
Argument
Description
column
The column or expression whose values you want to test. Column
can be the column name or the column number preceded by a pound
sign (#). Column can also be an expression that includes a reference
to the column. Column is compared to each valuen.
Introduces a value-result pair. At least one WHEN is required.
WHEN
(optional)
valuen
One or more values that you want to compare to values of column.
A value can be:
• A single value
• A list of values separated by commas (for example, 2, 4, 6, 8)
• A TO clause (for example, 1 TO 20)
• IS followed by a relational operator and comparison value (for
example, IS>5)
THEN
resultn
ELSE
(optional)
resultelse
• Any combination of the above with an implied OR between
expressions (for example, 1,3,5,7,9,27 TO 33, IS>42)
Introduces the result to be returned when column matches the
corresponding valuen.
An expression whose value is returned by Case for the
corresponding valuen. All resultn values must have the same
datatype.
Specifies that for any values of column that do not match the values
of valuen already specified, Case returns resultelse.
An expression whose value is returned by Case when the value of
column does not match any WHEN valuen expression.
Return value
The datatype of resultn. Returns the result you specify in resultn.
Usage
If more than one WHEN clause matches column, Case returns the result of the
first matching one.
Examples
This expression for the Background.Color property of a Salary column returns
values that represent red when an employee’s salary is greater than $70,000,
green when an employee’s salary is greater than $50,000, and blue otherwise:
Case(salary WHEN IS >70000 THEN RGB(255,0,0) WHEN IS
>50000 THEN RGB(0,255,0) ELSE RGB(0,0,255))
648
InfoMaker
CHAPTER 24 DataWindow Expression and InfoMaker Functions
This expression for the Background.Color property of an employee Id column
returns red for Id 101, gray for Id 102, and black for all other Id numbers:
Case(emp_id WHEN 101 THEN 255 WHEN 102 THEN
RGB(100,100,100) ELSE 0)
This expression for the Format property of the Marital_status column returns
Single, Married, and Unknown based on the data value of the Marital_status
column for an employee:
Case(marital_status WHEN 'S'THEN 'Single' WHEN 'M' THEN
'Married' ELSE 'Unknown')
See also
“Example 3: creating a row indicator” on page 636
If
Ceiling
Description
Retrieves the smallest whole number that is greater than or equal to a specified
limit.
Syntax
Ceiling ( n )
Argument
Description
n
The number for which you want the smallest whole number that is
greater than or equal to it
Return value
The datatype of n. Returns the smallest whole number that is greater than or
equal to n.
Examples
These expressions both return -4:
Ceiling(-4.2)
Ceiling(-4.8)
This expression for a computed field returns ERROR if the value in
discount_amt is greater than the smallest whole number that is greater than or
equal to discount_factor times price. Otherwise, it returns discount_amt:
If(discount_amt <= Ceiling(discount_factor * price),
String(discount_amt), "ERROR")
Users Guide
649
Char
To pass this validation rule, the value in discount_amt must be less than or
equal to the smallest whole number that is greater than or equal to
discount_factor times price:
discount_amt <= Ceiling(discount_factor * price)
See also
Int
Round
Truncate
Char
Description
Converts an integer to a Unicode character.
Syntax
Char ( n )
Argument
Description
n
The integer you want to convert to a character
Return value
String. Returns the character whose code point value is n.
Examples
This expression returns the escape character:
Char(27)
See also
Asc
CharA
Description
Converts an integer to an ASCII character.
Syntax
CharA ( n )
Argument
Description
n
The integer you want to convert to a character
Return value
String. Returns the character whose ASCII value is n.
Examples
This expression returns the escape character:
CharA(27)
See also
650
AscA
InfoMaker
CHAPTER 24 DataWindow Expression and InfoMaker Functions
Cos
Description
Calculates the cosine of an angle.
Syntax
Cos ( n )
Argument
n
Description
The angle (in radians) for which you want the cosine
Return value
Double. Returns the cosine of n.
Examples
This expression returns 1:
Cos(0)
This expression returns .540302:
Cos(1)
This expression returns -1:
Cos(Pi(1))
See also
Pi
Sin
Tan
Count
Description
Calculates the total number of rows in the specified column.
Syntax
Count ( column { FOR range { DISTINCT { expres1 {, expres2 {, ... } } } } } )
Users Guide
Argument
Description
column
The column for which you want the number of rows. Column can
be the column name or the column number preceded by a pound
sign (#). Column can also be an expression that includes a reference
to the column.
651
Count
Argument
Description
FOR range
(optional)
The data that will be included in the count. For most presentation
styles, values for range are:
• ALL – (Default) The count of all rows in column.
• GROUP n – The count of rows in column in the specified group.
Specify the keyword GROUP followed by the group number: for
example, GROUP 1.
• PAGE – The count of the rows in column on a page.
For Crosstabs, specify CROSSTAB for range:
• CROSSTAB – (Crosstabs only) The count of all rows in column
in the crosstab.
For Graph and OLE objects, specify one of the following:
• GRAPH – (Graphs only) The count of values in column in the
range specified for the Rows option.
• OBJECT – (OLE objects only) The count of values in column in
the range specified for the Rows option.
DISTINCT
(optional)
expresn
(optional)
Usage
Causes Count to consider only the distinct values in column when
counting the rows. For a value of column, the first row found with
the value is used and other rows that have the same value are
ignored.
One or more expressions that you want to evaluate to determine
distinct rows. Expresn can be the name of a column, a function, or
an expression.
If you specify range, Count determines the number of rows in column in range.
If you specify DISTINCT, Count returns the number of the distinct rows
displayed in column, or if you specify expresn, the number of rows displayed
in column where the value of expresn is distinct.
For graphs and OLE objects, you do not select the range when you call the
function. The range has already been determined by the Rows setting on the
Data property page (the Range property), and the aggregation function uses
that range.
Settings for Rows include the following:
•
For the Graph presentation style, Rows is always All.
•
For Graph controls, Rows can be All, Page, or Group.
•
For OLE controls, Rows can be All, Current Row, Page, or Group. The
available choices depend on the layer the control occupies.
Null values in the column are ignored and are not included in the count.
652
InfoMaker
CHAPTER 24 DataWindow Expression and InfoMaker Functions
Not in validation rules or filter expressions
You cannot use this or other aggregate functions in validation rules or filter
expressions.
Using an aggregate function cancels the effect of setting Retrieve Rows As
Needed in the painter. To do the aggregation, a report always retrieves all rows.
Examples
This expression returns the number of rows in the column named emp_id that
are not null:
Count(emp_id)
This expression returns the number of rows in the column named emp_id of
group 1 that are not null:
Count(emp_id for group 1)
This expression returns the number of dept_ids that are distinct:
Count(dept_id for all DISTINCT)
This expression returns the number of regions with distinct products:
Count(region_id for all DISTINCT Lower(product_id))
This expression returns the number of rows in column 3 on the page that are
not null:
Count(#3 for page)
See also
“Example 1: counting null values in a column” on page 630
CrosstabAvg
Description
Calculates the average of the values returned by an expression in the values list
of the crosstab. When the crosstab definition has more than one column,
CrosstabAvg can also calculate averages of the expression’s values for groups
of column values.
For crosstabs only
You can use this function only in a crosstab report.
Users Guide
653
CrosstabAvg
Syntax
CrosstabAvg ( n {, column, groupvalue } )
Argument
n
column
(optional)
groupvalue
(optional)
Description
The number of the crosstab-values expression for which you want
the average of the returned values. The crosstab expression must be
numeric.
The number of the crosstab column as it is listed in the Columns box
of the Crosstab Definition dialog box for which you want
intermediate calculations.
A string whose value controls the grouping for the calculation.
Groupvalue is usually a value from another column in the crosstab.
To specify the current column value in a dynamic crosstab, rather
than a specific value, specify @ plus the column name as a quoted
string.
Return value
Double. Returns the average of the crosstab values returned by expression n for
all the column values or, optionally, for a subset of column values. To return a
decimal datatype, use CrosstabAvgDec.
Usage
This function is meaningful only for the average of the values of the expression
in a row in the crosstab. This means you can use it only in the detail band, not
in a header, trailer, or summary band.
Null values are ignored and are not included in the average.
How functions in a crosstab are used When a crosstab is generated from
your definition, the appropriate computed fields are automatically created
using the Crosstab functions. To understand the functions, consider a crosstab
with two columns (year and quarter), a row (product), and the values
expression Avg(amount for crosstab).
The Crosstab Definition dialog box looks like this.
654
InfoMaker
CHAPTER 24 DataWindow Expression and InfoMaker Functions
When you define the crosstab described above, the painter automatically
creates the appropriate computed fields. A computed field named avg_amount
returns the average of the quarterly figures for each year. Its expression is:
CrosstabAvg(1, 2, "@year")
A second computed field named grand_avg_amount computes the average of
all the amounts in the row. Its expression is:
CrosstabAvg(1)
Other computed fields in the summary band use the Avg function to display the
average of the values in the amount column, the yearly averages, and the final
average.
The crosstab in the Design view looks like this.
Each row in the crosstab (after adjusting the column widths) has cells for the
amounts in the quarters, a repeating cell for the yearly average, and a grand
average. The crosstab also displays averages of the amounts for all the financial
codes in the quarters in the summary band at the bottom.
Users Guide
655
CrosstabAvg
What the function arguments mean When the crosstab definition has more
than one column, you can specify column qualifiers for any of the Crosstab
functions, so that the crosstab displays calculations for groups of column
values. As illustrated previously, when year and quarter are the columns in the
crosstab, the expression for the computed field is:
CrosstabAvg(1, 2, "@year")
The value 2 refers to the quarter column (the second column in the Crosstab
Definition dialog) and “@year” specifies grouping values from the year
column (meaning the function will average values for the quarters within each
year). The value 1 refers to the crosstab-values expression that will be
averaged. In the resulting crosstab, the computed field repeats in each row after
the cells for the quarters within each year.
Tips for defining crosstabs When you define a crosstab with more than one
column, the order of the columns in the Columns box of the Crosstab
Definition dialog box governs the way the columns are grouped. To end up
with the most effective expressions, make the column that contains the
grouping values (for example, year or department) the first column in the
Columns box and the column that contains the values to be grouped (for
example, quarter or employee) second.
To display calculations for groups of rows, define groups as you would for
other report presentation styles and define computed fields in the group header
or footer using noncrosstab aggregation functions, such as Avg, Sum, or Max.
Reviewing the expressions
To review the expressions defined for the crosstab values, open the Crosstab
Definition dialog box (select Design>Crosstab from the menubar).
Examples
The first two examples use the crosstab expressions shown below:
Count(emp_id for crosstab),Sum(salary for crosstab)
This expression for a computed field in the crosstab returns the average of the
employee counts (the first expression):
CrosstabAvg(1)
This expression for a computed field in the crosstab returns the average of the
salary totals (the second expression):
CrosstabAvg(2)
656
InfoMaker
CHAPTER 24 DataWindow Expression and InfoMaker Functions
Consider a crosstab that has two columns (region and city) and the values
expression Avg(sales for crosstab). This expression for a computed field in the
detail band computes the average sales over all the cities in a region:
CrosstabAvg(1, 2, "@region")
This expression for another computed field in the same crosstab computes the
grand average over all the cities:
CrosstabAvg(1)
See also
CrosstabAvgDec
CrosstabCount
CrosstabMax
CrosstabMin
CrosstabSum
CrosstabAvgDec
Description
Calculates the average of the values returned by an expression in the values list
of the crosstab and returns a result with the decimal datatype. When the
crosstab definition has more than one column, CrosstabAvgDec can also
calculate averages of the expression’s values for groups of column values.
For crosstabs only
You can use this function only in a crosstab report.
Syntax
Users Guide
CrosstabAvgDec ( n {, column, groupvalue } )
Argument
n
Description
The number of the crosstab-values expression for which you
want the average of the returned values. The crosstab
expression must be numeric.
column
(optional)
The number of the crosstab column as it is listed in the
Columns box of the Crosstab Definition dialog box for which
you want intermediate calculations.
groupvalue
(optional)
A string whose value controls the grouping for the calculation.
Groupvalue is usually a value from another column in the
crosstab. To specify the current column value in a dynamic
crosstab, rather than a specific value, specify @ plus the
column name as a quoted string.
657
CrosstabCount
Return value
Decimal. Returns the average of the crosstab values returned by expression n
for all the column values or, optionally, for a subset of column values.
Usage
Use this function instead of CrosstabAvg when you want to return a decimal
datatype instead of a double datatype. For more information, see CrosstabAvg.
See also
CrosstabMaxDec
CrosstabMinDec
CrosstabSumDec
CrosstabCount
Description
Counts the number of values returned by an expression in the values list of the
crosstab. When the crosstab definition has more than one column,
CrosstabCount can also count the number of the expression’s values for groups
of column values.
For crosstabs only
You can use this function only in a crosstab report.
Syntax
CrosstabCount ( n {, column, groupvalue } )
Argument
Description
n
The number of the crosstab-values expression for which you want
the total number of returned values.
column
(optional)
The number of the crosstab column as it is listed in the Columns box
of the Crosstab Definition dialog for which you want intermediate
calculations.
groupvalue
(optional)
A string whose value controls the grouping for the calculation.
Groupvalue is usually a value from another column in the crosstab.
To specify the current column value in a dynamic crosstab, rather
than a specific value, specify @ plus the column name as a quoted
string.
Return value
Long. Returns the number of values returned by expression n for all the column
values or, optionally, for a subset of column values.
Usage
This function is meaningful only for the count of the values of the expression
in a row in the crosstab. This means you can use it only in the detail band, not
in a header, trailer, or summary band.
Null values are ignored and are not included in the count.
658
InfoMaker
CHAPTER 24 DataWindow Expression and InfoMaker Functions
For more information about restricting the calculation to groups of values when
the crosstab definition has more than one column, see Usage for CrosstabAvg.
Reviewing the expressions
To review the expressions defined for the crosstab values, open the Crosstab
Definition dialog box (select Design>Crosstab from the menubar).
Examples
These examples all use the crosstab-values expressions shown below:
Count(emp_id for crosstab),Sum(salary for crosstab)
This expression for a computed field in the crosstab returns the count of the
employee counts (the first expression):
CrosstabCount(1)
This expression for a computed field in the crosstab returns the count of the
salary totals (the second expression):
CrosstabCount(2)
The next two examples use a crosstab with two columns (year and quarter), a
row (product), and the values expression Avg(sales for crosstab).
This expression for a computed field returns the count of the sales for each
year:
CrosstabCount(1, 2, "@year")
This expression for a computed field returns the count of all the sales in the
row:
CrosstabCount(1)
For an example illustrating how the painter automatically defines a crosstab by
creating computed fields using the Crosstab functions, see CrosstabAvg.
See also
Users Guide
CrosstabAvg
CrosstabMax
CrosstabMin
CrosstabSum
659
CrosstabMax
CrosstabMax
Description
Calculates the maximum value returned by an expression in the values list of
the crosstab. When the crosstab definition has more than one column,
CrosstabMax can also calculate the maximum of the expression’s values for
groups of column values.
For crosstabs only
You can use this function only in a crosstab report.
Syntax
CrosstabMax ( n {, column, groupvalue } )
Argument
n
column
(optional)
groupvalue
(optional)
Description
The number of the crosstab-values expression for which you want
the maximum returned value. The expression’s datatype must be
numeric.
The number of the crosstab column as it is listed in the Columns box
of the Crosstab Definition dialog box for which you want
intermediate calculations.
A string whose value controls the grouping for the calculation.
Groupvalue is usually a value from another column in the crosstab.
To specify the current column value in a dynamic crosstab, rather
than a specific value, specify @ plus the column name as a quoted
string.
Return value
Double. Returns the maximum value returned by expression n for all the
column values or, optionally, for a subset of column values. To return a decimal
datatype, use CrosstabMaxDec.
Usage
This function is meaningful only for the maximum of the values of the
expression in a row in the crosstab. This means you can use it only in the detail
band, not in a header, trailer, or summary band.
Null values are ignored and are not included in the comparison.
For more information about restricting the calculation to groups of values when
the crosstab definition has more than one column, see Usage for CrosstabAvg.
Reviewing the expressions
To review the expressions defined for the crosstab values, open the Crosstab
Definition dialog box (select Design>Crosstab from the menubar).
660
InfoMaker
CHAPTER 24 DataWindow Expression and InfoMaker Functions
Examples
These examples all use the crosstab-values expressions shown below:
Count(emp_id for crosstab),Sum(salary for crosstab)
This expression for a computed field in the crosstab returns the maximum of
the employee counts (the first expression):
CrosstabMax(1)
This expression for a computed field in the crosstab returns the maximum of
the salary totals (the second expression):
CrosstabMax(2)
The next two examples use a crosstab with two columns (year and quarter), a
row (product), and a values expression Avg(sales for crosstab).
This expression for a computed field returns the largest of the quarterly average
sales for each year:
CrosstabMax(1, 2, "@year")
This expression for a computed field returns the maximum of all the average
sales in the row:
CrosstabMax(1)
For an example illustrating how the painter automatically defines a crosstab by
creating computed fields using the Crosstab functions, see CrosstabAvg.
See also
CrosstabAvg
CrosstabCount
CrosstabMaxDec
CrosstabMin
CrosstabSum
CrosstabMaxDec
Description
Calculates the maximum value returned by an expression in the values list of
the crosstab and returns a result with the decimal datatype. When the crosstab
definition has more than one column, CrosstabMaxDec can also calculate the
maximum of the expression’s values for groups of column values.
For crosstabs only
You can use this function only in a crosstab report.
Users Guide
661
CrosstabMin
Syntax
CrosstabMaxDec ( n {, column, groupvalue } )
Argument
n
column
(optional)
groupvalue
(optional)
Description
The number of the crosstab-values expression for which you want
the maximum returned value. The expression’s datatype must be
numeric.
The number of the crosstab column as it is listed in the Columns box
of the Crosstab Definition dialog box for which you want
intermediate calculations.
A string whose value controls the grouping for the calculation.
Groupvalue is usually a value from another column in the crosstab.
To specify the current column value in a dynamic crosstab, rather
than a specific value, specify @ plus the column name as a quoted
string.
Return value
Decimal. Returns the maximum value returned by expression n for all the
column values or, optionally, for a subset of column values.
Usage
Use this function instead of CrosstabMax when you want to return a decimal
datatype instead of a double datatype. For more information, see CrosstabMax.
See also
CrosstabAvgDec
CrosstabMinDec
CrosstabSumDec
CrosstabMin
Description
Calculates the minimum value returned by an expression in the values list of
the crosstab. When the crosstab definition has more than one column,
CrosstabMin can also calculate the minimum of the expression’s values for
groups of column values.
For crosstabs only
You can use this function only in a crosstab report.
Syntax
662
CrosstabMin ( n {, column, groupvalue } )
Argument
Description
n
The number of the crosstab-values expression for which you want
the minimum return value. The expression’s datatype must be
numeric.
InfoMaker
CHAPTER 24 DataWindow Expression and InfoMaker Functions
Argument
Description
column
(optional)
The number of the crosstab column as it is listed in the Columns box
of the Crosstab Definition dialog box for which you want
intermediate calculations.
A string whose value controls the grouping for the calculation.
Groupvalue is usually a value from another column in the crosstab.
To specify the current column value in a dynamic crosstab, rather
than a specific value, specify @ plus the column name as a quoted
string.
groupvalue
(optional)
Return value
Double. Returns the minimum value returned by expression n for all the
column values or, optionally, for a subset of column values. To return a decimal
datatype, use CrosstabMinDec.
Usage
This function is meaningful only for the minimum of the values of the
expression in a row in the crosstab. This means you can use it only in the detail
band, not in a header, trailer, or summary band.
Null values are ignored and are not included in the comparison.
For more information about restricting the calculation to groups of values when
the crosstab definition has more than one column, see Usage for CrosstabAvg.
Reviewing the expressions
To review the expressions defined for the crosstab values, open the Crosstab
Definition dialog box (select Design>Crosstab from the menubar).
Examples
These examples all use the crosstab-values expressions shown below:
Count(emp_id for crosstab),Sum(salary for crosstab)
This expression for a computed field in the crosstab returns the minimum of the
employee counts (the first expression):
CrosstabMin(1)
This expression for a computed field in the crosstab returns the minimum of the
salary totals (the second expression):
CrosstabMin(2)
The next two examples use a crosstab with two columns (year and quarter), a
row (product), and the values expression Avg(sales for crosstab).
This expression for a computed field returns the smallest of the quarterly
average sales for each year:
CrosstabMin(1, 2, "@year")
Users Guide
663
CrosstabMinDec
This expression for a computed field returns the minimum of all the average
sales in the row:
CrosstabMin(1)
For an example illustrating how the painter automatically defines a crosstab by
creating computed fields using the crosstab functions, see CrosstabAvg.
See also
CrosstabAvg
CrosstabCount
CrosstabMax
CrosstabMinDec
CrosstabSum
CrosstabMinDec
Description
Calculates the minimum value returned by an expression in the values list of
the crosstab and returns a result with the decimal datatype. When the crosstab
definition has more than one column, CrosstabMinDec can also calculate the
minimum of the expression’s values for groups of column values.
For crosstabs only
You can use this function only in a crosstab report.
Syntax
CrosstabMinDec ( n {, column, groupvalue } )
Argument
n
column
(optional)
groupvalue
(optional)
Return value
664
Description
The number of the crosstab-values expression for which you want
the minimum return value. The expression’s datatype must be
numeric.
The number of the crosstab column as it is listed in the Columns box
of the Crosstab Definition dialog box for which you want
intermediate calculations.
A string whose value controls the grouping for the calculation.
Groupvalue is usually a value from another column in the crosstab.
To specify the current column value in a dynamic crosstab, rather
than a specific value, specify @ plus the column name as a quoted
string.
Decimal. Returns the minimum value returned by expression n for all the
column values or, optionally, for a subset of column values.
InfoMaker
CHAPTER 24 DataWindow Expression and InfoMaker Functions
Usage
Use this function instead of CrosstabMin when you want to return a decimal
datatype instead of a double datatype. For more information, see CrosstabMin.
See also
CrosstabAvgDec
CrosstabMaxDec
CrosstabSumDec
CrosstabSum
Description
Calculates the sum of the values returned by an expression in the values list of
the crosstab. When the crosstab definition has more than one column,
CrosstabSum can also calculate the sum of the expression’s values for groups
of column values.
For crosstabs only
You can use this function only in a crosstab report.
Syntax
CrosstabSum ( n {, column, groupvalue } )
Argument
n
column
(optional)
groupvalue
(optional)
Description
The number of the crosstab-values expression for which you want
the sum of the returned values. The expression’s datatype must be
numeric.
The number of the crosstab column as it is listed in the Columns box
of the Crosstab Definition dialog box for which you want
intermediate calculations.
A string whose value controls the grouping for the calculation.
Groupvalue is usually a value from another column in the crosstab.
To specify the current column value in a dynamic crosstab, rather
than a specific value, specify @ plus the column name as a quoted
string.
Return value
Double. Returns the total of the values returned by expression n for all the
column values or, optionally, for a subset of column values. To return a decimal
datatype, use CrosstabSumDec.
Usage
This function is meaningful only for the sum of the values of the expression in
a row in the crosstab. This means you can use it only in the detail band, not in
a header, trailer, or summary band.
Null values are ignored and are not included in the sum.
Users Guide
665
CrosstabSum
For more information about restricting the calculation to groups of values when
the crosstab definition has more than one column, see Usage for CrosstabAvg.
Reviewing the expressions
To review the expressions defined for the crosstab values, open the Crosstab
Definition dialog box (select Design>Crosstab from the menubar).
Examples
These examples all use the crosstab-values expressions shown below:
Count(emp_id for crosstab),Sum(salary for crosstab)
This expression for a computed field in the crosstab returns the sum of the
employee counts (the first expression):
CrosstabSum(1)
This expression for a computed field in the crosstab returns the sum of the
salary totals (the second expression):
CrosstabSum(2)
The next two examples use a crosstab with two columns (year and quarter), a
row (product), and the values expression Avg(sales for crosstab).
This expression for a computed field returns the sum of the quarterly average
sales for each year:
CrosstabSum(1, 2, "@year")
This expression for a computed field returns the sum of all the average sales in
the row:
CrosstabSum(1)
For an example illustrating how the painter automatically defines a crosstab by
creating computed fields using the Crosstab functions, see CrosstabAvg.
See also
666
CrosstabAvg
CrosstabCount
CrosstabMax
CrosstabMin
CrosstabSumDec
InfoMaker
CHAPTER 24 DataWindow Expression and InfoMaker Functions
CrosstabSumDec
Description
Calculates the sum of the values returned by an expression in the values list of
the crosstab and returns a result with the decimal datatype. When the crosstab
definition has more than one column, CrosstabSumDec can also calculate the
sum of the expression’s values for groups of column values.
For crosstabs only
You can use this function only in a crosstab report.
Syntax
CrosstabSumDec ( n {, column, groupvalue } )
Argument
n
column
(optional)
groupvalue
(optional)
Description
The number of the crosstab-values expression for which you want
the sum of the returned values. The expression’s datatype must be
numeric.
The number of the crosstab column as it is listed in the Columns box
of the Crosstab Definition dialog box for which you want
intermediate calculations.
A string whose value controls the grouping for the calculation.
Groupvalue is usually a value from another column in the crosstab.
To specify the current column value in a dynamic crosstab, rather
than a specific value, specify @ plus the column name as a quoted
string.
Return value
Decimal. Returns the total of the values returned by expression n for all the
column values or, optionally, for a subset of column values.
Usage
Use this function instead of CrosstabSum when you want to return a decimal
datatype instead of a double datatype. For more information, see CrosstabSum.
See also
CrosstabAvgDec
CrosstabMaxDec
CrosstabMinDec
Users Guide
667
CumulativePercent
CumulativePercent
Description
Calculates the total value of the rows up to and including the current row in the
specified column as a percentage of the total value of the column (a running
percentage).
Syntax
CumulativePercent ( column { FOR range } )
Argument
column
FOR range
(optional)
Description
The column for which you want the cumulative value of the rows
up to and including the current row as a percentage of the total value
of the column for range. Column can be the column name or the
column number preceded by a pound sign (#). Column can also be
an expression that includes a reference to the column. The datatype
of column must be numeric.
The data that will be included in the cumulative percentage. For
most presentation styles, values for range are:
• ALL – (Default) The cumulative percentage of all rows in
column.
• GROUP n – The cumulative percentage of rows in column in the
specified group. Specify the keyword GROUP followed by the
group number: for example, GROUP 1.
• PAGE – The cumulative percentage of the rows in column on a
page.
For Crosstabs, specify CROSSTAB for range:
• CROSSTAB – (Crosstabs only) The cumulative percentage of
all rows in column in the crosstab.
For Graph and OLE objects, specify one of the following:
• GRAPH – (Graphs only) The cumulative percentage of values in
column in the range specified for the Rows option.
• OBJECT – (OLE objects only) The cumulative percentage of
values in column in the range specified for the Rows option.
Return value
Long. Returns the cumulative percentage value.
Usage
If you specify range, CumulativePercent restarts the accumulation at the start
of the range.
For graphs and OLE objects, you do not select the range when you call the
function. The range has already been determined by the Rows setting on the
Data property page (the Range property), and the aggregation function uses
that range.
668
InfoMaker
CHAPTER 24 DataWindow Expression and InfoMaker Functions
Settings for Rows include the following:
•
For the Graph presentation style, Rows is always All.
•
For Graph controls, Rows can be All, Page, or Group.
•
For OLE controls, Rows can be All, Current Row, Page, or Group. The
available choices depend on the layer the control occupies.
In calculating the percentage, null values are ignored.
Not in validation rules or filter expressions
You cannot use this or other aggregate functions in validation rules or filter
expressions.
Using an aggregate function cancels the effect of setting Retrieve Rows As
Needed in the painter. To do the aggregation, a report always retrieves all rows.
Examples
This expression returns the running percentage for the values that are not null
in the column named salary:
CumulativePercent(salary)
This expression returns the running percentage for the column named salary for
the values in group 1 that are not null:
CumulativePercent(salary for group 1)
This expression entered in the Value box on the Data property page for a graph
returns the running percentage for the salary column for the values in the graph
that are not null:
CumulativePercent(salary for graph)
This expression in a crosstab computed field returns the running percentage for
the salary column for the values in the crosstab that are not null:
CumulativePercent(salary for crosstab)
See also
Users Guide
Percent
CumulativeSum
669
CumulativeSum
CumulativeSum
Description
Calculates the total value of the rows up to and including the current row in the
specified column (a running total).
Syntax
CumulativeSum ( column { FOR range } )
Argument
column
Description
The column for which you want the cumulative total value of the
rows up to and including the current row for group. Column can be
the column name or the column number preceded by a pound sign
(#). Column can also be an expression that includes a reference to
the column. The datatype of column must be numeric.
FOR range
(optional)
The data that will be included in the cumulative sum. For most
presentation styles, values for range are:
• ALL – (Default) The cumulative sum of all values in column.
• GROUP n – The cumulative sum of values in column in the
specified group. Specify the keyword GROUP followed by the
group number: for example, GROUP 1.
• PAGE – The cumulative sum of the values in column on a page.
For Crosstabs, specify CROSSTAB for range:
• CROSSTAB – (Crosstabs only) The cumulative sum of all
values in column in the crosstab.
For Graph and OLE objects, specify one of the following:
• GRAPH – (Graphs only) The cumulative sum of values in
column in the range specified for the Rows option.
• OBJECT – (OLE objects only) The cumulative sum of values in
column in the range specified for the Rows option.
Return value
The appropriate numeric datatype. Returns the cumulative total value of the
rows.
Usage
If you specify range, CumulativeSum restarts the accumulation at the start of
the range.
For graphs and OLE objects, you do not select the range when you call the
function. The range has already been determined by the Rows setting on the
Data property page (the Range property), and the aggregation function uses
that range. Settings for Rows include the following:
670
•
For the Graph or OLE presentation style, Rows is always All.
•
For Graph controls, Rows can be All, Page, or Group.
•
For OLE controls, Rows can be All, Current Row, Page, or Group. The
available choices depend on the layer the control occupies.
InfoMaker
CHAPTER 24 DataWindow Expression and InfoMaker Functions
In calculating the sum, null values are ignored.
Examples
This expression returns the running total for the values that are not null in the
column named salary:
CumulativeSum(salary)
This expression returns the running total for the values that are not null in the
column named salary in group 1:
CumulativeSum(salary for group 1)
This expression entered in the Value box on the Data property page for a graph
returns the running total for the salary column for the values in the graph that
are not null:
CumulativeSum(salary for graph)
This expression in a crosstab computed field returns the running total for the
salary column for the values in the crosstab that are not null:
CumulativeSum(salary for crosstab)
See also
CumulativePercent
CurrentRow
Description
Reports the number of the current row (the row with focus).
Syntax
CurrentRow ( )
Return value
Long. Returns the number of the row if it succeeds and 0 if no row is current.
What row is current
The current row is not always a row displayed on the screen. For example, if
the cursor is on row 7 column 2 and the user uses the scroll bar to scroll to row
50, the current row remains row 7 unless the user clicks row 50.
Examples
This expression in a computed field returns the number of the current row:
CurrentRow()
This expression for a computed control displays an arrow bitmap as an
indicator for the row with focus and displays no bitmap for rows not having
focus. As the user moves from row to row, an arrow marks where the user is:
Bitmap(If(CurrentRow() = GetRow(),"arrow.bmp",""))
Users Guide
671
Date
Alternatively, this expression for the Visible property of an arrow picture
control makes the arrow bitmap visible for the row with focus and invisible for
rows not having focus. As the user moves from row to row, an arrow marks
where the user is:
If(CurrentRow() = GetRow(), 1, 0)
See also
“Example 3: creating a row indicator” on page 636
GetRow
Date
Description
Converts a string whose value is a valid date to a value of datatype date.
Syntax
Date ( string )
Argument
Description
string
A string containing a valid date (such as Jan 1, 2004, or 12-31-99)
that you want returned as a date
Return value
Date. Returns the date in string as a date. If string does not contain a valid date,
Date returns null.
Usage
The value of the string must be a valid date.
Valid dates Valid dates can include any combination of day (1–31), month
(1–12 or the name or abbreviation of a month), and year (two or four digits).
Leading zeros are optional for month and day. If the month is a name or an
abbreviation, it can come before or after the day; if it is a number, it must be in
the month location specified in the Windows control panel. A 4-digit number
is assumed to be a year.
If the year is two digits, the assumption of century follows this rule: for years
between 00 and 49, the first two digits are assumed to be 20; for years between
50 and 99, the first two digits are assumed to be 19. If your data includes dates
before 1950, such as birth dates, always specify a four-digit year to ensure the
correct interpretation.
The function handles years from 1000 to 3000 inclusive.
672
InfoMaker
CHAPTER 24 DataWindow Expression and InfoMaker Functions
An expression has a more limited set of datatypes than the functions that can
be part of the expression. Although the Date function returns a date value, the
whole expression is promoted to a DateTime value. Therefore, if your
expression consists of a single Date function, it will appear that Date returns the
wrong datatype. To display the date without the time, choose an appropriate
display format. (See “Using DataWindow expression and InfoMaker
functions” on page 629.)
Examples
These expressions all return the date datatype for July 4, 2004 when the default
location of the month in Regional Settings is center:
Date("2004/07/04")
Date("2004 July 4")
Date("July 4, 2004")
See also
IsDate
DateTime
Description
Combines a date and a time value into a DateTime value.
Syntax
DateTime ( date {, time } )
Argument
Description
date
A valid date (such as Jan 1, 2005, or 12-31-99) or a blob variable
whose first value is a date that you want included in the value
returned by DateTime.
time
(optional)
A valid time (such as 8am or 10:25:23:456799) or a blob variable
whose first value is a time that you want included in the value
returned by DateTime. If you include a time, only the hour portion
is required. If you omit the minutes, seconds, or microseconds, they
are assumed to be zeros. If you omit am or pm, the hour is
determined according to the 24-hour clock.
Return value
DateTime. Returns a DateTime value based on the values in date and
optionally time. If time is omitted, DateTime uses 00:00:00.000000 (midnight).
Usage
To display microseconds in a time, the display format for the field must include
microseconds.
For information on valid dates, see Date.
Examples
This expression returns the values in the order_date and order_time columns as
a DateTime value that can be used to update the database:
DateTime(Order_Date, Order_Time)
Users Guide
673
Day
Using this expression for a computed field displays 11/11/01 11:11:00:
DateTime(11/11/01, 11:11)
See also
Date
Time
Day
Description
Obtains the day of the month in a date value.
Syntax
Day ( date )
Argument
Description
date
The date for which you want the day
Return value
Integer. Returns an integer (1–31) representing the day of the month in date.
Examples
This expression returns 31:
Day(2005-01-31)
This expression returns the day of the month in the start_date column:
Day(start_date)
See also
Date
IsDate
Month
Year
DayName
Description
Gets the day of the week in a date value and returns the weekday’s name.
Syntax
DayName ( date )
Argument
date
Return value
674
Description
The date for which you want the name of the day
String. Returns a string whose value is the name of the weekday (Sunday,
Monday, and so on) for date.
InfoMaker
CHAPTER 24 DataWindow Expression and InfoMaker Functions
Usage
DayName returns a name in the language of the deployment files available on
the machine where the application is run. If you have installed localized
deployment files in the development environment or on a user’s machine, then
on that machine the name returned by DayName will be in the language of the
localized files.
Examples
This expression for a computed field returns Okay if the day in date_signed is
not Sunday:
If(DayName(date_signed) <> "Sunday", "Okay", "Invalid
Date")
To pass this validation rule, the day in date_signed must not be Sunday:
DayName(date_signed) <> "Sunday"
See also
Date
Day
DayNumber
IsDate
DayNumber
Description
Gets the day of the week of a date value and returns the number of the weekday.
Syntax
DayNumber ( date )
Argument
Description
date
The date from which you want the number of the day of the week
Return value
Integer. Returns an integer (1–7) representing the day of the week of date.
Sunday is day 1, Monday is day 2, and so on.
Examples
This expression for a computed field returns Wrong Day if the date in
start_date is not a Sunday or a Monday:
If(DayNumber(start_date) > 2, "Okay", "Wrong Day")
This expression for a computed field returns Wrong Day if the date in end_date
is not a Saturday or a Sunday:
If(DayNumber(end_date) > 1 and DayNumber(end_date)
< 7, "Okay", "Wrong Day")
This validation rule for the column end_date ensures that the day is not a
Saturday or Sunday:
DayNumber(end_date) >1 and DayNumber(end_date) < 7
Users Guide
675
DaysAfter
See also
Date
Day
DayName
IsDate
DaysAfter
Description
Gets the number of days one date occurs after another.
Syntax
DaysAfter ( date1, date2 )
Argument
Description
date1
date2
A date value that is the start date of the interval being measured
A date value that is the end date of the interval
Return value
Long. Returns a long containing the number of days date2 occurs after date1.
If date2 occurs before date1, DaysAfter returns a negative number.
Examples
This expression returns 4:
DaysAfter(2005-12-20, 2005-12-24)
This expression returns –4:
DaysAfter(2005-12-24, 2005-12-20)
This expression returns 0:
DaysAfter(2005-12-24, 2005-12-24)
This expression returns 5:
DaysAfter(2004-12-29, 2005-01-03)
See also
676
Date
SecondsAfter
InfoMaker
CHAPTER 24 DataWindow Expression and InfoMaker Functions
Dec
Description
Converts the value of a string to a decimal.
Syntax
Dec ( string )
Argument
string
Description
The string you want returned as a decimal
Return value
Decimal. Returns the contents of string as a decimal if it succeeds and 0 if
string is not a number.
Usage
The decimal datatype supports up to 28 digits.
You can also append the letter D in upper or lowercase to identify a number as
a decimal constant in InfoMaker expressions. For example, 2.0d and
123.456789012345678901D are treated as decimals.
Examples
This expression returns the string 24.3 as a decimal datatype:
Dec("24.3")
This expression for a computed field returns “Not a valid score” if the string in
the score column does not contain a number. The expression checks whether
the Dec function returns 0, which means it failed to convert the value:
If ( Dec(score) <> 0, score, "Not a valid score")
This expression returns 0:
// 3ABC is not a number
Dec("3ABC")
This validation rule checks that the value in the column the user entered is
greater than 1999.99:
Dec(GetText()) > 1999.99
This validation rule for the column named score insures that score contains a
string:
Dec(score) <> 0
Users Guide
677
Describe
Describe
Description
Reports the values of properties of a report or form object and the controls
within the object. Each column and graphic control in the report or form has a
set of properties. You specify one or more properties as a string and Describe
returns the values of the properties.
Syntax
Describe ( propertylist )
Argument
propertylist
Return value
Description
A string whose value is a blank-separated list of properties or
Evaluate functions
String. Returns a string that includes a value for each property or Evaluate
function. A new line character (~n) separates the value of each item in
propertylist.
If propertylist contains an invalid item, Describe returns an exclamation point
(!) for that item and ignores the rest of propertylist. Describe returns a question
mark (?) if there is no value for a property.
Usage
Specifying the values for propertylist can be complex. For information and
examples, see the DataWindow Reference in the PowerBuilder documentation
set.
Examples
This expression for a computed field in the header band of a report displays the
report’s SELECT statement:
Describe("DataWindow.Table.Select")
Exp
Description
Raises e to the specified power.
Syntax
Exp ( n )
Argument
Description
n
The power to which you want to raise e (2.71828)
Return value
Double. Returns e raised to the power n.
Examples
This expression returns 7.38905609893065:
Exp(2)
See also
678
Log
LogTen
InfoMaker
CHAPTER 24 DataWindow Expression and InfoMaker Functions
Fact
Description
Gets the factorial of a number.
Syntax
Fact ( n )
Argument
n
Description
The number for which you want the factorial
Return value
Double. Returns the factorial of n.
Examples
This expression returns 24:
Fact(4)
Both these expressions return 1:
Fact(1)
Fact(0)
Fill
Description
Builds a string of the specified length by repeating the specified characters
until the result string is long enough.
Syntax
Fill ( chars, n )
Argument
chars
Description
A string whose value will be repeated to fill the return string
n
A long whose value is the number of characters in the string you
want returned
Return value
String. Returns a string n characters long filled with repetitions of the
characters in the argument chars. If the argument chars has more than n
characters, the first n characters of chars are used to fill the return string. If the
argument chars has fewer than n characters, the characters in chars are
repeated until the return string has n characters.
Usage
Fill is used to create a line or other special effect. For example, asterisks
repeated in a printed report can fill an amount line, or hyphens can simulate a
total line in a screen display.
Examples
This expression returns a string containing 35 asterisks:
Fill("*", 35)
Users Guide
679
FillA
This expression returns the string -+-+-+-:
Fill("-+", 7)
This expression returns 10 tildes (~):
Fill("~", 10)
See also
FillA
Space
FillA
Description
Builds a string of the specified length in bytes by repeating the specified
characters until the result string is long enough.
Syntax
FillA ( chars, n )
Argument
chars
Description
A string whose value will be repeated to fill the return string
n
A long whose value is the number of bytes in the string you want
returned
Return value
String. Returns a string n bytes long filled with repetitions of the characters in
the argument chars. If the argument chars has more than n bytes, the first n
bytes of chars are used to fill the return string. If the argument chars has fewer
than n bytes, the characters in chars are repeated until the return string has n
bytes.
Usage
FillA replaces the functionality that Fill had in DBCS environments in
InfoMaker 9. In SBCS environments, Fill and FillA return the same results.
See also
Fill
680
InfoMaker
CHAPTER 24 DataWindow Expression and InfoMaker Functions
First
Description
Reports the value in the first row in the specified column.
Syntax
First ( column { FOR range { DISTINCT { expresn {, expres2 {, ... } } } } } )
Argument
column
Description
The column for which you want the value of the first row. Column
can be a column name or a column number preceded by a pound
sign (#). Column can also be an expression that includes a reference
to the column.
FOR range
(optional)
The data that will be included when the value in the first row is
found. Values for range depend on the presentation style. See the
Usage section for more information.
DISTINCT
(optional)
Causes First to consider only the distinct values in column when
determining the first value. For a value of column, the first row
found with the value is used and other rows that have the same value
are ignored.
One or more expressions that you want to evaluate to determine
distinct rows. Expresn can be the name of a column, a function, or
an expression.
expresn
(optional)
Return value
The datatype of the column. Returns the value in the first row of column. If you
specify range, First returns the value of the first row in column in range.
Usage
If you specify range, First determines the value of the first row in column in
range. If you specify DISTINCT, First returns the first distinct value in column,
or if you specify expresn, the first distinct value in column where the value of
expresn is distinct.
For most presentation styles, values for range are:
•
ALL – (Default) The value in the first of all rows in column.
•
GROUP n – The value in the first of rows in column in the specified group.
Specify the keyword GROUP followed by the group number: for example,
GROUP 1.
•
PAGE – The value in the first of the rows in column on a page.
For Crosstabs, specify CROSSTAB for range to indicate the first of all rows in
column in the crosstab.
For Graphs specify GRAPH and for OLE objects specify OBJECT for range,
to indicate the value in the first row in column in the range specified for the
Rows option.
Users Guide
681
First
For graphs and OLE objects, you do not select the range when you call the
function. The range has already been determined by the Rows setting on the
Data property page (the Range property), and the aggregation function uses
that range. Settings for Rows include the following:
•
For the Graph or OLE presentation style, Rows is always All.
•
For Graph controls, Rows can be All, Page, or Group.
•
For OLE controls, Rows can be All, Current Row, Page, or Group. The
available choices depend on the layer the control occupies.
Not in validation rules or filter expressions
You cannot use this or other aggregate functions in validation rules or filter
expressions.
Using an aggregate function cancels the effect of setting Retrieve Rows As
Needed in the painter. To do the aggregation, a report always retrieves all rows.
Examples
This expression returns the first value in column 3 on the page:
First(#3 for page)
This expression returns the first distinct value in the column named dept_id in
group 2:
First(dept_id for group 2 DISTINCT)
This expression returns the first value in the column named dept_id in group 2:
First(dept_id for group 2)
See also
682
Last
InfoMaker
CHAPTER 24 DataWindow Expression and InfoMaker Functions
GetRow
Description
Reports the number of a row associated with a band in a report.
Syntax
GetRow ( )
Return value
Long. Returns the number of a row if it succeeds, 0 if no data has been retrieved
or added, and –1 if an error occurs. Where you call GetRow determines what
row it returns, as follows:
Examples
If the control in the report
is in this band
GetRow returns
Header
Group header
First row on the page
First row in the group
Detail
Group trailer
The row in which the expression occurs
Last row in the group
Summary
Footer
Last row in the report
Last row on the page
This expression for a computed field in the detail band displays the number of
each row:
GetRow()
This expression for a computed field in the header band checks to see if there
is data. It returns the number of the first row on the page if there is data, and
otherwise returns No Data:
If(GetRow()= 0, "No Data", String(GetRow()))
See also
Users Guide
“Example 3: creating a row indicator” on page 636
CurrentRow
683
GetText
GetText
Description
Obtains the text that a user has entered in a column.
Syntax
GetText ( )
Return value
String. Returns the text the user has entered in the current column.
Usage
Use GetText in validation rules to compare what the user has entered to
application-defined criteria before it is accepted into the data buffer.
Examples
This validation rule checks that the value the user entered in the column is less
than 100:
Integer(GetText()) < 100
Hour
Description
Obtains the hour in a time value. The hour is based on a 24-hour clock.
Syntax
Hour ( time )
Argument
Description
time
The time value from which you want the hour
Return value
Integer. Returns an integer (00–23) containing the hour portion of time.
Examples
This expression returns the current hour:
Hour(Now())
This expression returns 19:
Hour(19:01:31)
See also
684
Minute
Now
Second
InfoMaker
CHAPTER 24 DataWindow Expression and InfoMaker Functions
If
Description
Evaluates a condition and returns a value based on that condition.
Syntax
If ( boolean, truevalue, falsevalue )
Argument
boolean
Description
A boolean expression that evaluates to true or false.
truevalue
The value you want returned if the boolean expression is true. The
value can be a string or numeric value.
The value you want returned if the boolean expression is false. The
value can be a string or numeric value.
falsevalue
Return value
The datatype of truevalue or falsevalue. Returns truevalue if boolean is true
and falsevalue if it is false. Returns null if an error occurs.
Examples
This expression returns Boss if salary is over $100,000 and Employee if salary
is less than or equal to $100,000:
If(salary > 100000, "Boss", "Employee")
This expression returns Boss if salary is over $100,000, Supervisor if salary is
between $12,000 and $100,000, and Clerk if salary is less than or equal to
$12,000:
If(salary > 100000, "Boss", If(salary > 12000,
"Supervisor", "Clerk"))
In this example of a validation rule, the value the user should enter in the
commission column depends on the price. If price is greater than or equal to
1000, then the commission is between .10 and .20. If price is less than 1000,
then the commission must be between .04 and .09. The validation rule is:
(Number(GetText()) >= If(price >=1000, .10, .04)) AND
(Number(GetText()) <= If(price >= 1000, .20, .09))
The accompanying error message expression might be:
"Price is " + If(price >= 1000, "greater than or
equal to", "less than") + " 1000. Commission must be
between " + If(price >= 1000, ".10", ".04") + " and "
+ If(price >= 1000, ".20.", ".09.")
See also
Users Guide
“Example 1: counting null values in a column” on page 630
“Example 2: counting male and female employees” on page 632
“Example 3: creating a row indicator” on page 636
“Example 4: displaying all data when a column allows nulls” on page 638
Case
685
Int
Int
Description
Gets the largest whole number less than or equal to a number.
Syntax
Int ( n )
Argument
n
Description
The number for which you want the largest whole number that is
less than or equal to it
Return value
The datatype of n. Returns the largest whole number less than or equal to n.
Examples
These expressions return 3.0:
Int(3.2)
Int(3.8)
These expressions return -4.0:
Int(-3.2)
Int(-3.8)
See also
Ceiling
Integer
Round
Truncate
Integer
Description
Converts the value of a string to an integer.
Syntax
Integer ( string )
Argument
string
Description
The string you want returned as an integer
Return value
Integer. Returns the contents of string as an integer if it succeeds and 0 if string
is not a number.
Examples
This expression converts the string 24 to an integer:
Integer("24")
686
InfoMaker
CHAPTER 24 DataWindow Expression and InfoMaker Functions
This expression for a computed field returns “Not a valid age” if age does not
contain a number. The expression checks whether the Integer function returns
0, which means it failed to convert the value:
If (Integer(age) <> 0, age, "Not a valid age")
This expression returns 0:
Integer("3ABC")
// 3ABC is not a number
This validation rule checks that the value in the column the user entered is less
than 100:
Integer(GetText()) < 100
This validation rule for the column named age insures that age contains a
string:
Integer(age) <> 0
See also
IsNumber
IsDate
Description
Tests whether a string value is a valid date.
Syntax
IsDate ( datevalue )
Argument
datevalue
Description
A string whose value you want to test to determine whether it is a
valid date
Return value
Boolean. Returns true if datevalue is a valid date and false if it is not.
Examples
This expression returns true:
IsDate("Jan 1, 99")
This expression returns false:
IsDate("Jan 32, 2005")
This expression for a computed field returns a day number or 0. If the
date_received column contains a valid date, the expression returns the number
of the day in date_received in the computed field, and otherwise returns 0:
If(IsDate(String(date_received)),
DayNumber(date_received), 0)
Users Guide
687
IsExpanded
IsExpanded
Description
Tests whether a node in a TreeView report with the specified TreeView level
and that includes the specified row is expanded.
Syntax
IsExpanded(long row, long level)
Argument
row
Description
The number of the row that belongs to the node
level
The TreeView level of the node
Return value
Returns true if the group is expanded and false otherwise.
Usage
A TreeView report has several TreeView level bands that can be expanded and
collapsed. You can use the IsExpanded function to test whether or not a node in
a TreeView report is expanded.
Examples
This expression returns true if the node that contains row 3 at TreeView level
2 is expanded:
IsExpanded(3,2)
IsNull
Description
Reports whether the value of a column or expression is null.
Syntax
IsNull ( any )
Argument
Description
any
A column or expression that you want to test to determine whether
its value is null
Return value
Boolean. Returns true if any is null and false if it is not.
Usage
Use IsNull to test whether a user-entered value or a value retrieved from the
database is null.
Examples
This expression returns true if either a or b is null:
IsNull(a + b)
This expression returns true if the value in the salary column is null:
IsNull(salary)
This expression returns true if the value the user has entered is null:
IsNull(GetText())
688
InfoMaker
CHAPTER 24 DataWindow Expression and InfoMaker Functions
See also
“Example 1: counting null values in a column” on page 630
“Example 4: displaying all data when a column allows nulls” on page 638
IsNumber
Description
Reports whether the value of a string is a number.
Syntax
IsNumber ( string )
Argument
Description
string
A string whose value you want to test to determine whether it is a
valid number
Return value
Boolean. Returns true if string is a valid number and false if it is not.
Examples
This expression returns true:
IsNumber("32.65")
This expression returns false:
IsNumber("A16")
This expression for a computed field returns “Not a valid age” if age does not
contain a number:
If(IsNumber(age), age, "Not a valid age")
To pass this validation rule, Age_nbr must be a number:
IsNumber(Age_nbr) = true
See also
Integer
IsRowModified
Description
Reports whether the row has been modified.
Syntax
IsRowModified ( )
Return value
Boolean. Returns true if the row has been modified and false if it has not.
Usage
In a report, when you use IsRowModified in bands other than the detail band, it
reports on a row in the detail band. See GetRow for a table specifying which
row is associated with each band for reporting purposes.
Users Guide
689
IsRowNew
Examples
This expression in a computed field in the detail area displays true or false to
indicate whether each row has been modified:
IsRowModified()
This expression defined in the Properties view for the Color property of the
computed field displays the text (true) in red if the user has modified any value
in the row:
If(IsRowModified(), 255, 0)
See also
GetRow
IsRowNew
Description
Reports whether the row has been newly inserted.
Syntax
IsRowNew ( )
Return value
Boolean. Returns true if the row is new and false if it was retrieved from the
database.
Usage
In a report, when you call IsRowNew in bands other than the detail band, it
reports on a row in the detail band. See GetRow for a table specifying which
row is associated with each band for reporting purposes.
Examples
This expression defined in the Properties view for the Protect property of a
column prevents the user from modifying the column unless the row has been
newly inserted:
If(IsRowNew(), 0, 1)
See also
GetRow
IsSelected
Description
Determines whether the row is selected. A selected row is highlighted using
reverse video.
Syntax
IsSelected ( )
Return value
Boolean. Returns true if the row is selected and false if it is not selected.
690
InfoMaker
CHAPTER 24 DataWindow Expression and InfoMaker Functions
Usage
When you use IsSelected in bands other than the detail band, it reports on a row
in the detail band. See GetRow for a table specifying which row is associated
with each band for reporting purposes.
Examples
This expression for a computed field in the detail area displays a bitmap if the
row is selected:
Bitmap(If(IsSelected(), "beach.bmp", ""))
This example allows the report to display a salary total for all the selected rows.
The expression for a computed field in the detail band returns the salary only
when the row is selected so that another computed field in the summary band
can add up all the selected salaries.
The expression for cf_selected_salary (the computed field in the detail band)
is:
If(IsSelected(), salary, 0)
The expression for the computed field in the summary band is:
Sum(cf_selected_salary for all)
See also
GetRow
IsTime
Description
Reports whether the value of a string is a valid time value.
Syntax
IsTime ( timevalue )
Argument
Description
timevalue
A string whose value you want to test to determine whether it is a
valid time
Return value
Boolean. Returns true if timevalue is a valid time and false if it is not.
Examples
This expression returns true:
IsTime("8:00:00 am")
This expression returns false:
IsTime("25:00")
To pass this validation rule, the value in start_time must be a time:
IsTime(start_time)
Users Guide
691
Large
Large
Description
Finds a large value at a specified ranking in a column (for example, thirdlargest, fifth-largest) and returns the value of another column or expression
based on the result.
Syntax
Large ( returnexp, column, ntop { FOR range { DISTINCT { expres1
{, expres2 {, ... } } } } } )
Argument
Description
returnexp
The value you want returned when the large value is found.
Returnexp includes a reference to a column, but not necessarily the
column that is being evaluated for the largest value, so that a value is
returned from the same row that contains the large value.
The column that contains the large value you are searching for.
Column can be a column name or a column number preceded by a
pound sign (#). Column can also be an expression that includes a
reference to the column. The datatype of column must be numeric.
column
ntop
The ranking of the large value in relation to the column’s largest
value. For example, when ntop is 2, Large finds the second-largest
value.
FOR range
(optional)
The data that will be included when the largest value is found. For
most presentation styles, values for range are:
• ALL – (Default) The largest of all values in column.
• GROUP n – The largest of values in column in the specified group.
Specify the keyword GROUP followed by the group number: for
example, GROUP 1.
• PAGE – The largest of the values in column on a page.
For Crosstabs, specify CROSSTAB for range:
• CROSSTAB – (Crosstabs only) The largest of all values in column
in the crosstab.
For Graph and OLE objects, specify one of the following:
• GRAPH – (Graphs only) The largest of values in column in the
range specified for the Rows option.
• OBJECT – (OLE objects only) The largest of values in column in
the range specified for the Rows option.
DISTINCT
(optional)
expresn
(optional)
692
Causes Large to consider only the distinct values in column when
determining the large value. For a value of column, the first row
found with the value is used and other rows that have the same value
are ignored.
One or more expressions that you need to evaluate to determine
distinct rows. Expresn can be the name of a column, a function, or an
expression.
InfoMaker
CHAPTER 24 DataWindow Expression and InfoMaker Functions
Return value
The datatype of returnexp. Returns the ntop-largest value if it succeeds and –1
if an error occurs.
Usage
If you specify range, Large returns the value in returnexp when the value in
column is the ntop-largest value in range. If you specify DISTINCT, Large
returns returnexp when the value in column is the ntop-largest value of the
distinct values in column, or if you specify expresn, the ntop-largest for each
distinct value of expresn.
For graphs and OLE objects, you do not select the range when you call the
function. The range has already been determined by the Rows setting on the
Data property page (the Range property), and the aggregation function uses
that range. Settings for Rows are as follows:
•
For the Graph presentation style, Rows is always All
•
For Graph controls, Rows can be All, Page, or Group
•
For OLE controls, Rows can be All, Current Row, Page, or Group. The
available choices depend on the layer the control occupies
Max might be faster
If you do not need a return value from another column and you want to find the
largest value (ntop = 1), use Max; it is faster.
You cannot use this or other aggregate functions in validation rules or filter
expressions.
Using an aggregate function cancels the effect of setting Retrieve Rows As
Needed in the painter. To do the aggregation, a report always retrieves all rows.
Examples
These expressions return the names of the salespersons with the three largest
sales (sum_sales is the sum of the sales for each salesperson) in group 2, which
might be the salesregion group. Note that sum_sales contains the values being
compared, but Large returns a value in the name column:
Large(name, sum_sales, 1 for group 2)
Large(name, sum_sales, 2 for group 2)
Large(name, sum_sales, 3 for group 2)
This example reports the salesperson with the third-largest sales, considering
only the first entry for each person:
Large(name, sum_sales, 3 for all DISTINCT sum_sales)
See also
Users Guide
Small
693
Last
Last
Description
Gets the value in the last row in the specified column.
Syntax
Last ( column { FOR range { DISTINCT { expres1 {, expres2 {, ... } } } } } )
Argument
column
Description
The column for which you want the value of the last row. Column
can be a column name or a column number preceded by a pound
sign (#). Column can also be an expression that includes a reference
to the column.
FOR range
(optional)
The data that will be included when the value in the last row is
found. For most presentation styles, values for range are:
• ALL – (Default) The value in the last of all rows in column.
• GROUP n – The value in the last row in column in the specified
group. Specify the keyword GROUP followed by the group
number: for example, GROUP 1.
• PAGE – The value in the last row in column on a page.
For Crosstabs, specify CROSSTAB for range:
• CROSSTAB – (Crosstabs only) The value in the last row in
column in the crosstab.
For Graph and OLE objects, specify one of the following:
• GRAPH – (Graphs only) The value in the last row in column in
the range specified for the Rows option.
• OBJECT – (OLE objects only) The value in the last row in
column in the range specified for the Rows option.
DISTINCT
(optional)
expresn
(optional)
Causes Last to consider only the distinct values in column when
determining the last value. For a value of column, the first row
found with the value is used and other rows that have the same value
are ignored.
One or more expressions that you want to evaluate to determine
distinct rows. Expresn can be the name of a column, a function, or
an expression.
Return value
The datatype of the column. Returns the value in the last row of column. If you
specify range, Last returns the value of the last row in column in range.
Usage
If you specify range, Last determines the value of the last row in column in
range. If you specify DISTINCT, Last returns the last distinct value in column,
or if you specify expresn, the last distinct value in column where the value of
expresn is distinct.
694
InfoMaker
CHAPTER 24 DataWindow Expression and InfoMaker Functions
For graphs and OLE objects, you do not select the range when you call the
function. The range has already been determined by the Rows setting on the
Data property page (the Range property), and the aggregation function uses
that range. Settings for Rows include the following:
•
For the Graph presentation style, Rows is always All.
•
For Graph controls, Rows can be All, Page, or Group.
•
For OLE controls, Rows can be All, Current Row, Page, or Group. The
available choices depend on the layer the control occupies.
Not in validation rules or filter expressions
You cannot use this or other aggregate functions in validation rules or filter
expressions.
Using an aggregate function cancels the effect of setting Retrieve Rows As
Needed in the painter. To do the aggregation, a report always retrieves all rows.
Examples
This expression returns the last distinct value in the column named dept_id in
group 2:
Last(dept_id for group 2 DISTINCT)
This expression returns the last value in the column named emp_id in group 2:
Last(emp_id for group 2)
See also
First
LastPos
Description
Finds the last position of a target string in a source string.
Syntax
LastPos ( string1, string2, searchlength )
Users Guide
Argument
Description
string1
string2
The string in which you want to find string2.
The string you want to find in string1.
searchlength
(optional)
A long that limits the search to the leftmost searchlength characters
of the source string string1. The default is the entire string.
695
Left
Return value
Long. Returns a long whose value is the starting position of the last occurrence
of string2 in string1 within the characters specified in searchlength. If string2
is not found in string1 or if searchlength is 0, LastPos returns 0. If any
argument’s value is null, LastPos returns null.
Usage
The LastPos function is case sensitive. The entire target string must be found
in the source string.
Examples
This statement returns 6, because the position of the last occurrence of RU is
position 6:
LastPos("BABE RUTH", "RU")
This statement returns 3:
LastPos("BABE RUTH", "B")
This statement returns 0, because the case does not match:
LastPos("BABE RUTH", "be")
This statement searches the leftmost 4 characters and returns 0, because the
only occurrence of RU is after position 4:
LastPos("BABE RUTH", "RU", 2)
See also
Pos
Left
Description
Obtains a specified number of characters from the beginning of a string.
Syntax
Left ( string, n )
Return value
Argument
string
Description
The string containing the characters you want
n
A long specifying the number of characters you want
String. Returns the leftmost n characters in string if it succeeds and the empty
string (“”) if an error occurs.
If n is greater than or equal to the length of the string, Left returns the entire
string. It does not add spaces to make the return value’s length equal to n.
696
InfoMaker
CHAPTER 24 DataWindow Expression and InfoMaker Functions
Examples
This expression returns BABE:
Left("BABE RUTH", 4)
This expression returns BABE RUTH:
Left("BABE RUTH", 40)
This expression for a computed field returns the first 40 characters of the text
in the column home_address:
Left(home_address, 40)
See also
LeftA
Mid
Pos
Right
LeftA
Description
Obtains a specified number of bytes from the beginning of a string.
Syntax
LeftA ( string, n )
Return value
Argument
string
Description
The string containing the characters you want
n
A long specifying the number of bytes you want
String. Returns the characters in the leftmost n bytes in string if it succeeds and
the empty string (“”) if an error occurs.
If n is greater than or equal to the length of the string, LeftA returns the entire
string. It does not add spaces to make the return value’s length equal to n.
Usage
LeftA replaces the functionality that Left had in DBCS environments in
InfoMaker 9. In SBCS environments, Left and LeftA return the same results.
See also
MidA
PosA
RightA
Users Guide
697
LeftTrim
LeftTrim
Description
Removes spaces from the beginning of a string.
Syntax
LeftTrim ( string )
Argument
string
Description
The string you want returned with leading spaces deleted
Return value
String. Returns a copy of string with leading spaces deleted if it succeeds and
the empty string (“”) if an error occurs.
Examples
This expression returns RUTH:
LeftTrim(" RUTH")
This expression for a computed field deletes any leading blanks from the value
in the column lname and returns the value preceded by the salutation specified
in salut_emp:
salut_emp + " " +
See also
LeftTrim(lname)
RightTrim
Trim
Len
Description
Reports the length of a string in characters.
Syntax
Len ( string )
Argument
Description
string
The string for which you want the length
Return value
Long. Returns a long containing the length of string in characters if it succeeds
and –1 if an error occurs.
Examples
This expression returns 0:
Len("")
This validation rule tests that the value the user entered is fewer than 20
characters:
Len(GetText()) < 20
See also
698
LenA
InfoMaker
CHAPTER 24 DataWindow Expression and InfoMaker Functions
LenA
Description
Reports the length of a string in bytes.
Syntax
LenA ( string )
Argument
string
Description
The string for which you want the length
Return value
Long. Returns a long containing the length of string in bytes if it succeeds and
–1 if an error occurs.
Usage
LenA replaces the functionality that Len had in DBCS environments in
InfoMaker 9. In SBCS environments, Len and LenA return the same results.
See also
Len
Log
Description
Gets the natural logarithm of a number.
Syntax
Log ( n )
Return value
Argument
Description
n
The number for which you want the natural logarithm (base e). The
value of n must be greater than 0.
Double. Returns the natural logarithm of n. An execution error occurs if n is
negative or zero.
Inverse
The inverse of the Log function is the Exp function.
Examples
This expression returns 2.302585092:
Log(10)
This expression returns -.693147 ... :
Log(0.5)
Both these expressions result in an error at runtime:
Log(0)
Log(-2)
Users Guide
699
LogTen
See also
Exp
LogTen
LogTen
Description
Gets the base 10 logarithm of a number.
Syntax
LogTen ( n )
Return value
Argument
Description
n
The number for which you want the base 10 logarithm. The value
of n must not be negative.
Double. Returns the base 10 logarithm.
Obtaining a number
The expression 10^n is the inverse for LogTen(n). To obtain n given number
(nbr = LogTen(n)), use n = 10^nbr.
Examples
This expression returns 1:
LogTen(10)
The following expressions both return 0:
LogTen(1)
LogTen(0)
This expression results in an execution error:
LogTen(–2)
See also
Log
Long
Description
Converts the value of a string to a long.
Syntax
Long ( string )
Argument
string
700
Description
The string you want returned as a long
InfoMaker
CHAPTER 24 DataWindow Expression and InfoMaker Functions
Return value
Long. Returns the contents of string as a long if it succeeds and 0 if string is
not a valid number.
Examples
This expression returns 2167899876 as a long:
Long("2167899876")
LookUpDisplay
Description
Obtains the display value in the code table associated with the data value in the
specified column.
Syntax
LookUpDisplay ( column )
Argument
column
Description
The column for which you want the code table display value
Return value
String. Returns the display value when it succeeds and the empty string (“”) if
an error occurs.
Usage
If a column has a code table, a buffer stores a value from the data column of
the code table, but the user sees a value from the display column. Use
LookUpDisplay to get the value the user sees.
Code tables and data values and graphs
When a column that is displayed in a graph has a code table, the graph displays
the data values of the code table by default. To display the display values, call
this function when you define the graph data.
Examples
This expression returns the display value for the column unit_measure:
LookUpDisplay(unit_measure)
Assume the column product_type has a code table and you want to use it as a
category for a graph. To display the product type descriptions instead of the
data values in the categories, enter this expression in the Category option on
the Data page in the graph’s property sheet:
LookUpDisplay(product_type)
Users Guide
701
Lower
Lower
Description
Converts all the characters in a string to lowercase.
Syntax
Lower ( string )
Argument
string
Description
The string you want to convert to lowercase letters
Return value
String. Returns string with uppercase letters changed to lowercase if it
succeeds and the empty string (“”) if an error occurs.
Examples
This expression returns castle hill:
Lower("Castle Hill")
See also
Upper
Match
Description
Determines whether a string’s value contains a particular pattern of characters.
Syntax
Match ( string, textpattern )
Argument
string
Description
The string in which you want to look for a pattern of characters
textpattern
A string whose value is the text pattern
Return value
Boolean. Returns true if string matches textpattern and false if it does not.
Match also returns false if either argument has not been assigned a value or the
pattern is invalid.
Usage
Match enables you to evaluate whether a string contains a general pattern of
characters. To find out whether a string contains a specific substring, use the
Pos function.
Textpattern is similar to a regular expression. It consists of metacharacters,
which have special meaning, and ordinary characters, which match
themselves. You can specify that the string begin or end with one or more
characters from a set, or that it contain any characters except those in a set.
A text pattern consists of metacharacters, which have special meaning in the
match string, and nonmetacharacters, which match the characters themselves.
702
InfoMaker
CHAPTER 24 DataWindow Expression and InfoMaker Functions
The following tables explain the meaning and use of these metacharacters:
Metacharacter
Meaning
Example
Caret (^)
Matches the beginning of
a string
Matches the end of a
string
Matches any character
^C matches C at the
beginning of a string.
s$ matches s at the end of a
string.
. . . matches three
consecutive characters.
\$ matches $.
Dollar sign ($)
Period (.)
Backslash (\)
Removes the following
metacharacter’s special
characteristics so that it
matches itself
Character class (a group
of characters enclosed in
square brackets [ ])
Matches any of the
enclosed characters
Complemented character
class (first character
inside the square
brackets is a caret)
Matches any character
not in the group
following the caret
[AEIOU] matches A, E, I, O,
or U.
You can use hyphens to
abbreviate ranges of
characters in a character
class. For example, [A-Za-z]
matches any letter.
[^0-9] matches any character
except a digit, and [^A-Za-z]
matches any character
except a letter.
The metacharacters asterisk (*), plus (+), and question mark (?) are unary
operators that are used to specify repetitions in a regular expression:
Users Guide
Metacharacter
* (asterisk)
Meaning
Indicates zero or more
occurrences
+ (plus)
Indicates one or more
occurrences
? (question mark)
Indicates zero or one
occurrence
Example
A* matches zero or more As
(no As, A, AA, AAA, and so
on)
A+ matches one A or more
than one A (A, AAA, and so
on)
A? matches an empty string
(“”) or A
703
Max
Sample patterns The following table shows various text patterns and sample
text that matches each pattern:
This pattern
AB
Matches
Any string that contains AB, such as ABA, DEABC,
graphAB_one.
B*
Any string that contains 0 or more Bs, such as AC, B, BB,
BBB, ABBBC, and so on. Since B* used alone matches any
string, you would not use it alone, but notice its use in some
the following examples.
Any string containing the pattern AC or ABC or ABBC, and
so on (0 or more Bs).
Any string containing the pattern ABC or ABBC or
ABBBC, and so on (1 or more Bs).
Any string containing the pattern ABC or ABBC or
ABBBC, and so on (1 B plus 0 or more Bs).
AB*C
AB+C
ABB*C
Examples
^AB
AB?C
Any string starting with AB.
Any string containing the pattern AC or ABC (0 or 1 B).
^[ABC]
[^ABC]
Any string starting with A, B, or C.
A string containing any characters other than A, B, or C.
^[^abc]
^[^a-z]$
[A-Z]+
A string that begins with any character except a, b, or c.
Any single-character string that is not a lowercase letter (^
and $ indicate the beginning and end of the string).
Any string with one or more uppercase letters.
^[0-9]+$
^[0-9][0-9][0-9]$
Any string consisting only of digits.
Any string consisting of exactly three digits.
^([0-9][0-9][0-9])$
Any string consisting of exactly three digits enclosed in
parentheses.
This validation rule checks that the value the user entered begins with an
uppercase letter. If the value of the expression is false, the data fails validation:
Match(GetText(), "^[A-Z]")
See also
Pos
Max
Description
Gets the maximum value in the specified column.
Syntax
Max ( column { FOR range { DISTINCT { expres1 {, expres2 {, ... } } } } } )
704
InfoMaker
CHAPTER 24 DataWindow Expression and InfoMaker Functions
Argument
Description
column
The column for which you want the maximum value. Column can
be the column name or the column number preceded by a pound
sign (#). Column can also be an expression that includes a reference
to the column. The datatype of column must be numeric.
The data that will be included when the maximum value is found.
For most presentation styles, values for range are:
FOR range
(optional)
• ALL – (Default) The maximum value of all rows in column.
• GROUP n – The maximum value of rows in column in the
specified group. Specify the keyword GROUP followed by the
group number: for example, GROUP 1.
• PAGE – The maximum value of the rows in column on a page.
For Crosstabs, specify CROSSTAB for range:
• CROSSTAB – (Crosstabs only) The maximum value of all rows
in column in the crosstab.
For Graph and OLE objects, specify one of the following:
• GRAPH – (Graphs only) The maximum value in column in the
range specified for the Rows option.
DISTINCT
(optional)
expresn
(optional)
• OBJECT – (OLE objects only) The maximum value in column
in the range specified for the Rows option.
Causes Max to consider only the distinct values in column when
determining the largest value. For a value of column, the first row
found with the value is used and other rows that have the same value
are ignored.
One or more expressions that you want to evaluate to determine
distinct rows. Expresn can be the name of a column, a function, or
an expression.
Return value
The datatype of the column. Returns the maximum value in the rows of
column. If you specify range, Max returns the maximum value in column in
range.
Usage
If you specify range, Max determines the maximum value in column in range.
If you specify DISTINCT, Max returns the maximum distinct value in column,
or if you specify expresn, the maximum distinct value in column where the
value of expresn is distinct.
For graphs and OLE objects, you do not select the range when you call the
function. The range has already been determined by the Rows setting on the
Data property page (the Range property), and the aggregation function uses
that range. Settings for Rows include the following:
•
Users Guide
For the Graph presentation style, Rows is always All.
705
Median
•
For Graph controls, Rows can be All, Page, or Group.
•
For OLE controls, Rows can be All, Current Row, Page, or Group. The
available choices depend on the layer the control occupies.
Null values are ignored and are not considered in determining the maximum.
Not in validation rules or filter expressions
You cannot use this or other aggregate functions in validation rules or filter
expressions.
Using an aggregate function cancels the effect of setting Retrieve Rows As
Needed in the painter. To do the aggregation, a report always retrieves all rows.
Examples
This expression returns the maximum of the values in the age column on the
page:
Max(age for page)
This expression returns the maximum of the values in column 3 on the page:
Max(#3 for page)
This expression returns the maximum of the values in the column named age
in group 1:
Max(age for group 1)
Assuming a report displays the order number, amount, and line items for each
order, this computed field returns the maximum of the order amount for the
distinct order numbers:
Max(order_amt for all DISTINCT order_nbr)
See also
Min
Median
Description
Calculates the median of the values of the column. The median is the middle
value in the set of values, for which there is an equal number of values greater
and smaller than it.
Syntax
Median ( column { FOR range { DISTINCT { expres1 {, expres2 {, ... } } } } } )
706
InfoMaker
CHAPTER 24 DataWindow Expression and InfoMaker Functions
Argument
Description
column
The column for which you want the median of the data values.
Column can be the column name or the column number preceded
by a pound sign (#). Column can also be an expression that includes
a reference to the column. The datatype of column must be numeric.
The data that will be included in the median. For most presentation
styles, values for range are:
FOR range
(optional)
• ALL – (Default) The median of all values in column.
• GROUP n – The median of values in column in the specified
group. Specify the keyword GROUP followed by the group
number: for example, GROUP 1.
• PAGE – The median of the values in column on a page.
For Crosstabs, specify CROSSTAB for range:
• CROSSTAB – (Crosstabs only) The median of all values in
column in the crosstab.
For Graph and OLE objects, specify one of the following:
• GRAPH – (Graphs only) The median of values in column in the
range specified for the Rows.
DISTINCT
(optional)
expresn
(optional)
• OBJECT – (OLE objects only) The median of values in column
in the range specified for the Rows option.
Causes Median to consider only the distinct values in column when
determining the median. For a value of column, the first row found
with the value is used and other rows that have the same value are
ignored.
One or more expressions that you want to evaluate to determine
distinct rows. Expresn can be the name of a column, a function, or
an expression.
Return value
The numeric datatype of the column. Returns the median of the values of the
rows in range if it succeeds and –1 if an error occurs.
Usage
If you specify range, Median returns the median value of column in range. If
you specif