1
Atlas Polymer Evaluation Products
CL400
CHE MIL UME
A
N
A
L
Y
Z
E
USER’S GUIDE FOR
INSTALLATION AND
OPERATION
August 14, 2000
Software Ver. 1.00 (Win 95)
Doc. Part No. 14-2696-00
R
TM
TABLE OF CONTENTS
Click on the Home
H
button on any page to return here.
1.0 WARNINGS AND PRECAUTIONS
1
2.0
2.1
2.2
2.3
2
2
2
3
INSTRUMENT INSTALLATION
Uncrating
Selecting a Location
Facilities Requirements
2.4 System Requirements - User Supplied
2.4.1 Computer Specifications
2.4.2 Water Chiller Specifications
4
4
4
2.5 System Connections
2.5.1 Gas Supply Connections
2.5.2 Water Chiller Connections
2.5.3 Chiller Leak Check
2.5.4 Electrical Connections - Power
2.5.5 Computer Connections
5
5
5
8
8
9
2.6 System Startup
2.6.1 CL400 ChemiLume
2.6.2 Computer and Monitor
2.6.3 Chiller Temperature Adjustment/Tuning
10
10
10
11
3.0 SOFTWARE SETUP
3.1 System Data
3.2 PMT Intensity Standard
3.3 Temperature Calibration Probe
3.4 Advanced Test Settings
3.5 Cell Conditioning Settings
3.6 Appearance Settings
3.7 Communications Settings
3.8 Saving the Configuration File
3.9 Opening a Configuration File
3.10 Autoloading a Configuration File
13
13
14
15
16
17
19
20
20
22
22
4.0
4.1
4.2
4.3
4.4
24
24
25
26
29
SOFTWARE OVERVIEW
Menu Commands
Screen Controls
Window Views
Special Menus
ii
CL400 ChemiLume User's Guide
TABLE OF CONTENTS
5.0 SOFTWARE INSTRUCTIONS
5.1 Adjusting Gas Supplies and Chiller
5.2 PMT Calibration (Note)
30
30
31
5.3 Test Definition
5.3.1 Cell Conditioning Phase
5.3.2 Procedure
5.3.2.1 Test Description
5.3.2.2 Temperature Profile
5.3.2.3 Deviation Alarm
5.3.2.4 Test Phase Duration
5.3.2.5 Gas Types
5.3.2.6 Data Logging
5.3.2.7 Saving and Loading the Test Setup
31
31
31
32
33
34
35
35
35
47
5.4 Performing a Test
5.4.1 Cell Conditioning and PMT Gain Settings
5.4.2 Cell Conditioning Phase
5.4.3 Specimen Preparation and Loading
5.4.4 Test Monitoring
5.4.5 Exporting Data
5.4.6 Test Completion and Stopping a Test
5.4.7 Printing Results and Cell Reloading
38
38
38
39
40
42
43
44
5.5 Analyzing Test Data
5.5.1 Opening a Data File
5.5.2 Oxidation Induction Time (OIT) Analysis
5.5.3 Integral Analysis
5.5.4 Time to Failure Analysis
5.5.5 Activation Energy Analysis
47
48
48
51
53
55
5.6 Archived Files
5.6.1 Viewing the Test Details
5.6.2 Saving an Archived Test Setup
57
58
59
6.0
6.1
6.2
6.3
CALIBRATION PROCEDURES
PMT Intensity Calibration
Cell Temperature Calibration
Gas Flow Verification
60
60
63
67
7.0
7.1
7.2
7.3
MAINTENANCE PROCEDURES
Computer Maintenance
CL400 Maintenance
Water Chiller Maintenance
68
68
68
69
APPENDIX A - PROGRAM ERROR MESSAGES
iii
CL400 ChemiLume User's Guide
72
TABLE OF CONTENTS
List of Figures
1
2
3
4
5
6
7
8
9
10
11
12
Dimensions and Clearance Requirements
CL400 Plumbing Ports
Optional Water Chiller and Service Connections
CL400 ChemiLume Component Descriptions
Chiller Temperature Controller
Computer Ports
Program Icon
Chiller Controller Display
Constant Temperature Test Profile
Ramped Temperature Test Profile
Intensity Standard and Filter Setup
Temperature Calibration Setup
2
5
6
7
8
9
10
12
33
33
61
64
List of Screens
2-1 Communications Menu
11
3-1 System Configuration Menu
3-2 PMT Intensity Standard Configuration Menu
3-3 Temperature Calibration Probe Configuration Menu
3-4 Advanced Test Settings Configuration Menu
3-5 Cell Conditioning Phase Settings
3-6 Appearance Settings Configuration Menu
3-7 Communications Configuration Menu
3-8 System Save As Dialog Box
3-9 System Open File Dialog Box
3-10Program Icon Menu
3-11 Shortcut Editing Menu
13
15
15
16
17
19
20
21
22
22
23
5-1 Cell 1 Setup View
5-2 Temperature Profile Selections
5-3 Deviation Alarm Selection
5-4 Test Phase Duration
5-5 Gas Type Selections
5-6 Data Logging Selections
5-7 Data Logging Options
5-8 Setup Save As Dialog Box
5-9 Calibration Diagnostic Reminder
5-10 Test Data File Save As Dialog Box
5-11 Load Specimens Screen Prompt
5-12 Cell 1 Monitor View
32
33
34
35
35
36
37
37
38
39
39
40
iv
CL400 ChemiLume User's Guide
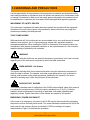
1.0 WARNINGS AND PRECAUTIONS
H
It is the responsibility of the purchaser of this equipment to establish and implement safety
and health procedures or regulations which will protect the operator from unnecessary risks
or hazards. Procedures for safe use of the supply gasses required by this instrument must
be established in compliance with local safety codes and applicable regulatory agencies.
IMPAIRMENT OF SAFETY DEVICES
This instrument is equipped with safety devices to protect the operator and the equipment.
Operation of the unit in any manner not prescribed by these instructions may impair the
protection provided by the safety devices.
TOXIC FUME HAZARD
While each test cell in the instrument can accommodate only a very small amount of sample
material, some polymer, ink or oil specimens may release toxic gas when heated to
elevated temperatures. When locating the CL400 in a laboratory, this should be taken into
consideration with respect to adequate ventilation or the implementation of a fume hood for
repetitive testing of potentially toxic materials.
WARNING
This symbol indicates that there are special instructions or precautions in the user’s manual
regarding use of the instrument component to which the label is attached.
BURN HAZARD - Hot Surface
This symbol indicates that a burn hazard exists when using the instrument component to
which the label is affixed. The operator must take proper precautions, such as protective
clothing, and be aware of the proper procedures (marked by this symbol) in the user’s
manual for avoiding injury when using this part of the instrument.
RADIOACTIVITY HAZARD
The intensity standard used for calibration of the CL400 photomultiplier tubes (light sensors)
is a radioactive emission source. While its output is extremely low (7-9 µCi), it must be
handled, stored and disposed of according to applicable, local safety standards and
regulatory policies. Special instructions in the manual are marked by this symbol.
EMERGENCY POWER DISCONNECT
In the event of an emergency, all power to the CL400 may be disconnected by unplugging
the power cord from the back panel socket. The socket has been located near the top of the
back panel for this purpose. Be sure to situate the CL400 according to the space
requirements in Figure 1 to facilitate this procedure.
1
CL400 ChemiLume User's Guide
2.0 INSTRUMENT INSTALLATION
H
This section describes how to unpack and set up your
system hardware and what facilities are required for
proper operation.
2.1 UNCRATING
The components of the CL400 ChemiLume are usually
shipped in separate crates. Prior to accepting the
shipment, carefully inspect the crates for signs of
mishandling. Should hidden damage be found,
immediately notify the carrier. Notify Atlas regarding the
nature and extent of the damage so that the most
appropriate corrective action can be determined.
Save all packing materials until the instrument is
installed and operating properly.
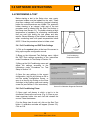
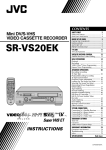
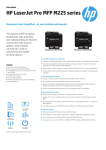
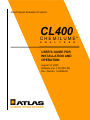
2.2 SELECTING A LOCATION
Place the CL400 on a sturdy lab bench or other suitable
table. Instrument space requirement is shown in Fig. 1.
The location must be
20 cm (8 in)
convenient to electrical
and
gas
supplies.
Locate the computer
beside the CL400 to
facilitate
operator
access. Serial cable
length
should
not
exceed 7.6m (25 feet).
Locate the chiller unit
near the CL400 on or
15 cm (6 in)
beneath the bench. Do
53 cm (21 in)
not locate the CL400 in
Figure 1 - Dimensions and Clearance Requirements
an area where stray
electrical signals
(RFI/EMI) and vibrations might adversely affect computer
operation. If vibration is unavoidable, install damping
material of equal thickness beneath each foot of the table.
30.5 cm (
POWER
TEST OXYGEN NITROGEN
1
TEST OXYGEN NITROGEN
2
CAUTION! The CL400 weighs 39 kgs (85 lbs). The
optional chiller weighs 74 kgs (163 lbs). Each
should always be lifted by two individuals or one
person using a hydraulic lift cart.
2
CL400 ChemiLume User's Guide
TEST OXYGEN NITROGEN
3
TEST OXYGEN NITROGEN
4
51 cm (20 in)
2.0 INSTRUMENT INSTALLATION
H
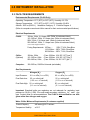
2.3 FACILITIES REQUIREMENTS
Environmental Requirements (CL400 Only)
o
o
o
o
o
o
o
Operating Temperature: 13 C (56 F) to 30 C (86 F); Humidity: 25-75%
Storage Temperature:
o
10 C (50 F) to 60 C (110 F); Humidity: 20-80%
Altitude: 2000 m (6560 ft.)
Installation Category: II Pollution Degree: II
(Refer to computer manual and chiller manual for their environmental specifications.)
Electrical Requirements
CL400:
100Vac, 50Hz, 2.6 Amps max. (Refer to instrument label.)
115-120Vac*, 60Hz, 2.2 Amps max. (Refer to instrument label.)
200V, 50Hz, 1.3A Amps max. (Refer to instrument label.)
220-240Vac*, 50Hz, 1.1 Amps max. (Refer to instrument label.)
*±10% mains supply fluctuations
Fusing Requirements: 100Vac –
250V, T3.0A, Slow-Blow
115-120Vac – 250V, T2.8A, Slow-Blow
200-240Vac – 250V, T1.6A, Slow-Blow
Chiller:
(Optional)
100Vac, 50Hz
115-120Vac, 60Hz
220-240Vac, 50Hz
Computer:
100-220Vac, 50/60Hz Universal (switchable)
(Fuse: 250Vac, 10A, IEC 127 Type T)
(Fuse: 250Vac, 10A, IEC 127 Type T)
(Fuse: 250Vac, 5A, IEC 127 Type T)
Gas Requirements
Nitrogen (N2)
Oxygen (O2)
Input Pressure:
6.9 +2-0 kPa (1+0.3-0 PSI)
6.9 +2-0 kPa (1+0.3-0 PSI)
Flow Rate-Low:
25 +5-0 ml/min/cell
3
(1.53 +0.3-0 in /min/cell)
25 +5-0 ml/min/cell
3
(1.53 +0.3-0 in /min/cell)
Flow Rate-High: 50 +5-0 ml/min/cell
3
(3.1 +0.3-0 in /min/cell)
50 +5-0 ml/min/cell
3
(3.1 +0.3-0 in /min/cell)
Important: Standard bottle gas regulators are not adequate for regulating input
pressure to 6.9 kPa (1 PSI). You must install secondary regulators for each gas
type. Contact Atlas for recommendations. The CL400 is not certified for use with
gases other than nitrogen and oxygen.
Water Chiller Minimum Requirements (if customer supplied)
Thermal Capacity:
480 watts @ 20°C ambient
Temperature Stability:
±0.5°C
3
CL400 ChemiLume User's Guide
2.0 INSTRUMENT INSTALLATION
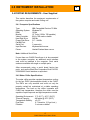
2.4 SYSTEM REQUIREMENTS - User Supplied
This section describes the equipment requirements of
the system computer and water chilling unit.
2.4.1 Computer Specifications
Type:
Operating System:
RAM:
Monitor:
Video Controller:
Hard Disk Drive:
Floppy Disk Drive:
Parallel Port:
Serial Port:
Input Devices:
Printer:
IBM Compatible Pentium 75 MHz
Windows 95
16 Mb
15” Color (1024 x 768 capable)
1024 x 768 mode or better
540 Mb
3.5” 1.44 Mb
1
1 (see note)
Keyboard and mouse
Hewlett Packard laser recom.
Note: Additional Serial Ports
If more than one CL400 ChemiLume is to be connected
to the system computer, an additional serial interface
card must be installed in the computer. Such serial
cards are available with single or multiple ports.
Atlas recommends using a serial board having two
ports, such as the Black Box Corporation Dual Port RS232/422/485 Serial Interface or equivalent.
2.4.2 Water Chiller Specifications
The water chiller provides constant temperature cooling
for the four PMTs (photomultiplier tubes) in the CL400.
The PMTs are very sensitive and must not only be
properly cooled but maintained at a stable operating
temperature. The load on the chiller increases with
CL400 test temperature, therefore the chiller must be
capable of rapid response and tight temperature control.
Operating Environment: 5°C (41°F) - 40°C (104°F)
Thermal Capacity:
480 watts @ 20°C (68°F)
Temperature Stability:
±0.5°C
Flow Rate:
8.7 liters/min. (2.3 gal./min.)
Filtration:
5 microns or better
4
CL400 ChemiLume User's Guide
H
2.0 INSTRUMENT INSTALLATION
H
2.5 SYSTEM CONNECTIONS
Connect gas and water supplies first to eliminate leaks.
2.5.1 Gas Supply Connections
The CL400 requires nitrogen and oxygen for proper
operation. These gases may be supplied from a central
facility source or via bottled supply. In either case,
secondary regulators are required for limiting input
pressure to the CL400 to a maximum of 6.9 kPa (1 PSI).
It is recommended that these be purchased from Atlas.
Make connections from your secondary gas
regulators to the CL400 back panel inlets with rigid
1/8 inch I.D. x 1/4 inch O.D. teflon tubing (see Figs. 2 &
3). If you purchased the regulators and chiller from
Atlas, all tubing is supplied. 6mm adapters are available
from Atlas for gas connections. Limit gas line lengths
to 3m (10 ft.) maximum between the CL400 and
supplies.
After making connections, adjust the gas pressure to
2
9.7 kPa (1.4 PSI or 22 oz/in on some regulators). This
setting is above the 6.9 kPa (1 PSI) maximum input
pressure since the CL400 gas flow is off. During
operation the pressure will drop slightly due to flow.
Readjust the gas regulators to 6.9 kPa (1 PSI) during
operation to achieve the most accurate setting.
Readjustment may also be required if you choose to run
a test in only a single cell, rather than all four.
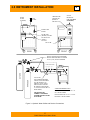
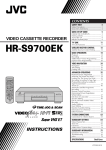
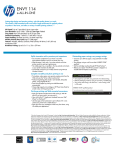
2.5.2 Water Chiller Connections
The chiller supplied by Atlas has 3/8” FNPT threaded
inlet and outlet ports (Fig. 3). Install tubing compression
connectors (similar to those on the back of the CL400).
Use the supplied 3/16 inch I.D. x 1/4 inch O.D. teflon
tubing to connect the chiller ports to the CL400 water
ports (in Europe or Japan, use 6mm adapters). If an
alternate tubing is used, it must be capable of
withstanding 120 PSI at 86°F (828 kPa at 30°C). As
much as possible, avoid unnecessary bends and
minimize tubing lengths to promote cooling efficiency.
Fill the chiller with clean tap water (Fig. 3). DO NOT use
deionized (D.I.) water. It will interact unfavorably with
chiller and internal components and connections.
5
CL400 ChemiLume User's Guide
O2
N2
H2O
IN
IN
O2 / N 2
OUT H2O
OUT
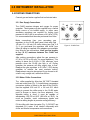
Figure 2 - CL400 Ports
2.0 INSTRUMENT INSTALLATION
WATER
FILTER
(5 MICRON)
H
WATER
RESERVOIR
(FILL ONLY WITH
TAP WATER!)
TEMPERATURE
CONTROLLER
(REFER TO
SECTION 2.6.3)
FUSE
HOLDER
000 0
POWER CORD
SOCKET
*
WATER INLET
(RETURN) 3/8" FNPT
WATER OUTLET
(SUPPLY)
3/8" FNPT
AIR FILTER
REAR
FRONT
INSTALL PRECISION LOW PRESSURE
REGULATORS REQUIRED TO PROVIDE
6.9 kPa (1 PSI) OUTPUT PRESSURE
CL400 ChemiLume
OXYGEN
IN
NITROGEN
IN
NITROGEN
OXYGEN
GAS
OUT
WATER
IN
WATER
OUT
GAS OUTLET
(NO PLUMBING REQUIRED
UNLESS TOXIC SPECIMENS
WILL BE TESTED. IF SO,
REFER TO LOCAL SAFETY
REGULATIONS. PORT MAY
BE VENTED OUTDOORS OR
TO COLLECTION SYSTEM VIA
RIGID TUBING.)
CAUTION! DO NOT
CONNECT TO EXHAUST
SYSTEM THAT MAY ALTER
FLOW RATE!
TUBING RECOMMENDATIONS
FOR WATER LINES: USE 3/16" I.D. x 1/4"
O.D. TEFLON TUBING.
FOR GAS LINES: USE 1/8" I.D. x 1/4" O.D.
RIGID-WALL TEFLON TUBING.
Figure 3 - Optional Water Chiller and Service Connections
6
CL400 ChemiLume User's Guide
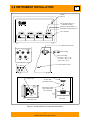
2.0 INSTRUMENT INSTALLATION
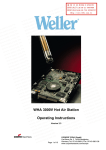
H
POWER
SWITCH
POWER
TEST RUNNING WHEN LIT
(DRAWER LOCKED)
OXYGEN FLOWING WHEN LIT
NITROGEN FLOWING WHEN LIT
TEST
OXYGEN
NITROGEN
TEST
1
OXYGEN
NITROGEN
TEST
3
2
OXYGEN
NITROGEN
TEST
OXYGEN
NITROGEN
4
CELL DRAWER
POWER CORD SOCKET
O2
N2
H2O
IN
FUSE HOLDER
IN
T1.6A 200V/240V
T2.8A 120V
T3.0A 100V
O2 / N 2
OUT H 2 O
OUT
INPUT LINE FUSES
220-240Vac = 250V, T1.5A
115-120Vac = 250V, T2.8A
100Vac= 250V, T3.0A
9-PIN MALE SERIAL PORT
TEST CELL
CELL COVER WITH
GLASS LENS
SPECIMEN (SOLID)
TEMP.
CALIBRATION
PORT
GAS
OUTLETS
SPECIMEN HOLDER
(STAINLESS STEEL
OR ALUMINUM)
GAS
INLETS
SIDE VIEW
OVERHEAD VIEW
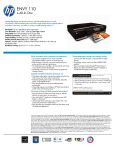
Figure 4 - CL400 ChemiLume Component Descriptions
7
CL400 ChemiLume User's Guide
2.0 INSTRUMENT INSTALLATION
H
2.5 SYSTEM CONNECTIONS (cont.)
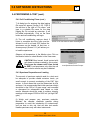
2.5.3 Chiller Leak Check
000 0
1) Grasp the lower portion of the filter housing on the
water chiller (Fig. 3) and unscrew it by turning it counterclockwise. If the filter is not present, place it into the
lower housing. Make sure the large O-ring is present on
the housing. Firmly screw the housing back into place.
2) Fill the chiller with tap water (Fig. 3).
*
SET
LOW
WATER
3) Plug the power cord into the chiller and into an
appropriate AC power outlet.
POWER
4) Start the chiller by setting its power switch to On (I).
The water pump runs continuously.
5) Check the water level in the reservoir and add more
water until the chiller runs continuously.
6) With the chiller operating, examine all
connections for leaks. Tighten or adjust those that
are leaking.
7) Adjust the chiller temperature setpoint as follows:
Press and hold the Set key (at far left marked *) and
∧) or down (∨) arrow key until the setpoint
press the up (∧
is 18°C (65°F). Release the Set key. Shut off the chiller.
Additional instructions for fine tuning this setting are
included in Section 2.6 System Startup.
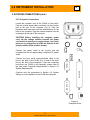
2.5.4 Electrical Connections - Power
Electrical power is supplied to the CL400 and the water
chiller by standard plug-in power cords (Figs. 3 and 4).
Plug the respective cords into the equipment and an
appropriately configured AC power outlet.
• The components of this system include devices for
extra protection from electrical shock. The protective
devices may not function properly unless the power
cords are connected to properly grounded outlets.
• It is the user’s responsibility to ensure that a proper
ground connection is provided.
8
CL400 ChemiLume User's Guide
Figure 5
Chiller Temp. Controller
2.0 INSTRUMENT INSTALLATION
H
2.5 SYSTEM CONNECTIONS (cont.)
2.5.5 Computer Connections
Locate the computer next to the CL400 on the bench.
Plug the monitor signal cable connector into the monitor
port at the rear of the computer (Fig 6). Plug the
keyboard cable connector into the keyboard port on the
back of the computer. Plug the mouse connector into the
mouse port at the rear of the computer.
CAUTION! Before installing the computer power
cord, set the voltage selector beneath the power
cord socket to match your supply voltage. Use a ballpoint pen or pointed tool to slide the selector to the
proper position (230V position shown).
230V
115V
PRINTER
Connect the 9-pin serial communications cable to the
port on the back of the CL400 (Fig. 3) and to the serial
port on the back of the computer. If you are connecting
more than one CL400 to the computer, please refer to
the note under Computer Requirements in Section 2.4
System Requirements.
SERIAL
Connect the power cords to the monitor and the
computer and into an appropriately configured AC power
outlet.
MONITOR
Continue with the procedures in Section 2.6 System
Startup to verify operation of the CL400 and computer.
Figure 6
Computer Ports
9
CL400 ChemiLume User's Guide
2.0 INSTRUMENT INSTALLATION
H
2.6 SYSTEM STARTUP
Initially you must verify that the computer is functioning
properly, that the CL400 powers up and that the chiller
temperature is properly set. Full functionality of the
CL400 cannot be verified until the software program is
operating and initial calibrations are performed.
2.6.1 CL400 ChemiLume
1) Turn on the CL400 power switch (Fig. 4). The power
switch should light up to indicate power is present. If it
doesn’t, check the power cord connection to ensure it is
fully engaged in the socket on the back of the unit and
plugged into an AC power outlet of the correct voltage.
2) If the power switch is still not lit, unplug the CL400
from the power source and check the input fuses on the
back of the unit (Fig. 4). Contact Atlas Service if the
CL400 fails to operate when power is applied.
3) Turn on the chiller.
2.6.2 Computer and Monitor
Important: To conduct the following steps the CL400
software program must be installed. Refer to software
installation instructions (with disks) if the program
is not present on your computer.
1) Turn on the video monitor.
2) Make sure that the computer disk drive is empty.
Remove any disk or shipping protector from the drive.
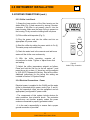
3) Turn on the computer power switch. The Windows 95
operating system will initiate.
4) The Windows 95 initial screen (desktop screen)
includes a CL400 ChemiLume icon (Fig. 7). Move the
mouse cursor onto the icon and double click the left
mouse button to start the CL400 program. If the
program gives an error message about the COM port
connection, make sure you have properly installed the
serial cable between the computer serial port and the
CL400 serial port.
10
CL400 ChemiLume User's Guide
Figure 7
Program
Icon
2.0 INSTRUMENT INSTALLATION
H
2.6 SYSTEM STARTUP (cont.)
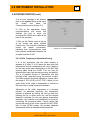
5) If an error message is still present,
click on the system button at the top of
the
screen
and
select
the
Communications menu (Screen 2-1).
6) Click on the appropriate Comm
(communications) port button that
matches the port to which you
connected the CL400 serial cable at the
back of the computer.
7) Click on the Control menu at the top
of the screen and select Initialize
ChemiLume. The controller initialization
screen
will
appear
momentarily,
indicating that communications have
been properly established between the
computer and the CL400.
Screen 2-1 Communications Menu
2.6.3 Chiller Temperature Adjustment/Tuning
It is of key importance that the chiller setpoint is
adjusted to a value 3° to 5° above the dew point (the
temperature at which condensation will occur). Setting it
too low may cause water condensation on the PMT light
sensing tubes inside the CL400. This can have an
adverse effect upon light sensing accuracy and stability.
This is of greatest concern in laboratories with high
humidity levels, especially during the summer months.
The chiller setpoint should be adjusted to a value within
the range of 16°C (60°F) to 21°C (70°F). Adjust it to an
upper value of this range if condensation is noticed on
the water lines or metal connection hardware.
Adjustment of the chiller temperature is a two-step
process. As described previously, the temperature
setpoint is adjusted by holding the Set key and then
pressing the up or down arrow key until the desired
setpoint is indicated. For the most precise temperature
regulation, the controller may additionally be tuned by
conducting the procedure below. Factory testing has
proven that tuning of the chiller controller at 18°C (65°F)
with no load (CL400 heaters off) provides adequate
temperature control at elevated test temperatures.
11
CL400 ChemiLume User's Guide
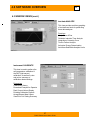
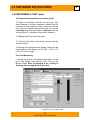
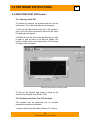
4.0 SOFTWARE OVERVIEW
H
This section describes initial settings that must be
performed in the CL400 ChemiLume software before
tests may be conducted. These include inputting of:
System Description (I.D. & configuration file name)
PMT Intensity Standard specifications
Temperature Calibration Probe specifications
Advanced Test Settings (PMT gain & filter values)
Cell Conditioning Settings (Threshold & duration)
Appearance Settings (color & graphing preferences)
These settings are used by the program for test report
header construction, calibration procedures, operating
tolerances and scaling of readings. Refer to
instructions provided with disks to install or
upgrade the software program.
Menu Tab
click cursor here to select
menu
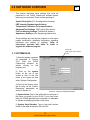
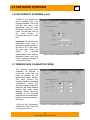
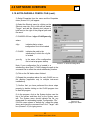
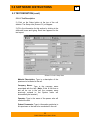
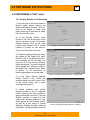
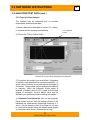
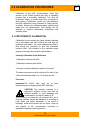
3.1 SYSTEM DATA
1) Start the system computer
as described in Section
2.6.2. Start the CL400
ChemiLume program by
double clicking on the
program icon.
2) Click on the system
button at the top of the
screen or click on the File
menu at the upper left and
select System Configuration.
3) Click on the System menu
tab to bring up the System
Description parameters as
shown in Screen 3-1.
Screen 3-1 System Configuration Menu
4) System Name: Click in the white edit box and type in
the name you prefer for the CL400. If you have more
than one CL400 attached to the computer it is advisable
to include an identifying number in the name.
5) System Serial Number: Type in the serial number
found on the label at the back of the CL400.
13
CL400 ChemiLume User's Guide
4.0 SOFTWARE OVERVIEW
3.1 SYSTEM DATA (cont.)
6) Company Name: Type in the name of your company.
This name appears on the test report.
7) Configuration File: Indicates the currently loaded
configuration (.cfg) file that defines the software setup.
Note: If the configuration file name “default.cfg” is used,
this file will be loaded automatically at program startup.
If you wish to create different configuration files to be
used with different CL400 units, return to this screen
(System) after you have performed the setup in Sections
3.2 through 3.6. Be aware that this file will contain the
specifications for your calibration standards and PMT
gain settings, etc. Thus, you must be careful that these
are properly configured for each new configuration file
created. At program startup you may load a uniquely
named configuration file by accessing this screen and
clicking on the Open button. These procedures are
discussed in detail in Section 3.7.
8) Do not click the OK button in these procedures until
you are advised to do so.
Important: When you finally exit from the system
configuration menus (by clicking on the OK button), all
settings will be automatically saved in the file designated
in Step 7 above. Or you may save the configuration
under a new file name (see Section 3.7).
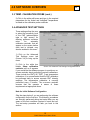
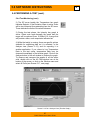
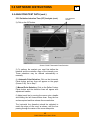
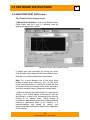
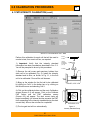
3.2 PMT INTENSITY STANDARD
An optional kit is available for use with the CL400 that
contains a liquid intensity standard. The standard is a
radioactive, low-emission source. It is used to calibrate
the PMT (photomultiplier tube) or light sensor monitoring
each test cell. The intensity standard comes with a
specification sheet that characterizes its emission
(output) and the date these measurements were
performed. This is critical information that must be
recorded in the software configuration to allow accurate
PMT calibration.
1) Click on the PMT Intensity Standard menu tab to
bring up the Standard Values listing (Screen 3-2).
14
CL400 ChemiLume User's Guide
H
4.0 SOFTWARE OVERVIEW
H
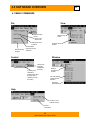
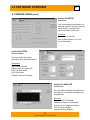
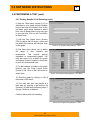
3.2 PMT INTENSITY STANDARD (cont.)
2) Refer to the specification
sheet provided with your
intensity standard. Click in an
edit box and type in the
appropriate value for each
parameter specified in the
menu. You may also click on
the
arrow
buttons
to
increment the value in an edit
box.
Important: Do not leave any
parameters blank, each is
required for proper operation.
Be sure to fill in the month,
day and year. These are
critical
for
accurate
determination of the intensity
standard’s output over time
since it declines (decays) at
a very specific rate.
Screen 3-2 PMT Intensity Standard Configuration Menu
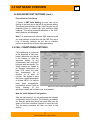
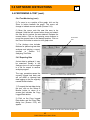
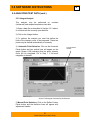
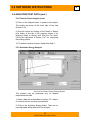
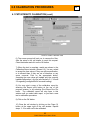
3.3 TEMPERATURE CALIBRATION PROBE
The optional temperature
calibration kit includes a
probe and meter that are
used to calibrate the cell
temperature control system.
This menu (Screen 3-3)
includes Actual and Indicated
Temperature values that
allow the software program to
determine the offset between
system and meter probe
readings. These values are
included on the certificate
supplied with the temperature
probe and must be entered in
this menu.
1) Click on the Temperature
Calibration Probe menu tab
to bring up the menu.
Screen 3-3 Temperature Calibration Probe Configuration Menu
15
CL400 ChemiLume User's Guide
4.0 SOFTWARE OVERVIEW
H
3.3 TEMP. CALIBRATION PROBE (cont.)
2) Click in the white edit boxes and type in the required
parameters for the Actual and Indicated Temperatures
as listed on the calibration probe certificate.
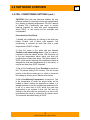
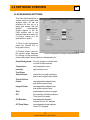
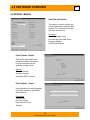
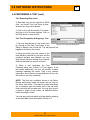
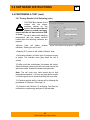
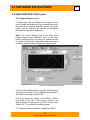
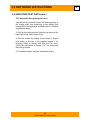
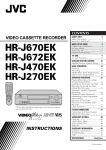
3.4 ADVANCED TEST SETTINGS
These settings allow the user
to select the sensitivity level
of the PMT (photomultiplier
tube or light sensor) for
differing specimen emission
rates.
An
automatic
calibration reminder, that will
appear on the screen before
each test is initiated, may
also be enabled in this menu
1) Click on the Advanced
Test Settings menu tab
(Screen 3-4) to bring up the
menu.
2) Click in the white box
beside Show calibration
Screen 3-4 Advanced Test Settings Configuration Menu
reminder until an X appears
if you would like the software program to provide an onscreen reminder about performing required calibrations.
These include the PMT{ XE "PMT" } and temperature
calibrations. It is recommended that the PMT calibration
be performed daily to ensure accurate PMT intensity
readings. The temperature calibration is normally
performed every 6 months. The on-screen reminder
ensures that the operator is aware of these
requirements at appropriate times.
Note for Initial Software Configuration
Skip the steps below if you are performing the software
configuration for the first time. The following procedures
are normally performed during test setup after you are
aware of the test conditions required in each test cell.
The test setup procedure will refer you back to this
section.
16
CL400 ChemiLume User's Guide
4.0 SOFTWARE OVERVIEW
H
3.4 ADVANCED TEST SETTINGS (cont.)
Procedures for Test Setup
1) Select a PMT Gain Setting for each test cell by
clicking in the white dot to the left of the desired setting.
The normal gain selection is High. Use Low gain only for
materials known to exhibit high light emissions while
oxidizing. This setting prevents saturation of the PMT,
which results is test stoppage.
Note: For specimens with unknown light emission levels
you must perform an initial test with the PMT Gain set to
Low. If Intensity readings are too low or unstable,
perform a second test using the High gain setting.
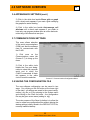
3.5 CELL CONDITIONING SETTINGS
Cell conditioning is performed
at the beginning of each test,
before specimens are placed
in the holders, to clean the
specimen holders of any
contaminants that could emit
light and alter test results. The
empty holders are heated at
an elevated temperature (at
least 50°C above the peak
test temperature) for a
duration of at least 60
minutes. This applies to tests
that have a peak temperature
of at least 200°C. For tests at
lower peak temperatures,
non-residual solvent (such as
Screen 3-5 Cell Conditioning Phase Settings
freon)
cleaning
of
the
specimen holders and cell lens cover is acceptable.
Note for Initial Software Configuration
Skip the steps below if you are performing the software
configuration for the first time. The following procedures
are normally performed during test setup after you are
aware of the test conditions required in each test cell.
The test setup procedure will refer you back to this
section.
17
CL400 ChemiLume User's Guide
4.0 SOFTWARE OVERVIEW
3.5 CELL CONDITIONING SETTINGS (cont.)
CAUTION: Even with new specimen holders, the only
effective method for removing microscopic contaminants
is by heating to elevated temperature. DO NOT attempt
to disable Cell Conditioning and resort to solvent
cleaning methods for tests with peak temperatures
above 200°C, or test results will be unreliable and
unrepeatable.
Procedures for Test Setup
1) Enable cell conditioning by clicking in the white box
beside “Enable” until a check mark appears. Cell
conditioning is required for tests that have a peak
temperature of 200°C or higher.
2) Click the cursor in the white edit box beneath
Condition cell when testing above. Type in a value or
increment it with the indexer arrows. This should be set
to the test temperature above which you wish cell
conditioning to always take place. The factory default is
200°C (since solvent cleaning of the specimen holders is
adequate for peak test temperatures up to this value). It
may be set lower than 200°C if desired.
3) Set a Cell Conditioning Phase Duration for each test
cell. The normal setting is 60 minutes. Click the mouse
pointer in the edit box and type in a value or increment
the reading by clicking on an indexer arrow button.
4) Set a Conditioning Temperature for each cell. This
is the temperature to which the empty holder will be
heated to clean it before the specimen is loaded. It is
standard practice to set the conditioning temperature for
a cell to a value that is 50°C above the peak test
temperature to be reached in that cell. Set each by
clicking in the white edit box and typing in a value or by
incrementing the value by clicking on an indexer arrow.
The maximum allowable setting is 300°C.
18
CL400 ChemiLume User's Guide
H
4.0 SOFTWARE OVERVIEW
H
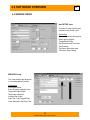
3.6 APPEARANCE SETTINGS
This menu allows selection of
screen colors for graphs and
analysis data, as well as
selections for the use of a
graph grid overlay and cell
window
arrangement.
Graphs appear in the All
Cells window and in the
Analyze window for each cell
if a test is running (or if an
archived file is open).
1) Click on the Appearance
menu tab (Screen 3-6) to
bring up the menu.
2) Choose screen colors for
the various graph elements
Screen 3-6 Appearance Settings Configuration Menu
by clicking on the pull-down
menu button (down arrow) and then the desired color.
Graph Background: fill color of graph, normally black
or white for best contrast
Temperature:
cell temperature curve
Intensity:
light intensity curve
Test Phase
Start Indicator:
Time to Failure
Points:
vertical line on graph indicating
start of test (oxygen flow) phase
user-adjustable endpoint lines
that define analysis limits
Integral Points:
user-adjustable endpoint lines
that define analysis limits
Grid:
graduated grid overlay on graph
OIT:
line indicating Oxidation Induction
Time (result) on graph
OIT Baseline:
user-adjustable baseline
indicator line for OIT analysis
OIT Peak Slope:
user-adjustable slope indicator
line for OIT analysis
19
CL400 ChemiLume User's Guide
4.0 SOFTWARE OVERVIEW
H
3.6 APPEARANCE SETTINGS (cont.)
3) Click in the white box beside Show grid on graph
until a check mark appears if you want a grid overlaying
the graphs for easier reading.
4) Click in the white box beside Auto-arrange cell
windows until a check mark appears if you prefer to
have only one program window open at a time and autominimizing of all others that are open.
3.7 COMMUNICATIONS SETTINGS
This menu allows selection
of the serial communications
(COM) port that the software
uses to communicate with
the CL400.
1) Click once on the
Communications menu tab
(Screen 3-7) to bring up the
menu.
2) Click in the white circle
beside the Com port designation to select the computer
serial port to which the
CL400 is connected. A black
dot appears in the white
circle to mark the selection.
Screen 3-7 Communications Configuration Menu
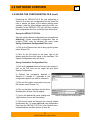
3.8 SAVING THE CONFIGURATION FILE
The new software configuration can be saved in two
ways: 1) by clicking on the OK button at the lower right
of the menu - all settings are saved in the current configuration (.cfg) file; or 2) by returning to the System menu
and clicking on the Save As button - the configuration
file may be given a new name (ending in .cfg).
The main purpose of the Save As button is to allow the
user to create new configuration files without altering the
startup settings initially saved in the DEFAULT.CFG file,
normally loaded at startup.
20
CL400 ChemiLume User's Guide
4.0 SOFTWARE OVERVIEW
H
3.8 SAVING THE CONFIGURATION FILE (cont.)
Preserving the DEFAULT.CFG file and performing a
Save As to create new configuration files will allow the
user to always be aware of the startup settings when
creating a new file. Atlas advises saving the initial configuration to the DEFAULT.CFG file, and then creating
user configuration files from it with the Save As function.
Saving the DEFAULT.CFG File
Save the initial software configuration just completed as
default.cfg. Create customized configuration files for
multiple CL400 units by following the steps under
Saving Customized Configuration Files below.
1) Click on the System menu tab to bring up the System
menu (Screen 3-1).
2) Click on the OK button at the lower right of the
window and the file will be saved to the hard disk. The
System Configuration menu will close.
Saving Customized Configuration Files
1) Click on the system button at the top of the screen or
click on the File menu at the upper left and select
System Configuration.
2) Perform the procedures detailed in
Sections 3.1 through 3.7 applicable to the
configuration options you wish to customize.
3) Click on the System menu tab to bring up
the System menu (Screen 3-1).
4) Click on the Save As button and the Save
As dialog box (Screen 3-8) will appear.
5) Type in the desired file name (ending with
.cfg) and then click on the Save button.
Screen 3-8 System Save As Dialog Box
6) The file just saved will become the currently loaded
configuration file. To create additional new configuration
files, open the DEFAULT.CFG file in the System menu,
make alterations and then perform a Save As.
21
CL400 ChemiLume User's Guide
4.0 SOFTWARE OVERVIEW
H
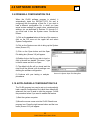
3.9 OPENING A CONFIGURATION FILE
When the CL400 software program is started, it
automatically loads the DEFAULT.CFG file and is
configured with the settings of that file. If you wish to
load a different configuration file, in which you have
saved custom settings for graph colors, advanced test
settings, etc. as described in Sections 3.1 through 3.6,
you must load it from the System menu. Proceed as
follows:
1) Click on the system button at the top of the screen or
click on the File menu at the upper left and select
System Configuration.
2) Click on the System menu tab to bring up the System
menu (Screen 3-1).
3) Click on the Open button and the Open
File dialog box (Screen 3-9) will appear.
4) Double click on the file you wish to load, or
click in the edit box beside “File name:”, type
in the file name and click on Open.
5) The default.cfg file will be closed and the
new file will be opened, with its settings now
defining the software configuration.
6) Continue with your testing or analysis
procedures.
Screen 3-9 System Open File Dialog Box
3.10 AUTOLOADING A CONFIGURATION FILE
The CL400 program icon can be set up to automatically
load a specific configuration file (rather than default.cfg)
whenever the icon is used to start the program. Follow
the procedure below if you want to enable this feature.
1) Start the system computer.
2) Move the mouse cursor onto the CL400 ChemiLume
program icon. Press the right mouse button and the icon
menu (Screen 3-10) will appear.
22
CL400 ChemiLume User's Guide
4.0 SOFTWARE OVERVIEW
H
3.10 AUTOLOADING A CONFIG. FILE (cont.)
3) Select Properties from the menu and the Properties
menu (Screen 3-11) will appear.
4) Select the Shortcut menu by clicking on the
Shortcut menu tab. Click in the edit box beside
“Target:” and add the following text (shown in
bold face) to the right of the program path and
file name:
C:\CL400\CL400.exe /cfg=c:\CL400\your.cfg
where:
/cfg=
indicates that a unique
configuration file is to be loaded
C:\CL400\
indicates the path to the
subdirectory in which the .cfg file
is located
your.cfg
is the name of the configuration
file to load at program startup
Screen 3-11 Shortcut Editing Menu
Note: If your configuration file is located in a
subdirectory other than C:\CL400,change the path in the
command line to reflect the actual subdirectory location.
5) Click on the OK button when finished.
6) Repeat the procedure above for each CL400 icon on
the desktop (applicable only to multiple instrument
installations).
7) Confirm that you have performed the above steps
properly by double clicking on the CL400 program icon
to start the program.
8) In the program, click on the System button near the
top of the screen and then click on the System menu
tab. The System menu should indicate the file you
designated for autoloading beside “Configuration File:”.
If the file name shown is “default.cfg”, repeat the steps
above and check the command line in the “Target:” edit
box (Screen 3-10) for typing errors.
23
CL400 ChemiLume User's Guide
Screen 3-10
Program Icon Menu
4.0 SOFTWARE OVERVIEW
H
4.1 MENU COMMANDS
File
View
Software setup
menus
Open a test
archive file
Window view
select
Graph print menu
& options
Exit (terminate)
program
Program screen
options
Test/Analysis
report print menu
& options
Control
Window
ChemiLume
controller
initialization
(manual)
O2 and N2 flow
verification
(perform each time
a supply tank is
replaced or every
3 months)
Window
arrangement
options
Test cell status &
current window
selection
Lists open
archived files
Help
CL400 I.D. and
software version
On-line
instructions
24
CL400 ChemiLume User's Guide
4.0 SOFTWARE OVERVIEW
H
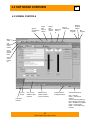
4.2 SCREEN CONTROLS
System
configuration
menus
Graph
print
menu &
options
Report
print
menu &
options
Open test
archive
fil
On-line
instructions
Restore
program
window
Minimize
program
Exit
program
Menu
select
Cell
window
select
buttons
Close
window
(double
click)
View
select
buttons
(4)
Current
window
One or more
additional open
windows
Minimized cell
window (double
click to maximize)
Communications
(COM) port status
Instrument
Indicator
25
CL400 ChemiLume User's Guide
Cell status indicators
Gray = cell idle
Green = normal (test
running)
Yellow = warning (latching)
Red = fatal error (test stop)
Blue = calibration in progress
Purple = cooling down
White = cell conditioning in
progress
4.0 SOFTWARE OVERVIEW
H
4.3 WINDOW VIEWS
test SETUP view
This view is used to define test
conditions and initiate a test.
Parameters
Test and Specimen Description
Data Logging Options
Temperature Profile
Gas Selection and Flow Rate
Test Duration
Test Setup Save and Load
Test Start, Stop & Setup
MONITOR view
This view displays test progress
in text and graphical formats.
Parameters
Instrument Status
Event Progress (elapsed time)
Temperature Bar Graph
Temperature Setpoint
Intensity Bar Graph
Stop Test, Copy Logged Data,
Clear Warnings, Start New Test
26
CL400 ChemiLume User's Guide
4.0 SOFTWARE OVERVIEW
H
4.3 WINDOW VIEWS (cont.)
test data ANALYZE
This view provides real-time graphing
of test data and tools for performing
three data analyses.
Functions
Graph Zoom & Pan
Oxidation Induction Time Analysis
Integration of Intensity Curve
Time to Failure Analysis
Activation Energy Determination
Auto/User-Selectable Analysis Limits
instrument CALIBRATE
This view is used to perform the
cell temperature calibration &
the PMT (light sensor)
calibration, as well as to view
and print a summary of
calibration related settings.
Parameters
Calibrations History
Procedural Prompts for Operator
Dark Current Values Display
Printable Calibration Reports
Accept/Discard New Values
View/Print Cal. Setting Summary
27
CL400 ChemiLume User's Guide
4.0 SOFTWARE OVERVIEW
H
4.3 WINDOW VIEWS (cont.)
archive file SETUP
View Setup
This view shows the test setup of an
archived data file. The setup may be
saved under a new name, but
cannot be edited in this view.
Functions
Test Setup of Data File
View or Save Setup (to new name)
View Test Details
archive file SETUP
View Test Details
This view shows the historic
information of an archived data file.
Parameters
Data Points Collected
Elapsed Time of Logging File
Date Test Performed
Final Test Status
Original Post-test Comments
archive file ANALYZE
Timeline View
This view allows archived test data files to
be analyzed. Four different analyses may
be performed.
Functions
Timeline View of Test Data
Oxidation Induction Time Analysis
Intensity Curve Integration Analysis
Time to Failure Analysis
Activation Energy Analysis
28
CL400 ChemiLume User's Guide
4.0 SOFTWARE OVERVIEW
H
4.4 SPECIAL MENUS
Gas Flow Verification
This screen is used to confirm gas
flow and gas sensor operation (see
Section 6.3). It checks the four gas
flow rates for each cell.
Functions
O2 and N2 Supply Check
Low and High Flow Rate Check
Progress Indicator
Pass/Fail Notification
Print Options - Report
Choices for report types to be
printed are made in this screen.
Font face and size may be
specified in Page Layout.
Reports
Test (test results)
Analysis (4 types)
Calibration (PMT or temp.)
Print Options - Graph
User preferences for printing graphs
of analysis results are specified in
these screens.
Parameters
Titles & Axes
Pen (line) Colors
Page Layout & Fonts
Analysis
29
CL400 ChemiLume User's Guide
5.0 SOFTWARE INSTRUCTIONS
5.2 PMT CALIBRATION
Perform the PMT calibration (Section 6.1) at the
beginning of each testing day. Print the summary of
results each day and compare them to determine
calibration stability. If conditions in your laboratory are
very stable, the PMT calibration interval may be
lengthened to twice, or even once per week.
5.3 TEST DEFINITION
To run a test in the CL400, you must first specify the
temperature profile, data logging interval, gas type and
I.D. information for the test report. The Setup view of
each cell window is used for this purpose. The
independent Setup views allow you to perform up to four
different tests at the same time, or the same test on four
different specimens. As well, you may conduct identical
tests with identical specimens in each cell for rapid
determination of a material’s average performance. You
may setup and initiate a test in one or more cells while
tests are still running in other cells.
5.3.1 Cell Conditioning Phase
Tests having a peak temperature of 200°C or above
include a cell conditioning phase during which a new,
empty specimen holder in each cell is typically heated to
the peak test temperature plus 50°C (see Section 3.5 for
instructions on setting the cell conditioning temperature).
This high temperature exposure will eliminate any
contaminants that could emit light during the test and
alter results. After this, the specimens are carefully
loaded and the test initiated.
Note: For tests with peak temperatures below 200°C,
cell conditioning may be disabled and the specimen
holders solvent cleaned with a non-residual solvent
(such as freon). Refer to Section 3.5.
5.3.2 Procedure
1) In the software program, bring up the window for a
cell in which you will conduct a test by clicking on the
cell button bar or by clicking on the Window menu and
selecting a cell.
31
CL400 ChemiLume User's Guide
H
5.0 SOFTWARE INSTRUCTIONS
5.3 TEST DEFINITION (cont.)
5.3.2.1 Test Description
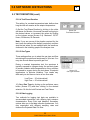
2) Click on the Setup button at the top of the cell
window. The Setup view (Screen 5-1) will appear.
3) Fill in the information for this section by clicking in the
white edit boxes and typing. Each item appears on the
test report.
Screen 5-1 Cell 1 Setup View
Material Description: Type in a description of the
specimen to be tested in the cell.
Company Name: Type in the company name
associated with the test. (Note: If this is first time a
test will be run in the cell, the company name
previously entered in the System menu will
automatically be inserted.)
Operator: Type in the name of the person who will
conduct the test.
Pretest Comments: Type in information particular to
this specimen or the test to be conducted in the cell.
32
CL400 ChemiLume User's Guide
H
5.0 SOFTWARE INSTRUCTIONS
H
5.3 TEST DEFINITION (cont.)
Pre-test
Phase
5.3.2.2 Temperature Profile
Setpoint
Temperature
Select your test Temperature Profile and Test Phase
Duration according to the instructions below. These
must be specified first to allow the data logging feature
to provide file size estimates.
Test Phase
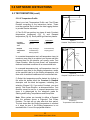
4) The CL400 can perform two types of tests: Constant
temperature (isothermal) (Fig. 9) and Ramped
temperature (Fig 10). Each profile type has two phases:
Ramped
Temperature
Test
Pre-test Phase
Temp. is rising to
setpoint.
Test Phase
Dwell at setpoint
temperature
Temp. is rising to
controlled ramp
starting setpoint
Controlled temp.
ramping period
Test Phase
n
Co
tro
l
R
led
am
p
Ending
Temp.
Starting
Temp.
ol
Do
wn
In a ramped temperature test, cell temperature rises (at
maximum ramp rate) to the Starting temperature, ramps
at the specified rate up to the Ending temperature, and
then cools to ambient conditions at an uncontrolled rate.
Pre-test
Phase
Co
In a constant temperature test, cell temperature rises (at
maximum ramp rate) to a setpoint you choose and then
remains there for the duration you specify under Test
Phase Duration. After the test phase, cell temperature
declines to ambient conditions at an uncontrolled rate.
Figure 9
Constant Temperature Test Profile
Temperature
Constant
Temperature
Test
Time
Time
Figure 10
Ramped Temperature Test Profile
5) Select the temperature profile desired by clicking in
the white dot beside either the Constant or Ramped
descriptor until the black dot appears, indicating your
selection (Screen 5-2). If you select Constant, you must
specify Test Phase Duration, as discussed below. Test
duration cannot be set for a ramped temperature test
since it is determined by the selections made for
Starting and Ending Temperatures and Ramp Rate.
Note: When values are inserted to define a Ramped
test, the software shows a Projected Test Phase
Duration. The test will not stop after that time period.
The test stops after the Ending temperature is reached
or it stops on error if the Ending temperature is not
reached within 1 hour of the projected duration.
33
CL400 ChemiLume User's Guide
Screen 5-2
Temperature Profile Selections
5.0 SOFTWARE INSTRUCTIONS
H
5.3 TEST DEFINITION (cont.)
5.3.2.2 Temperature Profile (cont.)
6) For a constant temperature test, specify a value for
the Setpoint (°°C) by clicking in that edit box and typing
the value desired, or increment the value by clicking on
the indexer arrows. Maximum temperature is 250°C.
7) For a ramped temperature test, you must specify:
Starting temperature: the cell temperature to be
reached before controlled ramping begins.
Ramp rate: the rate at which cell temperature is to
increase during the test phase. Range: 1 to
10°C/minute in 0.1°C increments.
Ending temperature: cell temperature to be reached
at the end of the test phase. Maximum: 250°C.
Set these values by clicking in the appropriate edit box
and typing in a value, or increment a value by clicking on
an indexer arrow.
5.3.2.3 Deviation Alarm
The Deviation alarm provides visual warnings in the
program and Monitor windows, and flags (messages) in
the data logging file when the test temperature exceeds
the tolerance setting of the alarm. If the alarm is
triggered by a temperature deviation, the Temperature
heading in the Monitor view turns yellow and the
associated Cell Status Indicator (Section 4.2) turns
yellow at the lower right in the program window.
In a constant temperature test, the deviation alarm
becomes active after the setpoint temperature is
reached. In a ramped temperature test, the alarm is
active only during the temperature ramping period (i.e.,
after the start temperature is reached).
8) If you desire alarm operation during the test, click on
the white box beside Deviation alarm until a check
mark appears. Set the tolerance by clicking in the white
edit box and typing in a value or increment the value by
clicking on an indexer arrow. Range: ± 0.1 to 10°C.
34
CL400 ChemiLume User's Guide
Screen 5-3
Deviation Alarm Selection
5.0 SOFTWARE INSTRUCTIONS
H
5.3 TEST DEFINITION (cont.)
5.3.2.4 Test Phase Duration
This setting, for constant temperature tests, defines how
long the test cell remains at the setpoint temperature.
9) Set the Test Phase Duration by clicking in the white
edit boxes for Minutes, Hours and Seconds and typing in
the desired values, or increment the values by clicking
on the indexer arrows (Screen 5-4). Maximum: 32,767
Hours, 59 Minutes, 59 Seconds.
Screen 5-4
Test Phase Duration
Note: If you are unsure of the duration required for the
test, leave the setting at the default (maximum) and then
stop the test when you are satisfied with the results as
observed in the Intensity graph of the Analyze view.
5.3.2.5 Gas Types
These settings allow you to select the gas type and flow
rate during the pre-test and test phases of your test. You
may also choose None to prevent gas flow.
During a constant temperature test, the specimen is
typically exposed to nitrogen during the pre-test phase
to prevent oxidation while temperature is rising, and then
is exposed to oxygen during the test phase, at setpoint
temperature, to optimize oxidation. Your needs may
differ and you also have a choice of two flow rates:
Low Flow = 25 ml/minute/cell
High Flow = 50 ml/minute/cell
10) Select Gas Type by clicking on the pull-down menu
button (Screen 5-5) and then clicking on the desired
selection. Do this for both Pre-test and Test Phase.
5.3.2.6 Data Logging
Two methods for logging test data are available to
accommodate specimens with differing light emission
characteristics: Every Point and Adaptive. Secondary
options allow you to set data collection preferences. You
may experiment with different sampling rates and
observe the Projected Data File Size.
35
CL400 ChemiLume User's Guide
Screen 5-5
Gas Type Selection
5.0 SOFTWARE INSTRUCTIONS
H
5.3 TEST DEFINITION (cont.)
5.3.2.6 Data Logging (cont.)
Every Point & Sampling Rate
This method will record light intensity data points at the
interval specified. This is the most appropriate method
for specimens that begin emitting light early in the test
phase. If this characteristic of the specimen is unknown,
use this data logging method.
Adaptive & Threshold
This method records data only if the intensity level
changes by the amount specified in the Threshold (mV)
setting box. It is useful for specimens that begin emitting
light later in the test phase and helps minimize file size.
11) Select the data logging method by clicking in the
white circle beside Every Point or Adaptive until a
black dot appears indicating selection (Screen 5-6). Set
a value for Sampling Rate or Threshold by clicking in
the appropriate edit box and typing in a value, or
increment it by clicking on an indexer arrow. Observe
the Maximum Data File Size indicated and adjust
sampling rate or threshold to alter file size.
Sampling Rate Range: 1 to 32,767 seconds/reading
Threshold Range:
1 to 10,000 mV (milliVolts)
Data logging options provide the following functions:
Log during pre-test phase
If selected, data will be recorded during both the pre-test
and test phases. This is useful in some cases for
examining pre-test temperature performance. Selecting
this option will increase data file size.
Log temperature data
Normally, only intensity data is recorded. Selecting this
option will cause cell temperature data to be recorded as
well. This is most useful for providing a full record of test
conditions and for revealing the relationship of
temperature to intensity in the timeline graph.
Temperature data is always logged for Ramped tests
since it is required for the analysis of ramped test data.
36
CL400 ChemiLume User's Guide
Screen 5-6
Data Logging Selections
5.0 SOFTWARE INSTRUCTIONS
H
5.3 TEST DEFINITION (cont.)
5.3.2.6 Data Logging (cont.)
Log status flags
Status flags (messages) are recorded in the data file to
mark the occurrence of events, such as: gas status, and
temperature out-of-tolerance warnings. These are useful
for analyzing the test data and observing the exact time
position of test events.
Screen 5-7
Data Logging Options
If this option is selected, an event will always be logged
as it happens, independently of sampling rate or
intensity threshold logging options. This increases data
file size.
12) Select the desired logging options described above
by clicking in the white box beside the appropriate ones
until a check mark appears (Screen 5-7).
5.3.2.7 Saving & Loading the Test Setup
At this point, test definition for Cell 1 is complete and
you may save the settings for future use. The test
settings can then be loaded at a future date by clicking
on the Load Setup button in any cell Setup view.
13) If desired, save the test setup by clicking
on the Save Setup button and the Save As
dialog box (Screen 5-8) will appear. Type in
the desired file name and do not include an
extension (.set is added automatically). Click
on OK to save the file.
14) If you are setting up more than one test,
repeat the procedure above (Steps 1 through
13) for each cell in which you will conduct a
test. Otherwise, continue with the next
section.
Screen 5-8 Setup Save As Dialog Box
37
CL400 ChemiLume User's Guide
5.0 SOFTWARE INSTRUCTIONS
H
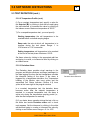
5.4 PERFORMING A TEST
Conditioning
Period
wn
l Do
Temperature
Coo
Before starting a test in the Setup view, new, empty
specimen holders must be loaded into the cells. These
must then undergo cell conditioning (preheat cleaning)
before the actual specimens are loaded. The specimen
holder cleaning is an integral, initial part of the test
procedure and is initiated with the Start Test button in
the Setup view (Screen 5-1). The holder cleaning at high
temperature is mandatory for eliminating contaminants
that can emit light during the test phase and alter
results. Solvent cleaning of the holders is adequate only
when conducting tests with peak temperatures below
200°C. Follow the procedure below to initiate a test.
5.4.1 Cell Conditioning and PMT Gain Settings
1) Click on the system button at the top of the screen to
bring up the system configuration menus.
2) Bring up the Advanced Test Settings menu. Adjust
the PMT Gain settings according to the instructions
under Procedures for Test Setup in Section 3.4.
50°C
Load Specimens
Screen Prompt
Appears
Time
Cell Conditioning
Temperature Profile
3) Bring up the Cell Conditioning menu and
adjust the settings according to the
instructions under Procedures for Test
Setup in Section 3.5.
4) Save the new settings in the current
configuration (.cfg) file by clicking on OK to
exit the system configuration menus, or
save to a new file by clicking on the Save
As button in the System menu and naming
a new file (see Section 3.8 for instructions).
Screen 5-9 Calibration Diagnostic Reminder
5.4.2 Cell Conditioning Phase
5) Open each cell drawer in which a test is to be
conducted. Remove the cell cover (Fig. 4). Place a new,
clean specimen holder into each cell and reinstall the
covers. Close the drawers.
6) In the Setup view of each cell, click on the Start Test
button. A calibration reminder will appear (Screen 5-9).
Click on O.K.
38
CL400 ChemiLume User's Guide
5.0 SOFTWARE INSTRUCTIONS
H
5.4 PERFORMING A TEST (cont.)
5.4.2 Cell Conditioning Phase (cont.)
7) A dialog box for entering the data logging
file name will appear (Screen 5-10). Click in
the edit box to the right of “File name:” and
type in a suitable file name for the data
logging file. Do not add an extension. It will
be added automatically. Click on the Save
button and cell conditioning will begin.
8) The cell conditioning requires about 2
hours to complete since the cells must be
allowed to cool to at least 50°C before the
specimens can be loaded. At that time, a
screen prompt (Screen 5-11) will advise you
to load the specimens.
Screen 5-10 Test Data File Save As Dialog Box
Observe cell temperature in the Monitor view. Click on
the Monitor button or select Monitor in the View menu.
CAUTION! Burn hazard. Avoid contact with
cell drawer surfaces marked by this symbol.
Don’t open the drawer until it has cooled
to 50°°C. Load specimens only after the cell
has cooled or results may be invalidated.
5.4.3 Specimen Preparation and Loading
The amount of specimen material used for a test must
be adequate to provide reliable emission levels, yet
small enough to prevent overloading of the PMT light
sensor. In most cases this must be determined by trial
and error. It is recommended that initial specimen weight
should be in the 0.05 to 0.5 gram range, and increased
or decreased for subsequent tests based on initial
results. Attempts should be made to achieve intensity
readings in the range of 5000 to 8000 mV (at High PMT
gain).
9) Weigh and prepare your specimen materials.
Maintain the cleanest conditions possible during
preparation to avoid the introduction of contaminants,
such as dust or skin oils, that will alter test results.
Handle specimens only with clean instruments.
39
CL400 ChemiLume User's Guide
Screen 5-11
Load Specimens Screen Prompt
5.0 SOFTWARE INSTRUCTIONS
5.4 PERFORMING A TEST (cont.)
5.4.3 Specimen Preparation and Loading (cont.)
10) Open a cell drawer. Remove the cell cover. Use
clean tweezers to transfer specimen material from its
container into the specimen holder. Clean the cell lens
cover with a non-residual solvent and install it on the cell
hand-tight only. Close the drawer. Important: Limit the
cell open time to 2 minutes to minimize air exposure.
11) Repeat step 10 for each active cell.
12) Click the OK button of the screen prompt and the
test will continue.
13) During the pre-test and test phases, check the gas
input pressure and adjust it to 6.9 kPa (1 PSI or 16
2
oz/in ) if it is out of range.
5.4.4 Test Monitoring
1) During the test you may observe the status of each
cell in the Monitor view (Screen 5-12). Click on the
Monitor button. Refer to Appendix A for a listing of
warnings that may appear during the test.
Screen 5-12 Cell 1 Monitor View
40
CL400 ChemiLume User's Guide
H
5.0 SOFTWARE INSTRUCTIONS
5.4 PERFORMING A TEST (cont.)
5.4.4 Test Monitoring (cont.)
2) The SP arrow beside the Temperature bar graph
indicates Setpoint. If the Deviation Alarm is active, there
will be two horizontal lines extending from the SP arrow.
These indicate the limits of the alarm tolerance.
3) During the test phase, the Intensity bar graph is
active. Select auto scale beneath the graph and the
range will be reduced (from 10,000mV) to a range that
will provide a taller, more responsive indicator bar.
4) While the test(s) is running, there are specific options
available for examining data as it is collected, in the
Analyze view (Screen 5-13), and for exporting it to
another application. If you chose to Log Temperature
Data in the test setup, temperature data may be
observed immediately in the timeline graph. Click on the
Analyze button in the cell window to observe the graph.
To observe and compare the graphs of all the active
cells, double click on the All Cells window icon at the
bottom of the screen, or click on the Window menu and
select All Cells (see Screen 5-17, next page).
Screen 5-13 Cell 1 Analyze View (Timeline Graph)
41
CL400 ChemiLume User's Guide
H
5.0 SOFTWARE INSTRUCTIONS
H
5.4 PERFORMING A TEST (cont.)
5.4.4 Test Monitoring (cont.)
5) To zoom in on a portion of the graph, click on the
Zoom In button beneath the graph. The cursor will
change to indicate a zoom window (Screen 5-14).
6) Move the cursor onto the near the area to be
enlarged. Hold the left mouse button down and stretch
the view box to enclose the area desired. Release the
mouse button. Click on the panning arrow buttons to
move the zoomed view to the desired position. Click on
the Zoom Out button to return to a full graph view.
Zoom view
box
7) The Analyze view includes
features for performing test data
analyses and printing a report,
covered
in
Section
5.5,
Analyzing Test Data.
5.4.5 Exporting Data
As test data is gathered, it may
be examined visually in the
Analyze view or it can be copied
to a file for export to another
analysis program.
The copy procedure saves the
currently logged test data and
will not affect or interrupt test
data logging to the file originally
named at test initiation.
Screen 5-14 Zoom View Selection Box
1) To export the test data during
the test, click on the Setup or
Monitor button to return to a
screen that includes the Copy
Logged Data button.
2) Click on the Copy Logged
Data button and the Copy Data
dialog box (Screen 5-16) will
appear.
Screen 5-15 All Cells Timeline Graph View
42
CL400 ChemiLume User's Guide
5.0 SOFTWARE INSTRUCTIONS
H
5.4 PERFORMING A TEST (cont.)
5.4.5 Exporting Data (cont.)
3) Data files may only be exported in ASCII
(text, .txt) format. Thus, the “Save as type:”
selection box may not be altered.
4) Click in the edit box beside “File name:”
and type in the file name desired. Click on
the Save button to save the file.
5.4.6 Test Completion & Stopping a Test
1) You may stop the test in a cell at any time
Screen 5-16 Copy Data Dialog Box
by clicking on the Stop Test button in the
Setup or Monitor view of that cell. The test data will be
logged up to the time this occurs.
If during test setup you were unsure of the
time (duration) required for your test, and the
maximum duration was selected, you may
stop the test with this method when intensity
data has declined to a specific minimum.
Screen 5-17 Test Complete - Post-test Comments
2) When a test completes, the Test
Complete dialog box (Screen 5-17) will appear. If the
test ended abnormally, this box will provide a status
message indicating the cause. Type in any relevant
information about the test process and then click on the
OK button to save the comments.
NOTE: The final test conditions shown in the Setup,
Monitor and Analyze views will remain until you click on
the Setup Test button. This clears the views and allows
you to configure and run another test in that cell while
other cells may still be under test. You may wish to print
a report or graph of test results, as described below,
before clearing the views.
You may also print test results at a later date by opening
an archived data file as described in Section 5.6.
43
CL400 ChemiLume User's Guide
5.0 SOFTWARE INSTRUCTIONS
H
5.4 PERFORMING A TEST (cont.)
5.4.7 Printing Results & Cell Reloading
1) You may print a test report and/or a
timeline graph before clearing the
Setup and Analyze screens. To do so,
click on the Report or Graph print
button at the top of the screen or select
Print from the File menu.
2) In the Printing Options menu
(Screen 5-18), click on the name of the
item(s) you wish to print (Test and/or
Analysis Report). Click on the Page
Layout button (Screen 5-19 to include
headers or footers on the printout.
Click on the Font button for fonts.
Screen 5-18 Printing Options Menu (Report)
3) Customize graph printouts by using
the options of the Graph Print menu
(Screen 5-20). If you performed one or
more analyses on the test data, you
may print it at this time by following
these instructions. To print the timeline
alone, disable all 3 analyses results in
the Graph Print - Analysis menu. Refer
to Section 5.5 for instructions on
performing analyses on the test data.
Screen 5-19 Report Printing Options - Page Layout
4) In the Graph Printing Analysis
screen (Screen 5-20), select the
analysis results you wish to print. Click
on the results names until a check
mark appears beside it.
5) Graph printouts may include
analysis results in text or graphical
format. Selecting Text Only provides a
graph and results in text form. Text and
Graphic provides a graph that has
coded lines indicating results as they
would appear on the Analysis screen,
as well as a text listing of results.
Selecting Detailed provides additional
information, including analysis limits, etc.
Screen 5-20 Graph Printing Options - Analysis
44
CL400 ChemiLume User's Guide
5.0 SOFTWARE INSTRUCTIONS
H
5.4 PERFORMING A TEST (cont.)
5.4.7 Printing Results & Cell Reloading (cont.)
6) Use the Titles menu (Screen 5-21) to
add titles to your graph printout. Multiple
lines of text may be included. Click on the
pull-down menu arrow buttons to select
from a list of default titles or you may type
in your own title. Click on the Font button
to select fonts.
7) Use the Pen Styles menu (Screen
5-22) to define the line styles, colors and
line width of the curves and indicator lines
on the graph.
Screen 5-21 Graph Printing Options - Titles
8) The Axes menu allows you to define
the range of time, intensity and
temperature.
This
permits
printing
expanded or compressed graphs. You
may also zoom in on a detail of a graph
and choose Current Viewport in this menu
to print only that zoomed view.
9) To add headers or footers to the graph
printout, use the Page Layout menu
(Screen 5-24). Click on the Font button to
select fonts.
Screen 5-22 Graph Printing Options - Pen Styles
10) Print the graph by clicking on OK at
the bottom of the menu.
11) You may also print test results at a
later date by opening a test archive file
(Section 5.6) and then performing steps 1
through 10 above, as desired.
Continue below with cell unloading.
Screen 5-23 Graph Printing Options - Axes
45
CL400 ChemiLume User's Guide
5.0 SOFTWARE INSTRUCTIONS
H
5.4 PERFORMING A TEST (cont.)
5.4.7 Printing Results & Cell Reloading (cont.)
CAUTION! Burn hazard. Avoid
contact with the drawer
surfaces marked by this
symbol. Do not open the cell
drawer or unload used spec
imens until the cell has cooled to 50°°C
or lower. The cell is above safe handling
temperature and the drawer remains
locked when the following indicators are
present:
• Monitor View cell status window
indicates: “Waiting for cell to cool.”
Screen 5-24 Graph Printing Options - Page Layout
• Setpoint (S.P.) arrow is still visible in Monitor View.
• Cell status indicator (at lower right of program screen)
is purple. The indicator turns gray when the cell is
cooled.
12) After a cell has cooled down, the drawer will unlock.
Open the drawer, remove the cell cover and remove the
specimen holder. Discard the holder and specimen.
Note: The cell cover may have seized due to high
temperature exposure. You may use large pliers to open
it, but take great care to avoid scratching the cover lens.
13) Conduct another test in a vacant cell by following the
procedures of Sections 5.2 through 5.4.
14) Continue with Section 5.5 Analyzing Test Data for
instructions on performing analyses of the test data.
46
CL400 ChemiLume User's Guide
5.0 SOFTWARE INSTRUCTIONS
5.5 ANALYZING TEST DATA
This section describes how to use the Analyze view to
perform four different analyses on the test data:
1) Oxidation Induction Time (OIT) - time at which
light emission intensity curve begins to increase from
baseline, which is the time interval to onset of
exothermic oxidation of the material. Applies to
constant temperature (isothermal) tests.
2) Integral - integration of area beneath intensity
curve between two limits. Applies to constant
temperature (isothermal) and ramped temperature
tests. Yields total integrated intensity in milliVolts.
3) Time to Failure* - duration at test temperature to
50% oxidation. Applies to constant temperature
(isotherm) tests. Yields induction period, oxidation rate
constant and material lifetime measurement.
4) Activation Energy* - activation energy of
hydroperoxide decomposition. Yields activation
energy and actual temperature ramp rate.
*(based on formulae published in Luminescence
Techniques in Solid-state Polymer Research, L.
Zlatkevich, Ed., Marcel Dekker, NY, 1989).
Some of the analyses may be performed from partial
data before a test is complete, such as OIT, Time to
Failure and Activation Energy.
Please follow the procedures below for performing
analyses on complete, saved data files. While it is
recommended that you perform these procedures after
a test is complete, they may be performed in the
Analyze view while a test is running when adequate data
has been recorded.
47
CL400 ChemiLume User's Guide
H
5.0 SOFTWARE INSTRUCTIONS
5.5 ANALYZING TEST DATA (cont.)
5.5.1 Opening a Data File
To perform an analysis, an archived data file must be
opened first. This is the initial step for each analysis.
1) Click on the Open button at the top of the screen or
click on the File menu and select Open and the Open
File dialog box will appear.
2) Double click on the name of the test data file you wish
to open or type its name in the edit box beside “File
name:” and then click on the Open button. The Archived
File Setup view will appear.
Screen 5-25 Archived File Analyze View
3) Click on the Analyze view button to bring up the
Archived File Analyze view (Screen 5-25).
5.5.2 Oxidation Induction Time (OIT) Analysis
This analysis may be performed only on constant
temperature (isothermal) test data.
1) Open a data file as described in Section 5.5.1 above.
48
CL400 ChemiLume User's Guide
H
5.0 SOFTWARE INSTRUCTIONS
H
5.5 ANALYZING TEST DATA (cont.)
5.5.2 Oxidation Induction Time (OIT) Analysis (cont.)
Line adjustment
handles
2) Click on the OIT button.
Screen 5-26 OIT Automatic Points Selection
3) To perform the analysis you must first define the
baseline and the maximum slope of the intensity cure.
These selections may be defined automatically or
manually.
4) Automatic Point Selection: Click on the Automatic
Points button and two lines will appear on the graph
(Screen 5-26). Go to Step 7.
5) Manual Point Selection: Click on the Define Custom
Points button and the definition lines will appear with
adjustment handles.
6) Adjust each line by moving the cursor onto a handle
and holding the left mouse button down. Drag the line
end as required and then release the mouse button.
The horizontal line (baseline) should be adjusted to
match the slope of the curve as shown, with the line
passing through the center of the curve data points.
49
CL400 ChemiLume User's Guide
5.0 SOFTWARE INSTRUCTIONS
5.5 ANALYZING TEST DATA (cont.)
5.5.2 Oxidation Induction Time (OIT) Analysis (cont.)
The peak slope line should be adjusted to pass through
the steepest point of the ascending curve. Both ends are
adjustable to allow angling of the line.
Note: For a more detailed view of the curve when
making manual point selections, click on the zoom
button, move the cursor to a point just outside the area
of interest, hold the left mouse button down and drag a
zoom box around the area. Release the mouse button.
7) Click on the Analyze button to perform the analysis.
Results are shown on the graph by the OIT line and
beneath the graph in the edit boxes (Screen 5-27).
Screen 5-27 OIT Analysis Results
8) Print the results by clicking on the Graph or Report
print button at the top of the program screen or by
selecting Graph or Report print from the File menu.
Follow the instructions of Section 5.4.7 for configuring
the printing options.
9) To perform another OIT analysis of the curve, repeat
the procedure above beginning with Step 3.
50
CL400 ChemiLume User's Guide
H
5.0 SOFTWARE INSTRUCTIONS
H
5.5 ANALYZING TEST DATA (cont.)
5.5.3 Integral Analysis
This analysis may be performed on constant
(isothermal) and ramped temperature test data.
1) Open a data file as described in Section 5.5.1 above,
or continue with the currently open data file.
2) Click on the Integral button.
3) To perform the analysis you must first define the
limits of the intensity curve to be integrated. These two
points may be defined automatically or manually.
4) Automatic Point Selection: Click on the Automatic
Points button and two vertical lines will appear on the
graph (Screen 5-28) indicating that the entire intensity
curve will be integrated. Go to Step 7 if full-curve
integration is desired.
Line adjustment
handles
Screen 5-28 Integral Automatic Points Selection
5) Manual Point Selection: Click on the Define Custom
Points button and the definition lines will appear with
adjustment handles.
51
CL400 ChemiLume User's Guide
5.0 SOFTWARE INSTRUCTIONS
5.5 ANALYZING TEST DATA (cont.)
5.5.3 Integral Analysis (cont.)
6) Adjust each line horizontally by moving the cursor
onto a handle and holding the right mouse button down.
Drag the line as required and then release the mouse
button. Only the portion of the intensity curve between
the definition lines will be integrated.
Note: For a more detailed view of the curve when
making manual point selections, click on the zoom
button, move the cursor to a point just outside the area
of interest, hold the left mouse button down and drag a
zoom box around the area. Release the mouse button.
Screen 5-29 Integral Analysis Results
7) Click on the Analyze button to perform the integration.
The results are shown in the Integrated Intensity box at
the bottom of the view (Screen 5-29).
8) Print the results by clicking on the Graph or Report
print button at the top of the program screen or by
selecting Graph or Report print from the File menu. See
Section 5.4.7 to configure the printing options.
9) To perform another integration, repeat from Step 3.
52
CL400 ChemiLume User's Guide
H
5.0 SOFTWARE INSTRUCTIONS
H
5.5 ANALYZING TEST DATA (cont.)
5.5.4 Time to Failure Analysis
This analysis may be performed only on constant
temperature (isothermal) test data.
1) Open a data file as described in Section 5.5.1 above,
or continue with the currently open data file.
Line adjustment
handle
2) Click on the Time to Failure button.
Screen 5-30 Time to Failure Automatic Points Selection
3) To perform the analysis you must define Io (beginning
of intensity curve deviation from exotherm baseline), Ipeak
(peak value of intensity curve) and the critical degree of
conversion. These values may be defined automatically
or manually. When the Automatic Points option is
selected, a default value of 0.50 is used for the critical
degree of conversion, but this default value may be
altered to your preference before initiating the analysis.
4) Automatic Point Selection: Click on the Automatic
Points button and two lines will appear (Screen 5-30)
indicating the automatically determined locations of Io
and Ipeak on the intensity curve. Go to Step 8 if you wish
to conduct the analysis using the default critical degree
of conversion value shown, otherwise go to Step 7.
53
CL400 ChemiLume User's Guide
5.0 SOFTWARE INSTRUCTIONS
5.5 ANALYZING TEST DATA (cont.)
5.5.4 Time to Failure Analysis (cont.)
5) Manual Point Selection: Click on the Define Custom
Points button and the Io and Ipeak definition lines will
appear with adjustment handles.
Screen 5-31 Time to Failure Analysis Results
6) Adjust each line horizontally by moving the cursor
onto a handle and holding the left mouse button down.
Drag the line and then release the mouse button.
Note: For a more detailed view of the curve when
making manual point selections, click on the zoom
button, move the cursor to a point just outside the area
of interest, hold the left mouse button down and drag a
zoom box around the area. Release the mouse button.
7) Select a value for the critical degree of conversion by
clicking in the “Critical degree of conversion” edit box
and typing in a value or by incrementing the value by
clicking on an indexer arrow. Critical degree of
conversion is defined as the amount of oxidation that will
produce a detrimental effect in the material. It is
customer-defined and based on results from
experimental data and factors related to the application
of the material.
54
CL400 ChemiLume User's Guide
H
5.0 SOFTWARE INSTRUCTIONS
5.5 ANALYZING TEST DATA (cont.)
5.5.4 Time to Failure Analysis (cont.)
8) Click on the Analyze button to perform the analysis.
The results are shown at the lower right of the view
(Screen 5-31).
9) Print the results by clicking on the Graph or Report
print button at the top of the program screen or by
selecting Graph or Report print from the File menu.
Follow the instructions of Section 5.4.7 for configuring
the printing options.
10) To perform another analysis, repeat from Step 3.
5.5.5 Activation Energy Analysis
Screen 5-32 Activation Energy Analysis Results
This analysis may be performed only on ramped
temperature test data.
1) Open a data file as described in Section 5.5.1 above,
or continue with the currently open data file.
2) Click on the Activation Energy button. There are no
user-adjustable setup options for this analysis.
55
CL400 ChemiLume User's Guide
H
5.0 SOFTWARE INSTRUCTIONS
5.5 ANALYZING TEST DATA (cont.)
5.5.5 Activation Energy Analysis (cont.)
Calculations are performed upon the data beginning at
the oxygen start time (beginning of test phase) and
ending at the last data point recorded (end of controlled
temperature ramp).
3) Click on the Analyze button. Results are shown at the
lower right of the view (Screen 5-32).
4) Print the results by clicking on the Graph or Report
print button at the top of the program screen or by
selecting Graph or Report print from the File menu.
Follow the instructions of Section 5.4.7 for configuring
the printing options.
5) To perform another analysis, repeat from Step 3.
56
CL400 ChemiLume User's Guide
H
6.0 CALIBRATION PROCEDURES
Calibration of the PMT (photomultiplier tube) light
sensors in the CL400 ensures that each is operating
properly and is accurately calibrated. This must be
conducted, initially, on a daily basis. After you acquire a
short history of calibration results you may determine
that PMT calibration is only necessary at 3 day intervals,
or weekly. Examine the calibration results collected and
make your own determination. PMT stability can be
affected by ambient temperature fluctuations and
vibration levels.
6.1 PMT INTENSITY CALIBRATION
Calibration involves placing the liquid intensity standard
into a cell drawer and then initiating the test with the
calibration start button. You must subsequently install a
filter during the procedure to alter the standard’s
emission level. Text prompts on the calibration page
guide you through the procedure outlined below.
Intensity Calibration Quick Reference
1) Standard in drawer with filter
2) Standard in drawer without filter
3) Accept or discard calibration results. Print report.
The above procedure must be carried out for each of the
4 test cells and takes about 6 to 12 minutes per cell.
Procedure
Important:The CL400 cells must be at room
temperature prior to beginning the PMT calibration.
CAUTION! The intensity standard is a
radioactive emission source and must be
handled carefully to avoid breakage and
contamination. Its output is about 8 µCi
(micro-Curies), an extremely low emission rate, but it
must be handled, stored and disposed of according to
local health and safety standards. In the event of
breakage, avoid direct contact with the liquid. Clean up
and dispose of the contamination according to
applicable hazardous waste regulations.
60
CL400 ChemiLume User's Guide
H
6.0 CALIBRATION PROCEDURES
H
6.1 PMT INTENSITY CALIBRATION (cont.)
Screen 6-1 Cell Calibration View - Main
Perform this calibration for each cell that will be used to
conduct a test, from one to all four, as required.
1) Important: Verify that the intensity standard
information has been recorded as described in Sec. 3.2.
You will be prompted to do so by this procedure.
2) Remove the cell covers and specimen holders from
each cell to be calibrated (Fig. 4). Install the intensity
standard and its filter, as shown in Fig. 11, in the first
cell to be calibrated. Close all the cell drawers.
3) Bring up the window for the first cell to be calibrated
by clicking on Cell X in the button bar or by clicking on
the Window menu and selecting Cell X.
4) Click on the calibrate button and the main Calibration
screen (Screen 6-1) will appear. Click on the Calibrate
PMT button and the PMT calibration screen
(Screen 6-2) will appear. The dark current tests will
begin immediately (an internal shutter prevents the PMT
from responding to the intensity standard during the dark
current test). Allow a few minutes for completion.
5) The low gain test will run automatically.
61
CL400 ChemiLume User's Guide
GLASS
FILTER
LIQUID
INTENSITY
STANDARD
(7.8 uCi)
HOLDER
CELL
DRAWER, SIDE VIEW
OVERHEAD VIEW
Figure 11
Intensity Standard Setup
6.0 CALIBRATION PROCEDURES
6.1 PMT INTENSITY CALIBRATION (cont.)
Screen 6-2 PMT Calibration View
6) The screen prompt will ask you to remove the filter.
Alter the setup in the cell drawer to meet this request.
Close the drawer and click on the OK button.
7) When the test is complete, results are shown in the
Calibration Report window (Screen 6-2). You are asked
to accept the new values, if they are within specification,
or to discard them if they are out of tolerance or any
errors occurred. Click on the appropriate button.
Accepting the new values will update only the currently
loaded configuration (.cfg) file (see Sections 3.1, 3.8 and
3.9 regarding configuration file use and loading).
8) You may print a copy of the calibration report by
selecting the Report print button at the top of the
program window, or by selecting Print Report the File
menu. The calibration report will stay open in this
window until you select clear report, or you start a new
test or calibration procedure.
9) Click on the OK button.
10) Close the cell window by clicking on the Close (X)
button at the upper right of the cell window. Repeat
steps 3 - 9 for each cell to be calibrated.
62
CL400 ChemiLume User's Guide
H