1
FireRack
Network Monitoring and Troubleshooting
Guide
Revision: rfs-051208-1
Table of Contents
Introduction ...........................................................................3
FMS Traffic Statistics.............................................................4
Monitoring and packet sniffing tools......................................6
Examining Argus logs ...........................................................13
Dynamic Groups as blacklists ..............................................14
Port scan and worm detection ..............................................15
Manual Pages .......................................................................16
2
Introduction
This guide describes the tools and techniques available in FireRack to identify and
deal with problem machines on your network.
The specific areas this document deals with are:
1. Bandwidth congestion
2. Port scanning activity
3. Worm infection
If your firewall(s) have the accounting module enabled, much of the information you’ll
need to trace these problems can be found on the FMS web interface. The next
section deals briefly with the FMS traffic statistics available in the web interface. This
gives you a very high level and user-friendly view of what is happening on your
network.
The remainder of this document then deals with the command line tools available on
the firewalls themselves. These tools can provide you with a great deal of detail not
available in the web interface, as the latter deals only in statistics, rather than dealing
with individual packets and connection. Also, the command line tools provide you
with real-time data, whereas the date in the web interface is updated every 5
minutes.
3
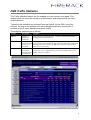
FMS Traffic Statistics
The Traffic Statistics feature can be enabled on a per security zone basis. This
chapter does not cover the setting up of this feature, and assumes that you have
already done so.
Typically these statistics are collected from the firewall, by the FMS, every five
minutes. As long as the problem you are investigating as been occurring for 5
minutes or more, these statistics may prove useful.
The statistics gathered are as follows:
Column
Description
Useful for
MBytes
Number of
Megabytes
transferred
Identifying heavy bandwidth users – possibly compromised machines
running FTP or P2P repositories
Packets/1000
Number of
packets sent and
received – In
thousands
High packet rates place a disproportionally high load on firewalls. Voice
over IP (VoIP) is an example of a high packet rate application. With VoIP,
although the packet count may be high, the connection count should be
relatively low (see below).
Conns/1000
Number of
This can be very useful for highlighting port scanning machines. They will
connection
typically have a very high number of connection attempt relative to the
attempts made – number of bytes or packets.
In thousands
4
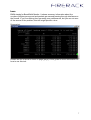
When setting up your traffic accounting for each zone, you will have selected whether
to collect a single set of statistics for the zone, or to collect per registered host
statistics for that zone. For the purposes of tracking down individual machines that
are abusing bandwidth, or port scanning, per registered hosts statistics are far more
useful than per security zone.
As you can see above, for each entity being monitored, there is a row showing the
number of bytes and packets sent and received by that entity. By changing the
Period and Display options at the top of the screen, you can chose how many
entities to display, and over what period. To detect port scanners active in the last 15
minutes, simply chose “15 minutes” for the period, and chose the appropriate number
of hosts to display (e.g. “Top Ten”).
By default the data is ordered by the total number of bytes to and from the entity (the
sum of sent and received). You can change the order of the rows by clicking on the
links at the top of columns you want to sort by. If for instance you want to sort by the
number of connection attempts coming from an entity, you would click on OUT
column under Conns/1000.
Realms and network segments
Traffic accounting in FireRack is grouped into different Realms. A realm is a group of
networks or subnets. This enables you to view statistics for your Internet connection
separately to your local networks.
Please bear this in mind as you search the statistics. Some worms may only scan
your local are network, and the firewall can only record packets that have passed
through it. Depending on the layout of your network, you may want to examine
multiple realms, or consider the possibility that the activity you are looking for doesn’t
even pass through the firewall.
5
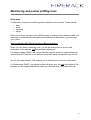
Monitoring and packet sniffing tools
Overview
FireRack has a variety of monitoring tools available on the console. These include:
• bwm
• iptraf
• tcpdump
• ngrep
Each one of these tools give you a different way of looking at your network traffic. It is
important to understand the strengths and limitations of these tools to get the most
out of them.
Notes regarding NAT (Redirection and Masquerading):
When you use these monitoring tools, you will be seeing the true source and
destination of the packets, not the translated addresses.
For Masquerading (SNAT) this means that although the firewall is masquerading an
internal host’s IP address as the packet leaves the firewall, the packets you will see
are not yet masqueraded. This enables you to identify the true source of a packet.
For Redirection (DNAT), the packet sniffers will show your the new destination of the
packets, not the original destination which you overrode with your redirection rule.
6
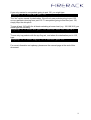
bwm
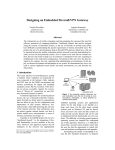
BWM stands for BandWidth Monitor. It shows summary information about the
number of kBytes per second and packets per second passing through interfaces on
the firewall. If you’re suffering from generally poor performance, but you are not sure
of the source of the problem, this tool might provide a clue.
Screenshot:
Please see the manual for bwm on page [page] of this guide for more information on
how to use this tool.
7
iptraf
iptraf is a command line IP LAN monitor that generates various network statistics
including TCP info, UDP counts, ICMP and OSPF information, Ethernet load info,
node stats, IP checksum errors, and others.
If the command is issued without any command-line options, the program comes up
in interactive mode, with the various facilities accessed through the main menu.
As the IP traffic monitor is connection oriented, it is not usually the best tool to
identify port scanning activity. Each probe in a typical port-scan is a single packet to
a single destination IP address and port. Consequently such activity is unlikely to
have a high packet (or byte) count for each connection.
If however the problem you are investigating is being caused by a relatively small
number of connections using high byte or packet rates, the IPTraf should prove very
useful.
Examples:
If you were aware that that the device eth1 was under heavy load and were
interested in which hosts or connections might be responsible, you might to the
following:
1. SSH onto the active firewall
2. Run “iptraf”
3. From the main menu select “IP traffic monitor”
4. Select the interface of interest (e.g. eth1)
8
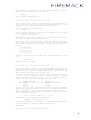
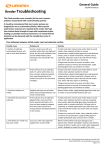
5. The traffic monitor starts running. Note the hot key options displayed at the
bottom of the screen. “S” for sort in particular:
6. Select “S”. You can now choose to sort the list by (P)acket count or (B)yte
count.
7. The display now ranks the connections in the order you specified.
8. The resort the display, repeat step 6, as many times as you like
For further information on using IPTraf, please see the manual at the and of this
guide.
9
tcpdump
tcpdump is a straightforward packet sniffer. By default it puts the ethernet card in
question into “promiscuous” mode and dumps information about those packets to the
console. In order to make effective use of this tool, it’s worth spending the time to
learn the syntax used for filtering, or extending its output.
The basic form of a tcpdump command is as follows:
#tcpdump n i eth0
-n
-i
turns off DNS lookups
is used to specify the interface to operate on
You can stop tcpdump at any time by pressing Ctrl-C
Typing the above command will produce a stream if lines describing the packets
seen on the interface in question. The output should look something like this:
23:11:06.853903 192.168.30.6.53760 > 192.168.99.2.22: . ack 76033 win 32584
<nop,nop,timestamp 3931728054 858328436> (DF) [tos 0x8]
23:11:06.854280 192.168.99.2.22 > 192.168.30.6.53760: . 141585:142993(1408)
win 8600 <nop,nop,timestamp 858330058 3931728054> (DF) [tos 0x8]
23:11:06.854393 192.168.99.2.22 > 192.168.30.6.53760: . 142993:144401(1408)
win 8600 <nop,nop,timestamp 858330058 3931728054> (DF) [tos 0x8]
23:11:06.854539 192.168.99.2.22 > 192.168.30.6.53760: . 144401:145809(1408)
win 8600 <nop,nop,timestamp 858330058 3931728054> (DF) [tos 0x8]
23:11:07.041595 192.168.30.6.53760 > 192.168.99.2.22: . ack 78849 win 32584
<nop,nop,timestamp 3931728244 858328535> (DF) [tos 0x8]
23:11:07.041979 192.168.99.2.22 > 192.168.30.6.53760: . 145809:147217(1408)
win 8600 <nop,nop,timestamp 858330245 3931728244> (DF) [tos 0x8]
23:11:07.042094 192.168.99.2.22 > 192.168.30.6.53760: . 147217:148625(1408)
win 8600 <nop,nop,timestamp 858330245 3931728244> (DF) [tos 0x8]
23:11:07.042218 192.168.99.2.22 > 192.168.30.6.53760: . 148625:150033(1408)
win 8600 <nop,nop,timestamp 858330245 3931728244> (DF) [tos 0x8]
ack 48
ack 48
ack 48
ack 48
ack 48
ack 48
The most interesting piece of data is usually the source and destination IP addresses
and ports (highlighted in red). In the above example we’ve highlighted a packet from
192.168.99.2 (port 22) to 192.168.30.6 (port 53760).
If you are searching for the source of a port scan, you would hope to see a large
number of packets from the same source address.
Filtering the output
If you, or other operators are connected to the firewall using ssh on the interface
you’re watching you’ll immediately see a problem. Your own ssh packets could well
dominate the tcpdump output. You will probably want to filter this data out.
You might have a clear idea what you are looking for, in which case you will want to
specify a filter that shows only that traffic. Alternatively, you could start by displaying
all packets and then systematically exclude uninteresting traffic as you see it.
To exclude your own and other peoples SSH traffic, you might type:
#tcpdump n i eth0 not port 48001
10
If you only wanted to see packets going to port 135, you might type:
#tcpdump n i eth0 dst port 135
The “dst” option stands for destination. We will only see packets going to port 135,
not any packets returning from port 135. To see packet going to and from port 135,
simply drop the dst option.
To see all port 135 traffic for all hosts excluding a known host (e.g. 192.168.30.2) you
would type the following:
#tcpdump n i eth0 dst port 135 and not host 192.168.30.2
To see only tcp packets with the syn flag set, and where the destination port is 135,
type:
#tcpdump n i eth0 tcp[13] == 2 and dst port 135
For more information on tcpdump, please see the manual page at the end of this
document.
11
ngrep
This tool can search some or all of the packets on an interface for a particular string
or sequence of bytes. The ports, sources and destinations can be filtered in a similar
way to tcpdump filters.
To find packets on the network interface eth0 containing the word “edonkey” you
would type:
#ngrep d eth0 edonkey
Snippets of all packets containing that string are dumped to the console in a similar
fashion to tcpdump.
In addition to the simple string match shown, it will also accept regular expressions
and hex sequences. Please see the ngrep manual page for more information.
12
Examining Argus logs
FireRack can run multiple instances of the argus listener. Each listener is bound to a
specific tcp port. Typically your FMS will be configured to connect to these ports and
write the resulting traffic flow data to disk.
This data can them be analysed using the provided tools, including “ra”.
INCOMPLETE
For more information about argus visit:
http://qosient.com/argus/
13
Dynamic Groups as blacklists
The Dynamic Groups feature allows you to dynamically or manually add IP
addresses to a list in response to certain events. Once an IP address is added to the
group, you can make use of it by matching against that Dynamic Group and either a
source or a destination address in a firewall rule.
You can create these dynamic groups in advance and pre-configure a set of rule to
govern how hosts on the list should be treated. Once you have determined that a
host on your network is misbehaving, you can manually add its address to this list. It
then instantaneously becomes subject to those predefined rules.
INCOMPLETE
14
Port scan and worm detection
INCOMPLETE
15
Manual Pages
IPTRAF(8)
NAME
iptraf - Interactive Colorful IP LAN Monitor
SYNOPSIS
iptraf { [ -f ] [ -q ] [ { -i iface | -g | -d iface | -s iface | -z
iface | -l iface } [ -t timeout ] [ -B [ -L logfile ] ] ] | [ -h ] }
DESCRIPTION
iptraf is an ncurses-based IP LAN monitor that generates various network statistics including TCP info, UDP counts, ICMP and OSPF information, Ethernet load info, node stats, IP checksum errors, and others.
If the command is issued without any command-line options, the program
comes up in interactive mode, with the various facilities accessed
through the main menu.
OPTIONS
These options can also be supplied to the command:
-i iface
immediately start the IP traffic monitor on the specified
interface, or all interfaces if "-i all" is specified
-g
immediately start the general interface statistics
-d iface
allows you to immediately start the detailed on
interface (iface)
the
indicated
-s iface
allows you to immediately monitor TCP and UDP traffic on the
specified interface (iface)
-z iface
shows packet counts by size on the specified interface
-l iface
start the LAN station monitor on the specified
all LAN interfaces if "-l all" is specified
interface,
or
-t timeout
tells IPTraf to run the specified facility for only timeout
minutes. This option is used only with one of the above parameters.
-B
redirect standard output to /dev/null, closes standard input,
and forks the program into the background. Can be used only
with one of the facility invocation parameters above. Send the
backgrounded process a USR2 signal to terminate.
-L logfile
allows you to specify an alternate log file name. The default
log file name is based on either the interface selected
(detailed interface statistics, TCP/UDP service statistics,
packet size breakdown), or the instance of the facility (IP
traffic monitor, LAN station monitor). If a path is not specified, the log file is placed in /var/log/iptraf
-f
clears all locks and counters, causing this instance of IPTraf
to think itâs the first one running. This should only be used
to recover from an abnormal termination or system crash.
-q
no longer needed, maintained only for compatibility.
-h
shows a command summary
SIGNALS
16
SIGUSR1 - rotates log files while program is running
SIGUSR2 - terminates an IPTraf process running in the background.
FILES
/var/log/iptraf/*.log - log file
/var/run/iptraf/* - important IPTraf data files
SEE ALSO
Documentation/* - complete documentation written by the author
AUTHOR
Gerard Paul Java ([email protected])
MANUAL AUTHOR
Frederic Peters ([email protected]), using iptraf --help General manual page modifications by Gerard Paul Java ([email protected])
IPTraf Help Page
IPTRAF(8)
17
BWM
USAGE
----USAGE: bwm-ng [OPTION] ... [CONFIGFILE]
Options:
-t, --timeout <msec>
displays stats every <msec> (1msec = 1/1000sec)
default: 500
-d, --dynamic
show values dynamicly (Byte KB or MB)
-a, --allif [mode]
where mode is one of:
0=show only up (and selected) interfaces
1=show all up interfaces (default)
2=show all and down interfaces
-p, --packets
show packets/s instead of KB/s
-I, --interfaces <list> show only interfaces in <list> (comma seperated), or
if list is prefaced with % show all but interfaces
in list
-S, --sumhidden
count hidden interfaces for total
-D, --daemon
fork into background and daemonize
-h, --help
displays this help
-V, --version
print version info
Input:
-i, --input <method>
-f, --procfile <file>
-n, --netstat <path>
Output:
-o, --output <method>
-C, --csvchar <char>
-F, --csvfile <file>
-H, --htmlrefresh <num>
-H, --htmlheader
-c, --count <num>
input method, one of: netstat proc libstatgrab
filename to read raw data from. (/proc/net/dev)
use <path> as netstat binary
output method, one of: plain, curses, csv, html
delimiter for csv
output file for csv (default stdout)
meta refresh for html output
show <html> and <meta> frame for html output
number of query/output for plain & csv
(ie 1 for one single output)
Keybindings (curses only):
'q'
exit
'+'
increases timeout by 100ms
'-'
decreases timeout by 100ms
'k','d' switch KB and auto assign Byte/KB/MB
'a'
cycle: show all interfaces, only those which are up,
only up and not hidden
's'
sum hidden ifaces to total aswell or not
'n'
cycle: input methods
'p'
switch show packets or Byte/s
18
TCPDUMP
TCPDUMP(8)
NAME
TCPDUMP(8)
tcpdump - dump traffic on a network
SYNOPSIS
tcpdump [
[
[
[
[
-adeflnNOpqRStuvxX ] [ -c count ]
-C file_size ] [ -F file ]
-i interface ] [ -m module ] [ -r file ]
-s snaplen ] [ -T type ] [ -U user ] [ -w file ]
-E algo:secret ] [ expression ]
DESCRIPTION
Tcpdump prints out the headers of packets on a network interface that
match the boolean expression. It can also be run with the -w flag,
which causes it to save the packet data to a file for later analysis,
and/or with the -r flag, which causes it to read from a saved packet
file rather than to read packets from a network interface. In all
cases, only packets that match expression will be processed by tcpdump.
Tcpdump will, if not run with the -c flag, continue capturing packets
until it is interrupted by a SIGINT signal (generated, for example, by
typing your interrupt character, typically control-C) or a SIGTERM signal (typically generated with the kill(1) command); if run with the -c
flag, it will capture packets until it is interrupted by a SIGINT or
SIGTERM signal or the specified number of packets have been processed.
When tcpdump finishes capturing packets, it will report counts of:
packets ``received by filter'' (the meaning of this depends on
the OS on which you're running tcpdump, and possibly on the way
the OS was configured - if a filter was specified on the command
line, on some OSes it counts packets regardless of whether they
were matched by the filter expression, and on other OSes it
counts only packets that were matched by the filter expression
and were processed by tcpdump);
packets ``dropped by kernel'' (this is the number of packets
that were dropped, due to a lack of buffer space, by the packet
capture mechanism in the OS on which tcpdump is running, if the
OS reports that information to applications; if not, it will be
reported as 0).
On platforms that support the SIGINFO signal, such as most BSDs, it
will report those counts when it receives a SIGINFO signal (generated,
for example, by typing your ``status'' character, typically control-T)
and will continue capturing packets.
OPTIONS
-a
Attempt to convert network and broadcast addresses to names.
-c
Exit after receiving count packets.
-C
Before writing a raw packet to a savefile, check whether the
file is currently larger than file_size and, if so, close the
current savefile and open a new one. Savefiles after the first
savefile will have the name specified with the -w flag, with a
number after it, starting at 2 and continuing upward. The units
of file_size are millions of bytes (1,000,000 bytes, not
1,048,576 bytes).
-d
Dump the compiled packet-matching code in a human readable form
to standard output and stop.
-dd
Dump packet-matching code as a C program fragment.
-ddd
Dump packet-matching code as decimal numbers
count).
-e
Print the link-level header on each dump line.
-E
Use algo:secret for decrypting IPsec ESP packets. Algorithms
may be des-cbc, 3des-cbc, blowfish-cbc, rc3-cbc, cast128-cbc, or
none.
The default is des-cbc. The ability to decrypt packets
is only present if tcpdump was compiled with cryptography
(preceded
with
a
19
enabled.
secret the ascii text for ESP secret key. We cannot
take arbitrary binary value at this moment. The option assumes
RFC2406 ESP, not RFC1827 ESP. The option is only for debugging
purposes, and the use of this option with truly `secret' key is
discouraged.
By presenting IPsec secret key onto command line
you make it visible to others, via ps(1) and other occasions.
-f
Print `foreign' internet addresses numerically rather than symbolically (this option is intended to get around serious brain
damage in Sun's yp server ? usually it hangs forever translating
non-local internet numbers).
-F
Use file as input for the filter expression.
expression given on the command line is ignored.
-i
Listen on interface. If unspecified, tcpdump searches the system interface list for the lowest numbered, configured up interface (excluding loopback). Ties are broken by choosing the earliest match.
An additional
On Linux systems with 2.2 or later kernels, an interface argument of ``any'' can be used to capture packets from all interfaces.
Note that captures on the ``any'' device will not be
done in promiscuous mode.
-l
Make stdout line buffered. Useful if you want to see the
while capturing it. E.g.,
``tcpdump -l | tee
dat''
or
``tcpdump -l
dat & tail -f dat''.
data
>
-m
Load SMI MIB module definitions from file module.
This option
can be used several times to load several MIB modules into tcpdump.
-n
Don't convert host addresses to names.
avoid DNS lookups.
-nn
Don't convert protocol and port numbers etc. to names either.
-N
Don't print domain name qualification of host names. E.g., if
you give this flag then tcpdump will print ``nic'' instead of
``nic.ddn.mil''.
-O
Do not run the packet-matching code optimizer.
only if you suspect a bug in the optimizer.
-p
Don't put the interface into promiscuous mode.
Note that the
interface might be in promiscuous mode for some other reason;
hence, `-p' cannot be used as an abbreviation for `ether host
{local-hw-addr} or ether broadcast'.
-q
Quick (quiet?) output.
put lines are shorter.
-R
Assume ESP/AH packets to be based on old specification (RFC1825
to RFC1829).
If specified, tcpdump will not print replay prevention field. Since there is no protocol version field in
ESP/AH specification, tcpdump cannot deduce the version of
ESP/AH protocol.
-r
Read packets from file (which was created with the
Standard input is used if file is ``-''.
-S
Print absolute, rather than relative, TCP sequence numbers.
-s
Snarf snaplen bytes of data from each packet rather than the
default of 68 (with SunOS's NIT, the minimum is actually 96).
68 bytes is adequate for IP, ICMP, TCP and UDP but may truncate
protocol information from name server and NFS packets (see
below).
Packets truncated because of a limited snapshot are
indicated in the output with ``[|proto]'', where proto is the
name of the protocol level at which the truncation has occurred.
Note that taking larger snapshots both increases the amount of
time it takes to process packets and, effectively, decreases the
amount of packet buffering. This may cause packets to be lost.
You should limit snaplen to the smallest number that will capture the protocol information you're interested in.
Setting
This
can
be
used
to
This is useful
Print less protocol information so out-
-w
option).
20
snaplen
ets.
to 0 means use the required length to catch whole pack-
-T
Force packets selected by "expression" to be interpreted the
specified type.
Currently known types are cnfp (Cisco NetFlow
protocol), rpc (Remote Procedure Call), rtp (Real-Time Applications protocol), rtcp (Real-Time Applications control protocol),
snmp (Simple Network Management Protocol), vat (Visual Audio
Tool), and wb (distributed White Board).
-t
Don't print a timestamp on each dump line.
-tt
Print an unformatted timestamp on each dump line.
-U
Drops root privileges and changes user ID to user and group ID
to the primary group of user.
Note! Red Hat Linux automatically drops the privileges to
``pcap'' if nothing else is specified.
user
-ttt
Print a delta (in micro-seconds) between current and previous
line on each dump line.
-tttt
Print a timestamp in default format proceeded by
dump line.
-u
Print undecoded NFS handles.
-v
(Slightly more) verbose output. For example, the time to live,
identification, total length and options in an IP packet are
printed.
Also enables additional packet integrity checks such
as verifying the IP and ICMP header checksum.
-vv
Even more verbose output.
printed from NFS reply
decoded.
-vvv
Even more verbose output. For example, telnet SB ... SE options
are printed in full. With -X telnet options are printed in hex
as well.
-w
Write the raw packets to file rather than parsing and printing
them out. They can later be printed with the -r option. Standard output is used if file is ``-''.
-x
Print each packet (minus its link level header) in hex.
The
smaller of the entire packet or snaplen bytes will be printed.
Note that this is the entire link-layer packet, so for link layers that pad (e.g. Ethernet), the padding bytes will also be
printed when the higher layer packet is shorter than the
required padding.
-X
When printing hex, print ascii too. Thus if -x is also set, the
packet is printed in hex/ascii.
This is very handy for
analysing new protocols. Even if -x is not also set, some parts
of some packets may be printed in hex/ascii.
date
on
each
For example, additional fields are
packets, and SMB packets are fully
expression
selects which packets will be dumped.
If no expression is
given, all packets on the net will be dumped. Otherwise, only
packets for which expression is `true' will be dumped.
The expression consists of one or more primitives.
Primitives
usually consist of an id (name or number) preceded by one or
more qualifiers. There are three different kinds of qualifier:
type
qualifiers say what kind of thing the id name or number
refers to. Possible types are host, net and port. E.g.,
`host foo', `net 128.3', `port 20'. If there is no type
qualifier, host is assumed.
dir
qualifiers specify a particular transfer direction to
and/or from id. Possible directions are src, dst, src or
dst and src and dst. E.g., `src foo', `dst net 128.3',
`src or dst port ftp-data'. If there is no dir qualifier, src or dst is assumed. For `null' link layers
21
(i.e. point to point protocols such as slip) the inbound
and outbound qualifiers can be used to specify a desired
direction.
proto
qualifiers restrict the match to a particular protocol.
Possible protos are: ether, fddi, tr, ip, ip6, arp, rarp,
decnet, tcp and udp. E.g., `ether src foo', `arp net
128.3', `tcp port 21'. If there is no proto qualifier,
all protocols consistent with the type are assumed.
E.g., `src foo' means `(ip or arp or rarp) src foo'
(except the latter is not legal syntax), `net bar' means
`(ip or arp or rarp) net bar' and `port 53' means `(tcp
or udp) port 53'.
[`fddi' is actually an alias for `ether'; the parser treats them
identically as meaning ``the data link level used on the specified network interface.'' FDDI headers contain Ethernet-like
source and destination addresses, and often contain Ethernetlike packet types, so you can filter on these FDDI fields just
as with the analogous Ethernet fields. FDDI headers also contain other fields, but you cannot name them explicitly in a filter expression.
Similarly, `tr' is an alias for `ether'; the previous paragraph's statements about FDDI headers also apply to Token Ring
headers.]
In addition to the above, there are some special `primitive'
keywords that don't follow the pattern: gateway, broadcast,
less, greater and arithmetic expressions.
All of these are
described below.
More complex filter expressions are built up by using the words
and, or and not to combine primitives. E.g., `host foo and not
port ftp and not port ftp-data'.
To save typing, identical
qualifier lists can be omitted. E.g., `tcp dst port ftp or ftpdata or domain' is exactly the same as `tcp dst port ftp or tcp
dst port ftp-data or tcp dst port domain'.
Allowable primitives are:
dst host host
True if the IPv4/v6 destination field of the packet is
host, which may be either an address or a name.
src host host
True if the IPv4/v6 source field of the packet is host.
host host
True if either the IPv4/v6 source or destination of the
packet is host. Any of the above host expressions can be
prepended with the keywords, ip, arp, rarp, or ip6 as in:
ip host host
which is equivalent to:
ether proto \ip and host host
If host is a name with multiple IP addresses, each
address will be checked for a match.
ether dst ehost
True if the ethernet destination address is ehost. Ehost
may be either a name from /etc/ethers or a number (see
ethers(3N) for numeric format).
ether src ehost
True if the ethernet source address is ehost.
ether host ehost
True if either the ethernet source or destination address
is ehost.
gateway host
True if the packet used host as a gateway. I.e., the
ethernet source or destination address was host but neither the IP source nor the IP destination was host. Host
must be a name and must be found both by the machine's
host-name-to-IP-address resolution mechanisms (host name
file, DNS, NIS, etc.) and by the machine's host-name-to-
22
Ethernet-address
resolution
mechanism
(/etc/ethers,
etc.). (An equivalent expression is
ether host ehost and not host host
which can be used with either names or numbers for host /
ehost.)
This syntax does not work in IPv6-enabled configuration at this moment.
dst net net
True if the IPv4/v6 destination address of the packet has
a network number of net. Net may be either a name from
/etc/networks or a network number (see networks(4) for
details).
src net net
True if the IPv4/v6 source address of the packet has a
network number of net.
net net
True if either the IPv4/v6 source or destination
of the packet has a network number of net.
address
net net mask netmask
True if the IP address matches net with the specific netmask. May be qualified with src or dst. Note that this
syntax is not valid for IPv6 net.
net net/len
True if the IPv4/v6 address matches net with a netmask
len bits wide. May be qualified with src or dst.
dst port port
True if the packet is ip/tcp, ip/udp, ip6/tcp or ip6/udp
and has a destination port value of port. The port can
be a number or a name used in /etc/services (see tcp(4P)
and udp(4P)).
If a name is used, both the port number
and protocol are checked. If a number or ambiguous name
is used, only the port number is checked (e.g., dst port
513 will print both tcp/login traffic and udp/who traffic, and port domain will print both tcp/domain and
udp/domain traffic).
src port port
True if the packet has a source port value of port.
port port
True if either the source or destination port of the
packet is port. Any of the above port expressions can be
prepended with the keywords, tcp or udp, as in:
tcp src port port
which matches only tcp packets whose source port is port.
less length
True if the packet has a length less than or equal to
length. This is equivalent to:
len <= length.
greater length
True if the packet has a length greater than or equal
length. This is equivalent to:
len >= length.
to
ip proto protocol
True if the packet is an IP packet (see ip(4P)) of protocol type protocol. Protocol can be a number or one of
the names icmp, icmp6, igmp, igrp, pim, ah, esp, vrrp,
udp, or tcp. Note that the identifiers tcp, udp, and
icmp are also keywords and must be escaped via backslash
(\), which is \\ in the C-shell. Note that this primitive does not chase the protocol header chain.
ip6 proto protocol
True if the packet is an IPv6 packet of protocol type
protocol. Note that this primitive does not chase the
protocol header chain.
ip6 protochain protocol
True if the packet is IPv6 packet, and contains protocol
23
header with type protocol in its protocol header chain.
For example,
ip6 protochain 6
matches any IPv6 packet with TCP protocol header in the
protocol header chain. The packet may contain, for example, authentication header, routing header, or hop-by-hop
option header, between IPv6 header and TCP header.
The
BPF code emitted by this primitive is complex and cannot
be optimized by BPF optimizer code in tcpdump, so this
can be somewhat slow.
ip protochain protocol
Equivalent to ip6
IPv4.
protochain protocol, but this is for
ether broadcast
True if the packet is an ethernet broadcast packet.
ether keyword is optional.
The
ip broadcast
True if the packet is an IP broadcast packet. It checks
for both the all-zeroes and all-ones broadcast conventions, and looks up the local subnet mask.
ether multicast
True if the packet is an ethernet multicast packet.
ether keyword is optional.
This is shorthand
`ether[0] & 1 != 0'.
The
for
ip multicast
True if the packet is an IP multicast packet.
ip6 multicast
True if the packet is an IPv6 multicast packet.
ether proto protocol
True if the packet is of ether type protocol. Protocol
can be a number or one of the names ip, ip6, arp, rarp,
atalk, aarp, decnet, sca, lat, mopdl, moprc, iso, stp,
ipx, or netbeui. Note these identifiers are also keywords and must be escaped via backslash (\).
[In the case of FDDI (e.g., `fddi protocol arp') and
Token Ring (e.g., `tr protocol arp'), for most of those
protocols, the protocol identification comes from the
802.2 Logical Link Control (LLC) header, which is usually
layered on top of the FDDI or Token Ring header.
When filtering for most protocol identifiers on FDDI or
Token Ring, tcpdump checks only the protocol ID field of
an LLC header in so-called SNAP format with an Organizational Unit Identifier (OUI) of 0x000000, for encapsulated Ethernet; it doesn't check whether the packet is in
SNAP format with an OUI of 0x000000.
The exceptions are iso, for which it checks the DSAP
(Destination Service Access Point) and SSAP (Source Service Access Point) fields of the LLC header, stp and netbeui, where it checks the DSAP of the LLC header, and
atalk, where it checks for a SNAP-format packet with an
OUI of 0x080007 and the Appletalk etype.
In the case of Ethernet, tcpdump checks the Ethernet type
field for most of those protocols; the exceptions are
iso, sap, and netbeui, for which it checks for an 802.3
frame and then checks the LLC header as it does for FDDI
and Token Ring, atalk, where it checks both for the
Appletalk etype in an Ethernet frame and for a SNAP-format packet as it does for FDDI and Token Ring, aarp,
where it checks for the Appletalk ARP etype in either an
Ethernet frame or an 802.2 SNAP frame with an OUI of
0x000000, and ipx, where it checks for the IPX etype in
an Ethernet frame, the IPX DSAP in the LLC header, the
802.3 with no LLC header encapsulation of IPX, and the
IPX etype in a SNAP frame.]
decnet src host
24
True if the DECNET source address is host, which may be
an address of the form ``10.123'', or a DECNET host name.
[DECNET host name support is only available on Ultrix
systems that are configured to run DECNET.]
decnet dst host
True if the DECNET destination address is host.
decnet host host
True if either the DECNET source or
is host.
destination
address
ip, ip6, arp, rarp, atalk, aarp, decnet, iso, stp, ipx, netbeui
Abbreviations for:
ether proto p
where p is one of the above protocols.
lat, moprc, mopdl
Abbreviations for:
ether proto p
where p is one of the above protocols. Note that tcpdump
does not currently know how to parse these protocols.
vlan [vlan_id]
True if the packet is an IEEE 802.1Q VLAN packet.
If
[vlan_id] is specified, only true is the packet has the
specified vlan_id. Note that the first vlan keyword
encountered in expression changes the decoding offsets
for the remainder of expression on the assumption that
the packet is a VLAN packet.
tcp, udp, icmp
Abbreviations for:
ip proto p or ip6 proto p
where p is one of the above protocols.
iso proto protocol
True if the packet is an OSI packet of protocol type protocol. Protocol can be a number or one of the names
clnp, esis, or isis.
clnp, esis, isis
Abbreviations for:
iso proto p
where p is one of the above protocols. Note that tcpdump
does an incomplete job of parsing these protocols.
expr relop expr
True if the relation holds, where relop is one of >, <,
>=, <=, =, !=, and expr is an arithmetic expression composed of integer constants (expressed in standard C syntax), the normal binary operators [+, -, *, /, &, |], a
length operator, and special packet data accessors.
To
access data inside the packet, use the following syntax:
proto [ expr : size ]
Proto is one of ether, fddi, tr, ppp, slip, link, ip,
arp, rarp, tcp, udp, icmp or ip6, and indicates the protocol layer for the index operation. (ether, fddi, tr,
ppp, slip and link all refer to the link layer.)
Note
that tcp, udp and other upper-layer protocol types only
apply to IPv4, not IPv6 (this will be fixed in the
future). The byte offset, relative to the indicated protocol layer, is given by expr.
Size is optional and
indicates the number of bytes in the field of interest;
it can be either one, two, or four, and defaults to one.
The length operator, indicated by the keyword len, gives
the length of the packet.
For example, `ether[0] & 1 != 0' catches all multicast
traffic.
The expression `ip[0] & 0xf != 5' catches all
IP packets with options.
The expression `ip[6:2] &
0x1fff = 0' catches only unfragmented datagrams and frag
zero of fragmented datagrams. This check is implicitly
applied to the tcp and udp index operations.
For
instance, tcp[0] always means the first byte of the TCP
header, and never means the first byte of an intervening
fragment.
25
Some offsets and field values may be expressed as names
rather than as numeric values. The following protocol
header field offsets are available: icmptype (ICMP type
field), icmpcode (ICMP code field), and tcpflags (TCP
flags field).
The following ICMP type field values are available: icmpechoreply, icmp-unreach, icmp-sourcequench, icmp-redirect, icmp-echo, icmp-routeradvert, icmp-routersolicit,
icmp-timxceed, icmp-paramprob, icmp-tstamp, icmp-tstampreply, icmp-ireq, icmp-ireqreply, icmp-maskreq, icmpmaskreply.
The following TCP flags field values are available: tcpfin, tcp-syn, tcp-rst, tcp-push, tcp-push, tcp-ack, tcpurg.
Primitives may be combined using:
A parenthesized group of primitives and operators (parentheses are special to the Shell and must be escaped).
Negation (`!' or `not').
Concatenation (`&&' or `and').
Alternation (`||' or `or').
Negation has highest precedence. Alternation and concatenation
have equal precedence and associate left to right. Note that
explicit and tokens, not juxtaposition, are now required for
concatenation.
If an identifier is given without a keyword, the most recent
keyword is assumed. For example,
not host vs and ace
is short for
not host vs and host ace
which should not be confused with
not ( host vs or ace )
Expression arguments can be passed to tcpdump as either a single
argument or as multiple arguments, whichever is more convenient.
Generally, if the expression contains Shell metacharacters, it
is easier to pass it as a single, quoted argument. Multiple
arguments are concatenated with spaces before being parsed.
EXAMPLES
To print all packets arriving at or departing from sundown:
tcpdump host sundown
To print traffic between helios and either hot or ace:
tcpdump host helios and \( hot or ace \)
To print all IP packets between ace and any host except helios:
tcpdump ip host ace and not helios
To print all traffic between local hosts and hosts at Berkeley:
tcpdump net ucb-ether
To print all ftp traffic through internet gateway snup: (note that the
expression is quoted to prevent the shell from (mis-)interpreting the
parentheses):
tcpdump 'gateway snup and (port ftp or ftp-data)'
To print traffic neither sourced from nor destined for local hosts (if
you gateway to one other net, this stuff should never make it onto your
local net).
tcpdump ip and not net localnet
To print the start and end packets (the SYN and FIN packets) of each
TCP conversation that involves a non-local host.
tcpdump 'tcp[tcpflags] & (tcp-syn|tcp-fin) != 0 and not src and dst net
localnet'
To print IP packets longer than 576 bytes sent through gateway snup:
26
tcpdump 'gateway snup and ip[2:2] > 576'
To print IP broadcast or multicast packets that were not sent via ethernet broadcast or multicast:
tcpdump 'ether[0] & 1 = 0 and ip[16] >= 224'
To print all ICMP packets that are not echo requests/replies (i.e., not
ping packets):
tcpdump 'icmp[icmptype] != icmp-echo and icmp[icmptype] != icmp-echoreply'
OUTPUT FORMAT
The output of tcpdump is protocol dependent. The following gives a
brief description and examples of most of the formats.
Link Level Headers
If the '-e' option is given, the link level header is printed out.
On
ethernets, the source and destination addresses, protocol, and packet
length are printed.
On FDDI networks, the '-e' option causes tcpdump to print the `frame
control' field,
the source and destination addresses, and the packet
length. (The `frame control' field governs the interpretation of the
rest of the packet. Normal packets (such as those containing IP datagrams) are `async' packets, with a priority value between 0 and 7; for
example, `async4'. Such packets are assumed to contain an 802.2 Logical Link Control (LLC) packet; the LLC header is printed if it is not
an ISO datagram or a so-called SNAP packet.
On Token Ring networks, the '-e' option causes tcpdump to print the
`access control' and `frame control' fields, the source and destination
addresses, and the packet length. As on FDDI networks, packets are
assumed to contain an LLC packet.
Regardless of whether the '-e'
option is specified or not, the source routing information is printed
for source-routed packets.
(N.B.: The following description assumes familiarity with the SLIP compression algorithm described in RFC-1144.)
On SLIP links, a direction indicator (``I'' for inbound, ``O'' for outbound), packet type, and compression information are printed out.
The
packet type is printed first. The three types are ip, utcp, and ctcp.
No further link information is printed for ip packets. For TCP packets, the connection identifier is printed following the type. If the
packet is compressed, its encoded header is printed out.
The special
cases are printed out as *S+n and *SA+n, where n is the amount by which
the sequence number (or sequence number and ack) has changed. If it is
not a special case, zero or more changes are printed. A change is
indicated by U (urgent pointer), W (window), A (ack), S (sequence number), and I (packet ID), followed by a delta (+n or -n), or a new value
(=n). Finally, the amount of data in the packet and compressed header
length are printed.
For example, the following line shows an outbound compressed TCP
packet, with an implicit connection identifier; the ack has changed by
6, the sequence number by 49, and the packet ID by 6; there are 3 bytes
of data and 6 bytes of compressed header:
O ctcp * A+6 S+49 I+6 3 (6)
ARP/RARP Packets
Arp/rarp output shows the type of request and its arguments. The format is intended to be self explanatory. Here is a short sample taken
from the start of an `rlogin' from host rtsg to host csam:
arp who-has csam tell rtsg
arp reply csam is-at CSAM
The first line says that rtsg sent an arp packet asking for the ethernet address of internet host csam. Csam replies with its ethernet
address (in this example, ethernet addresses are in caps and internet
addresses in lower case).
This would look less redundant if we had done tcpdump -n:
arp who-has 128.3.254.6 tell 128.3.254.68
arp reply 128.3.254.6 is-at 02:07:01:00:01:c4
If
we had done tcpdump -e, the fact that the first packet is broadcast
27
and the second is point-to-point would be visible:
RTSG Broadcast 0806 64: arp who-has csam tell rtsg
CSAM RTSG 0806 64: arp reply csam is-at CSAM
For the first packet this says the ethernet source address is RTSG, the
destination is the ethernet broadcast address, the type field contained
hex 0806 (type ETHER_ARP) and the total length was 64 bytes.
TCP Packets
(N.B.:The following description assumes familiarity with the TCP protocol described in RFC-793. If you are not familiar with the protocol,
neither this description nor tcpdump will be of much use to you.)
The general format of a tcp protocol line is:
src > dst: flags data-seqno ack window urgent options
Src and dst are the source and destination IP addresses and ports.
Flags are some combination of S (SYN), F (FIN), P (PUSH) or R (RST) or
a single `.' (no flags). Data-seqno describes the portion of sequence
space covered by the data in this packet (see example below). Ack is
sequence number of the next data expected the other direction on this
connection.
Window is the number of bytes of receive buffer space
available the other direction on this connection. Urg indicates there
is `urgent' data in the packet. Options are tcp options enclosed in
angle brackets (e.g., <mss 1024>).
Src, dst and flags are always present. The other fields depend on the
contents of the packet's tcp protocol header and are output only if
appropriate.
Here is the opening portion of an rlogin from host rtsg to host csam.
rtsg.1023 > csam.login: S 768512:768512(0) win 4096 <mss 1024>
csam.login > rtsg.1023: S 947648:947648(0) ack 768513 win 4096 <mss 1024>
rtsg.1023 > csam.login: . ack 1 win 4096
rtsg.1023 > csam.login: P 1:2(1) ack 1 win 4096
csam.login > rtsg.1023: . ack 2 win 4096
rtsg.1023 > csam.login: P 2:21(19) ack 1 win 4096
csam.login > rtsg.1023: P 1:2(1) ack 21 win 4077
csam.login > rtsg.1023: P 2:3(1) ack 21 win 4077 urg 1
csam.login > rtsg.1023: P 3:4(1) ack 21 win 4077 urg 1
The first line says that tcp port 1023 on rtsg sent a packet to port
login on csam. The S indicates that the SYN flag was set. The packet
sequence number was 768512 and it contained no data. (The notation is
`first:last(nbytes)' which means `sequence numbers first up to but not
including last which is nbytes bytes of user data'.)
There was no
piggy-backed ack, the available receive window was 4096 bytes and there
was a max-segment-size option requesting an mss of 1024 bytes.
Csam replies with a similar packet except it includes a piggy-backed
ack for rtsg's SYN. Rtsg then acks csam's SYN. The `.' means no flags
were set. The packet contained no data so there is no data sequence
number. Note that the ack sequence number is a small integer (1). The
first time tcpdump sees a tcp `conversation', it prints the sequence
number from the packet. On subsequent packets of the conversation, the
difference between the current packet's sequence number and this initial sequence number is printed.
This means that sequence numbers
after the first can be interpreted as relative byte positions in the
conversation's data stream (with the first data byte each direction
being `1'). `-S' will override this feature, causing the original
sequence numbers to be output.
On the 6th line, rtsg sends csam 19 bytes of data (bytes 2 through 20
in the rtsg -> csam side of the conversation). The PUSH flag is set in
the packet. On the 7th line, csam says it's received data sent by rtsg
up to but not including byte 21. Most of this data is apparently sitting in the socket buffer since csam's receive window has gotten 19
bytes smaller. Csam also sends one byte of data to rtsg in this
packet.
On the 8th and 9th lines, csam sends two bytes of urgent,
pushed data to rtsg.
If the snapshot was small enough that tcpdump didn't capture the full
TCP header, it interprets as much of the header as it can and then
reports ``[|tcp]'' to indicate the remainder could not be interpreted.
If the header contains a bogus option (one with a length that's either
too small or beyond the end of the header), tcpdump reports it as
``[bad opt]'' and does not interpret any further options (since it's
impossible to tell where they start). If the header length indicates
options are present but the IP datagram length is not long enough for
28
the options to actually be there, tcpdump
length]''.
reports
it
as
``[bad
hdr
Capturing TCP packets with particular flag combinations (SYN-ACK, URGACK, etc.)
There are 8 bits in the control bits section of the TCP header:
CWR | ECE | URG | ACK | PSH | RST | SYN | FIN
Let's assume that we want to watch packets used in establishing a TCP
connection.
Recall that TCP uses a 3-way handshake protocol when it
initializes a new connection; the connection sequence with regard to
the TCP control bits is
1) Caller sends SYN
2) Recipient responds with SYN, ACK
3) Caller sends ACK
Now we're interested in capturing packets that have only the SYN bit
set (Step 1). Note that we don't want packets from step 2 (SYN-ACK),
just a plain initial SYN. What we need is a correct filter expression
for tcpdump.
Recall the structure of a TCP header without options:
0
15
31
----------------------------------------------------------------|
source port
|
destination port
|
----------------------------------------------------------------|
sequence number
|
----------------------------------------------------------------|
acknowledgment number
|
----------------------------------------------------------------| HL
| rsvd |C|E|U|A|P|R|S|F|
window size
|
----------------------------------------------------------------|
TCP checksum
|
urgent pointer
|
----------------------------------------------------------------A TCP header usually holds 20 octets of data, unless options are
present. The first line of the graph contains octets 0 - 3, the second
line shows octets 4 - 7 etc.
Starting to count with 0, the relevant TCP control bits
in octet 13:
are
contained
0
7|
15|
23|
31
----------------|---------------|---------------|---------------| HL
| rsvd |C|E|U|A|P|R|S|F|
window size
|
----------------|---------------|---------------|---------------|
| 13th octet
|
|
|
Let's have a closer look at octet no. 13:
|
|
|---------------|
|C|E|U|A|P|R|S|F|
|---------------|
|7
5
3
0|
These are the TCP control bits we are interested in. We have numbered
the bits in this octet from 0 to 7, right to left, so the PSH bit is
bit number 3, while the URG bit is number 5.
Recall that we want to capture packets with only SYN set. Let's see
what happens to octet 13 if a TCP datagram arrives with the SYN bit set
in its header:
|C|E|U|A|P|R|S|F|
|---------------|
|0 0 0 0 0 0 1 0|
|---------------|
|7 6 5 4 3 2 1 0|
Looking at the control bits section we see that only bit number 1 (SYN)
is set.
29
Assuming that octet number 13 is an 8-bit unsigned integer
byte order, the binary value of this octet is
in
network
00000010
and its decimal representation is
7
6
5
4
3
2
1
0
0*2 + 0*2 + 0*2 + 0*2 + 0*2 + 0*2 + 1*2 + 0*2 =
2
We're almost done, because now we know that if only SYN is set, the
value of the 13th octet in the TCP header, when interpreted as a 8-bit
unsigned integer in network byte order, must be exactly 2.
This relationship can be expressed as
tcp[13] == 2
We can use this expression as the filter for tcpdump in order to watch
packets which have only SYN set:
tcpdump -i xl0 tcp[13] == 2
The expression says "let the 13th octet of a TCP datagram have the decimal value 2", which is exactly what we want.
Now, let's assume that we need to capture SYN packets, but we don't
care if ACK or any other TCP control bit is set at the same time.
Let's see what happens to octet 13 when a TCP datagram with SYN-ACK set
arrives:
|C|E|U|A|P|R|S|F|
|---------------|
|0 0 0 1 0 0 1 0|
|---------------|
|7 6 5 4 3 2 1 0|
Now bits 1 and 4 are set in the 13th octet.
13 is
The binary value of
octet
00010010
which translates to decimal
7
6
5
4
3
2
1
0
0*2 + 0*2 + 0*2 + 1*2 + 0*2 + 0*2 + 1*2 + 0*2
= 18
Now we can't just use 'tcp[13] == 18' in the tcpdump filter expression,
because that would select only those packets that have SYN-ACK set, but
not those with only SYN set. Remember that we don't care if ACK or any
other control bit is set as long as SYN is set.
In order to achieve our goal, we need to logically AND the binary value
of octet 13 with some other value to preserve the SYN bit. We know
that we want SYN to be set in any case, so we'll logically AND the
value in the 13th octet with the binary value of a SYN:
AND
=
00010010 SYN-ACK
00000010 (we want SYN)
-------00000010
AND
=
00000010 SYN
00000010 (we want SYN)
-------00000010
We see that this AND operation delivers the same result regardless
whether ACK or another TCP control bit is set. The decimal representation of the AND value as well as the result of this operation is 2
(binary 00000010), so we know that for packets with SYN set the following relation must hold true:
( ( value of octet 13 ) AND ( 2 ) ) == ( 2 )
This points us to the tcpdump filter expression
tcpdump -i xl0 'tcp[13] & 2 == 2'
Note that you should use single quotes or a backslash in the expression
to hide the AND ('&') special character from the shell.
UDP Packets
UDP format is illustrated by this rwho packet:
30
actinide.who > broadcast.who: udp 84
This says that port who on host actinide sent a udp datagram to port
who on host broadcast, the Internet broadcast address. The packet contained 84 bytes of user data.
Some UDP services are recognized (from the source or destination port
number) and the higher level protocol information printed. In particular, Domain Name service requests (RFC-1034/1035) and Sun RPC calls
(RFC-1050) to NFS.
UDP Name Server Requests
(N.B.:The following description assumes familiarity with the Domain
Service protocol described in RFC-1035. If you are not familiar with
the protocol, the following description will appear to be written in
greek.)
Name server requests are formatted as
src > dst: id op? flags qtype qclass name (len)
h2opolo.1538 > helios.domain: 3+ A? ucbvax.berkeley.edu. (37)
Host h2opolo asked the domain server on helios for an address record
(qtype=A) associated with the name ucbvax.berkeley.edu. The query id
was `3'. The `+' indicates the recursion desired flag was set.
The
query length was 37 bytes, not including the UDP and IP protocol headers. The query operation was the normal one, Query, so the op field
was omitted.
If the op had been anything else, it would have been
printed between the `3' and the `+'. Similarly, the qclass was the
normal one, C_IN, and omitted.
Any other qclass would have been
printed immediately after the `A'.
A few anomalies are checked and may result in extra fields enclosed in
square brackets:
If a query contains an answer, authority records or
additional records section, ancount, nscount, or arcount are printed as
`[na]', `[nn]' or `[nau]' where n is the appropriate count. If any of
the response bits are set (AA, RA or rcode) or any of the `must be
zero' bits are set in bytes two and three, `[b2&3=x]' is printed, where
x is the hex value of header bytes two and three.
UDP Name Server Responses
Name server responses are formatted as
src > dst: id op rcode flags a/n/au type class data (len)
helios.domain > h2opolo.1538: 3 3/3/7 A 128.32.137.3 (273)
helios.domain > h2opolo.1537: 2 NXDomain* 0/1/0 (97)
In the first example, helios responds to query id 3 from h2opolo with 3
answer records, 3 name server records and 7 additional records. The
first answer record is type A (address) and its data is internet
address 128.32.137.3.
The total size of the response was 273 bytes,
excluding UDP and IP headers. The op (Query) and response code (NoError) were omitted, as was the class (C_IN) of the A record.
In the second example, helios responds to query 2 with a response code
of non-existent domain (NXDomain) with no answers, one name server and
no authority records. The `*' indicates that the authoritative answer
bit was set. Since there were no answers, no type, class or data were
printed.
Other flag characters that might appear are `-' (recursion available,
RA, not set) and `|' (truncated message, TC, set). If the `question'
section doesn't contain exactly one entry, `[nq]' is printed.
Note that name server requests and responses tend to be large and the
default snaplen of 68 bytes may not capture enough of the packet to
print.
Use the -s flag to increase the snaplen if you need to seriously investigate name server traffic. `-s 128' has worked well for
me.
SMB/CIFS decoding
tcpdump now includes fairly extensive SMB/CIFS/NBT decoding for data on
UDP/137, UDP/138 and TCP/139. Some primitive decoding of IPX and NetBEUI SMB data is also done.
By default a fairly minimal decode is done, with a much more detailed
decode done if -v is used. Be warned that with -v a single SMB packet
may take up a page or more, so only use -v if you really want all the
gory details.
31
If you are decoding SMB sessions containing unicode strings then you
may wish to set the environment variable USE_UNICODE to 1. A patch to
auto-detect unicode srings would be welcome.
For information on SMB packet formats and what all te fields mean see
www.cifs.org or the pub/samba/specs/ directory on your favourite
samba.org mirror site. The SMB patches were written by Andrew Tridgell
([email protected]).
NFS Requests and Replies
Sun NFS (Network File System) requests and replies are printed as:
src.xid > dst.nfs: len op args
src.nfs > dst.xid: reply stat len op results
sushi.6709 > wrl.nfs: 112 readlink fh 21,24/10.73165
wrl.nfs > sushi.6709: reply ok 40 readlink "../var"
sushi.201b > wrl.nfs:
144 lookup fh 9,74/4096.6878 "xcolors"
wrl.nfs > sushi.201b:
reply ok 128 lookup fh 9,74/4134.3150
In the first line, host sushi sends a transaction with id 6709 to wrl
(note that the number following the src host is a transaction id, not
the source port). The request was 112 bytes, excluding the UDP and IP
headers. The operation was a readlink (read symbolic link) on file
handle (fh) 21,24/10.731657119. (If one is lucky, as in this case, the
file handle can be interpreted as a major,minor device number pair,
followed by the inode number and generation number.) Wrl replies `ok'
with the contents of the link.
In the third line, sushi asks wrl to lookup the name `xcolors' in
directory file 9,74/4096.6878. Note that the data printed depends on
the operation type. The format is intended to be self explanatory if
read in conjunction with an NFS protocol spec.
If the -v (verbose) flag is given, additional information is printed.
For example:
sushi.1372a > wrl.nfs:
148 read fh 21,11/12.195 8192 bytes @ 24576
wrl.nfs > sushi.1372a:
reply ok 1472 read REG 100664 ids 417/0 sz 29388
(-v also prints the IP header TTL, ID, length, and fragmentation
fields, which have been omitted from this example.) In the first line,
sushi asks wrl to read 8192 bytes from file 21,11/12.195, at byte offset 24576.
Wrl replies `ok'; the packet shown on the second line is
the first fragment of the reply, and hence is only 1472 bytes long (the
other bytes will follow in subsequent fragments, but these fragments do
not have NFS or even UDP headers and so might not be printed, depending
on the filter expression used). Because the -v flag is given, some of
the file attributes (which are returned in addition to the file data)
are printed: the file type (``REG'', for regular file), the file mode
(in octal), the uid and gid, and the file size.
If the -v flag is given more than once, even more details are
printed.
Note that NFS requests are very large and much of the detail won't be
printed unless snaplen is increased. Try using `-s 192' to watch NFS
traffic.
NFS reply packets do not explicitly identify the RPC operation.
Instead, tcpdump keeps track of ``recent'' requests, and matches them
to the replies using the transaction ID. If a reply does not closely
follow the corresponding request, it might not be parsable.
AFS Requests and Replies
Transarc AFS (Andrew File System) requests and replies are printed as:
src.sport > dst.dport: rx packet-type
src.sport > dst.dport: rx packet-type service call call-name args
src.sport > dst.dport: rx packet-type service reply call-name args
elvis.7001 > pike.afsfs:
rx data fs call rename old fid 536876964/1/1 ".newsrc.new"
new fid 536876964/1/1 ".newsrc"
32
pike.afsfs > elvis.7001: rx data fs reply rename
In the first line, host elvis sends a RX packet to pike. This was a RX
data packet to the fs (fileserver) service, and is the start of an RPC
call. The RPC call was a rename, with the old directory file id of
536876964/1/1 and an old filename of `.newsrc.new', and a new directory
file id of 536876964/1/1 and a new filename of `.newsrc'.
The host
pike responds with a RPC reply to the rename call (which was successful, because it was a data packet and not an abort packet).
In general, all AFS RPCs are decoded at least by RPC call name.
Most
AFS RPCs have at least some of the arguments decoded (generally only
the `interesting' arguments, for some definition of interesting).
The format is intended to be self-describing, but it will probably not
be useful to people who are not familiar with the workings of AFS and
RX.
If the -v (verbose) flag is given twice, acknowledgement packets and
additional header information is printed, such as the the RX call ID,
call number, sequence number, serial number, and the RX packet flags.
If the -v flag is given twice, additional information is printed, such
as the the RX call ID, serial number, and the RX packet flags. The MTU
negotiation information is also printed from RX ack packets.
If the -v flag is given three times, the security index and service
are printed.
id
Error codes are printed for abort packets, with the exception of Ubik
beacon packets (because abort packets are used to signify a yes vote
for the Ubik protocol).
Note that AFS requests are very large and many of the arguments won't
be printed unless snaplen is increased. Try using `-s 256' to watch
AFS traffic.
AFS reply packets do not explicitly identify the RPC operation.
Instead, tcpdump keeps track of ``recent'' requests, and matches them
to the replies using the call number and service ID. If a reply does
not closely follow the corresponding request, it might not be parsable.
KIP Appletalk (DDP in UDP)
Appletalk DDP packets encapsulated in UDP datagrams are de-encapsulated
and dumped as DDP packets (i.e., all the UDP header information is discarded).
The file /etc/atalk.names is used to translate appletalk net
and node numbers to names. Lines in this file have the form
number
name
1.254
ether
16.1
icsd-net
1.254.110 ace
The first two lines give the names of appletalk networks.
The third
line gives the name of a particular host (a host is distinguished from
a net by the 3rd octet in the number - a net number must have two
octets and a host number must have three octets.) The number and name
should be
separated
by
whitespace
(blanks
or
tabs).
The
/etc/atalk.names file may contain blank lines or comment lines (lines
starting with a `#').
Appletalk addresses are printed in the form
net.host.port
144.1.209.2 > icsd-net.112.220
office.2 > icsd-net.112.220
jssmag.149.235 > icsd-net.2
(If the /etc/atalk.names doesn't exist or doesn't contain an entry for
some appletalk host/net number, addresses are printed in numeric form.)
In the first example, NBP (DDP port 2) on net 144.1 node 209 is sending
to whatever is listening on port 220 of net icsd node 112. The second
line is the same except the full name of the source node is known
(`office').
The third line is a send from port 235 on net jssmag node
149 to broadcast on the icsd-net NBP port (note that the broadcast
address (255) is indicated by a net name with no host number - for this
reason it's a good idea to keep node names and net names distinct in
/etc/atalk.names).
33
NBP (name binding protocol) and ATP (Appletalk transaction protocol)
packets have their contents interpreted. Other protocols just dump the
protocol name (or number if no name is registered for the protocol) and
packet size.
NBP packets are formatted like the following examples:
icsd-net.112.220 > jssmag.2: nbp-lkup 190: "=:LaserWriter@*"
jssmag.209.2 > icsd-net.112.220: nbp-reply 190: "RM1140:LaserWriter@*" 250
techpit.2 > icsd-net.112.220: nbp-reply 190: "techpit:LaserWriter@*" 186
The first line is a name lookup request for laserwriters sent by net
icsd host 112 and broadcast on net jssmag. The nbp id for the lookup
is 190. The second line shows a reply for this request (note that it
has the same id) from host jssmag.209 saying that it has a laserwriter
resource named "RM1140" registered on port 250.
The third line is
another reply to the same request saying host techpit has laserwriter
"techpit" registered on port 186.
ATP packet formatting is demonstrated by the following example:
jssmag.209.165 > helios.132: atp-req 12266<0-7> 0xae030001
helios.132 > jssmag.209.165: atp-resp 12266:0 (512) 0xae040000
helios.132 > jssmag.209.165: atp-resp 12266:1 (512) 0xae040000
helios.132 > jssmag.209.165: atp-resp 12266:2 (512) 0xae040000
helios.132 > jssmag.209.165: atp-resp 12266:3 (512) 0xae040000
helios.132 > jssmag.209.165: atp-resp 12266:4 (512) 0xae040000
helios.132 > jssmag.209.165: atp-resp 12266:5 (512) 0xae040000
helios.132 > jssmag.209.165: atp-resp 12266:6 (512) 0xae040000
helios.132 > jssmag.209.165: atp-resp*12266:7 (512) 0xae040000
jssmag.209.165 > helios.132: atp-req 12266<3,5> 0xae030001
helios.132 > jssmag.209.165: atp-resp 12266:3 (512) 0xae040000
helios.132 > jssmag.209.165: atp-resp 12266:5 (512) 0xae040000
jssmag.209.165 > helios.132: atp-rel 12266<0-7> 0xae030001
jssmag.209.133 > helios.132: atp-req* 12267<0-7> 0xae030002
Jssmag.209 initiates transaction id 12266 with host helios by requesting up to 8 packets (the `<0-7>'). The hex number at the end of the
line is the value of the `userdata' field in the request.
Helios responds with 8 512-byte packets. The `:digit' following the
transaction id gives the packet sequence number in the transaction and
the number in parens is the amount of data in the packet, excluding the
atp header. The `*' on packet 7 indicates that the EOM bit was set.
Jssmag.209 then requests that packets 3 & 5 be retransmitted. Helios
resends them then jssmag.209 releases the transaction.
Finally, jssmag.209 initiates the next request. The `*' on the request indicates
that XO (`exactly once') was not set.
IP Fragmentation
Fragmented Internet datagrams are printed as
(frag id:size@offset+)
(frag id:size@offset)
(The first form indicates there are more fragments.
cates this is the last fragment.)
The
second
indi-
Id is the fragment id. Size is the fragment size (in bytes) excluding
the IP header. Offset is this fragment's offset (in bytes) in the
original datagram.
The fragment information is output for each fragment. The first fragment contains the higher level protocol header and the frag info is
printed after the protocol info. Fragments after the first contain no
higher level protocol header and the frag info is printed after the
source and destination addresses. For example, here is part of an ftp
from arizona.edu to lbl-rtsg.arpa over a CSNET connection that doesn't
appear to handle 576 byte datagrams:
arizona.ftp-data > rtsg.1170: . 1024:1332(308) ack 1 win 4096 (frag 595a:328@0+)
arizona > rtsg: (frag 595a:204@328)
rtsg.1170 > arizona.ftp-data: . ack 1536 win 2560
There are a couple of things to note here: First, addresses in the 2nd
line don't include port numbers. This is because the TCP protocol
information is all in the first fragment and we have no idea what the
port or sequence numbers are when we print the later fragments.
Second, the tcp sequence information in the first line is printed as if
there were 308 bytes of user data when, in fact, there are 512 bytes
(308 in the first frag and 204 in the second). If you are looking for
holes in the sequence space or trying to match up acks with packets,
this can fool you.
34
A packet
(DF).
with
the
IP
don't fragment flag is marked with a trailing
Timestamps
By default, all output lines are preceded by a timestamp.
The timestamp is the current clock time in the form
hh:mm:ss.frac
and is as accurate as the kernel's clock. The timestamp reflects the
time the kernel first saw the packet. No attempt is made to account
for the time lag between when the ethernet interface removed the packet
from the wire and when the kernel serviced the `new packet' interrupt.
SEE ALSO
traffic(1C), nit(4P), bpf(4), pcap(3)
AUTHORS
The original authors are:
Van Jacobson, Craig Leres and Steven McCanne, all of the Lawrence
Berkeley National Laboratory, University of California, Berkeley, CA.
It is currently being maintained by tcpdump.org.
The current version is available via http:
http://www.tcpdump.org/
The original distribution is available via anonymous ftp:
ftp://ftp.ee.lbl.gov/tcpdump.tar.Z
IPv6/IPsec support is added by WIDE/KAME project.
This program
Eric Young's SSLeay library, under specific configuration.
uses
35
NGREP
NGREP(8)
NAME
User Manuals
NGREP(8)
ngrep - network grep
SYNOPSIS
ngrep <-hNXViwqpevxlDtTRM> <-IO pcap_dump > < -n num > < -d dev > < -A
num > < -s snaplen > < -S limitlen > < -W normal|byline|single|none > <
-c cols > < -P char > < -F file > < match expression > < bpf filter >
DESCRIPTION
ngrep strives to provide most of GNU grep’s common features, applying
them to the network layer. ngrep is a pcap-aware tool that will allow
you to specify extended regular expressions to match against data payloads of packets. It currently recognizes TCP, UDP and ICMP across
Ethernet, PPP, SLIP, FDDI and null interfaces, and understands bpf filter logic in the same fashion as more common packet sniffing tools,
such as tcpdump(8) and snoop(1).
OPTIONS
-h
Display help/usage information.
-N
Show sub-protocol number along with single-character identifier
(useful when observing raw or unknown protocols).
-X
Treat the match expression as a hexadecimal
explanation of match expression below.
-V
Display version information.
-i
Ignore case for the regex expression.
-w
Match the regex expression as a word.
-q
Be quiet; don’t output any information other than packet headers
and their payloads (if relevant).
-p
Don’t put the interface into promiscuous mode.
-e
Show empty packets.
Normally empty packets are discarded
because they have no payload to search. If specified, empty
packets will be shown, regardless of the specified regex expression.
-v
Invert the match; only display packets that don’t match.
-x
Dump packet contents as hexadecimal as well as ASCII.
-l
Make stdout line buffered.
-D
When reading pcap_dump files, replay them at their recorded time
intervals (mimic realtime).
-t
Print a timestamp in the form
everytime a packet is matched.
of
string.
YYYY/MM/DD
See
the
HH:MM:SS.UUUUUU
36
-T
Print a timestamp in the form of +S.UUUUUU, indicating the delta
between packet matches.
-R
Do not try to drop privileges to the DROPPRIVS_USER.
ngrep makes no effort to validate input from live or offline
sources as it is focused more on performance and handling large
amounts of data than protocol correctness, which is most often a
fair assumption to make. However, sometimes it matters and thus
as a rule ngrep will try to be defensive and drop any root privileges it might have.
There exist scenarios where this behaviour can become an obstacle, so this option is provided to end-users who want to disable
this feature, but must do so with an understanding of the risks.
Packets can be randomly malformed or even specifically designed
to overflow sniffers and take control of them, and revoking root
privileges is currently the only risk mitigation ngrep employs
against such an attack. Use this option and turn it off at your
own risk.
-c cols
Explicitly set the console width to ‘‘cols’’. Note that this is
the console width, and not the full width of what ngrep prints
out as payloads; depending on the output mode ngrep may print
less than ‘‘cols’’ bytes per line (indentation).
-F file
Read in the bpf filter from the specified filename. This is a
compatibility option for users familiar with tcpdump.
Please
note that specifying ‘‘-F’’ will override any bpf filter specified on the command-line.
-P char
Specify an alternate character to signify non-printable
ters when displayed. The default is ‘‘.’’.
charac-
-W normal|byline|single|none
Specify an alternate manner for displaying packets, when not in
hexadecimal mode. The ‘‘byline’’ mode honors embedded linefeeds, wrapping text only when a linefeed is encountered. The
‘‘none’’ mode doesn’t wrap under any circumstance (entire payload is displayed on one line). The ‘‘single’’ mode is conceptually the same as ‘‘none’’, except that everything including IP
and source/destination header information is all on one line.
‘‘normal’’ is the default mode and is only included for completeness. This option is incompatible with ‘‘-x’’.
-s snaplen
Set the bpf caplen to snaplen (default 65536).
-S limitlen
Set the upper limit on the size of packets that ngrep will look
at. Useful for looking at only the first N bytes of packets
without changing the BPF snaplen.
-I pcap_dump
Input file pcap_dump into ngrep. Works with any pcap-compatible
dump file format. This option is useful for searching for a
wide range of different patterns over the same packet stream.
-O pcap_dump
Output matched packets to a pcap-compatible dump file.
feature does not interfere with normal output to stdout.
This
37
-n num Match only num packets total, then exit.
-d dev By default ngrep will select a default interface to listen
Use this option to force ngrep to listen on interface dev.
on.
-A num Dump num packets of trailing context after matching a packet.
-W normal|byline|none
Alter the method by which ngrep displays packet payload. ‘‘normal’’ mode represents the standard
behaviour,
‘‘byline’’
instructs ngrep to respect embedded linefeeds (useful for
observing HTTP transactions, for instance), and ‘‘none’’ results
in the payload on one single line (useful for scripted processing of ngrep output).
-c cols
Ignore the detected terminal width and force the column width to
the specified size.
-P char
Change the non-printable character from the default ‘‘.’’ to the
character specified.
match expression
A match expression is either an extended regular expression, or
if the -X option is specified, a string signifying a hexadecimal
value. An extended regular expression follows the rules as
implemented by the GNU regex library. Hexadecimal expressions
can optionally be preceded by ‘0x’. E.g., ‘DEADBEEF’, ‘0xDEADBEEF’.
bpf filter
Selects a filter that specifies what packets will be dumped. If
no bpf filter is given, all IP packets seen on the selected
interface will be dumped. Otherwise, only packets for which bpf
filter is ‘true’ will be dumped.
The bpf filter consists of one or more primitives. Primitives usually
consist of an id (name or number) preceded by one or more qualifiers.
There are three different kinds of qualifier:
type
qualifiers say what kind of thing the id name or number refers
to. Possible types are host, net and port. E.g., ‘host blort’,
‘net 1.2.3’, ‘port 80’. If there is no type qualifier, host is
assumed.
dir
qualifiers specify a particular transfer direction to and/or
from id. Possible directions are src, dst, src or dst and src
and dst.
E.g., ‘src foo’, ‘dst net 1.2.3’, ‘src or dst port
ftp-data’. If there is no dir qualifier, src or dst is assumed.
For ‘null’ link layers (i.e. point to point protocols such as
slip) the inbound and outbound qualifiers can be used to specify
a desired direction.
proto
qualifiers are restricted to ip-only protocols. Possible protos
are: tcp , udp and icmp. e.g., ‘udp src foo’ or ‘tcp port 21’.
If there is no proto qualifier, all protocols consistent with
the type are assumed. E.g., ‘src foo’ means ‘ip and ((tcp or
udp) src foo)’, ‘net bar’ means ‘ip and (net bar)’, and ‘port
53’ means ‘ip and ((tcp or udp) port 53)’.
In addition to the above, there are some special ‘primitive’ keywords
that don’t follow the pattern: gateway, broadcast, less, greater and
arithmetic expressions. All of these are described below.
More complex filter expressions are built up by using the words and, or
and not to combine primitives. E.g., ‘host blort and not port ftp and
not port ftp-data’. To save typing, identical qualifier lists can be
omitted. E.g., ‘tcp dst port ftp or ftp-data or domain’ is exactly the
same as ‘tcp dst port ftp or tcp dst port ftp-data or tcp dst port
38
domain’.
Allowable primitives are:
dst host host
True if the IP destination field of the packet is host, which
may be either an address or a name.
src host host
True if the IP source field of the packet is host.
host host
True if either the IP source or destination of the packet is
host.
Any of the above host expressions can be prepended with
the keywords, ip, arp, or rarp as in:
ip host host
which is equivalent to:
ether dst ehost
True if the ethernet destination address is ehost. Ehost may be
either a name from /etc/ethers or a number (see ethers(3N) for
numeric format).
ether src ehost
True if the ethernet source address is ehost.
ether host ehost
True if either the ethernet source
ehost.
or
destination
address
is
gateway host
True if the packet used host as a gateway. I.e., the ethernet
source or destination address was host but neither the IP source
nor the IP destination was host. Host must be a name and must
be found in both /etc/hosts and /etc/ethers.
(An equivalent
expression is
ether host ehost and not host host
which can be used with either names or numbers for host /
ehost.)
dst net net
True if the IP destination address of the packet has a network
number of net. Net may be either a name from /etc/networks or a
network number (see networks(4) for details).
src net net
True if the IP source address of the packet has a network number
of net.
net net
True if either the IP source or destination address of the
packet has a network number of net.
net net mask mask
True if the IP address matches net with
May be qualified with src or dst.
the
specific
netmask.
net net/len
True if the IP address matches net a netmask len bits wide.
be qualified with src or dst.
May
dst port port
True if the packet is ip/tcp or ip/udp and has a destination
port value of port. The port can be a number or a name used in
/etc/services (see tcp(4P) and udp(4P)). If a name is used,
39
both the port number and protocol are checked. If a number or
ambiguous name is used, only the port number is checked (e.g.,
dst port 513 will print both tcp/login traffic and udp/who traffic, and port domain will print both tcp/domain and udp/domain
traffic).
src port port
True if the packet has a source port value of port.
port port
True if either the source or destination port of the packet is
port. Any of the above port expressions can be prepended with
the keywords, tcp or udp, as in:
tcp src port port
which matches only tcp packets whose source port is port.
less length
True if the packet has a length less than or equal to length.
This is equivalent to:
len <= length.
greater length
True if the packet has a length greater than or equal to length.
This is equivalent to:
len >= length.
ip proto protocol
True if the packet is an ip packet (see ip(4P)) of protocol type
protocol. Protocol can be a number or one of the names tcp, udp
or icmp.
Note that the identifiers tcp and udp are also keywords and must be escaped via backslash (\), which is \\ in the
C-shell.
ip broadcast
True if the packet is an IP broadcast packet. It checks for
both the all-zeroes and all-ones broadcast conventions, and
looks up the local subnet mask.
ip multicast
True if the packet is an IP multicast packet.
ip
Abbreviation for:
ether proto ip
tcp, udp, icmp
Abbreviations for:
ip proto p
where p is one of the above protocols.
expr relop expr
True if the relation holds, where relop is one of >, <, >=, <=,
=, !=, and expr is an arithmetic expression composed of integer
constants (expressed in standard C syntax), the normal binary
operators [+, -, *, /, &, |], a length operator, and special
packet data accessors.
To access data inside the packet, use
the following syntax:
proto [ expr : size ]
Proto is one of ip, tcp, udp or icmp, and indicates the protocol
layer for the index operation. The byte offset, relative to the
indicated protocol layer, is given by expr.
Size is optional
and indicates the number of bytes in the field of interest; it
can be either one, two, or four, and defaults to one.
The
length operator, indicated by the keyword len, gives the length
of the packet.
For example, ‘ether[0] & 1 != 0’ catches all multicast traffic.
The expression ‘ip[0] & 0xf != 5’ catches all IP packets with
options. The expression ‘ip[6:2] & 0x1fff = 0’ catches only
unfragmented datagrams and frag zero of fragmented datagrams.
40
This check is implicitly applied to the tcp and udp index operations.
For instance, tcp[0] always means the first byte of the
TCP header, and never means the first byte of an intervening
fragment.
Primitives may be combined using:
A parenthesized group of primitives and operators (parentheses
are special to the Shell and must be escaped).
Negation (‘!’ or ‘not’).
Concatenation (‘&&’ or ‘and’).
Alternation (‘||’ or ‘or’).
Negation has highest precedence. Alternation and concatenation have
equal precedence and associate left to right. Note that explicit and
tokens, not juxtaposition, are now required for concatenation.
If an identifier is given without a keyword, the most recent keyword is
assumed. For example,
not host vs and ace
is short for
not host vs and host ace
which should not be confused with
not ( host vs or ace )
Expression arguments can be passed to ngrep as either a single argument
or as multiple arguments, whichever is more convenient. Generally, if
the expression contains Shell metacharacters, it is easier to pass it
as a single, quoted argument. Multiple arguments are concatenated with
spaces before being parsed.
DIAGNOSTICS
Errors from ngrep, libpcap, and the GNU regex library are all output to
stderr.
AUTHOR
Written by Jordan Ritter <[email protected]>.
REPORTING BUGS
Please report bugs to the ngrep’s Sourceforge Bug Tracker, located at
http://sourceforge.net/projects/ngrep/
Non-bug, non-feature-request general feedback should
author directly by email.
*nux
June 2005
be
sent
to
the
NGREP(8)
41