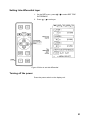
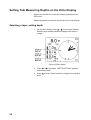
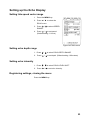
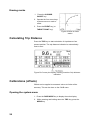
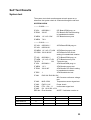
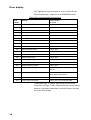
1
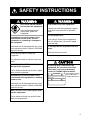
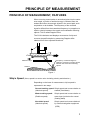
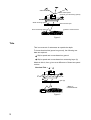
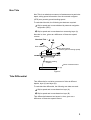
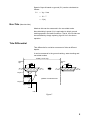
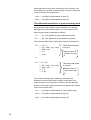
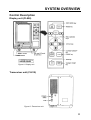
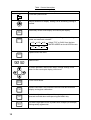
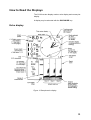
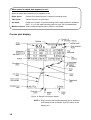
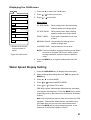
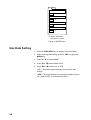
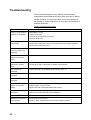
DOPPLER SONAR CURRENT INDICATOR CI-80 C Yo u r L o c a l A g e n t / D e a l e r 9-52, Ashihara-cho, Nishinomiya, Japan Te l e p h o n e : Te l e f a x : 0 7 9 8 - 6 5 - 2 111 0798-65-4200 All rights reserved. Printed in Japan PUB. No. OME-72390 (DAMI) CI-80 FIRST EDITION F : : FEB. 1995 JAN. 6, 2001 SAFETY INSTRUCTIONS WARNING ELECTRICAL SHOCK HAZARD WARNING Keep heater away from equipment. Do not open the equipment. Only qualified personnel should work inside the equipment. Immediately turn off the power at the switchboard if water leaks into the equipment or something is dropped in the equipment. Continued use of the equipment can cause fire or electrical shock. Contact a FURUNO agent for service. Do not disassemble or modify the equipment. Fire, electrical shock or serious injury can result. Do not place liquid-filled containers on the top of the equipment. Fire or electrical shock can result if a liquid spills into the equipment. A heater can melt the equipment’s power cord, which can cause fire or electrical shock. Use the proper fuse. Fuse rating is shown on the equipment. Use of a wrong fuse can result in equipment damage. Do not operate the equipment with wet hands. Electrical shock can result. CAUTION A warning label is attached to the equipment. Do not remove the label. If the label is missing or damaged, contact a FURUNO agent or dealer. WARNING Immediately turn off the power at the switchboard if the equipment is emitting smoke or fire. To avoid electrical shock, do not remove cover. No user-serviceable parts inside. Name: Warning Label (1) Type: 86-003-1011-0 Code No.: 100-236-230 Continued use of the equipment can cause fire or electrical shock. Contact a FURUNO agent for service. Make sure no rain or water splash leaks into the equipment. Fire or electrical shock can result if water leaks in the equipment. i Table of Contents PRINCIPLE OF MEASUREMENT................................................................................ 1 PRINCIPLE OF MEASUREMENT, FEATURES.................................................................................. 1 TIDE, NAV-TIDE & TIDE DIFFERENTIAL .......................................................................................... 4 IMPORTANT NOTICE ON TIDE MEASUREMENTS.......................................................................... 8 Features ............................................................................................................................................ 10 SYSTEM OVERVIEW ..................................................................................................11 Control Description............................................................................................................................ 11 How to Read the Displays ................................................................................................................. 13 MAIN MENU DESCRIPTION...................................................................................... 16 DEP Menu ......................................................................................................................................... 16 ECHO Menu ...................................................................................................................................... 17 TRK Menu ......................................................................................................................................... 17 MARK Menu ...................................................................................................................................... 18 AVR Menu ......................................................................................................................................... 18 OPERATION............................................................................................................... 19 Basic Operating Procedure ............................................................................................................... 19 Setting Tide Measuring Depths on the Echo Display........................................................................ 22 Setting up the Echo Display .............................................................................................................. 23 Setting up the Course Plot Display ................................................................................................... 24 Marks ............................................................................................................................................... 25 Calculating Trip Distance................................................................................................................... 26 Calibrations (offsets) ......................................................................................................................... 26 Water Speed Display Setting............................................................................................................. 27 Nav Data Setting ............................................................................................................................... 28 MAINTENANCE & TROUBLESHOOTING................................................................. 29 Preventive Maintenance.................................................................................................................... 29 Troubleshooting................................................................................................................................. 30 Self Tests, Demonstration Display..................................................................................................... 31 Self Test Results................................................................................................................................ 33 MENU TREE............................................................................................................... 36 SPECIFICATIONS .................................................................................................. SP-1 ii PRINCIPLE OF MEASUREMENT PRINCIPLE OF MEASUREMENT, FEATURES When a moving vessel emits an acoustical pulse into the water at an angle, a portion of emitted energy is reflected from the seabed and other microscopic objects in the sound path, such as plankton or air bubbles. The frequency of the received signal is shifted from the transmitted frequency in proportion to relative velocity between the vessel and underwater reflecting objects. This is called Doppler Effect. The CI-80 calculates and displays movements of ship and currents at specific depths by measuring Doppler shifts obtained from three separate directions. Frequency of reflected signal is shifted in proportion to relative speed between the vessel and reflecting objects. Planktonic layer Seabed Figure 1 Ship’s Speed (Here, speed is a vector value including velocity and direction.) Depending on the base of measurement, ship’s speed is expressed in two ways: Ground tracking speed: Ship’s speed and course relative to (Absolute speed) seabed (fixed base) Water tracking speed: (Relative speed) Ship’s speed and course relative to water layer just below the vessel (floating base) Nav-aided speed: (Absolute speed) Ship’s speed and course obtained by external navigation equipment (GPS) 1 GPS satellites Nav-aided speed (Pseudo ground tracking speed) Water tracking speed Near-surface layer :Base of measurement Ground tracking speed Fixed Figure 2 Tide Tide is movement of watermass at a particular depth. To know absolute tide (speed on ground), the following two data are required: 1 Ship’s speed and course based on ground 2 Ship’s speed and course based on measuring layer (A) Absolute tide is, then, given as a difference of these two speed vectors. Absolute Tide = 1 – 2 2 Layer (A) 1 :Base of measurement Fixed Figure 3 2 Nav Tide Nav-Tide is an absolute movement of watermass at a particular depth, taking speed information from the external navigator (GPS) as a pseudo ground tracking speed. To calculate Nav-tide, the following two data are required: 1 Ship’s speed and course obtained by external navigation equipment (GPS) 2 Ship’s speed and course based on measuring layer (A) Nav-tide is, then, given as a difference of these two speed vectors. Absolute Tide = 1 – 2 GPS satellites 1 2 Nav-aided speed (Pseudo ground tracking speed) Water tracking speed :Base of measurement Layer (A) Figure 4 Tide Differential Tide differential is a relative movement of tides at different depths, layer (A) and layer (B). To calculate tide differential, the following two data are used: 1 Ship’s speed and course based on layer (A) 2 Ship’s speed and course based on layer (B) Tide differential between two layers is, then, given as a difference of these two speed vectors. 3 Tide Difference = 1 - 2 (Movement of layer B based on layer A) or = 2 - 1 (Movement of layer A based on layer B) 1 Layer (A) 2 Layer (B) :Base of measurement Figure 5 TIDE, NAV-TIDE & TIDE DIFFERENTIAL Tide (Absolute tide) Absolute tide can be measured in the ground tracking mode. 10 NM (1 hour trip) Start of trip End of trip (Moving at 10 kt on ground) Layer A 1 (Moving at 3 kt on ground) 2 :Base of measurement Fixed Figure 6 Assume that the ship and layer A are moving in the same direction, and ship’s speeds based on ground (Vg) and on layer A (Vwa) are measured as; Vg = 10 kt (Ship’s speed based on ground) Vwa = 4 7 kt (Ship’s speed based on layer A). Speed of layer A based on ground (C1) can be calculated as follows: C1 = Vg – Vwa = 10 – 7 = 3 (kt) Nav-Tide (Absolute tide) Absolute tide can be measured in the nav-aided mode. Nav-aided ship’s speed (Vn) is equivalent to ship’s ground tracking speed in the ideal conditions. That is, the nav-tide can be calculated by simply replacing Vg with Vn in the above equation. Tide Differential Tide differential is a relative movement of tides at different depths. It can be measured in the ground tracking, water tracking and nav-aided modes. 10 NM (1 hour trip) Start of trip Layer A End of trip 2 3 (Moving) :Base of measurement Layer B (Moving) 2 kt 5 kt Figure 7 5 Assuming that the ship, layer A and layer B are moving in the same direction, and ship’s speeds based on layer A (Vwa) and on layer B (Vwb) are measured as; Vwa = 8 kt (Ship’s speed based on layer A) Vwb = 5 kt (Ship’s speed based on layer B) Tide differential calculations in ground tracking mode As an absolute ship’s speed (Vg) is available in the ground tracking mode, tide speeds of layer A (C1) and layer B (C2) based on ground are calculated as follows: C1 = Vg - Vwa (Speed of layer A based on ground) C2 = Vg - Vwb (Speed of layer B based on ground) Thus, the tide differential (Cd) between layer A and layer B is; Cd = = = = = C2 - C1 (Vg - Vwb) - (Vg - Vwa) Vwa - Vwb 8-5 3 (kt) Tide differential based on layer A = = = = = C1 - C2 (Vg - Vwa) - (Vg - Vwb) Vwb - Vwa 5-8 -3 (kt) Tide differential based on layer B Speed of layer B viewed from layer A or Cd Speed of layer A viewed from layer B In the water tracking mode, watermass just below the transducer (near-surface layer) is taken as the base of all measurements (virtual ground). Therefore, the ship and tide speeds in the water tracking mode are not absolute but relative to this near-surface layer. Vw = 9 kt (Ship’s speed based on near-surface layer) Vwa = 8 kt (Ship’s speed based on layer A) Vwb = 5 kt (Ship’s speed based on layer B) 6 10 NM (1 hour trip) Start of trip Nearsurface layer 1 2 Layer A End of trip 3 :Base of measurement Layer B Assume that the ship and all measuring layers are moving in the same direction, but at different speeds. 1 kt 2 kt 5 kt Figure 8 7 [READ THIS FIRST!!] IMPORTANT NOTICE ON TIDE MEASUREMENTS (In the nav-aided mode, tide accuracy depends heavily on gyro accuracy.) SETTING SHIP’S HEADING The CI-80 has the nav-aided mode to measure absolute tides even in deep waters where ground tracking is unattainable. To achieve reliable measurements, however, you must supply accurate heading (gyro) information and ship’s position (or speed/course) data to the CI-80. If you are going to use the nav-aided mode, set the reading of the AD converter (gyro interface) exactly with that of the master gyrocompass. Procedure 1. Confirm that the gyrocompass has settled and all the necessary compensations (latitude compensation, weather compensation, etc.) are made correctly. 2. Operate the AD converter to obtain the same reading as you read on the master gyrocompass. (Do not make adjustment while the ship is turning.) Master Gyrocompass AD Converter (Gyro Interface) Figure 9 If the gyro reading is accurate, the CI-80 should provide accurate tide information. If the gyro data contains some error, however, you may see the following symptoms. • • 8 Set/drift information on the nav-aided mode differs from that on the ground-tracking mode. Tide/tide differential information on the nav-aided mode differs from that on the ground-tracking mode. 10 0 10 10 20 20 0 10 20 20 1° -3° 0.2 kt 0.5 kt GT Mode NAV Mode GT Mode NAV Mode Figure 10 9 Features The CI-80 mainly consists of three units: a display unit, a transceiver unit, and a transducer, each compact enough to fit on small boats. The main features of the CI-80 are; • • • • • • • • • 10 Even in deep waters where ground (bottom) reference is not available acoustically, the CI-80 can provide absolute movements of measuring layers by receiving position (or speed) data from GPS navigator and heading data from gyro compass. It may be used on deep sea fishing boats or on ocean research vessels. Triple-beam system for automatic compensation against pitching and rolling of vessel. Single mold transducer for excellent mechanical beaming accuracy. DC powered for economic operation. Alphanumeric information display on high resolution 10 inch color CRT. Simultaneous display of tide vectors and ship’s track. Indispensable for maneuvering and docking. Echo level display constantly displays underwater conditions of three sounding beams. Target point feature predicts flow of objects (for example, fishing tackle) against tide. Easy-to-follow menu operation for control of various settings and measuring conditions. SYSTEM OVERVIEW Control Description Display unit (CI-800) Figure 11 Display unit Transceiver unit (CI-810) Figure 12 Transceiver unit 11 Table 1 Control description Control Description Turns the system on/off. ON OFF Adjusts brilliance of display. Setting can be locked by pushing in control. 0 10 BRLL Alternately selects echo display and course plot display. DISP MODE MODE Selects tracking mode among ground tracking, water tracking, nav aided and automatic selection. (G) (W) (A) (G) (N) (A) Select "T/D" or "NAV" from the item WATER SPEED on the SYSTEM menu. Opens/closes the menu. MENU Select menu. In menu operation, select menu items; change settings; enter data. On the course plot display, shift cursor. CURSOR ON/OFF EVENT TRIP TARGET POINT 12 Turns cursor on/off. Enters event mark. Also activates self tests and demonstration display and register calibrations. Calculates trip distance. Also enables system menu, when pressed and held down while pressing the MENU key. Inscribes target point mark, to predict flow of object (for example, fishing tackle) against tide. How to Read the Displays The CI-80 has two display modes: echo display and course plot display. A display may be selected with the DISP MODE key. Echo display Figure 13 Sample echo display 13 When speed or depth data appears in red… Speed or depth data containing error appears in red. Ships speed Cannot find reference echo in respective tracking mode. Tide speed Cannot find echo in given layer. Set depth Depth set is invalid. In ground tracking mode, depth should be shallower than 7 m, or in the water tracking mode no more 3/4 of seabed depth. Measured speed When measured speed (tide or ship's) is unreliable. Course plot display Figure 14 Sample course plot display NOTE 1: Ship's course and heading displays can be switched with display mode as follows, by a DIP switch in the display unit. 14 NOTE 2: Ship's speed and course displays are update every three seconds, in the default setting. They can be updated every second. For details, consult your dealer. 15 MAIN MENU DESCRIPTION Most major functions of the CI-80 are carried out through an easy-to-follow menu system. The menu system consists of two main groups of menus: main (operation) and system (testing, calibration). This chapter covers the main menu. For complete menu tree, see page 36. Basic Menu Operation Most major functions of the CI-80 are carried out through an easy-to-follow menu system. Two general types of menus are used: main (operation) and system (testing). Opening/closing the menu: Press the MENU key. Selecting menus: Press ◄ / ►. Selecting menu items: Press / . Selecting menu options, changing settings: Press / . DEP Menu This menu sets both the measuring depths for three layers and the reference layer for tide differential calculation. LAYER 1, LAYER 2, LAYER 3: Depth for measuring layers 1, 2 and 3 can be set between 2 and 250 meters, in resolution of one meter. REF TIDE DIFFERENCE: Selects tide layer to be used reference layer in tide differential calculation. NOTE: The depth of each layer may be set as you like; layer number does not necessarily correspond to depth in ascending order. Figure 15 DEP menu 16 ECHO Menu Sets up the echo display. SPEED RANGE: Sets length of tide speed vector between 0.1 and 15.0 knots, in resolution of 0.1 knots. ECHO DEPTH RANGE: Sets echo depth range. Depth can be set either manually between 50 and 300 meters in resolution of 50 meters or automatically. In AUTO, seabed depth is automatically selected as depth range. ECHO LEVEL SHIFT: Sets echo intensity level, between 1 and 100 in resolution of 1. The higher the figure the stronger the echo level. NOTE: ECHO LEVEL SHIFT is not related to amplifier gain; it does not affect detection of tide speed or ship’s speed. Figure 16 ECHO menu TRK Menu Sets up the course plot display. PLOT RANGE: Sets latitude and longitude range of course plot, between 0.1 and 5.0 miles in resolution of 0.1 mile. PLOT MODE: You may select either Head-up (bow at top of display) or North-up (North at top of display) orientation. TRACK DISPLAY: Turn on/off trackline display. Figure 17 TRK menu 17 MARK Menu This menu sets measuring conditions for tide vector and target point mark. PRESET REFERENCE VALUE: Sets the effect of tide on the target point mark. The higher the figure, the greater the effect of tide. TIDE HISTORY: Sets tide vector plotting interval, among 0 (turns off tide vector display), 15 sec. (1/4 min.), 1 min., 5 min., 10 min., 30 min., and 60 min. Figure 18 MARK menu AVR Menu The AVR (Averaging) sets averaging time for measuring raw speed, tide and water tracking data, to smooth out random variation of data. SHIP SPD AVR: Raw speed data (from connected sensor) may change randomly due to receiving conditions, etc. If speed data varies greatly increase speed averaging. Speed averaging is available in times of 15 sec., 30 sec., 60 sec., and 90 sec. The default setting is 15 sec., which is suitable for most conditions. Figure 19 AVR menu TIDE AVERAGE: Direction and speed of a tide changes with time, place and depth. Therefore it is important that the current indicator not respond to quickly or too slowly to tide movement. Tide averaging time is available between 0 and 5 minutes in the nearest minute. (“0” is for use of raw tide data.) In most cases “2 min.” provides excellent results. Too high a setting may prevent detection of rapid changes in tide movement, such as a current rip. WT SPD DEPTH: Sets measuring depth of water speed in the water tracking mode. The default setting is two meters, and it is suitable for most conditions. Change the setting when water tracking speed display becomes unstable (due to air bubbles, etc.), or to measure water tracking speed at a given depth. 18 OPERATION Basic Operating Procedure Turning on the system 1. Turn on the transceiver unit. 2. Turn on the display unit. 3. Adjust brilliance of display. The display unit conducts a check of the system, displaying the results about 40 seconds after turning on the power. Figure 20 Display unit and transceiver unit Selecting operating mode Press the MODE key to select operating mode among water tracking, ground tracking, or automatic selection. Selected mode appears at top right corner on the display. N: Nav Figure 21 Location of operating mode indication on echo display 19 Ground Tracking Mode: Shows absolute ship and tide movements based on ground. (Bottom echo required.) Water Tracking Mode: Shows movements of ship and tide relative to near-surface water. Nav-aided Mode: Shows ship’s movement measured by the external navigation equipment, and the tide movements based on the nav speed data. Auto Tracking Mode: Uses ground tracking mode when bottom echo is available. Switches to water tracking mode (or nav-aided mode) when bottom echo is lost. Bottom echo is continuously searched for, and if re-acquired the ground tracking mode is restored. Setting measuring depths 1. Press the MENU key. 2. Press ◄ / ► to select DEP menu. 3. Press / to select layer. 4. Press / to set depth. 5. Repeat steps 1-4 to set other layers. Note that measuring depth can also be set on the echo display. See next page for further details. 20 Setting tide differential layer 1. On the DEP menu, press DIFFERENCE. 2. Press / / to select REF TIDE to set layer. Figure 22 How to set tide differential Turning off the power Press the power switch on the display unit. 21 Setting Tide Measuring Depths on the Echo Display Earlier you learned how to set tide measuring depths on the DEP menu. Measuring depths can also be set directly on the echo display. Selecting a layer, setting depth 1. On the echo display, press / to select layer desired. Selected layer’s depth indication changes from white to orange. Figure 23 Echo display 2. Press / to set depth. “DEPTH SETTING” appears while setting depth. 3. Press white. 22 to finish. Depth indications change from orange to Setting up the Echo Display Setting tide speed vector range 1. Press the MENU key. 2. Press ◄ / ► to select the ECHO menu. 3. Press / RANGE. to select SPEED 4. Press / to set speed. (Default setting: 1.0 knot) Figure 24 ECHO menu Setting echo depth range 1. Press / to select ECHO DEPTH RANGE. 2. Press / to set depth. (Default setting: 100 meters) 1. Press / to select ECHO LEVEL SHIFT. 2. Press / to set echo intensity. Setting echo intensity Registering settings, closing the menu Press the MENU key. 23 Setting up the Course Plot Display The course plot display mainly plots ship’s track. It can be displayed by pressing the DISP MODE key. Figure 25 Sample course plot display, TRK menu Setting the plot range 1. Press the MENU key. 2. Press ◄ / ► to select the TRK menu. 3. Press / to select PLOT RANGE. 4. Press / to set plot range. 1. Press / to PLOT MODE. 2. Press / to select HU (Head-up) or NU (North-up). Setting plot orientation Setting tide vector plotting interval 1. Press ◄ / ► to select the MARK menu. 2. Press / to select TIDE HISTORY. / 3. Press interval. 24 to set plotting Figure 26 MARK menu Marks The CI-80 has two types of marks which can be inscribed on the display: event mark and target point mark. Figure 27 Appearance of event mark and target point mark Event mark The EVENT key inscribes present position on the display. It is useful for marking important locations, etc. 25 event marks may be entered. When the event mark memory is full the oldest event mark is erased to make room for the latest. Target point mark The TARGET POINT key inscribes a target point mark on the display. The target point mark is useful for estimating 3-D deformation of fishing tackle (net, etc.) by the effect of tides at different depths. 25 target point marks can be entered. When the target point mark memory is full the oldest target point mark is erased to make room for the latest. Tide effect can be set on the MARK menu. 25 Erasing marks 1. Press the CURSOR ON/OFF key. 2. Operate the four arrow keys to place cursor on mark to erase. 3. Press the EVENT key (or TARGET POINT key). Figure 28 How to erase marks Calculating Trip Distance Press the TRIP key to start calculation of trip distance from present position. The trip distance indication is automatically reset to zero. Figure 29 Course plot display, showing location of trip distance indication Calibrations (offsets) Offsets can be applied to measured values to further refine accuracy. This can be done on the CALB menu. Opening the system menu 1. Press the DISP MODE key to display the echo display. 2. While pressing and holding down the TRIP key, press the MENU key. 26 Displaying the CALB menu MODE 1. Press ◄ / ► to select the CALB menu. CALB GT SPD CALIB 2. Press / to select menu item. 0.0 3. Press / to set offset. % [-12.8~12.7] WT SPD CALIB 0.0 % [-12.8~12.7] DRAFT LEVEL 0.0 m ° ° Raise setting when ground tracking speed is slower than ship’s speed. WT SPD CALIB: Raise setting when water tracking speed is slower than ship’s speed. DRAFT LEVEL: Enter depth of transducer from sea surface. [-12.8~12.7] COURSE CALIB 0.0 GT SPD CALIB: [0.0~50.0] BEARING CALIB 0.0 Menu items *1 [-12.8~12.7] *1: Shown when current (tide) processor is active. Figure 30 CALB menu BEARING CALIB: Compensate for bearing error in relation to ship’s bow. COURSE CALIB: Compensate for course error. NOTE: If course indication by ground tracking mode differs from that of navigator (GPS) even with a correct bearing calibration, enter the course calibration angle. 4. Press the MENU key to register settings and close the menu. Water Speed Display Setting 1. Press the DISP MODE key to display the echo display. 2. While pressing and holding down the TRIP key press the MENU key. 3. Press ◄ / ► to select MODE. 4. Press or to select WATER SPEED. 5. Press or to select T/D or NAV. T/D: Ship’s speed, tide and tide differential are calculated from doppler shift frequency. Press the MODE key to select measuring mode, in the sequence of G(Ground), W(Water), A(Auto). NAV: Ship’s speed and position data are fed from the GPS navigator. Tide and tide differential are calculated using GPS data when the ground echo cannot be detected. Press the MODE key to select measuring mode, in the sequence of G(Ground), N(Nav), A(Auto). 27 MODE CALB SELF TEST OFF SYS ECHO PNL DEMONSTRATION OFF ON WATER SPEED T/D NAV NAV DATA SPD *1 *1 L/L *1: Shown when tide processor is active. Figure 31 MODE menu Nav Data Setting 1. Press the DISP MODE key to display the echo display. 2. While pressing and holding down the TRIP key press the MENU key. 3. Press ◄ / ► to select MODE. 4. Press or to select NAV DATA. 5. Press or to select L/L or SPD. “L/L”: Calculates speed internally from position data change. “SPD”: Takes speed data from external navigator as they are. (Select “SPD” if connected with GPS.) 28 MAINTENANCE & TROUBLESHOOTING Preventive Maintenance Regular checks • • • • Regular maintenance is important for continued performance. Check the following on a monthly basis. Check that all connectors and cables are securely tightened. Check grounding systems of units for corrosion. Also regularly measure voltage to confirm that it is within prescribed rating. Cleaning of units Display unit/ transceiver unit Accumulated dirt can be wiped off with a soft cloth. If necessary, a mild detergent diluted in water may be used. Chemical cleaners should not be used to clean any unit; they can remove paint and markings. Transducer unit Barnacles and other marine life adhering to the transducer face can cause a considerable drop in performance. Check the transducer face regularly for marine life and clean if necessary. The transducer should never be painted. 29 Troubleshooting The troubleshooting table which follows provides simple troubleshooting procedures which the user may use to restore normal operation. If normal operation cannot be restored, do not attempt to check inside any unit. Any repair is best left to a qualified technician. Table 2 Troubleshooting table If… Then… power is on but nothing appears on the display • adjust BRILL control. • check power cable. • check for loosened power connector. • check for blown fuse. nothing appears on the echo display • check that transceiver unit is turned on. • check power cable and connector on transceiver unit for tight connection. • check fuse on transceiver unit. echo display is normal but echo or tide is not displayed • check interconnection cable between transceiver unit and display unit. color is distorted or display is too bright/ dark • adjust BRILL control. certain colors are abnormal or picture jumps • check for magnets near display unit. tide vector is not displayed • “TIDE HISTORY” on the MARK menu may be set to “0”. no echoes are displayed • “ECHO LEVEL SHIFT” on the ECHO menu may be set too narrow. If ship’s track is not displayed • “TRACK DISPLAY” on the TRK menu may be turned off. seabed does not appear on the echo display • “ECHO DEPTH RANGE” on the ECHO menu is set too shallow. Set to suitable depth, or select AUTO. echo display is interrupted • vessel is in heavy seas or passing over wake of another vessel. tide data is unstable • “TIDE AVERAGE” on the AVR menu may be set to “0”. interference is present on the display • check ground for corrosion. 30 • try turning off and on the power to restore normal picture. • depth is beyond measurable depth (300 meters). • marine life may be adhering to the transducer. • cables of other equipment may be too near transducer cable. Self Tests, Demonstration Display The CI-80 has four self tests and a demonstration display which check the system for proper operation. Display the system menu 1. Press the DISP MODE key to select the echo display. 2. While pressing and holding down the TRIP key, press the MENU key. Conducting self tests MODE 1. Press ◄ / ► to select the MODE menu. CALB SELF TEST 2. Press / to select SELF TEST OFF SYS ECHO PNL 3. Press / to select test. DEMONSTRATION OFF WATER SPEED T/D *1 SYS: Conducts general check of all circuit boards. ECHO: Checks receiver and transmitter. NAV NAV DATA SPD Self test menu description ON *1 L/L PNL: Checks key and switches of display unit. 4. Press the EVENT key to start test. 5. Press the MENU key when test is completed. *1: Shown when tide processor is active. To quit the self test, Select “SELF TEST-OFF” on the MODE menu and press the EVENT key. Figure 32 MODE menu 31 Starting the demonstration display MODE CALB OFF SYS ECHO PNL The demonstration display checks the controls on the display unit and conducts a loopback test between the display unit and the transceiver unit. DEMONSTRATION 1. Press / OFF 2. Press to select ON. SELF TEST ON WATER SPEED T/D SPD *1 3. Press the EVENT key. *1 The echo display appears and the demonstration begins. "DEMO DATA OUTPUTTING” appears while the demonstration display is on. All data shown is for purpose of demonstration; it is not actual data. NAV NAV DATA L/L *1: Shown when tide processor is active. Figure 33 MODE menu 32 to select DEMONSTRATION. To quit the demonstration display, select “DEMONSTRATIONOFF” on the MODE menu and press the EVENT key. Self Test Results System test The system test check results appear at each power on or whenever the system check is conducted though the self test. SYSTEM CHECK ---------CI-800--------IP VOL IP DSW 66503001** “00 00” IP MEM IP MEM 1 2 3 4 5 6 OK 789 ICP Board ROM prog. no. IPU Board’s DIP switch setting in hexadecimal notation ICP Board memory test ---------CI-810--------CP VOL CP VOL CP MEM CP DSW 66503101** JCPA Board ROM prog no. 66503110** 1 2 3 4 5 6 7 8 OK JCPA Board memory test “00 00 00 00” JCPA Board’s DIP switch setting in hexadecimal notation FT VOL 66503201** JFTA Board ROM prog. no. FT NEM 1 2 3 4 5 6 7 OK JFTA Board memory test. TX DEV 1 OK TX device test. IF VOL 66500401** JIFA Board ROM prog no. IF MEM 1 2 3 JIFA Board memory test IF DSW “00 00 00” JIFA Board’s DIP switch setting in hexadecimal notation IF DEV 1 JIFA Board device test IF AN1 RU3 00V RL2.00V OK AD Converter reference voltage test IF AN2 MLD 2.50V Temperature sensor signal test IF AN3 PWR 1.01V Power check IF AN4 PTH…RLL…V Inclinometer signal test IF AN5 IS1 1.01V IS2 1.01V ERR No. Error Number NOTE: **indicates version no. Test ICP JCPA JFTA JIFA Prog. ROM test 5 6 1 1 Data ROM test 6 1-5, 7-8 2-7 2-3 Memory test 1-4, 7-9 33 Error display “OK” appears for normal memory IC test. For fault NG (No Good) and asterisk (*) appear next to ROM/RAM number. Table 3 Error number display and meaning Error number Reason Circuit board to check 000 Input voltage JCPA, JIFA 001 Overheated transducer element JLGA, JCPA, JIFA* 002 Abnormal Tx B voltage STXA, UPW, JCPA 003 Tx voltage of beam 1 JCPA, STXA 004 Tx voltage of beam 2 JCPA, STXA 005 Tx voltage of beam 3 JCPA, STXA 006 Tx current of beam 1 JCPA, STXA 007 Tx current of beam 2 JCPA, STXA 008 Tx current of beam 3 JCPA, STXA 100 External position data JCPA, JIFA 101 External speed data JCPA, JIFA 102 External time data JCPA, JIFA 103 External depth data JCPA, JIFA 104 Heading data JCPA, JIFA 105 Heading error angle JCPA, JIFA 106 Water temperature data JCPA, JIFA 200 External KP input interval JCPA, JIFA, abnormal external KP interval 201 Depth sensor input JLGA, JCPA, JIFA, faulty temperature sensor 202 Inclinometer roll signal JCPA, JIFA, no inclinometer data 203 Inclinometer pitch signal JCPA, JIFA, no inclinometer data * Abnormally high Tx voltage, abnormally low transducer impedance, too high Tx duty, faulty temperature sensor (faulty element), high water temperature, and other factors may also cause this error display. 34 Echo test Checking echo display intensity Press the right and left arrow keys. The SHIFT indication should change with key operation, between 0 and 100. Checking echo display range Press the up and down arrow keys. The echo display range should in steps of 50 between 0 and 300. Figure 34 Sample echo test display Panel test Press each key on the control panel one by one. The pressed key’s corresponding “0” on the display should change to “1”. Figure 35 Panel test display 35 MENU TREE MAIN MENU SYSTEM MENU DEP LAYER1 LAYER2 LAYER3 REF TIDE DIFFERENCE ECHO SPEED RANGE ECHO DEPTH RANGE ECHO LEVEL SHIFT TRK PLOT RANGE PLOT MODE TRACK DISPLAY MARK PRESET REFERENCE VALUE TIDE HISTORY AVR SHIP SPD AVR TIDE AVERAGE WT SPD DEPTH MODE SELF TEST OFF SYS ECHO PANEL DEMONSTRATION OFF ON WATER SPEED T/D NAV NAV DATA SPD L/L CALIB 36 GT SPD CALIB WT SPD CALIB DRAFT LEVEL BEARING CALIB COURSE CALIB SPECIFICATIONS OF CI-80 1. General (1) Ground tracking acquirable depth (2) Measurable tide range (3) Measurable tide depth (4) Measurable ship's speed (5) Measurable tide speed (6) Tide differential range (7) Measuring accuracy (8) Number of beams (9) Transmitting frequency (10) Display type 2. Display (1) Common displays (2) Course plot display (3) Echo display (4) Other 3. Input/Output Signal (1) Input signal (2) Output signal 4. (1) (2) 5. DOPPLER SONAR CURRENT INDICATOR 3m-200m (measure able range 300m) 2m-100m, or 75% of depth, whichever is shallower 10m (measurable from 7m) Fore/aft: +30kts to –10kts, Port/starboard: +9.9kts to –9.9kts 0kts to 9.9kts –9.9kts to +9.9kts Ship’s speed: ±1 (1% +0.1kt), Tide speed: (±2% +0.1kt) Three (tilt angle 60° each beam) 288kHz 10-inch color CRT Speed, heading: Tide speed, direction: Track display: Tide vector: Target point mark: Event mark: Ship’s position: Orientation: Trip distance indication: Tide vector: Tide differential: layers Video sounder: Self test: demonstration: Calibration facilities Range selection Object flow prediction 360 degree or 32 compass points Three layers DR, max. 1000 pts. Three layers, max. 1000 pts. 25 pts. 25 pts. Latitude, longitude Head-up (true motion), North-up Provided Three layers, circular graph Three layers, measurement between two Three directions All circuit boards, controls With internal data Compass signal (heading): AD-100 format KP (2 circuits): Photo isolation (current loop) CIF/NMEA 0183: Position data Log signal: 200/400 pulses, contact signal KP signal: TTL CIF/NMEA 0183: Speed, tide CI-7000 format signal Environmental Conditions Useable temperature 0°C to 45°C Relative humidity 85% Power Supply & Power Consumption Main’s input 11-40VDC, less than 120W avg., or 100/110/115/220/230VAC, 1φ, 50/60Hz (rectifier required) SP-1