1
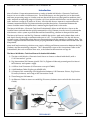
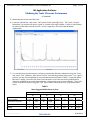
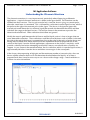
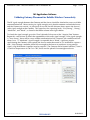
Instruction Guide for Using
the Massa M3 Wireless Ultrasonic
Tank Level Sensor Evaluation Kit
PRELIMINARY
10-20-11
Instruction Guide – Massa M3 Wireless Sensor Evaluation Kit
Page 1 of 14
Introduction
Massa Products Corporation manufactures a family of Model M3 Wireless Ultrasonic Tank Level
Sensors for use in tanks of different sizes. The M3/150 Sensors are designed for use in short tanks
and have an operating range of 4 inches to 8 feet; the M3/95 Sensor are designed for medium sized
tanks and have an operating range of 12 inches to 13 feet; and the M3/50 Sensors are designed for tall
tanks and have a range of 14 inches to 35 feet. All of the M3 Sensors operate in conjunction with
Gateways manufactured by Digi International to provide the wireless connection between the
sensors and the central computer that is monitoring the liquid levels in the tanks.
The Massa M3 Wireless Ultrasonic Tank Level Evaluation Kit allows an M3 Wireless Sensor to be
installed into a tank and then be quickly connected to a Digi Gateway in order to easily evaluate the
effectiveness of the system to provide the tank level monitoring solution for that particular tank.
The Massa M3 Sensors and the Digi Gateway establish the wireless path and to obtain data such as
tank levels directly through a communication port of a PC. To extend battery life, the M3 Sensors
normally enter a Sleep Mode when they not communicating with the gateway or collecting data. The
sensors supplied with the Evaluation Kit are preprogrammed to always be awake and do not enter the
Sleep Mode.
Many tank level monitoring solutions may require utilizing an Ethernet connection between the Digi
Gateways and the monitoring computer. This is beyond the scope of this Instruction Guide or the
Evaluation Kit, but such a solution does exist, as described in the overview on Page 10.
The Massa M3 Wireless Tank Level Sensor Evaluation Kit includes:
1) The Massa M3 Wireless Ultrasonic Level Sensor or Sensors ordered with the Kit, with a
2” NPS nut and a 2” gasket.
2) Digi International X4 Gateway (p/n X4-Z11-E-A, Zigbee to Ethernet) preconfigured for Massa’s
M3 Software, and a power supply.
3) A USB to Serial Converter (USConverters.com p/n UT8801).
4) A Null Modem Cable (Digikey p/n AE9879-ND).
5) A Compact Disk containing: a) M3 Application Software, USB Converter Drivers, Digi Device
Discovery Software, and a copy of this Instruction Guide.
6) Three Energizer L91 batteries.
7) An Ethernet Cable for future use with Digi Discovery Software (not used with this Instruction
Guide).
M3 Kit Guide 111017.docx
PRELIMINARY
10-20-2011
Instruction Guide – Massa M3 Wireless Sensor Evaluation Kit
Page 2 of 14
Getting Started
1) Obtain the USB to Serial Converter but don’t plug it into the USB port until you run
“setup.exe” from the supplied USB Converter Disk. Once setup has been completed, plug
the converter into a USB port on the PC and install the USB software when the “Hardware
Wizard” is displayed (automatic selection). If a comm port number assignment is indicated,
record this for use with the M3 Software (see below).
2) Locate the M3 Software CD, and under the M3 Software directory, unzip the M3 zip file onto
the PC (make sure to select “Use Folder Names” when unzipping). Execute “M3.application”
and allow it to set up this program for use on your PC.
3) Connect one end of the Null Modem Cable to the USB Converter and the other end to the
Gateway’s 9 pin D-connector serial port input.
4) Attach the Gateway’s antenna, and then connect the Gateway Power Supply by turning the
bayonet connector so that it locks. The Gateway is preconfigured to autostart and run Massa’s
Python Code for use with the M3 Application Software. It takes about a minute every time to
power up the Gateway before it to be ready to detect a Sensor (the Zigbee link light will be
“ON” when ready).
5) Install the 3 AA batteries into the M3 Sensor in the direction indicated in the battery holder.
The Sensor’s green LED will blink 3 times followed by the red LED staying on for up to 50
seconds while the Sensor searches for the Gateway. Once the Sensor is commissioned to the
Gateway (wirelessly connected), then the Sensor’s red LED will blink every 2 seconds.
6) With the Sensor’s red LED blinking every 2 seconds, execute the M3 Application Software.
Under the drop down menu, got to “View” and then to “Program Settings”, and find the Serial
Communications Port menu. If you know the comm port assignment, select it from the menu,
otherwise it must be found by an iterative process. First select a “port 2”. Next, click on
“Search for Sensors” to determine if the M3 Sensor has been located. If the Sensor is found,
all its parameters will be uploaded. If the Sensor is not found, select the next comm port and
run “Search for Sensors” again. Continue this process until the Sensor is located.
7) Once the Sensor has been located, continue with this Instruction Guide.
Notes:
a) If the Gateway is turned off, the Sensor will enter a 1 minute “Sleep Mode” while it searches
for Gateway. Once the Gateway has powered up, it will take several Sensor “Wake-up”
periods to reestablish communications (indicated by the LED blinking every 2 seconds).
b) If the sensor is not found, re-start the process from the beginning. If it still cannot be found,
the Sensor may be out of radio range, so move the Gateway closer to the Sensor and try again.
c) If it is necessary to restart the Sensor manually, first remove one battery, press the
“Commission” pushbutton on the Sensor, and then reinstall the battery.
d) Sensors are designed to enter a “Sleep Mode” when not operating to extend battery life.
Because the Sensors in the Evaluation Kits do not enter the “Sleep Mode”, the battery life will
only last 2-3 months.
M3 Kit Guide 111017.docx
PRELIMINARY
10-20-2011
Instruction Guide – Massa M3 Wireless Sensor Evaluation Kit
Page 3 of 14
M3 Application Software
Validating the Tanks Ultrasonic Performance
This section of the Instruction Guide describes how to evaluate the ultrasonic signals being
measured in the tank, to ensure reliable level measurement. The M3 Software allows access to
sensor status information which reports distance to the liquid surface, air temperature, radio signal
strength, battery voltage, and other status information. The M3 Software also will record the signal
magnitudes vs. time of the ringing caused by the ultrasonic transmit pulse and the echoes reflected
from the targets around the sound path within the tank. This feature can be used to analyze and
determine if signals are sufficient in the application and if there are any issues that may exist, such as
unwanted reflections (see the “Understanding the Ultrasonic Waveform” section).
1) If not already running, start the M3 Application Software (Step 2 on the Page 2).
2) The first time the M3 application software is used, the comm port that connects the USB
converter must be selected. From the dropdown menu, go to “View” and select “Program
Settings”. Go to the “Serial Communications Port” menu, select a comm port, and then click
“OK”, then go to “Search for Sensors”. If the Sensor is not found, go back and select another
comm port and repeat. Once the Sensor is found, all of its settings will be uploaded.
3) When the sensor is found, it will be in the “On-Line
Sensor List”, as shown in the figure on the right.
Check the “Shown” box.
4) Point Sensor at a target such as the ceiling. Click the “Data” tab and then click the “Acquire
Data, Don’t Store” button to measure the distance to the target. Other information will also
be displayed, as shown in the figure below. Clicking on “Acquire Data, Store” performs the
same operation, but also assigns an event number that will be stored in the Sensor.
M3 Kit Guide 111017.docx
PRELIMINARY
10-20-2011
Page 4 of 14
Instruction Guide – Massa M3 Wireless Sensor Evaluation Kit
M3 Application Software
Validating the Tanks Ultrasonic Performance
(Continued)
5) Mount the M3 Sensor onto the tank.
6) From the “Waveform” tab, select “10 Transmit Cycles and high Gain”. Then click “Acquire
Waveform” to view the ultrasonic signal, as shown in the figure below. It takes a few minutes
to collect all the data from the Sensor. For best operation, close all other Windows
applications.
7) To save the ultrasonic waveforms and status information that were obtained using the “Data”
tab, select “File” and then “Save Sensor to File” from the drop down menu items. It is a good
practice for any new installation to save each waveform indicated in Table 1, especially when
the tank is empty, since this will show if any obstacles exist in the ultrasonic path that may
interfere in obtaining accurate measurements (see the next page for more details). These files
can be recalled for review using the “File” then “Recall Sensor from File” drop down menu
items.
TABLE 1
Some Suggested Waveforms to Save
Waveforms
Sensor Model
#1
Transmit
Cycles
Gain
#2
Transmit
Cycles
Gain
#3
Transmit
Cycles
Gain
#4
Transmit
Cycles
Gain
M3/150 and M3/150is
1
low
10
High
-
-
-
-
M3/95 and M3/95is
1
low
10
low
10
high
20
high
M3/50
4
low
1
low
10
low
10
high
M3 Kit Guide 111017.docx
PRELIMINARY
10-20-2011
Instruction Guide – Massa M3 Wireless Sensor Evaluation Kit
Page 5 of 14
M3 Application Software
Understanding the Ultrasonic Waveform
The ultrasonic waveform is a very important tool, particularly when diagnosing problematic
applications. A typical ultrasonic waveform is shown in the figure below. The waveform can be
divided into three sections. The first pulse on the left is from the Sensor’s ping, or transmit pulse,
when the sound wave is transmitted. This is followed by a reflection from the liquid surface, which is
the pulse to the right of the transmit pulse in the figure. The Sensor is designed to ignore the
transmit pulse and detect the first reflected signal that exceeds the detection threshold, and then
calculates the range to the liquid surface. The red line shown in the waveform represents the
detection threshold level. Other reflections that follow are ignored.
Ideally the acoustic path between the M3 Sensor and the liquid surface is clear of targets that can
cause detectable reflections. These reflections could be caused by items such as ladders in the tank,
the side of the tank if the Sensor is mounted too close to the edge of the tank, or by the Sensor not
having been installed level, which would cause the sound beam to not be perpendicular to the
surface of the liquid. In more difficult applications, adjustments to the Sensor’s sensitivity could
provide a solution, but before attempting to utilize this feature, consult with Massa Products for
support. As you shown in the waveform below, the first reflection, which is from the liquid surface, is
approximately 60 inches from the Sensor and there are no targets in the sound path.
If the Sensor, when operating at high gain and the maximum number of transmit cycles, does not
have a reliable reflection that crosses the detection threshold when the liquid is at its lowest
expected level, then it may be necessary to use a Sensor with a longer range. Consult with Massa
Products for more information.
M3 Kit Guide 111017.docx
PRELIMINARY
10-20-2011
Instruction Guide – Massa M3 Wireless Sensor Evaluation Kit
Page 6 of 14
M3 Application Software
Automatic Sensor Data Collection
Collecting the measurements taken by the Sensor over a period
of time can be performed automatically using the M3 Software’s
“AutoSend Monitor” tab. The Sensor can be configured to
automatically send data by clicking the “Settings and Info” tab
and entering the desired values as shown in the figure to the
right. In this example, the data collection interval has been set to
3600 seconds (1 hour). After entering the desired settings, click
“OK” to program them into the Sensor.
Select “AutoSend Monitor” menu item and the
screen shown in the figure on the right will
appear. Click on “Edit File Path” if you prefer
another location to save the file other than the
default path. To start saving data to file, click the
“Save Data to File “box. The numbers occurring in
the “Bytes Received” box indicate incoming data.
The data is stored as a spreadsheet, file type (.csv),
as is shown in the figure below. Each “AutoSend”
message will contain up to 8 historical blocks of
data. In this example, the Event numbers are in
one hour increments with the highest Event
number being the latest data acquired.
Note:
A range of 510 inches represents a cleared record.
Example of Auto Send Messages Saved to an Excel File
M3 Kit Guide 111017.docx
PRELIMINARY
10-20-2011
Instruction Guide – Massa M3 Wireless Sensor Evaluation Kit
Page 7 of 14
M3 Application Software
Validating Gateway Placement for Reliable Wireless Connectivity
The RF signal strength between the Gateway and the Sensor should be checked to ensure a reliable
communication link. Before testing for signal strength, verify that the antennas on both the Sensor
and the Gateway are vertical. As previously discussed, the M3 Software Status reports the Sensor’s
radio signal strength at the Gateway. This report has four reporting levels, “Very Strong”, “Strong”,
“Moderate”, and “Weak”, as shown in the Radio column in the figure below.
To check the signal strength, go to the “Data” tab and click on one of the “Acquire Data” buttons.
Repeat this several times to check the repeatability of the radio signal strength. If the signal strength
is “Very Strong”, there will be a very reliable communication link. However, this condition will not
always exist. A “Moderate” signal strength is acceptable, but a “Weak” signal may require
repositioning the Gateway since typically the Sensor cannot be moved as it is installed on a process
tank. If the Gateway cannot be placed close enough to the Sensor to produce a strong enough
signal, a Digi Wall Router (repeater) may be required. The Gateway can be located outdoors, since it
is rated for temperatures of -30ºC to +70ºC, but it must be placed in a watertight enclosure.
M3 Kit Guide 111017.docx
PRELIMINARY
10-20-2011
Instruction Guide – Massa M3 Wireless Sensor Evaluation Kit
Page 8 of 14
Digi Gateway and Massa M3 Sensor Placement Strategies
In this example, a tractor trailer truck is
parked between a short storage tank and
Gateway. Radio signals may not be reliable.
Placing a Digi Wall Router as shown here will
allow another path around structures that
could block radio signals.
This example shows a much taller tank with a
Gateway placed high overhead. Here the
tractor trailer does not impede the radio
signals.
M3 Kit Guide 111017.docx
PRELIMINARY
10-20-2011
Instruction Guide – Massa M3 Wireless Sensor Evaluation Kit
Page 9 of 14
Challenging Sensor-Gateway Locations
In this scenario, a chain link fence is
between the Sensor and the Gateway. A
metal fence will significantly reduce the
radio range. It is better to place the tank
with Sensor on the other side of the
fence or place a router in a location
possibly over the fence.
This scenario will also reduce the
effective radio range. Place wall routers
between the 2 points or place the
Gateway closer to the storage tanks. The
radio signals here can bounce away from
the Sensor due to the building with a
metal roof.
M3 Kit Guide 111017.docx
PRELIMINARY
10-20-2011
Instruction Guide – Massa M3 Wireless Sensor Evaluation Kit
Page 10 of 14
Wireless Tank Level Solutions Beyond the Evaluation Kit
The Evaluation Kit contains the components necessary for measuring the liquid level in a tank by
connecting the Gateway directly to a PC. These same components can be used for a configuration in
which the monitoring computer and Gateways are connected through an IP Network using data
services such as iDigi Cloud. A typical configuration of this type is shown in the figure below, but it
is beyond the scope of this Instruction Guide. Contact Massa Products or Digi International for more
information on this solution.
M3 Kit Guide 111017.docx
PRELIMINARY
10-20-2011
Page 11 of 14
Instruction Guide – Massa M3 Wireless Sensor Evaluation Kit
APPENDIX A
M3 Sensor LED Behavior
LED Behavior
OFF
RED quick flash every 2 seconds
RED quick flash every
2 seconds followed by an
extended OFF period
Description
No power, battery voltage too low, or Sensor sleeping if
powered
Commissioning succeeded and joined ZigBee network with
Deep-Sleep Timer disabled if remains in this mode
Commissioning succeeded and joined ZigBee network,
sensor goes to sleep in programmed time
(see Deep Sleep Timer and Awake Timer registers)
RED 3 to 6 seconds ON,
OFF for 1 min.
Un-associated state with ZigBee network with Deep Sleep
Time disabled
RED 2 seconds ON and
2 seconds OFF followed by
an extended OFF period
Un-associated state with ZigBee network with Deep Sleep
Time enabled
(see Deep Sleep Timer and Awake Timer registers)
RED flash every 1/2 second
for 30 seconds
Commission button pressed followed by other behaviors
indicated above after 30 sec.
RED 2 Hz flash,
GREEN 1 Hz flash
M3 Kit Guide 111017.docx
Error: Application firmware not present
PRELIMINARY
10-20-2011
Page 12 of 14
Instruction Guide – Massa M3 Wireless Sensor Evaluation Kit
APPENDIX B
Fresnel Zone and Effect on Range
(See Digi web site for more information.)
It makes sense that obstructions between a transmitter and receiver will reduce the communication
range. In order to obtain the absolute maximum communication range possible, a radio modem
system must be installed such that true RF Line-of-Sight (LOS) conditions exist between the
transmitting and receiving antennas.
RF LOS is different that visual LOS. Visual LOS is present when one can stand next one antenna and
use binoculars to view the other antenna. RF LOS requires not only a visual sight line between the
antennas but it also requires that a football shaped area between the two antennas be free of
obstructions.
This football shaped area is called the Fresnel Zone (pronounced Fernel Zone). The Fresnel Zone is
an area that is larger in diameter at the center and smaller in diameter at either end. Also, the greater
the distance between the antennas, the larger the diameter of the Fresnel Zone in the center.
Any obstructions that enter into the Fresnel Zone will reduce the communication range; including
buildings, vegetation, the ground, etc. As the antennas get further apart and the diameter of the
Fresnel Zone increases, the ground can begin to obstruct the Fresnel Zone. In order to keep the
entire Fresnel Zone free of obstructions it is necessary to raise the antennas. To keep the Fresnel
Zone off the ground the heights of the antennas added together must total more than the diameter
of the Fresnel Zone at the specific distance.
The diameter of the Fresnel Zone is a function of the frequency and the distance between the
antennas. For reference here is a table to use as a guideline:
2.4 GHz
Distance between antennas
1000 ft (300 m)
1 Mile (1.6 km)
Fresnel zone
diameter
11 ft (3.4 m)
21 ft (6.4 m)
Freespace loss (dB)
90
104
Side view of Fresnel Zone
Since the RF signal is omnidirectional, it can
reflect signals from objects back to the sensor
and gateway. This overhead view shows the RF
signal deflecting off of an object that may
reduce the signal of the direct RF path if out of
phase. This example could be the source of
problems of obtaining good signal strength
between the 2 devices and is why it is important
to perform site testing where the gateway and
sensor it to be located. Most cased the
reflected signal would be low in sensitivity and
may not be an issue.
M3 Kit Guide 111017.docx
PRELIMINARY
10-20-2011
Instruction Guide – Massa M3 Wireless Sensor Evaluation Kit
Page 13 of 14
APPENDIX C
X4 Gateway Settings for Use with M3 Sensor Software
1) Gateway XBee Configuration (advanced)
a) Extended PAN ID (ID): 1
b) Discovery Timeout (DT): 60
c) Scan Channels (SC): 0x1ffe
d) Peripheral sleep count (SN): 8460
e) Cyclic sleep period (SP): 1000
2) Serial Port Configuration
a) Baud Rate=9600, Data Bits=8, Parity=None, Stop Bits=1, and Flow Control=None
b) Serial Port Services: Access the command line interface (UNCHECK)
3) Python Configuration (Python files)
a) python.zip
b) zigbee.py
c) massa_gateway_appl.py
4) Python Configuration (Auto-start Settings)
a) massa_gateway_appl.py (CHECK Enable)
The Gateway and Sensor in these kits are defaulted to PAN ID = 1 (Personal Area Network) as
indicated in 1a. If another Gateway is in the same vicinity, then both Sensors and Gateway for the
new Gateway and sensor will need to have the PAN ID changed with different value.
M3 Software Configuration Settings
View – Program Settings tab
1) Serial Communications Port: (select proper port USB or null modem cable is plugged into)
2) Discovery Timeout: 12 seconds
M3 Sensor Settings
1) Data Collection Interval: 0
2) Deep Sleep Timer: 0
3) Awake Timer: 31
4) Outgoing Message Mode: 0
M3 Kit Guide 111017.docx
PRELIMINARY
10-20-2011
Instruction Guide – Massa M3 Wireless Sensor Evaluation Kit
Page 14 of 14
APPENDIX D
Digi Device Discovery Application
To gain access to the X4 Gateway you will need to get an Ethernet connection to the Gateway and
then use the Device Discovery Software. The X4 Gateway’s Ethernet IP Settings are configured to
obtain an IP address automatically using DHCP. Contact your network administrator if you need
support for this. Another option is to plug the Gateway directly into your PC Ethernet port with your
PC’s Local Area Connection TCP/IP set to obtain an IP address automatically. Run the Device
Discovery to find the gateway as you see in the screen below. Double click the IP address found to
get to the Digi Web pages (bottom figure below).
Should it be necessary to change a Gateway setting, you will have to proceed in gaining access as
shown here. The kit for one system will not need any changes for use with the M3 Software.
However, an example that will require a settings change is where 2 Gateways are present in the same
nd
area. This will require the PAN IDs of both the Sensors and 2 Gateway to be changed to a number
other than the default value of 1 assigned to the Massa M3 Evaluation Kit.
M3 Kit Guide 111017.docx
PRELIMINARY
10-20-2011