1
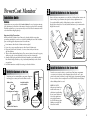
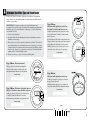
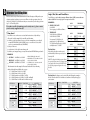
PowerCost Monitor
™
User Guide
Install your PowerCost Monitor™
before reading this Guide
Current Consumption – Top Row
The top row displays your current energy consumption. If you
press the $/kW button repeatedly, the display alternates between
values in dollars per hour and kilowatts per hour.
$
/hr
ON-PEAK
$
TOTAL
In the examples on the right, you are currently using $0.83 (top)
and 5.2 kW (bottom) worth of electricity per hour.
º
PM
TUE
Dollars & Cents Mode
IMPORTANT: If your Display Unit shows unusually low
consumption (0.4 KW or less) for an extended period of time
when you are performing normal household tasks such as
cooking or laundry, your Sensor Unit may be misaligned.
See the Troubleshooting section on the reverse side.
kW
ON-PEAK
TOTAL
kWh
º
PM
TUE
Kilowatt Mode
APPL
$/kW
BUTTON
CLEAR
TOTAL/EST
FUNCTION
$/kW
Toggles the display of values between dollar and kilowatt amounts.
TOTAL/EST
Toggles the display of values between current consumption and
estimated 30-day consumption.
CLEAR
Press and hold to reset the consumption totals to zero.
APPL
Toggles the APPL function on and off. The APPL function allows you
to measure the amount of power consumed by a single appliance.
Normal Operation
Your Display Unit should be displaying a short, thick bar scrolling across the screen
from left to right, immediately under the top value on the Display. This indicates that
your Display Unit is correctly receiving the signals trasmitted by your Sensor Unit.
This Guide explains all the values and icons that your Display Unit can show, as well
as all its various functions. It also contains a Troubleshooting section on the reverse
where you can find answers to specific issues.
Consumption Totals – Middle Row
Pressing the TOTAL/EST key alternates the displayed values on
this row between your current total consumption (the TOTAL
indicator is displayed) and a calculated estimated consumption
for 30 days (the EST indicator is displayed).
$
The value in the middle row shows the cumulative total of electricity
consumed since you last reset the totals. If you press the $/kW
button repeatedly, the display alternates between values in dollars
and kilowatts per hour. In the examples on the right, you have used
$27.09 (top) and 36.9 kWh (bottom) worth of electricity since you
last reset the totals.
$
When the ESTIMATE indicator is displayed, the value shown
represents the estimated total amount of electricity you will have
consumed during a 30-day period starting on when you last reset
the totals (press $/kW to alternate between dollars and kilowatthours).
Finally, if your Sensor Unit or Display Unit batteries are low, the
LOW BATT and with either SENSOR or DISPLAY (or both) appear
on this row. It is best to change the batteries as soon as these
indicators appear.
/hr
ON-PEAK
TOTAL
º
PM
TUE
Dollars & Cents Mode
kW
ON-PEAK
TOTAL
kWh
º
TUE
PM
Kilowatt Mode
1
Factory (Hard) Reset
Time and Temperature – Bottom Row
The bottom row displays the current day of the week, as well as the temperature and time
in the formats you selected when configuring the Display Unit (degrees Fahrenheit or
Celsius and 12-hour or 24-hour clock).
Resetting the Totals
Press-and-hold the CLEAR button located on
the front of the Display Unit until you hear a
beep.
This resets the Total values (Dollars and kW)
that appear on the middle row, and starts a
new 30 day cycle. All the other values remain
the same.
By resetting the totals on the first day of your
billing cycle, you can always have a rough idea
of your next monthly electricity bill.
To reset the Display Unit to its factory-set default values, simultaneously press-andhold the CLEAR and PROG/SYNC buttons until you hear a beep.
All the values you entered are deleted and your Display Unit is configured with its
default factory settings.
APPL – Measuring a single appliance
$
kW
/hr
$
TOTAL
TOTAL
kWh
º
º
TUE
PM
Dollars & Cents Mode
PM
TUE
Kilowatt Mode
Sensor Unit.
$
/hr
ON-PEAK
º
WED
AM
Dollars & Cents Mode
kW
$
/hr
➢ There is a strong interference from other electronic devices,
ON-PEAK
such as wireless weather stations.
To restore communications between the two units, simply press
any key on the Display Unit. The bar should start moving and
values should start being displayed after a short time.
If the problem persists, see the Troubleshooting section on the
reverse side.
First, turn off the appliance you wish to measure, wait a few minutes, press the APPL
button, then turn on the appliance. The APPL indicator is displayed in the top row
and, after a few more minutes, the values displayed represent the energy currently
consumed by that particular appliance.
NOTE: To obtain realistic results, you should ensure that no other appliance, light
bulb, etc. is turned on or off while you are measuring an appliance.
TARE
TUE
➢ The Display Unit has been moved out of range of the
TOTAL/EST
When you are done, press APPL again to return to normal mode.
For example, loss of signal may occur if you move the Display Unit
to a location in your house that is too far from the Sensor Unit.
Here are a few causes of loss of signal:
➢ The Sensor Unit batteries are exhausted.
CLEAR
You can also choose to press APPL first, then turn off the appliance. The value
displayed will still be positive, as it will represent the quantity of electricity that the
appliance was consuming before you turned it off.
SLEEP Mode
In the event that your Display Unit loses the signal transmitted
by your Sensor Unit, the middle row displays SLEEP. You will
also notice that the first row displays dashes instead of values,
and since the Sensor Unit also transmits temperature information,
the temperature disappears from the last row.
$/kW
When you press APPL, the Display Unit memorizes the total current consumption and
then displays only the consumption above that value until you press APPL again.
ON-PEAK
ON-PEAK
The APPL button allows you to measure how much electricity is
consumed by a single appliance.
APPL
º
WED
TUE
Kilowatt Mode
AM
WARRANTY - LIMITED ONE YEAR WARRANTY
Blue Line Innovations warrants this product to be free from defects in
materials and workmanship for a period of one year from the date of sale to
the original user or consumer purchaser. Blue Line Innovation’s exclusive
obligation under this warranty shall be, at its option, (a) to supply, without
charge, a replacement of the product or (b) to refund the purchase price in
respect of any product that is found to be defective and that is returned, with
its proof of purchase, to the original supplier.
This warranty excludes and does not cover defects, malfunctions, or
failures caused by misuse, unauthorized repairs, modifications or accidental
damage.
Note: This warranty does not apply to batteries or damage to the product
caused by the use of faulty batteries.
Warning: Changes or modifications not expressly approved by Blue Line
Innovations Inc. void the user’s authority to operate the equipment.
This warranty is only applicable to a product purchased through a Blue Line
Innovations authorized dealer.
In no event shall Blue Line Innovations be liable for consequential or
incidental damages.
This warranty is in lieu of all other expressed warranties. The duration of
any implied warranty is limited to the period of the expressed warranty set
forth above.
Blue Line Innovations Inc.
187 Kenmount Road
1st Floor, ICON Building
St. John’s, NL Canada
A1B 3P9
[email protected]
www.bluelineinnovations.com
Toll Free: 1-866-607-2583
© 2008. Blue Line Innovations Incorporated. All
rights reserved. Information in this document
is subject to change without notice. Blue
Line Innovations and PowerCost Monitor
are trademarks of Blue Line Innovations
Incorporated. All other trademarks are the
property of their respective owners.
Printed in China.
PN BLI-00299R001
2
PowerCost Monitor
Troubleshooting - Page 1
Q
A
I am unsure of my utility meter type. How can I find out which type
of meter I have?
The illustrations in Step 4 of the Installation Guide represent various kinds
of meters that we have grouped arbitrarily under “types”, based on different
sequences of operations that are required to mount a Sensor Unit correctly.
The majority of existing meters fall under one of these generic types. Determine
which illustration most closely matches your meter, and remember to follow the
installation instructions for that meter type. Also find the meter’s power factor
on the face of the meter and write it in the box labeled “Power factor”. The power
factor is a number (usually 1.0 or 7.2) preceded by two letters (usually Kh or Ks
or Kt). Proceed with the installation steps in order and, in Steps 8 and 9, follow
the installation instructions for that meter type.
Q
A
After installing the Sensor Unit on my meter and pressing the RESET
button, nothing happens. The red indicator does not light up.
The STATUS light in the Sensor should light up solid red within 10 seconds
afterpressing the RESET switch. If it does not, try these steps:
1. Confirm that the batteries are inserted in the correct orientation. + and –
symbols are printed on the green circuit board inside the battery compartment.
2. Confirm that the batteries are not dead. We recommend lithium batteries for
longer life in freezing conditions.
3. Confirm that the battery lid is closed and screwed down. The lid has to be
fastened down for the batteries to make contact.
Q
A
The red STATUS indicator on my Sensor Unit is flashing rapidly.
Is this the indication of a problem?
The STATUS indicator starts flashing very rapidly if the Sensor Unit still has not
detected the signal of a meter 20 minutes after being powered up. This is normal.
Simply press the RESET button and wait 10 seconds for the STATUS indicator to
light up solid. You can then proceed with the installation as described.
Q
A
My Sensor Unit STATUS LED is flashing regularly, but every now and
then, there is an extra flash. Is there anything wrong with my unit?
This is exactly what you should see. Electronic meters produce one single
pulse every time you have consumed one watt-hour. When the Sensor Unit first
detects a pulse from an electronic meter, the STATUS indicator starts flashing.
Thereafter, the indicator keeps on flashing at the same frequency, but in addition,
it will flash once every time it reads a pulse from your meter, at intervals that vary
according to your current rate of electricity consumption. This periodic irregular
flashing is absolutely normal.
Q
A
When I try to synchronize my Display and Sensor Units, the Display
Unit keeps showing “id” on the screen.
This indicates that the Display Unit is in ID mode, meaning that is searching for
your Sensor Unit. Press the RESET button on the Sensor Unit. If the Display Unit
remains in ID mode, move it to a location between 2 and 10 feet (60 cm to 3m)
of the Sensor Unit, and then press the RESET button again.
Q
A
The Sensor Battery indicator shows a low battery level, but I installed
fresh batteries not long ago.
Regular alkaline batteries can become exhausted very rapidly when it is extremely
cold outside. If you are expecting an extended period of temperatures below
-20°C (-4°F), try using lithium type AA batteries in the Sensor Unit. These
batteries are commonly available and they provide better performance in cold
weather.
Q
A
The Sensor Unit appears to have detected my meter properly, but I only
see dashes (--) on my Display Unit.
This indicates that the Display Unit is not receiving transmissions from the
Sensor Unit. Ensure that the Display Unit is located within 100 feet (30m)
of the Sensor Unit. Note that each wall of your house reduces the range by
approximately 15 feet (5m). Also, aluminium siding on your house will
significantly reduce the range. If this is the case, try to position the Display Unit
so that there is a window between it and the Sensor Unit.
If neither range nor wall construction seem to cause be the problem, repeat
Step 10 in the Installation Guide to re-synchronize your Display and Sensor Units,
ensuring that you keep the RESET button pressed for at least 5 seconds.
Lastly, it is possible that the batteries in the Sensor Unit are exhausted. Replace
the batteries with fresh ones.
3
PowerCost Monitor
Troubleshooting - Page 2
Q
A
Q
A
Q
A
Q
A
The power usage shown on my Display Unit is not updating or is
unusually low.
Try turning on an electric appliance that consumes a large amount of power
such as a stove or dryer. If the values on the Display Unit do not start to update
within a few minutes, then the Sensor Unit is likely not aligned correctly on
your utility meter. Try repeating the appropriate alignment steps described in
the Installation Guide.
The temperature shown on the Display Unit does not match weather
reports or appears to be incorrect.
The temperature shown on the Display Unit is the ambient temperature at your
utility meter; it may vary from other sources, such as TV weather reports, because
of distance and other factors. Also, if your utility meter is exposed to direct
sunlight during any part of the day, then the reading will be higher than normal.
The reading will return to the correct value when the utility meter is in the shade.
Q
A
My Display Unit behaves erratically and shows illogical values.
My display Unit is showing SLEEP and dashes. What do I do?
This means that your Display Unit has stopped receiving the signal from your
Sensor Unit for more than 10 minutes. Go to your Sensor Unit, taking the Display
Unit with you. Remove the batteries from the Display Unit and put them back in.
After a few seconds, press PROG/SYNC unil you hear two beeps to put the Display
Unit in ID mode, then press the RESET button on the Sensor Unit. Normal
operation should resume.
The total shown on my Display Unit does not match the total shown
on my electricity bill.
In order for the two totals to match, you would need to clear the totals on the
Display Unit on the exact day and time the utility company reads your meter. In
addition, your electricity bill also may include other fees, as well as any applicable
taxes. The total amount shown on the PowerCost Monitor is accurate, but is
really meant as a reference to indicate how much power you have consumed since
you last cleared the totals. For example, if you clear the totals at the beginning of
every monthly cycle, then you can use the PowerCost Monitor to compare against
your monthly budget.
Should your Display Unit start displaying any unexpected values, reset it to the
factory settings by pressing on the PROG/SYNC and CLEAR keys simultaneously
until you hear 3 beeps (about 5 seconds). However, doing so will erase all your
existing rate entries and you will have to follow the instructions in Steps 6 and 7
of the Installation Guide to setup your Display Unit again.
Q
A
The consumption information shown on my Display Unit is not correct
and it jumps randomly.
Several factors can affect the accuracy of the information shown on your Display
Unit and they all relate to interference. If your neighbour also has a PowerCost
Monitor system, you may be receiving their information. In this case, you need
to change the Sensor Unit address and resynchronize the Display Unit. Repeat
Step 10 in the Installation Guide, but press and hold the RESET button for five (5)
seconds. The Sensor Unit then selects a new address randomly on which to base
the synchronization.Wireless devices, such as weather stations or old-style baby
monitors and cordless phones, transmit information on frequencies similar to
the PowerCost Monitor. If you have a wireless weather station try turning it off
briefly and check to see if the PowerCost Monitor Display Unit returns to normal
operation. If it does, then check to see if you can change the weather station’s
operating channel.
Blue Line Innovations Inc.
187 Kenmount Road
1st Floor, ICON Building
St. John’s, NL Canada
A1B 3P9
[email protected]
www.bluelineinnovations.com
Toll Free: 1-866-607-2583
© 2008. Blue Line Innovations Incorporated.
All rights reserved. Information in this
document is subject to change without notice.
Blue Line Innovations and PowerCost Monitor
are trademarks of Blue Line Innovations
Incorporated. All other trademarks are the
property of their respective owners.
Printed in China.
PN BLI-00299R001
4
2
PowerCost Monitor
™
Installation Guide
Install the Batteries in the Display Unit
Remove the battery compartment cover on the back of the Display Unit, insert two AA
batteries in the proper orientation, and replace the battery compartment cover.
Welcome
You can also install the stand by clicking it into its position on the back of the
Display Unit as shown below. Note that, with the stand removed, you can mount the
Display Unit on a wall.
Congratulations on your purchase of the PowerCost Monitor™, a new electricity-monitoring
device that informs you in real time of the amount of electricity your household is consuming.
This Guide explains how to get your system ready for use. Please follow the instructions in the
order shown without skipping any steps.
Important Safety Precautions
Install your PowerCost Monitor Sensor Unit on a dry day and take all necessary safety
precautions, particularly if you need to use a ladder for installing the Sensor Unit. In addition,
please read and apply the safety instructions below at all times.
➢ Do not immerse either PowerCost Monitor unit in any liquid.
➢ Do not drop or cause any sudden impact to either PowerCost Monitor unit.
➢ If disposing of the PowerCost Monitor, do so in accordance with your local waste
disposal regulations.
➢ Take precautions when handling batteries. They can cause injuries, burns, and/or property
damage as a result of contact with metal objects, heat, and corrosive materials.
➢ A damaged LCD display may leak fluids that can be harmful to your health. If any fluid
leaks from the Display Unit after you drop it accidentally, immediately wash it off with
soap and water.
➢ Read all the instructions carefully before using your PowerCost Monitor.
1
Verify the Contents of the Box
Verify that your box contains all these components. If any item
is missing, please contact your PowerCost Monitor reseller.
Rubber Shim
Display
Unit
Installation Guide
and User Guide
™
onitor
Clear Alignment Template
tM
erCos
Powatio
n Guide
Install
ase of
purch
tents
of the
ET
RES
+
+
the Con
Box
Sensor Unit
_
_
_
Verify
US
AT
ST
safety
on,
Congr
to get
that informns how ing any steps.
necessary In additi
device
explai ut skipp
r Unit.
take all
day and
the Senso
This Guide witho
ns
shown
on a dryfor installing
order
r
.
Precautio r Unit
Safety Monitor Sensoto use a ladde at all times
.
below
rtant
need
or unit.
liquid
Impo your PowerCost
if you instructions
Monit local waste
in any
ularly
l
Instal
or unit PowerCost
, partic
the safety
rty
Monit
with your
either
r prope
precautions and apply
PowerCostn impact to in accordance
, and/o
read
so
burns
please
rse eitherany sudde
or, do
injuries, materials.
imme
fluid
Do not drop or cause rCost Monit
. If any
can cause corrosive
Powe
ies. Theys, heat, and to your health it off with
Do not sing of the
batter
ful
y wash
diatel
If dispo regulations. handling metal object be harm
can
, imme
ntally
disposal utions whencontact with fluids that
of
or.
it accide
leak
result
Take preca
Monit
y may
you drop
rCost
ge as a
dama ged LCD display Unit after
your Powe
using
Displa
A dama
lly before
from the .
leaks
carefu
water
soap and the instructions
all
Read
item
s. If any r.
onent
comp
or reselle
these
Monit
ins all
rCost
box conta your Powe
ct
that your
Verify g, please conta
is missin
1
_
ing
onitor
ming.
electricity-m
consu the
a new
in
hold is
tor™,
house
ctions
Moni
rCost
the instru
icity your
the Powe nt of electrPlease follow
amou for use.
of the
your
ready
time
Welcome
ions on you in real
atulat
your system
s
+
+
Alkaline “AA” Batteries
(with clamping strap)
3
Install the Batteries in the Sensor Unit
Turn the screw counter-clockwise to open the Sensor Unit battery compartment
cover, insert two AA batteries in the orientation indicated by the + and – signs
printed on the circuit board, then close and lock the battery compartment by turning
the screw clockwise. Do not overtighten. The red STATUS indicator should light up
without flashing within 10 seconds.
NOTE: The STATUS
indicator stays lit until you
install it on the meter, at
which time it starts flashing.
If your Sensor Unit has not
detected the signal from a
meter within 20 minutes,
the STATUS indicator starts
blinking very rapidly. This
behaviour is normal.
1
4
Determine Your Meter Type and Power Factor
In some cases, it may be necessary to adjust your Sensor Unit to fit your particular
meter. Therefore, it is extremely important to determine exactly what kind of meter is
installed on your premises.
INSTRUCTIONS: To determine your meter type, study the illustrations and
descriptions below as well as in any other meter-specific installation guide that may be
included in your box. For more information on meter types, see the Troubleshooting
section in the User Guide.
1. Locate your electricity meter.
2. Determine which of the following illustrations most closely matches your meter.
Remember your meter type.
3. Find your meter’s power factor and write it down in the box labeled “Power Factor”
next to the illustration below which matches your meter. Your meter’s power factor
is indicated on the face of the meter, most often next to the letters Kh (less often the
letters Ks or Kt). In most cases, your meter’s power factor is 7.2 if it has dials and a
spinning disk, or 1.0 if it has a digital readout.
Type 3 Meter:
Electronic with optical port on the face,
less than 1.5 inches from the outer rim
On these electronic meters, the optical port is on the
face, located less than 1.5 inches (37 mm) from the
meter’s outer rim.
If in doubt, measure the distance using the ruler below.
This type of meter requires that you mount the supplied
rubber shims on the underside of the Sensor Unit.
NOTE: If your meter seems to have two ports, the one
closest to the center of the meter is the optical port.
Power Factor
4. When you are done, go to Step 5 - Determine your Billing Mode.
Type 1 Meter: Electromechanical
This type of meter has dials and a spinning disk.
9 0 1
8
2
7
3
654
9 0 1
8
2
7
3
654
9 0 1
8
2
7
3
654
10 9
2
8
3
7
456
9 0 1
8
2
7
3
654
The Sensor Unit reads the revolutions of the disk
and transmits that information to the Display Unit.
Power Factor
Type 4 Meter:
Electronic with optical port on the top
On this type of meter, the optical port is located on
the top portion of the meter.
Type 2 Meter: Electronic with optical port on
the face, 1.5 inches or more from the outer rim
This kind of meter requires you to reconfigure the
Sensor Unit and install the Clear Alignment template.
Power Factor
On this type of meter, the optical port is located at least
1.5 inches (37 mm) from the meter’s outer rim.
If in doubt, measure the distance using the ruler below.
Power Factor
ruler
2
5
Determine Your Billing Mode
Single (Flat) Rate and Tiered Rates
Find a recent electricity bill and determine which of the following two billing modes your
electricity supplier is applying to your account. Then, write the appropriate value(s) in
the box(es) provided as a quick reference that you can use when you are ready to perform
Step 7 - Set Your Billing Rates.
If you have trouble determining your electricity rate(s), please contact
your electricity supplier directly!
Time-based
Your bill shows two or three rates associated with various times of day and days
of the week. Study the example below carefully, and determine:
a) whether you are being charged on a two-rate basis, meaning that you are charged
normal (OFF PEAK) and peak (ON PEAK) rates, or on a three-rate basis, where
you also pay an intermediate rate (MID PEAK).
b) what your rates are;
c) at what time(s) of the day the rates change; and
d) whether your company charges you any other rate than OFF PEAK during weekends.
EXAMPLE:
➢ OFF PEAK
MID/ON PEAK applies Mon to Fri.
* MID PEAK Periods: 9:30 AM to 4:20 PM
and 7:00 PM to 11:00 PM
** ON PEAK Periods: 6:10 AM to 9:30 AM
and 4:20 PM to 7:00 PM
342 kWh @ $0.063/kWh
➢ MID PEAK* 399 kWh @ $0.069/kWh
➢ ON PEAK** 988 kWh @ $0.075 /kWh
The information from this example is illustrated in the table below, indicating
that from Monday through Friday only, you pay:
1) 7.5 ¢/kWh from 6:10 AM to 9:30 AM;
2) 6.9 ¢/kWh from 9:30 AM to 4:20 PM;
3) 7.5 ¢/kWh again from 4:20 PM to 7:00 PM;
4) 6.9 ¢/kWh again from 7:00 PM to 11:00 PM; and finally
5) 6.3 ¢/kWh from 11:00 PM until 6:10 AM the next day.
TIME SLOT START TIME
OFF PEAK rate
6.3
¢/kWh
MID PEAK rate
6.9
¢/kWh
ON PEAK rate
7.5
¢/kWh
MID/ON PEAK rates
apply on weekends?
Yes
No
✓
1
6 : 10
2
9 : 30
3
4 : 20
4
7 : 00
5
11 : 00
6
:
RATE TYPE
✓AM ✓ON PEAK
PM
✓AM
PM
AM
✓PM
AM
✓PM
AM
✓PM
AM
PM
MID PEAK
ON PEAK
✓MID PEAK
✓ON PEAK
MID PEAK
ON PEAK
✓MID PEAK
ON PEAK
MID PEAK
ON PEAK
MID PEAK
OFF PEAK
Your bill shows a single value in cents per kilowatt-hour (¢/kWh) or more than one
value in ¢/kWh for increasingly higher consumption thresholds.
EXAMPLES:
➢ SINGLE (FLAT) RATE
$0.063/kWh
You are paying 6.3 ¢/kWh at all times.
➢ TIERED RATE
1200 kWh @ $0.063/kWh and
1369 kWh @ $0.075/kWh
You consumed 2,569 kWh in total,
paying the first 1,200 kWh at the rate
of 6.3 ¢/kWh and the following 1,369 kWh
at the higher rate of 7.5 ¢/kWh.
OFF PEAK
OFF PEAK
¢/kWh
RATE
kWh
THRESHOLD
1
6.3
¢/kWh
2
7.5
¢/kWh
RATE
1200
kWh
kWh
THRESHOLD
¢/kWh
kWh
2
¢/kWh
kWh
3
¢/kWh
kWh
NOTE: The PowerCost Monitor system allows 4
for up to six different rates. If you pay a single
5
rate, simply write it down in the RATE 1 box
for reference purposes and ignore the rest of
6
the table.
¢/kWh
kWh
¢/kWh
kWh
¢/kWh
kWh
In the table to the right, enter the rate(s)
and threshold(s) that are reported on your
electricity bill.
Instructions: Looking at your electricity bill, and following the example to
the left, fill out the table below with the rates and times of the day that apply to
your situation.
TIME SLOT START TIME
OFF PEAK rate
MID PEAK rate
¢/kWh
ON PEAK rate
¢/kWh
OFF PEAK
✓OFF PEAK
6.3
1
THRESHOLD
1
Instructions:
¢/kWh
OFF PEAK
RATE
MID/ON PEAK rates
apply on weekends?
Yes
No
1
:
2
:
3
:
4
:
5
:
6
:
RATE TYPE
AM
PM
AM
PM
AM
PM
AM
PM
AM
PM
AM
PM
ON PEAK
MID PEAK
ON PEAK
MID PEAK
ON PEAK
MID PEAK
ON PEAK
MID PEAK
ON PEAK
MID PEAK
ON PEAK
MID PEAK
OFF PEAK
OFF PEAK
OFF PEAK
OFF PEAK
OFF PEAK
OFF PEAK
3
6
Configure Your Display Unit
You will now configure your Display Unit so it will be ready to provide you with real time
information as soon as you install your Sensor Unit.
Important: Your Display Unit has three buttons you will use during configuration:
the ▲ and ▼ buttons on the front of the unit, and the PROG/SYNC button on top. In the
configuration instructions that follow, “Enter” means pressing the ▲ and ▼ buttons
to select the appropriate value, then pressing PROG/SYNC to record the value in memory.
The next parameter will then automatically start flashing.
The Display Unit automatically exits Configuration Mode after one minute of inactivity,
saving whatever values you set up to that point. If you are interrupted before you have
finished entering all your values, return to Configuration Mode and press PROG/SYNC
successively until you get to the value(s) you need to modify.
Set your billing mode, the internal clock and the meter’s Power Factor
NOTE: If your Display Unit displays SLEEP, briefly press any button before
proceeding with the steps below.
1. Press PROG/SYNC until the Display Unit beeps once (about 3 seconds) and enters
Configuration mode. The hours start flashing.
2. Enter the current hour of the day.
º
º
3. Enter the current minutes of the day.
4. Enter the clock format you wish to use. Pressing ▲ or▼ toggles
between 12 hour and 24 hour time display format.
SUN
º
AM
PROG/SYNC
CLEAR
TOTAL/EST
AM
SUN
7. Enter the Power Factor you wrote down in Step 4. If you have a
meter with dials and a spinning disk, this value is most likely 7.2.
If you have a meter with a digital readout, it is most likely 1.0.
$/kW
Hr
SUN
6. Enter the temperature format you wish to use. Pressing ▲ or▼
toggles between degrees Celsius and Fahrenheit.
TOP
AM
SUN
5. Enter the current day of the week.
APPL
AM
SUN
AM
SUN
8. The TIER billing mode indicator (Flat/Tiered
rate) is now flashing. Pressing ▲ or ▼ alternates
between TIER, 2-PEAK (time-based, two rates) and
3-PEAK(time-based, 3 rates). Enter the indicator
that corresponds to your billing mode
TIER
2-PEAK
3-PEAK
9. You will now enter your billing details. While still in Configuration
Mode, and referring to the numbers you wrote down in Step 5, set
up your Display Unit for your billing mode by following the instructions in the appropriate table under Step 7 - Set Your Billing Rates.
4
7
Set Your Billing Rates
Time-based (2 and 3 rates)
NOTE: If you need to reconfigure your Display Unit after your energy supplier has
changed your rates, perform a Factory (Hard) Reset as described in your User Guide and
start from Step 6 - Configure Your Display Unit.
REMEMBER: To “Enter” a value, press ▲ or ▼ until the correct value is displayed, then
press PROG/SYNC.
Single Flat Rate
1. The RATE and TIER 1 indicators are displayed and the default rate is
flashing. Enter your electricity rate.
TIER
RATE
1. All the day of the week segments are displayed, with the
SAT and SUN segments flashing. This means that in the
current setting, higher rates are not applied on weekends.
If you do not pay higher rates on weekends, go to step
2 below. If you do pay higher rates on weekends, press
either ▲ or ▼ to make the SAT and SUN display solid
like the other day segments, then press PROG/SYNC.
3-PEAK
SUN MON TUE WED THU FRI SAT
OFF-PEAK
¢/kWh
2. The THRESHOLD and TIER 1 indicators are now displayed and the
default threshold value is flashing. Press ▼ until a series of dashes is
displayed.
3. Press PROG/SYNC. Your Display Unit exits Configuration Mode.
TIER
THRESHOLD
2. Enter your OFF PEAK RATE.
TIER
THRESHOLD
MID-PEAK
3. If required, enter your MID PEAK RATE.
4. Go to Step 8 - Prepare your Sensor Unit.
NOTE: The next time you change your rates, the TIER 1 indicator is not displayed.
It will only reappear if your enter a value to change the threshold.
RATE
3-PEAK
¢/kWh
3. The RATE and TIER 2 indicators are now displayed. Enter your
second rate.
THRESHOLD
kWh
RATE
5. Number “1” is displayed above the clock,
indicating the 1st time slot.
Enter the HOURS when your 1st time slot starts.
Next, enter the MINUTES when your 1st time slot starts.
º
AM
3-PEAK
º
AM
¢/kWh
TIER
THRESHOLD
OFF-PEAK
kWh
6. Enter the RATE TYPE of your 1st time slot.
TIER
5. Press PROG/SYNC. Your Display Unit exits Configuration Mode.
NOTE: The Display Unit automatically exits Configuration Mode as soon as you enter
a 6th rate.
6. Go to Step 8 - Prepare your Sensor Unit.
PM
TIER
TIER
s
¢/kWh
º
2. The THRESHOLD and TIER 1 indicators are now displayed and the
default threshold value is flashing. Enter your (first) threshold
If you have no more rates to enter, press ▼ until a series of dashes
is displayed.
Enter your second threshold and repeat steps 1 and 2 until you
have entered all your rates and thresholds. After your have entered
your last rate, press ▼ until a series of dashes is displayed.
PM
ON-PEAK
TIER
s
¢/kWh
º
4. Enter your ON PEAK RATE.
Tiered Rates
4. The THRESHOLD and TIER 2 indicators are displayed and the default
value for the second threshold is flashing. Do one of the following:
PM
kWh
kWh
1. The RATE and TIER 1 indicators are displayed and the default rate is
flashing. Enter your first electricity rate.
¢/kWh
º
THRESHOLD
º
AM
¢/kWh
7. Number “2” is now displayed above the clock, indicating
the 2nd time slot. Repeat steps 5 and 6 for all your time slots.
3-PEAK
º
AM
When you are done, press PROG/SYNC for 3 seconds to exit
Configuration mode. Also, note that the Display Unit exits
Configuration mode automatically as soon as you finish entering
the 6th time slot.
5
8
Prepare Your Sensor Unit
Type 3 Meter: Electronic with optical port on the face, 1.5 inches
maximum from the outer rim
G
A Clamp
B Sensor Arm (pulled out)
C
B
F
E
C Sensor Head
D
1
2
3
4
Verify that the Sensor Arm B is fully pushed in as described for Type 2 meters.
Peel off the adhesive backing from the shim.
Position the shim on the underside of the Sensor Unit casing with the adhesive side down.
Press the shim in place onto the underside of the Sensor Unit casing.
D Sensor LEDs (dark red
and white)
E Wire
4
F Wire Cavity
G Sensor Arm Latch
A
Instructions: Perform the operations in the block that corresponds to your meter
type. When you are done, go to Step 9 - Install your Sensor Unit.
Type 1 Meter: Electromechanical
1 Open the Sensor Arm latch G by pulling upward.
2 Extend the Sensor Arm B to its full length by pulling
on it firmly, but gently. If you accidentally pull it out
completely, push it back into the casing.
3 Close the latch G .
Type 4 Meter: Electronic - optical port on top
Open the Sensor Arm latch G by pulling upward.
Gently pull the Sensor Arm B completely out of the Sensor Body.
Turn over the Sensor Arm B .
Push the thin end of the Sensor Arm B upwards through the latch opening and press
the Sensor Arm firmly into the cavity.
5 Firmly push the Sensor Head C behind the strap, and as far down as it will go into the
bottom cavity of the body. The dark red Sensor Head LED D must be clearly visible
below the clamp. If necessary, use a dull pointed object, such as a ballpoint pen to push
the head C downwards.
6 Tuck the wire E into the side cavity F .
7 Close the latch G .
1
2
3
4
Type 2 Meter: Electronic with optical
port on the face, 1.5 inches or more from
the outer rim
1 Open the Sensor Arm latch G by pulling upward.
2 Ensure that the Sensor Arm B is pushed in as far
as it will go into the body of the Sensor Unit.
3 Close the latch G .
6
9
Install Your Sensor Unit
START – Read SAFETY PRECAUTIONS first
IMPORTANT: Turn on a high energy-consuming appliance in your house, such as
your electric stove or dryer. This will temporarily increase your electricity consumption and enable the Sensor Unit to begin reading your meter’s output in less time.
1. Go to your meter, taking the following items with you:
➢
➢
➢
➢
This Guide
Sensor Unit
Display Unit
A clean damp cloth
➢ 1 large Flat Head screwdriver
➢ Clear Alignment Template (if you have a Type 4 meter)
➢ Stepping stool or ladder if your utility meter is located
higher than eye level
2. Perform the installation steps for your type of meter (which you determined in Step 4).
Type 1, 2 & 3 Meters:
1. After carefully wiping the meter dome clean with the
damp cloth, fit the Sensor Unit over your utility meter
as shown, so that the Sensor Head C sits as close as
possible to the front of the glass dome.
2. With your screwdriver, tighten the hose clamp A until
the Sensor Unit is snug, but can move just enough to
allow for slight adjustments.
3. Position the Sensor Head C :
TYPE 1 Meters:
Position the Sensor Arm
B so that it is inline
with the spinning disk
(use the line on the
Sensor Arm as a reference)
and the Sensor Head C is
on or near the center of the meter.
TYPES 2, 3 Meters:
Position the Sensor
Arm B so that the
dark red LED D
in the Sensor Head
C is located exactly
above the optical port.
4. Press the RESET button and wait 10 seconds. The red STATUS indicator turns on solid.
5. If you positioned the Sensor Head
C correctly, the STATUS indicator
starts flashing as indicated below.
If it does not, correct the
positioning slightly.
TYPE 1 - After 15 seconds, the red STATUS indicator turns off and within two minutes,
it starts flashing once per disk revolution. This is an indication that your Sensor Unit is
correctly reading the meter.
TYPES 2 and 3 - After about 15 seconds, the red STATUS indicator starts flashing
regularly, indicating that the Sensor Unit has detected the signal from your meter.
Within 1 minute, in addition to the regular flashing, you should see an extra flash every
now and then, depending on your rate of electricity consumption. These extra flashes
are normal, and indicate that the Sensor Unit is reading the meter’s output correctly.
Note 1: The STATUS indicator stops flashing after 2 minutes, in order to maximize
battery life.
Note 2: If the STATUS indicator does not flash at all and stays lit solid, please read
the Troubleshooting section in your User Guide.
Type 4 Meters:
1. Stand directly in front of your meter, at a height where you can see the optical port.
The optical port itself looks like a small protruding pipe in the center of the top
portion of the meter. Carefully wipe the meter dome clean with the damp cloth.
2. Hold the template with the protruding tab facing you
and the white arrow pointing away from you. Peel off
the adhesive backing.
3. Position the template on the meter so that the
horizontal white line on the template follows the front
edge of the meter dome, and the white arrow points
straight to the optical port.
4. Carefully stick the template to the dome, pressing it in
place on top first, then on the protruding tab down the
front of the dome.
5. Slide the Sensor Unit over the glass dome and
align the edges of the Sensor Unit body with
the white side lines.
6. Tighten the hose clamp A until the Sensor
Unit is snug, but can move just enough to allow
for adjustments.
7. Open the Sensor Arm latch G and sight down
the opening. You see a vertical plastic tab painted
white on the inside of the Sensor body.
8. Sighting through the opening, position the Sensor
Unit so that the white plastic tab on the body is
aligned with the arrow on the template.
9. Press the RESET button and wait 10 seconds.
The red STATUS indicator turns on solid.
10. Keeping the white lines on the body and template
aligned, slowly and gently push or pull on the
Sensor Unit until the red STATUS indicator starts
flashing regularly, indicating that the Sensor Unit
has detected the signal from your meter. Within
1 minute, in addition to the regular flashing, you
should see an extra flash every now and then,
depending on your rate of electricity consumption. These extra flashes are normal, and indicate
that the Sensor Unit is reading the meter’s output
correctly.
Note 1: The STATUS indicator stops flashing after 2 minutes, in order to
maximize battery life. If you have not seen at least one extra flash by then,
please read the Troubleshooting section in your User Guide.
Note 2: If the STATUS indicator doesn’t flash at all and stays lit solid, please
read the Troubleshooting section in your User Guide.
7
10
Synchronize Your Sensor and Display Units
Startup Screen
ID Screen
$
PROG/SYNC
TIER 1
$
TOTAL
TOTAL
PM
SUN
1. Press and hold the PROG/SYNC
button until the Display Unit
beeps twice (about 5 seconds)
and displays the ID screen.
Wireless Communications
Frequency
Update Rate
Range
TIER 1
$
PM
SUN
2. Press and release the RESET
button on the battery cover of the
Sensor Unit. The Display Unit now
displays the Startup screen.
Your Display Unit should start
displaying real-time information
within a few minutes.
11
Finalize the Installation
1. Tighten the hose clamp A just enough so that the Sensor Unit cannot move.
2. Turn off the appliance you turned on when you started.
Your Sensor Unit should now be correctly installed and communicating
with your Display Unit.
If there is a problem, please read the Troubleshooting section in the
User Guide.
Technical Specifications
Power
Display Unit
Sensor Unit
Operating Temperature Range
Display Unit
Sensor Unit
Altitude
Display Unit
Relative Humidity
Display Unit
Pollution
Display Unit
2 AA Alkaline Batteries (LR6 or equivalent)
2 AA Alkaline Batteries (LR6 or equivalent)
2 AA Lithium Batteries for temperatures consistently below -20 ºC
433.92MHz
Approximately every 30 seconds
Up to 30m (100ft.) line-of-sight (Subtract 5m or 15 feet
for each wall between Display and Sensor Units)
10°C to 40°C (50°F to 104°F). For indoor use only
-40°C to 60°C (-40°F to 140°F)
2,000 meters maximum
80% for temperatures up to 31°C decreasing linearly to 50% at 40°C
Pollution Degree 2
FCC INFORMATION
FCC Class B Part 15
This device complies with part 15 of the FCC Rules.
This equipment has been tested and found to comply with the limits for a Class
B digital device, pursuant to part 15 of the FCC Rules. These limits are designed
to provide reasonable protection against harmful interference in a residential
installation. This equipment generates, uses, and can radiate radio frequency
energy and, if not installed and used in accordance with the instructions, may
cause harmful interference to radio communications. However, there is no guarantee that interference will not occur in a particular installation. If this equipment does cause harmful interference to radio or television reception, which can
be determined by turning the equipment off and on, the user is encouraged to
try to correct the interference by one or more of the following measures:
s 2EORIENTORRELOCATETHERECEIVINGANTENNA
s )NCREASETHESEPARATIONBETWEENTHEEQUIPMENTANDRECEIVER
s #ONNECTTHEEQUIPMENTINTOANOUTLETONACIRCUITDIFFERENTFROMTHAT
to which the receiver is connected.
s #ONSULTTHEDEALERORANEXPERIENCEDRADIO46TECHNICIANFORHELP
Industry Canada Certification
Operation is subject to the following two conditions:
s 4HISDEVICEMAYNOTCAUSEHARMFULINTERFERENCEAND
s 4HISDEVICEMUSTACCEPTANYINTERFERENCERECEIVEDINCLUDINGINTERFERENCE
that may cause undesired operation.
Blue Line Innovations Inc.
187 Kenmount Road
1st Floor, ICON Building
St. John’s, NL Canada, A1B 3P9
[email protected]
www.bluelineinnovations.com
Toll Free: 1-866-607-2583
© 2008. Blue Line Innovations Incorporated. All
rights reserved. Information in this document
is subject to change without notice. Blue Line
Innovations and PowerCost Monitor are trademarks of Blue Line Innovations Incorporated.
All other trademarks are the property of their
respective owners.
Printed in China
BLI-00301R001
8