1
Maintenance Guide
HP bh5700 ATCA 14-Slot Blade Server
First Edition
Manufacturing Part Number : AD171-9605A
June 2006
Legal Notices
The information in this document is subject to change without notice.
Hewlett-Packard makes no warranty of any kind with regard to this manual, including, but not limited to,
the implied warranties of merchantability and fitness for a particular purpose. Hewlett- Packard shall not be
held liable for errors contained herein or direct, indirect, special, incidental or consequential damages in
connection with the furnishing, performance, or use of this material.
Restricted Rights Legend. Use, duplication or disclosure by the U.S. Government is subject to restrictions as
set forth in subparagraph (c) (1) (ii) of the Rights in Technical Data and Computer Software clause at DFARS
252.227-7013 for DOD agencies, and subparagraphs (c) (1) and (c) (2) of the Commercial Computer Software
Restricted Rights clause at FAR 52.227-19 for other agencies.
Information in this document is provided in connection with Intel® products. No license, express or implied,
by estoppel or otherwise, to any intellectual property rights is granted by this document. Except as provided
in Intel's Terms and Conditions of Sale for such products, Intel assumes no liability whatsoever, and Intel
disclaims any express or implied warranty, relating to sale and/or use of Intel products including liability or
warranties relating to fitness for a particular purpose, merchantability, or infringement of any patent,
copyright or other intellectual property right. Intel products are not intended for use in medical, life saving,
or life sustaining applications.
Intel may make changes to specifications and product descriptions at any time, without notice.
HEWLETT-PACKARD COMPANY 3000 Hanover Street Palo Alto, California 94304 U.S.A.
Copyright Notice. Copyright ©2003 Hewlett-Packard Development Company, L.P. Reproduction, adaptation,
or translation of this document without prior written permission is prohibited, except as allowed under the
copyright laws.
Additional Copyright Notices. AdvancedTCA® is a registered trademark of the PCI Industrial Computer
Manufacturers Group. Linux® is a registered trademark of Linus Torvalds.
2
Contents
1. Field Replaceable Unit Removal and Replacement
Introduction . . . . . . . . . . . . . . . . . . . . . . . . . . . . . . . . . . . . . . . . . . . . . . . . . . . . . . . . . . . . . . . . . . . . . . . .
Required Tools . . . . . . . . . . . . . . . . . . . . . . . . . . . . . . . . . . . . . . . . . . . . . . . . . . . . . . . . . . . . . . . . . . . . . .
Power-Off Field Replaceable Units . . . . . . . . . . . . . . . . . . . . . . . . . . . . . . . . . . . . . . . . . . . . . . . . . . . . . .
Hot-Swap Field Replaceable Units . . . . . . . . . . . . . . . . . . . . . . . . . . . . . . . . . . . . . . . . . . . . . . . . . . . . . .
Safety and Environmental Considerations. . . . . . . . . . . . . . . . . . . . . . . . . . . . . . . . . . . . . . . . . . . . . . . .
Electrical Safety . . . . . . . . . . . . . . . . . . . . . . . . . . . . . . . . . . . . . . . . . . . . . . . . . . . . . . . . . . . . . . . . . . .
Communications Interference . . . . . . . . . . . . . . . . . . . . . . . . . . . . . . . . . . . . . . . . . . . . . . . . . . . . . . . .
Electrostatic Discharge Hazard to Equipment . . . . . . . . . . . . . . . . . . . . . . . . . . . . . . . . . . . . . . . . . . .
Removing Power from the Shelf . . . . . . . . . . . . . . . . . . . . . . . . . . . . . . . . . . . . . . . . . . . . . . . . . . . . . . . .
Power Entry Modules (PEMs) and PEM Fuses . . . . . . . . . . . . . . . . . . . . . . . . . . . . . . . . . . . . . . . . . . . .
Removing a Power Entry Module . . . . . . . . . . . . . . . . . . . . . . . . . . . . . . . . . . . . . . . . . . . . . . . . . . . . .
Replacing a Power Entry Module. . . . . . . . . . . . . . . . . . . . . . . . . . . . . . . . . . . . . . . . . . . . . . . . . . . . . .
Removing and Replacing Power Entry Module (PEM) Fuses . . . . . . . . . . . . . . . . . . . . . . . . . . . . . . .
Shelf Manager . . . . . . . . . . . . . . . . . . . . . . . . . . . . . . . . . . . . . . . . . . . . . . . . . . . . . . . . . . . . . . . . . . . . . .
Removing a Shelf Manager Unit . . . . . . . . . . . . . . . . . . . . . . . . . . . . . . . . . . . . . . . . . . . . . . . . . . . . . .
Replacing a Shelf Manager . . . . . . . . . . . . . . . . . . . . . . . . . . . . . . . . . . . . . . . . . . . . . . . . . . . . . . . . . .
Ethernet Switch Blade. . . . . . . . . . . . . . . . . . . . . . . . . . . . . . . . . . . . . . . . . . . . . . . . . . . . . . . . . . . . . . . .
Removing an Ethernet Switch Blade. . . . . . . . . . . . . . . . . . . . . . . . . . . . . . . . . . . . . . . . . . . . . . . . . . .
Replacing an Ethernet Switch Blade. . . . . . . . . . . . . . . . . . . . . . . . . . . . . . . . . . . . . . . . . . . . . . . . . . .
HP bc2100 ATCA Server Blade . . . . . . . . . . . . . . . . . . . . . . . . . . . . . . . . . . . . . . . . . . . . . . . . . . . . . . . . .
Removing an HP bc2100 ATCA Server Blade . . . . . . . . . . . . . . . . . . . . . . . . . . . . . . . . . . . . . . . . . . . .
Replacing an HP bc2100 ATCA Server Blade . . . . . . . . . . . . . . . . . . . . . . . . . . . . . . . . . . . . . . . . . . . .
Fan Trays . . . . . . . . . . . . . . . . . . . . . . . . . . . . . . . . . . . . . . . . . . . . . . . . . . . . . . . . . . . . . . . . . . . . . . . . . .
Removing a Fan Tray . . . . . . . . . . . . . . . . . . . . . . . . . . . . . . . . . . . . . . . . . . . . . . . . . . . . . . . . . . . . . . .
Replacing a Fan Tray . . . . . . . . . . . . . . . . . . . . . . . . . . . . . . . . . . . . . . . . . . . . . . . . . . . . . . . . . . . . . . .
Air Filter. . . . . . . . . . . . . . . . . . . . . . . . . . . . . . . . . . . . . . . . . . . . . . . . . . . . . . . . . . . . . . . . . . . . . . . . . . .
Air Filter Element Replacement Schedule . . . . . . . . . . . . . . . . . . . . . . . . . . . . . . . . . . . . . . . . . . . . . .
Removing the Air Filter . . . . . . . . . . . . . . . . . . . . . . . . . . . . . . . . . . . . . . . . . . . . . . . . . . . . . . . . . . . . .
Replacing the Air Filter . . . . . . . . . . . . . . . . . . . . . . . . . . . . . . . . . . . . . . . . . . . . . . . . . . . . . . . . . . . . .
Backplane SEEPROM Assemblies . . . . . . . . . . . . . . . . . . . . . . . . . . . . . . . . . . . . . . . . . . . . . . . . . . . . . .
Removing a 14-Slot Shelf SEEPROM Assembly. . . . . . . . . . . . . . . . . . . . . . . . . . . . . . . . . . . . . . . . . .
Replacing a 14-Slot Self SEEPROM Assembly . . . . . . . . . . . . . . . . . . . . . . . . . . . . . . . . . . . . . . . . . . .
Alarm Display Panel and Alarm Connector Panel. . . . . . . . . . . . . . . . . . . . . . . . . . . . . . . . . . . . . . . . . .
Removing and Replacing the Alarm Display Panel . . . . . . . . . . . . . . . . . . . . . . . . . . . . . . . . . . . . . . .
Removing the Alarm Display Panel . . . . . . . . . . . . . . . . . . . . . . . . . . . . . . . . . . . . . . . . . . . . . . . . . .
Replacing the Alarm Display Panel . . . . . . . . . . . . . . . . . . . . . . . . . . . . . . . . . . . . . . . . . . . . . . . . . .
Removing and Replacing the Alarm Connector Panel . . . . . . . . . . . . . . . . . . . . . . . . . . . . . . . . . . . . .
Removing the Alarm Connector Panel . . . . . . . . . . . . . . . . . . . . . . . . . . . . . . . . . . . . . . . . . . . . . . . .
Replacing the Alarm Connector Panel . . . . . . . . . . . . . . . . . . . . . . . . . . . . . . . . . . . . . . . . . . . . . . . .
Cable Trays and Rack Mounting Flange Kit . . . . . . . . . . . . . . . . . . . . . . . . . . . . . . . . . . . . . . . . . . . . . .
Removing and Replacing Rack Mount Flanges. . . . . . . . . . . . . . . . . . . . . . . . . . . . . . . . . . . . . . . . . . .
Removing and Replacing Cable Trays . . . . . . . . . . . . . . . . . . . . . . . . . . . . . . . . . . . . . . . . . . . . . . . . . .
14-Slot Shelf Chassis and Backplane . . . . . . . . . . . . . . . . . . . . . . . . . . . . . . . . . . . . . . . . . . . . . . . . . . . .
Removing the 14-Slot Shelf Chassis and Backplane . . . . . . . . . . . . . . . . . . . . . . . . . . . . . . . . . . . . . .
Replacing the 14-Slot Shelf Chassis with Backplane . . . . . . . . . . . . . . . . . . . . . . . . . . . . . . . . . . . . . .
22
24
25
26
27
27
27
27
29
30
30
31
32
34
34
35
36
36
37
39
39
41
42
42
43
44
44
44
45
46
47
47
49
49
49
50
51
51
52
54
54
55
58
58
61
3
Contents
HP bc2100 ATCA Server Blade Hard Disk Drive . . . . . . . . . . . . . . . . . . . . . . . . . . . . . . . . . . . . . . . . . .
Removing the Hard Disk Drive and Mounting Kit . . . . . . . . . . . . . . . . . . . . . . . . . . . . . . . . . . . . . . . .
Replacing the Hard Disk Drive and Mounting Brackets . . . . . . . . . . . . . . . . . . . . . . . . . . . . . . . . . . .
HP bc2100 ATCA Server Blade Memory Modules . . . . . . . . . . . . . . . . . . . . . . . . . . . . . . . . . . . . . . . . . .
Removing the DIMMs. . . . . . . . . . . . . . . . . . . . . . . . . . . . . . . . . . . . . . . . . . . . . . . . . . . . . . . . . . . . . . .
Replacing the Memory Modules. . . . . . . . . . . . . . . . . . . . . . . . . . . . . . . . . . . . . . . . . . . . . . . . . . . . . . .
64
64
68
69
69
70
2. LED Indicators
Introduction . . . . . . . . . . . . . . . . . . . . . . . . . . . . . . . . . . . . . . . . . . . . . . . . . . . . . . . . . . . . . . . . . . . . . . . . 74
Ethernet Switch Blade. . . . . . . . . . . . . . . . . . . . . . . . . . . . . . . . . . . . . . . . . . . . . . . . . . . . . . . . . . . . . . . . 75
Normal LED Activity . . . . . . . . . . . . . . . . . . . . . . . . . . . . . . . . . . . . . . . . . . . . . . . . . . . . . . . . . . . . . . . 76
Abnormal LED Activity . . . . . . . . . . . . . . . . . . . . . . . . . . . . . . . . . . . . . . . . . . . . . . . . . . . . . . . . . . . . . 78
14-Slot Shelf . . . . . . . . . . . . . . . . . . . . . . . . . . . . . . . . . . . . . . . . . . . . . . . . . . . . . . . . . . . . . . . . . . . . . . . . 82
Shelf Alarm display . . . . . . . . . . . . . . . . . . . . . . . . . . . . . . . . . . . . . . . . . . . . . . . . . . . . . . . . . . . . . . . . 82
Troubleshooting the Shelf Alarm Display Panel. . . . . . . . . . . . . . . . . . . . . . . . . . . . . . . . . . . . . . . . . . 83
Connection Between the Shelf Manager and ADP . . . . . . . . . . . . . . . . . . . . . . . . . . . . . . . . . . . . . . . . 86
Shelf Alarm Display Horizontal Board Connector . . . . . . . . . . . . . . . . . . . . . . . . . . . . . . . . . . . . . . . . 88
Alarm Display Panel Telco Alarms . . . . . . . . . . . . . . . . . . . . . . . . . . . . . . . . . . . . . . . . . . . . . . . . . . . . 90
Telco Alarm Interface . . . . . . . . . . . . . . . . . . . . . . . . . . . . . . . . . . . . . . . . . . . . . . . . . . . . . . . . . . . . . 90
Telco Alarm LEDs . . . . . . . . . . . . . . . . . . . . . . . . . . . . . . . . . . . . . . . . . . . . . . . . . . . . . . . . . . . . . . . . 90
Telco Alarm Cutoff Pushbuttons . . . . . . . . . . . . . . . . . . . . . . . . . . . . . . . . . . . . . . . . . . . . . . . . . . . . 90
Telco Alarm Connector on the Shelf Alarm Panel. . . . . . . . . . . . . . . . . . . . . . . . . . . . . . . . . . . . . . . 91
Troubleshooting the Shelf Alarm Panel. . . . . . . . . . . . . . . . . . . . . . . . . . . . . . . . . . . . . . . . . . . . . . . 92
Alarm Connector Panel Horizontal Board Connector . . . . . . . . . . . . . . . . . . . . . . . . . . . . . . . . . . . . 92
Alarm Display Panel Temperature Sensor . . . . . . . . . . . . . . . . . . . . . . . . . . . . . . . . . . . . . . . . . . . . . . 93
Fan Trays . . . . . . . . . . . . . . . . . . . . . . . . . . . . . . . . . . . . . . . . . . . . . . . . . . . . . . . . . . . . . . . . . . . . . . . . 93
Fan Tray Signals . . . . . . . . . . . . . . . . . . . . . . . . . . . . . . . . . . . . . . . . . . . . . . . . . . . . . . . . . . . . . . . . . 95
Fan Tray Temperature Sensor . . . . . . . . . . . . . . . . . . . . . . . . . . . . . . . . . . . . . . . . . . . . . . . . . . . . . . 97
Fan Tray Control Board SEEPROM . . . . . . . . . . . . . . . . . . . . . . . . . . . . . . . . . . . . . . . . . . . . . . . . . 97
Fan Tray Connectors and Indicators . . . . . . . . . . . . . . . . . . . . . . . . . . . . . . . . . . . . . . . . . . . . . . . . . 97
Troubleshooting Fan Trays . . . . . . . . . . . . . . . . . . . . . . . . . . . . . . . . . . . . . . . . . . . . . . . . . . . . . . . . . 98
Power Entry Module (PEM) . . . . . . . . . . . . . . . . . . . . . . . . . . . . . . . . . . . . . . . . . . . . . . . . . . . . . . . . . . 99
PEM Components . . . . . . . . . . . . . . . . . . . . . . . . . . . . . . . . . . . . . . . . . . . . . . . . . . . . . . . . . . . . . . . 100
PEM I/O Device . . . . . . . . . . . . . . . . . . . . . . . . . . . . . . . . . . . . . . . . . . . . . . . . . . . . . . . . . . . . . . . . . 101
Troubleshooting the Power Entry Module . . . . . . . . . . . . . . . . . . . . . . . . . . . . . . . . . . . . . . . . . . . . 102
Shelf Manager LEDs . . . . . . . . . . . . . . . . . . . . . . . . . . . . . . . . . . . . . . . . . . . . . . . . . . . . . . . . . . . . . . 104
Front Panel Components . . . . . . . . . . . . . . . . . . . . . . . . . . . . . . . . . . . . . . . . . . . . . . . . . . . . . . . . . 104
Ethernet Channels . . . . . . . . . . . . . . . . . . . . . . . . . . . . . . . . . . . . . . . . . . . . . . . . . . . . . . . . . . . . . . 104
Hardware Redundancy Interface . . . . . . . . . . . . . . . . . . . . . . . . . . . . . . . . . . . . . . . . . . . . . . . . . . . 105
Hot-Swap LED. . . . . . . . . . . . . . . . . . . . . . . . . . . . . . . . . . . . . . . . . . . . . . . . . . . . . . . . . . . . . . . . . . 106
Troubleshooting the Shelf Manager. . . . . . . . . . . . . . . . . . . . . . . . . . . . . . . . . . . . . . . . . . . . . . . . . 106
HP bc2100 ATCA Server Blade . . . . . . . . . . . . . . . . . . . . . . . . . . . . . . . . . . . . . . . . . . . . . . . . . . . . . . . . 109
Front Panel LEDs . . . . . . . . . . . . . . . . . . . . . . . . . . . . . . . . . . . . . . . . . . . . . . . . . . . . . . . . . . . . . . . . . 109
Out of Service (OOS) LED . . . . . . . . . . . . . . . . . . . . . . . . . . . . . . . . . . . . . . . . . . . . . . . . . . . . . . . . . . 111
Health LED . . . . . . . . . . . . . . . . . . . . . . . . . . . . . . . . . . . . . . . . . . . . . . . . . . . . . . . . . . . . . . . . . . . . . . 111
IDE Drive Activity LED . . . . . . . . . . . . . . . . . . . . . . . . . . . . . . . . . . . . . . . . . . . . . . . . . . . . . . . . . . . . 112
4
Contents
Network Link and Speed LEDs (10, 100, 1000 Mbps Ethernet) . . . . . . . . . . . . . . . . . . . . . . . . . . . .
User-Programmable LEDs . . . . . . . . . . . . . . . . . . . . . . . . . . . . . . . . . . . . . . . . . . . . . . . . . . . . . . . . . .
Ethernet Controller Port State (Base Ethernet Activity/Link) LEDs . . . . . . . . . . . . . . . . . . . . . . . .
Hot-Swap LED (DS10) . . . . . . . . . . . . . . . . . . . . . . . . . . . . . . . . . . . . . . . . . . . . . . . . . . . . . . . . . . . . .
Reset Button . . . . . . . . . . . . . . . . . . . . . . . . . . . . . . . . . . . . . . . . . . . . . . . . . . . . . . . . . . . . . . . . . . . . .
Troubleshooting the HP bc2100 ATCA Server Blade . . . . . . . . . . . . . . . . . . . . . . . . . . . . . . . . . . . . .
Shelf Manager Redundant Operation. . . . . . . . . . . . . . . . . . . . . . . . . . . . . . . . . . . . . . . . . . . . . . . . . . .
112
113
114
114
115
115
118
3. Diagnostics
Introduction . . . . . . . . . . . . . . . . . . . . . . . . . . . . . . . . . . . . . . . . . . . . . . . . . . . . . . . . . . . . . . . . . . . . . . .
General ATCA Diagnostics for the Shelf Management Module (ShMM) . . . . . . . . . . . . . . . . . . . . . . .
Using the Command Line Interface . . . . . . . . . . . . . . . . . . . . . . . . . . . . . . . . . . . . . . . . . . . . . . . . . .
Diagnostic Commands . . . . . . . . . . . . . . . . . . . . . . . . . . . . . . . . . . . . . . . . . . . . . . . . . . . . . . . . . . . . .
board [physical slot #]. . . . . . . . . . . . . . . . . . . . . . . . . . . . . . . . . . . . . . . . . . . . . . . . . . . . . . . . . . . . . .
boardreset <physical slot #>. . . . . . . . . . . . . . . . . . . . . . . . . . . . . . . . . . . . . . . . . . . . . . . . . . . . . . . . .
deactivate <addr> <fru_id> . . . . . . . . . . . . . . . . . . . . . . . . . . . . . . . . . . . . . . . . . . . . . . . . . . . . . . . . .
debuglevel [mask] . . . . . . . . . . . . . . . . . . . . . . . . . . . . . . . . . . . . . . . . . . . . . . . . . . . . . . . . . . . . . . . . .
fans [addr] [fru_id] . . . . . . . . . . . . . . . . . . . . . . . . . . . . . . . . . . . . . . . . . . . . . . . . . . . . . . . . . . . . . . . .
fru [addr] . . . . . . . . . . . . . . . . . . . . . . . . . . . . . . . . . . . . . . . . . . . . . . . . . . . . . . . . . . . . . . . . . . . . . . . .
fruinfo <addr> <fru_id> . . . . . . . . . . . . . . . . . . . . . . . . . . . . . . . . . . . . . . . . . . . . . . . . . . . . . . . . . . . .
frucontrol <addr> <fru_id> <command> . . . . . . . . . . . . . . . . . . . . . . . . . . . . . . . . . . . . . . . . . . . . . . .
getthreshold <addr> [lun:][sensor #] . . . . . . . . . . . . . . . . . . . . . . . . . . . . . . . . . . . . . . . . . . . . . . . . . .
ipmc [addr] . . . . . . . . . . . . . . . . . . . . . . . . . . . . . . . . . . . . . . . . . . . . . . . . . . . . . . . . . . . . . . . . . . . . . .
sel [-v] [info] or [clear]. . . . . . . . . . . . . . . . . . . . . . . . . . . . . . . . . . . . . . . . . . . . . . . . . . . . . . . . . . . . . .
sensor [<addr> [[lun:]<sensor id>]. . . . . . . . . . . . . . . . . . . . . . . . . . . . . . . . . . . . . . . . . . . . . . . . . . . .
sensordata [<addr> [[lun: ]<sensor id>] . . . . . . . . . . . . . . . . . . . . . . . . . . . . . . . . . . . . . . . . . . . . . . .
shelf <sub-command> . . . . . . . . . . . . . . . . . . . . . . . . . . . . . . . . . . . . . . . . . . . . . . . . . . . . . . . . . . . . . .
showunhealthy . . . . . . . . . . . . . . . . . . . . . . . . . . . . . . . . . . . . . . . . . . . . . . . . . . . . . . . . . . . . . . . . . . .
Shelf Manager (ShMM) Functional Specifications . . . . . . . . . . . . . . . . . . . . . . . . . . . . . . . . . . . . . . . .
ShMM Diagnostics Functionality and Features . . . . . . . . . . . . . . . . . . . . . . . . . . . . . . . . . . . . . . . . .
ShMM Diagnostics Performance . . . . . . . . . . . . . . . . . . . . . . . . . . . . . . . . . . . . . . . . . . . . . . . . . . . . .
ShMM Diagnostics Security . . . . . . . . . . . . . . . . . . . . . . . . . . . . . . . . . . . . . . . . . . . . . . . . . . . . . . . . .
ShMM Diagnostics Valid Configurations . . . . . . . . . . . . . . . . . . . . . . . . . . . . . . . . . . . . . . . . . . . . . .
Power-on Self Test (POST) . . . . . . . . . . . . . . . . . . . . . . . . . . . . . . . . . . . . . . . . . . . . . . . . . . . . . . . .
post_normal . . . . . . . . . . . . . . . . . . . . . . . . . . . . . . . . . . . . . . . . . . . . . . . . . . . . . . . . . . . . . . . . .
post_poweron . . . . . . . . . . . . . . . . . . . . . . . . . . . . . . . . . . . . . . . . . . . . . . . . . . . . . . . . . . . . . . . .
Online Tests . . . . . . . . . . . . . . . . . . . . . . . . . . . . . . . . . . . . . . . . . . . . . . . . . . . . . . . . . . . . . . . . . . . . .
CPU Error Daemon . . . . . . . . . . . . . . . . . . . . . . . . . . . . . . . . . . . . . . . . . . . . . . . . . . . . . . . . . . . . . . .
Shelf Manager (ShMM) Diagnostics User Interface . . . . . . . . . . . . . . . . . . . . . . . . . . . . . . . . . . . . . . .
ShMM Diagnostics Overall Interface Description . . . . . . . . . . . . . . . . . . . . . . . . . . . . . . . . . . . . . . .
Power-On Self Tests . . . . . . . . . . . . . . . . . . . . . . . . . . . . . . . . . . . . . . . . . . . . . . . . . . . . . . . . . . . . . . .
Online Tests . . . . . . . . . . . . . . . . . . . . . . . . . . . . . . . . . . . . . . . . . . . . . . . . . . . . . . . . . . . . . . . . . . . . .
Hardware Tests . . . . . . . . . . . . . . . . . . . . . . . . . . . . . . . . . . . . . . . . . . . . . . . . . . . . . . . . . . . . . . . . .
Memory Tests . . . . . . . . . . . . . . . . . . . . . . . . . . . . . . . . . . . . . . . . . . . . . . . . . . . . . . . . . . . . . . . . . .
CPU Error Daemon . . . . . . . . . . . . . . . . . . . . . . . . . . . . . . . . . . . . . . . . . . . . . . . . . . . . . . . . . . . . . . .
ShMM Diagnostics UI Syntax and Semantics . . . . . . . . . . . . . . . . . . . . . . . . . . . . . . . . . . . . . . . . . .
120
121
121
121
122
122
122
123
123
123
124
125
125
126
126
127
128
128
129
130
130
130
130
130
130
131
131
131
131
132
132
132
132
132
132
133
133
5
Contents
Power-On Self Test (POST). . . . . . . . . . . . . . . . . . . . . . . . . . . . . . . . . . . . . . . . . . . . . . . . . . . . . . . .
Online Tests . . . . . . . . . . . . . . . . . . . . . . . . . . . . . . . . . . . . . . . . . . . . . . . . . . . . . . . . . . . . . . . . . . . . .
shmm_uart_test [-e] . . . . . . . . . . . . . . . . . . . . . . . . . . . . . . . . . . . . . . . . . . . . . . . . . . . . . . . . . . . . .
shmm_eth_test [-a <ip_addr>] . . . . . . . . . . . . . . . . . . . . . . . . . . . . . . . . . . . . . . . . . . . . . . . . . . . . .
shmm_crc_test . . . . . . . . . . . . . . . . . . . . . . . . . . . . . . . . . . . . . . . . . . . . . . . . . . . . . . . . . . . . . . . . . .
Memory tests . . . . . . . . . . . . . . . . . . . . . . . . . . . . . . . . . . . . . . . . . . . . . . . . . . . . . . . . . . . . . . . . . . .
mem01 . . . . . . . . . . . . . . . . . . . . . . . . . . . . . . . . . . . . . . . . . . . . . . . . . . . . . . . . . . . . . . . . . . . . . .
mem02 . . . . . . . . . . . . . . . . . . . . . . . . . . . . . . . . . . . . . . . . . . . . . . . . . . . . . . . . . . . . . . . . . . . . . .
CPU Error Daemon . . . . . . . . . . . . . . . . . . . . . . . . . . . . . . . . . . . . . . . . . . . . . . . . . . . . . . . . . . .
Ethernet Switch Blade Functional Specifications . . . . . . . . . . . . . . . . . . . . . . . . . . . . . . . . . . . . . . . . .
Ethernet Switch Blade Diagnostics Features . . . . . . . . . . . . . . . . . . . . . . . . . . . . . . . . . . . . . . . . . . .
HP bc2100 ATCA Server Blade Functional Specifications . . . . . . . . . . . . . . . . . . . . . . . . . . . . . . . . . .
HP bc2100 ATCA Server Blade Diagnostics Features . . . . . . . . . . . . . . . . . . . . . . . . . . . . . . . . . . . .
Server Blade Diagnostics Performance . . . . . . . . . . . . . . . . . . . . . . . . . . . . . . . . . . . . . . . . . . . . . .
Server Blade Diagnostics Security . . . . . . . . . . . . . . . . . . . . . . . . . . . . . . . . . . . . . . . . . . . . . . . . . .
Server Blade Diagnostics Valid Configurations . . . . . . . . . . . . . . . . . . . . . . . . . . . . . . . . . . . . . . .
PXE Boot . . . . . . . . . . . . . . . . . . . . . . . . . . . . . . . . . . . . . . . . . . . . . . . . . . . . . . . . . . . . . . . . . . . .
Booting from CD with BDP ISO image . . . . . . . . . . . . . . . . . . . . . . . . . . . . . . . . . . . . . . . . . . . .
Configuring BIOS Settings for Remote Boot. . . . . . . . . . . . . . . . . . . . . . . . . . . . . . . . . . . . . . . .
Selecting the Diagnostic Boot Sequence . . . . . . . . . . . . . . . . . . . . . . . . . . . . . . . . . . . . . . . . . . . . .
Service OS Configuration Information . . . . . . . . . . . . . . . . . . . . . . . . . . . . . . . . . . . . . . . . . . . . . .
User logins and passwords. . . . . . . . . . . . . . . . . . . . . . . . . . . . . . . . . . . . . . . . . . . . . . . . . . . . . .
Network configuration . . . . . . . . . . . . . . . . . . . . . . . . . . . . . . . . . . . . . . . . . . . . . . . . . . . . . . . . . . .
HP bc2100 ATCA Server Blade User Interface . . . . . . . . . . . . . . . . . . . . . . . . . . . . . . . . . . . . . . . . . . .
HP bc2100 ATCA Server Blade Diagnostics Interface Description . . . . . . . . . . . . . . . . . . . . . . . . . .
HP bc2100 ATCA Server Blade Diagnostics Overview. . . . . . . . . . . . . . . . . . . . . . . . . . . . . . . . . . . .
HP bc2100 ATCA Server Blade Diagnostics Syntax and Semantics of UI . . . . . . . . . . . . . . . . . . . . . .
BDP CLI . . . . . . . . . . . . . . . . . . . . . . . . . . . . . . . . . . . . . . . . . . . . . . . . . . . . . . . . . . . . . . . . . . . . . . . .
CLI Usage . . . . . . . . . . . . . . . . . . . . . . . . . . . . . . . . . . . . . . . . . . . . . . . . . . . . . . . . . . . . . . . . . . . . . . .
BDP CLI Examples. . . . . . . . . . . . . . . . . . . . . . . . . . . . . . . . . . . . . . . . . . . . . . . . . . . . . . . . . . . . . . . .
Customizing BDP . . . . . . . . . . . . . . . . . . . . . . . . . . . . . . . . . . . . . . . . . . . . . . . . . . . . . . . . . . . . . . . . .
“t” Command Line Interface. . . . . . . . . . . . . . . . . . . . . . . . . . . . . . . . . . . . . . . . . . . . . . . . . . . . . . . . .
“t” Quick Start . . . . . . . . . . . . . . . . . . . . . . . . . . . . . . . . . . . . . . . . . . . . . . . . . . . . . . . . . . . . . . . . . .
“t” Commands and Parameters . . . . . . . . . . . . . . . . . . . . . . . . . . . . . . . . . . . . . . . . . . . . . . . . . . . .
t Test Results . . . . . . . . . . . . . . . . . . . . . . . . . . . . . . . . . . . . . . . . . . . . . . . . . . . . . . . . . . . . . . . . . . . .
t Screen Output . . . . . . . . . . . . . . . . . . . . . . . . . . . . . . . . . . . . . . . . . . . . . . . . . . . . . . . . . . . . . . . . .
t Summary File . . . . . . . . . . . . . . . . . . . . . . . . . . . . . . . . . . . . . . . . . . . . . . . . . . . . . . . . . . . . . . . . .
Environment Variable Return Code. . . . . . . . . . . . . . . . . . . . . . . . . . . . . . . . . . . . . . . . . . . . . . . . .
Tests and Subtest Descriptions . . . . . . . . . . . . . . . . . . . . . . . . . . . . . . . . . . . . . . . . . . . . . . . . . . . .
XTC Graphical User Interface . . . . . . . . . . . . . . . . . . . . . . . . . . . . . . . . . . . . . . . . . . . . . . . . . . . . . . .
Prerequisite to Using the XTC Program . . . . . . . . . . . . . . . . . . . . . . . . . . . . . . . . . . . . . . . . . . . . .
Getting Started . . . . . . . . . . . . . . . . . . . . . . . . . . . . . . . . . . . . . . . . . . . . . . . . . . . . . . . . . . . . . . . . .
Overview . . . . . . . . . . . . . . . . . . . . . . . . . . . . . . . . . . . . . . . . . . . . . . . . . . . . . . . . . . . . . . . . . . . . . .
Basic Concepts. . . . . . . . . . . . . . . . . . . . . . . . . . . . . . . . . . . . . . . . . . . . . . . . . . . . . . . . . . . . . . . . . .
Test Package . . . . . . . . . . . . . . . . . . . . . . . . . . . . . . . . . . . . . . . . . . . . . . . . . . . . . . . . . . . . . . . . .
Autoconfig Template. . . . . . . . . . . . . . . . . . . . . . . . . . . . . . . . . . . . . . . . . . . . . . . . . . . . . . . . . . .
6
133
134
134
134
135
136
136
137
137
139
139
140
140
140
140
141
141
141
141
143
143
143
144
146
146
146
147
147
147
148
148
149
149
150
155
155
156
156
156
156
156
157
158
159
159
159
Contents
Module. . . . . . . . . . . . . . . . . . . . . . . . . . . . . . . . . . . . . . . . . . . . . . . . . . . . . . . . . . . . . . . . . . . . . .
Device . . . . . . . . . . . . . . . . . . . . . . . . . . . . . . . . . . . . . . . . . . . . . . . . . . . . . . . . . . . . . . . . . . . . . .
Test . . . . . . . . . . . . . . . . . . . . . . . . . . . . . . . . . . . . . . . . . . . . . . . . . . . . . . . . . . . . . . . . . . . . . . . .
Parameter . . . . . . . . . . . . . . . . . . . . . . . . . . . . . . . . . . . . . . . . . . . . . . . . . . . . . . . . . . . . . . . . . . .
Test Flow Groups . . . . . . . . . . . . . . . . . . . . . . . . . . . . . . . . . . . . . . . . . . . . . . . . . . . . . . . . . . . . .
Test Flow Tree . . . . . . . . . . . . . . . . . . . . . . . . . . . . . . . . . . . . . . . . . . . . . . . . . . . . . . . . . . . . . . .
Configuration Tree . . . . . . . . . . . . . . . . . . . . . . . . . . . . . . . . . . . . . . . . . . . . . . . . . . . . . . . . . . . .
Message Types . . . . . . . . . . . . . . . . . . . . . . . . . . . . . . . . . . . . . . . . . . . . . . . . . . . . . . . . . . . . . . .
Summary File . . . . . . . . . . . . . . . . . . . . . . . . . . . . . . . . . . . . . . . . . . . . . . . . . . . . . . . . . . . . . . . .
Document File Types . . . . . . . . . . . . . . . . . . . . . . . . . . . . . . . . . . . . . . . . . . . . . . . . . . . . . . . . . .
User Interface . . . . . . . . . . . . . . . . . . . . . . . . . . . . . . . . . . . . . . . . . . . . . . . . . . . . . . . . . . . . . . . . . .
Test Modules Pane . . . . . . . . . . . . . . . . . . . . . . . . . . . . . . . . . . . . . . . . . . . . . . . . . . . . . . . . . . . .
Test Sequence Pane . . . . . . . . . . . . . . . . . . . . . . . . . . . . . . . . . . . . . . . . . . . . . . . . . . . . . . . . . . .
Message Redirection Pane . . . . . . . . . . . . . . . . . . . . . . . . . . . . . . . . . . . . . . . . . . . . . . . . . . . . . .
Test Message Pane . . . . . . . . . . . . . . . . . . . . . . . . . . . . . . . . . . . . . . . . . . . . . . . . . . . . . . . . . . . .
Test Summary Pane . . . . . . . . . . . . . . . . . . . . . . . . . . . . . . . . . . . . . . . . . . . . . . . . . . . . . . . . . . .
Property Dialog Boxes . . . . . . . . . . . . . . . . . . . . . . . . . . . . . . . . . . . . . . . . . . . . . . . . . . . . . . . . .
Device Node Dialog Box . . . . . . . . . . . . . . . . . . . . . . . . . . . . . . . . . . . . . . . . . . . . . . . . . . . . . .
Test Node Dialog Box . . . . . . . . . . . . . . . . . . . . . . . . . . . . . . . . . . . . . . . . . . . . . . . . . . . . . . . .
Flowgroup Node Dialog Box . . . . . . . . . . . . . . . . . . . . . . . . . . . . . . . . . . . . . . . . . . . . . . . . . . .
Param Node Dialog Box . . . . . . . . . . . . . . . . . . . . . . . . . . . . . . . . . . . . . . . . . . . . . . . . . . . . . .
Param View Tab . . . . . . . . . . . . . . . . . . . . . . . . . . . . . . . . . . . . . . . . . . . . . . . . . . . . . . . . . . . .
Menus and Toolbars . . . . . . . . . . . . . . . . . . . . . . . . . . . . . . . . . . . . . . . . . . . . . . . . . . . . . . . . . . .
File Menu. . . . . . . . . . . . . . . . . . . . . . . . . . . . . . . . . . . . . . . . . . . . . . . . . . . . . . . . . . . . . . . . . .
Edit Menu . . . . . . . . . . . . . . . . . . . . . . . . . . . . . . . . . . . . . . . . . . . . . . . . . . . . . . . . . . . . . . . . .
View Menu . . . . . . . . . . . . . . . . . . . . . . . . . . . . . . . . . . . . . . . . . . . . . . . . . . . . . . . . . . . . . . . . .
Insert Menu . . . . . . . . . . . . . . . . . . . . . . . . . . . . . . . . . . . . . . . . . . . . . . . . . . . . . . . . . . . . . . . .
Action Menu. . . . . . . . . . . . . . . . . . . . . . . . . . . . . . . . . . . . . . . . . . . . . . . . . . . . . . . . . . . . . . . .
Help Menu . . . . . . . . . . . . . . . . . . . . . . . . . . . . . . . . . . . . . . . . . . . . . . . . . . . . . . . . . . . . . . . . .
New Package Button . . . . . . . . . . . . . . . . . . . . . . . . . . . . . . . . . . . . . . . . . . . . . . . . . . . . . . . . .
Open File Button . . . . . . . . . . . . . . . . . . . . . . . . . . . . . . . . . . . . . . . . . . . . . . . . . . . . . . . . . . . .
Save File Button . . . . . . . . . . . . . . . . . . . . . . . . . . . . . . . . . . . . . . . . . . . . . . . . . . . . . . . . . . . .
Configuration Drop-Down. . . . . . . . . . . . . . . . . . . . . . . . . . . . . . . . . . . . . . . . . . . . . . . . . . . . .
Configuration Rename . . . . . . . . . . . . . . . . . . . . . . . . . . . . . . . . . . . . . . . . . . . . . . . . . . . . . . .
Clone Configuration . . . . . . . . . . . . . . . . . . . . . . . . . . . . . . . . . . . . . . . . . . . . . . . . . . . . . . . . .
Clone Configuration . . . . . . . . . . . . . . . . . . . . . . . . . . . . . . . . . . . . . . . . . . . . . . . . . . . . . . . . .
Status Bar . . . . . . . . . . . . . . . . . . . . . . . . . . . . . . . . . . . . . . . . . . . . . . . . . . . . . . . . . . . . . . . . . .
Right-Click Menu . . . . . . . . . . . . . . . . . . . . . . . . . . . . . . . . . . . . . . . . . . . . . . . . . . . . . . . . . . . .
Invocation Parameters . . . . . . . . . . . . . . . . . . . . . . . . . . . . . . . . . . . . . . . . . . . . . . . . . . . . . . . . . . .
file.pkg. . . . . . . . . . . . . . . . . . . . . . . . . . . . . . . . . . . . . . . . . . . . . . . . . . . . . . . . . . . . . . . . . . . . . .
/PKG . . . . . . . . . . . . . . . . . . . . . . . . . . . . . . . . . . . . . . . . . . . . . . . . . . . . . . . . . . . . . . . . . . . . . . .
/AUTO . . . . . . . . . . . . . . . . . . . . . . . . . . . . . . . . . . . . . . . . . . . . . . . . . . . . . . . . . . . . . . . . . . . . . .
/SELF . . . . . . . . . . . . . . . . . . . . . . . . . . . . . . . . . . . . . . . . . . . . . . . . . . . . . . . . . . . . . . . . . . . . . .
/RUN . . . . . . . . . . . . . . . . . . . . . . . . . . . . . . . . . . . . . . . . . . . . . . . . . . . . . . . . . . . . . . . . . . . . . . .
/CFG . . . . . . . . . . . . . . . . . . . . . . . . . . . . . . . . . . . . . . . . . . . . . . . . . . . . . . . . . . . . . . . . . . . . . . .
/PC . . . . . . . . . . . . . . . . . . . . . . . . . . . . . . . . . . . . . . . . . . . . . . . . . . . . . . . . . . . . . . . . . . . . . . . . .
159
160
160
160
160
160
160
161
161
161
162
162
163
164
164
166
167
167
168
170
171
171
173
173
174
175
175
176
177
177
178
178
178
178
178
178
178
178
179
180
180
180
180
180
181
181
7
Contents
/MINUTES . . . . . . . . . . . . . . . . . . . . . . . . . . . . . . . . . . . . . . . . . . . . . . . . . . . . . . . . . . . . . . . . . .
/LOOPS . . . . . . . . . . . . . . . . . . . . . . . . . . . . . . . . . . . . . . . . . . . . . . . . . . . . . . . . . . . . . . . . . . . . .
/N . . . . . . . . . . . . . . . . . . . . . . . . . . . . . . . . . . . . . . . . . . . . . . . . . . . . . . . . . . . . . . . . . . . . . . . . . .
/QUIT. . . . . . . . . . . . . . . . . . . . . . . . . . . . . . . . . . . . . . . . . . . . . . . . . . . . . . . . . . . . . . . . . . . . . . .
/HE. . . . . . . . . . . . . . . . . . . . . . . . . . . . . . . . . . . . . . . . . . . . . . . . . . . . . . . . . . . . . . . . . . . . . . . . .
/FOREVER . . . . . . . . . . . . . . . . . . . . . . . . . . . . . . . . . . . . . . . . . . . . . . . . . . . . . . . . . . . . . . . . . .
/SUMMARY . . . . . . . . . . . . . . . . . . . . . . . . . . . . . . . . . . . . . . . . . . . . . . . . . . . . . . . . . . . . . . . . .
/SF . . . . . . . . . . . . . . . . . . . . . . . . . . . . . . . . . . . . . . . . . . . . . . . . . . . . . . . . . . . . . . . . . . . . . . . . .
/V . . . . . . . . . . . . . . . . . . . . . . . . . . . . . . . . . . . . . . . . . . . . . . . . . . . . . . . . . . . . . . . . . . . . . . . . . .
/PORT . . . . . . . . . . . . . . . . . . . . . . . . . . . . . . . . . . . . . . . . . . . . . . . . . . . . . . . . . . . . . . . . . . . . . .
/Q . . . . . . . . . . . . . . . . . . . . . . . . . . . . . . . . . . . . . . . . . . . . . . . . . . . . . . . . . . . . . . . . . . . . . . . . . .
/L . . . . . . . . . . . . . . . . . . . . . . . . . . . . . . . . . . . . . . . . . . . . . . . . . . . . . . . . . . . . . . . . . . . . . . . . . .
/W. . . . . . . . . . . . . . . . . . . . . . . . . . . . . . . . . . . . . . . . . . . . . . . . . . . . . . . . . . . . . . . . . . . . . . . . . .
Message Redirection . . . . . . . . . . . . . . . . . . . . . . . . . . . . . . . . . . . . . . . . . . . . . . . . . . . . . . . . . . . . .
Autoconfigure . . . . . . . . . . . . . . . . . . . . . . . . . . . . . . . . . . . . . . . . . . . . . . . . . . . . . . . . . . . . . . . . . .
Autoconfigure Configuration Tree Updates . . . . . . . . . . . . . . . . . . . . . . . . . . . . . . . . . . . . . . . .
Disabled Tests . . . . . . . . . . . . . . . . . . . . . . . . . . . . . . . . . . . . . . . . . . . . . . . . . . . . . . . . . . . . . .
Remove Tests . . . . . . . . . . . . . . . . . . . . . . . . . . . . . . . . . . . . . . . . . . . . . . . . . . . . . . . . . . . . . . .
Remove Devices . . . . . . . . . . . . . . . . . . . . . . . . . . . . . . . . . . . . . . . . . . . . . . . . . . . . . . . . . . . . .
Clone Devices. . . . . . . . . . . . . . . . . . . . . . . . . . . . . . . . . . . . . . . . . . . . . . . . . . . . . . . . . . . . . . .
Change Parameter Values . . . . . . . . . . . . . . . . . . . . . . . . . . . . . . . . . . . . . . . . . . . . . . . . . . . .
Add New Parameters . . . . . . . . . . . . . . . . . . . . . . . . . . . . . . . . . . . . . . . . . . . . . . . . . . . . . . . .
Autoconfigure Flow Tree Updates . . . . . . . . . . . . . . . . . . . . . . . . . . . . . . . . . . . . . . . . . . . . . . . .
Re-Configure . . . . . . . . . . . . . . . . . . . . . . . . . . . . . . . . . . . . . . . . . . . . . . . . . . . . . . . . . . . . . . .
BIOS Settings. . . . . . . . . . . . . . . . . . . . . . . . . . . . . . . . . . . . . . . . . . . . . . . . . . . . . . . . . . . . . . . . . . . . . .
Using ipmitool to Request Diagnostic Boot . . . . . . . . . . . . . . . . . . . . . . . . . . . . . . . . . . . . . . . . . . . . . .
Customizing the Service OS ISO Image . . . . . . . . . . . . . . . . . . . . . . . . . . . . . . . . . . . . . . . . . . . . . . . . .
181
181
181
181
181
182
182
182
182
182
182
182
183
183
183
184
184
185
185
185
185
186
186
187
188
190
192
4. System Event Log Decoding
Introduction . . . . . . . . . . . . . . . . . . . . . . . . . . . . . . . . . . . . . . . . . . . . . . . . . . . . . . . . . . . . . . . . . . . . . . .
Accessing the SEL . . . . . . . . . . . . . . . . . . . . . . . . . . . . . . . . . . . . . . . . . . . . . . . . . . . . . . . . . . . . . . . .
Decoding an SEL Entry . . . . . . . . . . . . . . . . . . . . . . . . . . . . . . . . . . . . . . . . . . . . . . . . . . . . . . . . . . . .
System Event Log Record Structure . . . . . . . . . . . . . . . . . . . . . . . . . . . . . . . . . . . . . . . . . . . . . . . .
Example SEL Entry . . . . . . . . . . . . . . . . . . . . . . . . . . . . . . . . . . . . . . . . . . . . . . . . . . . . . . . . . . . . .
Decoding the Example SEL Entry . . . . . . . . . . . . . . . . . . . . . . . . . . . . . . . . . . . . . . . . . . . . . . . . . .
IPMB Address to Physical Slot Mapping for SEL Decoding . . . . . . . . . . . . . . . . . . . . . . . . . . . . . . . . .
Decoding Tables . . . . . . . . . . . . . . . . . . . . . . . . . . . . . . . . . . . . . . . . . . . . . . . . . . . . . . . . . . . . . . . . . . . .
Sensor Type Codes (Table 36-3 from the IPMI v1.5 Documentation) . . . . . . . . . . . . . . . . . . . . . . . . . .
Component-Specific SEL Decoding Tables . . . . . . . . . . . . . . . . . . . . . . . . . . . . . . . . . . . . . . . . . . . . . . .
8
194
194
194
194
197
198
200
201
205
217
Contents
9
Contents
10
Contents
11
Contents
12
Tables
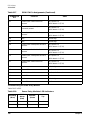
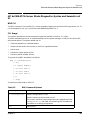
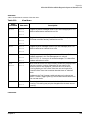
Table 1-1. HP bh5700 ATCA 14-Slot Blade Server Field Replaceable Units . . . . . . . . . . . . . . . . . . 22
Table 2-1. Troubleshooting the Ethernet Switch Blade with Status Indicators. . . . . . . . . . . . . . . . 78
Table 2-2. Solution Table for LED Indicators . . . . . . . . . . . . . . . . . . . . . . . . . . . . . . . . . . . . . . . . . . . 79
Table 2-3. Shelf Alarm Display Panel LED Indicators. . . . . . . . . . . . . . . . . . . . . . . . . . . . . . . . . . . . 83
Table 2-4. Shelf Alarm Display Panel LED Tips . . . . . . . . . . . . . . . . . . . . . . . . . . . . . . . . . . . . . . . . 84
Table 2-5. Alarm Display Panel Horizontal Board Pin Assignment . . . . . . . . . . . . . . . . . . . . . . . . . 89
Table 2-6. Telco Alarm LEDs . . . . . . . . . . . . . . . . . . . . . . . . . . . . . . . . . . . . . . . . . . . . . . . . . . . . . . . . 90
Table 2-7. Telco Alarm Connector (DB15-male) . . . . . . . . . . . . . . . . . . . . . . . . . . . . . . . . . . . . . . . . . 91
Table 2-8. Shelf Alarm Panel Troubleshooting . . . . . . . . . . . . . . . . . . . . . . . . . . . . . . . . . . . . . . . . . . 92
Table 2-9. Alarm Connector Panel Horizontal Board Connector Pin Assignment . . . . . . . . . . . . . . 92
Table 2-10. Fan and Fan Tray Numbering Scheme . . . . . . . . . . . . . . . . . . . . . . . . . . . . . . . . . . . . . . 95
Table 2-11. Fan Tray Signals . . . . . . . . . . . . . . . . . . . . . . . . . . . . . . . . . . . . . . . . . . . . . . . . . . . . . . . . 96
Table 2-12. LEDs on the Fan Tray Control Panel . . . . . . . . . . . . . . . . . . . . . . . . . . . . . . . . . . . . . . . 97
Table 2-13. Fan Tray Backplane Connector Pin Assignment . . . . . . . . . . . . . . . . . . . . . . . . . . . . . . 97
Table 2-14. Fan Tray LED Indicators . . . . . . . . . . . . . . . . . . . . . . . . . . . . . . . . . . . . . . . . . . . . . . . . . 98
Table 2-15. Fan Tray LED Indicator Tips . . . . . . . . . . . . . . . . . . . . . . . . . . . . . . . . . . . . . . . . . . . . . . 98
Table 2-16. PEM Components . . . . . . . . . . . . . . . . . . . . . . . . . . . . . . . . . . . . . . . . . . . . . . . . . . . . . . 100
Table 2-17. PEM PCA Pin Assignments . . . . . . . . . . . . . . . . . . . . . . . . . . . . . . . . . . . . . . . . . . . . . . 101
Table 2-18. Power Entry Modules LED Indicators. . . . . . . . . . . . . . . . . . . . . . . . . . . . . . . . . . . . . . 102
Table 2-19. Power Entry Module Troubleshooting Actions . . . . . . . . . . . . . . . . . . . . . . . . . . . . . . . 103
Table 2-20. Hot-Swap LED . . . . . . . . . . . . . . . . . . . . . . . . . . . . . . . . . . . . . . . . . . . . . . . . . . . . . . . . 106
Table 2-21. Shelf Manager Status LEDs. . . . . . . . . . . . . . . . . . . . . . . . . . . . . . . . . . . . . . . . . . . . . . 106
Table 2-22. Shelf Manager Troubleshooting Tips. . . . . . . . . . . . . . . . . . . . . . . . . . . . . . . . . . . . . . . 107
Table 2-23. OOS LED (D59). . . . . . . . . . . . . . . . . . . . . . . . . . . . . . . . . . . . . . . . . . . . . . . . . . . . . . . . 111
Table 2-24. Health LED . . . . . . . . . . . . . . . . . . . . . . . . . . . . . . . . . . . . . . . . . . . . . . . . . . . . . . . . . . . 112
Table 2-25. IDE Drive Activity LED . . . . . . . . . . . . . . . . . . . . . . . . . . . . . . . . . . . . . . . . . . . . . . . . . 112
Table 2-26. Network Link Activity LEDs . . . . . . . . . . . . . . . . . . . . . . . . . . . . . . . . . . . . . . . . . . . . . 112
Table 2-27. Network Speed LEDs . . . . . . . . . . . . . . . . . . . . . . . . . . . . . . . . . . . . . . . . . . . . . . . . . . . 113
Table 2-28. User-Programmable LED States . . . . . . . . . . . . . . . . . . . . . . . . . . . . . . . . . . . . . . . . . . 113
Table 2-29. GPIO Pin Connections . . . . . . . . . . . . . . . . . . . . . . . . . . . . . . . . . . . . . . . . . . . . . . . . . . 114
Table 2-30. Ethernet Controller Port State LEDs . . . . . . . . . . . . . . . . . . . . . . . . . . . . . . . . . . . . . . 114
Table 2-31. Hot-Swap LED (DS11) . . . . . . . . . . . . . . . . . . . . . . . . . . . . . . . . . . . . . . . . . . . . . . . . . . 115
Table 2-32. HP bc2100 ATCA Server Blade LED States . . . . . . . . . . . . . . . . . . . . . . . . . . . . . . . . . 115
Table 2-33. HP bc2100 ATCA Server Blade LED Tips. . . . . . . . . . . . . . . . . . . . . . . . . . . . . . . . . . . 116
Table 3-1. ShMM Diagnostic Commands . . . . . . . . . . . . . . . . . . . . . . . . . . . . . . . . . . . . . . . . . . . . . 121
Table 3-2. CPU Error Types. . . . . . . . . . . . . . . . . . . . . . . . . . . . . . . . . . . . . . . . . . . . . . . . . . . . . . . . 137
Table 3-3. IPMI Commands for Diagnostic Boot . . . . . . . . . . . . . . . . . . . . . . . . . . . . . . . . . . . . . . . 143
Table 3-4. Default User Logins . . . . . . . . . . . . . . . . . . . . . . . . . . . . . . . . . . . . . . . . . . . . . . . . . . . . . 144
Table 3-5. BDP Command Options . . . . . . . . . . . . . . . . . . . . . . . . . . . . . . . . . . . . . . . . . . . . . . . . . . 147
Table 3-6. Available Modules. . . . . . . . . . . . . . . . . . . . . . . . . . . . . . . . . . . . . . . . . . . . . . . . . . . . . . . 151
Table 3-7. t Command Examples. . . . . . . . . . . . . . . . . . . . . . . . . . . . . . . . . . . . . . . . . . . . . . . . . . . . 152
Table 3-8. t Command Line Interface Flags . . . . . . . . . . . . . . . . . . . . . . . . . . . . . . . . . . . . . . . . . . . 152
Table 3-9. Test Modules Pane Button Descriptions . . . . . . . . . . . . . . . . . . . . . . . . . . . . . . . . . . . . . 162
13
Tables
Table 3-10. Test Sequence Pane Button Descriptions . . . . . . . . . . . . . . . . . . . . . . . . . . . . . . . . . . .
Table 3-11. Test Message Pane Button Descriptions . . . . . . . . . . . . . . . . . . . . . . . . . . . . . . . . . . . .
Table 3-12. Test Summary Pane Button Descriptions . . . . . . . . . . . . . . . . . . . . . . . . . . . . . . . . . . .
Table 3-13. Device Node Field Descriptions . . . . . . . . . . . . . . . . . . . . . . . . . . . . . . . . . . . . . . . . . . .
Table 3-14. Test Node Field Descriptions.. . . . . . . . . . . . . . . . . . . . . . . . . . . . . . . . . . . . . . . . . . . . .
Table 3-15. Flowgroup Node Field Descriptions. . . . . . . . . . . . . . . . . . . . . . . . . . . . . . . . . . . . . . . .
Table 3-16. Param Node Field Descriptions . . . . . . . . . . . . . . . . . . . . . . . . . . . . . . . . . . . . . . . . . . .
Table 3-17. File Menu . . . . . . . . . . . . . . . . . . . . . . . . . . . . . . . . . . . . . . . . . . . . . . . . . . . . . . . . . . . .
Table 3-18. Edit Menu . . . . . . . . . . . . . . . . . . . . . . . . . . . . . . . . . . . . . . . . . . . . . . . . . . . . . . . . . . . .
Table 3-19. View Menu. . . . . . . . . . . . . . . . . . . . . . . . . . . . . . . . . . . . . . . . . . . . . . . . . . . . . . . . . . . .
Table 3-20. Insert Menu. . . . . . . . . . . . . . . . . . . . . . . . . . . . . . . . . . . . . . . . . . . . . . . . . . . . . . . . . . .
Table 3-21. Action Menu . . . . . . . . . . . . . . . . . . . . . . . . . . . . . . . . . . . . . . . . . . . . . . . . . . . . . . . . . .
Table 3-22. Help Menu . . . . . . . . . . . . . . . . . . . . . . . . . . . . . . . . . . . . . . . . . . . . . . . . . . . . . . . . . . . .
Table 3-23. BIOS Settings and Description . . . . . . . . . . . . . . . . . . . . . . . . . . . . . . . . . . . . . . . . . . .
Table 3-24. ipmitool Command Bytes . . . . . . . . . . . . . . . . . . . . . . . . . . . . . . . . . . . . . . . . . . . . . . . .
Table 4-1. Raw SEL Event Record Data . . . . . . . . . . . . . . . . . . . . . . . . . . . . . . . . . . . . . . . . . . . . . .
Table 4-2. Decoding Example . . . . . . . . . . . . . . . . . . . . . . . . . . . . . . . . . . . . . . . . . . . . . . . . . . . . . .
Table 4-3. IPMB Address to Physical Location Making. . . . . . . . . . . . . . . . . . . . . . . . . . . . . . . . . .
Table 4-4. Generic Event/Reading Type Codes. . . . . . . . . . . . . . . . . . . . . . . . . . . . . . . . . . . . . . . . .
Table 4-5. Sensor Type Codes (Table 36-3 from the IPMI v1.5 Document) . . . . . . . . . . . . . . . . . .
14
163
165
166
168
169
170
171
173
174
175
176
176
177
188
190
194
198
200
201
205
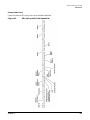
Figures
Figure 1-1. Electrostatic Discharge Wrist Strap Connection Sockets. . . . . . . . . . . . . . . . . . . . . . . . 28
Figure 1-2. Power Entry Module (PEM) A, Power Cables and Returns Attached . . . . . . . . . . . . . . 31
Figure 1-3. PEM with Fuses installed (Showing Backplane Connector Power Contacts) . . . . . . . . 33
Figure 1-4. Shelf Manager (ShMM) Front Panel . . . . . . . . . . . . . . . . . . . . . . . . . . . . . . . . . . . . . . . . 34
Figure 1-5. Ethernet Switch Blade Front Panel (Lower Half), Showing Blue Hot Swap LED . . . . 37
Figure 1-6. HP bc2100 ATCA Server Blade, Front Panel Indicators . . . . . . . . . . . . . . . . . . . . . . . . 40
Figure 1-7. Fan Tray, Front and Back View . . . . . . . . . . . . . . . . . . . . . . . . . . . . . . . . . . . . . . . . . . . . 42
Figure 1-8. Filter Tray Extended, 14-Slot Shelf Front View . . . . . . . . . . . . . . . . . . . . . . . . . . . . . . . 44
Figure 1-9. Backplane SEEPROM Assemblies (PEM B Removed) . . . . . . . . . . . . . . . . . . . . . . . . . . 46
Figure 1-10. Alarm Display Panel, Front View . . . . . . . . . . . . . . . . . . . . . . . . . . . . . . . . . . . . . . . . . 50
Figure 1-11. Alarm Display Panel, Rear View . . . . . . . . . . . . . . . . . . . . . . . . . . . . . . . . . . . . . . . . . . 51
Figure 1-12. Alarm Connector Panel, Front View . . . . . . . . . . . . . . . . . . . . . . . . . . . . . . . . . . . . . . . 52
Figure 1-13. Alarm Connector Panel, Rear View . . . . . . . . . . . . . . . . . . . . . . . . . . . . . . . . . . . . . . . . 52
Figure 1-14. Rack Mount Flange Positions . . . . . . . . . . . . . . . . . . . . . . . . . . . . . . . . . . . . . . . . . . . . 54
Figure 1-15. 14-Slot Shelf, Front View (Blade Cage Empty) . . . . . . . . . . . . . . . . . . . . . . . . . . . . . . . 56
Figure 1-16. 14-Slot Shelf, Rear View (Blade Cage Empty) . . . . . . . . . . . . . . . . . . . . . . . . . . . . . . . 57
Figure 1-17. 14-Slot Shelf, Front View (Blade Cage Empty) . . . . . . . . . . . . . . . . . . . . . . . . . . . . . . . 59
Figure 1-18. 14-Slot Shelf, Rear View (Blade Cage Empty). . . . . . . . . . . . . . . . . . . . . . . . . . . . . . . . 60
Figure 1-19. HP bc2100 ATCA Server Blade, Access Cover Panel Installed . . . . . . . . . . . . . . . . . . 65
Figure 1-20. HDD Installed . . . . . . . . . . . . . . . . . . . . . . . . . . . . . . . . . . . . . . . . . . . . . . . . . . . . . . . . 66
Figure 1-21. Hard Disk Drive (Arrows Point Toward the Blade Connector) . . . . . . . . . . . . . . . . . . 67
Figure 1-22. Hard Disk Drive, Mounting Brackets Attached . . . . . . . . . . . . . . . . . . . . . . . . . . . . . . 67
Figure 1-23. Hard Disk Drive Mounting Bracket Kit . . . . . . . . . . . . . . . . . . . . . . . . . . . . . . . . . . . . 68
Figure 1-24. HP bc2100 ATCA Server Blade, Access Cover Panel Installed . . . . . . . . . . . . . . . . . . 69
Figure 1-25. Unlocking DIMM in DIMM Socket U5 . . . . . . . . . . . . . . . . . . . . . . . . . . . . . . . . . . . . . 70
Figure 1-26. DIMM Socket Assignments . . . . . . . . . . . . . . . . . . . . . . . . . . . . . . . . . . . . . . . . . . . . . . 71
Figure 2-1. Ethernet Switch blade LED Display . . . . . . . . . . . . . . . . . . . . . . . . . . . . . . . . . . . . . . . . 76
Figure 2-2. Alarm Display Panel . . . . . . . . . . . . . . . . . . . . . . . . . . . . . . . . . . . . . . . . . . . . . . . . . . . . . 83
Figure 2-3. Alarm Display Panel Interconnect Diagram . . . . . . . . . . . . . . . . . . . . . . . . . . . . . . . . . . 86
Figure 2-4. Alarm Display Panel Block Diagram (1) . . . . . . . . . . . . . . . . . . . . . . . . . . . . . . . . . . . . . 87
Figure 2-5. Alarm Display Panel Block Diagram (2) . . . . . . . . . . . . . . . . . . . . . . . . . . . . . . . . . . . . . 88
Figure 2-6. Alarm Display Panel Horizontal Board Connector . . . . . . . . . . . . . . . . . . . . . . . . . . . . . 89
Figure 2-7. Telco Alarm Connector (DB15-male) . . . . . . . . . . . . . . . . . . . . . . . . . . . . . . . . . . . . . . . . 91
Figure 2-8. Alarm Connector Panel Horizontal Board Connector . . . . . . . . . . . . . . . . . . . . . . . . . . . 92
Figure 2-9. Fan Tray, Front and Rear View . . . . . . . . . . . . . . . . . . . . . . . . . . . . . . . . . . . . . . . . . . . . 94
Figure 2-10. Fan Tray Number Scheme . . . . . . . . . . . . . . . . . . . . . . . . . . . . . . . . . . . . . . . . . . . . . . . 95
Figure 2-11. Fan Tray Block Diagram . . . . . . . . . . . . . . . . . . . . . . . . . . . . . . . . . . . . . . . . . . . . . . . . 96
Figure 2-12. Fan Tray Backplane Connector . . . . . . . . . . . . . . . . . . . . . . . . . . . . . . . . . . . . . . . . . . . 97
Figure 2-13. PEM Components . . . . . . . . . . . . . . . . . . . . . . . . . . . . . . . . . . . . . . . . . . . . . . . . . . . . . 100
Figure 2-14. PEM Block Diagram . . . . . . . . . . . . . . . . . . . . . . . . . . . . . . . . . . . . . . . . . . . . . . . . . . . 101
Figure 2-15. Shelf Manager Front Panel Components. . . . . . . . . . . . . . . . . . . . . . . . . . . . . . . . . . . 104
Figure 2-16. Shelf Manager Redundancy Control . . . . . . . . . . . . . . . . . . . . . . . . . . . . . . . . . . . . . . 105
Figure 2-17. HP bc2100 ATCA Server Blade Front Panel . . . . . . . . . . . . . . . . . . . . . . . . . . . . . . . . 110
15
Figures
Figure 3-1. Diagnostics Boot Option . . . . . . . . . . . . . . . . . . . . . . . . . . . . . . . . . . . . . . . . . . . . . . . . .
Figure 3-2. Default Device Selection for Diagnostics Boot . . . . . . . . . . . . . . . . . . . . . . . . . . . . . . .
Figure 3-3. Network Configuration Agent Operation . . . . . . . . . . . . . . . . . . . . . . . . . . . . . . . . . . .
Figure 3-4. XTC Program Environment . . . . . . . . . . . . . . . . . . . . . . . . . . . . . . . . . . . . . . . . . . . . . .
Figure 3-5. Test Modules Pane . . . . . . . . . . . . . . . . . . . . . . . . . . . . . . . . . . . . . . . . . . . . . . . . . . . . .
Figure 3-6. Test Sequence Pane. . . . . . . . . . . . . . . . . . . . . . . . . . . . . . . . . . . . . . . . . . . . . . . . . . . . .
Figure 3-7. Message Redirection Pane . . . . . . . . . . . . . . . . . . . . . . . . . . . . . . . . . . . . . . . . . . . . . . .
Figure 3-8. Test Message Pane . . . . . . . . . . . . . . . . . . . . . . . . . . . . . . . . . . . . . . . . . . . . . . . . . . . . .
Figure 3-9. Test Summary Pane . . . . . . . . . . . . . . . . . . . . . . . . . . . . . . . . . . . . . . . . . . . . . . . . . . . .
Figure 3-10. Device Node . . . . . . . . . . . . . . . . . . . . . . . . . . . . . . . . . . . . . . . . . . . . . . . . . . . . . . . . . .
Figure 3-11. Test Node Dialog . . . . . . . . . . . . . . . . . . . . . . . . . . . . . . . . . . . . . . . . . . . . . . . . . . . . . .
Figure 3-12. Flowgroup Node Dialog . . . . . . . . . . . . . . . . . . . . . . . . . . . . . . . . . . . . . . . . . . . . . . . .
Figure 3-13. Param Node Dialog . . . . . . . . . . . . . . . . . . . . . . . . . . . . . . . . . . . . . . . . . . . . . . . . . . . .
Figure 3-14. Param View Tab . . . . . . . . . . . . . . . . . . . . . . . . . . . . . . . . . . . . . . . . . . . . . . . . . . . . . .
Figure 3-15. Main Menu and Toolbar . . . . . . . . . . . . . . . . . . . . . . . . . . . . . . . . . . . . . . . . . . . . . . . .
Figure 3-16. Right-Click Menu . . . . . . . . . . . . . . . . . . . . . . . . . . . . . . . . . . . . . . . . . . . . . . . . . . . . .
Figure 3-17. Starting Autoconfigure . . . . . . . . . . . . . . . . . . . . . . . . . . . . . . . . . . . . . . . . . . . . . . . . .
Figure 3-18. Autoconfiguration Complete. . . . . . . . . . . . . . . . . . . . . . . . . . . . . . . . . . . . . . . . . . . . .
Figure 3-19. Cloned Devices Representation . . . . . . . . . . . . . . . . . . . . . . . . . . . . . . . . . . . . . . . . . .
Figure 3-20. Autoconfigure Flow Tree Updates . . . . . . . . . . . . . . . . . . . . . . . . . . . . . . . . . . . . . . . .
Figure 4-1. SEL Entry with Fields Identified. . . . . . . . . . . . . . . . . . . . . . . . . . . . . . . . . . . . . . . . . .
16
142
142
145
157
162
163
164
165
166
168
169
170
171
172
173
179
183
184
185
186
197
About This Document
17
Publishing History
The document printing date and edition number indicate the document’s current edition. The printing date
will change when a new edition is produced. Document updates may be issued between editions to correct
errors or document product changes. The latest version of this document is available on line at:
docs.hp.com.
18
HP Encourages Your Comments
HP encourages your comments concerning this document. We are truly committed to providing
documentation that meets your needs.
Please send comments to:
http://docs.hp.com/en/feedback.html.
Please include document title, manufacturing part number, and any comment, error found, or suggestion for
improvement you have concerning this document.
Also, please include any comments about what you think we did right, so that we can incorporate it into other
documents.
19
20
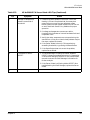
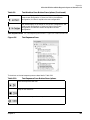
1 Field Replaceable Unit Removal and
Replacement
Chapter 1
21
Field Replaceable Unit Removal and Replacement
Introduction
Introduction
This section provides detailed procedures for removing and replacing all HP bh5700 ATCA 14-Slot Blade
Shelf Field Replaceable Units (FRUs), including important safety information.
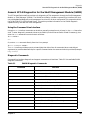
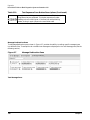
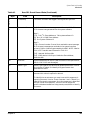
Field Replaceable Units (FRUs) for the HP bh5700 Telco Blade 14-Slot Shelf include those shown in
Table 1-1. Some 14-Slot Shelf FRUs can be “hot-swapped” (removed and replaced during normal shelf
operation), while others require that all system power be disconnected before they can be removed and
replaced.
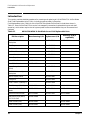
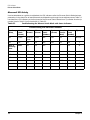
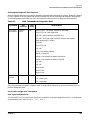
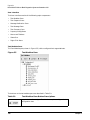
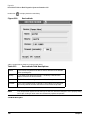
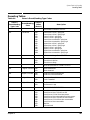
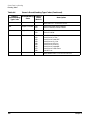
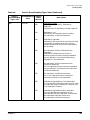
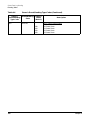
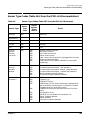
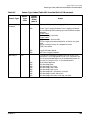
Table 1-1
HP bh5700 ATCA 14-Slot Blade Server Field Replaceable Units
FRU Description
14-Slot Shelf with
Backplane
Manufacturing P/N
Replacement P/N
AD171-2000A
AD171-67001
Fan Tray
AD 171-67002
Air Filter Carrier, 14-slot
AD 171-67003
Air Filter Element, Qty 10
AD171-67006
Alarm Connector Panel
AD172-67006
Cable Tray Kit
AD171-2100A
Front Filler Panel
AD171-0001A
Rear Filler Panel
AD171-0002A
Power Entry Module
(PEM)
AD172-67003
SEEPROM Assembly,
Backplane
AD172-67004
Alarm Display Panel
AD172-67005
Flange Kit
AD171-67005
PEM Fuse Kit, Quantity 5
AD171-67004
Exchange P/N (if
repairable)
AD171-69001
Shelf Manager (ShMM)
AD190-6001
AD190-67001
AD190-69001
HP bc2100 ATCA Server
Blade
AD239-60001
AD239-67001
AD239-69001
Ethernet Switch Blade
AD173-60001
AD173-67001
AD173-69001
Hard Disk Drive (HDD)
HP 72 GB SAS
AD241-2000A
1 GB DIMMs (Pair)
AD191-60001
AD191-69001
2 GB DIMMs (Pair)
AD192-60001
AD192-69001
22
Chapter 1
Field Replaceable Unit Removal and Replacement
Introduction
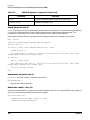
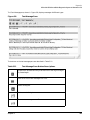
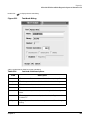
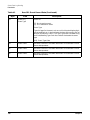
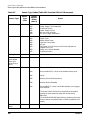
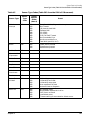
Table 1-1
HP bh5700 ATCA 14-Slot Blade Server Field Replaceable Units (Continued)
FRU Description
Adapter Cable, RS-232
Serial Connection, RJ-45
to DB-9
Manufacturing P/N
Replacement P/N
Exchange P/N (if
repairable)
A6900-63006
The above part numbers are current as of the publication date of this manual. Check
http://partsurfer.hp.com/cgi-bin/spi/main for the most current part numbers.
Chapter 1
23
Field Replaceable Unit Removal and Replacement
Required Tools
Required Tools
The following tools are required to safely remove and replace components within the chassis
•
ESD safe mat
•
Torx T-20 driver
•
Torx T-15 driver
•
#1 Phillips screwdriver
•
#2 Phillips screwdriver
•
10-mm nut driver
24
Chapter 1
Field Replaceable Unit Removal and Replacement
Power-Off Field Replaceable Units
Power-Off Field Replaceable Units
Field Replaceable Units are considered to be power-off FRUs if electrical power must first be removed from
the 14-Slot Shelf before the FRU can be removed and replaced. Power-off FRUs in the 14-Slot Shelf include
the following:
•
HP 14-slot 14-Slot Shelf Chassis with Backplane
•
Backplane SEEPROM Assembly (Chassis Data Module)
The following FRUs are power-off FRUs, but are removed and replaced after the HP bc2100 ATCA Server
Blade has been removed from the 14-Slot Shelf by following hot-swap procedures:
•
HP 72 GB SAS Hard Disk Drive (HDD) – HP bc2100 ATCA Server Blade
•
HP 72 GB SAS HDD Mounting Kit – HP bc2100 ATCA Server Blade
•
1 GB Memory DIMMs (replaced in pairs) – HP bc2100 ATCA Server Blade
•
2 GB Memory DIMMs (replaced in pairs) – HP bc2100 ATCA Server Blade
Chapter 1
25
Field Replaceable Unit Removal and Replacement
Hot-Swap Field Replaceable Units
Hot-Swap Field Replaceable Units
Hot-swap FRUs are considered such if they can be removed from the 14-Slot Shelf and be replaced while the
Shelf remains fully operational, and if they require no software intervention before being removed. Hot-swap
FRUs in the 14-Slot Shelf include the following:
•
Power Entry Modules (PEMs)
•
Power Entry Module (PEM) Fuse Kit
•
Shelf Manager
•
Alarm Display Panel
•
Alarm Connector Panel
•
Ethernet Switch Blades
•
HP bc2100 ATCA Server Blades
•
Fan Trays
•
Air Filter
26
Chapter 1
Field Replaceable Unit Removal and Replacement
Safety and Environmental Considerations
Safety and Environmental Considerations
Safety and environmental considerations include electrical safety, communications interference, and
electrostatic discharge hazards to equipment.
Electrical Safety
Electrical safety precautions must be followed at all times when working on the 14-Slot Shelf.
WARNING
High Voltage. There are no system power controls on the 14-Slot Shelf. System power (-48 VDC
from multiple power domains) is applied by an external power source at all times unless
disabled/disconnected at the source.
Communications Interference
Hewlett-Packard system compliance tests are conducted with Hewlett-Packard supported peripheral devices
and shielded cables, such as those received with the system. The system meets interference requirements of
all the countries in which it is sold. These requirements provide reasonable protection against interference
with radio and television communications.
Installing and using the system in strict accordance with Hewlett-Packard instructions minimizes the
chances that the system will cause radio or television interference. However, Hewlett-Packard does not
guarantee that the system will not interfere with radio and television reception.
Take these precautions:
•
Use only shielded cables.
•
Ensure that all cable connector screws are firmly tightened.
•
Use only Hewlett-Packard supported peripheral devices.
•
Ensure that all panels and cover plates are in place and secure before system operation.
Electrostatic Discharge Hazard to Equipment
Hewlett-Packard systems and peripherals contain assemblies and components that are sensitive to
electrostatic discharge (ESD). Carefully observe the precautions and recommended procedures in this manual
to prevent component damage from static electricity.
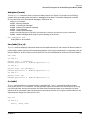
CAUTION
Wear an ESD wrist strap that is connected to the same ground potential as the unit you are
working on. Connect the wrist strap to any grounded metal assembly in the 14-Slot Shelf or to
one of the ESD grounding sockets (see Figure 1-1). Both you and the electronic devices must be
grounded to avoid static discharges that can cause damage. If the 14-Slot Shelf is not connected
to earth ground, place the Shelf in an ESD-safe working environment before removing or
replacing any FRU.
Chapter 1
27
Field Replaceable Unit Removal and Replacement
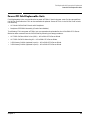
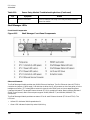
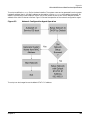
Safety and Environmental Considerations
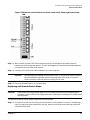
Figure 1-1
Electrostatic Discharge Wrist Strap Connection Sockets
1. ESD Socket, Lower Left Front
2. Shelf Manager (ShMM)
3. ESD Socket, Lower Left Rear
4. Power Entry Module, (PEM) B
Take these ESD precautions:
•
Prepare an ESD-safe work surface large enough to accommodate the various assemblies to be handled
during servicing. Use a grounding mat and an anti-static wrist strap, such as those included in the ESD
Field Service Kit (A3024-80004).
•
Do not use the anti-static bag for any purpose other than to enclose a product. The anti-static bag that
encloses new or repaired FRUs cannot function as a static dissipating mat.
•
Treat all assemblies, components, and interface connections as static-sensitive.
•
Keep replacement and removed FRUs in a conductive plastic bag until they are ready to be installed or
shipped for repair.
•
Avoid working in carpeted areas, and keep body movement to a minimum while removing and installing
FRUs.
28
Chapter 1
Field Replaceable Unit Removal and Replacement
Removing Power from the Shelf
Removing Power from the Shelf
In a telecommunications environment, the 14-Slot Shelf is typically installed with a separate High
Availability (HA) four-domain input power supply configuration to each of the 14-Slot Shelf Power Entry
Modules (PEMs). In this configuration input power can be removed from either or both PEMs on the Shelf, as
required.
WARNING
WARNING: High Voltage. Follow appropriate safety precautions to avoid electrical shock.
There are no system power controls on the 14-Slot Shelf. System power (-48 VDC from multiple
power domains) is applied by an external power source at all times unless disabled or
disconnected at the source.
To remove all input power from the 14-Slot Shelf, disable or disconnect all circuit breakers on all external
power supplies for both PEMs.
Chapter 1
29
Field Replaceable Unit Removal and Replacement
Power Entry Modules (PEMs) and PEM Fuses
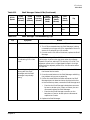
Power Entry Modules (PEMs) and PEM Fuses
The two 14-Slot Shelf PEMs are located at the lower right and left corners at the rear of the Shelf. The PEM
is a hot-swap unit. Power Entry Module fuses are mounted in the main body of each PEM, and are accessible
only after the respective PEM has been removed from the Shelf.
WARNING
Electrical Shock Hazard to Personnel. Although the PEM is a hot swap unit that can be
removed and replaced while the 14-Slot Shelf continues to operate, all input power domains to
the PEM being replaced must be turned off and disconnected before removal.
Removing a Power Entry Module
WARNING
Electrical Shock Hazard to Personnel. Power is present at the PEM power terminals unless the
external power source is turned off. Disable/disconnect all power domain circuit breakers in the
OFF (O) position before completing any of the following steps. Failure to follow electrical safety
precautions may result in personal injury.
CAUTION
Electrostatic Discharge Hazard. Observe all ESD safety precautions while completing this
procedure. Failure to follow ESD safety precautions could result in damage to the 14-Slot Shelf
and equipment.
To remove a Power Entry Module (PEM) while the 14-Slot Shelf continues to operate using the redundant
PEM, complete the following steps.
For the PEM to be removed do the following:
Step 1. Disable or disconnect all power domain circuit breakers in the OFF (O) position. The 14-Slot Shelf
should continue to operate unless power has been removed from both PEMs.
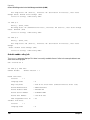
Step 2. Press and release the H/S (Hot-Swap) button (#1, Figure 1-2) on the PEM to be removed. The blue
hot-swap LED (#2, Figure 1-2) will flash intermittently while the request is being processed by the
Shelf Manager (ShMM). The blue hot-swap LED will be constantly illuminated when it is safe to
remove the PEM.
30
Chapter 1
Field Replaceable Unit Removal and Replacement
Power Entry Modules (PEMs) and PEM Fuses
Figure 1-2Power Entry Module (PEM) A, Power Cables and Returns Attached
Step 3. With the blue hot-swap LED steadily illuminated and all input power disabled/disconnected,
remove the PEM Terminal Block Cover (#5, Figure 1-2.
Step 4. Remove and label each terminal block power and return cable for replacement hookup.
Step 5. Loosen both PEM fixing screws (#7, Figure 1-2).
Step 6. Using the two PEM handles (#6, Figure 1-2), pull the PEM from its mounting slot.
Step 7. Place the removed PEM in an anti-static bag for shipment.
Replacing a Power Entry Module
CAUTION
Electrostatic Discharge Hazard. Observe all ESD safety precautions while completing this
procedure. Failure to follow ESD safety precautions could result in damage to the 14-Slot Shelf
and equipment.
To replace the PEM in the Shelf, complete the following steps:
Step 1. Holding the replacement PEM by its handles (#7, Figure 1-2) carefully insert the PEM into the
empty PEM slot. Ensure that the PEM internal electrical connectors are aligned, and then use firm
pressure to ensure that the PEM is properly seated in the connector.
Step 2. Tighten the PEM fixing screws that hold the PEM in the 14-Slot Shelf chassis (#7, Figure 1-2).
Chapter 1
31
Field Replaceable Unit Removal and Replacement
Power Entry Modules (PEMs) and PEM Fuses
Step 3. Connect the power cables and return lines, ensuring that each power domain cable and return line
is attached to the correct power terminal lug (Figure 1-2). It may be easier to connect all PEM
cables before actually replacing the PEM into the 14-Slot Shelf chassis.
Step 4. Position the terminal block cover over the terminal block, then tighten the terminal block cover
retaining screws (Figure 1-2).
Step 5. Enable all power supply circuit breakers supplying power to the replacement PEM.
Step 6. The green PEM OK LED (#4, Figure 1-2) should illuminate steadily. This completes the PEM
replacement procedure.
Removing and Replacing Power Entry Module (PEM) Fuses
Power Entry Module (PEM) fuses for power domain input and return lines are mounted in each PEM, and are
only accessible after the PEM is removed from the Shelf.
NOTE
A PEM can be removed from the 14-Slot Shelf in hot-swap mode in order to remove and replace
the fuses. The PEM can then be reinstalled while the 14-Slot Shelf continues to operate.
WARNING
Electrical Shock Hazard. Power is present at the PEM power terminals unless the external
power source is turned off. Disable/disconnect all power domain circuit breakers in the OFF (O)
position for only the PEM to be removed before completing any of the following steps. Failure to
follow electrical safety precautions may result in personal injury.
CAUTION
Electrostatic Discharge Hazard. Observe all ESD safety precautions while completing this
procedure. Failure to follow ESD safety precautions could result in damage to the 14-Slot Shelf
and equipment.
To remove and replace one or more fuses in a PEM, complete the following steps:
Step 1. Disable or disconnect all power supply domain circuit breakers in the OFF (O) position for the PEM
to be removed that has the fuses that must be replaced. The 14-Slot Shelf should continue normal
operation if desired with power supplied by the redundant PEM.
Step 2. Remove the respective PEM, following the removal procedures provided above.
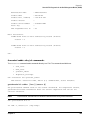
Step 3. Remove and replace PEM fuses as required. Grasp each fuse and remove it by pulling upward.
Press each replacement fuse into its mounting position by pressing down (see Figure 1-3).
32
Chapter 1
Field Replaceable Unit Removal and Replacement
Power Entry Modules (PEMs) and PEM Fuses
Figure 1-3PEM with Fuses installed (Showing Backplane Connector Power Contacts)
Step 4. Replace the PEM, following the replacement procedures provided above.
Step 5. Re-enable or re-connect all power domain circuit breakers, and apply power to the reinstalled PEM.
Step 6. With all fuses either replaced or having tested as functional, the green PEM OK LED (#4,
Figure 1-2) should illuminate steadily.
Step 7. This completes the PEM fuse removal and replacement procedure.
Chapter 1
33
Field Replaceable Unit Removal and Replacement
Shelf Manager
Shelf Manager
The 14-Slot Shelf contains two redundant Shelf Managers (ShMMs) as hot-swap FRUs. These units are
located in the lower left and right corners at the front of the Shelf, and protrude into the air intake plenum.
Both ShMMs are accessible from the outside front of the Shelf.
WARNING
Potential Electrical Shock Hazard to Personnel. System power is applied to the 14-Slot Shelf at
all times during this hot-swap removal and replacement procedure. Observe all electrical
safety procedures while working on this hot-swap unit.
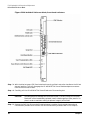
Removing a Shelf Manager Unit
CAUTION
Electrostatic Discharge Hazard. Observe all ESD safety precautions while completing this
procedure. Failure to follow ESD safety precautions could result in damage to the 14-Slot Shelf
and equipment.
To remove a ShMM unit, complete the following steps:
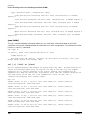
Step 1. Loosen the ShMM fixing screw (#1, Figure 1-4), and pull the ShMM extraction handle
approximately one-half of its full travel distance away from the ShMM front panel. The blue
hot-swap (H/S) LED (#10, Figure 1-4) will flash intermittently as the request is being processed by
the Shelf Manager, then illuminate solid when the unit is ready to be hot-swapped (removed).
Figure 1-4Shelf Manager (ShMM) Front Panel
34
Chapter 1
Field Replaceable Unit Removal and Replacement
Shelf Manager
Step 2. When the blue H/S LED illuminates continuously, pull the extraction handle as far as it will go.
This will release the ShMM unit from the 14-Slot Shelf.
Step 3. Remove the ShMM by pulling it out of its 14-Slot Shelf mounting slot, and place it in an anti-static
bag.
Replacing a Shelf Manager
CAUTION
Electrostatic Discharge Hazard. Observe all ESD safety precautions while completing this
procedure. Failure to follow ESD safety precautions could result in damage to the 14-Slot Shelf
and equipment.
To replace a ShMM unit, complete the following steps:
Step 1. Ensure that the replacement ShMM extraction handle (#11, Figure 1-4 is completely pulled out as
far as it will go.
Step 2. Carefully insert the ShMM into the empty Shelf ShMM slot until the two ShMM backplane
connectors align with the 14-Slot Shelf connectors.
Step 3. Press the extraction/insertion handle toward the ShMM unit front panel (Figure 1-4) until the unit
is fully seated into the ShMM slot, and the extraction/insertion handle closes fully against the
ShMM front panel.
Step 4. Tighten the ShMM fixing screw (#1, Figure 1-4) until it is snug.
Step 5. The blue H/S LED will illuminate with a long blink cycle while the replacement ShMM is
activating itself. When the ShMM is active, the blue H/S LED will go out.
Step 6. After replacement, the green STATUS LED (#9, Figure 1-4) will illuminate continuously when the
ShMM is active, and blink when the ShMM is operating in standby mode.
Chapter 1
35
Field Replaceable Unit Removal and Replacement
Ethernet Switch Blade
Ethernet Switch Blade
The Ethernet Switch Blade (typically installed in 14-Slot Shelf physical hub slots 7 and 8) is a hot-swap FRU
and can be removed and replaced while the 14-Slot Shelf is fully operational.
WARNING
Electrical Shock Hazard. System power is applied to the 14-Slot Shelf at all times during this
hot-swap removal and replacement procedure. Observe all electrical safety procedures while
working on this hot-swap unit.
Removing an Ethernet Switch Blade
CAUTION
Possible data loss or network damage. Before removing an Ethernet Switch Blade, ensure that
your VLAN topology will allow this Switch Blade to be removed without causing data loss or
damage to the network.
CAUTION
Electrostatic Discharge Hazard. Observe all ESD safety precautions while completing this
procedure. Failure to follow ESD safety precautions could result in damage to the 14-Slot Shelf
and equipment.
To remove an Ethernet Switch Blade, complete the following steps:
Step 1. At the front of the 14-Slot Shelf blade cage, loosen the two retaining screws that secure the
Ethernet Switch Blade front panel to the blade cage.
Step 2. Simultaneously pull both Ethernet Switch Blade extraction levers to the one-half open (extract)
position only. The blue hot-swap LED located on the Ethernet Switch Blade front panel (Figure 1-5)
will initially illuminate in a blinking mode. When the Ethernet Switch Blade can be safely
removed, the blue hot-swap LED will illuminate continuously.
36
Chapter 1
Field Replaceable Unit Removal and Replacement
Ethernet Switch Blade
Figure 1-5Ethernet Switch Blade Front Panel (Lower Half), Showing Blue Hot Swap
LED
Step 3. With the blue hot-swap LED illuminated continuously, simultaneously pull both extraction
handles to the full-out extract position. This will disengage the Ethernet Switch Blade backplane
connectors from the 14-Slot Shelf chassis.
Step 4. Carefully pull the Ethernet Switch Blade out of its mounting slot.
CAUTION
Possible equipment damage due to excessive heat. If the Ethernet Switch Blade will
not be immediately replaced, install a blade cage front filler panel in its place in
order to maintain cooling air plenum integrity of the Shelf.
Step 5. Place the removed blade in an anti-static bag.
Replacing an Ethernet Switch Blade
CAUTION
Electrostatic Discharge Hazard. Observe all ESD safety precautions while completing this
procedure. Failure to follow ESD safety precautions could result in damage to the 14-Slot Shelf
and equipment.
To replace an Ethernet Switch Blade, complete the following steps:
Step 1. Ensure that the slot that the Ethernet Switch Blade is to be installed in is empty. If a blade cage
front filler panel has been installed for that slot, loosen the two filler panel retaining screws and
remove the filler panel.
Chapter 1
37
Field Replaceable Unit Removal and Replacement
Ethernet Switch Blade
Step 2. Carefully align the Ethernet Switch Blade in its assigned slot, and slide the blade approximately
half-way into the slot.
Step 3. Holding the two extraction levers in the fully extracted position (away from each other), carefully
slide the Blade into the slot until the backplane connectors properly mate with the 14-Slot Shelf
connectors and the blade is fully seated. A blade is fully seated when it touches the 14-Slot Shelf
case up to the extractors.
Step 4. Push the extraction levers toward each other until they are seated flat against the front panel in
order to complete the seating process, and secure the retention screws. The Ethernet Switch Blade
will not operate unless the extraction levers are fully latched.
Step 5. The blue hot-swap LED will be blinking or off. This completes the replacement procedure.
38
Chapter 1
Field Replaceable Unit Removal and Replacement
HP bc2100 ATCA Server Blade
HP bc2100 ATCA Server Blade
The HP bc2100 ATCA Server Blade is a hot-swap FRU and can be removed and replaced while the 14-Slot
Shelf is fully operational.
WARNING
Electrical Shock Hazard. System power is applied to the 14-Slot Shelf at all times during this
hot-swap removal and replacement procedure. Observe all electrical safety procedures while
working on this hot-swap unit.
Removing an HP bc2100 ATCA Server Blade
CAUTION
Electrostatic Discharge Hazard. Observe all ESD safety precautions while completing this
procedure. Failure to follow ESD safety precautions could result in damage to the 14-Slot Shelf
and equipment.
To remove an HP bc2100 ATCA Server Blade, complete the following steps:
Step 1. Loosen the two retention screws on the HP bc2100 ATCA Server Blade front panel.
Step 2. Simultaneously pull both HP bc2100 ATCA Server Blade extraction levers to the one-half open
(extract) position only. The blue hot-swap LED located on the HP bc2100 ATCA Server Blade front
panel (Figure 1-6) will initially illuminate in a blinking mode. When the HP bc2100 ATCA Server
Blade can be safely removed, the blue hot-swap LED will illuminate continuously.
Chapter 1
39
Field Replaceable Unit Removal and Replacement
HP bc2100 ATCA Server Blade
Figure 1-6HP bc2100 ATCA Server Blade, Front Panel Indicators
Step 3. With the blue hot-swap LED illuminated continuously, pull both extraction handles to the full-out
(extract) position. This will disengage the HP bc2100 ATCA Server Blade backplane connectors
from the 14-Slot Shelf chassis.
Step 4. Carefully pull the HP bc2100 ATCA Server Blade out of its mounting slot.
CAUTION
Possible equipment damage due to excessive heat. If the HP bc2100 ATCA Server
Blade will not be immediately replaced, install a blade cage front filler panel in its
place in order to maintain cooling air plenum integrity of the Shelf.
Step 5. Remove the SAS Disk Drive and all installed memory modules from the blade (removal and
reinstallation procedures for the SAS Disk Drive and memory modules later in this chapter).
40
Chapter 1
Field Replaceable Unit Removal and Replacement
HP bc2100 ATCA Server Blade
Step 6. Place the removed blade into an anti-static bag.
Replacing an HP bc2100 ATCA Server Blade
CAUTION
Electrostatic Discharge Hazard. Observe all ESD safety precautions while completing this
procedure. Failure to follow ESD safety precautions could result in damage to the 14-Slot Shelf
and equipment.
To replace an HP bc2100 ATCA Server Blade, complete the following steps:
Step 1. Ensure that the slot that the HP bc2100 ATCA Server Blade is to be installed in is empty. If a blade
cage front filler panel has been installed for that slot, loosen the two filler panel retaining screws
and remove the filler panel.
Step 2. Carefully align the HP bc2100 ATCA Server Blade in its assigned slot, and slide the blade
approximately half-way into the slot.
Step 3. Holding the two extraction levers in the fully extracted position (away from each other), carefully
slide the Blade into the slot until the backplane connectors properly mate with the 14-Slot Shelf
connectors and the blade is fully seated. A blade is fully seated when it touches the 14-Slot Shelf
case up to the extractors.
Step 4. Push the extraction levers toward each other until they are seated flat against the front panel in
order to complete the seating process, and secure the retention screws. The HP bc2100 ATCA
Server Blade will not operate unless the extraction levers are fully latched.
Step 5. The blue hot-swap LED (Figure 1-6) will be blinking or off. This completes the replacement
procedure.
Chapter 1
41
Field Replaceable Unit Removal and Replacement
Fan Trays
Fan Trays
The 14-Slot Shelf has three interchangeable cooling fan trays that can be hot-swapped. The fan trays are
individual plug-in modules, located at the top rear of the Shelf.
WARNING
Electrical Shock Hazard. System power is applied to the 14-Slot Shelf at all times during this
hot-swap removal and replacement procedure. Observe all electrical safety procedures while
working on this hot-swap unit.
Removing a Fan Tray
To remove a fan tray, complete the following steps:
Step 1. Identify the fan tray to be removed. The fan tray LED display alarm LED (#3, Figure 1-7) may be
illuminated.
Figure 1-7Fan Tray, Front and Back View
Step 2. While the 14-Slot Shelf is in normal operation, press and hold the hot-swap (HS) push button (#1,
Figure 1-7) on the fan tray to be removed. The blue hot-swap LED (#2, Figure 1-7) will flash
intermittently, then illuminate continuously. The fan tray is safe to remove when the blue HS LED
is illuminated.
42
Chapter 1
Field Replaceable Unit Removal and Replacement
Fan Trays
Step 3. Raise and hold the fan tray retention lever (#6, Figure 1-7) while pulling on the fan tray extraction
handle (#5, Figure 1-7), and then remove the fan tray from the 14-Slot Shelf enclosure.
Step 4. Place the fan tray in an anti-static bag.
Replacing a Fan Tray
To replace a fan tray, complete the following steps:
Step 1. Carefully insert the fan tray into the empty fan tray enclosure of the Shelf.
Step 2. Ensure that the fan tray horizontal board connector (#7, Figure 1-7) engages with its horizontal
board connector, and then press the fan tray into the enclosure until the retention lever locks the
fan tray in place.
Step 3. As the fan tray begins operation, the green “Fan Tray OK” LED (#4, Figure 1-7) should illuminate
continuously.
All “FAN” and “OK” LED indicators on the Alarm Display Panel should be illuminated with the
system operating.
Chapter 1
43
Field Replaceable Unit Removal and Replacement
Air Filter
Air Filter
The 14-Slot Shelf air filter is located near the bottom front of the Shelf, immediately beneath the blade slots
(Figure 1-8). The air filter is a hot-swap unit, and can be removed and replaced while the
14-Slot Shelf is in normal operation. There is no voltage present at the air filter element and filter tray.
WARNING
Figure 1-8
Electrical Shock Hazard. System power is applied to the 14-Slot Shelf at all times during this
hot-swap removal and replacement procedure. Observe all electrical safety procedures while
working on this hot-swap unit.
Filter Tray Extended, 14-Slot Shelf Front View
Air Filter Element Replacement Schedule
The air filter element must be removed and replaced a minimum of every three months when operating in a
computer room with a raised-floor environment. Your environment may require a more frequent change
schedule.
Removing the Air Filter
IMPORTANT When the air filter tray is removed during system operation, the removal event is recorded in
the System Event Log (SEL) of the 14-Slot Shelf as a default reaction. Note that the ShMM
software can be pre-set to react to this event.
44
Chapter 1
Field Replaceable Unit Removal and Replacement
Air Filter
To remove the 14-Slot Shelf replaceable air filter, complete the following steps:
Step 1. Using the filter tray handle (Figure 1-8), pull the filter tray out, and remove it from the 14-Slot
Shelf.
Step 2. Remove the air filter element from the filter tray and discard the used element.
Replacing the Air Filter
To replace the air filter, complete the following steps:
Step 1. Install the new air filter element in the filter tray, as it is shown in Figure 1-8.
Step 2. Insert the filter tray into the two filter tray guide rails located inside the 14-Slot Shelf filter tray
compartment (Figure 1-8) until the spring mounted ball lock (#4, Figure 1-8) engages.
Chapter 1
45
Field Replaceable Unit Removal and Replacement
Backplane SEEPROM Assemblies
Backplane SEEPROM Assemblies
The redundant 14-Slot Shelf Backplane SEEPROM Assemblies contain chassis configuration information for
the system, and are power-off, cold-swap FRUs. Backplane SEEPROM Assemblies (also known as Chassis
Data Modules CDM1 and CDM2) are small, pluggable circuit board modules that are mounted on the back
side of the 14-Slot Shelf chassis backplane. They can be accessed after removing the Power Entry Modules
(PEMs) mounted in front of them, as shown in Figure 1-9.
IMPORTANT The redundant SEEPROMs contain identical configuration information for the 14-Slot Shelf
system. When a single Backplane SEEPROM Assembly is replaced with a new blank
SEERPOM Assembly from stock, the Shelf Manager (ShMM) will copy all 14-Slot Shelf system
configuration information from the remaining installed SEEPROM into the new replacement
SEEPROM, thereby maintaining redundancy.
Figure 1-9
46
Backplane SEEPROM Assemblies (PEM B Removed)
Chapter 1
Field Replaceable Unit Removal and Replacement
Backplane SEEPROM Assemblies
Removing a 14-Slot Shelf SEEPROM Assembly
WARNING
Electrical Shock Hazard to Personnel. Shut down all normal operation of the 14-Slot Shelf and
disable/disconnect all external power supply power domain circuit breakers in the OFF (O)
position before completing any of the following steps. Failure to disable/disconnect all power
supplied to the 14-Slot Shelf at the power source may result in personal injury.
CAUTION
Electrostatic Discharge Hazard. Observe all ESD safety precautions while completing this
procedure. Failure to follow ESD safety precautions could result in damage to the 14-Slot Shelf
and equipment.
To remove a 14-Slot Shelf SEEPROM assembly, complete the following steps:
Step 1. Remove both PEMs in order to provide maximum physical access to the defective SEEPROM.
Step 2. Carefully remove the Backplane SEEPROM Assembly fixing screw (#4, Figure 1-9) using an
applicable Torx head screw driver. Note that the Torx drive mounting screw is not captive, and can
be easily dropped inside the chassis.
Step 3. Push the SEEPROM Assembly board in the direction of the arrow in Figure 1-9 to release the
locking mechanism in the mounting slot, and remove the SEERPOM Assembly from the backplane.
Step 4. Place the SEEPROM Assembly containing the defective SEEPROM into an anti-static bag.
Replacing a 14-Slot Self SEEPROM Assembly
WARNING
Electrical Shock Hazard to Personnel. Shut down all normal operation of the 14-Slot Shelf and
disable/disconnect all external power supply power domain circuit breakers in the OFF (O)
position before completing any of the following steps. Failure to disable/disconnect all power
supplied to the 14-Slot Shelf at the power source may result in personal injury.
CAUTION
Electrostatic Discharge Hazard. Observe all ESD safety precautions while completing this
procedure. Failure to follow ESD safety precautions could result in damage to the 14-Slot Shelf
and equipment.
To replace a Backplane SEEPROM Assembly, complete the following steps:
Step 1. Ensure that the PEMs have been removed, and that the required SEEPROM Assembly mounting
slot is open and unobstructed (see Figure 1-9).
Step 2. Hold the replacement SEEPROM Assembly vertically by its edges so that the fixing screw hole is at
the top (in the same orientation as shown in Figure 1-9). Slide the SEEPROM Assembly into its
backplane mounting slot, as shown in Figure 1-9, so that the fixing screw hole is aligned with the
fixing screw threads on the backplane.
Step 3. Ensure that the new SEEPROM Assembly is locked in place in its mounting slot, then insert and
tighten the Torx drive mounting screw (Figure 1-9).
Step 4. Reinstall the PEMs.
Chapter 1
47
Field Replaceable Unit Removal and Replacement
Backplane SEEPROM Assemblies
Step 5. This completes the SEEPROM Assembly replacement procedure.
IMPORTANT If replacing a single backplane SEEPROM Assembly, the active ShMM will copy all
existing 14-Slot Shelf system configuration information from the remaining installed
SEEPROM Assembly into the new replacement SEEPROM Assembly when power is
applied to the 14-Slot Shelf.
48
Chapter 1
Field Replaceable Unit Removal and Replacement
Alarm Display Panel and Alarm Connector Panel
Alarm Display Panel and Alarm Connector Panel
This section provides information on removing and replacing the Alarm Display Panel and the Alarm
Connector Panel.
Removing and Replacing the Alarm Display Panel
The Alarm Display Panel is a hot-swap FRU, and is mounted in the upper, left front corner of the Shelf. There
is no hot-swap button or blue hot-swap LED for the Alarm Display Panel.
Removing the Alarm Display Panel
WARNING
Electrical Shock Hazard to Personnel. Shut down all normal operation of the 14-Slot Shelf and
disable/disconnect all external power supply power domain circuit breakers in the OFF (O)
position before completing any of the following steps. Failure to disable/disconnect all power
supplied to the 14-Slot Shelf at the power source may result in personal injury.
CAUTION
Electrostatic Discharge Hazard. Observe all ESD safety precautions while completing this
procedure. Failure to follow ESD safety precautions could result in damage to the 14-Slot Shelf
and equipment.
To remove the Alarm Display Panel, complete the following steps:
Step 1. Loosen the fixing thumb screws holding the Alarm Display Panel (Figure 1-10) to the Shelf.
Chapter 1
49
Field Replaceable Unit Removal and Replacement
Alarm Display Panel and Alarm Connector Panel
Figure 1-10Alarm Display Panel, Front View
Step 2. Pull the Alarm Display Panel unit from the chassis and place it in an anti-static bag.
Replacing the Alarm Display Panel
WARNING
Electrical Shock Hazard to Personnel. Shut down all normal operation of the 14-Slot Shelf and
disable/disconnect all external power supply power domain circuit breakers in the OFF (O)
position before completing any of the following steps. Failure to disable/disconnect all power
supplied to the 14-Slot Shelf at the power source may result in personal injury.
CAUTION
Electrostatic Discharge Hazard. Observe all ESD safety precautions while completing this
procedure. Failure to follow ESD safety precautions could result in damage to the 14-Slot Shelf
and equipment.
To replace an Alarm Display Panel, complete the following steps:
50
Chapter 1
Field Replaceable Unit Removal and Replacement
Alarm Display Panel and Alarm Connector Panel
Step 1. Carefully insert the Alarm Display Panel assembly into its chassis mounting slot, using the fiber
board tabs to align the display connector pins (Figure 1-11).
Figure 1-11Alarm Display Panel, Rear View
Step 2. Ensure that all connector pins are properly aligned with the 14-Slot Shelf receptacle. Using firm
pressure, push the Alarm Display Panel into the chassis connector until it is fully seated.
Step 3. Tighten the two retaining thumb screws to secure the Alarm Display Panel to the 14-Slot Shelf
chassis.
Removing and Replacing the Alarm Connector Panel
The Alarm Connector Panel is a hot-swap FRU, and is mounted in the upper, right front corner of the Shelf.
WARNING
Electrical Shock Hazard to Personnel. Shut down all normal operation of the 14-Slot Shelf and
disable/disconnect all external power supply power domain circuit breakers in the OFF (O)
position before completing any of the following steps. Failure to disable/disconnect all power
supplied to the 14-Slot Shelf at the power source may result in personal injury.
CAUTION
Electrostatic Discharge Hazard. Observe all ESD safety precautions while completing this
procedure. Failure to follow ESD safety precautions could result in damage to the 14-Slot Shelf
and equipment.
Removing the Alarm Connector Panel
To remove the Alarm Connector Panel, complete the following steps:
Step 1. Loosen the retaining thumb screws holding the Alarm Connector Panel to the 14-Slot Shelf chassis
(Figure 1-12).
Chapter 1
51
Field Replaceable Unit Removal and Replacement
Alarm Display Panel and Alarm Connector Panel
Figure 1-12Alarm Connector Panel, Front View
Step 2. Pull the Alarm Connector Panel assembly from the 14-Slot Shelf chassis and place it in an
anti-static bag.
Replacing the Alarm Connector Panel
WARNING
Electrical Shock Hazard to Personnel. Shut down all normal operation of the 14-Slot Shelf and
disable/disconnect all external power supply power domain circuit breakers in the OFF (O)
position before completing any of the following steps. Failure to disable/disconnect all power
supplied to the 14-Slot Shelf at the power source may result in personal injury.
CAUTION
Electrostatic Discharge Hazard. Observe all ESD safety precautions while completing this
procedure. Failure to follow ESD safety precautions could result in damage to the 14-Slot Shelf
and equipment.
To replace an Alarm Connector Panel, complete the following steps:
Step 1. Carefully insert the Alarm Connector Panel assembly into its chassis mounting slot, using the fiber
board tabs to align the mounting connector pins (see Figure 1-13).
Figure 1-13Alarm Connector Panel, Rear View
52
Chapter 1
Field Replaceable Unit Removal and Replacement
Alarm Display Panel and Alarm Connector Panel
Step 2. Ensure that all connector pins are properly aligned with the 14-Slot Shelf receptacle. Using firm
pressure, push the Alarm Connector Panel into the chassis connector until it is fully seated.
Step 3. Tighten the two retaining thumb screws to secure the Alarm Connector Panel to the chassis.
Chapter 1
53
Field Replaceable Unit Removal and Replacement
Cable Trays and Rack Mounting Flange Kit
Cable Trays and Rack Mounting Flange Kit
This section provides procedures for removing and replacing the 14-Slot Shelf rack mount Flanges, front and
rear Cable Trays, and front and rear blade cage Filler Panels.
Removing and Replacing Rack Mount Flanges
To remove the 14-Slot Shelf rack mounting Flanges, complete the following steps:
Step 1. The rack mounting Flanges can be mounted for installing the 14-Slot Shelf in either the 4-post
equipment rack or a 2-post equipment rack (see Figure 1-14). In either case, the removal
procedures are identical.
Figure 1-14 Rack Mount Flange Positions
Step 2. Remove the two mounting flanges from the mounting position (Figure 1-14) by first removing the
two screws that secure each flange to the outside of the 14-Slot Shelf side panels.
54
Chapter 1
Field Replaceable Unit Removal and Replacement
Cable Trays and Rack Mounting Flange Kit
Step 3. Slide each flange down until the flanges drop out of the five retaining clips that hold them to the
Shelf.
Step 4. Set the flanges aside.
To replace the rack mounting flanges, complete the following steps:
Step 1. Position each flange over the five retaining clips on each side of the 14-Slot Shelf chassis for either
the 4-post or 2-post mounting position, as required for your installation. Ensure that the flange
retaining clips on the chassis protrude into the five rectangular-shaped cut-out openings in the
flange body.
Step 2. Ensure that the protruding right-angle flange surfaces that mate to the equipment rack are
oriented toward the front of the 14-Slot Shelf blade cage (see Figure 1-14, flange mounted in
position for 4-post rack installation).
Step 3. Slide each flange up under the flange retaining clips until the flanges are securely seated under
each clip. The rack mounting flange screw holes should now be aligned with mating threaded
receptacles in the 14-Slot Shelf body.
Step 4. Insert two retaining screws into each rack mounting flange and tighten.
Step 5. The 14-Slot Shelf is now ready to be mounted into a four-post equipment rack.
Removing and Replacing Cable Trays
To remove the Shelf front and rear cable trays, complete the following steps:
Step 1. Remove the mounting screws that fix the front or rear cable tray to the Shelf (Figure 1-15 and
Figure 1-16).
Chapter 1
55
Field Replaceable Unit Removal and Replacement
Cable Trays and Rack Mounting Flange Kit
Figure 1-1514-Slot Shelf, Front View (Blade Cage Empty)
56
Chapter 1
Field Replaceable Unit Removal and Replacement
Cable Trays and Rack Mounting Flange Kit
Figure 1-16 14-Slot Shelf, Rear View (Blade Cage Empty)
Step 2. Set the front/rear cable trays and attaching screws aside.
To replace the 14-Slot Shelf front and rear cable trays, complete the following steps:
Step 1. Position the front cable tray (upper front of the blade cage, shown as #7 in Figure 1-15), and insert
and tighten the tray mounting screws.
Step 2. Position the rear cable tray (lower rear of blade cage, just above the PEMs), and insert and tighten
the tray mounting screws (see #17, Figure 1-16 for tray location).
Chapter 1
57
Field Replaceable Unit Removal and Replacement
14-Slot Shelf Chassis and Backplane
14-Slot Shelf Chassis and Backplane
Although the 14-Slot Shelf chassis with backplane is replaced as an individual FRU, the replacement 14-Slot
Shelf chassis and backplane will contain a full complement of chassis components when delivered. These
components include:
•
Both Shelf Management Modules, or “Shelf Managers” (ShMMs)
•
Both Power Entry Modules (PEMs)
•
All Fan Modules
•
Air Filter Tray and Filter Element
•
The Alarm Display Panel
•
The Alarm Connector Panel
•
Both Chassis Data Modules (Backplane SEEPROM Assemblies)
CAUTION
Possible 14-Slot Shelf chassis data loss. The Chassis Data Modules must be removed from the
defective 14-Slot Shelf and installed in the replacement 14-Slot Shelf chassis in order to retain
your 14-Slot Shelf chassis configuration data.
Removing the 14-Slot Shelf Chassis and Backplane
CAUTION
Possible 14-Slot Shelf chassis configuration data loss. In order to retain original chassis
configuration data when the 14-Slot Shelf chassis and backplane are replaced as a FRU, the
original 14-Slot Shelf Backplane SEEPROM Assemblies must be removed from the defective
chassis and installed in the replacement 14-Slot Shelf chassis.
CAUTION
Electrostatic Discharge Hazard. Observe all ESD safety precautions while completing this
procedure. Failure to follow ESD safety precautions could result in damage to the 14-Slot Shelf
and equipment.
NOTE
Removing and replacing the 14-Slot Shelf chassis is a cold-swap procedure. There are no hot
swap requirements for this procedure.
To remove the chassis and backplane from the 14-Slot Shelf system, complete the following steps (refer to
Figure 1-17 and Figure 1-18):
58
Chapter 1
Field Replaceable Unit Removal and Replacement
14-Slot Shelf Chassis and Backplane
Figure 1-17
Chapter 1
14-Slot Shelf, Front View (Blade Cage Empty)
59
Field Replaceable Unit Removal and Replacement
14-Slot Shelf Chassis and Backplane
Figure 1-18
14-Slot Shelf, Rear View (Blade Cage Empty)
Step 1. Shut down normal operation of the HP bh5700ATCA 14-Slot Blade Server.
Step 2. Disconnect/disable all external input power sources to both PEMs.
WARNING
Electrical Shock Hazard. Power is always present at the PEM power terminals
unless the external power source is turned off. Disable/disconnect all power domain
circuit breakers in the OFF (O) position before completing any of the following steps.
Failure to follow electrical safety precautions may result in personal injury.
Step 3. Record all current console and Ethernet cable hookup configurations for all installed blades and the
Shelf, and set aside as a reference for configuring the replacement Shelf.
Step 4. Disconnect all external power supply input cables from the PEMs and protective earth ground
cables from the 14-Slot Shelf chassis.
60
Chapter 1
Field Replaceable Unit Removal and Replacement
14-Slot Shelf Chassis and Backplane
Step 5. Remove all Ethernet Switch Blades, HP bc2100 ATCA Server Blades, and any other installed
blades from the 14-Slot Shelf blade cage, and individually set aside in anti-static bags for
reinstallation in the replacement chassis (follow removal procedures in “Ethernet Switch Blade” on
page 36).
Step 6. Remove all additional blades and filler panels from the blade cage and set aside for installation in
the replacement chassis.
Step 7. If the 14-Slot Shelf is currently installed in a rack, use a mobile mechanical lifting device to support
and transport the 14-Slot Shelf to an anti-static working area for further disassembly.
WARNING
Heavy lift hazard. A fully loaded 14-Slot Shelf can weight as much as 200 lbs (90 kg).
Ensure that the 14-Slot Shelf is secure and balanced on the mechanical lift before
removing it from the equipment rack.
Step 8. Remove both PEMs by following the procedures in “Power Entry Modules (PEMs) and PEM Fuses”
on page 30. Set individual PEMs aside in anti-static bags for reinstallation into this chassis
following replacement of the Backplane SEEPROM Assemblies.
Step 9. Remove both Backplane SEEPROM Assemblies, and set aside in anti-static bags for installation
into the replacement chassis (see removal procedures in “Backplane SEEPROM Assemblies” on
page 46).
Step 10. Set the defective chassis aside until replacement Backplane SEEPROM Assemblies have been
installed in preparation for return of the chassis to Hewlett-Packard.
IMPORTANT Ensure that the two replacement Backplane SEEPROM Assemblies have been
installed, and that PEMs have been reinstalled in the defective 14-Slot Shelf chassis
before it is returned to Hewlett-Packard.
Replacing the 14-Slot Shelf Chassis with Backplane
CAUTION
Electrostatic Discharge Hazard. Observe all ESD safety precautions while completing this
procedure. Failure to follow ESD safety precautions could result in damage to the 14-Slot Shelf
and equipment.
NOTE
Replacing the 14-Slot Shelf chassis is a completely cold- swap procedure. There are no hot-swap
requirements for this procedure.
To replace a 14-Slot Shelf Chassis with Backplane, complete the following preparation and replacement
steps:
Step 1. Ensure that the replacement 14-Slot Shelf chassis is located in an anti-static work area.
Step 2. If the replacement chassis is to be installed in a rack, ensure that the rack mounting flanges are
installed in the correct position. Position rack mounting flanges for either the 4-post or the 2-post
rack, as required.
Step 3. Install the front and rear 14-Slot Shelf cable trays using the existing cable tray mounting screws.
Chapter 1
61
Field Replaceable Unit Removal and Replacement
14-Slot Shelf Chassis and Backplane
Step 4. Remove both PEMs from the replacement chassis.
Step 5. Remove both Backplane SEEPROM Assemblies from the replacement chassis and set aside for
installation into the defective chassis for return to Hewlett-Packard.
Step 6. Install the two Backplane SEEPROM Assemblies you removed from the defective chassis into the
replacement chassis.
Step 7. Reinstall both PEMs in the replacement chassis. Do not connect input power cables and earth
protective grounds until the 14-Slot Shelf has been installed in its operating location.
Step 8. If the replacement 14-Slot Shelf chassis is to be installed in an equipment rack, place the chassis on
a mobile mechanical lifting device for transport and support during installation of the into the rack.
WARNING
Heavy lift hazard. A fully loaded 14-Slot Shelf can weight as much as 200 lbs (90 kg).
Ensure that the 14-Slot Shelf is secure and balanced on the mechanical lift when
installing the 14-Slot Shelf in a rack.
Step 9. Install the replacement 14-Slot Shelf chassis into its equipment rack location and secure all rack
mounting flange screws.
Step 10. Install all blades in the blade cage that were removed from the original 14-Slot Shelf chassis.
Step 11. Install all blade cage front and rear slot Filler Panels to fill all open blade cage slots. Ensure that
there are no open slots remaining in the blades cage front or back in order to maintain cooling air
plenum integrity.
WARNING
Electrical Shock Hazard. Power is always present at the external power supply
cables and PEM power terminals unless the external power source is turned off.
Disable/disconnect all external power supply domain circuit breakers in the OFF (O)
position before completing any of the following steps. Failure to follow electrical
safety precautions may result in personal injury.
Step 12. Reconnect the protective earth ground lead from the installation building to the replacement
14-Slot Shelf chassis (see Figure 1-2).
Step 13. Reconnect all power supply domain leads and return cables to the replacement PEMs (see
Figure 1-2).
Step 14. Verify that all FRUs have been installed in the replacement 14-Slot Shelf chassis and backplane,
and that the cooling air plenum integrity is intact (specifically, that there are no front or rear open
slots in the blade cage).
Step 15. The replacement 14-slot Shelf chassis, components, and blades should now be ready for you to
re-configure all interconnect cables as required by your VLAN topology.
CAUTION
62
Possible management control or data loss. Ensure the Jumpers JB141-144 on both
ShMM carriers boards are installed in the position required by your specific VLAN
topology. Refer to the HP bh5700 ATCA 14-Slot Blade Server, Installation Guide, A Sample
VLAN Topology, Shelf Manager Configuration – eth0 for information of positioning these
jumpers.
Chapter 1
Field Replaceable Unit Removal and Replacement
14-Slot Shelf Chassis and Backplane
Step 16. The replacement 14-Slot Shelf should be ready to reapply external power and resume normal
operation.
Chapter 1
63
Field Replaceable Unit Removal and Replacement
HP bc2100 ATCA Server Blade Hard Disk Drive
HP bc2100 ATCA Server Blade Hard Disk Drive
This section provides information on removing and replacing the HP bc2100 ATCA Server Blade optional
Hard Disk Drive and Mounting Kit.
Removing
the Hard Disk Drive and Mounting Kit
CAUTION
Electrostatic Discharge Hazard. Observe all ESD safety precautions while completing this
procedure. Failure to follow ESD safety precautions could result in damage to the 14-Slot Shelf
and equipment.
To remove the Hard Disk Drive (HDD) and Mounting Kit, complete the following steps:
Step 1. Following the blade hot-swap procedures, remove the HP bc2100 ATCA Server Blade from the shelf.
Step 2. Lay the Server Blade flat on its left side on an ESD-safe working surface, with the blade front panel
facing you (Figure 1-19). Ensure that the blade backplane connector (blue color) is facing away from
you, and located on the far right corner of the blade as it lays flat.
64
Chapter 1
Field Replaceable Unit Removal and Replacement
HP bc2100 ATCA Server Blade Hard Disk Drive
Figure 1-19 HP bc2100 ATCA Server Blade, Access Cover Panel Installed
Step 3. Remove the four countersunk retaining screws that secure the blade cover panel, and remove the
access cover panel. Set the cover panel and the retaining screws aside for reuse.
Step 4. Locate the HDD (Figure 1-20), and remove the four pan head screws holding the HDD mounting
brackets to the blade circuit board stand-off posts. Set the mounting bracket pan head screws aside
for reuse during replacement.
Chapter 1
65
Field Replaceable Unit Removal and Replacement
HP bc2100 ATCA Server Blade Hard Disk Drive
Figure 1-20 HDD Installed
Step 5. Grasp the HDD body with one hand, holding it at the mounting brackets. Gently pull the HDD
body away from the blade SAS connector (in the opposite direction of the arrows in Figure 1-21) to
disconnect the HDD.
66
Chapter 1
Field Replaceable Unit Removal and Replacement
HP bc2100 ATCA Server Blade Hard Disk Drive
Figure 1-21Hard Disk Drive (Arrows Point Toward the Blade Connector)
Step 6. When disconnected from the blade SAS connector, lift the HDD body with mounting brackets free of
the HP bc2100 ATCA Server Blade circuit board.
Step 7. Lay the HDD body with mounting brackets flat on an ESD-safe working surface with the
circuit-side facing upward (see Figure 1-22).
Figure 1-22Hard Disk Drive, Mounting Brackets Attached
Step 8. Remove the four counter-sunk mounting bracket screws in the side of the HDD body. There are two
screws on each side (circled in red in Figure 1-22).
Step 9. Set the mounting bracket screws and the brackets aside for reuse, and place the HDD body into an
anti-static bag.
Chapter 1
67
Field Replaceable Unit Removal and Replacement
HP bc2100 ATCA Server Blade Hard Disk Drive
Replacing the Hard Disk Drive and Mounting Brackets
CAUTION
Electrostatic Discharge Hazard. Observe all ESD safety precautions while completing this
procedure. Failure to follow ESD safety precautions could result in damage to the 14-Slot Shelf
and equipment.
To replace the HDD and HDD mounting brackets, complete the following steps:
Step 1. Place the HDD body on a flat anti-static working surface, with the HDD circuit-side facing up (as
shown in Figure 1-22).
Step 2. Using the four countersunk screws removed earlier and the two HDD mounting brackets (see
Figure 1-23), attach the mounting brackets to the HDD body (see Figure 1-22).
Figure 1-23 Hard Disk Drive Mounting Bracket Kit
Step 3. Holding the HDD and the mounting bracket assembly with the circuit-side down, slide the HDD
body assembly in the direction of the arrows in order to mate the HDD body connector with the
blade SAS connector on the HP bc2100 ATCA Server Blade (Figure 1-21).
Step 4. Ensure that the HDD assembly connector is fully mated to the Server Blade on-board connector,
and that the HDD mounting bracket holes align with the four HDD mounting studs on the blade.
Step 5. Insert the four panhead HDD mounting bracket screws (removed earlier) into the HDD mounting
bracket holes and mounting posts under the brackets in order to affix the HDD assembly to the
blade (Figure 1-20). Tighten the screws to 67.7 newton cm (6 in-lbs).
Step 6. Insert the four countersunk blade cover panel retaining screws previously removed, and tighten
them.
Step 7. This completes replacement of the Server Blade Hard Disk Drive. The blade is now ready for
re-installation.
68
Chapter 1
Field Replaceable Unit Removal and Replacement
HP bc2100 ATCA Server Blade Memory Modules
HP bc2100 ATCA Server Blade Memory Modules
The HP bc2100 ATCA Server Blade Dual In-line Memory Modules (DIMMs) are always installed in pairs.
Each individual DIMM within a pair must be identical in storage capacity, revision, and part number to the
other DIMM in the pair. The current DIMM configurations supported by Hewlett-Packard include any of the
following:
•
Two 1-GB DIMMs (2 GB)
•
Four 1-GB DIMMs (4 GB)
•
Two 2-GB DIMMs (4 GB)
•
Four 2-GB DIMMs (8 GB)
This section provides information on removing and replacing the DIMMs in the HP bc2100 ATCA Server
Blade.
Removing the DIMMs
To remove mounted DIMMs from the Server Blade, complete the following steps:
CAUTION
Observe all ESD safety precautions while completing this procedure. Failure to follow ESD
safety precautions could result in damage to the 14-Slot Shelf and equipment.
1. Following hot-swap procedures, remove the HP bc2100 ATCA Server Blade from the 14-Slot Shelf.
2. Lay the Server Blade flat on an anti-static working surface and position the blade’s front panel facing you.
Ensure that the blade backplane connector (blue color) is facing away from you, and is on right side of the
blade as it lays flat (Figure 1-24).
Figure 1-24
Chapter 1
HP bc2100 ATCA Server Blade, Access Cover Panel Installed
69
Field Replaceable Unit Removal and Replacement
HP bc2100 ATCA Server Blade Memory Modules
3. Remove the countersunk retaining screws that secure the blade access cover panel and remove the cover
panel. Set the cover panel and the retaining screws aside for reuse.
4. To release a DIMM from its socket, pull the two locking levers outward and away from the DIMM ends
(see Figure 1-25).
Figure 1-25
Unlocking DIMM in DIMM Socket U5
5. Remove the DIMM by angling it away from the socket and gently pulling on it. Place the DIMM in an
static-safe location.
6. Repeat steps 4 and 5 to remove additional DIMMs. Place each memory module in a static-safe location.
Replacing the Memory Modules
CAUTION
Observe all ESD safety precautions while completing this procedure. Failure to follow ESD
safety precautions could result in damage to the 14-Slot Shelf and equipment.
CAUTION
Each DIMM is keyed. Ensure the memory module key is indexed correctly before seating into a
DIMM socket. Failure to properly align the DIMM will damage the DIMM and the socket
requiring replacement of the Server Blade and the affected DIMM.
CAUTION
The DIMMs must be replaced in pairs. Each individual DIMM must be identical in storage
capacity, revision, and part number for each pair. The only DIMM configurations supported by
HP include any of the following:
70
•
Two 1-GB DIMMs (2 GB)
•
Four 1-GB DIMMs (4 GB)
•
Two 2-GB DIMMs (4 GB)
•
Four 2-GB DIMMs (8 GB)
Chapter 1
Field Replaceable Unit Removal and Replacement
HP bc2100 ATCA Server Blade Memory Modules
IMPORTANT DIMM sockets U5 and U12 must always be populated (Figure 1-26).
Figure 1-26
DIMM Socket Assignments
If you are only loading one DIMM pair, load the first DIMM into socket U12. This will ease the installation of
the second DIMM into socket U5.
If you are populating all four DIMM sockets, load the DIMMs in this order: Socket U17, U15, U12, and then
U5.
1. Angle the selected DIMM over the empty socket.
2. Correctly orient the key and press the DIMM down evenly into the socket to seat the DIMM.
3. The DIMM socket levers will rise to secure the DIMM. Pull each lever against the side of the DIMM to
ensure it is properly seated.
4. Repeat steps 1 through 3 to load the remaining DIMMs.
5. Reinstall the Server Blade access cover. Fasten the cover with the screws retained earlier.
6. Reinstall the Server Blade into the chassis.
This completes the DIMM replacement procedure.
Chapter 1
71
Field Replaceable Unit Removal and Replacement
HP bc2100 ATCA Server Blade Memory Modules
72
Chapter 1
2 LED Indicators
Chapter 2
73
LED Indicators
Introduction
Introduction
Many of the components of the HP bh5700 have Light Emitting Diodes (LEDs) that are a visual diagnostic for
the health of the server. The usual colors used for LEDs are amber (yellow), green, red, and blue. Each
component has a variety of LEDs that have different server health meanings. Listed are the LEDs for the
Ethernet Switch Blade, the 14-slot Shelf Manager (ShMM), and the HP bc2100 ATCA Server Blade.
74
Chapter 2
LED Indicators
Ethernet Switch Blade
Ethernet Switch Blade
The following information covers normal and abnormal LED activity.
Chapter 2
75
LED Indicators
Ethernet Switch Blade
Normal LED Activity
Figure 2-1
76
Ethernet Switch blade LED Display
Chapter 2
LED Indicators
Ethernet Switch Blade
During a successful boot, the following sequence of LED activity should be observed:
1. All LEDs are off as the board is released from reset (Initial insertion into chassis, or pressing the front
panel reset button).
2. IPMC turns on the OUT OF SERVICE and HEALTHY LEDs on the front panel.
3. HEALTHY LED turns green when the IPMC is up and running.
4. Ethernet link and activity (CLK, OK, INT FLT, EXT FLT) LEDs are turned on when the IPMC powers up
the board (these LEDs are also turned on when the front panel reset switch is depressed, but turned off
again when the board is released from reset in step 1).
5. When power up is complete, the Ethernet link/activity LEDs off.
6. When the bootloader code begins executing out of SDRAM, the Ethernet link LEDs turn to ORANGE and
CLK turns to RED. OK, INT FLT, and EXT FLT remain off. The LEDs will remain in this state while
the OpenArchitect (OA) software is loaded into RAM. (Console: Sparky version message is displayed,
“Testing memory activity,” ZMON banner displayed).
7. OK is turned on when the OA software completes its boot successfully. The CLK LED will blink. INT
FLT should be off. The Ethernet link LEDs will reflect the actual state of the network link for the
configured ports. The EXT FLT link may be turned on if any port brought up by ifconfig cannot establish
a link to a remote partner.
NOTE
If the switch ports are not fully populated with connections to other devices, and the
ifconfig brought up all the parts, this can result in the EXT FLT being turned on even
though all of the established connections are operating normally.
8. Normal LED states for a fully operational (healthy state) switch are as follows:
•
Healthy LED – Green
•
Hot-Swap LED - off
•
CLK LED blinking
•
OK LED on
Deviations from this sequence can help pinpoint at what point during the boot process the switch encountered
a problem.
NOTE
Chapter 2
If the Ethernet Switch Blade does not display this normal sequence of activity, refer to the
Abnormal LED Activity section, below.
77
LED Indicators
Ethernet Switch Blade
Abnormal LED Activity
Use the table below as a guide to troubleshoot the LED indicators after the Ethernet Switch Blade has been
powered up in the chassis for at least 60 seconds and allowed to go through the normal boot process. Table 2-1
translates the LED indicators on the front panel of the Ethernet Switch Blade into a Tip number. Use the tip
number listed in Table 2-1 to find a solution in Table 2-2.
Troubleshooting the Ethernet Switch Blade with Status Indicators
Table 2-1
Troubleshooting with LED Status Indicators
Hot-Swap
(Blue_
Healthy
(Red /
Green)
CLK
(Green)
OK
(Green)
Int
Fault
(Amber)
System
(Green)
Out of
Service
(Red)
Ext
Fault
(Amber)
Tip
Off
Green
Blinking
Green
Green
Off
Off
Off
-
Normal
Off
Off
Off
Off
Off
Off
Off
Off
1
Blue or
blinking
blue
RED
Off
Off
Off
..
..
Off
2
Off
Red
Off
Off
Off
..
..
Off
3
Off
Green
Off
Off
Off
..
..
Off
4
Off
Off
Red
Off
Off
..
..
Off
5
..
..
..
..
Amber
Off
OFF
Off
6
..
..
..
..
..
..
Red
..
7
..
..
..
..
..
..
..
Amber
8
78
Chapter 2
LED Indicators
Ethernet Switch Blade
Table 2-2
Solution Table for LED Indicators
Tip
1
Problem
No power
Solution
1. Examine other blades in the front card cage. If all
blades indicate no power, verify that the power is
applied to the chassis and that the Power Entry
Modules are operational.
2. Verify that the Switch is fully inserted into the front
card cage. If not, fully seat the switch.
3. Verify that the switch is in either chassis slot 7 or 8. If
in another slot, move it to either slot 7 or 8.
4. Check to see if the lower ejector lever is open. If open or
partially open, fully close the lower ejector lever.
5. Remove the switch and examine the blade's backplane
connectors, especially the blue power connector, for
bent or broken pins. If any pins are bent or broken are,
replace the switch.
6. Examine the backplane's blade connectors for bent or
broken pins. If any pins are bent or broken, replace the
chassis.
2
Hot-Swap ejector open
1. Make sure that the lower ejector handle is fully closed.
The hot swap LED may remain illuminated or blinking
if awaiting permission to activate from the Shelf
Manager.
2. If either ejector handle cannot be closed, replace the
Switch.
3. If the lower Hot Swap handle is closed, retrieve the
Mstate information from the Shelf Manager.
4. A blinking Hot Swap LED may indicate a failure in
communications between the switch and the Shelf
Manager. Use information in the System Event Log
(SEL) to identify chassis communication problems. If
other FRUs are also encountering difficulty, replace the
Chassis.
Chapter 2
79
LED Indicators
Ethernet Switch Blade
Table 2-2
Tip
3
Solution Table for LED Indicators (Continued)
Problem
Solution
Voltage or temperature
sensors are outside of
threshold
1. Examine the other Blades in the Shelf. If all of the
healthy LEDs are illuminated red, there may be a
power failure on one of the two redundant power
busses. Check that both power busses to the ATCA are
on (energized) and check both Power Entry Modules as
described in the PEM section.
2. If voltage and temperature sensors are within
threshold, this indicates an internal hardware fault
and inoperable IPMC. Additional troubleshooting using
the SEL is required to determine the cause of failure.
3. Follow the other troubleshooting tips in 3.5to
determine if exceeded thresholds are specific to the
switch
4. If a chassis problem is suspected, replace the chassis
5. If the switch is the only FRU experiencing the problem
reset the switch by pressing the base reset button.
6. If the reset does not correct the problem, replace the
Switch.
4
Bootloader code unable to load
1. Reset the switch by pressing the base reset button.
2. If the reset does not solve the problem, the boot loader
code was not able to load.
5
The OpenArchitect Linux
image did not load successfully
from an onboard flash.
1. The OpenArchitect Linux image did not load
successfully from the onboard flash. If a recent
firmware update was performed on the switch, this
may indicate either a flash failure, or a corrupted
image was flashed during the update.
•
Using a console connection configure the switch to
boot from its alternate flash. See Troubleshooting a
failed OpenArchitect Load” in the Ethernet Switch
Blade Manual for additional information.
•
6
80
Serious Internal Hardware
error
If the e OpenArchitect Linux image fails to load
after being directed to boot from the alternate flash
and troubleshooting fails to correct the problem,
replace the Switch.
1. Reset the switch with the base reset button.
2. If the reset does not correct the problem, replace the
switch.
Chapter 2
LED Indicators
Ethernet Switch Blade
Table 2-2
Tip
7
Solution Table for LED Indicators (Continued)
Problem
Board held in reset
Solution
1. The Shelf Manager is holding the Switch in RESET.
Follow the troubleshooting tips in "Diagnosing a failed
Shelf Manger Activation" in the Ethernet Switch Blade
Manual to extract the Shelf Manager information for
further analysis.
2. If, after troubleshooting the Shelf Manager information
the Switch is still being held in RESET, replace the
Switch.
8
Network Error
1. The EXT FLT LED indicates communications could not
be established with one or more remote partner devices
on an active port or ports. Ports which were configured
to be up (via ifconfig), but do not have remote partner
devices attached, can cause the EXT FLT LED to be lit,
even if there are no hardware problems with the
Switch. See "Network Configuration Problems" in the
Ethernet Switch Blade Manual for more information.
2. Examine the cable between the Switch and the remote
partners. If the cable is disconnected, broken, or
damaged, replace the cable.
3. Verify that the remote partners are active. If not,
activate the remote partner and verify proper
operation.
4. If the remote partners are active and the cable is good,
reset the switch by pressing the fabric reset button.
5. If the fabric reset button does not correct the problem,
replace the Switch.
Chapter 2
81
LED Indicators
14-Slot Shelf
14-Slot Shelf
This section provides LED indicator and LED connection information on the HP bh5700 Telco Blade 14-Slot
Shelf and its components.
Shelf Alarm display
The Alarm Display Panel (ADP) is located at the right front top side of the Shelf. It provides the Telco Alarm
connector (DB15-male). The I²C-bus devices on the ADP are connected to the Master-Only I²C-bus of both
Shelf Managers. Only the active Shelf Manager has access to the SAP.
The ADP is a user interface and is located at the left front top of the Shelf. It provides the following (see
Figure 2-2):
•
Three Shelf Alarm LEDs (MINOR, MAJOR, CRITICAL)
•
Three User-definable LEDs (USER1, USER2, USER3)
•
Three Fan Tray Alarm LEDs (Left, Center, Right)
•
Three Fan Tray OK LEDs (Left, Center, Right)
•
An Alarm Cutoff push button (RST)
•
Two serial console interfaces for both Shelf Managers (RJ45 connectors)
82
Chapter 2
LED Indicators
14-Slot Shelf
Figure 2-2
Alarm Display Panel
The LEDs USER (1, 2, 3) are user definable and connected to the I²C-bus I/O port of the PCA 9555 on the
ADP.
Troubleshooting the Shelf Alarm Display Panel
The Shelf Alarm Display Panel has a low failure rate. Any indication displayed is being reported by some
other electrical subsystem
Table 2-3
Shelf Alarm Display Panel LED Indicators
Fan
Tray
Alarm
(Red)
Fan
Tray
OK
(Green)
Critical
Alarm
(Red)
Major
Alarm
(Amber
)
Minor
Alarm
(Yellow
)
Off
Off
Off
Off
Green
Red
Amber
Yellow
Red
Green
Chapter 2
User
LED 2
(Green)
User
LED 3
(Amber
)
Off
Off
Off
Normal
Red
Green
Amber
1
User
LED 1
(Red)
Tip
83
LED Indicators
14-Slot Shelf
Table 2-3
Shelf Alarm Display Panel LED Indicators (Continued)
User
LED 2
(Green)
User
LED 3
(Amber
)
Off
Off
Off
2
-
-
-
-
3
-
-
-
-
-
4
Yellow
-
-
-
-
-
5
-
-
Red
-
-
-
-
6
-
-
-
-
-
Red
-
-
7
-
-
-
-
-
-
Green
-
8
-
-
-
-
-
-
-
Amber
9
Fan
Tray
Alarm
(Red)
Fan
Tray
OK
(Green)
Critical
Alarm
(Red)
Major
Alarm
(Amber
)
Minor
Alarm
(Yellow
)
Off
Off
Off
Off
Off
Red
-
-
-
-
Amber
-
-
-
-
Table 2-4
Tip
1
User
LED 1
(Red)
Tip
Shelf Alarm Display Panel LED Tips
Symptom
LED Test
Action
1. The LEDs are tested when primary power is first
applied to the chassis by illuminating all LEDs for a
period of up to 15 seconds.
2. If one or more LEDs fail to illuminate, follow the
instructions in Tip 2.
84
Chapter 2
LED Indicators
14-Slot Shelf
Table 2-4
Tip
2
Shelf Alarm Display Panel LED Tips (Continued)
Symptom
All LEDs are off
Action
1. Check the Power Entry Module for proper operation.
2. Check the Shelf Alarm Display for proper seating.
3. Cycle both primary power busses to the system at the
same time. During the initial boot cycle all 12 LEDs
should turn on during the LED check cycle. If all LEDs
turn on the Shelf Alarm Display is good. Look for other
error conditions and LEDs
4. Remove the Shelf Alarm Display and examine the Shelf
Alarm Panel's Horizontal Board connector for bent or
broken pins. If any pin is bent or damaged, replace the
Shelf Alarm Display Assembly.
5. Examine the Shelf Alarm Panel mating connector on
the Horizontal Board for bent or broken pins. If any pin
is bent or damaged, replace the Chassis.
6. Examine the Riser Board to determine if a payload
module in slot 14 has scraped against it. If the Riser
Board is damaged replace the chassis.
7. Replace the Shelf Alarm Display.
3
Critical Event has
occurred
The Shelf Alarm Display is indicating that a Critical event
has occurred. See the System Event Log, 0, for Critical
Events to determine which parameter caused the alarm.
4
Major Event has occurred
The Shelf Alarm Display is indicating that a Major event
has occurred. See the System Event Log, 0, for Major
Events to determine which parameter caused the alarm.
5
Minor Event has occurred
The Shelf Alarm Display is indicating that a Minor event
has occurred. See the System Event Log, 0, for Minor
Events to determine which parameter caused the alarm.
6
Fan Tray Failure
The Shelf Alarm Display is indicating that there is a failure
in one of the Fan Trays. Check the fan trays.
7
User LED 1 Indication
The user LEDs are delivered unprogrammed. They may be
programmed to indicate events that are important to the
customer. If a user defined LED is lit, report it to the
customer to determine the cause.
8
User LED 2 Indication
The user LEDs are delivered unprogrammed. They may be
programmed to indicate events that are important to the
customer. If a user defined LED is lit, report it to the
customer to determine the cause.
9
User LED 3 Indication
The user LEDs are delivered unprogrammed. They may be
programmed to indicate events that are important to the
customer. If a user defined LED is lit, report it to the
customer to determine the cause.
Chapter 2
85
LED Indicators
14-Slot Shelf
Connection Between the Shelf Manager and ADP
The following figures show the connection between the Shelf Manager and the ADP, and block diagrams of
the Shelf Manager and the ADP (Figure 2-3, Figure 2-4, and, Figure 2-5).
Figure 2-3
86
Alarm Display Panel Interconnect Diagram
Chapter 2
LED Indicators
14-Slot Shelf
Figure 2-4
Chapter 2
Alarm Display Panel Block Diagram (1)
87
LED Indicators
14-Slot Shelf
Figure 2-5
Alarm Display Panel Block Diagram (2)
Shelf Alarm Display Horizontal Board Connector
Figure 2-6 shows the connector for the Shelf Alarm Display. Table 2-5 lists the pin assignments for the SAD.
88
Chapter 2
LED Indicators
14-Slot Shelf
Figure 2-6
Alarm Display Panel Horizontal Board Connector
Table 2-5
Alarm Display Panel Horizontal Board Pin Assignment
Pin
Signal Name
Description
1
GND
Ground
2
GND
Ground
3
GND
Ground
4
RXD0_ACB1
Receive Data to primary Shelf Manager
5
RXD0_ACB2
Receive Data to secondary Manager
6
TXD0_ACB1
Transmit Data from primary Shelf Manager
7
TXD0_ACB2
Transmit Data from secondary Shelf Manager
8
DSR_ACB1
Data Set Ready to primary Shelf Manager
9
DSR_ACB2
Data Set Ready to secondary Shelf Manager
10
DTR_ACB1
Data Terminal Ready from primary Shelf Manager
11
DTR_ACB2
Data Terminal Ready from secondary Shelf Manager
12
RXD0_ACB1
Clear To Send from primary Shelf Manager
13
CTS_ACB2
Clear to Send from secondary Shelf Manager
14
RTS_ACB1
Request to Send to primary Shelf Manager
15
RTS_ACB2
Request to Send to secondary Shelf Manager
16
LED_MIN
Signal to Minor Alarm LED
17
LED_MAJ
Signal to Major Alarm LED
18
LED_CRIT
Signal to Critical Alarm LED
19
LED_USER1
Signal to User Definable LED1
20
LED_USER2
Signal to User Definable LED2
21
LED_USER3
Signal to User Definable LED3
Chapter 2
89
LED Indicators
14-Slot Shelf
Table 2-5
Alarm Display Panel Horizontal Board Pin Assignment (Continued)
Pin
Signal Name
Description
22
RST_PB
Signal from Alarm Cutoff Push Button
23
LED_FT-FAIL_1
Signal to Fan Tray Left Alarm LED
24
LED_FT_FAIL_2
Signal to Fan Tray Center Alarm LED
25
LED_FT_FAIL_3
Signal to Fan Tray Right Alarm LED
26
LED_FT_OK_1
Signal to Fan Tray Left OK LED
27
LED_FT_OK_2
Signal to Fan Tray Center OK LED
28
LED_FT_OK_3
Signal to Fan Tray Left OK LED
Alarm Display Panel Telco Alarms
The following section describes some of the alarm interfaces, LEDs, and other functions.
Telco Alarm Interface
The ADP provides a Telco Alarm interface on the DB15-male connector. The Telco Alarm interface relay
circuits are capable of carrying 60 VDC or 1 A with a max. rating of 30 VA. The ADP accepts timed pulse
inputs for clearing Minor and Major alarm states.
There is no test for the Critical state.
NOTE
Reset is accomplished by asserting a voltage differential from 3.3 V to 48 V for between 200 and 300 ms. The
acceptance voltage range is from 0 to 48 VDC continuous (handles up to 60 VDC at a 50% duty cycle). The
current drawn by a reset input does not exceed 12 mA.
Telco Alarm LEDs
The Shelf Alarm Display provides the Telco Alarm LEDs. These LEDs indicate presence of Critical, Major
and Minor alarms as follows:
Table 2-6
Telco Alarm LEDs
State
Description
Off
No alarm triggered
On
Alarm triggered
Blinking
Alarm Cutoff (ACO) is activated
Telco Alarm Cutoff Pushbuttons
The Telco Alarm Cutoff push button (RST) on the Shelf Alarm Display activates the Alarm Cutoff (ACO)
state. When ACO is activated, the active Alarm LEDs blink and all of the alarm relays are deactivated.
90
Chapter 2
LED Indicators
14-Slot Shelf
The push button only activates the Alarm Cutoff (ACO) state, but does not clear the alarm
completely.
NOTE
Telco Alarm Connector on the Shelf Alarm Panel
The Shelf Alarm Panel (SAP) is a user interface that provides a Telco Alarm connector for troubleshooting.
Figure 2-7
Telco Alarm Connector (DB15-male)
Table 2-7
Telco Alarm Connector (DB15-male)
cn2
Name
Description
1
AMIR+
MinorReset+
2
AMIR-
MinorRest-
3
AMAR+
MajorReset+
4
AMAR-
MajorReset-
5
ACNO
CriticalAlarm-NO
6
ACNC
CriticalAlarm-NC
7
ACCOM
CriticalAlarm-COM
8
AMINO
MinorAlarm-NO
9
AMINC
MinorAlarm-NC
10
AMINCOM
MinorAlarm-CDM
11
AMANO
MajorAlarm-NO
12
AMANC
MajorAlarm-NC
13
AMACOM
MajorAlarm-COM
14
APRCO
PwrAlarm-NO
15
APRCOM
PwrAlarm-COM
Chapter 2
91
LED Indicators
14-Slot Shelf
Troubleshooting the Shelf Alarm Panel
The Shelf Alarm Panel is a pass-through device with no logical circuits. Problems with the SAP are generally
mechanical damage to the Telco Alarm Connector or the connector between the Shelf Alarm Panel and the
Horizontal Board.
Table 2-8
Tip
1
Shelf Alarm Panel Troubleshooting
Symptom
Action
Communicat
ion problems
to the Shelf
thorough the
SAP
connector
1. Check Shelf Alarm Panel for proper seating and verify that the
fixing screws are tight.
2. Examine the Telco Alarm Connector for bent or broken pins. If
pins are bent or damaged, replace the Shelf Alarm Panel
Assembly.
3. Remove the Shelf Alarm Panel and examine the Shelf Alarm
Display's Horizontal Board connector for bent or broken pins. If
bent or damaged pins are discovered, replace the Shelf Alarm
Panel Assembly.
4. Examine the Shelf Alarm Panel mating connector on the
Horizontal Board for bent or broken pins. If pins are bent or
damaged, replace the Chassis.
5. Replace the Shelf Alarm Panel.
Alarm Connector Panel Horizontal Board Connector
Figure 2-8 and Table 2-9 show the Alarm Connector Panel (ACP) Horizontal Board Connector and the pin
assignments.
Figure 2-8
Alarm Connector Panel Horizontal Board Connector
Table 2-9
Alarm Connector Panel Horizontal Board Connector Pin Assignment
Pin
Signal Name
Description
1
LED_USER1
Signal to User Definable LED1 on Shelf Alarm Display
2
LED_USER2
Signal to User Definable LED2 on Shelf Alarm Display
92
Chapter 2
LED Indicators
14-Slot Shelf
Table 2-9
Pin
Alarm Connector Panel Horizontal Board Connector Pin Assignment
Signal Name
Description
3
LED_USER3
Signal to User definable LED3 on Shelf Alarm Display
4
LED_MIN
Signal to Minor Alarm LED on Shelf Alarm Display
5
LED_MAJ
Signal to Major Alarm LED on Shelf Alarm Display
6
LED_CRIT
Signal to Critical Alarm LED on Shelf Alarm Display
7
RST_PB
Signal from Alarm Cutoff Push Button on Shelf Alarm Display
8
GND
Ground
9
SCL_CH0
Serial Clock Master – Only I²C-Bus Channel 0
10
SDA_CH0
Serial Data master – Only I²C–Bus Channel 0
11
GND
Ground
12
ADP_PRES
ADP Presence Signal (Grounded on DAP)
13
INT#
External Interrupt Request (Master – Only I²C–bus devices
14
GND
Ground
15
I2C_PWR_B
3.3 VDC power supply for Shelf I²C–bus devices
16
I2C_PWR_A
3.3 VDC power supply for Shelf I²C-bus devices
Alarm Display Panel Temperature Sensor
The LM75 temperature sensor measuring the board temperature is located on the ADP PCB. The
temperature sensor is connected to the Master-Only I²C-bus.
Fan Trays
The 14 Slot ATCA Shelf contains three interchangeable Fan Trays. The Fan Trays are plugged in at the rear
top of the Shelf and can be removed by lifting the retention lever.
Each Fan Tray contains three radial fans for cooling the front boards. The fan speeds are monitored by a
tachometer signal sent from the Fan Trays to the Shelf Manager. The Shelf Manager regulates the fan speed
with a DC voltage. The display module at the Fan Tray provides:
•
A blue Hot-Swap LED.
•
A red Fan Tray Alarm LED.
•
A green Fan Tray OK LED.
•
A Hot-Swap push button.
The Fan Tray, its display module, and the fan tray numbering scheme are shown in Figure 2-9, Figure 2-10,
and Table 2-10.
Chapter 2
93
LED Indicators
14-Slot Shelf
Figure 2-9
94
Fan Tray, Front and Rear View
Chapter 2
LED Indicators
14-Slot Shelf
Figure 2-10
Fan Tray Number Scheme
Table 2-10
Fan and Fan Tray Numbering Scheme
0
Fan #0
4
Fan #4
8
Fan #8
1
Fan #1
5
Fan #5
10
Fan Tray #0 (Left)
2
Fan #2
6
Fan #6
11
Fan Tray #1 (Center)
3
Fan #3
7
Fan #7
12
Fan Tray #2 (Right)
Fan Tray Signals
The Fan Tray provides signals for:
•
Voltage monitoring
•
Switching off the fans
•
Status of the DC/DC converter
Chapter 2
95
LED Indicators
14-Slot Shelf
These signals are controlled by the PCA9555 I²C device on the Fan Tray PCB. The Shelf Manager has access
to these signals via Channel 3 of the Master-Only I²C-bus. The fan signals are shown in Table 2-11, and
Figure 2-11.
Table 2-11
Fan Tray Signals
Signal
Description
-48 V_A bus voltage
Indicates the presence of the -48 V_A/VRTN_A at the Horizontal Board Connector.
-48 V_A fan tray voltage
Indicates the presence of the -48 V_A/VRTN_A after the fan tray’s main fuse.
-48 V_B bus voltage
Indicates the presence of the -48 V_B/VRTN_B at the Horizontal Board Connector.
-48 V_B fan tray voltage
Indicates the presence of the -48 V_B/VRTN_B after the fan tray’s main fuse.
DC/DC OK
Indicates the proper functioning of the DC-DC converter that generates the 24 V
voltage supply.
Fan Off
Turns off the fans.
Figure 2-11
96
Fan Tray Block Diagram
Chapter 2
LED Indicators
14-Slot Shelf
Fan Tray Temperature Sensor
The temperature sensors (LM75) in the Fan Trays measure the exhaust temperatures of the Shelf. The
temperature sensors are connected to Channel 3 of the Master-Only I²C-bus.
Fan Tray Control Board SEEPROM
The SEEPROM on the Fan Tray control board stores the FRU data and is connected to Channel 3 of the
Master-Only I²C-bus.
Fan Tray Connectors and Indicators
Table 2-12, Figure 2-12, and Table 2-13 provide information on the fan tray LED indicators and backplane
connector.
Table 2-12
LEDs on the Fan Tray Control Panel
Color
Description
Blue
Hot-Swap LED
Red
Alarm LED
Green
Fan tray OK LED
Figure 2-12
Fan Tray Backplane Connector
Table 2-13
Fan Tray Backplane Connector Pin Assignment
Pin Number
Signal
Pin Number
Signal
1
I2C_PWER_A
13
GND
2
I²C_PWR_B
14
FANTRAY_PRESENT
3
SCL
15
HA0
4
SDA
16
HA1
5
LED_FT_OK
17
INT#
6
LED_FT_FAIL
18
7
8
Chapter 2
FAN_TK3
19
VRTN_B
20
VRTN_A
97
LED Indicators
14-Slot Shelf
Table 2-13
Fan Tray Backplane Connector Pin Assignment (Continued)
Pin Number
Signal
Pin Number
Signal
9
FAN_TK2
21
-48 V_B
10
FAN_TK1
22
-48 V_A
11
FAN_Speed
23
FAN_24V
24
FAN_PWR_RTN
12
Troubleshooting Fan Trays
Table 2-14
Hot-Swap
(Blue)
Fan Tray LED Indicators
Ran Tray
Alarm
(Red)
Fan Tray
OK (Green)
Tip
-
-
Green
Normal
Blue
Red
Green
1
-
-
-
2
-
Red
-
3
Flashing
Blue
-
-
4
Blue
-
-
5
Table 2-15
Tip
1
Fan Tray LED Indicator Tips
Symptom
LED test
Action
1. The LEDs are tested when primary power is first
applied to the chassis by turning on all LEDs,
regardless of the true status, for a period of up to 15
seconds.
2. If one or more LEDs fail to illuminate, replace the Fan
Tray.
98
Chapter 2
LED Indicators
14-Slot Shelf
Table 2-15
Tip
2
Fan Tray LED Indicator Tips (Continued)
Symptom
No Fan Tray indicators on.
Action
1. Check the Fan Tray for proper seating.
2. Verify that the Fan Tray is installed right side up. The
Extraction Handle be down.
3. Remove Fan Tray and examine the Horizontal Board
Connector on the Fan Tray for bent or broken pins. If
pins are bent or damaged, replace the Fan Tray.
4. Flip the Fan Tray Air Dam on the chassis UP and
examine the Fan Tray connector on the Horizontal
Board for bent or broken pins. If pins are bent or
damaged, replace the Chassis.
5. Replace the Fan Tray.
3
Fan Tray indicates Failure.
1. Check the Fan Tray for proper seating.
2. Remove Fan Tray and examine the Horizontal Board
Connector on the Fan Tray for bent or broken pins. If
Bent or damaged pins are discovered, replace the Fan
Tray.
3. Flip the Fan Tray Air Dam on the chassis UP and
examine the Fan Tray connector on the Horizontal
Board for bent or broken pins. If bent or damaged pins
are discovered, replace the Chassis.
4. Replace the Fan Tray.
4
Blue hot-swap LED is
flashing
Fan tray is preparing for hot-swap
5
Blue hot-swap LED is on
solid
Fan tray is ready to be removed (hot-swapped).
Power Entry Module (PEM)
WARNING
Hazardous Voltage! Before working, ensure that the power is removed from the power
connection cables. When the system is powered on, do NOT touch the power terminals.
Two pluggable redundant Power Entry Modules (PEMs) are located at the rear bottom side of the Shelf. Each
PEM provides power terminals for four 30 A power feeds.
NOTE
Although there are fuses in the power entry circuit of the Shelf, the power lines must be
protected on rack level with 30 A breakers.
The power filtering consists of filtered power terminals and a discrete line-filter for each power input. The
input voltage range for the Shelf is from -37 VDC to -72 VDC.
Chapter 2
99
LED Indicators
14-Slot Shelf
To indicate the presence of the PEM, a PEM presence signal is grounded by the PEM body. A Blue Hot-Swap
LED and a Hot-Swap Push Button provide Hot-Swap functionality.
A red (power failure) and a green (OK) LED provide status indication. Each of the four redundant
power-feeds supply power to a separate part of the ATCA Backplane.
PEM Components
Figure 2-13
PEM Components
Table 2-16
PEM Components
1
Hot-Swap Push Button
5
Power Terminal Cover
2
Hot-Swap Push Button
6
Handle
3
PEM Alarm LED (red)
7
PEM fixing screws
4
PEM Alarm LED (red)
8
Shelf Ground Connection
100
Chapter 2
LED Indicators
14-Slot Shelf
Figure 2-14
PEM Block Diagram
PEM I/O Device
The PEM I/O device (PCA9555):
•
Controls the status of the LEDs.
•
Reads the status of the Hot-Swap push button.
•
Reads the status of the -48 VDC inputs.
Table 2-17
PCA9555 I/O
Pin
0.0
Chapter 2
PEM PCA Pin Assignments
Function
Power input 2 Backplane connector
present
State
-48 V present = 0
-48 V absent = 1 (3.3V)
101
LED Indicators
14-Slot Shelf
Table 2-17
PEM PCA Pin Assignments (Continued)
PCA9555 I/O
Pin
Function
0.1
State
Power input 2 behind the fuse
present
-48 V present = 0
Power input 1 at Backplane
connector present
-48 V present = 0
Power input 1 behind the fuse
present.
-48 V present = 0
0.4
N/C
Pulled High
0.5
N/C
Pulled High
0.6
Power input 4 Backplane connector
present
-48 V present = 0
Power input 4 behind the fuse
present
-48 V present = 0
Power input 3 Backplane connector
present
-48 V present = 0
Power input 3 behind the fuse
present
-48 V present = 0
1.2
N/C
Pulled High
1.3
Green LED
1 = On
1.4
Push-button switch
1 = Out, 0 = Pushed
1.5
Red LED
1 = On
1.6
N/C
Pulled High
1.7
Blue LED
1 = On
0.2
0.3
0.7
1.0
1.1
-48 V absent = 1 (3.3V)
-48 V absent = 1 (3.3V)
-48 V absent = 1 (3.3V)
-48 V absent = 1 (3.3V)
-48 V absent = 1 (3.3V)
-48 V absent = 1 (3.3V)
-48 V absent = 1 (3.3V)
Troubleshooting the Power Entry Module
TABLE REF HERE
Table 2-18
Power Entry Modules LED Indicators
PEM
Alarm
(Red)
Hot Swap
(Blue)
PEM OK
(Green
Tip
-
-
Green
Normal
Blue
Red
Green
1
102
Chapter 2
LED Indicators
14-Slot Shelf
Table 2-18
Power Entry Modules LED Indicators (Continued)
PEM
Alarm
(Red)
Hot Swap
(Blue)
PEM OK
(Green
Tip
-
-
-
2
-
Red
-
3
Flashing
Blue
-
-
4
Blue
-
-
5
Table 2-19
Tip
1
Power Entry Module Troubleshooting Actions
Symptom
LED Test
Action
1. The LEDs are tested when primary power is first
applied to the chassis by turning on all LEDs,
regardless of the true status, for a period of up to 15
seconds.
2. If one or more LEDs fail to illuminate, replace the
Power Entry Module.
2
No Power Entry Modules
indicators are on.
1. Check the Power Entry Module for proper seating.
2. Remove Power Entry Module and examine the
Backplane connector on the Power Entry Module for
bent or broken pins. If pins are bent or damaged,
replace the Power Entry Module.
3. Examine the Power Entry Module mating connector on
the backplane for bent or broken pins. If pins are bent
or damaged, replace Chassis.
4. Replace the Power Entry Module.
3
Power Entry Module
indicates Failure.
1. Check the Power Entry Module for proper seating.
2. Examine the connection between the Power Entry
Cable and the Power Entry Module's terminal block.
3. Remove Power Entry Module and examine the
Backplane connector on the Power Entry Module for
bent or broken pins. If pins are bent or damaged,
replace the Power Entry Module.
4. Examine the Power Entry Module mating connector on
the backplane for bent or broken pins. If pins bent or
damaged, replace the Chassis.
5. Replace the Power Entry Module.
4
Chapter 2
Flashing Blue LED
PEM is preparing for hot-swap.
103
LED Indicators
14-Slot Shelf
Table 2-19
Power Entry Module Troubleshooting Actions (Continued)
Tip
5
Symptom
Blue LED on solid
Action
PEM is ready for hot-swap. PEM may be safely removed
from the chassis.
Shelf Manager LEDs
Front Panel Components
Figure 2-15
Shelf Manager Front Panel Components
Ethernet Channels
The Shelf Manager Module provides two 10/100 Ethernet interfaces. The first Ethernet channel (ETH0) is
routed to the jumpers JP40 through JP43 and then to either the RJ-45 connector on the front panel or to the
backplane connector J2. The backplane routes this channel to the ShMC port on the corresponding Base
Interface Hub board. The second Ethernet channel (ETH1) is routed to the other Base Interface Hub board
(ShMC Cross Connect). Both Ethernet ports support 10 Mb (10BASE-T) and 100 Mb (100BASE-TX)
connections.
The Shelf Manager Module provides two status LEDs for each Ethernet channel (ETH0 and ETH1). The
LEDs are:
•
Yellow LED indicates 100 Mb speed when lit.
•
Green LED indicates link/activity when lit/blinking.
104
Chapter 2
LED Indicators
14-Slot Shelf
Hardware Redundancy Interface
The Shelf Manager supports redundant operation with automatic switchover using redundant Shelf
Managers. In a configuration where two Shelf Manager are present, one acts as the active Shelf Manager and
the other as a standby. The Shelf Managers monitor each other and either can trigger a switchover if
necessary.
The hardware redundancy interfaces of the Shelf Managers are as follows:
•
Cross connected Shelf Manger present input (PRES_1#) and output (PRES_GND#).
•
Cross connected Shelf Manger present input (PRES_1#) and output (PRES_GND#).
•
Cross connected Shelf Manager health input (HLY_Input#) and output (HLY_Output#).
•
Cross connected negotiation input (SWR_Input#) and output (SWR_Output#).²Active output from the
ShMM-500 (ACTIVE#) that is used by the ShMM-ACB-IV to enable interfaces that must be exclusively
driven by the active Shelf Manager, specifically PWM and fan tachometer buffers.
•
Two status LEDs using the SWS_LED_G# (Green) and SWS_LED_R# (Red) signals.
•
The PRES_1# signal is grounded on the redundant Shelf Manager. This indicates both Shelf Managers
the presence of the other.
Figure 2-16 shows the hardware redundancy interface of the ShMM-ACB-IV.
Figure 2-16
Chapter 2
Shelf Manager Redundancy Control
105
LED Indicators
14-Slot Shelf
Hot-Swap LED
The Shelf Manager provides a blue Hot-Swap LED. This LED indicates when it is safe to remove the Shelf
Manager from a powered Shelf.
Table 2-20
Hot-Swap LED
LED State
Condition
Off
The Shelf Manager is not ready to be removed/disconnected from the Shelf.
Blue
The Shelf Manager is ready to be removed/disconnected from the Shelf.
Long Blink
The Shelf Manager is activating itself.
Short Blink
Deactivation has been requested.
Troubleshooting the Shelf Manager
Use Table 2-21 and Table 2-22 to troubleshoot problems with the Shelf Manager.
Table 2-21
ETH1
Speed
Shelf Manager Status LEDs
ETH1
Activity
(Green)
ETH0
Speed
(Yellow)
ETH0
Activity
(Green)
Shelf
Manager
Status
(Red)
Shelf
Manager
Status
(Green)
Hot
Swap
(Blue)
Tip
-
-
-
-
Off
On Green
Off
Normal
(Active)
-
-
-
-
Off
Flashing
Green
Off
Normal
(Backup
ShMM)
Off
-
Off
-
-
Green or
Flashing
Green
-
Normal
(10 Mb)
Yellow
-
Yellow
-
-
Green or
Flashing
Green
-
Normal
(100 Mb)
-
-
-
Green or
Flashing
Green
-
Green
-
Normal
ETH0
Active
Yellow
Green
Yellow
Green
Red
Green
Blue
1
Yellow
Yellow
Yellow
-
Off
Green or
Flashing
Green
Off
2
Off
Off
Off
Off
Off
Off
Off
3
106
Chapter 2
LED Indicators
14-Slot Shelf
Table 2-21
ETH1
Speed
Shelf Manager Status LEDs (Continued)
ETH1
Activity
(Green)
ETH0
Speed
(Yellow)
ETH0
Activity
(Green)
Shelf
Manager
Status
(Red)
Shelf
Manager
Status
(Green)
Hot
Swap
(Blue)
Tip
-
-
-
-
Red
-
-
4
-
-
-
-
-
-
Flashing
Blue
5
-
-
-
-
-
-
Blue
6
Table 2-22
Tip
1
Shelf Manager Troubleshooting Tips
Symptom
LED test
Action
1. Does the shelf Manager have an LED test?
2. The LEDs are tested when the Shelf Manager is being
re-booted by turning on all LEDs, regardless of the true
status, for a period of up to 15 seconds.
3. If one or more LEDs fail to illuminate, replace the Shelf
Manager.
2
ETH1 Activity GREEN LED
is indicating a YELLOW
color
3
Something is seriously
wrong with the Shelf
Manager and the Shelf
Manager has probably
hung.
The ETH1 Activity LED is GREEN and cannot show a
yellow color. A yellow color may show when the adjacent
Speed LEDs are on and the ETH1 Activity LED is off. The
apparent yellow color is a light bleed through in the light
pipes from the adjacent yellow LEDs. No corrective action
is required.
1. Observe the other Shelf Manager to determine if it is in
the Normal Active mode.
2. Press the reset button on the Shelf Manager exhibiting
the problem using a pen or paperclip.
3. If after the reset button has been activated, the Shelf
Manager does not reboot and enter the Normal Active
or Normal Backup state, remove the Shelf Manager and
•
Examine the Shelf Manager's backplane connector
for bent or broken pins. If bent or broken pins are
discovered replace the Shelf Manager.
•
Examine the Shelf Manager connector on the
backplane. If bent or broken pins are discovered
replace the Chassis.
4. Replace the Shelf Manager.
Chapter 2
107
LED Indicators
14-Slot Shelf
Table 2-22
Tip
4
Shelf Manager Troubleshooting Tips (Continued)
Symptom
Something is seriously
wrong with the Shelf
Manager and the Shelf
Manager was able to
indicate the failure.
Action
1. Observe the other Shelf Manager to determine if it is in
the Normal Active mode.
2. Press the reset button on the Shelf Manager exhibiting
the problem using a pen or paperclip.
3. If after the reset button has been activated, the Shelf
Manager does not reboot and enter the Normal Active
or Normal Backup state, remove the Shelf Manager and
•
Examine the Shelf Manager's backplane connector
for bent or broken pins. If bent or broken pins are
discovered replace the Shelf Manager.
•
Examine the Shelf Manager connector on the
backplane. If bent or broken pins are discovered
replace the Chassis.
4. Replace the Shelf Manager.
5
Shelf Manager transitioning
from active to inactive.
1. The Shelf Manager is transitioning from an active state
to an inactive state. Wait until the LED becomes solid
blue.
If the blue hot swap LED on the Shelf Manager fails to
stop flashing within 15 seconds, check the status of the
other Shelf Manager. If that Shelf Manager is active, it
is safe to remove the Shelf manager with the flashing
blue LED from the chassis.
6
108
Shelf Manager ready for
removal.
The Shelf Manager is inactive and may be removed from
the chassis.
Chapter 2
LED Indicators
HP bc2100 ATCA Server Blade
HP bc2100 ATCA Server Blade
This section provides information on the HP bc2100 ATCA Server Blade front panel hard reset button and the
LED indicators.
Front Panel LEDs
The HP bc2100 ATCA Server Blade front panel LEDs include the following: (as shown in Figure 2-17):
•
One Out of Service (OOS) LED
•
One Health LED
•
One IDE/SAS/SATA Activity LED
•
Eight 10/100/1000 Ethernet LEDs (For each Ethernet Channel)
•
Two User Programmable LEDs
•
Two Base Ethernet Activity/Link LEDs
•
One Hot-Swap LED
Chapter 2
109
LED Indicators
HP bc2100 ATCA Server Blade
Figure 2-17
110
HP bc2100 ATCA Server Blade Front Panel
Chapter 2
LED Indicators
HP bc2100 ATCA Server Blade
Out of Service (OOS) LED
The HP bc2100 ATCA Server Blade supports one bi-color Out of Service (OOS) LED, mounted on the front
faceplate. The OOS LED is identified by the following graphical legend on the faceplate, as shown in
Figure 2-17:
The OOS LED can be driven to display a red or amber color. When this LED is lit, it indicates that the board
is not in service. Its back-end (payload) power could be OFF or ON. Often the OOS state is entered when a
critical fault occurs on the board. In this state, the back-end (payload) power is turned OFF. A board could be
in this state when its back-end power is OFF but healthy, or when a board is fully powered but not yet
deployed, or during the reset process.
NOTE
Do not extract a board unless the Hot-Swap LED is lit.
Table 2-23
OOS LED (D59)
LED State
Meaning
Off
In service
Solid Amber/Red
Fault or error condition
The default color and override capabilities of the LED follow the LED management requirements defined in
Section 3.2.5 of the PICMG 3.0 Specification. It is possible to override the default IPMC behavior of the LED
using ATCA FRU LED Control commands.
Health LED
The HP bc2100 ATCA Server Blade supports one bi-color health LED to indicate the HP bc2100 ATCA Server
Blade’s health status, such as, whether a fault or error condition has been detected on the HP bc2100 ATCA
Server Blade. This LED is mounted on the front faceplate, and is identified by the following graphical legend:
The Health LED is driven by the onboard IPMC. The health LED will only be driven to an error condition
(red) if there is a critical or non-recoverable (major or critical in ATCA parlance) condition active on the HP
bc2100 ATCA Server Blade. Alarms could include exceeding sensor thresholds for temperature and on-board
logic voltages. The health LED remains red until the sensors return to a normal operating value. Hard-drive
failures, boot failures, etc. are not considered critical/major IPMI states, so the IPMC does not explicitly set
the health LED in these cases.
Chapter 2
111
LED Indicators
HP bc2100 ATCA Server Blade
The LED’s error state color default to red, but the color can be overridden using PICMG
3.0-defined commands.
NOTE
Table 2-24
Health LED
LED Status
Meaning
Solid Green
Healthy
Solid Amber/Red
Fault or error condition
The default color and override capabilities of the LED follow the LED management requirements defined in
Section 3.2.5 of the PICMG 3.0 Specification. It is possible to override the default IPMC behavior of the LED
using ATCA FRU LED Control commands.
IDE Drive Activity LED
The IDE Drive Activity LED is located on the faceplate of the HP bc2100 ATCA Server Blade, as shown in
Figure 2-17.
Table 2-25
IDE Drive Activity LED
LED Status
Meaning
Off
Normal/No disk access
Green (Blinking)
Disk access (read/write activity)
Network Link and Speed LEDs (10, 100, 1000 Mbps Ethernet)
The front panel of the HP bc2100 ATCA Server Blade provides two LEDs for each of the four Ethernet
connections, which indicate the speed and link activity for that network connection (see Figure 2-17.
The Gigabit Ethernet (GbE) Network Link activity LEDs are identified by the following graphical legends
located on the Server Blade front panel:
Network Link activity LED states are defined as shown in Table 2-26.
Table 2-26
Network Link Activity LEDs
For Channel A (L2) and Channel B (L6)
Link LED Status
Meaning
Off
No link
Solid Green
Link Established
Blinking Green
Link with activity
112
Chapter 2
LED Indicators
HP bc2100 ATCA Server Blade
The Gigabit Ethernet (GbE) Network Speed activity LEDs are identified by the following graphical legends
located on the Server Blade front panel:
Network Speed activity LED states are defined as shown in Table 2-27.
Table 2-27
Network Speed LEDs
For Ethernet Controller Channel A (L3 and L4)
Speed LED Status
Meaning
L3
L4
Solid Yellow
Off
1 Gbps connection
Off
Solid Green
100 Mbps connection
Off
Off
10 Mbps connection
For Ethernet Controller Channel A (L7 and L8)
Speed LED Status
Meaning
L7
L8
Solid Yellow
Off
1 Gbps connection
Off
Solid Green
100 Mbps connection
Off
Off
10 Mbps connection
User-Programmable LEDs
The HP bc2100 ATCA Server Blade provides two bi-color LEDs for user-programmable functions.
The LEDs can be driven to display a red, green or amber color. When these LEDs are illuminated,
they indicate a status of a user-defined function. (Table 2-28).
Table 2-28
User-Programmable LED States
LED Status (Left)
LED Status (Right)
Meaning
Off
Off
No status
Red
Red/Green
Active Status of user defined
function
Chapter 2
113
LED Indicators
HP bc2100 ATCA Server Blade
The user-programmable LEDs are connected to the GPIO pins on the ICH device, as shown in Table 2-29.
Table 2-29
GPIO Pin Connections
LED
Pin
User_Prog_LED1_Red#
GPIO20
User_Prog_LED1_GRN#
GPIO21
User_Prog_LED2_Red#
GPIO28
User_Prog_LED2_GRN#
GPIO23
Ethernet Controller Port State (Base Ethernet Activity/Link) LEDs
The front panel of the HP bc2100 ATCA Server Blade provides a bi-color LED for each Ethernet channel that
indicates the Ethernet port state. These LEDs can display a red, green or amber color (Table 2-30). The
function of the port state LEDs is user definable. The Ethernet Controller SDP[6:7] GPIO bits for each
channel are the outputs that control the LEDs. SDP[6] is connected to the Green LED, and SPD[7] is
connected to the Red LED.
Table 2-30
Ethernet Controller Port State LEDs
LED Status (L1 and L5)
Meaning
Off
No status
Red, or Green, or Amber
Active status of user-defined function
Refer to the documentation for the Intel® 82546 Dual Gigabit Ethernet Controller for information on how to
drive these LED signals. Note that existing network drivers may drive these GPIO pins.
Hot-Swap LED (DS10)
The HP bc2100 ATCA Server Blade can be hot-swapped in and out of a chassis. The onboard IPMC manages
the HP bc2100 ATCA Server Blade power-up and power- down transitions.
The HP bc2100 ATCA Server Blade supports one blue Hot-Swap LED, mounted on the front panel. This LED
indicates when it is safe to remove the HP bc2100 ATCA Server Blade from the chassis. The on-board IPMC
drives this LED to indicate the hot-swap state. The Hot-Swap LED is identified by the following graphical
legend on the Server Blade front panel:
When the lower ejector handle is disengaged from the faceplate, the hot-swap switch embedded in the PCB
will assert a "HOT_SWAP_PB#" signal to the IPMC, and the IPMC will move from the M4 state to the M5
state. At the M5 state, the IPMC will ask the CMM (or Shelf Manager) for permission to move to the M6
state. The Hot-Swap LED will indicate this state by blinking on for about 100 milliseconds, followed by 900
milliseconds in the off state. This will occur as long as the HP bc2100 ATCA Server Blade remains in the M5
state. Once permission is received from the CMM or higher-level software, the HP bc2100 ATCA Server Blade
will move to the M6 state.
114
Chapter 2
LED Indicators
HP bc2100 ATCA Server Blade
The CMM or higher level software can reject the request to move to the M6 state. If this occurs, the Hot-Swap
LED returns to a solid off condition, indicating that the HP bc2100 ATCA Server Blade has returned to M4
state.
If the HP bc2100 ATCA Server Blade reaches the M6 state, either through an extraction request through the
lower ejector handle or through a direct command from higher-level software (and an ACPI-enabled OS is
loaded on the HP bc2100 ATCA Server Blade) the IPMC communicates to the OS that the module must
discontinue operation in preparation for removal. The Hot-Swap LED continues to flash during this
preparation time, just like it does at the M5 state. When main board power is successfully removed from the
HP bc2100 ATCA Server Blade, the Hot-Swap LED remains lit, indicating it is safe to remove the HP bc2100
ATCA Server Blade from the chassis (see Table 2-31).
CAUTION
Removing the HP bc2100 ATCA Server Blade prematurely can lead to device corruption or
failure.
Table 2-31
Hot-Swap LED (DS11)
LED Status
Meaning
Off
Normal status.
Blinking Blue
Preparing for removal/insertion: Long blink indicates activation is in progress,
short blink when deactivation is in progress.
Solid Blue
Ready for hot-swap.
It is possible to override the default IPMC behavior of the LED using ATCA FRU LED Control commands.
Reset Button
The reset button is located in a small recessed hole below the USB ports. The reset button is used as an input
to the IPMC to request a cold reset. There are IPMI commands to reset the board and change power states
through the software. The reset button is a last resort, since you must be physically present at the chassis to
reset the board. The reset button is located on the HP bc2100 ATCA Server Blade front panel
(seeFigure 2-17).
Troubleshooting the HP bc2100 ATCA Server Blade
Table 2-32
Hot Swap
(Blue)
HP bc2100 ATCA Server Blade LED States
Healthy
(Red /
Green)
Out of
Service
(Red)
Tip
Off
Green
Off
Normal
Off
Off
Off
1
Blue or
Blinking
Blue
Red
-
2
Chapter 2
115
LED Indicators
HP bc2100 ATCA Server Blade
Table 2-32
HP bc2100 ATCA Server Blade LED States (Continued)
Healthy
(Red /
Green)
Hot Swap
(Blue)
Out of
Service
(Red)
Tip
Off
Red
-
3
-
-
Red
4
Table 2-33
Tip
1
HP bc2100 ATCA Server Blade LED Tips
Symptom
No Power
Action
1. Examine other blades in the front card cage. If all
Blades indicate no power, verify that the power is
applied to the chassis and the Power Entry Modules are
operational
2. Verify that the Server Blade s is fully inserted into the
front card cage. If not, fully seat the blade.
3. Verify that the lower ejector level is fully closed. If the
lever is open or partially open, fully close the lower
ejector lever.
4. Remove the Server Blade its backplane connectors,
especially the blue power connector, for bent or broken
pins. If any pins are bent or broken, replace the Server
Blade.
5. Examine the backplane's blade connectors for bent or
broken pins. If any pins are bent or broken, replace the
chassis.
2
Hot Swap Ejector open
1. Verify that the lower ejector handle is fully closed. The
hot swap LED may remain illuminated or blinking if it
is waiting to activate from the Shelf Manager.
2. If either ejector handle cannot be closed, replace the
Server Blade.
3. If the lower hot swap handle is closed, retrieve the
Mstate information from the Shelf Manager.
4. A blinking Hot Swap LED may indicate a failure in
communications between the Server Blade and the
Shelf Manager. Use information in the System Event
Log (SEL) to identify chassis communication problems.
If other FRUs are also encountering difficulty, replace
the Chassis.
116
Chapter 2
LED Indicators
HP bc2100 ATCA Server Blade
Table 2-33
Tip
3
HP bc2100 ATCA Server Blade LED Tips (Continued)
Symptom
Voltage or temperature
sensors are outside of
threshold
Action
1. Examine the other Blades in the Shelf. If all of the
Healthy LEDs are illuminated red, there may be a
power failure on one of the two redundant power
busses. Make sure both power busses to the ATCA are
on and Check both Power Entry Modules for proper
operation.
2. If voltage and temperature sensors are within
threshold, this indicates an internal hardware fault and
inoperable IPMC.
3. Verify that other components are not experiencing the
same failure. If they are a chassis level problem may be
the cause, replace the chassis.
4. If the Server Blade is the only FRU experiencing
exceeding thresholds, try pressing the Reset Button
5. If the Reset Button does not correct the problem,
replace Server Blade.
4
The switch is held in
RESET.
1. The Shelf Manager is holding the Server Blade as
RESET. Follow the troubleshooting tips in "Diagnosing
a Failed Shelf Manger Activation" in the Server Blade
manual to extract the Shelf Manager information for
further analysis.
2. If the Server Blade is still being held at RESET after
troubleshooting the Shelf Manager, replace the Server
Blade.
5
Chapter 2
117
LED Indicators
Shelf Manager Redundant Operation
Shelf Manager Redundant Operation
The active Shelf Manager exposes the ShMC device (address 20h) on IPMB, manages IPMB and the IPM
controllers, and interacts with the System Manager over RMCP and other shelf-external interfaces. It
maintains an open TCP connection with the backup Shelf Manager. It communicates all changes in the state
of the managed objects to the backup Shelf Manager.
The backup Shelf Manager does not expose the ShMC on IPMB, does not actively manage IPMB and IPM
controllers, and does not interact with the System Manager via the shelf-external interfaces, with one
exception (noted later in this section). Instead, it maintains the state of the managed objects in its own
memory (volatile and nonvolatile) and updates the state as directed by the active Shelf Manager.
The backup Shelf Manager may become active as the result of a switchover. The following two types of
switchover are defined:
•
Cooperative switchover: The active and backup Shelf Managers negotiate the transfer of responsibilities
from the active to the backup Shelf Manager. This mode is supported via the CLI switchover command
issued on the active or backup Shelf Manager.
•
Forced switchover: The backup Shelf Manager determines that the active Shelf Manager is no longer
alive or healthy, and forcefully takes on the responsibilities of the active Shelf Manager.
The backup Shelf Manager recognizes the departure of the active Shelf Manager when the Remote Healthy or
Remote Presence low-level signal becomes inactive. Remote Presence signal monitors the presence of the peer
Shelf Manager; this signal going inactive means that the board hosting the peer Shelf Manager has been
removed from the shelf. The Remote Healthy signal is set by the peer Shelf Manager during initialization;
this signal going inactive means that the remote Shelf Manager has become unhealthy (typically, has been
powered off or reset).
Another situation that needs some action from the backup Shelf Manager is when the TCP connection
between the Shelf Managers closes. This happens either when the communication link between the two Shelf
Managers gets broken or when the shelfman process on the active Shelf Manager terminates (in a voluntary
or involuntary way, or due to a software exception). Also, because the keepalive option is enabled on the TCP
connection, it will close shortly after the active ShMM is switched off or reset. In the case of Shelf Manager
termination, it is possible that the TCP connection is closed before the Remote Healthy signal becomes
inactive. So, in order to determine why the TCP connection closed, the backup Shelf Manager samples the
state of the Remote Healthy signal immediately and, if it is still active, again after some delay. If the Remote
Healthy signal ultimately becomes inactive, the backup Shelf Manager concludes that the active Shelf
Manager is dead and initiates a switchover.
Otherwise, if the Remote Healthy signal stays active, the backup Shelf Manager concludes that the
communication link between the Shelf Managers is broken. In that case, no switchover is initiated. Instead,
the backup Shelf Manager repeatedly re initializes itself and tries to establish a connection with the active
Shelf Manager until the communication link is restored. Reinstallation is achieved by rebooting the ShMM
and automatically restarting the Shelf Manager after the reboot. Special logic in the Shelf Manager
guarantees that it does not try to become active at startup if the peer Shelf Manager is already active.
The Shelf Manager uses a watchdog timer to protect against becoming unresponsive due to infinite loops or
other software bugs. In the event the watchdog timer on the active Shelf Manager triggers, that ShMM will
be reset, causing the Remote Healthy signal on the backup ShMM to become inactive, thus triggering a
switchover.
118
Chapter 2
3 Diagnostics
Chapter 3
119
Diagnostics
Introduction
Introduction
The HP bh5700 ATCA 14-Slot Blade Server component diagnostics are to be run in offline mode. The
operating system must not be loaded and the component to be tested must not be in operation. The
diagnostics described in this document are intended to be used by trained Hewlett-Packard field engineers or
Network Equipment Providers (NEPs).
CAUTION
Entering these diagnostic commands on a running system can cause the system to
halt operations with data loss.
The diagnostics provide the ability to isolate hardware failures to the Field Replaceable Unit (FRU) for each
component.
The diagnostics can be run remotely and (where applicable) meet software guidelines for Linux open source
code mandated by the Advanced Telecom Computing Architecture (ATCA) specification.
The component diagnostics are not required to have a unified front-end interface for all components, as each
component will have its own diagnostic environment.
120
Chapter 3
Diagnostics
General ATCA Diagnostics for the Shelf Management Module (ShMM)
General ATCA Diagnostics for the Shelf Management Module (ShMM)
The ATCA specification defines provisions for diagnosing ATCA components through the Shelf Management
Module, or “Shelf Manager” (ShMM). The ShMM functionality includes a command line interface (clia) that
can provide detailed diagnostic and management functions for all other configured ATCA components within
the HP bh5700 ATCA 14-Slot Blade Server. This section provides information on the ShMM diagnostic
capabilities only, and does not cover management.
Using the Command Line Interface
Using the clia interface, commands can be either manually entered one at a time or in the clia interactive
shell. To enter diagnostic commands, telnet to the ShMM (via the Ethernet Switch Blade if necessary), then
enter the clia command line environment as follows:
# clia <enter>
CLI>
Or, enter a clia command directly from the Linux prompt:
# clia <command> <enter>
The clia interface provides access to on-board help that either lists all commands (when used without
arguments) or provides detailed help for a specific command when the command name is provided (Example:
help alarm).
Diagnostic Commands
Command-line interface diagnostic and support commands are listed here. Table 3-1 lists available ShMM
diagnostic commands.
Table 3-1
ShMM Diagnostic Commands
Command
Function
board
Used to print the status of a device in the chassis
boardreset
Used to reset a board (based on physical slot address).
deactivate
Deactivates a FRU.
debuglevel
Sets the level of debug messages.
fans
Reads the level of fan speed and status.
fru
Reads information about a specific FRU.
fruinfo
Dumps FRU data in a user friendly format.
frucontrol
Issues commands to a FRU (such as reset).
getthreshold
Gets the current thresholds for a sensor.
ipmc
Reads information about an IPM controller.
sel
Read or Clear the SEL (System Event Log).
sensor
Gets information on a sensor.
sensordata
Shows the actual value for a sensor.
Chapter 3
121
Diagnostics
General ATCA Diagnostics for the Shelf Management Module (ShMM)
Table 3-1
ShMM Diagnostic Commands (Continued)
Command
Function
shelf
Display information about various shelf subsystems.
showunhealthy
Show all unhealthy FRUs.
board [physical slot #]
board is used to print status and information about a board in the chassis. The command displays the Device
ID String, the How Swap State, and the reason the previous Hot Swap State change was made. This
information is useful when FRUs have transitioned from active to inactive due to a fault.
Running the command without any arguments will display the status for all boards in the chassis.
CLI>
board 7
IPM Sentry Shelf Manager Command Line Interpreter
Physical Slot # 7
82: Entity: (0xa0, 0x60) Maximum FRU device ID: 0x00
PICMG Version 2.1
Hot Swap State: M4 (Active), Previous: M3 (Activation In Process), Last State
Change Cause: Normal State Change (0x0)
82: FRU # 0
Entity: (0xa0, 0x60)
Hot Swap State: M4 (Active), Previous: M3 (Activation In Process), Last State
Change Cause: Normal State Change (0x0)
Device ID String: "Switch"
CLI>
boardreset <physical slot #>
boardreset will reset a board in a given physical slot #.
CLI> boardreset 9
Board 9 reset, status returned 0
deactivate <addr> <fru_id>
Deactivate the specified FRU. Instead of the IPMB bus address and FRU ID, a board, ShMM, power supply, or
fan tray ID may also be provided (see Help text for details).
CLI> deactivate 88 0
Command issued via IPMB, status = 0 (0x0)
Command executed successfully
122
Chapter 3
Diagnostics
General ATCA Diagnostics for the Shelf Management Module (ShMM)
debuglevel [mask]
The debuglevel command raises or lowers the debug level for the ShMM. If the status of the ShMM is
suspect, raising the debug level may assist in debugging the problem. The default debug level is 0x0007
(Errors, Warnings, and Informational Messages). Valid levels are:
0x0001 - Error messages
0x0002 - Warning messages
0x0004 - Informational messages
0x0008 - Verbose informational messages
0x0010 - Trace messages
0x0020 - Verbose trace messages
0x0040 - Messages displayed for important commands sent to the IPM controllers during their initialization
0x0080 - Verbose messages about acquiring and releasing internal locks
CLI> debuglevel 0x1f
Debug Mask is set to 0x001f
fans [addr] [fru_id]
The fans command displays information about the fan speed and status. A slot number, fan board number, or
power supply number may be used instead of the address. Running the command with no arguments will display the status for all fans. Refer to the HP bh5700 ATCA 14-Slot Blade Server Shelf User Guide for details.
CLI> fans
20: FRU # 3
Current Level: 6 "Automatic"
Minimum Speed Level: 0, Maximum Speed Level: 15
20: FRU # 4
Current Level: 255 "Automatic"
Minimum Speed Level: 0, Maximum Speed Level: 15
20: FRU # 5
Current Level: 255
Minimum Speed Level: 0, Maximum Speed Level: 15
fru [addr]
The fru command displays information about a specified FRU. The fru command provides the same
functionality as the board command. The command will display information such as the Device ID String,
the Hot Swap State, and why the previous Hot Swap State change was made. As an example, this could
explain that an active device was transitioned to inactive due to a fault. Running the command without any
arguments will display the status for all FRUs.
CLI> fru
10: FRU # 0
Entity: (0xf0, 0x60)
Chapter 3
123
Diagnostics
General ATCA Diagnostics for the Shelf Management Module (ShMM)
Hot Swap State: M4 (Active), Previous: M3 (Activation In Process), Last State
Change Cause: Normal State Change (0x0)
Device ID String: "IPM Sentry ShM"
12: FRU # 0
Entity: (0xf0, 0x60)
Hot Swap State: M7 (Communication Lost), Previous: M4 (Active), Last State Change
Cause: Unknown (0xf)
Device ID String: "IPM Sentry ShM"
20: FRU # 0
Entity: (0xf0, 0x1)
Hot Swap State: M4 (Active), Previous: M3 (Activation In Process), Last State
Change
Cause: Normal State Change (0x0)
Device ID String: "IPM Sentry BMC"
fruinfo <addr> <fru_id>
The fruinfo command displays FRU data in an easily readable format. Refer to the example below to see
what fields are displayed.
CLI> fruinfo 84 0
84: FRU # 0, FRU Info
Common Header:
Format Version = 1
Board Info Area:
Version
= 1
Language Code
= 0
Mfg Date/Time
= Feb 25 23:32:00 2006 (5340932 minutes since 1996)
Board Manufacturer
= ZNYX Networks
Board Product Name
= ZX6000D-HP
Board Serial Number
= 01BZ0X111HWP
Board Part Number
= 700-0170-003
FRU Programmer File ID
= 03
Product Info Area:
Version
= 1
Language Code
124
= 0
Chapter 3
Diagnostics
General ATCA Diagnostics for the Shelf Management Module (ShMM)
Manufacturer Name
= ZNYX Networks
Product Name
= ZX7120-HP
Product Part / Model#
= 700-0174-002
Product Version
=
Product Serial Number
= 01CS00111HWP
Asset Tag
=
FRU Programmer File ID
= 03
Multi Record Area:
PICMG Board Point-to-Point Connectivity Record (ID=0x14)
Version = 0
PICMG Board Point-to-Point Connectivity Record (ID=0x14)
Version = 0
CLI>
frucontrol <addr> <fru_id> <command>
The frucontrol command sends commands directly to a FRU. The commands available are:
•
cold_reset
•
warm_reset
•
graceful_reboot
•
diagnostic_interrupt
CLI> frucontrol 88 0 graceful_reboot
FRU Control: Controller 0x88, FRU ID # 0, command 0x02, status 204(0xcc)
getthreshold <addr> [lun:][sensor #]
The getthreshold command reads or sets sensor thresholds. For temperature sensors,
getthreshold returns information about the current temperature and can set the
critical threshold.
NOTE
Use the sensor command first to locate the sensors before using these commands.
CLI> getthreshold 82 0:11
82: LUN: 0, Sensor # 11 ("Top Temp")
Chapter 3
125
Diagnostics
General ATCA Diagnostics for the Shelf Management Module (ShMM)
Type: Threshold (0x01), "Temperature" (0x01)
Lower Non-Critical Threshold, Raw Data: 0x0a, Processed Data: 10.000000
degrees C
Lower Critical Threshold, Raw Data: 0x05, Processed Data: 5.000000 degrees C
Lower Non-Recoverable Threshold, Raw Data: 0x00, Processed Data: 0.000000
degrees C
Upper Non-Critical Threshold, Raw Data: 0x28, Processed Data: 40.000000
degrees C
Upper Critical Threshold, Raw Data: 0x3c, Processed Data: 60.000000 degrees C
Upper Non-Recoverable Threshold, Raw Data: 0x50, Processed Data: 80.000000
degrees C
ipmc [addr]
The ipmc command displays information about the ipmc controllers. Information about all the IPMC
controllers in the server is displayed when the command is run with no arguments. This command is similar
to the board and fru commands.
CLI> ipmc 10
10: Entity: (0xf0, 0x60) Maximum FRU device ID: 0x08
PICMG Version 2.1
Hot Swap State: M4 (Active), Previous: M3 (Activation In Process), Last State
Change Cause: Normal State Change (0x0)
sel [-v] [info] or [clear]
The sel command displays and manages the System Event Log (SEL). The SEL contains all
errors and warnings reported by the system. The SEL is the main log that support
engineers use to isolate problems in the system. Running this command with no
arguments will dump the entire SEL, which may be long. The info argument displays the
size and status of the SEL. The clear command will clear the SEL. The –v
(verbose)flag displays more verbose output.
CLI> sel
0x0083: Event: at Jan 9 14:04:16 1970; from:(0x88,0,0); sensor:(0x22,14);
event:0x6f(asserted): 0x0C 0xFF 0xFF
0x0084: Event: at Jan 9 15:29:32 1970; from:(0x88,0,0); sensor:(0x1b,10);
event:0x3(asserted): 0x01 0xFF 0xFF
0x0085: Event: at Jan 9 15:29:38 1970; from:(0x88,0,0); sensor:(0x1b,10);
event:0x3(asserted): 0x00 0xFF 0xFF
0x0086: Event: at Jan 9 15:29:38 1970; from:(0x88,0,0); sensor:(0x22,14);
event:0x6f(asserted): 0x0C 0xFF 0xFF
0x0087: Event: at Jan 10 02:12:28 1970; from:(0x88,0,0); sensor:(0x1b,10);
event:0x3(asserted): 0x01 0xFF 0xFF
0x0088: Event: at Jan 10 02:12:33 1970; from:(0x88,0,0); sensor:(0x1b,10);
event:0x3(asserted): 0x00 0xFF 0xFF
126
Chapter 3
Diagnostics
General ATCA Diagnostics for the Shelf Management Module (ShMM)
0x0089: Event: at Jan 10 02:12:33 1970; from:(0x88,0,0); sensor:(0x22,14);
event:0x6f(asserted): 0x0C 0xFF 0xFF
0x008A: Event: at Jan 10 04:30:24 1970; from:(0x88,0,0); sensor:(0x1b,10);
event:0x3(asserted): 0x01 0xFF 0xFF
0x008B: Event: at Jan 10 04:30:29 1970; from:(0x88,0,0); sensor:(0x1b,10);
event:0x3(asserted): 0x00 0xFF 0xFF
0x008C: Event: at Jan 10 04:30:29 1970; from:(0x88,0,0); sensor:(0x22,14);
event:0x6f(asserted): 0x0C 0xFF 0xFF
0x008D: Event: at Jan 10 20:58:41 1970; from:(0x88,0,0); sensor:(0x1b,10);
event:0x3(asserted): 0x01 0xFF 0xFF
sensor [<addr> [[lun:]<sensor id>]
The sensor command displays information about a sensor. Sensors include power and temperature sensors.
Running the command with no arguments shows information for all sensors in the system. The sensor
command is used in conjunction with the sel command to analyze SEL failures. For example:
CLI> sel –v
0x000C: Event: at: Aug 16 05:26:28 2005; from IPM Controller: 0x8c, LUN: 0,
Channel: 0
"System Firmware Progress (formerly POST Error)" (0x0f) sensor # 6
"Sensor-specific" (0x6f) event Asserted
"System Firmware Progress"
Sensor specific code 1: 0x13
0x000D: Event: at: Aug 16 05:26:28 2005; from IPM Controller: 0x8c, LUN: 0,
Channel: 0
"System Firmware Progress (formerly POST Error)" (0x0f) sensor # 6
"Sensor-specific" (0x6f) event Asserted
"System Firmware Progress"
Sensor specific code 1: 0x13
In this example, the failures show that IPM controlled 0x8c, sensor 6, is reporting problems. This is a System
Firmware progress sensor, as stated in the text. Using the sensor command gives additional information on
the failure.
CLI> sensor –v 8c 6
8c: LUN: 0, Sensor # 6 ("Sys FW Progress")
Type: Discrete (0x6f), "System Firmware Progress (formerly POST Error)"
(0x0f)
Belongs to entity: (0xa0, 97) [FRU # 0]
Chapter 3
127
Diagnostics
General ATCA Diagnostics for the Shelf Management Module (ShMM)
Assertion Mask: 0x0001
System Firmware Error
Deassertion Mask: 0x0001
Settable / Readable Mask: 0x0001
System Firmware Error
sensordata [<addr> [[lun: ]<sensor id>]
The sensordata command displays the current value for a sensor.
CLI>
sensordata 82 0:12
82: LUN: 0, Sensor # 12 ("Bottom Temp")
Type: Threshold (0x01), "Temperature" (0x01)
Status: 0xc0
All event messages enabled from this sensor
Sensor scanning enabled
Initial update completed
Raw data: 28 (0x1c)
Processed data: 28.000000 degrees C
Status: 0x00
shelf <sub-command>
The shelf command displays information on the following list of valid sub-commands:
128
•
address_table
•
cooling_state
•
fans_state
•
power_distribution
•
power_management
•
pci_connectivity
•
ha_connectivity
•
h110_connectivity
•
point-to-point_connectivity
•
MaxCurrent [feed] <Amps>
•
MinVoltage [feed] <Volts>
•
Activation <addr> <fru_id> 1/0
•
Deactivation <addr> <fru_id> 1/0
Chapter 3
Diagnostics
General ATCA Diagnostics for the Shelf Management Module (ShMM)
•
BDSelGrounded <slot number> 1/0 (1 means Enabled, 0 means Disabled)
•
PwrCapability <addr> <fru_id> <Watts>
•
PwrDelay <addr> <fru_id> <10ths_of_second>
•
Allowance <seconds>
•
PwrReorder <addr1> <fru_id1> before/after <addr2> <fru_id2>
•
info_refresh
•
info_force_update
showunhealthy
The showunhealthy command displays information on failing or substandard FRUs in the system. It lists all
FRUs that are reporting an unhealthy condition such as FRUs that have temperature or power problems, or
FRUs that have lost connectivity to the ShMM.
CLI> showunhealthy
12: FRU # 0 (Controller)
Hot Swap State: M7 (Communication Lost), Previous: M4 (Active), Last State Change
Cause: Unknown (0xf)
8c: FRU # 0 (Controller)
Hot Swap State: M7 (Communication Lost), Previous: M4 (Active), Last State Change
Cause: Unknown (0xf)
Chapter 3
129
Diagnostics
Shelf Manager (ShMM) Functional Specifications
Shelf Manager (ShMM) Functional Specifications
.
ShMM Diagnostics Functionality and Features
The ShMM has three levels of diagnostics. The first level runs during Power-On-Self-Test (POST), and runs a
self-check on the board. The results of this test are available using the dmesg command from the ShMM’s
Linux operating environment.
The second level is a CPU error-monitoring daemon that runs in the background and reports all CPU errors
to the SEL.
The third level consists of run-time tests that are executed from the Linux operating environment on the
ShMM. To run these tests, you must connect to the ShMM console port or connect via telnet in order to access
the ShMM shell prompt.
IMPORTANT Ensure that these test are invoked only from the backup ShMM, and NOT from the active
ShMM. You can use the clia shmstatus and clia switchover commands to determine or
change the ShMM's current status.
ShMM Diagnostics Performance
There are two levels of POST test on the ShMM (see Valid Configurations, below). The ARP test takes up to
20 seconds to complete. All other tests complete within a few seconds.
ShMM Diagnostics Security
The results of the POST test are available by logging into the ShMM. They are displayed using the dmesg
command. By logging into the ShMM you can view the results of the POST tests. The results can also be
viewed using the U-boot firmware menu interface log show command. A serial connection to the ShMM is
required to use this. Tests may be configured from the U-boot interface using the environment variables (see
Valid Configurations, below).
The online tests are available to all users who have execute permissions to the test files.
ShMM Diagnostics Valid Configurations
Valid diagnostics configurations include:
•
Power-on Self Test (POST)
•
Online Tests
•
CPU Error Daemon
Power-on Self Test (POST)
The POST tests are included as part of the onboard firmware. They are divided into three groups:
•
Tests run on power-on booting only
•
Tests run on normal booting (on each reboot)
130
Chapter 3
Diagnostics
Shelf Manager (ShMM) Functional Specifications
•
Manually executed tests
The categories that are run and when the tests run are controlled by the U-boot environment variables
post_normal and post_poweron. These variables are accessible from the pre-boot firmware menu, over a
serial console connection. The variables are described below:
post_normal (U-boot environment variable)
post_normal determines the list of POST tests that are run on each boot-up. If it is not set, compile-time
default settings are used. The test names are separated by the space character.
post_poweron (U-boot environment variable)
post_poweron determines the list of POST tests that are run after power-on reset. If it is not set, compile-time
default settings are used. The test names l are separated by the space character.
These variables are controlled from the U-boot environment with setenv and printenv. The syntax from the
firmware menu is:.
shmm printenv [<variable>]
shmm setenv <variable> <value>
To make environment variable changes permanent, run the saveenv command. The syntax is:
saveenv
Manual tests can be run from the firmware menu. To run these tests, a serial connection is required.
The steps to run manual tests are:
1. After connecting to the serial port, reboot the ShMM.
2. Interrupt the ShMM Boot when it prints “Hit any key to stop autoboot:”.
3. At the “shmm” menu prompt, use the diag command to run diagnostics
Online Tests
NOTE
The online memory tests (mem01 and mem02) are provided by Hewlett-Packard as standalone
executables which can be installed on the ShMM-500’s embedded linux OS. The other online
tests are part of the embedded OS firmware.
Online tests are run from a booted ShMM. Most tests require no setup or configuration. For the external
UART test, a loopback cable is required and the ARP test requires correct Ethernet wiring and configuration.
Details on these requirements are in the following sections.
CPU Error Daemon
The CPU error daemon runs in the background on a booted ShMM’s Linux operating environment. This
capability is included with the base software/firmware for the ShMM.
Chapter 3
131
Diagnostics
Shelf Manager (ShMM) Diagnostics User Interface
Shelf Manager (ShMM) Diagnostics User Interface
ShMM Diagnostics Overall Interface Description
This section describes the ShMM diagnostics interface.
Power-On Self Tests
Power-On Self-Test (POST) diagnostics run at power-on and during boot. Six areas are tested by POST:
•
memory – tests SDRAM
•
i2c – checks the I2C bus
•
uart – tests the UARTs
•
ethernet – tests the Ethernet port
•
crc – performs a CRC check on the ROM
•
ipmb – tests the ipmb bus (This test is currently disabled)
POST reports PASS or FAIL for each test. POST tests can be run manually from the U-boot firmware menu.
Online Tests
There are two types of online tests: Hardware and memory.
The hardware tests exercise the ports and test the checksums of the firmware. The memory tests verify the
memory interfaces in the kernel and that the memory is free of faults
NOTE
The ShMM does not have the ability to report single-bit memory errors.
Hardware Tests
The available hardware tests are:
•
shmm_uart_test – tests the UARTs
•
shmm_eth_test – tests the Ethernet interfaces
•
shmm_crc_test – tests the firmware checksums
Memory Tests
•
mem01 – malloc’s all available memory to ensure that the memory is clean
•
mem02 – tests all the kernel memory interfaces (malloc, calloc, and so on), and Reads/Writes this memory.
These test are usually run from the shell and may be included in scripts. The following example will run the
mem02 test until it is interrupted by the user.
# while true
> do
132
Chapter 3
Diagnostics
Shelf Manager (ShMM) Diagnostics User Interface
> mem02
> sleep 5
> done
Additional information on the memory tests is found in the section “Memory tests” on page 136.
CPU Error Daemon
The CPU error monitoring daemon runs in the background and reports CPU errors to /var/log/messages.
It is part of the ShMM standard operating environment.
ShMM Diagnostics UI Syntax and Semantics
Power-On Self Test (POST)
POST output is available from the U-boot firmware menu using the log show command (information on
connecting a serial console to access the U-boot menu is below). The output is also available from the ShMM
Linux shell after the boot operations are complete using the dmesg command.
#dmesg
POST memory PASSED
POST i2c PASSED
POST uart PASSED
POST ethernet PASSED
POST crc PASSED
dmesg shows additional status and message information about the startup of the system.
The tests may be run manually from the ShMM firmware menu. The diag command is used to run the tests.
A serial console connection is required to access the firmware menu.
1. Connect to the serial port and reboot the ShMM.
2. Interrupt the ShMM boot when it prints “Hit any key to stop autoboot”.
3. At the shmm menu prompt use the diag command to run the test
4. At the shmm menu prompt use the log show command to display the test results
> shmm diag run i2c
> shmm log show
POST i2c PASSED
NOTE
Chapter 3
The POST memory test cannot be run manually, as it is destructive and would overwrite the
SDRAM that the ShMM firmware is using.
133
Diagnostics
Shelf Manager (ShMM) Diagnostics User Interface
Online Tests
The online tests discussed in this section are available in the /bin directory. If these utilities do not exist in
the /bin directory on the ShMM, please contact Hewlett-Packard support for assistance.
shmm_uart_test [-e]
NOTE
The external test (-e) requires a loopback cable. Before running the test verify that the loopback
cable is properly installed. The test will fail with a “Timeout occurred” message if the loopback
cable is not installed.
The shmm_uart_test checks the internal interfaces of the UARTs. The –e flag checks the external
interfaces as well. The valid UARTs are 0 and 3. Both are tested by this test.
This test returns 0 on success and -1 on failure. The possible failure messages:
•
Timeout occurred - the interface timed out
•
Invalid symbol occurred - data was corrupted in transmission
•
Unknown error
Below is an example of running the tests without the loopback cables installed.
# shmm_uart_test
Performing Internal UART Tests...
Testing UART 0: PASSED.
Testing UART 3: PASSED.
# shmm_uart_test -e
Performing Internal UART Tests...
Testing UART 0: PASSED.
Testing UART 3: PASSED.
Performing External UART Tests...
Note: A loopback cable is required for these tests
Testing UART 0: FAILURE: Timeout occurred
Testing UART 3: FAILURE: Timeout occurred
shmm_eth_test [-a <ip_addr>]
NOTE
134
The external test (-e) requires a loopback cable. Before running the test verify that the loopback
cable is properly installed. The test will fail with a “Timeout occurred” message if the loopback
cable is not installed.
Chapter 3
Diagnostics
Shelf Manager (ShMM) Diagnostics User Interface
The shmm_eth_test checks the ethernet interfaces on the ShMM. Three tests are run to verify proper
operation of the interfaces: internal checks, PHY and ARP tests. The internal and PHY tests are run
automatically and the ARP test is run when the -a flag is used. When the –a argument is added with a valid
IP address, the ARP test will send ARP packets to the target IP address and wait for a response. Two
Ethernet ports are exercised by this test.
This test returns 0 on success and -1 on failure. The possible failure messages are:
•
Timeout occurred - the interface timed out
•
Packets do not match - data was corrupted in transmission
•
Unknown error
Below is an example of running the tests without the loopback cables installed.
# shmm_eth_test
Performing Internal Ethernet Tests...
Testing MAC 0: PASSED.
Testing MAC 1: PASSED.
Performing PHY Ethernet Tests...
Testing MAC 0: PASSED
Testing MAC 1: PASSED
# shmm_eth_test -a 10.0.0.42
Performing Internal Ethernet Tests...
Testing MAC 0: PASSED.
Testing MAC 1: PASSED.
Performing PHY Ethernet Tests...
Testing MAC 0: PASSED
Testing MAC 1: PASSED
Performing ARP Ethernet Tests...
Each test will wait 10 seconds for the ARP packet to return
Testing MAC 0: FAILURE: Timeout occurred
Testing MAC 1: FAILURE: Timeout occurred
shmm_crc_test
This test will validate the checksums (CRCs) of the firmware images on the ShMM. It will iterate through all
firmware images, and will return 0 on success and -1 on an error. There are four possible error messages:
•
Checksum does not match
•
No signature detected
•
Invalid image
•
Unknown type of image
Chapter 3
135
Diagnostics
Shelf Manager (ShMM) Diagnostics User Interface
For example:
# shmm_crc_test
Performing CRC Checksum Tests...
Testing MTD IMAGE 0: FAILURE:
Unknown type of image.
Testing MTD IMAGE 1: FAILURE:
Unknown type of image.
Testing MTD IMAGE 2: PASSED.
Testing MTD IMAGE 3: PASSED.
Memory tests
Online memory tests are not installed on the system delivered from the factory. If you need to
run the memory tests, they must be installed on the ShMM’s Linux operating environment file
system following the instructions provided by Hewlett-Packard. To ensure the tests remain
accessible after rebooting the shelf manager, it is recommended that the files be installed in
/var/bin. After installing and setting execute permissions on the files, the following mem01
and mem02 tests are available.
NOTE
mem01
The mem01 test allocates a large chunk of memory and fills it, forcing a real physical allocation. This test does
not detect single bit memory errors as the ShMM does not support reporting of these errors. Errors detected
by this test will likely cause a panic or reboot. mem01 does not test memory already in use by the processes
and the kernel.
Running the command with the –h option displays usage information.
# mem01 -h
-c n
Run n copies concurrently
-e
Turn on error logging
-f
Turn off functional testing
-h
Show this help screen
-i n
Execute test n times
-I x
Execute test for x seconds
-p
Pause for SIGUSR1 before starting
-P x
Pause for x seconds between iterations
-t
Turn on syscall timing
-C ARG
Run the child process with arguments ARG (for internal use)
-m x
size of malloc in MB (default from /proc/meminfo)
-r
random touching versus linear
-v
verbose progress indication
Useful options for support are –v and –r. The –v flag executes the test in verbose mode. The –r flag forces
random memory touching. This test returns 0 on success and 1 on failure. All failures are reported with a
FAIL message.
136
Chapter 3
Diagnostics
Shelf Manager (ShMM) Diagnostics User Interface
# mem01
Free Mem:
35 Mb
Free Swap:
0 Mb
Total Free:
35 Mb
Total Tested:
35 Mb
mem01
0
INFO
:
touching 35MB of malloc'ed memory (linear)
mem01
1
PASS
:
malloc - alloc of 35MB succeeded
:
touching 35MB of malloc'ed memory (random)
# mem01 -r -v
Free Mem:
35 Mb
Free Swap:
0 Mb
Total Free:
35 Mb
Total Tested:
35 Mb
mem01
0
INFO
....................................................................................
....................................................................................
....................................................................................
....................................................................................
...............................
mem01
1
PASS
:
malloc - alloc of 35MB succeeded
mem02
The mem02 allocates a 4 MB chunk of memory and verifies that the memory: can be properly zeroed, can be
written to, and can be freed. Mem02 catches memory subsystem errors. The mem02 test cannot check memory
that is currently in use by the system and user space applications. The mem02 test has no options.
The test returns 0 on success and 1 on any error. All failures are reported with a FAIL message.
# mem02
mem02
1
PASS
:
calloc - calloc of 4MB of memory succeeded
mem02
2
PASS
:
malloc - malloc of 4MB of memory succeeded
mem02
3
PASS
:
realloc - realloc of 256MB succeeded
mem02
4
PASS
:
realloc - realloc of 256MB succeeded
CPU Error Daemon
In order for the errors to be reported, syslogd and klogd must both be running. The following error types
are monitored:
Table 3-2
CPU Error Types
Exception
Mod
Chapter 3
Description
TLB modification exception
137
Diagnostics
Shelf Manager (ShMM) Diagnostics User Interface
Table 3-2
CPU Error Types (Continued)
Exception
Description
TLBL
TLB exception (load or instruction
fetch)
TLBS
TLB exception (store)
AdEL
Address error exception (load or
instruction fetch)
AdES
Address error exception (store)
Sys
Syscall exception
BP
Breakpoint exception
RI
Reserved instruction exception
CpU
Coprocessor Unusable exception
Ov
Arithmetic Overflow exception
Tr
Trap exception
NOTE
Many of these exceptions can be caused by code errors. Before replacing a CPU, verify that the
programs running on the system are not known to have defects. Running known “good test
programs” to verify the errors is recommended.
All errors are logged in this format:
<Date> <hostname> <alert level> <logging daemon> CPUERR:<type>(Process ID, Program Counter,
Address)
A Mod exception will be reported as:
Jan 1 00:10:17 demo syslog.alert klogd: CPUERR:Mod(PID=71, PC=0x400700,
BadVaddr=0x2aaa8000)
138
Chapter 3
Diagnostics
Ethernet Switch Blade Functional Specifications
Ethernet Switch Blade Functional Specifications
Ethernet Switch Blade Diagnostics Features
There are no executable diagnostics for the ethernet switch blade. The following components are verified as
functional as a result of booting the ethernet switch blade to its Linux based operating environment:
•
The IPMC controller passed a power-on self test and established communications across at least one
IPMB to the ShMM
•
The IPMC controller reported to the ShMM that its power circuits and temperature sensor were within
thresholds. (FRU is declared healthy.)
•
The ShMM granted permission to the IPMC controller to power on the switch
•
The ShMM and the IPMC granted permission to the Ethernet port to access the backplane (if the port is
routed to the backplane)
•
The onboard CPU is functional, including interrupts
•
The Boot flash is operational (bootloader code has run)
•
A light-weight, fast memory inspection was conducted during boot
•
The Linux kernel was booted from the specified flash device, validating that flash. (The switch
administrator can select the boot device by specifying the device on a zbootcfg command, if the
alternate boot flash needs to be tested)
•
The PCI bus was probed to build a list of all devices before the driver module was loaded. The driver
attaches only those devices that have an expected PCI device ID.
•
The driver makes PCI accesses to get the version information and set up the switch registers and memory
•
The Driver reads the VPD (Vital Product Data) over the I2C bus.
•
The Linux (OpenArchitect) driver has loaded successfully and traffic can flow over a given switch port.
The ethernet switch blade LEDs and the shelf manager (ShMM) information related to the switch can assist
in troubleshooting hardware failures on the switch. They also can be used to troubleshoot networking
problems and network configuration issues.
Chapter 3
139
Diagnostics
HP bc2100 ATCA Server Blade Functional Specifications
HP bc2100 ATCA Server Blade Functional Specifications
HP bc2100 ATCA Server Blade Diagnostics Features
The diagnostics are based on the Intel® Modular Test Architecture (Intel® MTA) for Linux*, an execution
environment and framework for Intel® architecture (IA) platforms running on a Linux Service OS. This
framework consists of test executives and test modules written as Linux applications. The test executives use
a text configuration file to describe the tests available and use either a Graphical User Interface (GUI) or
command line arguments to specify test options. The test modules use a standard test services library to
receive test parameters from the test executive and report status and test results in a consistent manner.
The diagnostics run locally on the Server Blade in an offline mode on a Linux Service OS. The board is
instructed to reboot into the Service OS and the diagnostics are loaded and run. The diagnostics interrogate
the board and compare the results to known valid values that are configured in a test package. If the tests
find variances between the board test results and the test package, the diagnostic test fails. The diagnostics
come with default test packages, but need to be reconfigured to represent the final configuration of the board.
Once the diagnostics are complete, the results are captured for viewing in output files. Tests are provided for
the following server blade components:
•
BMC
•
CPU
•
Memory
•
Cache
•
Disk
•
USB
•
PCI
•
System Management BIOS information
•
Network Interface Card (NIC)
Refer to the user interface and syntax section for more information on running the tests.
Server Blade Diagnostics Performance
The time required to complete each diagnostic test will vary depending on the blade configuration. In general,
most of the individual tests should run to completion (from several seconds to up to one minute). However,
memory, cache and disk tests can take much longer, depending on the size of the memory, cache or disk being
tested.
See individual test descriptions in the module help files provided with the Service OS diagnostic test package
for expected performance of each subtest in a standard configuration.
Server Blade Diagnostics Security
Access to the diagnostic service OS is restricted by user login and passwords, which can be altered within the
provided ISO image by the system administrator.
140
Chapter 3
Diagnostics
HP bc2100 ATCA Server Blade Functional Specifications
Server Blade Diagnostics Valid Configurations
The diagnostic service OS is delivered in the form of an ISO image. The following are the recommended
options for deploying the ISO image:
PXE Boot
The ISO image is downloaded onto the PXE server and the compressed kernel and RAMdisk image (vmlinuz
and initrd.gz) are extracted into the tftpboot directory. The diagnostics package is integrated with the Service
OS. Once the blade is booted into the Service OS, the BDP package is accessible via a network user session
(telnet or ssh).
Information and examples on setting up a PXE server are available at the following web site:
http://syslinux.zytor.com/pxe.php
Booting from CD with BDP ISO image
Create a boot CD using the ISO image of the BDP. Then connect a USB CD-ROM drive to the blade to boot
from the CD.
Configuring BIOS Settings for Remote Boot
To correctly boot the Server Blade for diagnostics using the remote boot method, the BIOS settings may need
to be changed to select the correct default device to boot from.
NOTE
The example below shows how to change the BIOS settings to enable booting of the Diagnostics
OS via PXE. Please consult the Server Blade user manual for details of these BIOS settings.
To configure the BIOS settings for remote boot perform the following steps:
1. Make sure that the Diagnostics Boot option is enabled under Advanced Settings (Diagnostic Boot
Sequence Configuration Screen). Refer to Figure 3-1.
Chapter 3
141
Diagnostics
HP bc2100 ATCA Server Blade Functional Specifications
2. Choose the correct default device for the selected boot option. Available options for the Default PXE device
will be based on which ports were enabled for PXE in the PCI configuration screen. The user may select a
specific PXE-enabled port to be used for diagnostic boot based on their support configuration. Refer to
Figure 3-2.
Figure 3-1
Diagnostics Boot Option
Figure 3-2
Default Device Selection for Diagnostics Boot
142
Chapter 3
Diagnostics
HP bc2100 ATCA Server Blade Functional Specifications
Selecting the Diagnostic Boot Sequence
When the default device(s) to be used for diagnostic boot have been configured, the Server Blade will respond
to IPMI requests to set the system boot options and boot from one of the configured diagnostic boot devices.
The following table summarizes the IPMI commands to invoke the one-time diagnostic boot sequence.
Table 3-3
Command
Set System
Boot Option
IPMI Commands for Diagnostic Boot
Net
Function
Chassis
(00h)
Cmd
Code
08h
Request Data
Byte 1 = 0x5 - Parameter Selector as ‘boot flags’
Byte 2 [7] = 1b - boot flags valid
[6] = 0b - options apply to next boot only
[5] = 0b - BIOS boot type (for BIOS variants that support
both legacy and EFI boots)
[4-0] 0b
Byte 3 [7] = 0b
[6] = 0b
[5:2] - Boot device selector
0001b = Force PXE
0010b = Force boot from default hard drive
0101b = Force boot from default CD/DVD
[1] = 0b
[0] = 0b
Byte 4 = 0b
Byte 5 = 0b
Byte 6 = 0b
Chassis
Control
Chassis
02h
Byte 1
=2 - Power cycle
=3 - Hard reset
See “Using ipmitool to Request Diagnostic Boot” on page 190 for examples on using the ipmitool utility to
perform a diagnostic boot.
Service OS Configuration Information
User logins and passwords
The Service OS is a Linux distribution specifically created for running the diagnostics utility. It includes some
of the standard UNIX tools like grep, less, and vi.
Chapter 3
143
Diagnostics
HP bc2100 ATCA Server Blade Functional Specifications
There are two default users in the Service OS, “root” and “bdp”. It is recommended to use “bdp” as the user
when running the diagnostics and other operations. The following are the default passwords for these users:.
Refer to “Customizing the Service OS ISO Image” on page 192 for information on customizing the Service OS.
Table 3-4
Username
Default User Logins
Default
Password
root
(none)
bdp
“bdp”
Network configuration
A network configuration agent script, named the netsvc script (/etc/rc.d/init.d/netsvc), starts at Service
OS boot time. By default, it configures the Service OS network to DHCP. The script can be changed by the
user to configure STATIC by default with a specific IP address. The ISO image in this case needs to be rebuilt
by the user. Refer to “Customizing the Service OS ISO Image” on page 192 for more information on
customizing the service OS.
144
Chapter 3
Diagnostics
HP bc2100 ATCA Server Blade Functional Specifications
The script modifies the ifcfg file for the base interface. The system name can be generated from the system
hardware address (that is, the MAC address can be read by running ifconfig and reading the output). By
default, the host name is set to bdp-XX-XX-XX-XX-XX-XX, where XX-XX-XX-XX-XX-XX denotes the MAC
address of the “eth0” Ethernet interface. Figure 3-3 shows the operation of the network configuration agent.
Figure 3-3
Network Configuration Agent Operation
The script can be changed to use the default STATIC IP address.
Chapter 3
145
Diagnostics
HP bc2100 ATCA Server Blade User Interface
HP bc2100 ATCA Server Blade User Interface
HP bc2100 ATCA Server Blade Diagnostics Interface Description
The diagnostics package (referred to as the “Board Diagnostics Package (BDP)” from this point forward) is
provided as an ISO image. The ISO image is a bootable CD image that can be installed in the production
environment to boot using various boot methods.
The BDP consists of following components:
•
Service OS - The Service OS provides basic functionality and an environment for running the offline
diagnostics. The Service OS also provides network services for using ssh and telnet interfaces for remote
use.
•
BDP CLI Application - This is a command line application to invoke the Modular Test Architecture (MTA)
that can be run from an interactive login, a remote login or a system manager. Various command line
options are available to run diagnostics for selected components or all components.
•
Diagnostics Utility - This is the core of the BDP that consists of the binaries, drivers and configuration
files required to run the diagnostic tests. The MTA is based on Intel® Modular Test Architecture (Intel®
MTA), a framework that provides modules for testing different hardware components such as the CPU,
PCI bus, USB, Memory etc.
When run outside of the BDP CLI application, the diagnostics are accessible via a command-line “T” test exec
controller module, or via an “XTC” X-Windows test controller
HP bc2100 ATCA Server Blade Diagnostics Overview
The basic organization of the Server Blade diagnostics package is as follows:
•
Module executable files (lxCPU, lxMemory, lxPCI, lxdiskdrv and so on) in the installed test
directory. The test directory (/opt/intel/bdp/common/iMTA-1.5) will be initialized on boot with links
to the module executables in /opt/intel/bdp/common/bin/.
•
Module default configuration or “snippet” files (lxCPU.snp, lxMemory.snp, and so on) which define all
available tests and default execution parameters for the corresponding module. These are text-readable
and editable XML files. The test directory (/opt/intel/bdp/common/iMTA-1.5) will be initialized on
boot with links to the snippet files in /opt/intel/bdp/common/Configuration/.
•
Test package (.pkg) files created by the user which import one or more of the module snippet files. The
.pkg files are also text-readable and editable XML files. The test directory
(/opt/intel/bdp/common/iMTA-1.5) will be initialized on boot with links to a default BDP package
for the board under test (for example from
/opt/intel/bdp/MPCBL0030/Configuration/bdp_MPCBL0030.pkg).
146
Chapter 3
Diagnostics
HP bc2100 ATCA Server Blade Diagnostics Syntax and Semantics of UI
HP bc2100 ATCA Server Blade Diagnostics Syntax and Semantics of
UI
BDP CLI
The BDP Command Line Interface (CLI) can be accessed by logging into the Service OS using telnet or ssh. To
run the diagnostics, use “bdp” as the user name (default password “bdp”).
CLI Usage
This section describes the various command line options available in the BDP CLI utility.
The BDP executable can be run or invoked remotely from the system manager or locally on the Service OS,
with several options. The options enable user to:
•
Perform diagnostics on a selected module.
•
Output the test results to the screen or to a file at a specified location.
•
Halt on error.
•
Execute for a given period of time.
•
Execute a specific number of times.
The syntax of the BDP executable is as follows:
bdp [-c <configuration>]
[--he ]
[-n <repeat number>]
[--rr <File name >]
[--rv <File name>]
[--re <File name >]
[-v]
[--help]
The options are described in Table 3-5.
Table 3-5
BDP Command Options
Option
-e <configuration>
Description
Default <configuration> = core
Numeric values can also be used: core =0
The numeric values for these configurations are mapped and listed
in the platform.ini file. Refer to Customizing BDP for additional
information on creating configurations.
-he
Chapter 3
Halt on error
147
Diagnostics
HP bc2100 ATCA Server Blade Diagnostics Syntax and Semantics of UI
Table 3-5
BDP Command Options (Continued)
Option
Description
-n <repeat number>
Specifies the number of times the test will be repeated. If 0 run
forever. The default is 1.
-o <filename>
Redirect all output to the specified file.
-rv <filename>
Redirect verbose output to the specified files.
-re <filename>
Redirect error messages to the specified file.
-v
Display BDP and MTA version number.
-help or -?
Show a brief help message.
NOTE
The -o and -rv options turn on verbose mode which can generate large amounts of data very
quickly and fill up the available disk space.
Please note the following regarding the use of the BDP CLI:
•
Output file names cannot be MTA framework keywords.
•
Output file names should be a fully qualified pathname. If a fully qualified pathname is not specified,
output files will be created in the test directory /opt/intel/bdp/common/iMTA-1.5.
•
When looping with output redirected to the files, the resulting files can grow excessively large, especially
when verbose mode is enabled. This can lead to problems with the RAM file system (/dev/ram0), which
has limited free space for creating new files.
•
The configurations present in the .pkg file are supplied as examples only. Any differences in Server Blade
hardware configuration when compared to the configuration when the .pkg file was generated will cause
tests to fail. For example, if a .pkg file was generated for a blade with 1 GB of memory installed and the
user’s blade now has 2 GB installed, some memory tests will fail because of the mismatch in the amount
of memory present
BDP CLI Examples
Run default (core) test modules in the default configuration redirecting output to a file and halting on error:
# bdp -o /root/alltests.log --he
Run default (core) test modules in the default configuration 15 times, redirecting all output to a file:
# bdp -o /root/alltests.log -n 15
Customizing BDP
The default BDP configuration is named core. Users may modify this configuration and create additional
configurations as needed. Each configuration is assigned a numeric equivalent value. This name to number
mapping is stored in the /opt/intel/bdp/MPCBLXXXX/Configuration/bdp_MPCBLXXXX.ini file, where
MPCBLXXXX is the Server Blade model number. The dual Xeon Server Blade model number is MPCBL0030.
To add a new configuration mapping to the system, add an entry with a unique number to the
MPCBLXXXX.ini file. The maximum configuration number is 254. For example, to add the new configuration
“preferred” to the system, add following line to the MPCBLXXXX.ini file:
148
Chapter 3
Diagnostics
HP bc2100 ATCA Server Blade Diagnostics Syntax and Semantics of UI
[n]:preferred
Where n is the configuration number.
NOTE
You must create a new configuration “preferred” as described below for this new configuration
to work properly.
The BDP application uses /opt/intel/bdp/MPCBLXXXX/Configuration/bdp_MPCBLXXXX.pkg to load
the configuration data. The configurations are listed by name in this file.
Editing of the configuration file is performed with the XTC X-windows application found on the blade server.
To use the XTC application, boot the Server Blade to the Service OS, login using telnet or ssh. Set the
DISPLAY environment variable to the X server you are using as a display. Then run:
# export DISPLAY=<your X server DISPLAY>
# cd /opt/intel/bdp/common/iMTA-1.5/
# ./xtc
The XTC window will open on your X server. Open the
/opt/intel/bdp/MPCBLXXXX/Configuration/bdp_MPCBLXXXX.pkg package file and add or edit
configurations as required. Refer to “Prerequisite to Using the XTC Program” on page 156 for additional
information on using the XTC GUI interface to configure tests.
After the bdp_MPCBLXXXX.ini and bdp__MPCBLXXXX.pkg files have been modified, copy the modified files
into the Service OS ISO Image. Refer to “Customizing the Service OS ISO Image” on page 192 for additional
information.
To see the currently available preconfigured tests that can be invoked via the bdp CLI, list the contents of the
/opt/intel/bdp/common/iMTA-1.5/bdp_MPCBLXXXX.ini file after booting into the diagnostic OS on the
blade under test.
“t” Command Line Interface
The BDP interface is the recommended method to invoke MTA. However, there is an iMTA utility that may be
used as a stand-alone utility (without the BDP interface) for advanced options. Bypassing the BDP interface
will limit the interface capabilities provided by the BDP interface.
The iMTA utility has two user interfaces. This section describes the “t” Command Line Interface (CLI). The
next section, “XTC Graphical User Interface” describes the Graphical User Interface (GUI).
NOTE
The autoconfigure feature of iMTA scans all the hardware in the Server Blade. It is
recommended to populate the board with all hardware before running “t” to create or modify
configurations.
The “t” program is located in the /opt/intel/bdp/common/iMTA-1.5/ directory. The following sections
describe how to use the “t” command line interface.
“t” Quick Start
Chapter 3
149
Diagnostics
HP bc2100 ATCA Server Blade Diagnostics Syntax and Semantics of UI
NOTE
•
If you are having problems viewing “t” command output, use the -BG white option for a white
terminal background or the -BG black option for a black terminal background.
Import all module configuration files (.snp extension) into a new package file (default name: “t.pkg”).
./t -autoi
•
To import only one module configuration file, type the name of the file after the “autoi” option:
./t -autoi lxCPU.snp
•
To save data to a different package file, use the “-pkg” option:
./t -autoi -pkg new_pkg_file_name
If a different package file name is used, all following commands must include the-pkg
new_pkg_file_name option.
NOTE
•
Autoconfigure the package file for the current system (substitute “new_config_name” with your own
configuration name).
./t -auto new_config_name
1. Tests will run immediately after they are configured. All destructive tests are disabled.
NOTE
2. Message colors can be configured for either a black or white background. If messages are
hard to read or do not display on the screen, type “-bg black” or “-bg white” after any
commands. The selected color configuration is saved and used for all future commands.
•
To re-run the same configuration:
./t -pc new_config_name
•
To save all messages to a file:
./t -pc new_config_name -rr new_file_name.txt
•
To list all tests in the default section of a package file:
./t -dt
•
To list the pre-configured options in the package file:
./t -dt -pc
“t” Commands and Parameters
Command line syntax for the ‘t’ command is:
t [runlist] [flags...]
NOTE
150
The “t” command line interface fails if the user supplies one of its keywords (in any case
variation) as a file name for any kind of output redirection.
Chapter 3
Diagnostics
HP bc2100 ATCA Server Blade Diagnostics Syntax and Semantics of UI
NOTE
If the current directory is not included in the “PATH” environment variable, replace all “t”
references with “./t”. The test directory for the Service OS is
/opt/intel/bdp/common/iMTA-1.5/
Both runlist and flags are optional. If “t” is run with no command line arguments, all enabled tests are
executed in the order they appear in the module definition list.
Below are examples of valid run lists, assuming the test configuration (which can be displayed with “t -dt”):
Table 1-6 show the tests available to be run with the ‘t’ command.
Table 3-6
Available Modules
2
device - memory
G--E
3
test - Memory Sliding Ones and Zeroes
G--E
4
test - Memory Random Data
G--E
5
test - Memory Address Pattern
6
device - CPU
G--E
7
test - Clock Speed
G--E
8
test - MMX instructions
9
device - Drive
G--E
10
test - Physical Disk Sequential Read
G--E
11
test - Physical Disk Sequential WRC
The above output shows tests and flow/groups. The first column has four characters which can be interpreted
as follows:
For a test:
•
Type (G = Generic, U = Utility). Default = G.
•
Interactive (I = Interactive, otherwise “-”). Default = “-”.
•
Destructive (D = Destrive, otherwise “-”). Default = “-”.
•
Disabled (D = Disabled, E = Enabled). Default = E.
For a flow/group:
•
Type (S = Serial, P = Parallel, E = Parallel Exact). Default = S.
•
OnError (C = Continue, H = Halt, P = Pause, T = Trigger). Default = C.
•
Loop (F = Forever, T = Time, N = Number). Default = N.
•
Depends on value of the third character (Loop);
If “F”, prints “*”
If “T”, lists the number of minutes
If “N”, lists the number of loops
Chapter 3
151
Diagnostics
HP bc2100 ATCA Server Blade Diagnostics Syntax and Semantics of UI
Otherwise lists “-”.
The second column shows the test, flow or group number that can be used on the command line.
The third column shows the name of a test, flow or group.
The following are some examples of running “t” (assuming a t.pkg file exists from previous steps):
Table 3-7
t Command Examples
Command Line
Description
t
Run all test in main section of package file.
t 2
Run all test of “memory” device in package
file.
t memory
Run all tests of “memory” device in package
files.
t 3
Run test 1 of “memory device in package
file.
t memory.Memory Sliding Ones and
Zeroes
Run test 1 of “memory” device in package
file.
Valid “t” flags are given in Table 3-7. Unrecognized flags are passed to the tests in addition to the common
and specific command line arguments found in the module definition file.
NOTE
“Any valid string” is defined as including alphanumeric characters, dashes (-), underscores (_),
brackets ([, ]), and spaces.
NOTE
Flags are case insensitive. The flags can be used with a preceding dash (-), double dash (--) or
slash (/). For example, -auto, --auto, /auto and /AUTO all give the same result.
Table 3-8
t Command Line Interface Flags
Flag
Range
Description
/AUTO [configname]
Any valid string
Run each test in self-sense mode to determine the hardware
configuration of the system. Write a new configuration
override section into the test package file. If the
configuration name is not entered, the user is prompted for
it. If the configuration name already exists, the existing
configuration is overwritten.
152
Chapter 3
Diagnostics
HP bc2100 ATCA Server Blade Diagnostics Syntax and Semantics of UI
Table 3-8
t Command Line Interface Flags (Continued)
Flag
Range
Description
Valid SNP file
name in current
directory
Imports SNP file(s) into the package file. If it is used with
the PKG flag, it imports files into the specified PKG file.
Otherwise, it uses the default PKG file. If the file already
exists, the user is given the option to override the current
file or append to it. If the SNP file name is specified, it
imports only that file. Otherwise, it imports all files with a
“.SNP” extension in the current directory.
/BG color
“BLACK” or
“WHITE”
Sets message colors to appear correctly, based on the
indicated background color. Color choices remain until the
/BG flag is used again. The default color is “BLACK”.
/DLL dll_name
[cmd_line_switches
]
Valid DLL
name. A user
may enter
arguments
after the DLL
name by
separating
them with
commas (no
spaces between
commas).
Dynamically loads all available functions from the
extension library (dll_name). It is typically used for data
collection in a manufacturing environment. Examples:
/DT [line_count]
1 to 2^30
Display all available tests. If a number is specified, up to
that many lines of text can be displayed on the screen at one
time.
/FLOW [flowname]
Any valid
string. It must
match the name
of the FLOW
section in the
package file.
Whether running tests or displaying a list of tests, refer to
the indicated “flowname” section of the package file.
/HE
None
Halt on error.
/HELP [line_count]
1 to 2^30
Display the help file. If a parameter is specified, that
number of lines is displayed on the screen at a time.
/MINUTES number
1 to 2^31
(unsigned long)
Loop on the specified test(s) until the number of specified
minutes has elapsed.
/N [number]
0 to 2^31
(unsigned long)
Number of loops. The default is 1. 0 = forever.
/OVER
N/A
Use this flag to run a disabled test.
/AUTOI
Chapter 3
[snp_file]
/DLL libcb.so.1[a,b,c,d]
or
/DLL libcb.so.1
153
Diagnostics
HP bc2100 ATCA Server Blade Diagnostics Syntax and Semantics of UI
Table 3-8
t Command Line Interface Flags (Continued)
Flag
Range
Description
/PC [configname]
Any valid
string. It must
match the
configuration
name in the
package file.
Whether running tests or displaying a list of tests, it refers
to the indicated “configname” section of the package file.
/PKG filename
Any valid Linux
filename
Use the specified file name as the test package file. The
default is “T.PKG”.
/PORT port
1024 to 65535
This switch specifies the port to use for communication
between the Test Executive and Run Engine.
/Q
None
Suppress most output to screen. This flag does not suppress
Info and Prompt messages, since they are always intended
to be viewed.
/QQ
None
Suppress all output to screen, including Info and Prompt
messages.
/RA filename
Any valid Linux
filename
Redirect advisory messages to a file as well as being
displayed on the screen.
/RE filename
Any valid Linux
filename
Redirect errors to a file as well as being displayed on the
screen.
/RI filename
Any valid Linux
filename
Redirect info messages to a file as well as being displayed
on the screen.
/RP filename
Any valid Linux
filename
Redirect prompt messages and user responses to a file as
well as being displayed on the screen.
/RR filename
Any valid Linux
filename
Redirect all output to a file as well as being displayed on the
screen.
/RS filename
Any valid Linux
filename
Redirect status to a file as well as being displayed on the
screen.
/RT filename
Any valid Linux
filename
Redirect statistic messages to a file (not displayed on
screen).
/RV filename
Any valid Linux
filename
Redirect verbose messages to a file as well as being
displayed on the screen.
/SELF
None
Self sense the hardware and run tests. Similar to the
/AUTO flag, but does not save the result in a configuration
override section of the package file.
/SF [filename]
Any valid Linux
filename
Generate a summary file of tests executed. The default file
name is “summary.txt”. If the summary file name is
specified, the name cannot be the same as any file names
used with redirect file flags (RA, RE, RI, RR, RS, RT, and
RV).
154
Chapter 3
Diagnostics
HP bc2100 ATCA Server Blade Diagnostics Syntax and Semantics of UI
Table 3-8
Flag
t Command Line Interface Flags (Continued)
Range
Description
/V [maskvalue]
32-bit integer.
Can be
negative.
Maskvalue is a 32-bit value that is bitwise ANDed with the
VerboseMask parameter of any Verbose Test Library
function calls the tests make. If the result is non-zero for a
particular call, the calls message is displayed. The default
maskvalue is zero. This flag is intended for module
debugging purposes only. A test developer can assign
message types to each bit and use them to control tracing of
test logic flow. A maskvalue of –1 displays all verbose
messages in all tests.
/W
None
Do not wait for replies to user prompts. Default values are
used instead. Intended for automated scripting.
t Test Results
The results of an invocation of the Test Executive are reported in several ways. As each test is invoked, a line
is written to the screen at the beginning and end of each test. Test results are also stored cumulatively in a
summary file which has the default name of summary.txt. The file name can be changed with the /SF
command line argument. In addition, for each invocation of the Test Executive, a volatile environment
variable records the results of the invocation.
t Screen Output
The format of the screen output as each test is invoked is as follows:
MM-DD-YYYY HH:MM:SS [handle] STARTED modulename.testname
MM-DD-YYYY HH:MM:SS [handle] PASSED modulename.testname
MM-DD-YYYY HH:MM:SS [handle] FAILED modulename.testname
Text is displayed in the following colors by default:
•
“Test Start” messages are reported in white text.
•
“Test Passed” messages are reported in green text.
•
“Test Failed” messages are reported in red text.
•
Error messages are reported in red text.
•
Advisory messages are reported in cyan text.
•
User prompts are displayed in yellow text.
•
Status messages are displayed in gray text.
•
Information messages are displayed in white text.
•
Verbose messages are displayed in magenta text.
Color values can be changed by using the “/BG” flag or manually editing the hidden .mta file in the same
directory as the “t” Test Executive.
Chapter 3
155
Diagnostics
HP bc2100 ATCA Server Blade Diagnostics Syntax and Semantics of UI
t Summary File
The summary file (by default called summary.txt) is a text file that records the cumulative test results for
all invocations of the Test Executive. In the file, there is a line for each test that summarizes the number of
passes, failures, and errors that each test has reported. The format of the file is as follows:
---Module.Subtest--------------------Pass Fail Errors Last Updated::
Modulename.testname
NOTE
#####
#####
#####
MM-DD-YYYY HH:MM:SS
The summary file is cumulative across Test Executive invocations, so to reset the counters, the
file must be deleted.
Environment Variable Return Code
The environment variable MTA_RETURN_CODE is set to “0” if all the tests are successful, and a non-zero value
if any tests report a failure. The value is also available in the $? environment variable.
Tests and Subtest Descriptions
Descriptions and information on the available tests can be found in the module help (*_hlp.text) files in
the Service OS. A subdirectory “module help files” will be installed in the test directory
(/opt/intel/bdp/common/iMTA-1.5) with a help text file for each test module. Please refer to the
installed help files for the updated descriptions of the available tests.
XTC Graphical User Interface
The BDP interface is the recommended method to invoke MTA. There is also an iMTA utility that can be used
as a stand-alone utility (without the BDP interface) for advanced options. Bypassing the BDP interface may
limit the additional interface capabilities provided by the BDP interface.
The iMTA utility has two user interfaces. This chapter describes XTC, which is a Graphical User Interface
(GUI). The previous chapter, ““t” Command Line Interface” describes the “t” interface, which is a Command
Line Interface (CLI).
The XTC GUI requires a working X server on the client machine.
NOTE
The autoconfigure feature of iMTA scans all the hardware present on the Server Blade.
Therefore, it is recommended to populate the board with all standard hardware configuration
before running the XTC program (or the “t” program) to create or modify configurations.
Prerequisite to Using the XTC Program
To use the XTC (X-windows Test Control) GUI program, it is necessary to have X server running on your
client machine. Any X server that supports the X11R6 protocol should be sufficient. Examples of X servers are
the standard X-server on Linux/UNIX desktops and workstations. Examples of X-servers running on
Windows clients are Hummingbird or Cygwin-X.
The following is an example of how to start XTC from an X-server desktop:
1. Boot the Server Blade into the Service OS. Write down the host name or IP address of the Server Blade.
Also write down the X-server’s IP address
2. Start a new “xterm” window on your X-server.
156
Chapter 3
Diagnostics
HP bc2100 ATCA Server Blade Diagnostics Syntax and Semantics of UI
3. Add the Server Blade host to the X-server’s access control list.
$ xhost +[IP ADDRESS OF Server
Blade]
4. Use telnet or ssh to login to the Server Blade. The default user name is “bdp”; the default password is
“bdp”.
5. Once logged into the Server Blade, set the DISPLAY environment variable:
-bash-3.0# export DISPLAY=[IP ADDRESS OF X-SERVER]
6. Now, change directory to iMTA-1.5 and start the XTC program:
-bash-3.0# cd /opt/intel/bdp/iMTA-1.5
-bash-3.0# ./xtc
The following sections describe how to use the XTC program to import modules and to configure, copy, add,
and modify packages to create different test configurations. The XTC program is the recommended method
for creating package configurations because it offers more options than the “t” program command line utility,
and it offers a user-friendly interface.
Getting Started
After the XTC program starts, a “Welcome to X-Windows Test Control (XTC)!” message is displayed. The
window shown in Figure 3-4 is then displayed.
Figure 3-4
XTC Program Environment
Additional information on XTC and its features is described in the sections:
Chapter 3
157
Diagnostics
HP bc2100 ATCA Server Blade Diagnostics Syntax and Semantics of UI
•
Overivew
•
Basic Concepts
•
Document File Types
Overview
XTC is short for “X-Windows Test Control” and is the graphical user interface for the Intel® Modular Test
Architecture for Linux. XTC tests are organized into modules to accommodate the wide range of system
configurations available. A group of test modules configured for a system is called a test package. The overall
architecture was designed to make it easy to configure because it is possible to update an existing test
package to accommodate new hardware by simply adding a new module.
158
Chapter 3
Diagnostics
HP bc2100 ATCA Server Blade Diagnostics Syntax and Semantics of UI
Basic Concepts
This section describes all of the basic components of a test package and the overall concepts of XTC
which include:
•
Test Package
•
Autoconfig Template
•
Module
•
Device
•
Test
•
Parameter
•
Test Flow Groups
•
Test Flow Tree
•
Configuration Tree
•
Message Types
•
Summary File
Test Package
A test package is a collection of configurations. The first configuration tree in a package is called the
“template configuration”. This tree is used during the auto-configuration process to generate new
configuration trees.
A configuration consists of a configuration tree and a flow tree. A configuration tree consists of devices, and
devices consist of individual subtests. The flow tree consists of flow groups and subtests. The subtests within
the flow tree are only pointers into the corresponding configuration tree. The flow tree is where a user can
control the duration and sequence of subtests.
Autoconfig Template
The template configuration serves a unique purpose. It is used as a template for the autoconfig process. This
means that autoconfig will invoke the autoconfig subtest of each device in the template. The output from the
autoconfig subtests is used to build a new configuration.
When the memory autoconfig subtest is running, it is probing the current system’s memory configuration and
reporting back to the test executive with information such as the type of memory and how much memory to
expect.
By default, an empty package has an empty “Autoconfig Template”. Use the import command to add devices
into the template configuration. Devices in the template configuration may not be run because they are in an
“unconfigured” state.
Module
A module is a collection of devices that target a subsystem, hardware device or a class of devices.
For example, a module called lxCPU might have a number of tests that target the CPU as opposed to memory
or chip sets. The definition is a little vague because some modules may have multiple devices which target
different hardware functions. An example of this would be the lxMemory module that exercises memory,
cache and symmetric multi-processing.
A module is a collection of files:
Chapter 3
159
Diagnostics
HP bc2100 ATCA Server Blade Diagnostics Syntax and Semantics of UI
•
lxModule - The executable file containing the test code.
•
lxModule.hlp - A help file describing all the tests, parameters and error messages.
•
lxModule.snp - A configuration tree branch representing the tests and parameters.
•
*.so.* - Any required libraries.
The name of the module in the configuration tree does not have to be the same as the file name.
Device
Tests within modules are logically grouped by devices.
Shortcut: Double-click the left mouse button on a device to edit its parameters.
Test
A test is the smallest executable unit of a module that returns a pass or a fail result. A module represents an
executable file. When the executable file is run, a parameter is passed to it to select the desired test by test
number.
A test is represented by a node in the configuration tree and a test’s properties may be viewed and edited by
the test Property Sheet (see the section “Property Dialog Boxes”).
Shortcut: Double-click the left mouse button on a test to edit its parameters.
Parameter
A parameter is an input to the test and usually describes variable characteristics of hardware, such as the
size of memory. Parameters can also be used to control the test in other ways, such as representing a testing
pattern or a number of bytes to test.
A parameter has a name and a value. Parameters may be optional or required. Parameters may be numeric or
string valued. The only way to know these things is to have read the modules help file.
Parameters are inherited and overridable. Tests are passed all parameters in all of its parent groups. If a
parameter occurs more than once, only the parameter located lowest in the tree is passed.
Shortcut: Double-click the left mouse button on a parameter to edit its parameters.
Test Flow Groups
Flow Groups are used to specify how a group of tests will be executed. The icons for flow groups represent
serial and parallel test flows. The flow type and a number of other parameters (such as number of loops and
time limit) can be specified and changed using the group Property Sheet (Refer to “Property Dialog Boxes” on
page 167t).
Shortcut: Double-click the left mouse button on a flow group to edit its parameters.
Test Flow Tree
A Test Flow tree is a hierarchy of flow groups that control the order of test execution. The flow groups contain
tests (or other flow groups) and specify how the tests are run. The groups specify whether the tests are run in
parallel or serial, run forever, halt on error, etc.
To add a test to the flow tree, drag it from the configuration tree and drop it in the desired group.
Configuration Tree
A configuration tree is a collection of tests and parameters that have been adjusted for a specific hardware
configuration. Packages can contain any number of configurations.
160
Chapter 3
Diagnostics
HP bc2100 ATCA Server Blade Diagnostics Syntax and Semantics of UI
Message Types
Various message types can be sent from test modules. Each message type can be individually filtered from
the message window. Each type can also be redirected to a separate file.
The following are the supported message descriptions and corresponding color code:
•
Error messages are sent when a failure condition is detected by the test or the test executive. If this
message is sent, the test will indicate a failure in the test status window.
•
Informative messages generated by tests with names like “Display CPU”.
•
Advisory messages are sent to indicate conditions that a user should be aware of during testing, but are
not failures. For example, the test executive could display an advisory if a test is sending keep-alive
messages at intervals close to the test timeout period. This would indicate that the test is running slowly,
which may be due to running too many tests in parallel.
•
Status messages are sent to indicate progress through the test.
•
Prompt messages log the message and answer after a user-interactive dialog box is displayed by a test.
•
Statistic messages include a piece of data you may want to collect in the data collection system, such as
the exact value of an analog measurement.
•
Verbose messages are debug messages and usually only make sense to the module developer.
Summary File
The summary file displays the test’s full path, the last known state, the activity and the progress values. The
pass and fail count are recorded also.
The summary file is updated once per second during testing. The default file name is “xtc_summary.csv”,
but you can change the name with the /SUMMARY invocation parameter. There is also a place to change the
file name in the options window.
The output file is comma-separated for convenience when importing the file into a spreadsheet program. The
following is a sample extract from the summary file:
Test,State,Pass,Fail,Activity,Progress
Memory Size Check pkgname/configuration_0/flowname/system, idle, 1, 0, 7, 100%
Document File Types
XTC supports the following file types:
•
XML Package File (.PKG) - XML representation of a Test Package.
•
XML Snippet File (.SNP) - XML representation for a branch of a Configuration Tree that supports a
Module.
This extension designates a branch of a Configuration Tree. It contains no test flow data. This type can be
opened directly from the File menu by choosing Open. Snippet files are imported into package files.
Chapter 3
161
Diagnostics
HP bc2100 ATCA Server Blade Diagnostics Syntax and Semantics of UI
User Interface
The User Interface consists of the following major components.
•
Test Modules Pane.
•
Test Sequence Pane.
•
Message Redirection Pane.
•
Test Message Pane.
•
Test Summary Pane.
•
Property Dialog Boxes.
•
Menus and Toolbars.
•
Status Bar.
•
Right-Click Menu.
Test Modules Pane
The Test Modules pane, shown in Figure 3-5, holds a configuration’s supported tests.
Figure 3-5
Test Modules Pane
The buttons on the test modules pane are described in Table 3-9.
Table 3-9
Test Modules Pane Button Descriptions
Import devices from snippet files into the template configuration's
configuration tree.
162
Chapter 3
Diagnostics
HP bc2100 ATCA Server Blade Diagnostics Syntax and Semantics of UI
Table 3-9
Test Modules Pane Button Descriptions (Continued)
Run autoconfigure on all devices in the template configuration, and
create a new configuration. If there is a flow in the template
configuration, the flow is copied to the new configuration.
Run autoconfigure on all devices in the current configuration, and
create a new configuration. If there is a flow in the current
configuration, the flow will be will be copied to the new
configuration.
Test Sequence Pane The Test Sequence pane shown in Figure 3-6 holds the flow tree.
Figure 3-6
Test Sequence Pane
The buttons on the test sequence pane are described in Table 3-10.
Table 3-10
Test Sequence Pane Button Descriptions
Start the top of the flow tree.
Stop all test execution.
Clear the test message and summary window.
Chapter 3
163
Diagnostics
HP bc2100 ATCA Server Blade Diagnostics Syntax and Semantics of UI
Table 3-10
Test Sequence Pane Button Descriptions (Continued)
Jump to the next failing test node in the flow tree. This is handy for
large flows that are collapsed. This button expands all nodes
leading to the first failing test. If the flow has multiple failing
nodes, clicking it again jumps to the next failed node.
Message Redirection Pane
The Message Redirection pane, shown in Figure 3-7, provides the ability to redirect specific message types
into different files. These options do not affect how messages are displayed in the Test Message pane (see the
following section).
Figure 3-7
Message Redirection Pane
Test Message Pane
164
Chapter 3
Diagnostics
HP bc2100 ATCA Server Blade Diagnostics Syntax and Semantics of UI
The Test Message pane, shown in Figure 3-8, displays messages of different types.
Figure 3-8
Test Message Pane
The buttons on the test message pane are described in Table 3-11.
Table 3-11
Test Message Pane Button Descriptions
Expand this window vertically. Restores back to the original height
if pressed again.
Save all of the current messages into a file.
Search dialog box.
Verbose mask dialog box.
Turn status messages on or off.
Chapter 3
165
Diagnostics
HP bc2100 ATCA Server Blade Diagnostics Syntax and Semantics of UI
Table 3-11
Test Message Pane Button Descriptions (Continued)
Turn advisory messages on or off.
Turn error messages on or off.
NOTE
Turning status, advisory, and error messages off does not affect message redirection to a file.
Turning verbose messages off does affect message redirection.
Test Summary Pane The Test Summary pane, shown in Figure 3-9, shows the status of the various tests.
Figure 3-9
Test Summary Pane
The buttons on the test summary pane are described in Table 3-12.
Table 3-12
Test Summary Pane Button Descriptions
The test name and path
idle = test is not running
starreg = test is running
aborted = test is being aborted
166
Chapter 3
Diagnostics
HP bc2100 ATCA Server Blade Diagnostics Syntax and Semantics of UI
Table 3-12
Test Summary Pane Button Descriptions (Continued)
The number of times the test passed
The number of times the test failed.
The first word is the number of test library calls made. The second
word is for the module developer’s use.
How far along the test is.
Property Dialog Boxes
Double-click a node to pop up a “property” dialog box. Depending on the type of file editing, PKG or SNP, some
fields may not be editable. The following are examples of the different nodes and their property dialog boxes.
Device Node Dialog Box
Chapter 3
167
Diagnostics
HP bc2100 ATCA Server Blade Diagnostics Syntax and Semantics of UI
Double-click
Figure 3-10
to display the device node dialog.
Device Node
Table 3-13 describes the fields for the device node dialog.
Table 3-13
Device Node Field Descriptions
Name
This field is the name of the device. Device names are not editable
from a package file.
Binary
This field is the name of the binary. The binary name and the
device name do not have to match.
Version
This is the version string from the module’s binary.
Timeout
This is the timeout value in seconds. If the module is not active for
this many seconds the test executive will terminate the process.
NOTE
The “Accept” button applies the new settings, but does not remove the dialog box. Once a property dialog
box is open, clicking on other nodes once automatically updates the open box.
Test Node Dialog Box
168
Chapter 3
Diagnostics
HP bc2100 ATCA Server Blade Diagnostics Syntax and Semantics of UI
Double-click
Figure 3-11
to display the test node dialog.
Test Node Dialog
Table 3-14 describes the fields for the test node dialog.
Table 3-14
Test Node Field Descriptions.
Field
Description
Name
The test name. Test names are
Binary
The binary name of the module in which the subtest belongs.
Number
The subtest number.
Timeout
This timeout overrides the device's timeout.
Destructive
The test does not put the component testing back in the original
state.
Interactive
The test requires some user input, unless the /w flag was used to
invoke XTC.
Utility
Typically means the test does not report an error if something is
wrong.
Chapter 3
editable from a package file.
169
Diagnostics
HP bc2100 ATCA Server Blade Diagnostics Syntax and Semantics of UI
Table 3-14
Test Node Field Descriptions. (Continued)
Field
Description
Disabled
The test will not run. By default, destructive tests should be
disabled.
Requires
The test requires external hardware or special setup before it can
run.
Flowgroup Node Dialog Box
Double-click
Figure 3-12
or
to display the Flowgroup node dialog.
Flowgroup Node Dialog
Table 3-15 describes the fields for the flowgroup node dialog box.
Table 3-15
Flowgroup Node Field Descriptions
Field
Description
Name
This field is the name of the binary. The binary name and the
device name do not have to match.
Execution
Execution: See the section “Test Flow Groups” for more
information.
Terminated
When to terminate test:
Forever: The test runs until manually aborted.
Loops: The test runs N times.
Minutes: The test runs for N minutes.
170
Chapter 3
Diagnostics
HP bc2100 ATCA Server Blade Diagnostics Syntax and Semantics of UI
Table 3-15
Flowgroup Node Field Descriptions (Continued)
Field
Description
On Error
Action to take on error:
Continue: Errors do not interrupt test flow.
Halt: All tests are aborted on 1st error.
Param Node Dialog Box
Double-click
to display the param node dialog.
Figure 3-13
Param Node Dialog
Table 3-16 describes the fields in the param node dialog box.
Table 3-16
Param Node Field Descriptions
Field
Description
Name
The name of the parameter.
Value
The parameter value.
Param View Tab
Chapter 3
171
Diagnostics
HP bc2100 ATCA Server Blade Diagnostics Syntax and Semantics of UI
Double-click
Figure 3-14
and click the Param View tab to view the parameters that a test is using.
Param View Tab
The Param View tab provides the list of the parameters that a particular test receives, and also shows where each
parameter resides in the package file.
172
Chapter 3
Diagnostics
HP bc2100 ATCA Server Blade Diagnostics Syntax and Semantics of UI
Menus and Toolbars
The main menu and toolbar are shown in FIG HERE.
Figure 3-15
Main Menu and Toolbar
The main menu and toolbar contain the following menus and buttons:
•
File Menu
•
Edit Menu
•
View Menu
•
Insert Menu
•
Action Menu
•
Help Menu
•
New Pkg Button
•
Open File Button
•
Save File Button
•
Configuration Drop Down
•
Configuration Rename
•
Clone Configuration
•
Remove Configuration
Additional information on each menu and toolbar is found in the following sections.
File Menu
Table 3-17 describes the file menu.
Table 3-17
Menu
Command
File Menu
Shortcuts
New
Package
Alt-F
Alt-N
Alt-P
New
Snippet
Alt-F
Alt-N
Alt-S
Open
Alt-F
Alt-O
Chapter 3
Ctl-N
Description
Creates a new package (.pkg) file.
Creates a new snippet (.snp) file.
Ctl-O
Opens an existing package or snippet file.
173
Diagnostics
HP bc2100 ATCA Server Blade Diagnostics Syntax and Semantics of UI
Table 3-17
Menu
Command
Save
File Menu (Continued)
Shortcuts
Alt-F
Alt-S
Ctl-S
Description
Saves the current package file.
If the package file has not been previously named, the Save As
dialog box is displayed.
Save As
Alt-F
Alt-A
Ctl-A
Saves the current package file as a different name.
Exit
Alt-F
Alt-E
Ctl-E
Exits the application if tests are not running. If the user chooses
“Exit” while tests are running, the “Tests are still running. Stop
tests before exiting” message is displayed and the application does
not exit. The “Run” icon in the Test pane changes to the “Stop” icon
that the user must click to stop the tests.
Edit Menu
Table 3-18 describes the edit menu.
Table 3-18
Menu
Command
Edit Menu
Shortcuts
Description
Undo
Alt-E
Alt-U
Ctl-Z
If there is an “undo” action in the action log, the last action is
undone. Actions such as running tests, switching configurations,
running autoconfigure, and saving the package file erase the action
log.
Cut
Alt-E
Alt-T
Ctl-X
If there is an “undo” action in the undone log, the last undone action
is redone. Actions such as running tests, switching configurations,
running autoconfigure, and saving the package file erase the
undone log.
Cut
Alt-E
Alt-T
Ctl-X
Removes the node currently in focus from the tree and saves the
node for later pasting. Root nodes of the configuration and flow tree
may not be cut.
Copy
Alt-E
Alt-C
Ctl-C
Copies the node currently in focus from the tree and saves the node
for later pasting. Copying and pasting may not be done with a flow
node as the source, and the configuration tree as the destination.
Copying across configurations is also prohibited for all node types.
Paste
Alt-E
Alt-P
Ctl-V
Pastes the node from the copy buffer into the desired location.
Node
Properties
Alt-E
Alt-O
CtlShift-P
Pops up the Properties dialog box for the in-focus node, excluding
the root of the configuration tree. Editing properties of the root of
the configuration tree is done through the options pane.
PKG
Properties
Alt-E
Alt-E
174
Pops up a box displaying the package version number.
Chapter 3
Diagnostics
HP bc2100 ATCA Server Blade Diagnostics Syntax and Semantics of UI
View Menu
Table 3-19 describes the contents of the view menu.
Table 3-19
Menu
Command
Status
View Menu
Shortcuts
Alt-V
Alt-M
Description
Toggles the status messages on/off in the Test Messages pane. This
does not affect status redirection to a file.
Alt-S
Advisory
Alt-V
Alt-M
Toggles the advisory messages on/off in the Test Messages pane.
This does not affect advisory redirection to a file.
Alt-A
Error
Alt-V
Alt-M
Toggles the error messages on/off in the Test Messages pane. This
does not affect error redirection to a file.
Alt-E
Verbose
Alt-V
Alt-M
Alt-V
Show
Active
Alt-V
Alt-S
Displays a verbose mask dialog box. A value of 0 turns off all
verbose messages in the Test Message pane. A value of
0xFFFFFFFF or -1 turns on all verbose messages. This does affect
verbose redirection to a file.
With show active set, the Test Summary window only displays tests
that are currently running. Otherwise, all test nodes in the
execution branch are displayed. Tests that are not currently
running display an “idle” state. Tests that are running show a
“started” state. Tests that have been aborted show an “aborted”
state.
Updates to the Test Summary table take place only when a test
starts. Therefore, toggling during runtime does not take affect until
the next test starts.
Tree Stats
Alt-V
Alt-T
Turns test statistics in the test node “on” or “off ” while tests are
running. This setting may only be changed while the tests are not
running.
Insert Menu
Chapter 3
175
Diagnostics
HP bc2100 ATCA Server Blade Diagnostics Syntax and Semantics of UI
Table 3-20 describes the contents of the insert menu.
Table 3-20
Menu
Command
Add Device
Insert Menu
Shortcuts
Alt-l
Alt-D
Ctl-D
Description
Adds a device node to the root of the configuration tree (Test
Modules Window) when editing a snippet file.
You must explicitly open a file with the .snp extension, or create a
new snippet file to enable this feature
Add Test
Alt-l
Alt-T
Ctl-T
Adds a test node to the root of a device node in the configuration
tree (Test Modules Window) when editing a snippet file.
You must explicitly open a file with the .snp extension, or create a
new snippet file to enable this feature.
Add Param
Alt-l
Alt-P
Ctl-P
Adds a test node to the root of a device node in the configuration
tree (Test Modules Window) when editing both a snippet file and a
package file.
You may add parameters to both the .snp and .pkg files.
Add Group
Alt-l
Alt-T
Ctl-T
Adds a group node to the flow tree (Test Sequence Window) when
editing a package file.
You must explicitly open a file with the .pkg extension, or create a
new package file to enable this feature.
Action Menu
Table 3-21 describes the contents of the action menu.
Table 3-21
Menu
Command
Action Menu
Shortcuts
Description
Run Flow
Alt-A
Alt-R
F5
Starts the test flow (Test Sequence Window).
Stop Tests
Alt-A
Alt-S
F6
Stops all test execution.
Clear
Results
Alt-A
Alt-C
F7
Clears the Test Summary and Test Messages windows, and resets
the flow tree back to its original state.
Goto Error
Alt-A
Alt-E
Configure
Tests
Alt-A
Alt-G
176
Expands all branches that lead to the failing node, and makes the
node visible within the window. If there is more than one error,
activating this feature again jumps to the next failed node. This is
convenient when you have a very large flow tree that is collapsed.
F8
Runs auto-configure on all device nodes in the Template
Configuration’s configuration tree (Test Modules Window). The end
result is a new configuration.
Chapter 3
Diagnostics
HP bc2100 ATCA Server Blade Diagnostics Syntax and Semantics of UI
Table 3-21
Action Menu (Continued)
Menu
Command
Shortcuts
Description
Import
Tests
Alt-A
Alt-I
F9
Imports one or more snippet files into the current package file. The
end result is one or more new device nodes under the Template
Configuration’s configuration tree.
Switch
Configurati
on
Alt-A
Alt-W
Ctl-W
Moves focus to the configuration drop-down list in the Options
pane. In that pane, you can switch to a different configuration
within the current package file.
Clone
Configurati
on
Alt-A
Alt-N
Run This
Alt-A
Alt-U
Redirect
Messages
Alt-A
Alt-E
Moves focus to the ‘Redirect Verbose Messages’ check box in the
Summary
File
Alt-A
Alt-M
Moves focus to the ‘Create Summary File’ check box in the Options
pane. The summary file is updated every second, and is given the
name defined in the adjacent text field.
Makes a copy of the current configuration, and gives it a unique
name.
Ctl-U
Runs the node currently in focus in either tree.
Options pane.
Help Menu
Table 3-22 describes the contents of the help menu.
Table 3-22
Menu
Command
About
Help Menu
Shortcuts
Alt-H
Alt-A
Overview
Alt-H
Description
Pops up a dialog box describing the version number, and licensing
information.
Pops up a brief overview file on XTC.
Alt-O
Startup
Wizard
Alt-H
Configurati
on Wizard
Alt-H
Enables or disables the startup wizard.
Alt-S
Alt-C
Enables or disables the configuration wizard. The configuration
wizard occurs when a package file that contains multiple
configurations is opened
New Package Button
Chapter 3
177
Diagnostics
HP bc2100 ATCA Server Blade Diagnostics Syntax and Semantics of UI
This button creates a new package file.
Open File Button
This button opens an existing package (.pkg) or snippet (.snp) file.
Save File Button
This button saves the current package or snippet file. If the file has not been previously saved the Save As dialog
box is displayed.
Configuration Drop-Down
This drop-down list allows you to navigate between configurations within the package file.
Configuration Rename
This text box allows you to rename the current configuration.
Clone Configuration
This button creates an exact copy of the current configuration within the current package fileThis text box allows
you to rename the current configuration.
Clone Configuration
This button removes the current configuration from the package file.
Status Bar
The status bar shows an elapsed timer.
Right-Click Menu
Right clicking on a node in the tree displays the menu shown in Figure 3-16. This menu provides shortcuts to
some of the main menu commands. Additional information is found in the Menu and Toolbar sections above.
178
Chapter 3
Diagnostics
HP bc2100 ATCA Server Blade Diagnostics Syntax and Semantics of UI
mer.
Figure 3-16
Right-Click Menu
Invocation Parameters
These parameters can be entered on the command line invocation of XTC to control various aspects of XTC.
The forward slash token may be replaced by a hyphen.
Example - The following commands both invoke autoconfigure:
xtc /auto
xtc –auto
NOTE
Flags are case insensitive. The flags can be used with a preceding dash (-) or double-dash (--)
slash (/). For example, -auto, /auto, --auto, and /AUTO all yield the same result.
The complete list of parameters is as follows:
•
file.pkg - Initial document file opened by XTC.
•
/PKG - Same as the above.
•
/AUTO - Run autoconfig first.
•
/SELF - Run autoconfig first, but do not save pkg file.
•
/RUN - Run tests without user input.
•
/CFG - Use specified configuration tree on startup
•
/PC - Same as /CFG above.
•
/MINUTES - Stop testing after number of minutes.
•
/LOOPS - Stop testing after number of loops.
•
/N - Same as /LOOPS above.
•
/QUIT - Exit XTC when tests complete.
•
/HE - Set top flow node to Halt on error.
•
/FOREVER - Set top flow node to run-forever.
Chapter 3
179
Diagnostics
HP bc2100 ATCA Server Blade Diagnostics Syntax and Semantics of UI
•
/SUMMARY - Write summary file to specified file name
•
/SF - Same as /SUMMARY above.
•
/V - Control verbose messaging.
•
/PORT - Specify the socket for executive communications.
•
/Q - Quit mode. Turns off most messages to screen.
•
/L - Loud mode. Forces error, status, and advisory on.
•
/W - Turns off interactive tests.
•
Message Redirection parameters - Redirect selected message types to a file.
file.pkg
The first parameter on the command line, not preceded by a slash (/), is the initial file to be opened when the
application starts. This file may be one of the two supported types: .PKG and .SNP.
/PKG
Command Line: /PKG filename
The filename parameter is required when using this switch. This switch is provided for backwards compatibility purposes.
/AUTO
Command Line: /AUTO configtree
This switch causes autoconfig to be run when XTC starts.
If the optional configtree parameter is specified, a new configuration tree is added to the package. The new
tree contains the results of autoconfig. If the configtree parameter is not specified, a unique name is assigned
to the configuration.
If this switch is used in combination with the /RUN switch, autoconfig always occurs before tests are run.
/SELF
Command Line: /SELF configtree
This switch causes autoconfig to be run when XTC starts.
If the optional configtree parameter is specified, a new configuration tree is added to the package. The new
tree contains the results of autoconfig. If the configtree parameter is not specified, a unique name is assigned
to the configuration.
If this switch is used in combination with the /RUN switch, autoconfig always occurs before tests are run.
NOTE
This switch differs from the /AUTO switch because it does not save the package file when
autoconfigure is complete.
/RUN
180
Chapter 3
Diagnostics
HP bc2100 ATCA Server Blade Diagnostics Syntax and Semantics of UI
Command Line: /RUN
This switch causes XTC to run tests when the application starts. The tests run are those in the flow tree of the
test package specified on the command line. If the /AUTO switch is used in combination with this switch,
autoconfig runs before testing is started.
/CFG
Command Line: /CFG configname
This switch causes XTC to load a specific configuration tree when it starts. This is particularly useful when
used with the /RUN command.
The configname parameter must be the name of a configuration tree in the package file.
/PC
This switch has the same effect as the /CFG switch.
/MINUTES
Command Line: /MINUTES number
This switch forces testing to stop after a specified number of minutes.
The number parameter indicates the number of minutes the test should run. The number parameter is
required. If the parameter is omitted the command is ignored.
/LOOPS
Command Line: /LOOPS number
This switch forces testing to stop after a specified number of minutes.
The number parameter indicates the number of loops. By default testing stops after one loop.
/N
This switch has the same effect as the /LOOPS switch
/QUIT
Command Line: /QUIT
This switch forces STC to exit after tests have been run. This switch is most commonly use with the /RUN or
/AUTO switch.
/HE
Command Line: /HE
Chapter 3
181
Diagnostics
HP bc2100 ATCA Server Blade Diagnostics Syntax and Semantics of UI
This switch forces testing to stop when an error occurs. When tests are stopped, a signal is sent to all running
tests. Each test is responsible to check the signal, stop testing, clean up and execute. The amount of time it
takes to stop is varies when tests are running in parallel.
/FOREVER
Command Line: /FOREVER
This switch determines the name of the summary file as specified by the filename parameter. By default, the
name is “summary.out”.
/SUMMARY
Command Line: /SUMMARY
This switch determines the name of the summary file as specified by the filename parameter. By default the
filename is ‘summary.out’.
/SF
Command Line: /SF
This switch has the same functionality as the /SUMMARY switch.
/V
Command Line: /V mask
This switch causes verbose (debug) messages from tests to be displayed.
If the optional mask parameter is -1 or 0xFFFFFFFF, all verbose messages are displayed. If the value is 0x1,
then only level 1 debug messages are displayed. If the optional mask parameter is not defined, then the
default value (-1) is used.
/PORT
Command Line: /PORT number
This switch forces executive communication sockets to use the port specified by the number parameter. The
number parameter is required.
/Q
Command Line: /Q
This switch suppresses most output to screen. It does not suppress “info” and “prompt” messages, because
these are intended to be presented to the user at all times.
/L
Command Line: /L
182
Chapter 3
Diagnostics
HP bc2100 ATCA Server Blade Diagnostics Syntax and Semantics of UI
This switch forces advisory status and error messages to be displayed in the test message.
/W
Command Line: /W
This switch forces interactive tests off. Default values provided by the module are used in place of the users
input.
Message Redirection
The following switches can be used to redirect test message types to files. Any combination of the parameters
is allowed.
Command Line:.
•
/RE filename - Redirect errors to filename.
•
/RA filename - Redirect advisory to filename.
•
/F.RS filename - Redirect status to filename.
•
/RP filename - Redirect pause to filename.
•
/RT filename - Redirect statistics to filename.
•
/RR filename - Redirect all to filename.
Autoconfigure
Autoconfigure is the act of programmatically capturing a function’s (hardware or software) feature set for
testing purposes. Autoconfigure runs each module in a mode that sets the module’s parameters to pass on the
current hardware. Autoconfigure should only be used on known good hardware. See Figure 3-17 for
information on starting the autoconfigure process.
Figure 3-17
Chapter 3
Starting Autoconfigure
183
Diagnostics
HP bc2100 ATCA Server Blade Diagnostics Syntax and Semantics of UI
Click “Configure” to start the autoconfigure process.
The ‘template configuration’ is shown above. These are all of the devices that will run autoconfigure.
When autoconfiguration completes a new configuration is created. See Figure 3-18.
Figure 3-18
Autoconfiguration Complete
A new configuration was created and automatically named “Configuratino_0”. The configuration name can be
changed in the Options pane.
Autoconfigure configurations tree update options are as follows:
•
Autoconfigure Configuration Tree Updates.
•
Autoconfigure Flow Tree Updates.
Autoconfigure Configuration Tree Updates
Once autoconfigure is complete you can expect a new configuration with devices in the new configuration tree
ready to test the current platform. In order to do this, modules are given the ability to programmatically alter
the configuration tree during the autoconfigure process. The following are the supported autoconfigure
actions:
•
Disabled Tests
•
Remove Tests
•
Remove Devices
•
Clone Devices
•
Change Parameter Values
•
Add New Parameters
Disabled Tests
184
Chapter 3
Diagnostics
HP bc2100 ATCA Server Blade Diagnostics Syntax and Semantics of UI
In certain situations, a device may need to disable a test. For example, the disk drive module disables all
physical write tests because they are destructive. Tests that are disabled can be easily re-enabled by
double-clicking the test and clearing the disable check box. Disabled tests are represented by a faded blue
icon.
Remove Tests
In certain situations, tests need to be completely removed from the configuration tree because there is no way
for the test to possibly run. For example, if the USB module detects the current system does not support
USB2.0, it removes all USB2.0-specific tests from the configuration tree.
Remove Devices
When a module’s entire suite of tests are incapable of running, the entire device should be removed. For
example, when the USB module detects that a system has no USB controllers, it removes itself completely
from the configuration tree.
Clone Devices
Modules that support an undetermined number of devices (such as hard drives) have the ability to clone and rename
itself within the configuration. See Figure 3-19.
Figure 3-19
Cloned Devices Representation
Template Device
After Autoconfigure and Cloning
Change Parameter Values
Devices within the template configuration usually have default parameter values. When a module probes the
actual hardware, it usually updates the parameter values to accurately reflect the state of the hardware.
Chapter 3
185
Diagnostics
HP bc2100 ATCA Server Blade Diagnostics Syntax and Semantics of UI
Add New Parameters
New parameters may also show up in the configuration tree.
Autoconfigure Flow Tree Updates
The second tree within a configuration is the flow tree. The flow tree controls test sequencing and duration for
a particular configuration. Autoconfigure copies the flow tree from the template configuration into the new
configuration, or creates a new serial flow if a template flow is not available. See Figure 3-20 for an example.
Figure 3-20
Autoconfigure Flow Tree Updates
Template Flow
186
Chapter 3
Diagnostics
HP bc2100 ATCA Server Blade Diagnostics Syntax and Semantics of UI
Flow After Autoconfigure
Re-Configure
Re-Configure is useful when you have a configuration with only a subset of the devices from the template
configuration tree, or if your configuration’s flow tree differs from the template flow.
Autoconfigure runs the autoconfigure process on all devices from the template’s configuration tree, and copies
the template's flow tree into the new configuration. Re-Configure only runs autoconfigure on the current
configuration’s devices, and copies the current configuration’s flow tree into the newly generated
configuration. The ability to autoconfigure a single device within a configuration may be added later.
Chapter 3
187
Diagnostics
BIOS Settings
BIOS Settings
Tests affected by BIOS settings and optionally present hardware are given below.
Table 3-23
BIOS Settings and Description
Test Module
Description
lxBMC
Not affected
lxCPU
Affected by CPU speed settings in the BIOS.
Affected by enabling or disabling HyperThreading in the BIOS
lxICHx
Disabled if no Serial Ata Ports autosensed.
Affected by the presence or absence of PMCs.
(1 on HP bc2100 ATCA Server Blade; common example: Video
Card)
lxPCIe
Not affected
lxPCIx
Affected by the presence or absence of PMCs
lxpci
Affected by the presence or absence of PMCs
lxUsb
Affected by disabling USB 2.0 support in the BIOS.
Affected by the presence of USB devices connected to the blade’s
USB port(s); common examples are keyboard, mouse, HUB, Flash
JumpDisk, external CD, etc.
lxcmos
Affected by changing CMOS settings after the module has been
configured
Disk
Partition checks affected by adding or removing disk partitions
after the module is configured.
Physical disk checks affected by adding, removing, or replacing
hard disk drives.
SMB_Info
Affected by changes to the associated FRU or SDR data.
Tests that look at the Product FRU, which should not change.
Tests that look at the Board FRU, some of which may change; an
example is the Board. FRU’s Description field.
Tests that look at the Chassis FRU, which change if the blade is
installed in a different chassis after the module is configured
Memory
Controller Hub
188
Affected by the type and configuration of memory DIMMs
Chapter 3
Diagnostics
BIOS Settings
Table 3-23
BIOS Settings and Description (Continued)
Test Module
Description
System, Memory,
Cache,
CacheWindowed,
CacheCoherency,
WindowedCacheC
oherency,
CacheConflict,
and
CustomStressTest
Many of these have “memory size” checks, which are affected by
adding or removing memory after the module is configured.
lxL106x
Affected by the presence or absence of external SAS devices
SuperIO
Not affected
Chapter 3
Many of these also have “CPU count checks”, which are affected by
enabling/disabling.
HyperThreading in the BIOS after the module is configured
189
Diagnostics
Using ipmitool to Request Diagnostic Boot
Using ipmitool to Request Diagnostic Boot
For accessing the HP bc2100 ATCA Server Blade diagnostic Service OS, it is possible to override the default
boot options and boot device priority (configured in the BIOS setup), and instead invoke a diagnostic boot
sequence using an IPMI command to set the system boot options. For example, if the Server Blade generally
boots from its local hard disk, an IPMI command can be sent to the blade to direct the blade to perform a PXE
boot instead on its next boot. This is a one-time only boot option, so subsequent boots will once again be based
on the boot device priority in the BIOS.
The IPMI command functionality is described in the IPMI 1.5 Specification in the section on “Remote Access
Boot Control” (“Set System Boot Options” command). A summary of the command bytes is shown below
Table 3-24
Command
Set System
Boot Options
ipmitool Command Bytes
Net
Function
Cmd
Code
Chassis
(00h)
08h
Request Data
•
Byte 1 = 0x5 - Parameter Selector as ‘boot flags’
•
Byte 2
[7] = 1b - boot flags valid
[6] = 0b - options apply to next boot only
[5] = 0b - BIOS boot type (for BIOS variants that support
both legacy and EFI boots)
•
Byte 3
[7] = 0b
[6] = 0b
[5:2] = Boot device selector
- 0001b = Force PXE
- 0010b = Force boot from default hard drive
- 0101b = Force boot from default CD/DVD
•
Byte4 = 0b
•
Byte5 = 0b
•
Byte6 = 0b
ipmitool is a command line utility program that is used to send ipmi commands either locally (if ipmitool is
running on the Server Blade’s Linux OS) or via IPMI-over-LAN if run from a remote system manager.
For more information on ipmitool please see: http://ipmitool.sourceforge.net
Example 1: Sending a local raw data request to PXE boot on next boot
ipmitool raw 0x00 0x08 0x05 0x80 0x04 0x00 0x00 0x00
Where, as shown in the table above:
190
Chapter 3
Diagnostics
Using ipmitool to Request Diagnostic Boot
0x04 - "force PXE" bits 0001b in request data byte 3[5:2]
Example 2: Sending an IPMI-over-LAN request to PXE boot blade in slot 4 on next boot
ipmitool -I lan -H
0x04 0x00 0x00
192.168.1.2 -U root -P rootpass -t 0x8e raw 0x00 0x08 0x05 0x80
Where:
"-I
lan" specifies the LAN interface should be used by ipmitool
"-H 192.168.1.2" is the IP address of the shelf manager through which the RMCP session will be
established (a hostname can also be specified instead of IP address, if applicable)
"-U root -P rootpass" is the user login information (root/rootpass) for the shelf manager RMCP session
"-t 0x8e" is the target IPMB address for the bridged request (8eh is the address for physical slot 4)
Some versions of ipmitool also support command keywords which can be specified instead of the raw hex
bytes in some cases. For example:
ipmitool chassis bootdev [ pxe | disk | cdrom ]
So the following syntax can also be used to send the IPMI-over-LAN request shown in Example 2:
ipmitool -I lan -H 192.168.1.2 -U root -P rootpass -t 0x8e chassis bootdev pxe
After invoking ipmitool to send the set system boot options request, the specified blade can be rebooted; the
one-time only boot option will be in effect. When specifying PXE boot, the appropriate configuration must
exist on the PXE server so that the boot request from the MAC address associated with the Server blade's
diagnostic boot PXE port will cause the Service OS to be downloaded for diskless boot.
Chapter 3
191
Diagnostics
Customizing the Service OS ISO Image
Customizing the Service OS ISO Image
To create a customized Service OS ISO image with customized BDP configurations and any other changes,
follow these instructions:
1. Copy the ISO image to a Linux machine.
2. Mount the ISO image using the Loopback interface.
# mkdir /mnt/loop
# mount -o loop ReleasedImage.iso /mnt/loop
3. Copy the entire directory structure of the mounted image to the new location.
# cp -a /mnt/loop/* /home/CopiedImageTree
4. Unmount the ISO image.
# umount /mnt/loop
5. Make changes to the files (add, remove, or edit) in the new location. Most custom-tailoring, such as
changing passwords or network configuration options, or adding custom prebuilt test packages, will
require changing files in the initrd:
•
Unzip the initrd:
# gunzip /home/CopiedImageTree/boot/isolinux/initrd.gz
•
Mount the initrd using the loop interface:
# mount -o loop /mnt/loop \ /home/CopiedImageTree/boot/isolinux/initrd
•
Modify files, copy new files (.pkg, ...)
# cp /tmp/*.pkg /mnt/loop/opt/intel/bdp/MPC0020/Configuration/
•
Unmount the initrd:
# umount /mnt/loop
•
Rezip the initrd:
# gzip /home/CopiedImageTree/boot/isolinux/initrd
6. Use mkisofs to create a new ISO image from the new location.
# mkisofs -o newimage.iso -b boot/isolinux/isolinux.bin -c \
boot/isolinux/isolinux.cat \
-no-emul-boot -boot-load-size 4 -boot-info-table -l -R -r -U \
./CopiedImageTree
192
Chapter 3
4 System Event Log Decoding
This chapter describes how to access and decode events logged in the System Event Log (SEL). For an
in-depth discussion of SEL entries see the IPMI v1.5 documentation.
Chapter 4
193
System Event Log Decoding
Introduction
Introduction
This chapter provides information to decode and interpret the System Event Log (SEL).
Accessing the SEL
The System Event Log is accessed through the ShMM clia using the sel command. The sel command
needs 2 arguments. The first argument specifies the IPMB address of the component that maintains the SEL
(20 in the example). The second argument identifies the number of entries from the end of the SEL to be
displayed (5 in the example).
# clia sel 20 5
Pigeon Point Shelf Manager Command Line Interpreter
0x0270: Event: at Apr 19 07:24:11 1970; from:(0x8e,0,0); sensor:(0x01,55);
event:0x1(asserted): "Upper Non-Critical", Threshold: 0x4b, Reading: 0x4b
0x0272: Event: at Apr 19 07:24:35 1970; from:(0x8e,0,0); sensor:(0x01,93);
event:0x1(asserted): "Upper Non-Critical", Threshold: 0x2d, Reading: 0x2d
0x0273: Event: at Apr 19 07:25:31 1970; from:(0x8e,0,0); sensor:(0x01,55);
event:0x1(deasserted): "Upper Non-Critical", Threshold: 0x4b, Reading: 0x48
#
Decoding an SEL Entry
The general format of an SEL entry is a colon and semicolon delineated set of fields. Entries are read from left
to right. The first field is the SEL ID. The SEL ID is a unique value generated by the ‘Event Receiver”. The
Event Receiver in the HP bh5700 ATCA 14-Slot Blade Server is the ShMM. Each field contains information
as specified in Table 4-1.
System Event Log Record Structure
Table 4-1 presents the format of the SEL Event Records and describes the information that each record field
contains.
Table 4-1
Byte
Raw SEL Event Record Data
Field
Description
1
2
Record ID
ID used for SEL Record access.
Note: The Record ID values 0000h and FFFFh have special
meaning in the Event Access commands and must not be used as
Record ID values for slotted SEL Event Records.
3
Record Type
[7:0] - Record Type
02h = system event record
C0h - DFh = OEM timestamped, bytes 8-16 OEM defined
E0h-FFh = OEM non-timestamped, bytes 4-16 OEM defined
194
Chapter 4
System Event Log Decoding
Introduction
Table 4-1
Byte
Raw SEL Event Record Data (Continued)
Field
Description
4
5
6
7
Timestamp
Time when the event was logged. Least significant byte first.
8
9
Generator ID
RqSA & LUN if the event was generated from the IPMB. Software
ID if the event was generated from the system software.
Byte 1
[7:1] - 7 bit I2C. Slave Address or 7-bit system software ID
[0] - 0b = ID is IPMB Slave Address
[0] - 1b = System Software ID
Byte 2
[7:4] = Channel number. Channel that received the event message.
0h if the event message was received via the system interface,
primary IPMB or internally generated by the BMC. NOTE: New for
IPMI v1.5. These bits were reserved in IPMI v1.0.
[3:2] - reserved. Write as 00b.
[1:0] - IPMB device LUN if byte 1 holds the Slave Address,
otherwise 00b.
10
EvM Rev
Event Message format version (=04h for events in this specification,
03h for IPMI v1.0 Event Messages).
11
Sensor Type
Sensor Type Code for the sensor that generated the event. Use the
first column of Table 4-5 to identify the type of sensor that
generated the event.
12
Sensor #
Number of the sensor that generated the event. For the clia sel
command this value is reported in decimal.
To identify the correct sensor you must know which component is
reporting the event. Use the “Event Generator” row in Table 4-2 to
identify the reporting component. Once the component is identified
use the “Sensor Num (decimal)” column from the component
specific table downloaded from http://www.hp.com/XXXX to identify
the sensor.
Chapter 4
195
System Event Log Decoding
Introduction
Table 4-1
Byte
13
Raw SEL Event Record Data (Continued)
Field
Event Dir |
Event Type
Description
Event Dir
[7] - 0b = Assertion event.
[7] - 1b = Deassertion event.
Event Type
Type of trigger for the event, such as a critical threshold going high,
a state asserted, etc. It also indicates the class of the event, such as
discrete, threshold, or OEM. The Event Type field is encoded using
the Event/Reading Type Code. Use Table 4-4 to decode the event
type
[6:0] - Event Type Code
14
Event Data 1
Use Data 1 column in the table identified in the Generator ID and
Sensor # steps above.
15
Event Data 2
Use Data 2 column in the table identified in the Generator ID and
Sensor # steps above.
16
Event Data 3
Use Data 3 column in the table identified in the Generator ID and
Sensor # steps above.
196
Chapter 4
System Event Log Decoding
Introduction
Example SEL Entry
Figure 4-1 shows an SEL entry with the record fields identified.
Figure 4-1
Chapter 4
SEL Entry with Fields Identified
197
System Event Log Decoding
Introduction
Decoding the Example SEL Entry
Decoding an SEL entry consists of identifying the values of the fields in the event record and using the value
tables to decode their meaning.
Table 4-2 shows how to decode and SEL entry. The example uses the SEL entry from Figure 4-1.
Table 4-2
SEL Field
Decoding Example
Value
Decode
SEL ID
0x0273
Unique identifier of this SEL entry.
Timestamp
Apr 19 07:25:31
Date and time of the event.
Event
Generator
0x8e,0,0
The Event Generator Field identifies the IPMB address of
the board where the event occurred, the LUN on the board
and the Channel Number.
Table 4-3 identifies the IPMB addresses that map to
physical components in the chassis.
For this example:
0x8e = Node 4 = Physical Slot 4. To continue you must
identify the type of component located in slot 4 of the
chassis (A Ethernet Switch Blade or a Server Blade). For
this example Slot 4 contains an HP bc2100 ATCA Server
Blade.
Chassis level components.
Non-Slot components such as the ShMM, are identified
using the component tables. For example a value of 0x20
identifies the ShMM as the initiating component.
Note: For this release the LUN and Channel Numbers will
be 0 and require no decoding.
198
Chapter 4
System Event Log Decoding
Introduction
Table 4-2
SEL Field
Sensor
Definition
Decoding Example (Continued)
Value
0x01,55
Decode
The Sensor Definition identifies the sensor type and the
specific sensor that caused the event.
Sensor types are defined in Table 4-5 (Table 4-5 reproduces
Table 36-3 from the IPMI v1.5 documentation).
Specific sensor information is dependent on the component
identified in the Event Generator field. Once the component
is identified refer to the component table to identify the
specific sensor that asserted the event.
For example:
0x01 = Temperature Sensor from Table 4-5 (Table 36-3 in
the IPMI v1.5 documentation).
55 = Decimal identifier for the specific sensor that asserted
the event. Use the “Sensor Num Dec” column of the
component specific decoding table to identify the sensor.
For this example use the HP bc2100 ATCA Server Blade
table. From this table ‘55’ identifies the sensor as the CPU 0
Temp sensor.
Note: See “Component-Specific SEL Decoding Tables” on
page 217 for information on downloading the component
specific decoding tables.
Event Type
ID
0x01(deasserted)
The Event Type ID identifies the specific event that
occurred.
For example:
0x01 identifies this as a threshold event (refer to Table 4-4
for additional information on event types).
‘deasserted’ identifies that the event was going low. Refer to
the Data 1 field for which event crossed the threshold. For
this example an “Upper non-critical” event occurred.
Data 1
“Upper
non-critical”
Use the component specific table for additional information
Data 2
Threshold: 0x4b
Use the component specific table for additional information
Data 3
Reading: 0x48
Use the component specific table for additional information
Chapter 4
199
System Event Log Decoding
IPMB Address to Physical Slot Mapping for SEL Decoding
IPMB Address to Physical Slot Mapping for SEL Decoding
Table 4-3 is used to map the IPMB address found in the SEL event to the physical slot to identify the blade
that caused the SEL event to be recorded.
Table 4-3
IPMB
Address
IPMB Address to Physical Location Making
Physical
Location
Logical
Address
Component
9A
Slot 1
Node 1
13
96
Slot 2
Node 2
11
92
Slot 3
Node 3
9
8E
Slot 4
Node 4
7
8A
Slot 5
Node 5
5
86
Slot 6
Node 6
3
82
Slot 7
Node 7
1
84
Slot 8
Node 8
2
88
Slot 9
Node 9
4
8C
Slot 10
Node 10
6
90
Slot 11
Node 11
8
94
Slot 12
Node 12
10
96
Slot 13
Node 13
12
9C
Slot 14
Node 14
14
10
Left Lower
Chassis Slot
ShMM
12
Right Lower
Chassis Slot
ShMM
20
Active
Virtual
ShMM
200
Chapter 4
System Event Log Decoding
Decoding Tables
Decoding Tables
Table 4-4
Generic
Event/Reading
Type Code
Generic Event/Reading Type Codes
Event/Reading
Class
Generic
Offset
(Data 1)
Description
THRESHOLD BASED STATES
01h
Threshold
00h
01h
02h
03h
04h
05h
06h
07h
08h
09h
0Ah
0Bh
Lower Non-critical - going low
Lower Non-critical - going high
Lower Critical - going low
Lower Critical - going high
Lower Non-recoverable - going low
Lower Non-recoverable - going high
Upper Non-critical - going low
Upper Non-critical - going high
Upper Critical - going low
Upper Critical - going high
Upper Non-recoverable - going low
Upper Non-recoverable - going high
DMI-based “Usage State” STATES
02h
Discrete
00h
01h
02h
Transition to Idle
Transition to Active
Transition to Busy
DIGITAL/DISCRETE EVENT STATES
03h
‘digital’ Discrete
00h
01h
State Deasserted
State Asserted
04h
‘digital’ Discrete
00h
01h
Predictive Failure deasserted
Predictive Failure asserted
05h
‘digital’ Discrete
00h
01h
Limit Not Exceeded
Limit Exceeded
06h
‘digital’ Discrete
00h
01h
Performance Met
Performance Lags
SEVERITY EVENT STATES
07h
Chapter 4
Discrete
00h
01h
02h
03h
04h
05h
06h
07h
08h
transition to OK
transition to Non-Critical from OK
transition to Critical from less severe
transition to Non-recoverable from less severe
transition to Non-Critical from more severe
transition to Critical from Non-recoverable
transition to Non-recoverable
Monitor
Informational
201
System Event Log Decoding
Decoding Tables
Table 4-4
Generic
Event/Reading
Type Code
Generic Event/Reading Type Codes (Continued)
Event/Reading
Class
Generic
Offset
(Data 1)
Description
AVAILABILITY STATUS STATES
08h
‘digital’ Discrete
00h
01h
Device Removed / Device Absent
Device Inserted / Device Present
09h
‘digital’ Discrete
00h
01h
Device Disabled
Device Enabled
0Ah
Discrete
00h
01h
02h
03h
04h
05h
06h
07h
08h
transition to Running
transition to In Test
transition to Power Off
transition to On Line
transition to Off Line
transition to Off Duty
transition to Degraded
transition to Power Save
Install Error
Other AVAILABILITY STATUS STATES
202
Chapter 4
System Event Log Decoding
Decoding Tables
Table 4-4
Generic Event/Reading Type Codes (Continued)
Generic
Event/Reading
Type Code
Event/Reading
Class
0Bh
Discrete
Generic
Offset
(Data 1)
00h
Chapter 4
Description
Redundancy States
Fully Redundant (formerly “Redundancy
Regained”)
Indicates that full redundancy has been regained.
01h
Redundancy Lost
Entered any non-redundant state, including
Non-redundant: Insufficient Resources.
02h
Redundancy Degraded
Redundancy still exists, but at a less than full level.
For example: A system has four fans, and can
tolerate the failure of two of them, and presently,
one has failed.
03h
Non-redundant: Sufficient Resources from
Redundant.
Redundancy has been lost but the unit is
functioning with minimum resources needed for
‘normal’ operation. Entered from Redundancy
Degraded or Fully Redundant.
04h
Non-redundant: Sufficient Resources from
Insufficient Resources
Unit has regained minimum resources needed for
‘normal’ operation. Entered from Non-redundant:
Insufficient Resources.
05h
Non-redundant: Insufficient Resources
Unit is non-redundant and has insufficient
resources to maintain normal operation.
06h
Redundancy Degraded from Fully Redundant
Unit has lost some redundant resource(s) but is still
in a redundant state. Entered by a transition from
Fully Redundant condition.
07h
Redundancy Degraded from Non-redundant
Unit has regained some resource(s) and is
redundant but not fully redundant. Entered from
Non-redundant:Sufficient Resources or
Non-redundant:Insufficient Resources.
203
System Event Log Decoding
Decoding Tables
Table 4-4
Generic Event/Reading Type Codes (Continued)
Generic
Event/Reading
Type Code
Event/Reading
Class
0Ch
Discrete
Generic
Offset
(Data 1)
ACPI Device Power States
00h
01h
02h
03h
204
Description
D0 Power State
D1 Power State
D2 Power State
D3 Power State
Chapter 4
System Event Log Decoding
Sensor Type Codes (Table 36-3 from the IPMI v1.5 Documentation)
Sensor Type Codes (Table 36-3 from the IPMI v1.5 Documentation)
Table 4-5
Sensor Type
Sensor Type Codes (Table 36-3 from the IPMI v1.5 Document)
Sensor
Specific
Offset
(Data 1)
Sensor
Type
Code
Event
reserved
00h
-
Reserved
Temperature
01h
-
Temperature
Voltage
02h
-
Voltage
Current
03h
-
Current
Fan
04h
-
Fan
Physical
Security
(Chassis
Intrusion)
05h
00h
01h
02h
03h
04h
05h
06h
General Chassis Intrusion
Drive Bay intrusion
I/O Card area intrusion
Server area intrusion
LAN Leash Lost (the system is unplugged from the LAN)
Unauthorized dock/undock
FAN area intrusion (supports detection of hot plug fan
tampering)
Platform
Security
Violation
Attempt
06h
00h
01h
02h
03h
04h
05h
Secure Mode (Front Panel Lockout) Violation attempt
Pre-boot Password Violation - user password
Pre-boot Password Violation attempt - setup password
Pre-boot Password Violation - network boot password
Other pre-boot Password Violation
Out-of-band Access Password Violation
Server
(Processor)
07h
00h
01h
02h
03h
IERR
Thermal Trip
FRB1/BIST failure
FRB2/Hang in POST failure (used hang is believed to be
due or related to a server failure. Use System Firmware
Progress sensor for other BIOS hangs.)
FRB3/Server Startup/Initialization failure (CPU didn’t
start)
Configuration Error
SM BIOS ‘Un-correctable CPU-complex Error’
Server Presence detected
Server disabled
Terminator Presence Detected
04h
05h
06h
07h
08h
09h
Chapter 4
205
System Event Log Decoding
Sensor Type Codes (Table 36-3 from the IPMI v1.5 Documentation)
Table 4-5
Sensor Type
Sensor Type Codes (Table 36-3 from the IPMI v1.5 Document)
Sensor
Specific
Offset
(Data 1)
Sensor
Type
Code
Event
Power Supply
08h
00h
01h
02h
03h
04h
05h
Presence detected
Power Supply Failure detected
Predictive Failure
Power Supply AC lost
AC lost or out-of-range
AC out-of-range, but present
Power Unit
09h
00h
01h
02h
03h
04h
05h
06h
07h
Power Off / Power Down
Power Cycle
240VA Power Down
Interlock Power Down
AC lost
Soft Power Control Failure (unit did not respond to a
request to turn on)
Power Unit Failure detected
Predictive Failure
Cooling Device
0Ah
-
-
Other
Units-based
Senor (per
units given in
SDR)
0Bh
-
-
Memory
0Ch
00h
Correctable ECC / other correctable memory error
01h
Uncorrectable ECC / other uncorrectable memory error
02h
Parity
03h
Memory Scrub Failed (stuck bit)
04h
Memory Device Disabled
05h
Correctable ECC / other correctable memory error logging
limit reached
The Event Data 3 field for this command can be used to
provide an event extension code, with the following
definition:
7:0 DIMM/SIMM/RIMM identification, relative to the entity
that the sensor is associated with (if SDR provided for this
sensor)
Drive Slot
(Bay)
206
0Dh
-
-
Chapter 4
System Event Log Decoding
Sensor Type Codes (Table 36-3 from the IPMI v1.5 Documentation)
Table 4-5
Sensor Type
Sensor Type Codes (Table 36-3 from the IPMI v1.5 Document)
Sensor
Specific
Offset
(Data 1)
Sensor
Type
Code
Event
POST Memory
Resize
0Eh
-
-
System
Firmware
Progress
(Formerly
POST Error)
0Fh
00h
System Firmware Error (POST Error)
The Event Data 2 field can be used to provide an event
extension code, with the following definition:
Event Data 2:
00h Unspecified.
01h No system memory is physically installed in the
system.
02h No usable system memory, all installed memory has
experienced an unrecoverable failure.
03h Unrecoverable hard-disk/ATAPI/IDE device failure.
04h Unrecoverable system-board failure.
05h Unrecoverable diskette subsystem failure.
06h Unrecoverable hard-disk controller failure.
07h Unrecoverable PS/2 or USB keyboard failure.
08h Removable boot media not found
09h Unrecoverable video controller failure
0Ah No video device detected
0Bh Firmware (BIOS) ROM corruption detected
0Ch CPU voltage mismatch (servers that share same
supply have mismatched voltage requirements)
0Dh CPU speed matching failure
0Eh to FFh reserved
01h
Chapter 4
System Firmware Hang (uses the same Event Data 2
definition as following the System Firmware Progress
offset)
207
System Event Log Decoding
Sensor Type Codes (Table 36-3 from the IPMI v1.5 Documentation)
Table 4-5
Sensor Type
System
Firmware
Progress
(Formerly
POST Error)
Continued
208
Sensor Type Codes (Table 36-3 from the IPMI v1.5 Document)
Sensor
Type
Code
Sensor
Specific
Offset
(Data 1)
02h
Event
System Firmware Progress
The Event Data 2 field can be used to provide an event
extension code with the following definition:
Event Data 2:
00h Unspecified.
01h Memory initialization.
02h Hard-disk initialization
03h Secondary server(s) initialization
04h User authentication
05h User-initiated system setup
06h USB resource configuration
07h PCI resource configuration
08h Option ROM initialization
09h Video initialization
0Ah Cache initialization
0Bh SM Bus initialization
0Ch Keyboard controller initialization
0Dh Embedded controller/management controller
initialization
0Eh Docking station attachment
0Fh Enabling docking station
10h Docking station ejection
11h Disabling docking station
12h Calling operating system wake-up vector
13h Starting operating system boot process, e.g. calling Int
14h Baseboard or motherboard initialization
15h reserved
16h Floppy initialization
17h Keyboard test
18h Pointing device test
19h Primary server initialization
1Ah to FFh reserved
Chapter 4
System Event Log Decoding
Sensor Type Codes (Table 36-3 from the IPMI v1.5 Documentation)
Table 4-5
Sensor Type
Event Logging
Disabled
Watchdog 1
Chapter 4
Sensor Type Codes (Table 36-3 from the IPMI v1.5 Document)
Sensor
Type
Code
10h
Sensor
Specific
Offset
(Data 1)
Event
00h
Correctable Memory Error Logging Disabled
01h
Event ‘Type’ Logging Disabled. Event Logging is disabled
for the following event/reading type and the offset has been
disabled.
Event Data 2
Event/Reading Type Code
Event Data 3
[7:6] - reserved. Write as 00b.
[5] 1b = logging has been disabled for all events of a given
type
[4] 1b = assertion event, 0b = deassertion event
[3:0] Event Offset
02h
03h
Log Area Reset/Cleared
All Event Logging Disabled
00h
01h
02h
03h
04h
05h
06h
07h
This sensor is provided to support the IPMI v0.9 to v1.0
transition. This is deprecated in IPMI v1.5. See sensor 23h
for the recommended definition of the Watchdog sensor for
the new v1.0 and the IPMI v1.5 implementations.
BIOS Watchdog Reset
OS Watchdog Reset
OS Watchdog Shut Down
OS Watchdog Power Down
OS Watchdog Power Cycle
OS Watchdog NMI / Diagnostic Interrupt
OS Watchdog Expired, status only
OS Watchdog pre-timeout Interrupt, non-NMI
11h
209
System Event Log Decoding
Sensor Type Codes (Table 36-3 from the IPMI v1.5 Documentation)
Table 4-5
Sensor Type
System Event
210
Sensor Type Codes (Table 36-3 from the IPMI v1.5 Document)
Sensor
Type
Code
12h
Sensor
Specific
Offset
(Data 1)
Event
00h
01h
02h
System Reconfigured
OEM System Boot Event
Undetermined system hardware failure
(this event would typically require system-specific
diagnostics to determine FRU / failure type)
03h
Entry added to Auxiliary Log
(see 25.12, Get Auxiliary Log Status Command and 25.13,
Set Auxiliary Log Status Command, for more information)
Event Data 2
[7:4] - Log Entry Action
0h = entry added
1h = entry added because event did not be map to standard
IPMI event
2h = entry added along with one or more corresponding SEL
entries
3h = log cleared
4h = log disabled
5h = log enabled
all other = reserved
[3:0] - Log Type
0h = MCA Log
1h = OEM 1
2h = OEM 2
all other = reserved
04h
PEF Action
Event Data 2
The following bits reflect the PEF Actions that are about to
be taken after the event filters have been matched. The
event is captured before the actions are taken.
[7:6] - reserved
[5] - 1b = Diagnostic Interrupt (NMI)
[4] - 1b = OEM action
[3] - 1b = power cycle
[2] - 1b = reset
[1] - 1b = power off
[0] - 1b = Alert
Chapter 4
System Event Log Decoding
Sensor Type Codes (Table 36-3 from the IPMI v1.5 Documentation)
Table 4-5
Sensor Type
Sensor Type Codes (Table 36-3 from the IPMI v1.5 Document)
Sensor
Specific
Offset
(Data 1)
Sensor
Type
Code
Event
Critical
Interrupt
13h
00h
01h
02h
03h
04h
05h
06h
07h
08h
09h
Front Panel NMI / Diagnostic Interrupt
Bus Timeout
I/O channel check NMI
Software NMI
PCI PERR
PCI SERR
EISA Fail Safe Timeout
Bus Correctable Error
Bus Uncorrectable Error
Fatal NMI (port 61h, bit 7)
Button
14h
00h
01h
02h
Power Button pressed
Sleep Button pressed
Reset Button pressed
Module / Board
15h
-
-
Microcontroller
/ Coprocessor
16h
-
-
Add-in Card
17h
-
-
Chassis
18h
-
-
Chip Set
19h
-
-
Other FRU
1Ah
-
-
Cable /
Interconnect
1Bh
-
-
Terminator
1Ch
-
-
System Boot
Initiated
1Dh
00h
01h
02h
03h
04h
Initiated by power up
Initiated by hard reset
Initiated by warm reset
User requested PXE boot
Automatic boot to diagnostic
Boot Error
1Eh
00h
01h
02h
03h
04h
No bootable media
Non-bootable diskette left in drive
PXE Server not found
Invalid boot sector
Timeout waiting for user selection of boot source
Chapter 4
211
System Event Log Decoding
Sensor Type Codes (Table 36-3 from the IPMI v1.5 Documentation)
Table 4-5
Sensor Type
Sensor Type Codes (Table 36-3 from the IPMI v1.5 Document)
Sensor
Type
Code
Sensor
Specific
Offset
(Data 1)
Event
OS Boot
1Fh
00h
01h
02h
03h
04h
05h
06h
A: boot completed
C: boot completed
PXE boot completed
Diagnostic boot completed
CD-ROM boot completed
ROM boot completed
boot completed - boot device not specified
OS Critical
Stop
20h
00h
01h
Stop during OS load / initialization
Run-time Stop
212
Chapter 4
System Event Log Decoding
Sensor Type Codes (Table 36-3 from the IPMI v1.5 Documentation)
Table 4-5
Sensor Type
Slot /
Connector
Sensor Type Codes (Table 36-3 from the IPMI v1.5 Document)
Sensor
Type
Code
21h
Sensor
Specific
Offset
(Data 1)
Event
00h
01h
02h
Fault Status asserted
Identify Status asserted
Slot / Connector Device installed/attached
[This can include dock events]
03h
Slot / Connector Ready for Device Installation - Typically,
this means that the slot power is off. The Ready for
Installation, Ready for Removal, and Slot Power states can
transition together, depending on the slot implementation.
04h
05h
06h
Slot/Connector Ready for Device Removal
Slot Power is Off
Slot / Connector Device Removal Request - This is typically
connected to a switch that becomes asserted to request
removal of the device)
07h
Interlock asserted - This is typically connected to a switch
that mechanically enables/disables power to the slot, or
locks the slot in the ‘Ready for Installation / Ready for
Removal states’ - depending on the slot implementation.
The asserted state indicates that the lock-out is active.
08h
Slot is Disabled
The Event Data 2 & 3 fields can be used to provide an event
extension code, with the following definition:
Event Data 2
7 reserved
6:0 Slot/Connector Type
0 PCI
1 Drive Array
2 External Peripheral Connector
3 Docking
4 other standard internal expansion slot
5 slot associated with entity specified by Entity ID for
sensor
all other = reserved
Event Data 3
7:0 Slot/Connector Number
Chapter 4
213
System Event Log Decoding
Sensor Type Codes (Table 36-3 from the IPMI v1.5 Documentation)
Table 4-5
Sensor Type
System ACPI
Power State
Sensor Type Codes (Table 36-3 from the IPMI v1.5 Document)
Sensor
Type
Code
22h
Sensor
Specific
Offset
(Data 1)
00h
01h
02h
03h
04h
05h
06h
07h
08h
09h
0Ah
0Bh
0Ch
0Eh
214
Event
S0 / G0 “working”
S1 “sleeping with system h/w & processor context
maintained”
S2 “sleeping, processor context lost”
S3 “sleeping, processor & h/w context lost, memory
retained.”
S4 “non-volatile sleep / suspend-to disk”
S5 / G2 “soft-off ”
S4 / S5 soft-off, particular S4 / S5 state cannot be
determined
G3 / Mechanical Off
Sleeping in an S1, S2, or S3 states (used when particular
S1, S2, S3 state cannot be determined)
G1 sleeping (S1-S4 state cannot be determined)
S5 entered by override
Legacy ON state
Legacy OFF state
Unknown
Chapter 4
System Event Log Decoding
Sensor Type Codes (Table 36-3 from the IPMI v1.5 Documentation)
Table 4-5
Sensor Type
Watchdog 2
Sensor Type Codes (Table 36-3 from the IPMI v1.5 Document)
Sensor
Type
Code
Sensor
Specific
Offset
(Data 1)
Event
This sensor is recommended for new IPMI v1.0 and later
implementations.
23h
00h
01h
02h
03h
04h-07h
08h
Timer expired, status only (no action, no interrupt)
Hard Reset
Power Down
Power Cycle
reserved
Timer interrupt
The Event Data 2 field for this command can be used to
provide an event extension code, with the following
definition:
7:4 interrupt type
0h = none
1h = SMI
2h = NMI
3h = Messaging Interrupt
Fh = unspecified
all other = reserved
3:0 timer use at expiration:
0h = reserved
1h = BIOS FRB2
2h = BIOS/POST
3h = OS Load
4h = SMS/OS
5h = OEM
Fh = unspecified
all other = reserved
Platform Alert
This sensor can be used for returning the state and
generating events associated with alerts that have been
generated by the platform management subsystem
24h
00h
01h
02h
03h
Chapter 4
platform generated page
platform generated LAN alert
Platform Event Trap generated, formatted per IPMI PET
specification
platform generated SNMP trap, OEM format
215
System Event Log Decoding
Sensor Type Codes (Table 36-3 from the IPMI v1.5 Documentation)
Table 4-5
Sensor Type
Entity
Presence
Sensor Type Codes (Table 36-3 from the IPMI v1.5 Document)
Sensor
Specific
Offset
(Data 1)
Sensor
Type
Code
25h
Event
This sensor type provides a mechanism that allows a
management controller to direct system management
software to ignore a set of sensors based on detecting that
presence of an entity. This sensor type is not typically used
for event generation - but to just provide a present reading.
00h
Entity Present. This indicates that the Entity identified by
the Entity ID for the sensor is present.
01h
Entity Absent. This indicates that the Entity identified by
the Entity ID for the sensor is absent. If the entity is
absent, system management software should consider all
sensors associated with that Entity to be absent as well and ignore those sensors.
02h
Entity Disabled. The Entity is present, but has been
disabled. A deassertion of this event indicates that the
Entity has been enabled.
Monitor ASIC /
IC
26h
-
-
LAN
27h
00h
01h
LAN Heartbeat Lost
LAN Heartbeat
Management
Subsystem
Health
28h
00h
01h
02h
03h
sensor access degraded or unavailable
controller access degraded or unavailable
management controller off-line
management controller unavailable
Battery
29h
00h
01h
02h
battery low (predictive failure)
battery failed
battery presence detected
Reserved
remaining
-
-
OEM
RESERVED
C0h - FFh
-
-
216
Chapter 4
System Event Log Decoding
Component-Specific SEL Decoding Tables
Component-Specific SEL Decoding Tables
The component-specific SEL decoding tables are available for download from http://www.hp.com/
To download the decoding tables go to http://www.hp.com/. Select the Software & Drivers link. Enter your
product in the dialog box and select ‘go’. Select the desired decoding table and follow the instructions for
downloading.
Chapter 4
217