1
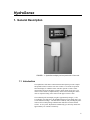
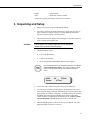
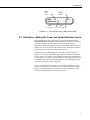
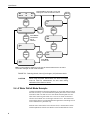
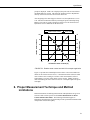
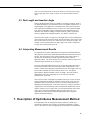
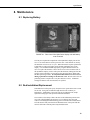
INSTRUCTION MANUAL Hydrosense Revision: 2/01 C o p y r i g h t ( c ) 1 9 9 9 - 2 0 0 1 C a m p b e l l S c i e n t i f i c , I n c . Warranty and Assistance The HYDROSENSE is warranted by CAMPBELL SCIENTIFIC, INC. to be free from defects in materials and workmanship under normal use and service for twelve (12) months from date of shipment unless specified otherwise. Batteries have no warranty. CAMPBELL SCIENTIFIC, INC.'s obligation under this warranty is limited to repairing or replacing (at CAMPBELL SCIENTIFIC, INC.'s option) defective products. The customer shall assume all costs of removing, reinstalling, and shipping defective products to CAMPBELL SCIENTIFIC, INC. CAMPBELL SCIENTIFIC, INC. will return such products by surface carrier prepaid. This warranty shall not apply to any CAMPBELL SCIENTIFIC, INC. products which have been subjected to modification, misuse, neglect, accidents of nature, or shipping damage. This warranty is in lieu of all other warranties, expressed or implied, including warranties of merchantability or fitness for a particular purpose. CAMPBELL SCIENTIFIC, INC. is not liable for special, indirect, incidental, or consequential damages. Products may not be returned without prior authorization. The following contact information is for US and International customers residing in countries served by Campbell Scientific, Inc. directly. Affiliate companies handle repairs for customers within their territories. Please visit www.campbellsci.com to determine which Campbell Scientific company serves your country. To obtain a Returned Materials Authorization (RMA), contact CAMPBELL SCIENTIFIC, INC., phone (435) 753-2342. After an applications engineer determines the nature of the problem, an RMA number will be issued. Please write this number clearly on the outside of the shipping container. CAMPBELL SCIENTIFIC's shipping address is: CAMPBELL SCIENTIFIC, INC. RMA#_____ 815 West 1800 North Logan, Utah 84321-1784 CAMPBELL SCIENTIFIC, INC. does not accept collect calls. HydroSense Table of Contents PDF viewers note: These page numbers refer to the printed version of this document. Use the Adobe Acrobat® bookmarks tab for links to specific sections. 1. General Description....................................................1 1.1 Introduction...............................................................................................1 1.2 HydroSense Modes ...................................................................................2 2. Specifications .............................................................2 3. Unpacking and Setup .................................................3 4. Water Content Measurement Mode ...........................4 4.1 4.2 4.3 4.4 4.5 4.6 Introduction...............................................................................................4 Display Information ..................................................................................4 Description of Water Content Measurement Mode ..................................5 Selecting Probe Rod Length .....................................................................5 Measuring Volumetric Water Content ......................................................6 Measurements in Special Materials...........................................................6 5. Water Deficit Mode......................................................6 5.1 5.2 5.3 5.4 Description of Water Deficit Mode ..........................................................6 Display Information ..................................................................................6 Calibration—Setting the Lower and Upper Reference Levels ..................7 A Water Deficit Mode Example ...............................................................8 6. Proper Measurement Technique and Method Limitations ...............................................................9 6.1 Probe Rod Insertion ................................................................................10 6.2 Soil Factors Which Can Affect the Measurement—Clay, Soil Electrical Conductivity, Organic Matter and Rocks ...........................10 6.3 Rod Length and Insertion Angle .............................................................11 6.4 Interpreting Measurement Results ..........................................................11 7. Description of HydroSense Measurement Method.11 8. Maintenance ..............................................................13 8.1 Replacing Battery....................................................................................13 8.2 Rod Installation/Replacement .................................................................13 i HydroSense Table of Contents A. Definition of Water Content Terms ....................... A-1 A.1 Definition of Water Content Terms..................................................... A-1 B. How Many Soil Water Content Measurements Are Enough .......................................................... B-1 B.1 B.2 B.3 B.4 Introduction to Spatial Variability ....................................................... B-1 An Example ......................................................................................... B-1 Some Background on Confidence Intervals......................................... B-1 Determining the Minimum Number of Samples .................................. B-2 1-1 4-1 5-1 5-2 5-3 8-1 HydroSense display unit and probe with 12 cm rods ............................... 1 Selecting probe rod length ....................................................................... 5 HydroSense display in Water Deficit Mode ............................................ 7 Selecting the site, lower (0) and upper (100) reference levels ................. 8 Relative water content and deficit for example application ..................... 9 Rear view of the HydroSense display unit with battery cover removed. 13 Figures Tables B.2-1 Sample Water Content Data ............................................................. B-1 ii HydroSense 1. General Description FIGURE 1-1. HydroSense display unit and probe with 12 cm rods. 1.1 Introduction The HydroSense Soil Water Content Measurement System provides a simple and portable means to measure soil water content. Two modes of operation allow the display of volumetric water content in percent or relative water content based on lower and upper reference values chosen by the user. The relative water content is complemented by deficit values showing how much water is required to bring water content to the upper reference value. The combined probe and display weight is approximately 600 gm (1.3 lb). Two alkaline AAA batteries in the handheld display provide enough power for several thousand readings. A measurement is made by fully inserting the probe rods into the soil and pressing a READ button and takes less than one-half second. To save power, HydroSense automatically goes into sleep mode after approximately two minutes of inactivity. 1 HydroSense 1.2 HydroSense Modes The Water Content Measurement Mode displays the measurement result as percent volumetric water content and shows the period of the probe output in milliseconds. In the Water Deficit Mode, HydroSense measurements are taken at lower and upper water contents chosen by the user and stored in memory as reference values. The reference values are then applied to subsequent measurements to determine the amount of water that must be added to bring the soil to the upper water content. The relative water content based on the reference values is also displayed. See sections 4 and 5 for detailed operating information. 2. Specifications HydroSense Display Unit Measurement % Volumetric Water Content Resolution 1.0% Environmental Splash resistant Display 16 character, 2 line LCD Keypad Two button membrane keypad Power 2 x AAA 1.5V DC alkaline batteries Current Consumption Sleep Idle Measurement Battery Life Approximately 12 months Dimensions 120 (w) x 73 (d) x 24 (h) mm Weight 166 gm <50µA 1.5mA 70mA CS620 Water Content Reflectometer 2 Accuracy +/- 3.0% volumetric water content with electrical conductivity <2 dS m-1. Range 0% to saturation* Stabilization time Instantaneous Response time < 50 milliseconds Power requirement 100 milliamps at 5 ±0.03 volts Output Square wave with +/- 2.5V DC amplitude Dimensions Head 105 x 70 x 18 mm Rods 120 or 200 mm length , 5 mm diameter, 32 mm spacing HydroSense Weight approx 400 gm Cable Spiral cable, 200cm extended. *saturation is typically around 50% volumetric water content 3. Unpacking and Setup CAUTION • Remove the protective strip from the display window. • Screw the rods into the probe threaded inserts to finger tight, use pliers to apply a small force and give a snug fit. Threads should be clean before rods are screwed into probe. (see Section 8.2). • Connect the probe to the display unit by mating the coiled cable connector to the connector on the display unit. The connector is a push-pull type and can be damaged if twisted while connecting or disconnecting. • The READ button is used 1) to power-up HydroSense, 2) to make a measurement, 3) and in combination with the MENU button to select options. READ ENTER Press the READ button and check that HydroSense is in Water Content Measurement Mode. The display should be similar to the following graphic but may have different numerical values. VWC Period 0% P12cm 0.77ms • An NC after VWC indicates the probe is not properly connected. • If it is necessary to change operating modes, the HydroSense must be in sleep mode (no display). The unit automatically goes into sleep mode after approximately two minutes of inactivity. To change modes, press and hold the MENU button then press the READ button. Release both buttons. Unless the mode is changed again, HydroSense will be in Water Content Measurement Mode when READ is next pressed to wake the unit. • While holding the probes so rods are in free air, press READ. The VWC displayed should be between -3% and 3%. 3 HydroSense VWC Period MENU SELECT • 0% P12cm 0.77ms In Water Content Measurement Mode, MENU is used to select the rod length. In the Water Deficit Mode, MENU is used to select the site number and to store reference water content values. To save power, HydroSense automatically goes into sleep mode after approximately two minutes of inactivity. Pressing the READ button wakes the unit and makes a measurement. 4. Water Content Measurement Mode 4.1 Introduction The Water Content Measurement Mode displays the measurement result as percent volumetric water content and also shows the period of the probe output in milliseconds. The HydroSense operating system applies standard calibrations to convert the probe response to volumetric water content. The calibrations were derived from laboratory measurements in typical agronomic soils. Section 6.2 discusses the soil factors which can affect probe response such that standard calibrations do not work well. 4.2 Display Information Volumetric Water Content VWC Period Probe Rod Length 22% P12cm 0.93ms Probe Output Period The two-line display provides the following information 1) The volumetric water content in percent (VWC). See Appendix A for definition of water content. 2) Which probe rod length is selected (see Section 4.4 for rod length selection). 3) The period of the square wave output from the probe in milliseconds. 4 HydroSense 4.3 Description of Water Content Measurement Mode The Water Content Measurement Mode applies calibration coefficients to the output of the probe to give volumetric water content in percent. The calibration coefficients reside in the operating system and were determined by the manufacturer. The calibration was derived from laboratory measurements in typical agronomic soils. See Section 6.2 for discussion of HydroSense use in high salinity, high clay or other atypical materials. 4.4 Selecting Probe Rod Length VWC Period 22% P12cm 0.93ms MENU SELECT READ ENTER Probe Exit MENU SELECT Probe 12cm MENU SELECT Probe 20cm MENU SELECT FIGURE 4-1. Selecting probe rod length 5 HydroSense 4.5 Measuring Volumetric Water Content To measure volumetric water content fully insert probe rods and press READ. The correct rod length must be selected so the HydroSense display unit applies the correct calibration to convert the probe output to water content. 4.6 Measurements in Special Materials The HydroSense was principally designed for use in agricultural soils, but the technology underlying the instrument supports many potential applications. Soils with characteristics as described in Section 6.2 and many other porous media can also be monitored with HydroSense using the period value presented in the display. The period is directly related to the dielectric permittivity of the material surrounding the probe rods and can be used as a relative value to monitor changes in the material of interest. As water content increases so does period. If actual water content values are needed, a calibration can be performed using an independent measurement of the water content. A calibration equation can then be derived using curve fitting methods to relate the independently measured water contents to the probe output periods. 5. Water Deficit Mode 5.1 Description of Water Deficit Mode To use the Water Deficit Mode, a lower reference level and an upper reference level must be chosen and a HydroSense reading taken at each level and stored in memory (see Section 5.4 for calibration). Measurements taken after reference levels are stored will display the relative water content and the amount of water in millimeters which must be added to bring the water content to the same value as the upper reference level. The relative water content is a value between 0 and 100 with 0 corresponding to the lower reference level and 100 the upper level. Upper and lower reference levels can be stored in HydroSense for up to 5 sites. A typical application of the Water Deficit Mode is irrigation scheduling. The lower reference level might correspond to the lowest water content that would be allowed for a particular crop and the upper level the point where irrigation would be ceased. 5.2 Display Information The two-line display provides the following information 1) The relative water content (RWC) 2) Which site reference level is selected 3) The water deficit for 12 and 20 cm profiles 6 HydroSense Relative Water Content Site Currently Selected RWC 33 Deficit mm 34 Deficit 12 cm Probe Site 1 20 Deficit 20 cm Probe FIGURE 5-1. HydroSense display in Water Deficit Mode 5.3 Calibration—Setting the Lower and Upper Reference Levels Lower and upper reference levels must be set to use the HydroSense in the Water Deficit Mode. HydroSense measurements are used to set the reference levels for a particular site. Once the reference levels are stored in the HydroSense, further measurements provide a relative water content and a water deficit value. The water deficit is the amount of water which must be added to bring the soil water content to the upper reference level. The water deficit calculation applies to a soil depth equal to the probe rod length, i.e. 12 or 20 cm. Knowledge of the particular soil allows extrapolation for other depths. For example, if the soil profile is known to be homogeneous in the surface 30 cm, a water deficit calculation of 15 mm using 20 cm rods can be multiplied by the ratio of extrapolated depth (30 cm) to rod length (20 cm) to give a corrected deficit value of 22.5 mm . Figure 5-2 presents the button sequence to set the lower (0) and upper (100) reference levels for any of 5 separate sites. The 0 and 100 values are stored in memory by taking a HydroSense measurement in the soil which is at a water content corresponding to the desired 0 and 100 values. 7 HydroSense WC Deficit 33 34 Site1 20 Press ENTER to store Cal 0 or Cal 100 readings or to exit the selection routine. MENU SELECT Cal 0 Site Exit READ ENTER MENU SELECT READ ENTER Press Select until desired Site is selected MENU SELECT Cal 100 Site 1 MENU SELECT MENU SELECT Site 2..5 READ ENTER Cal Exit Press Enter to select Site Note: To enter reference values for a site, the site must be selected once to enter a Cal 0 value and again to enter a Cal 100 value. FIGURE 5-2. Selecting the site, lower (0) and upper (100) reference levels CAUTION When using the Water Deficit Mode, the same rod length must be used for measurement as was used during calibration of the reference levels. 5.4 A Water Deficit Mode Example Consider an application where the HydroSense is used to help make irrigation decisions for a crop. It is known that unacceptable plant stress occurs at water contents less than 15% and excessive water drains from the plant root zone when water content is greater than 30%. The 15% is chosen for the lower reference level and the 30% for the upper reference level. The actual water content values may be less important than the agronomist’s knowledge of soil water conditions for a particular crop. With the water content at the lower reference level, a measurement is taken with the HydroSense after the site number is selected and while the CAL 0 8 HydroSense prompt is displayed. With CAL 0 displayed, the probe rods are inserted and the READ button is pressed. This stores the measured value in HydroSense memory as the lower reference level for the chosen site. After irrigating to the desired upper reference level, the HydroSense is set to CAL 100 and a measurement taken by inserting the probe rods and pressing READ. This value is stored as the upper reference level for the chosen site. HydroSense is now calibrated for the chosen site. relative water content water deficit 30 25 80 20 60 15 40 10 20 water deficit (mm) relative water content 100 5 0 0 10 15 20 25 30 35 volumetric water content (%) FIGURE 5-3. Relative water content and deficit for example application Figure 5-3 presents the relationship between relative water content and water deficit for the chosen reference levels. A measurement taken at this site when water content is 20% would give a relative water content (RWC) value of approximately 33% and a water deficit value of 20 mm. Adding 20 mm of water would bring the water content to 30% for a soil depth equal to the probe rod length. 6. Proper Measurement Technique and Method Limitations Detailed instructions for making measurements with HydroSense are given in Sections 4 and 5 and are specific for the Water Deficit Mode and Water Content Measurement Mode. The following information applies to HydroSense measurements in general and provides operational information that will optimize measurement quality. 9 HydroSense 6.1 Probe Rod Insertion Making a measurement with HydroSense is a simple matter of inserting the probe rods and pressing the READ button. However, the accuracy of the measurement can be degraded if the rods are inserted incorrectly. The rods must be completely inserted. If the probe rods are not fully inserted and air instead of soil occupies the space around the rods, a portion of the sensitive volume is not occupied by the medium intended to be measured and error will result. Additionally, if the rods are inserted closer than 3 cm from a material other than the soil being measured, e.g. the wall of a container, error can result. The most sensitive region for the measurement is that region immediately adjacent to the rod surface. Sensitivity decreases with distance away from the rod surface. It is important to push the probe so rods insert in a straight path with minimum sideways motion to prevent establishing an air void around the rod. During insertion, contact of probe rods with consolidated material such as rock can cause deflection and possibly bend the rods. Bent rods should be replaced as soon as possible because continued bending can lead to breakage at the point where the rod threads into the probe body making repair difficult. See Section 8.2 for replacement instructions. The 12 cm rods are less likely to bend than 20 cm rods. CAUTION If rods become loose in probe body threading, bending of the rods near the thread is more likely than if the rods are properly tightened. Please see maintenance Section 8.2. 6.2 Soil Factors Which Can Affect the Measurement—Clay, Soil Electrical Conductivity, Organic Matter and Rocks HydroSense is very sensitive to changes in dielectric permittivity and the probe has water content measurement resolution better than 0.1%. While the HydroSense is predominantly sensitive to dielectric permittivity (and consequently volumetric water content), other physical properties of the soil can affect the measurement. If the soil contains a large amount of clay or has high electrical conductivity (EC), the applied signal can be attenuated and this affects detection of the reflected signal in the probe electronics. Very high organic matter content has a similar effect. HydroSense will still respond to changes in water content but not the same as if the attenuation factors were present in small, noninterfering amounts. The calibration coefficients used to transform the probe output signal to water content or deficit reside in the HydroSense operating system and were determined in laboratory studies on typical soils. User determined coefficients can be applied to the probe output period value that is displayed in the Water Content Measurement Mode. Rocky soils can make rod insertion difficult (see Section 6.1) and introduce variability in water content measurements taken in the same general area. The rocks occupy space otherwise occupied by the fine soil fraction but do not hold water in the same manner as soil. If two proximal measurements are made in a 10 HydroSense rocky soil, the measured water content can differ by several percent if a large rock occupies part of the sensitive volume of one measurement but not the other. 6.3 Rod Length and Insertion Angle Rods for the HydroSense probe are available in 12 and 20 cm length. There is no significant difference in performance between rod lengths and the choice of length depends on the application. Threaded inserts on the probe body allow easy replacement of damaged rods (see Section 8.2) or use of different length rods. Bent rods should be replaced immediately since unparallel rods can introduce error and more bending can lead to breaking. Spare/ replacement rods are available from Campbell Scientific. See Table 1 of Section 8.2. Since the water content is averaged over the length of the rod, the reading from a probe with 20 cm rods inserted vertically into the soil surface will be the average value for the surface 20 cm of soil. Probe rods can be inserted at an angle. For example, 20 cm rods inserted at a 30 degree angle to the surface will provide average water content in the top 10 cm. 6.4 Interpreting Measurement Results It is important to recognize some intrinsic soil properties and understand how these properties affect water content distribution and the measurement of water content. One such property is the spatial variability of the water content, i.e., the difference in actual water content in proximal locations which are apparently similar. The water contents in two locations which are only tens of centimeters apart can differ by several percent. The scale of the measurement using a device such as the HydroSense must be considered in relation to the scale of the field or plot being monitored. The sensitive volume of the HydroSense measurement covers the length of the rods and extends out radially from the rod surface about 3 cm. The shape is approximately elliptical extended over the rod length. The total volume is approximately 650 cubic centimeters for 12 cm rods and 1100 cubic centimeters for 20 cm rods. Soil is not necessarily a homogeneous medium on the scale of most soil water content measurement methods. Soil features such as cracks, rocks, pore size distribution, plant roots and texture layers are not always distributed evenly throughout a measured profile. If the water content over a large area such as a cropped field is to be determined, either a measurement method must be used which is sensitive on a very large scale or several measurements can be taken with a device such as the HydroSense and an average value used. See Appendix B for a discussion of statistical methods that can be applied to optimize measurement quality. 7. Description of HydroSense Measurement Method The HydroSense uses the soil physical property dielectric permittivity to estimate the volumetric water content. The dielectric permittivity of liquid water is more than one order of magnitude greater than other soil constituents 11 HydroSense making it possible to relate water content to measured dielectric permittivity. Additionally, water and air are the only soil constituents that change with time. The electronics embedded in the probe body generate the high frequency electromagnetic energy necessary to polarize water molecules to the extent needed to measure the dielectric permittivity. The travel time of electromagnetic energy along a waveguide is dependent on the dielectric permittivity. The probe rods act as a waveguide and the applied signal travels to the end of the rods and reverses the direction of travel. Electronics encapsulated in the probe head both generate the applied signal and sense the return. The measurement reflects the average water content over the length of the rods. The high frequency signals are transformed to a square wave output with a frequency proportional to the water content. The HydroSense display unit converts the output of the probe to a readout which gives information about volumetric water content. The display output can be configured to display volumetric water content or a deficit value derived from the present measured value and reference levels previously determined. The HydroSense is operated in the Water Content Measurement Mode or the Water Deficit Mode. The mode is easily changed by holding down the MENU button while pressing the READ button when the HydroSense is in the sleep mode. The HydroSense automatically goes into sleep mode if either of the buttons are not pressed for about 2 minutes. Pressing only the READ button starts HydroSense in the last mode selected. The Water Content Measurement Mode applies calibration coefficients to the output of the probe to give volumetric water content in percent. The calibration coefficients reside in the operating system and were determined by the manufacturer. The amount of pore space in a typical soil is about 50%. The pore space can be occupied by water in liquid or vapor phase or by air. The other 50% of the soil is the solid portion. If the soil is saturated, that is, all the pore space is filled with water, the water content is 50%. Volumetric water content is defined as the volume of water per volume of soil. In the Water Deficit Mode upper and lower reference measurement levels are combined with the present measurement to provide relative water content information and the amount of water that must be added to bring the water content back to the upper reference value. Reference levels for up to 5 sites can be stored in the HydroSense. Use of this mode requires the user take measurements with the HydroSense when the soil is at the chosen upper and lower reference levels and store the value. The reference levels might correspond to the minimum desired water content for a crop and the water content desired after irrigation. A value of 50 indicates the actual water content is halfway between the reference levels and the value will be 100 after an irrigation to the upper reference value. 12 HydroSense 8. Maintenance 8.1 Replacing Battery FIGURE 8-1. Rear view of the HydroSense display unit with battery cover removed The only user-replaceable components in the HydroSense display unit are the two 1.5 volt AAA batteries used to power the unit. Under normal use, battery life should be well in excess of 1 year. When the batteries require replacement, a small battery symbol will appear on the bottom right hand corner of the display. It is recommended that high quality, long-life alkaline batteries be used. To replace the batteries, remove the two silver screws from the back of the HydroSense display, remove and replace the batteries, making sure that the positive end of each battery is inserted into the end of the battery holder with the RED polarizing washers. It is important that batteries are not reversed during replacement as damage to the unit can occur. Do not remove the red polarizing washers. Replace the cover plate and silver screws. Calibration settings will NOT be lost when batteries are replaced. 8.2 Rod Installation/Replacement Threaded inserts in the probe epoxy body allow user replacement of the 12 and 20 cm rods. Using rods of different length increases the versatility of HydroSense. Additionally, if the probe rods are accidentally bent, simple replacement using spare rods prevents instrument downtime. The rods have a disc-shape collar at the base of the unthreaded portion of the rod. This collar distributes lateral forces over a relatively large area and reduces rod bending/deformation during probe rod insertion for measurements. The rods must be fully inserted into the threaded inserts of the probe with the collar in full contact with the probe body threaded inserts. 13 HydroSense The friction between the rod collar and the insert surface along with thread friction will generally provide good rod attachment and loosening is unlikely. If rod loosening does occur, a thread coating compound can be used to enhance friction. There are two thread compounds that laboratory testing indicates minimal effect on the HydroSense measurement. A package with Loctite 222MS THREADLOCKER is included with each CS620 probe. There is enough thread coating to treat several rods. The compound should be used sparingly as a thick coating will cause slightly higher measured water content values. Another product that works well is Vibra-Tite by ND Industries. This compound has a higher viscosity than most thread coatings and a narrow strip is painted on the threads. The applied compound must cure aerobically before the rods are threaded into the probe inserts. The cured compound is a resilient plastic which is reusable several times. It is important that the rod threads are not completely coated because this can affect response of the probe. Replacement of the rods is a simple matter of screwing the threaded end of each rod into the insert of the probe body with attention to the following details. 14 • Threads should be clean before rod attachment. • After screwing the rods into the probe threaded inserts to finger tight, use pliers to apply a small force and give a snug fit. • Full contact between the rod collar and probe body is required for proper operation. Appendix A. Definition of Water Content Terms A.1 Definition of Water Content Terms Soil water content is expressed on a gravimetric or volumetric basis. Gravimetric water content (θg) is the mass of water per mass of dry soil. It is measured by weighing a soil sample (mwet), drying the sample to remove the water, then weighing the dried soil (mdry). θg = m water m wet − m dry = m soil m dry Volumetric water content (θv) is the volume of liquid water per volume of soil. Volume is the ratio of mass to density (ρ) which gives m water θ g ∗ ρsoil volume water ρ = water = θv = . m volume soil ρ water soil ρsoil Soil bulk density (ρbulk) is used for ρsoil and is the ratio of soil dry mass to sample volume. The density of water, ρwater, is close to 1 and is often ignored. Another useful property, soil porosity, (ε) is related to soil bulk density as shown by the following expression. ε = 1− ρbulk ρsolid The term ρsolid is the density of the soil solid fraction and is well approximated by the value 2.6 g cm-3. A simple data set is given here as an example. A sample of known volume was weighed before and after oven drying at 105°C for 24 hours. mwet 94 g mdry 78 g sample volume 60 cm3 θg = m water m soil ρbulk = = 94 g − 78 g = 0.205 g g−1 78 g m dry volume = 78 g 60 cm 3 . g cm − 3 = 13 A-1 Appendix A. Definition of Water Content Terms θv = ε = 1− θ g ∗ ρsoil ρ water = 0.267 cm 3 cm − 3 ρbulk 13 . g cm −3 = 1− = 0.50 ρsolid 2.6 g cm − 3 The porosity of 0.50 defines the maximum possible volumetric water content. The measured θv value of 0.267 indicates the pore space is just over half-full of water. If the sample is from a 20 cm depth profile, there are 5.3 cm of water in the profile. Water content indicates how much water is present in the soil. It can be used to estimate the amount of stored water in a profile or how much irrigation is required to reach a desired soil wetness. A-2 Appendix B. How Many Soil Water Content Measurements Are Enough B.1 Introduction to Spatial Variability Soil water content can vary significantly among several locations which are near each other and apparently similar. Water content measurements using the most accurate methods available provide evidence of significant differences in soil structure and texture even when the measurements are limited to an area of only 1 square meter. The degree of variability is dependent on many factors including presence of coarse fragments (rocks), micro and macro-fauna activity, erosion, management practice, and plant root activity. The difference in soil physical properties from location to location and the subsequent difference in soil water characteristics is commonly referred to as spatial variability of soil hydraulic properties. Any characterization of an area that will be used to manage or inventory water resources in that area must account for this variability. It would not be prudent to schedule irrigation of a cropped field based on a single measurement. Basic statistical methods are easily applied to define how many measurements are needed to provide a specific level of confidence that the area of interest has been adequately characterized. This section of the appendix will demonstrate this statistical approach. B.2 An Example As an example, the results of 12 volumetric water content measurements taken within a 2 meter radius on a well established and level lawn are presented. (The measurements were not taken with a HydroSense.) TABLE B.2-1. Sample Water Content Data 10.7 7.4 12.7 12.5 mean 11.9 11.9 12.5 12.1 14.0 stdev 1.74 13.4 12.5 10.2 12.5 range 6.6 B.3 Some Background on Confidence Intervals Statistical approaches are based on probability theory. A confidence interval is a different way to express probability. Consider measuring the water content at many different locations in a volume of soil. The measurements will differ in value but will be distributed about a mean value. If another measurement is then taken, the probability can be calculated that this measurement will fall within a specified interval which lies below and above the mean value. Conversely, given a probability value, a water content range can be calculated into which the measured value is likely to fall. The sum of the amounts below and above the mean value is referred to as the confidence interval. The confidence interval becomes smaller as the probability increases. B-1 Appendix B. How Many Soil Water Content Measurements Are Enough The relationship between confidence interval and probability can be described using the following expressions. µ −k σ n < x<µ+k σ n [1] with µ the actual population mean, σ the actual population standard deviation and n the number of values used to calculate the mean, x . The confidence coefficient, k, is used to specify a probability value. A probability of 90% or 0.9 could be specified and [1] would then define the range below and above the mean which is the confidence interval. The probability is 90% that a measured mean will fall within the defined interval. x−k σ n < µ < x+k σ n [2] Equation 2 is algebraically identical to Equation 1, but the rearranged form now describes the likelihood that an interval will bracket the actual population mean. The difference is subtle but important. Equation 2 is based on theory which assumes the actual population mean and standard deviation are known. Actual values are seldom known. If the values were known there would be no reason to measure them. Assuming a normal distribution, correcting for the fact that the actual population standard deviation, σ, must be estimated from measurements, and applying the theory of the Student's t-distribution, equation 2 becomes x− t s n <µ < x+ t s n [3] with s the estimate of σ based on the measurements and t the value obtained from a table of Student's t -values. Using the Student's t-distribution corrects the normal distribution for number of measurements taken or degrees of freedom. Consider the data presented in Section B.2. If a probability value of 0.90 is chosen as acceptable, equation 3 can be used to define the confidence interval. For this data, the mean is 11.9 and the standard deviation is 1.74. With 11 degrees of freedom, the Student's t value is 2.201. The calculated confidence interval is 10.76,12.97. In summary, there is a 90% probability that the mean water content lies in the water content range from 10.76% to 12.97% B.4 Determining the Minimum Number of Samples Knowing the confidence interval and the sample mean and standard deviation, equation 4 can be used to determine the minimum number of randomly taken measurements. N= B-2 4t 2s2 L2 [4] Appendix B. How Many Soil Water Content Measurements Are Enough N is the number of water content measurements and L is the acceptable range as defined by the user. For example, the acceptable water content range might be ±2.5% so L would be 5.0. Equation 4 relies on a good estimate of the population standard deviation. A useful approach using these statistical methods is to establish an estimate of the standard deviation by taking several water content measurements, then use that standard deviation estimate and the associated t value in [4]. The range is specified by the user and the calculated N value defines the number of measurements. The same s and t values are used, but the number of measurements can be determined for several different ranges. N= 4 t 2s2 L2 = 4 ⋅ (2.201) 2 ⋅ (174 . )2 5.0 2 = 2.35 The calculation of N using the sample standard deviation shows that 3 measurements are required to give a 90% probability that the sample mean gives the desired ±2.5%. B-3 Appendix B. How Many Soil Water Content Measurements Are Enough This is a blank page. B-4 This is a blank page. Campbell Scientific Companies Campbell Scientific, Inc. (CSI) 815 West 1800 North Logan, Utah 84321 UNITED STATES www.campbellsci.com [email protected] Campbell Scientific Africa Pty. Ltd. (CSAf) PO Box 2450 Somerset West 7129 SOUTH AFRICA www.csafrica.co.za [email protected] Campbell Scientific Australia Pty. Ltd. (CSA) PO Box 444 Thuringowa Central QLD 4812 AUSTRALIA www.campbellsci.com.au [email protected] Campbell Scientific do Brazil Ltda. (CSB) Rua Luisa Crapsi Orsi, 15 Butantã CEP: 005543-000 São Paulo SP BRAZIL www.campbellsci.com.br [email protected] Campbell Scientific Canada Corp. (CSC) 11564 - 149th Street NW Edmonton, Alberta T5M 1W7 CANADA www.campbellsci.ca [email protected] Campbell Scientific Ltd. (CSL) Campbell Park 80 Hathern Road Shepshed, Loughborough LE12 9GX UNITED KINGDOM www.campbellsci.co.uk [email protected] Campbell Scientific Ltd. (France) Miniparc du Verger - Bat. H 1, rue de Terre Neuve - Les Ulis 91967 COURTABOEUF CEDEX FRANCE www.campbellsci.fr [email protected] Campbell Scientific Spain, S. L. Psg. Font 14, local 8 08013 Barcelona SPAIN www.campbellsci.es [email protected] Please visit www.campbellsci.com to obtain contact information for your local US or International representative.


![Expanding Grain Model [EGM v1.0] - Illinois Institute of Technology](http://vs1.manualzilla.com/store/data/005895685_1-bff858b86f7bc344864531d7e5f7cd87-150x150.png)