1
HelpAndManual_unregistered_evaluation_copy
VQMA4
Video Analyzer and Video Scope
Software Tool
Version 4.1.2
User Manual
HelpAndManual_unregistered_evaluation_copy
VQMA4
Video Quality Measurement and Analysis Software
by VideoQ Inc
Software Video Analyzer to measure the quality of captured and
streamed video.
Ideal tool for development labs, software developers and high
volume manufacturing instantly revealing your video camera or
other video device performance.
HelpAndManual_unregistered_evaluation_copy
VQMA User Manual
© 2005-2014 by VideoQ Inc, all rights reserved
All rights reserved. No parts of this work may be reproduced in any form or by any means - graphic, electronic, or
mechanical, including photocopying, recording, taping, or information storage and retrieval systems - without the
written permission of the publisher. VideoQ and VQMA are registered trademarks of VideoQ, Inc. VQMA test pattern
and analysis algorithms are also protected by patents.
Products that are referred to in this document may be either trademarks and/or registered trademarks of the
respective owners. The publisher and the author make no claim to these trademarks.
While every precaution has been taken in the preparation of this document, the publisher and the author assume no
responsibility for errors or omissions, or for damages resulting from the use of information contained in this
document or from the use of programs and source code that may accompany it. In no event shall the publisher and
the author be liable for any loss of profit or any other commercial damage caused or alleged to have been caused
directly or indirectly by this document.
Author: Victor Steinberg
Printed: December 2014 in Sunnyvale, California, USA
Special thanks to:
All colleagues at VideoQ, who contibuted to this product development
Revision History
Revision
Date
Description
3.1.6
2013, June
Last Release of VQMA-3
4.1.1
2013, July
Release
4.1.2
2014, October
Release
VQMA User Manual
Table of Contents
1 Introduction
.............................................................................................................. 2
2 Supported
file formats
..............................................................................................................
5
3 VQMA
Test Pattern: File and/or Reflectance Chart
..............................................................................................................
6
4 Software
Installation and Test Setup
..............................................................................................................
9
5 Testing
Cameras with VQMA Reflectance Chart
..............................................................................................................
10
6 Capturing
Video Data File and running Test Sessions
..............................................................................................................
11
7 Running
VQMA in Windows GUI mode
..............................................................................................................
13
7.1 Menu -.......................................................................................................................
14
File
7.2 Menu -.......................................................................................................................
YUV Frame Size
16
7.3 Menu -.......................................................................................................................
17
Color Space
7.4 Menu -.......................................................................................................................
18
View Page #
7.4.1 Viewing
.................................................................................................................................................
Test Result Pages
19
7.4.2 Test
.................................................................................................................................................
Summary page
21
7.4.3 Geometry,
.................................................................................................................................................
Focus, Shading page
23
7.4.4 Colors,
.................................................................................................................................................
Levels. Gamma, RGB Balance page
26
7.4.5 Frequency
.................................................................................................................................................
Response page
29
7.4.6 K-rating,
.................................................................................................................................................
UV vs Y Gain page
31
7.4.7 Noise
.................................................................................................................................................
Measurement page
32
7.4.8 YUV/RGB
.................................................................................................................................................
Scope page
35
Scope
.........................................................................................................................................................
View menu
Scope
.........................................................................................................................................................
Line menu
Scope
.........................................................................................................................................................
Averaging Filter menu
Line
.........................................................................................................................................................
Select Control Panel
37
38
39
40
7.5 Menu -.......................................................................................................................
41
Help
7.5.1 About
.................................................................................................................................................
VQMA program
41
7.5.2 Short
.................................................................................................................................................
Guide
42
8 Test..............................................................................................................
results presentation in Short Report
43
9 Customization
and editing of INI Files
..............................................................................................................
46
10 Running
VQMA in Command Line Mode
..............................................................................................................
49
10.1 Command
.......................................................................................................................
line parameters
49
11 Terms
and Abbreviations
..............................................................................................................
51
© 2005-2014 by VideoQ Inc, all rights reserved
VQMA User Manual
1
Introduction
2
Introduction
VQMA is a self-contained software solution allowing manual or automated measurement of the
performance of video cameras, video processors and/or video capture devices in a PC running
WindowsTM OS. Used in cascade with high quality capture device VQMA can measure the quality
of the incoming video signal, such as 3G-SDI/HD-SDI, DVI/HDMI/DP/LVDS or analog YPrPb.
System Requirements:
· Windows XP, Vista, 7 or 8 - 32 bit or 64 bit versions
· About 2 MB of disk space
VQMA measures and display the following parameters:
·
·
·
·
·
·
·
·
Picture Geometry (Position, Scale, Rotation, Keystone), 4 Corners Focus, H & V Shading
Black and White levels, Gamma value and RGB Balance Errors on Grayscale pattern
YUV and RGB Levels on Color Bars and Errors vs. reference values
Frequency Response on fixed range of multi-burst frequencies
K-rating on 2T pulse
Y vs.UV Gain (Color Saturation) on 20T pulse
Weighted and Unweighted SNR for Y and UV, Noise Spectrum and Histograms Display
Total Video and Selected Line YUV/RGB waveform display (Scope) in a variety of formats
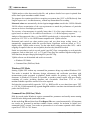
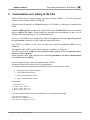
A source of special Matrix Test Pattern - VQMA-C Optical Test Chart or VQMA Test Signal
Generator/Player - should be presented at the input(s) of camera or any other device under test and
the resulting video data should be acquired via decoder and/or capture device as shown on the
diagram below.
Captured test pattern video data should be stored on fast access media, e.g. HDD, in a file of
suitable format, i.e. *.YUV file or *.BMP containing single video frame or at least 8 consecutive
video frames in uncompressed UYVY, YUV2 or RGB format with native 4:2:2 or 4:4:4
resolution from minimum 192 x 108 to maximum 4096 x 3072.
© 2005-2014 by VideoQ Inc, all rights reserved
3
VQMA User Manual
Introduction
VQMA analyzes video data stored in this file, and produces detailed test report in printed form
and/or short report in machine-readable format.
The program also contains special driver acquiring test pattern data (YUV or RGB) directly from
Unigraf capture card - via shared memory, without any intermediate file recording.
Measured values are automatically checked against target values stored in the .INI file. Editable
.INI file allows customization of the test requirements to match the performance of particular
cameras or devices of multiple types/models.
The accuracy of measurements is typically better than 1/10 of the target tolerance range, e.g.
typical errors are about 0.5% for video levels and about +/- 0.1 dB for frequency response.
Analysis of decompressed video, e.g. after MPEG encode-decode, is also possible, but the output
must be in 4:2:2 YUV or 4:4:4 RGB format compatible with VQMA software.
Horizontal and vertical test chart position errors and test chart image scaling (zoom ) are
automatically compensated within the specified limits. Significant zoom-out (down to 33% )
slightly reduce VQMA results accuracy. On the other hand, scaling-up more than 105% and/or
cropping of captured video are not acceptable, therefore they should be avoided.
Partial test procedures result in several partial “pass/fail” flags corresponding to each particular
parameter, such as white level, or Y vs. UV gain. These flags are combined together using logical
AND function, thus providing a global single bit “pass/fail” flag.
VQMA software can be launched and used in two modes:
· Windows GUI Mode
· Command Line (DOS box) Mode
Windows GUI Mode
Starting VQMA.EXE without any command line parameters brings up standard Windows GUI.
This mode is intended for laboratory design, adjustments and verification procedures with
measurements results presented in graphical format suitable for printing, e.g. creating PDF
document. In Windows GUI mode it is possible to produce printed reports with more details,
containing all results, including diagrams and screenshots. Short-form .TXT or .CSV
machine-readable report files can also be saved as required.
Each time the user successfully opens the .YUV or . BMP test file or save short-form report .TXT
or .CSV file, VQMA automatically appends Log File with the event date-time information and full
path to the file involved.
Command Line (DOS box) Mode
DOS box mode (under Windows) requires command line parameters and usually means running
batch file in the background (unattended) mode.
In this mode Log File and short-form Test Report Files are created automatically. All important
test results are presented in machine readable format, suitable for inclusion in higher level
automated QA/QC systems. Test results are presented as a set of comma separated values within a
report file of .TXT or .CSV format.
© 2005-2014 by VideoQ Inc, all rights reserved
VQMA User Manual
Introduction
4
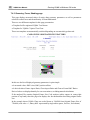
Using VQMA in multi-screen/multi-resolution environment
VQMA supports very wide range of frame sizes.
Size of BMP images is simply read from BMP header,
Size of headerless uncompressed YUV file frame(s) is either entered by user or auto-detected
from YUV file size, using built-in table of common (popular) sizes.
In any case all test pattern component positions and spatial frequencies are automatically scaled as
needed.
This allows usage of the same VQMA test pattern for IPTV, SD, HD, Ultra HD and Digital
Cinema frame sizes.
Usage of different chart sizes (within the transmitted or captured frame), and variety of aspect
ratios, provides for frequency response measurement within wide range of spatial frequencies from 100 tvl to 3,000 tvl.
For example, captured .YUV video file may contain video data arranged as 4:2:2 UYVY
("UYVY") or YUYV ("YUY2" also known as "YUV2") multiplex of 1920 pixels (2x1920 bytes),
by 1080 TV lines. If there was no scaling involved, this particular version of VQMA chart allows
frequency response measurement from 100 to 600 tvl.
By default, VQMA uses 8 bit "broadcast" quantization scale: Black_Y = 16d, White_Y = 235d,
Grey_UV = 128d, but VQMA analyzer can also automatically detect and process YUV/RGB data
in so-called "full-scale" or "high" level scheme with Black = 0d and White = 255d.
VQMA does not support automatic analysis of video quality parameters on any other test
pattern, except the original VQMA matrix test pattern.
However, it is possible to use other test patterns or any other images, e.g. full field 75% color
bars or live camera snapshot, but with limited functionality.
In this case only Noise Measurement and YUV/RGB Scope pages of VQMA display can be
used, i.e. VQMA will show measured noise parameters and also the YUV/RGB waveforms related
to the selected line of video frame.
Analysis of video files in lower resolutions formats, captured in composite video systems such as
NTSC/PAL/SECAM, is also possible with the previous VQMA versions, the latest is VQMA 2v4.
Note that legacy VQMA version v2 and current VQMA versions (v3 & v4) use different test
patterns, so they are not directly compatible.
© 2005-2014 by VideoQ Inc, all rights reserved
5
2
VQMA User Manual
Supported file formats
Supported file formats
VQMA.EXE can open any one file of three types:
*.YUV Single frame of raw YUV data, any pre-selected or specified resolution
from 192x108 to 4096x3072 pixels, without any header or wrapper,
suitable for quick video parameters check, also saving HDD space
(frame size auto-detected or set by user)
*.YUV Multiple frames of raw YUV data, format - as above,
either concatenated in one file or several single frame files
*.BMP Single frame or multiple frames, 24b (RGB) or 32b (RGBA) data, 54 bytes header,
any resolution from 192x108 to 4096x3072 pixels (auto-detected)
If the name of opened BMP or YUV file ends with "0" or "1", e.g. FRAME0.BMP, and the folder
contains at least 7 more files, e.g. *1.BMP ... *7.BMP, they are analyzed as 8 frames long video
sequence (equivalent of 8 frames long .YUV file). If any one of next seven files (*1.BMP ...
*7.BMP) is missing, then *0.BMP is analyzed as a single frame. In any case all files after *7.BMP
(*8.BMP, *9.BMP, etc) are ignored.
To provide for full and accurate measurement captured video file should contain a number of TV
frames containing uncompressed YUV or RGB data of VQMA-C test pattern and taken from
particular System Under Test Test Point. Total duration of this video sequence should be equal to
1 TV frame or at least 8 TV frames.
VQMA analyzes only first 8 frames; input files containing larger number of frames are acceptable,
but it does not improve the VQMA measurement accuracy. VQMA automatically detects Number
Of Frames and switches to the appropriate analysis mode. All video quality parameters can be
measured by relatively faster analysis of single-frame files, but with significantly lower accuracy,
especially it affects Noise Measurements.
File name extensions (.YUV or .BMP) directly control VQMA operation. All other file types and
extensions are not supported.
However, it is possible to use VQMA for video quality analysis with application to systems
processing large variety of other compressed and uncompressed video file formats, such as .TS,
.MXF, .AVI, etc. This requires appropriate front-end reference decoder, converting these specific
formats to generic YUV or BMP format. Such front-end converter(s) can be supplied on request.
Analyzed YUV/BMP files can be located on any local drive or reachable via LAN (Local Area
Network).
If it is necessary to analyze video data stored elsewhere, e.g. via WAN (Wide Area Network), it is
advisable to copy such data to local drive prior to actual analysis by VQMA tool.
© 2005-2014 by VideoQ Inc, all rights reserved
VQMA User Manual
3
VQMA Test Pattern: File and/or Reflectance Chart
6
VQMA Test Pattern: File and/or Reflectance Chart
There are two forms of VQMA test pattern supplied as standard (other formats on request):
a) Set of 4:2:2 UYVY .YUV and/or 4:4:4 RGB .BMP files in different resolutions.
These file provide the reference matrix test pattern as video source on the 3G-SDI, HD-SDI, DVI,
HDMI, DP and/or YPrPb outputs of a professional or semi-professional video play-out devices,
e.g. via media player HDMI connector.
It is possible to encode and multiplex VQMA bitmaps, thus providing custom transport stream
.TS or .M2TS files (supplied on request).
If necessary, VQMA transport stream coming out from play-out server can be further converted
into appropriate RF signal via optional external modulator.
b) Reflectance Chart for camera measurements (VQMA-C order option).
In any case system under test output should be captured by some appropriate high quality device,
e.g. Unigraf capture card.
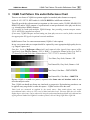
Note that levels of Reflectance Chart itself (and captured video signals from camera) differ
significantly from File Test Pattern (.YUV or .BMP), - in particular Gamma of the Gray Scale is
2.2 instead of 1.0 and Color Bars Nomenclature is 75/37.5/75/37.5 instead of 100/0/75/0.
Test Chart, Gray Scale, Gamma = 2.2
Test Pattern File, Gray Scale, Gamma = 1.0
Test Chart, Color Bars = 75/37.5/75/37.5
Test Pattern File, Color Bars = 100/0/75/0
Because VQMA is a static test pattern, captured video frame rate and interlace ratio do not
affect the analysis results.
Thus, VQMA can handle any frame rate, interlaced or progressive. De-interlacing procedures can
be applied at any stage before or after the capture - VQMA results will be the same.
Video levels are measured as supplied by the actual source. Some media players may output
non-calibrated video, with up to 25% errors of black and white levels. This may affect the test results.
Higher degree of accuracy can be achieved by using the professional hardware-based well-calibrated test
signal generator loaded with VQMA-C test matrix pattern, such as VideoQ VQS-200 or VQS-300.
© 2005-2014 by VideoQ Inc, all rights reserved
7
VQMA User Manual
VQMA Test Pattern: File and/or Reflectance Chart
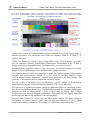
VQMA matrix consists of 6 horizontal bands (stripes) dedicated for automatic measurements of
particular parameters. For convenience these bands are numbered "Band 0" to "Band 5" in
VQMA.EXE menus.
VQMA Test Pattern also contains 4 identical Blue-White Circles. These important components
serve for automatic Geometry (Scale/Position/Tilt/Keystone) measurements; if any of them is
missing or excessively distorted the whole Test Pattern will be processed as "invalid".
Four Radial Plates with Black Crosses in each corner serve for automatic estimation of camera
Sharpness (Focus) and Shading (Vertical and Horizontal Lighting Uniformity)
First (topmost) band of VQMA test pattern serves mainly for visual assessment of monochrome
horizontal and vertical details rendition. It is also useful for revealing timebase errors,
scalers/deinterlacers/codecs performance, patterned noise, interferences and other artefacts. The
appearance of this band may differ in customized versions of VQMA.
Five lower bands of the matrix serve for simultaneous (parallel) analysis of all parameters
describing the performance of the signal transmission chain or the device under test.
The central part of VQMA matrix pattern contain two additional smaller size components, namely
Near-White Grays and Near-Black Grays. Two Shallow Ramps (dark-gray gradients and light-gray
gradients) are used for testing extreme Y levels. If these ramps are clipped, then Y Range
Overload Errors are detected, measured and displayed. White and black level clipping distortions
are also known as White Crash and Black Crash correspondingly.
Dynamic Frame Cadence Test consists of 8 static black squares and one gray square moving to
next position every frame. Because VQMA treats any inter-frame differences as "noise", frame
cadence can be visually estimated on "Noise Image" of VQMA Noise Measurement Page.
© 2005-2014 by VideoQ Inc, all rights reserved
VQMA User Manual
VQMA Test Pattern: File and/or Reflectance Chart
8
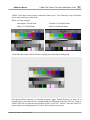
VQMA Test Pattern exists in many resolutions (frame sizes). Test Chart may occupy full frame
area or only central part of the frame.
Below are some examples:
Anamorphic 720x480 chart
Letterbox 16:9 800x450 chart
fitting 3:2 720x480 frame
within 10:6 800x480 frame
1920x1080 chart within 3840x2160 frame on light gray checkerboard background
Such layout allows extension of measured frequency range. Spatial frequency of burst #6 is
normally 600 tvl, but with reference to double height of UHD image it becomes 1200 tvl. Usage of
smaller 1280x720 test chart increases this limit to 600 x 2160/720 = 1800 tvl. Note that 1800 tvl is
closer to theoretical sampling limit of 2160 tvl, thus reducing test accuracy.
© 2005-2014 by VideoQ Inc, all rights reserved
9
4
VQMA User Manual
Software Installation and Test Setup
Software Installation and Test Setup
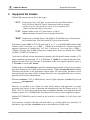
1. Install VQMA software as follows:
Create a folder on the PC hard drive, for example "c:\VQMA", and copy there the following
files:
1. VQMA.EXE
Main executable
Note that in some versions the executable file name can be shortened to VQM.EXE
2. VQMA.INI
Optional customizable configuration file
If the .INI file is not found in the program folder, then it will be created automatically by
VQMA.EXE with the default tolerance values. This happens when the video data file of the
appropriate standard is opened first time.
VQMA is a copy protected program using uniquely encrypted USB dongle, matched with the
copy of your executable as installed. This dongle must be inserted into USB port of the PC
where VQMA is installed whenever the VQMA.EXE is running. In case of loss or damage of
this USB dongle, VideoQ reserve the right to revoke the license.
Please note that when the dongle of the appropriate version is not connected, the protected
application will stop running. If you purchased multiple dongles of the same version, they are
interchangeable.
2. Present VQMA-C Test Chart before camera or provide VQMA-C Test Pattern as a signal,
stream or file to the input of device under test (DUT)
3. Run the appropriate capture/decode software to create .YUV or .BMP file(s) containing
video data
4. Open this file (or multiple BMP files) in VQMA program to measure the performance of the
device under test
Repeat steps 3 and 4 as required.
Removing VQMA software is quite simple. VQMA does not make records in Windows system
registry, except the location and type of the last opened video data file. Therefore, to remove
VQMA from the system it is enough to delete the executable file VQMA.EXE.
© 2005-2014 by VideoQ Inc, all rights reserved
VQMA User Manual
5
Testing Cameras with VQMA Reflectance Chart
10
Testing Cameras with VQMA Reflectance Chart
Ideally, camera should look straight to the center of the chart; lens axis position offset in any
direction should not exceed 5%.
Chart illumination uniformity is one of important parameters. Lux meter reading within the chart
surface should not vary more than +/- 20%.
Optimal chart-to-camera distance depends on lens specifications; typical range is from 1m to 3m.
Cameras with viewing angles up to +/-30 degrees can be tested using VideoQ standard chart
(VQMAC20, diagonal 20"); two plastic brackets attached to tripod front legs provide for good
chart fixation and adjustable tilt. Small (10") backlit portable chart is suitable for low-light cameras
testing. Ultra-wide viewing angles ("fish-eye" lenses) require much larger chart; on the right:
VQMAC3M chart fixed on the wall (diagonal size 3m).
Even small vibration of the test chart will be interpreted by VQMA as increase of camera noise
and drop-down of frequency response, so it is important to fix the chart firmly on something solid.
Same applies to camera itself - any vibration during video data capture is highly undesirable.
Fluorescent light sources are also undesirable. They produce flickering light, significantly
biasing VQMA noise analysis results.
Optimal chart illumination level depends on camera sensitivity. Typically 100 ... 400 lux is
enough. For light sources below 200 W the best incidence angle is about 45 degrees. For high
power light sources, light reflected from the ceiling or diffused by special filters could be better
option. Repeating VQMA SNR measurements for several different illumination levels, e.g. for 20,
100 and 400 lux, helps to reveal camera noise reduction capabilities.
It is highly undesirable to get noticeable reflections/glare.
Distance from light sources to the chart should be bigger than camera-to-chart distance. Good
lighting can be set up using is at least two LED panels of about 400 W, 50cmx50cm each,
positioned on the left and on the right at about 45 degrees angle each, preferably above camera
axis.
Direct light from the LED panels positioned about 50-80 cm above camera axis is reflected by
chart surface down to the floor - away from camera lens. Same is true for small (about 10 degrees)
chart tilt vs. ideal vertical axis - looking down chart directs reflections downwards.
Glare or reflections may also happen if some bright or reflective objects are behind or beside the
camera. Good practice is to put dark gray or black curtains behind and next to the camera.
© 2005-2014 by VideoQ Inc, all rights reserved
11
6
VQMA User Manual
Capturing Video Data File and running Test Sessions
Capturing Video Data File and running Test Sessions
1. Supply 3G-SDI, HD-SDI, DVI, HDMI, DP or YPrPb signal of the VQMA matrix test pattern
via device under test to the appropriate input of capture device or supply compressed stream to the
appropriate software/hardware decoder input, e.g. 3G-SDI signal via BNC cable, DVI/HDMI
signal via appropriate cable, or just a file in .TS, .YUV or .BMP format.
2. Run any capture software, software driver or Direct Show graph, available on the system, e.g.
"YUV File Writer":
2.1. The specified capture time should be equal or greater than 8 TV frames,
recommended capture duration is slightly more than 8 frames, e.g. 500 ms
Note that capturing video clip of longer duration is acceptable,
but it does not improve the accuracy of VQMA results
2.2. Select output file format, e.g. uncompressed .YUV with FOURCC code = UYVY or
YUV2, or .BMP (RGB)
2.3. Select native (full) resolution: preferably (but not mandatory) 1920 x 1080 or 1280 x 720
All this actions should be done by user prior to the measurement and analysis stage, described in
the following sections.
The process of capturing new file should be finished and file closed before the "open" ("input")
function of the VQMA program is performed.
It is possible to give the file any name of user choice and store it in any folder on any local or
network hard drive.
Note than in both GUI and Command Line modes VQMA accepts long file names with spaces.
Usage of network drives may slow down processing because of the extra bandwidth required for
copying test file data to local memory.
VQMA remembers the location of the folder with last opened file, so "File Open" dialog defaults
to this location.
Manual or automatic update of captured video data and corresponding update of test results are
possible at the rate of about 2-5 seconds – this is typical capture-plus-analysis time interval for
medium speed PC.
The update of captured data file, renaming, appending and/or overwriting of the relevant files
should be done by the user.
VQMA automatically creates and appends the Log File with fixed name:
VideoQ_VQMA_Log.TXT.
This log file is always located in the same directory as VQMA executable.
It is possible to arrange several folders, each containing separate set of VQMA.EXE, VQMA.INI,
and VideoQ_VQMA_Log.TXT files.
© 2005-2014 by VideoQ Inc, all rights reserved
VQMA User Manual
Capturing Video Data File and running Test Sessions
12
In such arrangement these folders should be treated as several completely independent analyzers
with different target values and separate log files.
In GUI Mode it is possible to launch multiple instances of the same VQMA.EXE, they will share
the log file.
It is also possible to use single copy of VQMA.EXE for sequential or parallel analysis of
multiple YUV/BMP files, applying separate target value sets stored in separate .INI files, each
INI file name matching corresponding YUV/BMP file name. For more details see "File Menu" and
"Command Line Mode" sections.
Systematic archiving of captured test files, as well as further processing of the test results, should
be organized by the user, e.g. in form of script or batch file.
If VQMA is integrated with the Unigraf capture card, then video data are captured to shared
memory and directly processed by VQMA analyzer launched from Unigraf Console Menu via
"VideoQ Export" command; there is no need to create/open .YUV or . BMP file.
Note that in case of Unigraf card, there is one important advantage: VQMA can analyze HDCP
protected links, but this comes with a restriction - no provision for saving captured video data.
VQMA tool is capable to process video test patterns others than VQMA Chart.
However, quite often, for calibration and debugging purposes, user needs just a valid display of
YUV/RGB waveform plus UV vector graph.
In such case, it is enough to provide a file containing some standard test pattern, e.g. SMPTE bars
or EBU bars.
By special order VideoQ can supply additional software converters to accommodate other file
formats, for example - single or multiple .RAW files of appropriate resolutions.
Such converters should be used as interface between the decode/capture device output format and
.YUV/.BMP formats supported by VQMA.
© 2005-2014 by VideoQ Inc, all rights reserved
13
7
VQMA User Manual
Running VQMA in Windows GUI mode
Running VQMA in Windows GUI mode
Click on the VQMA executable icon, or type VQMA.EXE (without any other parameters) in the
command line, to open GUI with standard Windows menus and dialog boxes.
Multiple instances of VQMA can be opened simultaneously, thus allowing easy comparison of
multiple test conditions or multiple devices under tests.
Test Session Results can be saved as Short Report as described in the separate section and/or
printed out. It is advisable to install a PDF printer, e.g. FinePrint "PDF Factory" to produce Full
Test Report in .PDF file format - 7 pages with all tables and plots.
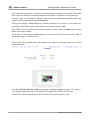
VQMA can also be launched from Unigraf Console Menu to receive captured test pattern YUV
or RGB data directly, via Unigraf Capture Card shared memory, without any intermediate file
recording.
This data exchange and preview window are active even when normal Unigraf file recording
function is disabled due to HDCP restrictions.
It is advisable to print full PDF Report for each test condition - because in this mode captured
YUV or RGB data are not stored and they are not accessible outside of the analyzer.
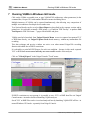
Click on "VideoQ Export" in the Unigraf Console "Tools" menu:
If HDCP restrictions are not present, it is possible to save YUV or BMP data files via Unigraf
Console menus - instead or beside of launching VQMA analyzer.
Saved YUV or BMP files can be viewed and analyzed later by launching VQMA.EXE off-line - in
normal Windows GUI mode - separately from Unigraf Console.
© 2005-2014 by VideoQ Inc, all rights reserved
VQMA User Manual
Running VQMA in Windows GUI mode
14
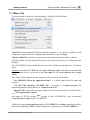
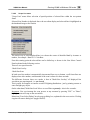
7.1 Menu - File
This menu should be used first - after launching of VQMA.EXE in GUI Mode:
"Open File" invokes standard "File/Open" Windows dialog box. User can browse folders to find
and open pre-captured video file. Supported file extensions are .yuv and .bmp.
"Reopen Valid File" is useful for recurrent test sessions, allowing manual update as desired.
Note that VQMA locks the analyzed file only for very short time needed to read video data from
hard drive.
Then YUV/BMP file can be modified by the user, while VQMA presents/print/save Test Report
Pages.
Important: Reopening YUV/BMP file also updates all target values read from customizable .INI
file. This feature can be very useful to check the same test file against different sets of target
values.
The .INI file location depends on three mutually exclusive items in the File menu:
- "Use VQMA.INI File in the Application Folder" is a default option (fixed file name and
location).
- "Use File Path matching YUV/BMP File", e.g.opening of c:/temp/current.yuv file
automatically implies opening and use of c:/temp/current.ini file.
- "Open INI File" option allows opening of any *.ini file located in any local or network folder,
e.g. \\PC2\temp\Remote2_temp.ini.
Any change of INI file location after opening of valid YUV/BMP file, leads to automatic
re-opening and re-testing of this YUV/BMP file.
VQMA also supports drag-and-drop opening of YUV/BMP files or folders containing such files.
Drag-and-drop opening of INI file results in automatic re-opening of last valid YUV/BMP file.
© 2005-2014 by VideoQ Inc, all rights reserved
15
VQMA User Manual
Running VQMA in Windows GUI mode
In "Print Report Page(s)" sub-menu each of seven on-screen pages of VQMA test results can be
printed separately or all pages together.
Actual printer name and used page numbers are selected via standard Windows dialog.
It is advisable to use a PDF writer, e.g. FinePrint pdfFactory, to create electronic reports of
VQMA test results; paper copies can also be printed if necessary.
Warning: VQMA.EXE automatically set printer page orientation to "Landscape". Manually
switching printer into "Portrait" mode may result in unreadable print-out.
Selection of "Quick Print" instead of "Print Report Pages" allows bypassing printer selection and
page number dialog; in such case all pages will be printed in background by the pre-selected
printer (i.e. by the printer, which was previously selected via regular Print menu).
At first launch of every VQMA instance this pre-selected printer name is reset to system default
printer. It is highly recommended to choose pdfFactory as a default printer. In such case it is
enough to press Enter once, thus confirming auto-prepared PDF file name and folder.
If the pre-selected printer is PDFCreator (supplied and installed separately under GNU license),
then click on "Quick Print" results in PDF Report file creation without any dialog.
The PDF Report with auto-generated file name is created in the folder, where the analyzed YUV/
BMP file resides.
Beside PDF printing VQMA allows clipboard capturing of viewed page screenshot image, e.g. by
pressing Ctrl+Alt+PrintScreen keys. Such graphic materials are quite useful for custom reports and
presentations. Commercial image printers, e.g. Zan Image Printer, can be used for such purposes
as well.
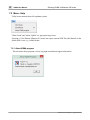
"File" menu also includes "Save Short Report" function, allowing user to browse folders and save
short text report in .TXT or .CSV format. Short Report file structure and content are identical to
Command Line Mode output, described in the correspondent section of this manual.
© 2005-2014 by VideoQ Inc, all rights reserved
VQMA User Manual
Running VQMA in Windows GUI mode
16
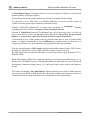
7.2 Menu - YUV Frame Size
Menu "YUV Frame Size" allows Auto Size (default) or particular Frame Size in Y pixels and
choose either custom size or one of six standard sizes from 720x480 to 4096x2304. Selection of
particular size disables Auto Size mode, which can be re-enabled by clicking on the corresponding
menu item. Any change in this menu leads to input file reloading and new analysis cycle.
This selection does not affect opening of .BMP files (BMP image resolution is always
auto-detected)
The user selected options are not stored in Windows Registry, so the choices done within this
menu are not persistent. If several instances of VQMA.EXE are running on the same computer,
user may run them with different frame sizes (and other menu settings as needed).
Clicking "Set Custom Frame Size" launches separate pop-up Dialog Box. It allows entering even
integers for the horizontal size or any integer for the vertical size; in both cases the permitted
ranges are automatically clipped. Note that the selected frame size should exactly match the .
YUV file to be opened.
If actual YUV file resolution (frame size) and/or number of frames (video file duration) do not fit
the list of Auto Size detectable sizes and durations, VQMA may report such file as "invalid". This
can be easily fixed via Custom Size dialog.
On the other hand, if manually entered values do not match actual YUV frame size, clicking "Auto
Size" may fix the error. YUV file will be automatically reopened, which typically results in valid
Test Report display.
© 2005-2014 by VideoQ Inc, all rights reserved
17
VQMA User Manual
Running VQMA in Windows GUI mode
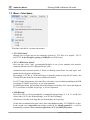
7.3 Menu - Color Space
This menu is divided in 3 sections (sub-menus):
· "YUV File Format"
allowing user to toggle between two alternative formats of .YUV files to be opened - UYVY
and YUV2. It does not affect opening of .BMP files (of RGB format)
· "YUV<>RGB Color Matrix"
Here user may select "Auto" (recommended default) or one of two standard color matrices,
commonly known as Rec709 (HD) and Rec601 (SD).
Automatic matrix selection decision is based on checking actual frame size and aspect ratio
against the list of typical combinations.
For example, YUV file of 1920x1080 frames is normally produced using Rec709 matrix, but
720x480 SD video should be associated with Rec601 matrix.
For YUV input format matrix selection affects color bars errors calculation and displayed RGB
waveforms on VQMA Scope Page, so it is quite important.
For BMP input format this selection affects only displayed color bars YUV values and displayed
YUV waveforms on VQMA Scope Page, so it is less important.
· "YRGB Range"
This allows user to select (automatically or manually) nominal range of Y, R, G, and B 8 bit
values: either 16-235 aka 'Reduced Range', or 0-255 aka 'Full Range';
Affected are Color & Levels Page and waveform display on Scope Page
All the above mentioned selections can be done either before opening .YUV/BMP file or after.
In the second case it does affect the analysis results for the already opened file - it will be
automatically reopened. These selections affect both .YUV and .BMP file formats..
© 2005-2014 by VideoQ Inc, all rights reserved
VQMA User Manual
Running VQMA in Windows GUI mode
18
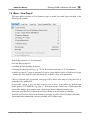
7.4 Menu - View Page #
This menu allows selection of Test Summary page or partial test result Pages described in the
following sub-sections.
Default page selection is "Test Summary".
User may browse pages by:
· Clicking the corresponding menu item
· Pressing the shortcut letter key, e.g. "W" for Waveform Scope Page or "S" for Summary
· Quickly go thru all 7 pages by pressing Left Arrow (page number down) or Right Arrow (page
number up). This method is especially useful for "at glance" check of all parameters.
Choice of selected page is persistent, same page will be shown after analysis of any new file or
reopening of the updated file.
It is possible, though it does not make analysis process faster, to pre-select any desired page
before opening YUV/BMP file, e.g. page # 7 "Waveform Scope". In this case, VQMA opens the
selected file and then goes straight to the selected page display, skipping summary page.
Frame Size and Chart Size (if detected) are always shown at top left corner of each page.
Test Date and Time are shown at the bottom of each page as well as Video File Name (full path).
This header/footer information is always presented on all VQMA pages.
© 2005-2014 by VideoQ Inc, all rights reserved
19
VQMA User Manual
Running VQMA in Windows GUI mode
7.4.1 Viewing Test Result Pages
VQMA produces several result presentation pages which are displayed one at a time, each page
containing detailed report about the particular type of video distortions:
· Test Summary table
shows all results, plus partial and global "Pass/Fail" flags
· Geometry, Focus, Shading
also contains auto-positioning markers display and optional Original Frame Size Code
reading
· Colors, Levels, Gamma and RGB Balance
shows YRGB Levels Plot on Grayscale, Black and White levels, and more
· Frequency Response
shows YUV multi-burst waveform and Frequency Response Plot
· K-rating, UV vs Y Gain
also contains 2T/20T pulse YUV waveforms display
· Noise Measurement
shows weighted and unweighted SNR for Y, UV and RGB channels ,
Noise Spectrum Display, Noise Histogram Display and Noise Pattern Display
· Waveform Scope
shows waveforms and levels for YUV and RGB channels, full frame or selected TV line
User can select any page from "View Page #" menu. At the first run of VQMA.EXE
"Summary" page is selected; it also can be selected by user at any time later.
the
At any time moment only one of these pages is displayed. If the user selects another video file,
VQMA stays on the previously opened page, allowing fast performance comparison of different
devices or even complete systems, e.g. made by different manufacturers.
This feature is also useful for adjustment or comparison of different configurations or modes, e.g.
comparing the device performance via HDMI input vs. YPbPr input.
For example, user may open file "Device_1.YUV", select "Noise Measurement" page, review it,
then open another video file, e.g. "Device_2.YUV". In this case VQMA stays on "Noise
Measurement" page, thus allowing quick (nearly instantaneous) visual comparison of interference
levels and noise performances of two capture devices.
Alternatively, user may launch two instances of VQMA.EXE:
1. first instance analyzing "Device_1.YUV",
2. second instance analyzing "Device_2.YUV".
Arranging two windows side-by-side allows easy comparison of the results.
© 2005-2014 by VideoQ Inc, all rights reserved
VQMA User Manual
Running VQMA in Windows GUI mode
20
Important Note: If VQMA-C Test Chart is not detected, e.g. because some other test pattern is
used or camera captures VQMA-C chart significantly distorted, then all pages, except Noise
Measurement and Scope, will display only warning message as shown below:
© 2005-2014 by VideoQ Inc, all rights reserved
21
VQMA User Manual
Running VQMA in Windows GUI mode
7.4.2 Test Summary page
The table shows the results of all partial tests, whilst the most important "global" result is displayed
in the upper right corner. This is shown as one word, which can be either "Passed" in green or
"Failed" in red; it is produced by logical AND function of partial test result flags of the table.
Leftmost column contains the partial test name (name of the measured parameter).
Next two columns shows measured value of the particular parameter and unit of measurement.
The "Target" column shows actual test tolerance values read from .INI file.
The rightmost column of the table shows partial test results. These are displayed as green ticks, if
partial test passed, or red crosses, if partial test failed.
At the bottom of the Summary Table there are three important statements in Brown:
Statement on the left is about the Nominal YRGB Range (Nominal Black and Nominal White
values) used to calculate the corresponding percentage values in the Summary Table. This range
selection can be Automatic or Manual - as set in the "File" menu.
Message in the center is about Color Matrix selection.
Statement on the right is about the automatically detected test type - Optical Test Chart or Test
Pattern.
Picture at the bottom of this page shows first TV frame, extracted from the captured video clip
under test.
It represents the content of opened file in auto-scaled form and serves only for general image
identification. It should not be used for any quality assessment.
© 2005-2014 by VideoQ Inc, all rights reserved
VQMA User Manual
Running VQMA in Windows GUI mode
22
If the ratio of opened frame size vs. default 1920x1080 does not match exactly 1/4, 1/2, 1, 2, or 4,
then the scaled image is displayed as centered insert within checkerboard background picture.
If VQMA Test Chart comes in form of central insert, occupying 50% or less of input frame, then
this insert is zoomed up and cropped to show the most important part of the frame - VQMA Chart
itself.
The resolution of opened frame and calculated sizes of chart within it (which could be equal,
smaller or even slightly bigger - if zoomed-up) are displayed in the upper left corner.
Values after "Chart:" are VQMA Chart Sizes automatically measured by VQMA. They may
slightly differ (+/-2 pixels) from the exact frame size even in absence of any scaling (scale =
100%).
These approximate values serve mainly for indication of zoom (scaling) settings of cameras and
signal processors.
Note that Frequency Bursts on the chart are labeled simply "1", "2", ,,, "6". In the Summary Table
corresponding spatial frequencies are marked as "F1" ... "F6".
Actual values of these frequencies depend on the test conditions, i.e. frame size and chart size
within the frame.
For every burst VQMA calculates and displays burst spatial frequency expressed in tvl and burst
relative level expressed in dB.
If the frequency exceeds theoretical limit of half pixel rate, then "Frequency Response" words are
replaced by "Aliasing Level".
For more details - see "Frequency Response Page" section.
© 2005-2014 by VideoQ Inc, all rights reserved
23
VQMA User Manual
Running VQMA in Windows GUI mode
7.4.3 Geometry, Focus, Shading page
This page displays measured values of major chart geometry parameters as well as parameters
related to camera focus and the uniformity of chart illumination.
There are two different templates for this page presentation:
· Template for file-originated VQMA Test Pattern
· Template for VQMA-C Optical Test Chart
These two templates are automatically switched depending on test material type detected.
CASE OF FILE-ORIGINATED TEST PATTERN
In this case the list of displayed geometry parameters is quite simple:
· 4 measured values: H&V sizes, H&V position offsets
· 4 derived values: Frame Aspect Ratio, Chart Aspect Ratio and Chart to Frame H&V Ratios.
Derived values are displayed mainly for user convenience, excluding manual calculations.
If the analyzed file contains Original Frame Size Code markers (white squares in center-right
portion of top band), then this page also displays the decoded number describing original frame
size.
In the example shown VQMA Chart was scaled down to 384x288 from Original Frame Size of
720x480 (code value = 1, binary 0001 represented by single white square, 2nd row, 2nd column).
© 2005-2014 by VideoQ Inc, all rights reserved
VQMA User Manual
Running VQMA in Windows GUI mode
24
CASE OF OPTICAL TEST CHART
At the top of the page are messages displaying average Contrast and Focus values based on
analysis of 4 corner Radial Plates. High enough values of these parameters are the critical
conditions for accurate measurements of other parameters, such as Frequency Response, KRating, etc.
Geometry parameters include H & V Scale (Zoom), Chart Position (H & V Offsets), Tilt and
Keystone Distortions.
These values are based on detecting and locating blue-white circular markers in 4 corners of the
VQMA-C chart. For purely electronic devices, such as video scalers, only scale and position
results are important - Tilt and Keystone values are typically zeroes..
Contrast and Shading are the parameters related to the uniformity of chart lighting.
Contrast calculation is based on statistics of differences between White and Black levels of all 4
corners. Thus, if some chart corner is affected by glare (pushing Black Level up) or lack of
illumination. (reducing White Level), then the overall (average) contrast value will go down.
Shading is calculated as maximum non-uniformity of two corresponding sides of the chart. So, if
only left chart side is illuminated non-evenly from top to bottom or camera lens "vignetting" is
significantly strong, then the displayed Vertical Shading value will go up. Similarly, Horizontal
Shading value will go up if only top or only bottom side of the chart shows non-consistent Black
and White Levels.
Green squares mark actual measured positions of the chart edges. They may exactly touch the
frame corners, if scale is exactly 100%. Markers are inside the frame, if scale is less than 100%, or
slightly outside of cropped chart image, e.g. for scale = 105%.
© 2005-2014 by VideoQ Inc, all rights reserved
25
VQMA User Manual
Running VQMA in Windows GUI mode
If no valid chart is presented, or chart levels and/or geometry parameters are seriously offset, then
these square are shown in red and measurement results display is replaced by warning message.
Central message "Test Condition Validated" (in green) serves as additional confirmation that chart
parameters are good enough for automated analysis.
This page also displays Focus (Sharpness) estimates separately for 4 corners. It is presented as a
percentage of fine details energy with reference to the original (perfect) chart.
Thus, 100% Focus means that measured chart contains in all 4 corners the same amount of fine
details as electronic original.
Focus value of 150% means excessive aperture correction, and 50% Focus value means lack of
fine details energy, i.e. blurred picture.
Picture below shows special case of file-originated test pattern, occupying central part of white
background frame.
Note that Vertical Chart Size = 360 means danger of aliasing artefacts on bursts # 4, 5 and 6, i.
e. incomplete suppression of 400, 500 and 600 tvl frequencies, exceeding 360 tvl limit.
Exact levels of these scaling artefacts can be found on "Frequency Response" page.
© 2005-2014 by VideoQ Inc, all rights reserved
VQMA User Manual
Running VQMA in Windows GUI mode
26
7.4.4 Colors, Levels. Gamma, RGB Balance page
This page displays most important parameters, related to YUV and RGB levels and measured
using the best available noise-reducing filter. Grayscale parameters are averaged on two Bands
(Band 2 and Band 3). Color Bar parameters are measured on Band 1.
Black Level and White Level are presented in % of the selected nominal YRGB range and also in
D1 8 bit levels.
Luminance Gamma is calculated by best fitting method on 9 of 11 staircase porches; two lowest
porches are ignored to minimize noise and glare related effects.
Independent on the type of the video data (Test Pattern or Optical Chart) this value is called Y
Gamma with assumed nominal Display Gamma value of 2 .2.
For user convenience Inverse Y Gamma (Camera Gamma) with assumed nominal value of 0.45
is also calculated and displayed. Note that only Luminance Gamma is presented on VQMA
Summary Page and in VQMA Short Report file - Inverse Gamma is not shown there.
RGB Dynamic Balance Error is a maximum of R-G, B-G and R-B magnitudes of all 11
staircase porches. Black Balance Error and White Balance Error are calculated similarly, but
only the lowest (Black) and the highest (White) porches are used.
Black Crash and White Crash (Y Range Overload) are measured by finding the clipping level of
shallow ramps in the central area of the VQMA Test Pattern. The shape of shallow ramp
waveforms can be seen on "YUV/RGB Scope" page by selecting "Near Black" or "Near White".
© 2005-2014 by VideoQ Inc, all rights reserved
27
VQMA User Manual
Running VQMA in Windows GUI mode
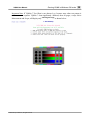
Grayscale YRGB Levels Plot displays side-by-side averaged Y, R, G, and B levels of all 11
Grayscale porches expressed in percents of nominal range - from Black on the left to the White on
the right. Plotted Y, R, G and B values depend on the selection (manual or automatic) of Nominal
YRGB Range.
The Grayscale Y Levels Table under the plot shows measured values (in Black), reference values
(in Gray) and errors, i.e. differences between them.
On the right there is a display of maximum Y channel error vs. ideal Yref values and RGB errors
relative to Y channel, i.e. maximum magnitudes of R-Y, G-Y, and B-Y for all 11 porches. These
errors should not be confused with Dynamic Balance Error.
On the left side next to grayscale plot the Y Nonlinearity value is shown. It is calculated on 5
even-numbered staircase porches as a ratio (Max_Ystep - Min_Ystep)/Max_Ystep and presented
in percents.
The bottom half of the page is occupied by Color Bars Table. It contains YUV and RGB levels of
VQMA-C test pattern measured on Band #1.
The Table also shows (in Gray) the reference values of 100/0/75/0 Color Bars corresponding to
the selected Nominal Range (16-235 or 0-255). The right half of each cell shows calculated Color
Bar Errors, i.e. differences between measured and reference values.
Maximal Errors of each row are shown in the rightmost column, and Maximal RGB Error of the
whole Table is displayed at the bottom right corner.
Maximal RGB Error is highlighted by green or red frame. If the error is below 3 levels of 8 bit
scale then the frame color is Green; it means that there are only minor rounding errors.
If the Max RGB Error is 3 or more the frame color becomes Red and the Table cell(s) containing
maximal errors are also highlighted by Red frame(s). This allows easy finding of the most critical
combinations of Bar Color and R, G or B component. In the example shown on the previous page,
the worst case (Error = -63) is in the Blue channel on Blue bar.
Values within the "Captured Data" part of the Table are YUV or RGB data, averaged and
rounded to 8 bit values without any mapping or scaling.
Values within the "Derived Values" part of the Table are results of application of BT.709 (HD)
Color Matrix to the input data, these results are also rounded to 8 bit and compared with the
corresponding 8 bit reference values.
"Captured Data" and "Derived Values" markers select top or bottom part of the Table depending
on the type of input data (YUV or RGB) .
If captured data are of YUV type, e.g. read from .YUV file, then the YUV (top) rows are marked
as "Captured Data" and RGB (bottom) rows of the Table are marked as "Derived Values".
But if captured data are of RGB type, e.g. coming from some RGB source connected via HDMI
cable to the Unigraf capture card, then RGB (bottom) rows are marked "Captured Data" and the
YUV (top) rows are marked "Derived Values".
Note that calculated Max RGB Error is exactly zero, despite small non-uniformity of displayed
RGB values.
© 2005-2014 by VideoQ Inc, all rights reserved
VQMA User Manual
Running VQMA in Windows GUI mode
28
This is because the references for "Derived Values" are not taken from pristine RGB Bars (16 and
180), but calculated from YUV Reference Values shown in the upper rows; this is a fundamental
feature of YUV-to-RGB 8 bit color matrixing process. In this case RGB References correspond to
the ideal player, which builds 24 bit RGB pixels from incoming 24 bit YUV pixels.
Example below shows Color Bars Table for reference test pattern without any errors in YUV
channels.
Note that the Color Bars Table always automatically shows appropriate Reference Values - even
when the manually selected Nominal Range does not match actual measured values.
In such case, the corresponding Warning Message is displayed (in brown) at the bottom left.
This may happen only in case of manual selection conflicting with the auto-adjustment; the
warning message will be never needed if Automatic Range is selected in the "Color Space" menu.
© 2005-2014 by VideoQ Inc, all rights reserved
29
VQMA User Manual
Running VQMA in Windows GUI mode
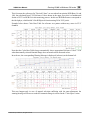
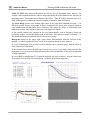
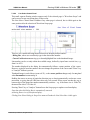
7.4.5 Frequency Response page
This page shows the measured averaged peak-to-peak amplitudes of six frequency bursts and
displays averaged luminance waveform of multi-burst band of VQMA matrix pattern (Band 4).
Type of averaging filter is selected automatically (best available filter).
The burst amplitudes are expressed in dB with reference to nominal (undistorted) value.
This band of VQMA test pattern includes special reference bars with levels exactly matching the
nominal burst amplitude. The measurement algorithm check these bars first, and automatically
compensate for any non-standard Black Level and White Level conditions, including Levels Tilt. In
other words, VQMA frequency response measurement is always accurate and correct, independent
of any lighting, setup or gain errors in Y channel.
Note that spatial frequency value expressed in tvl does not change if VQMA Test Pattern is
rendered in different resolutions. For example 400 tvl of burst #4 means that 200 periods
occupies full height of 16:9 video frame - independent of actual number of pixels per period or V
size of the frame: 1080, 720 or 480. On the other hand, any change in the relative H size of the
test chart within video frame, e.g. due to camera zooming, means change of all frequencies (and
their measured values, expressed in tvl).
VQMA displays frequency values in three formats: burst numbers (in gray), percents of the limit
frequency and actual (captured) tvl values.
In the example below these value significantly differ from original 1920x1080 16:9 Chart because
of the down-conversion to anamorphic 720x480 format.
Waveform display on this page includes U (in red) and V (in blue) components useful for visual
estimation of camera "debayering" ("de-mosaicing") algorithm artefacts. Strength of U and V
variations appearing on monochrome textures provides an estimate of the debayering filter
imperfection.
© 2005-2014 by VideoQ Inc, all rights reserved
VQMA User Manual
Running VQMA in Windows GUI mode
30
Significant zooming out or scaling down the chart size, e.g. from 100% to 50%, may also produce
in Y channel spatial frequencies much higher than original burst frequencies.
Positive side of this transformation is that it allows measurement of Frequency Response in much
wider range. For example, 4K camera response can be measured up to 3000 tvl.
Small number of pixels per texture period may also lead to well-known "aliasing" effect. The
boundary (limit) frequency of this effect is equal to half of sampling frequency, i.e. it is directly
proportional to video frame size in pixels.
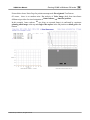
VQMA analyzer automatically calculates this limit and highlights the aliased frequencies.
Frequencies exceeding the sampling limit are labeled "Aliasing" and shown in red.
Example below shows significant aliasing levels: from -4.3 dB to -13.5 dB for bursts 4, 5 and 6.
In this example 640x360 chart is a product of down-conversion from 3840x2160 original to "poststamp" 640x360 image within 1280x720 frame. This process created relatively high spatial
frequencies of 800...1200 tvl - much higher than 720 tvl limit set by vertical frame size.
The Frequency Response curve is always plotted using actual (captured) frequency values as
horizontal positions on the tvl axis. Target limits are re-mapped together with the corresponding
frequencies. Aliased frequencies are "mirrored" around the limit frequency and plotted with red
pen.
The list of burst frequencies tested by VQMA is rather short; 6 frequencies represent only few
points on the frequency response plot. However, in typical test conditions frequency response plot
shape is smooth. Thus, VQMA values, measured on few frequency bursts, adequately represent
typical frequency response plot in total.
© 2005-2014 by VideoQ Inc, all rights reserved
31
VQMA User Manual
Running VQMA in Windows GUI mode
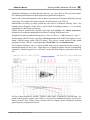
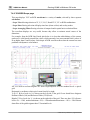
7.4.6 K-rating, UV vs Y Gain page
This page displays the measurements results for two key parameters related to the 5th band of
VQMA-C matrix test pattern:
1. K-rating, in %, measured on 2T pulse (white needle pulse)
2. UV vs. Y Gain, in dB, measured on 20T composite pulse (soft green pulse)
It also shows the overlay of averaged waveforms of Y , U and V signals in the band #5.
K-rating is a common quality metric using a 2T pulse along with a luminance bar as a reference
value. The measurement procedure includes calculation of several partial K-ratings, such as the
ratio of the maximum pulse voltage versus the luminance bar voltage, relative 2T pulse width and
weighted under-shoots and overshoots levels. Displayed is the overall (worst case) K-rating, which
is the maximum of all these partial measurements.
Black (inverted) needle pulse is also present in this band, but its distortions are not included in the
K-rating calculation. However, this particular test signal component is useful for estimation of
non-linear distortions. If its shape correlates well with the shape of its counterpart of opposite
polarity (white needle pulse), then the distortions are rather linear. In case of strong non-linearity,
caused, for example, by protective black or white level limiter, the overshoots of two needle pulses
will look quite different.
UV vs. Y Gain (Color Saturation) is calculated as the relative activity of combined U and V
signals (chrominance) of 20T pulse with reference to the activity of Y signal (luminance). Display
of Y (in black) U (in blue) and V (in red) components of 20T composite pulses of two opposite
polarities (soft green and soft magenta pulses) allows to distinguish between linear and non-linear
causes of UV vs. Y gain errors.
© 2005-2014 by VideoQ Inc, all rights reserved
VQMA User Manual
Running VQMA in Windows GUI mode
32
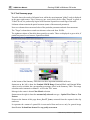
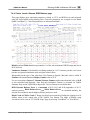
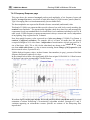
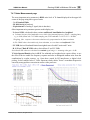
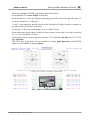
7.4.7 Noise Measurement page
The most important noise parameter is RMS noise level of Y channel displayed in the upper left
corner of the page using three types of units:
- % of Nominal White
- D1 8 bit levels (in brackets)
- Equivalent mV of analog Y signal (also in brackets)
Other important noise parameter present on this display are:
- Y channel SNR, calculated in three variants: unfiltered, band-limited and weighted.
a) Y channel low-pass filter bandwidth is set to 80% of the maximal frequency (Flimit = sampling limit),
e.g. in 1080i format with 74.25 MHz sampling rate, LPF bandwidth is 0.8*74.25/2 = 30 MHz.
Weighting filter response is also auto-scaled inversely proportional to the frame resolution.
-b) The Y RMS value is derived directly from video data, so it correlates with unfiltered Y SNR.
- UV SNR, derived from band-limited unweighted sum of scaled U noise and V noise
- R, G, B and "Dark B" SNR values, derived from Y and UV SNRs
Note that all SNR values are calculated wrt nominal signal range, i.e. assuming video gain = 0 dB.
Y Noise Spectral Density plots in dB/dF for unlimited and weighted noise spectra allows to see
the effect of device under test frequency response and also to distinguish random noise from the
contributions by regular textures, e.g. from those caused by RF interference or digital clock
pick-up. In the example below Y Noise Spectrum clearly shows "boost" on medium frequencies
caused by strong aperture correction in camera video processor.
© 2005-2014 by VideoQ Inc, all rights reserved
33
VQMA User Manual
Running VQMA in Windows GUI mode
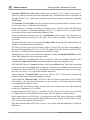
"Dark B" SNR value allows differentiate the effects of level dependent noise features. For
example, some sophisticated noise reducers target specifically this blue channel noise, but only on
dark image areas. The example above illustrates this effect: "Dark B" SNR is about the same as Y
SNR, whilst typically (without the special treatment) it should be about 6 dB lower.
The Noise Image picture at the bottom right corner of the page shows boosted (x16 gain = +24
dB) noise pattern on grey background. It allows visualization of various noise features related to
edge enhancement and non-linear noise reduction. This image also helps to differentiate true
random noise from other unwanted (but more or less periodic) signals.
In the example shown noise contrast on fine test pattern details, such as frequency bursts and
resolution wedges, is noticeably higher than on flat areas. This indicates strong "crispening", i.e.
fine details enhancement combined with low levels noise coring.
Histogram display in the upper right corner allows differentiation between Gaussian (truly
random, i.e. unprocessed) noise from "cored" noise signal produced by noise reducers.
If Y (and G) histogram plots are close to ideal Gaussian curve (shown in gray), then the effect of
noise reduction is rather small.
In the example shown above the difference between two curves is very large, which indicates the
application of very deep noise reduction boosting the relative probabilities of low noise magnitudes
vs. high magnitudes.
In case of BMP or single frame YUV input the analyzed area size is reduced - only the central part
of the image is involved in noise calculations - as shown on the following picture.
© 2005-2014 by VideoQ Inc, all rights reserved
VQMA User Manual
Running VQMA in Windows GUI mode
34
Picture below shows Noise Page for pristine uncompressed file-originated Test Pattern.
Of course, there is no random noise. But analysis of Noise Image (built from inter-frame
differences) provides for visual estimation of frame cadence and time-line position .
In this example frame cadence 1:1 (no skips, no repeated frames) is confirmed by consistent
spinning wheel image at the top and single white square in the 5th position on black grid at the
bottom.
© 2005-2014 by VideoQ Inc, all rights reserved
35
VQMA User Manual
Running VQMA in Windows GUI mode
7.4.8 YUV/RGB Scope page
This page displays YUV or RGB waveforms in a variety of modes, selected by three separate
sub-menus:
- Scope View allowing selection of Y, U, V, R, G, B and YUV, UV or RGB combinations
- Scope Line allowing selection of display time-base (frame or line) and overlay modes
- Scope Averaging Filter allowing selection of temporal and/or spatial noise reduction filters
The waveform displays are very useful, because they allow to estimate actual causes of the
distortions.
For example, from the RGB Line Parade plot below it is clear that white balance of the camera
under test is a bit biased towards blue colors, whilst extremely low (near nominal black) values of
R are higher than G and B values. Such shape of RGB waveform shows that the camera has some
problems with dynamic color balance.
All YUV/RGB waveform diagrams are shown superimposed over the standard levels vs pixels
grid.
Horizontal co-ordinate: relative pixel count from left to right.
Y (R, G, B) level scale in % is shown on the left side of the grid. Green dotted lines designate
Reference Black (16d) and Reference White (235d) levels.
Bipolar UV level scale (in % ) is shown on the right side of the grid. There are three UV reference
levels: 0% = 128d, nominal minimum -50% = 16d and nominal maximum +50% = 240d. Brown
dotted line of the grid designate these UV nominal levels.
© 2005-2014 by VideoQ Inc, all rights reserved
VQMA User Manual
Running VQMA in Windows GUI mode
36
There is one special YUV/RGB Scope display mode shown below.
It is dedicated to UV vectors display on color bars.
On the left side UV vectors are displayed with unity gain (0 dB), and on the right side same UV
vectors are boosted x2 (+ 6 dB) gain.
U and V vector signals are derived from the color bars band of VQMA-C matrix test pattern or
any other source of color bars can be used.
U (CR) and V (CB) levels on this display are in % of full UV scale.
Seven target zones (green squares on the left, brown squares on the right) are sized to represent
5% (+/-2.5%) of nominal UV range.
Central points of these squares represents reference 75% Color Bars (left side) and 37.5% Color
Bars (right side).
75% Color Bars target boxes are more suitable for testing signal processors, whilst 37.5%
targets are more suitable for testing cameras.
© 2005-2014 by VideoQ Inc, all rights reserved
37
VQMA User Manual
7.4.8.1
Running VQMA in Windows GUI mode
Scope View menu
"Scope View" menu allows selection of desirable signal component (or combination of
components) for waveform display.
Default mode is "RGB Line Parade"
The Y, R, G and B "Line" modes are quite simple and display only one selected component of the
selected TV line.
There are six modes in which the components are combined:
- RGB Line Parade and YUV Line Parade
- RGB Line Overlay, UV Line Overlay and YUV Line Overlay
- RGB Frame Parade
The difference between Line Parades and Line Overlays is in the time-base.
For Parades the waveforms are down-sampled x3, so less pixels are visible, but each component
occupies separate portion of the display, so it is not obscured by other components.
For Overlays signal components are not down-sampled, thus each pixel is displayed, but they are
superimposed, and maybe obscured.
The overlays are very useful for comparisons, e.g. to check the RGB balance errors.
RGB Frame Parade differs from all other modes - in this mode only peaks and troughs of each
line are involved.
Thus, this display represents top and bottom "envelops" of R,G and B waveforms.
UV Vectors Display Mode is already explained in "YUV/RGB Scope page" section. Note that
selection of UV Vectors menu item automatically changes Scope Line menu selection to Color
Bars (Band #1), but the user can later select any other band.
© 2005-2014 by VideoQ Inc, all rights reserved
VQMA User Manual
7.4.8.2
Running VQMA in Windows GUI mode
38
Scope Line menu
"Scope Line" menu allows selection of spatial position of selected line within the test pattern
frame.
Selected Line Number is displayed above the waveform display and selected line is highlighted on
the thumbnail image at the bottom.
The easiest way to select displayed line is to choose the center of desirable Band by its name or
number, for example - Band #1 = Color Bars.
From this starting point the selected line can be shifted up or down via the Line Select Control
Panel explained in the following section.
There are two special modes:
- Multi-Line Overlay
- Multi-line Scan
In both cases line number is automatically incremented from top to bottom, so all frame lines are
displayed one after another, total duration of the scan is about two-three seconds.
The difference between these two modes is that in "Multi-Line Overlay" all displayed line
waveforms are superimposed, i.e. not cleared.
This is useful for example to visualize overall 2D lighting distribution - just by pointing camera to
some flat light gray object.
On the other hand, "Multi-line Scan" allows to see all lines separately - also in few seconds..
Important: User can interrupt the scan process at any moment by pressing "ESC" or "Enter";
highlight cursor will stop on the current line.
Menu item "Line Select Dialog" invoke pop-up dialog box, explained in the next section. Clicking
it again will remove dialog box (toggle On/Off).
© 2005-2014 by VideoQ Inc, all rights reserved
39
VQMA User Manual
7.4.8.3
Running VQMA in Windows GUI mode
Scope Averaging Filter menu
"Scope Averaging Filter" menu allows selection of spatial/temporal averaging filters used to
reduce the harmful effect of noise, which affects the accuracy of measurement and waveform
display.
This menu is for advanced users.
Spatio-temporal apertures are:
a) 1x1 (No filtering, labeled "Single Frame Single Line")
b) 1x16 (Spatial filtering only, labeled "Single Frame Multiple Lines")
c) 8x1 (Temporal filtering only, labeled "Multiple Frames Single Line")
d) 8x16 (Spatial and Temporal filtering , labeled "Multiple Frames Multiple Lines")
Default selection is "Single Frame Single Line"; it allows to see waveform "as is".
Maximum reduction of noise influence over the displayed waveform is achieved by selection of
"Multiple Frames Multiple Lines", but this selection is available only for multi-frame inputs.
For single frame inputs significant noise reduction is achieved by selection of "Single Frame
Multiple Lines".
The "Multiple Frames Single Lines" option also allows significant noise reduction without
sometimes undesirable involvement of adjacent TV lines.
All listed options are especially useful to compare the behavior and amount of noise, e.g. when
viewing the "Staircase Display" bands.
© 2005-2014 by VideoQ Inc, all rights reserved
VQMA User Manual
7.4.8.4
Running VQMA in Windows GUI mode
40
Line Select Control Panel
This small separate floating window appears only if the selected page is "Waveform Scope" and
can be moved to any convenient place on the screen.
The Line Select Control Panel is hidden if any other page is selected, but is visible again at the
same position after the selection of Waveform Scope page.
There are two controls allowing manual selection of the analyzed line number:
- Dialog Box, where user can directly type-in the desired line number
- Cursor Position Arrows moving up or down highlighted line on the thumbnail image.
Line number can be set only within the available range, defined by input frame vertical size, e.g.
from 0 to 1079.
The number displayed in the dialog box automatically follows current position of the cursor.
However, typing-in new line number does not change the position of the cursor until "Enter" key
or "Analyze" button is pressed.
Thumbnail image is scaled down (zoom x0.25), so the cursor position changes only for one pixel
when line number increments by 4.
Holding the mouse on arrow of particular direction (up or down) automatically accelerates cursor
movement, so going thru all 1080 lines takes only few seconds. When cursor reaches the top or
bottom edge of the image line number automatically switches - e.g. if the frame size is 1280x720,
then next line after #719 is line #0.
Pressing "Enter" key or "Analyze" button forces the Scope page to update waveform display.
Note that after this Dialog Box is automatically removed
(allowing better view of waveform display).
Clicking Line Select Dialog in Scope Line menu will make the Line Select Box visible again.
© 2005-2014 by VideoQ Inc, all rights reserved
41
VQMA User Manual
Running VQMA in Windows GUI mode
7.5 Menu - Help
"Help" menu contains three self-explanatory items:
"Short Guide" and "About VQMA" are pop-up message boxes.
Selection of User Manual (Shortcut F1) menu item opens external PDF file (this Manual) in the
default PDF viewer, e.g. Adobe Reader.
7.5.1 About VQMA program
This sub-menu shows program version, copyright and technical support information
© 2005-2014 by VideoQ Inc, all rights reserved
VQMA User Manual
Running VQMA in Windows GUI mode
42
7.5.2 Short Guide
This sub-menu produces pop-up box with short description of modes of operation and supported
video file formats:
© 2005-2014 by VideoQ Inc, all rights reserved
43
8
VQMA User Manual
Test results presentation in Short Report
Test results presentation in Short Report
The Short Test Report can be saved from "File" menu or as <OutFile>
in Command Line
Mode. The results are presented in three sections:
1. VideoQ copyright and VQMA version info (commented out by semicolons), Test
Session date and time, full paths to Report File and input Test File
2. Test results in form of comma separated ASCII data
3. Copy of the .INI content (commented out by semicolons)
this section allows to log and recall, if necessary, the actual target values used for the
test
The most important is Section 2.
It consists of about forty lines containing the results of partial tests, starting with the parameter
code in form of reserved codeword - uppercase ASCII characters. After comma there is the
measurements result, followed in some cases by another comma and Success/Failure codewords.
First few lines are special:
FRAMES_ANALYZED, shows the total number of processed video frames, typically = 1 or 8.
FRAME_WIDTH and FRAME_HEIGHT show the detected YUV file format: e.g. 1920 x 1080.
VQMA_CHART_VALIDATION shows Success or Failure of Auto Detection and Validation
procedure, i.e. does the YUV file contain VQMA-C chart image with the parameters, such as size,
position,
tilt
and/or
contrast
suitable
for
automated
measurements.
If
VQMA_CHART_VALIDATION shows Failure then the number of the following report lines will
be reduced to just one: SNR. This is necessary because other measurements results depend on the
validity of the test pattern.
CHART_WIDTH, e.g. 1900, and CHART_HEIGHT, e.g. 1069, are actual (measured) sizes of the
test pattern within the YUV or BMP frame.
YRGB_RANGE_SELECTION shows the User selection between two possible modes: Auto or
Manual.
SELECTED_YRGB_RANGE shows the selected (automatically or manually) range: 16-235 or
0-255.
© 2005-2014 by VideoQ Inc, all rights reserved
VQMA User Manual
Test results presentation in Short Report
44
For all parameters specified in the VQMA.INI file, the corresponding lines of Test Report also
show special “Success” or “Failure” codewords.
For each such line Success/Failure flag means that the measured value is within/outside of the
specified target limits. In other words Success/Failure flag shows the compliance of the system
under test with the particular target value(s) set in the .INI file.
For example, minimal SNR value is specified in the VQMA.INI as 46 dB and actual measured
SNR value is 100 dB.
In such case SNR line of the Test Report will end with the codeword "Success".
The global “Success” flag is derived as simple logical AND function of all partial “Success” flags
Note that after FREQUENCY_RESPONSE_1, FREQUENCY_RESPONSE_2, etc are the
frequency response reading in dB for the burst of corresponding number.
These dB values and Success/Failure flags are calculated for automatically scaled spatial
frequencies as described in "Frequency Response page" section.
If
the scaled frequency exceeds the sampling limit defined by Frame Vertical Size, then
corresponding dB values should be interpreted by the database handler as aliasing level. For this
purpose after 6 lines of FREQUENCY RESPONSE section of the Report File there are 6
additional info lines (without Success/Failure flags). These 6 lines contain actual bursts spatial
frequencies and optional ALIASED flag, followed by aliased frequency value in tvl.
For example, if Frame Vertical Size = 432 and F6 = 600 tvl, then aliased frequency = 2*432 - 600
= 264 tvl.
Below is a sample of VQMA Test Report showing test results presentation:
; VideoQ Inc. Copyright [c] 2005-2013
; VQMA v4.1.2.1 Test Report
TEST_DATE_TIME_YEAR, Sun Oct 13 20:59:29 2013
;
REPORT_FILE, "C:\VQMA Demo Files\Full Run2\7_plugin_768x432_20131013_205921_PASS.TXT"
TEST_FILE, "C:\VQMA Demo Files\Full Run2\7_plugin_768x432.yuv"
;
TEST_RESULT, PASSED
;
DATA_TYPE, YUV
FRAMES_ANALYZED, 8
FRAME_WIDTH, 768
FRAME_HEIGHT, 432
VQMA_CHART_VALIDATION, Success
CHART_TYPE, Test_Pattern
ORIGINAL_FRAME_WIDTH, 1920
ORIGINAL_FRAME_HEIGHT, 1080
© 2005-2014 by VideoQ Inc, all rights reserved
45
VQMA User Manual
Test results presentation in Short Report
CHART_WIDTH, 768
CHART_HEIGHT, 432
YRGB_RANGE_SELECTION, Auto
SELECTED_YRGB_RANGE, 16-235
COLOR_MATRIX_DETECTED, Rec709-HD
COLOR_BARS_MAX_RGB_ERROR, 1, 8 bit value
MAX_RGB_ERROR_COLOR, Yellow
;
Y_BLACK, 0.0, %, Success
Y_WHITE, 100.0, %, Success
SNR, 100.0, dB, Success
K_RATING, 2.3, %, Success
UV_Y_GAIN, 0.0, dB, Success
Y_GAMMA, 2.2, , Success
RGB_BALANCE_ERROR, 0.0, %, Success
Y_BLACK_RANGE_ERROR, 0.0, %, Success
Y_WHITE_RANGE_ERROR, 0.0, %, Success
FREQUENCY_RESPONSE_1, -0.5, dB, Success
FREQUENCY_RESPONSE_2, -1.7, dB, Success
FREQUENCY_RESPONSE_3, -4.4, dB, Success
FREQUENCY_RESPONSE_4, -9.5, dB, Success
FREQUENCY_RESPONSE_5, -12.9, dB, Success
FREQUENCY_RESPONSE_6, -18.1, dB, Success
;
;BURSTS_SPATIAL_FREQUENCIES_tvl:
F1, 100
F2, 200
F3, 300
F4, 400
F5, 500, ALIASED, 364
F6, 600, ALIASED, 264
;
;BARS, Y, U, V, 8 bit values
WHITE, 235, 128, 128
YELLOW, 168, 44, 135
CYAN, 145, 146, 44
GREEN, 134, 62, 51
MAGENTA, 62, 193, 204
RED,
51, 109, 212
BLUE, 27, 212, 120
BLACK, 16, 128, 128
;
; Success-Failure flags shown above are derived
; using the following target values:
Next section after the text shown above is a just a copy of VQMA.INI values used for this Test Report.
© 2005-2014 by VideoQ Inc, all rights reserved
VQMA User Manual
9
Test results presentation in Short Report
46
Customization and editing of INI Files
VQMA.EXE checks the captured (input) video data, read from *.BMP or *.YUV file, against the
tolerance values contained within the .INI file.
Full path to this file depends on File menu options in GUI mode or -i/-ia flags in Command Line
Mode.
Default is VQMA.INI file residing in the VQMA.EXE folder. VQMA.INI file name is mandatory
only for VQMA.EXE folder; in other folders it is advisable (but not mandatory) to have a set of
.INI files with names matching .YUV (or .BMP) file names.
For every YUV/BMP file the corresponding .INI file with appropriate file name must be present in
the selected folder, otherwise it will be generated with default values.
Any .INI file is editable, so the users can input their customized tolerance values for any
parameter.
The content of the .INI files can be edited using any text editor (e.g. Notepad).
This allows application of different sets of tolerance values appropriate for the particular device
under test or test conditions.
Editing should be done with caution because the list of parameters and units of measurement
codes should not be modified.
Next is a sample of target values presentation within .INI file.
It contains a simple list of target values for all parameters.
For each parameter the target values are defined by three or four consecutive lines:
1. Parameter Code [in square brackets]
2. Unit Of Measurement Name
3. Lower Limit (Minimum Value)
4. Upper Limit (Maximum Value)
For example:
; [Y_BLACK_LEVEL_]
; Y_BLACK_LEVEL_UNIT=%
; Y_BLACK_LEVEL_MIN=-5.00
; Y_BLACK_LEVEL_MAX=5.00
For some parameter MIN value is not applicable, so it is omitted, for example:
; [RGB_BALANCE_ERROR_]
; RGB_BALANCE_ERROR_UNIT=%
; RGB_BALANCE_ERROR_MAX=10.00
© 2005-2014 by VideoQ Inc, all rights reserved
47
VQMA User Manual
Customization and editing of INI Files
Only numerical values of MIN and MAX limits can be edited.
For example, RGB_BALANCE_ERROR_MAX=10.00 can be changed from 10.00 (default) to
5.00.
It is recommended to store customized .INI files under the names which are different from the
reserved ones, e.g. MY_1080p30.INI.
To use these customized .INI file simply rename a copy of the selected MY_1080p30.INI file to
desired file name, overwriting the existing file if necessary.
It is also advisable to keep a backup copies of the edited .INI files, thus allowing to revert to the
desired values if necessary.
The process of replacement of the .INI files can be automated by usage of conventional batch files
or scripts.
© 2005-2014 by VideoQ Inc, all rights reserved
VQMA User Manual
Customization and editing of INI Files
Example of complete .INI file (default values):
; VideoQ VQMA v3.1.6.1, file VQMA.INI created Thu Jun 27 21:52:47 2013
[Y_BLACK_LEVEL_]
Y_BLACK_LEVEL_UNIT=%
Y_BLACK_LEVEL_MIN=-5.00
Y_BLACK_LEVEL_MAX=5.00
[Y_WHITE_LEVEL_]
Y_WHITE_LEVEL_UNIT=%
Y_WHITE_LEVEL_MIN=95.00
Y_WHITE_LEVEL_MAX=105.00
[Y_SNR_]
Y_SNR_UNIT=dB
Y_SNR_MIN=40.00
[K_RATING_]
K_RATING_UNIT=%
K_RATING_MAX=3.00
[UV_Y_GAIN_]
UV_Y_GAIN_UNIT=dB
UV_Y_GAIN_MIN=-1.00
UV_Y_GAIN_MAX=1.00
[Y_GAMMA_]
Y_GAMMA_UNIT=
Y_GAMMA_MIN=1.80
Y_GAMMA_MAX=2.50
[RGB_BALANCE_ERROR_]
RGB_BALANCE_ERROR_UNIT=%
RGB_BALANCE_ERROR_MAX=10.00
[Y_RANGE_BLACK_ERROR_]
Y_RANGE_BLACK_ERROR_UNIT=%
Y_RANGE_BLACK_ERROR_MAX=15.00
[Y_RANGE_WHITE_ERROR_]
Y_RANGE_WHITE_ERROR_UNIT=%
Y_RANGE_WHITE_ERROR_MAX=15.00
[FREQUENCY_RESPONSE_1_]
FREQUENCY_RESPONSE_1_UNIT=dB
FREQUENCY_RESPONSE_1_MIN=-1.00
FREQUENCY_RESPONSE_1_MAX=0.50
[FREQUENCY_RESPONSE_2_]
FREQUENCY_RESPONSE_2_UNIT=dB
FREQUENCY_RESPONSE_2_MIN=-2.00
FREQUENCY_RESPONSE_2_MAX=1.00
[FREQUENCY_RESPONSE_3_]
FREQUENCY_RESPONSE_3_UNIT=dB
FREQUENCY_RESPONSE_3_MIN=-3.00
FREQUENCY_RESPONSE_3_MAX=1.00
[FREQUENCY_RESPONSE_4_]
FREQUENCY_RESPONSE_4_UNIT=dB
FREQUENCY_RESPONSE_4_MIN=-4.00
FREQUENCY_RESPONSE_4_MAX=1.00
[FREQUENCY_RESPONSE_5_]
FREQUENCY_RESPONSE_5_UNIT=dB
FREQUENCY_RESPONSE_5_MIN=-5.00
FREQUENCY_RESPONSE_5_MAX=1.00
[FREQUENCY_RESPONSE_6_]
FREQUENCY_RESPONSE_6_UNIT=dB
FREQUENCY_RESPONSE_6_MIN=-6.00
FREQUENCY_RESPONSE_6_MAX=1.00
© 2005-2014 by VideoQ Inc, all rights reserved
48
49
VQMA User Manual
Running VQMA in Command Line Mode
10 Running VQMA in Command Line Mode
VQMA.EXE can be used in DOS window under Windows in unattended (robotic) mode.
For example:
vqma -i VQMBconvto2668x1500xnview.yuv -h 2668 -v 1500
or
vqma -i "VQMB conv to 2668 x 1500 xnview.yuv" -h 2668 -v 1500
10.1 Command line parameters
There are two different ways to launch VQMA - GUI Mode and Command Line Mode:
a) To launch VQMA.EXE from Windows DOS box in GUI Mode use the following command
line:
VQMA.exe or VQMA.exe -s <InFileName> [ -y <Format> ] [-h <HSize> -v <VSize>]
where <InFileName> can be full absolute path, relative path, or just a file name (.YUV or .BMP),
which defaults to the same directory where the VQMA executable resides. Long file and folder
names with spaces, file names in double quotes, and localized font encodings are supported.
For example, "VQMA -s *.YUV" command line format is used by VideoQ VQTS series
workstations for automatic transfer of captured YUV data to VQMA executable.
For YUV inputs optional [-h <HSize> -v <VSize>] parameters override auto-detected (default)
values.
b) To run the VQMA.EXE unattended within Windows DOS box use the following command
line:
VQMA.exe -i <InFileName> [-y <Format>] [-o <OutFileName>] [-h <HSize> -v <VSize>]
Optional <OutFileName> can be absolute path, folder name (without extension) or just a file
name. If the whole -o <OutFileName> component or some of its parts are omitted, they are
created automatically - using <InFileName> as a template with the addition of current date and
time.
For example:
<InFileName> = c:\Test\current.yuv
<OutFileName> = c:\MyTests\Report1.txt.
Short Report file will be saved exactly as specified by <OutFileName> full path.
© 2005-2014 by VideoQ Inc, all rights reserved
VQMA User Manual
Running VQMA in Command Line Mode
50
But if <OutFileName> = MyTests (not full path), then it will be interpreted as a sub-folder name
under the source file folder and special unique output file name will be created, adding date and
time to the name of input file and changing its extension to the default .TXT extension.
In such case new MyTests folder will be created and Short Report will be automatically saved as
c:\Test\MyTests\current_YYYYMMDD_HHMMSS.txt
Optional -y flag and following <Format> parameter allow to switch between two alternative
multiplexing formats of YUV data: UYVY and YUV2 (YUYV).
Four characters long <Format> string should be either uyvy or yuv2. If -y flag is not present
VQMA defaults to UYVY format.
The -i (or -ia), -s, -y, -o, -h and -v option flags should be entered as is.
Only -i (-ia) flag is mandatory.
All command line flags are in lower case with no gap between dash and flag letter.
The extension of <OutFileName> could be any; recommended formats are: .txt and .csv. Note that
<OutFileName> without extension means folder name, not file name.
VQMA uses Windows Registry to detect the presence of PDFCreator printer program (supplied
and installed separately under GNU license).
PDFCreator printer driver is called by special -f flag replacing -o flag in the command line. Then
Test Report is created in PDF format by unattended background printing.
Rules for Report folder and Report file name designation are as in -o mode, but full multi-page
PDF document is produced instead of TXT/CSV Short Report.
If -f flag is used but PDFCreator driver is not detected, then VQMA defaults to -o mode, resulting
in TXT/CSV Short Report file creation.
In some systems the total command line string length or full path string length could be restricted ,
e.g. not more than 256 bytes, so it make sense to keep command line length below this limit.
Usage of command line flag -i means that VQMA will open *.INI file with path and file name,
matching the specified YUV/BMP test file.
For example: VQMA.exe -i c:/tt/current.yuv command line implies use of c:/tt/current.ini file.
However, if (instead of -i flag) the extended -ia flag is used, then VQMA will open default
VQMA.INI file available at default location, i.e. in the folder where VQMA executable resides.
Note that another folder containing copy of VQMA.EXE executable may contain another
VQMA.INI file with different settings.
If necessary, multiple run instances, successive or variable commands can be organized using
standard Windows batch files or scripts.
© 2005-2014 by VideoQ Inc, all rights reserved
51
VQMA User Manual
Terms and Abbreviations
11 Terms and Abbreviations
Term
Explanation
3G-SDI
3 Gbps Serial Digital Interface (short name 3G)
CSV
Comma Separated Values (File Format)
CVBS
Color, Video, Blanking and Sync (Composite Video Signal)
DVI
Digital Visual Interface (Video interface for digital displays)
HDMI
High-Definition Multimedia Interface (also Video interface for digital displays)
NTSC
National Television Systems Committee (also a TV Standard name)
PAL
Phase Alternate Lines (TV Standard)
RMS
Root Mean Square (Value - noise strength estimate)
SDI
Serial Digital Interface (HD version known as HD-SDI)
SNR
Signal To Noise Ratio
SMPTE
Society of Motion Pictures and Television Engineers
TXT
Text (File Format, for VQMA software purposes - same as CSV)
UV
Color Difference Video Signals: U (CB) & V (CR)
Y
Luminance Video Signal
YPrPb
Analog Video Interface Format (also called YUV)
YUV
Digital Component 4:2:2 Multiplex (also a File Format)
© 2005-2014 by VideoQ Inc, all rights reserved
HelpAndManual_unregistered_evaluation_copy
VideoQ Inc