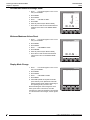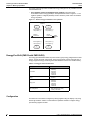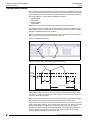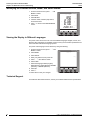
1
PowerLogic™ Series 800 Power Meter PM810, PM820, PM850, & PM870 User Guide 63230-500-225A2 03/2011 PowerLogicTM Series 800 Power Meter 63230-500-225A2 3/2011 HAZARD CATEGORIES AND SPECIAL SYMBOLS Read these instructions carefully and look at the equipment to become familiar with the device before trying to install, operate, service, or maintain it. The following special messages may appear throughout this bulletin or on the equipment to warn of potential hazards or to call attention to information that clarifies or simplifies a procedure. The addition of either symbol to a “Danger” or “Warning” safety label indicates that an electrical hazard exists which will result in personal injury if the instructions are not followed. This is the safety alert symbol. It is used to alert you to potential personal injury hazards. Obey all safety messages that follow this symbol to avoid possible injury or death. DANGER DANGER indicates an imminently hazardous situation which, if not avoided, will result in death or serious injury. WARNING WARNING indicates a potentially hazardous situation which, if not avoided, can result in death or serious injury. CAUTION CAUTION indicates a potentially hazardous situation which, if not avoided, can result in minor or moderate injury. CAUTION CAUTION, used without the safety alert symbol, indicates a potentially hazardous situation which, if not avoided, can result in property damage. NOTE: Provides additional information to clarify or simplify a procedure. PLEASE NOTE Electrical equipment should be installed, operated, serviced, and maintained only by qualified personnel. No responsibility is assumed by Schneider Electric for any consequences arising out of the use of this material. CLASS A FCC STATEMENT This equipment has been tested and found to comply with the limits for a Class A digital device, pursuant to part 15 of the FCC Rules. These limits are designed to provide reasonable protection against harmful interference when the equipment is operated in a commercial environment. This equipment generates, uses, and can radiate radio frequency energy and, if not installed and used in accordance with the instruction manual, may cause harmful interference to radio communications. Operation of this equipment in a residential area is likely to cause harmful interference in which case the user will be required to correct the interference at his own expense. This Class A digital apparatus complies with Canadian ICES-003. © 2011 Schneider Electric. All Rights Reserved. iii PowerLogicTM Series 800 Power Meter iv 63230-500-225A2 3/2011 © 2011 Schneider Electric. All Rights Reserved. PowerLogicTM Series 800 Power Meter Contents 63230-500-225A2 3/2011 Contents Chapter 1—Introduction - - - - - - - - - - - - - - - - - - - - - - - - - - - - - - - - - - - - - - - - - - - - Topics Not Covered In This Manual - - - - - - - - - - - - - - - - - - - - - - - - - - - - - - - - - - What is a Power Meter? - - - - - - - - - - - - - - - - - - - - - - - - - - - - - - - - - - - - - - - - - - Power Meter Hardware - - - - - - - - - - - - - - - - - - - - - - - - - - - - - - - - - - - - - - - - - - - Box Contents - - - - - - - - - - - - - - - - - - - - - - - - - - - - - - - - - - - - - - - - - - - - - - - - - - Features - - - - - - - - - - - - - - - - - - - - - - - - - - - - - - - - - - - - - - - - - - - - - - - - - - - - - Firmware - - - - - - - - - - - - - - - - - - - - - - - - - - - - - - - - - - - - - - - - - - - - - - - - - - - - - - 1 1 1 2 6 7 7 Chapter 2—Safety Precautions - - - - - - - - - - - - - - - - - - - - - - - - - - - - - - - - - - - - - - - - 9 Chapter 3—Operation - - - - - - - - - - - - - - - - - - - - - - - - - - - - - - - - - - - - - - - - - - - - - Power Meter Display - - - - - - - - - - - - - - - - - - - - - - - - - - - - - - - - - - - - - - - - - - - - How the Buttons Work - - - - - - - - - - - - - - - - - - - - - - - - - - - - - - - - - - - - - - - - - - - Changing Values - - - - - - - - - - - - - - - - - - - - - - - - - - - - - - - - - - - - - - - - - - - - - - Menu Overview - - - - - - - - - - - - - - - - - - - - - - - - - - - - - - - - - - - - - - - - - - - - - - - Power Meter Setup - - - - - - - - - - - - - - - - - - - - - - - - - - - - - - - - - - - - - - - - - - - - - Power Meter Resets - - - - - - - - - - - - - - - - - - - - - - - - - - - - - - - - - - - - - - - - - - - - Power Meter Diagnostics - - - - - - - - - - - - - - - - - - - - - - - - - - - - - - - - - - - - - - - - - - 11 11 11 11 11 13 23 25 Chapter 4—Metering Capabilities - - - - - - - - - - - - - - - - - - - - - - - - - - - - - - - - - - - - Real-Time Readings - - - - - - - - - - - - - - - - - - - - - - - - - - - - - - - - - - - - - - - - - - - - Power Factor Min/Max Conventions - - - - - - - - - - - - - - - - - - - - - - - - - - - - - - - - - Power Factor Sign Conventions - - - - - - - - - - - - - - - - - - - - - - - - - - - - - - - - - - - - Demand Readings - - - - - - - - - - - - - - - - - - - - - - - - - - - - - - - - - - - - - - - - - - - - - Energy Readings - - - - - - - - - - - - - - - - - - - - - - - - - - - - - - - - - - - - - - - - - - - - - - Energy-Per-Shift (PM810 with PM810LOG) - - - - - - - - - - - - - - - - - - - - - - - - - - - - Power Analysis Values - - - - - - - - - - - - - - - - - - - - - - - - - - - - - - - - - - - - - - - - - - - 27 27 28 29 30 35 36 37 Chapter 5—Input/Output Capabilities - - - - - - - - - - - - - - - - - - - - - - - - - - - - - - - - - Digital Inputs - - - - - - - - - - - - - - - - - - - - - - - - - - - - - - - - - - - - - - - - - - - - - - - - - Demand Synch Pulse Input - - - - - - - - - - - - - - - - - - - - - - - - - - - - - - - - - - - - - - - Relay Output Operating Modes - - - - - - - - - - - - - - - - - - - - - - - - - - - - - - - - - - - - Solid-state KY Pulse Output - - - - - - - - - - - - - - - - - - - - - - - - - - - - - - - - - - - - - - - Fixed Pulse Output - - - - - - - - - - - - - - - - - - - - - - - - - - - - - - - - - - - - - - - - - - - - Calculating the Kilowatthour-Per-Pulse Value - - - - - - - - - - - - - - - - - - - - - - - - - - Analog Inputs - - - - - - - - - - - - - - - - - - - - - - - - - - - - - - - - - - - - - - - - - - - - - - - - - Analog Outputs - - - - - - - - - - - - - - - - - - - - - - - - - - - - - - - - - - - - - - - - - - - - - - - - - 39 39 40 40 42 43 43 44 44 Chapter 6—Alarms - - - - - - - - - - - - - - - - - - - - - - - - - - - - - - - - - - - - - - - - - - - - - - - Basic Alarms - - - - - - - - - - - - - - - - - - - - - - - - - - - - - - - - - - - - - - - - - - - - - - - - - - - Basic Alarm Groups - - - - - - - - - - - - - - - - - - - - - - - - - - - - - - - - - - - - - - - - - - - - Setpoint-driven Alarms - - - - - - - - - - - - - - - - - - - - - - - - - - - - - - - - - - - - - - - - - - Priorities - - - - - - - - - - - - - - - - - - - - - - - - - - - - - - - - - - - - - - - - - - - - - - - - - - - - Viewing Alarm Activity and History - - - - - - - - - - - - - - - - - - - - - - - - - - - - - - - - - - Types of Setpoint-controlled Functions - - - - - - - - - - - - - - - - - - - - - - - - - - - - - - - Scale Factors - - - - - - - - - - - - - - - - - - - - - - - - - - - - - - - - - - - - - - - - - - - - - - - - - Scaling Alarm Setpoints - - - - - - - - - - - - - - - - - - - - - - - - - - - - - - - - - - - - - - - - - Alarm Conditions and Alarm Numbers - - - - - - - - - - - - - - - - - - - - - - - - - - - - - - - Advanced Alarms- - - - - - - - - - - - - - - - - - - - - - - - - - - - - - - - - - - - - - - - - - - - - - - - Advanced Alarm Groups - - - - - - - - - - - - - - - - - - - - - - - - - - - - - - - - - - - - - - - - - Alarm Levels - - - - - - - - - - - - - - - - - - - - - - - - - - - - - - - - - - - - - - - - - - - - - - - - - Viewing Alarm Activity and History - - - - - - - - - - - - - - - - - - - - - - - - - - - - - - - - - - Alarm Conditions and Alarm Numbers - - - - - - - - - - - - - - - - - - - - - - - - - - - - - - - - 45 45 45 46 47 47 47 49 50 50 53 53 54 54 55 Chapter 7—Logging - - - - - - - - - - - - - - - - - - - - - - - - - - - - - - - - - - - - - - - - - - - - - - Introduction - - - - - - - - - - - - - - - - - - - - - - - - - - - - - - - - - - - - - - - - - - - - - - - - - - Memory Allocation for Log Files - - - - - - - - - - - - - - - - - - - - - - - - - - - - - - - - - - - - Alarm Log - - - - - - - - - - - - - - - - - - - - - - - - - - - - - - - - - - - - - - - - - - - - - - - - - - - Maintenance Log - - - - - - - - - - - - - - - - - - - - - - - - - - - - - - - - - - - - - - - - - - - - - - Data Logs - - - - - - - - - - - - - - - - - - - - - - - - - - - - - - - - - - - - - - - - - - - - - - - - - - - Billing Log - - - - - - - - - - - - - - - - - - - - - - - - - - - - - - - - - - - - - - - - - - - - - - - - - - - - 57 57 58 58 58 60 61 © 2011 Schneider Electric. All Rights Reserved. v PowerLogicTM Series 800 Power Meter Contents 63230-500-225A2 3/2011 Chapter 8—Waveform Capture - - - - - - - - - - - - - - - - - - - - - - - - - - - - - - - - - - - - - - -63 Introduction - - - - - - - - - - - - - - - - - - - - - - - - - - - - - - - - - - - - - - - - - - - - - - - - - - - -63 Waveform Capture - - - - - - - - - - - - - - - - - - - - - - - - - - - - - - - - - - - - - - - - - - - - - - -63 Waveform Storage - - - - - - - - - - - - - - - - - - - - - - - - - - - - - - - - - - - - - - - - - - - - - - -64 How the Power Meter Captures an Event - - - - - - - - - - - - - - - - - - - - - - - - - - - - - - -64 Channel Selection in PowerLogic Software - - - - - - - - - - - - - - - - - - - - - - - - - - - - - -64 Chapter 9—Disturbance Monitoring (PM870) - - - - - - - - - - - - - - - - - - - - - - - - - - - - -65 About Disturbance Monitoring - - - - - - - - - - - - - - - - - - - - - - - - - - - - - - - - - - - - - - -65 Capabilities of the PM870 During an Event - - - - - - - - - - - - - - - - - - - - - - - - - - - - - -67 Chapter 10—Maintenance and Troubleshooting - - - - - - - - - - - - - - - - - - - - - - - - - -69 Introduction - - - - - - - - - - - - - - - - - - - - - - - - - - - - - - - - - - - - - - - - - - - - - - - - - - - -69 Power Meter Memory - - - - - - - - - - - - - - - - - - - - - - - - - - - - - - - - - - - - - - - - - - - - -69 Identifying the Firmware Version, Model, and Serial Number - - - - - - - - - - - - - - - - -70 Viewing the Display in Different Languages - - - - - - - - - - - - - - - - - - - - - - - - - - - - -70 Technical Support - - - - - - - - - - - - - - - - - - - - - - - - - - - - - - - - - - - - - - - - - - - - - - -70 Troubleshooting - - - - - - - - - - - - - - - - - - - - - - - - - - - - - - - - - - - - - - - - - - - - - - - - -71 Appendix A—Instrument Transformer Wiring: Troubleshooting Tables - - - - - - - - 73 Using This Appendix - - - - - - - - - - - - - - - - - - - - - - - - - - - - - - - - - - - - - - - - - - - - -73 Section I: Common Problems for 3-Wire and 4-Wire Systems - - - - - - - - - - - - - - - -74 Section II: 3-Wire System Troubleshooting - - - - - - - - - - - - - - - - - - - - - - - - - - - - - -75 Section III: 4-Wire System Troubleshooting - - - - - - - - - - - - - - - - - - - - - - - - - - - - -76 Field Example - - - - - - - - - - - - - - - - - - - - - - - - - - - - - - - - - - - - - - - - - - - - - - - - - -78 Appendix B—Register List - - - - - - - - - - - - - - - - - - - - - - - - - - - - - - - - - - - - - - - - - - 79 Register List Access - - - - - - - - - - - - - - - - - - - - - - - - - - - - - - - - - - - - - - - - - - - - - -79 About Registers - - - - - - - - - - - - - - - - - - - - - - - - - - - - - - - - - - - - - - - - - - - - - - - - -79 How Date and Time are Stored in Registers - - - - - - - - - - - - - - - - - - - - - - - - - - - - -80 How Signed Power Factor is Stored in the Register - - - - - - - - - - - - - - - - - - - - - - - -80 Supported Modbus Commands - - - - - - - - - - - - - - - - - - - - - - - - - - - - - - - - - - - - - -81 Resetting Registers - - - - - - - - - - - - - - - - - - - - - - - - - - - - - - - - - - - - - - - - - - - - - -81 Appendix C—Using the Command Interface- - - - - - - - - - - - - - - - - - - - - - - - - - - - - 83 Overview of the Command Interface - - - - - - - - - - - - - - - - - - - - - - - - - - - - - - - - - -83 Operating Outputs from the Command Interface - - - - - - - - - - - - - - - - - - - - - - - - - -86 Using the Command Interface to Change Configuration Registers - - - - - - - - - - - - -86 Conditional Energy - - - - - - - - - - - - - - - - - - - - - - - - - - - - - - - - - - - - - - - - - - - - - - -87 Incremental Energy - - - - - - - - - - - - - - - - - - - - - - - - - - - - - - - - - - - - - - - - - - - - - -88 Setting Up Individual Harmonic Calculations - - - - - - - - - - - - - - - - - - - - - - - - - - - - -89 Changing Scale Factors - - - - - - - - - - - - - - - - - - - - - - - - - - - - - - - - - - - - - - - - - - -90 Enabling Floating-point Registers - - - - - - - - - - - - - - - - - - - - - - - - - - - - - - - - - - - -91 Appendix D—Advanced Power Quality Evaluations - - - - - - - - - - - - - - - - - - - - - - - 93 Power Quality Standards - - - - - - - - - - - - - - - - - - - - - - - - - - - - - - - - - - - - - - - - - -93 SEMI-F47/ITI (CBEMA) Specification - - - - - - - - - - - - - - - - - - - - - - - - - - - - - - - - - -93 EN50160:2000 Specification - - - - - - - - - - - - - - - - - - - - - - - - - - - - - - - - - - - - - - - -95 How Evaluation Results Are Reported - - - - - - - - - - - - - - - - - - - - - - - - - - - - - - - - -95 Possible Configurations Through Register Writes - - - - - - - - - - - - - - - - - - - - - - - - -96 Evaluation During Normal Operation - - - - - - - - - - - - - - - - - - - - - - - - - - - - - - - - - -96 Evaluations During Abnormal Operation - - - - - - - - - - - - - - - - - - - - - - - - - - - - - - - -97 Operation with PQ Advanced Enabled - - - - - - - - - - - - - - - - - - - - - - - - - - - - - - - - -99 Advanced Power Quality Evaluation System Configuration and Status Registers [EN50160 and SEMI-F47/ITI (CBEMA)] - - - - - - - - - - - - - - - -99 EN50160 Evaluation Data Available Over a Communications Link - - - - - - - - - - - - 101 Setting Up PQ Advanced Evaluation from the Display - - - - - - - - - - - - - - - - - - - - - 104 Glossary - - - - - - - - - - - - - - - - - - - - - - - - - - - - - - - - - - - - - - - - - - - - - - - - - - - - - - - 105 Terms - - - - - - - - - - - - - - - - - - - - - - - - - - - - - - - - - - - - - - - - - - - - - - - - - - - - - - - 105 Abbreviations and Symbols - - - - - - - - - - - - - - - - - - - - - - - - - - - - - - - - - - - - - - - - 107 Index - - - - - - - - - - - - - - - - - - - - - - - - - - - - - - - - - - - - - - - - - - - - - - - - - - - - - - - - - - 109 vi © 2011 Schneider Electric. All Rights Reserved. PowerLogicTM Series 800 Power Meter Chapter 1—Introduction 63230-500-225A2 3/2011 Chapter 1—Introduction This user guide explains how to operate and configure a PowerLogic™ Series 800 Power Meter. Unless otherwise noted, the information contained in this manual refers to the following power meters: • • • Power meter with integrated display Power meter without a display Power meter with a remote display Refer to “Power Meter Parts and Accessories” on page 5 for all models and model numbers. For a list of supported features, see “Features” on page 7. NOTE: The power meter units on the PM810, PM810U, and the PM810RD are functionally equivalent. Topics Not Covered In This Manual Some of the power meter’s advanced features, such as on-board data logs and alarm log files, can only be set up via the communications link using PowerLogic software. This power meter user guide describes these advanced features but does not explain how to set them up. For information on using these features, refer to your software’s online help or user guide. What is a Power Meter? A power meter is a multifunction, digital instrumentation, data acquisition and control device. It can replace a variety of meters, relays, transducers, and other components. This power meter is equipped with RS485 communications for integration into any power monitoring/control system and can be installed at multiple locations within a facility. These are true rms meters, capable of exceptionally accurate measurement of highly non-linear loads. A sophisticated sampling technique enables accurate measurements through the 63rd harmonic➀. You can view over 50 metered values, plus minimum and maximum data, either from the display or remotely using software. Table 1–1 summarizes the readings available from the power meter. Table 1–1: Summary of power meter instrumentation Real-time Readings Power Analysis • • • • • • • • • • • • • • • • Current (per phase, residual, 3-Phase) Voltage (L–L, L–N, 3-Phase) Real Power (per phase, 3-Phase Reactive Power (per phase, 3-Phase Apparent Power (per phase, 3-Phase Power Factor (per phase, 3-Phase Frequency THD (current and voltage) • Displacement Power Factor (per phase, 3-Phase Fundamental Voltages (per phase) Fundamental Currents (per phase) Fundamental Real Power (per phase) Fundamental Reactive Power (per phase) Unbalance (current and voltage) Phase Rotation Current and Voltage Harmonic Magnitudes and ➀ Angles (per phase) Sequence Components Energy Readings Demand Readings • • • • • • • • Accumulated Energy, Real Accumulated Energy, Reactive Accumulated Energy, Apparent Bidirectional Readings Reactive Energy by Quadrant Incremental Energy Conditional Energy • • • • • • Demand Current (per phase present, 3-Phase avg.) Average Power Factor (3-Phase total) Demand Real Power (per phase present, peak) Demand Reactive Power (per phase present, peak) Demand Apparent Power (per phase present, peak) Coincident Readings Predicted Power Demands ➀ Individual harmonics are not calculated in the PM810. The PM810 with PM810LOG, and the PM820, calculate distortion to the 31st harmonic. The PM850 and PM870 calculate distortion to the 63rd harmonic. © 2011 Schneider Electric. All Rights Reserved. 1 PowerLogicTM Series 800 Power Meter 63230-500-225A2 3/2011 Chapter 1—Introduction Power Meter Hardware Power Meter With Integrated Display Figure 1–1: Parts of the Series 800 Power Meter with integrated display Bottom View 2 1 3 4 5 6 8 Back View 7 Table 1–2: Parts of the Series 800 Power Meter with integrated display No. Part 2 Description 1 Control power supply connector Connection for control power to the power meter. 2 Voltage inputs Voltage metering connections. 3 I/O connector KY pulse output/digital input connections. 4 Heartbeat LED A green flashing LED indicates the power meter is ON. 5 RS-485 port (COM1) The RS-485 port is used for communications with a monitoring and control system. This port can be daisy-chained to multiple devices. 6 Option module connector Used to connect an option module to the power meter. 7 Current inputs Current metering connections. 8 Integrated display Visual interface to configure and operate the power meter. © 2011 Schneider Electric. All Rights Reserved. PowerLogicTM Series 800 Power Meter Chapter 1—Introduction 63230-500-225A2 3/2011 Power Meter Without Display Figure 1–2: Parts of the Series 800 Power Meter without display Bottom View 3 4 2 1 5 6 Back View 7 Table 1–3: Parts of the Series 800 Power Meter without display No. Part Description 1 Control power supply connector Connection for control power to the power meter. 2 Voltage inputs Voltage metering connections. 3 I/O connector KY pulse output/digital input connections. 4 Heartbeat LED A green flashing LED indicates the power meter is ON. 5 RS-485 port (COM1) The RS-485 port is used for communications with a monitoring and control system. This port can be daisy-chained to multiple devices. 6 Option module connector Used to connect an option module to the power meter. 7 Current inputs Current metering connections. © 2011 Schneider Electric. All Rights Reserved. 3 PowerLogicTM Series 800 Power Meter 63230-500-225A2 3/2011 Chapter 1—Introduction Power Meter With Remote Display NOTE: The remote display kit (PM8RD) is used with a power meter without a display. See “Power Meter Without Display” on page 3 for the parts of the power meter without a display. Figure 1–3: Parts of the remote display and the remote display adapter 1 2 4 5 6 7 8 3 TX/RX PM8RDA Top View Table 1–4: Parts of the remote display No. Part 1 4 Description Provides the connection between the remote display and the Remote display adapter (PM8RDA) power meter. Also provides an additional RS232/RS485 connection (2- or 4-wire). 2 Cable CAB12 3 Remote display (PM8D) Connects the remote display to the remote display adapter. Visual interface to configure and operate the power meter. 4 Communications mode button Use to select the communications mode (RS232 or RS485). 5 Communications mode LED When lit, the LED indicates the communications port is in RS232 mode. 6 RS232/RS485 port This port is used for communications with a monitoring and control system. This port can be daisy-chained to multiple devices. 7 Tx/Rx Activity LED The LED flashes to indicate communications activity. 8 CAB12 port Port for the CAB12 cable used to connect the remote display to the remote display adapter. © 2011 Schneider Electric. All Rights Reserved. PowerLogicTM Series 800 Power Meter Chapter 1—Introduction 63230-500-225A2 3/2011 Power Meter Parts and Accessories Table 1–5: Power Meter Parts and Accessories Model Number Description Square D Schneider Electric Power meters ➀ PM810 ➁ PM820 ➂ PM850 ➃ PM870 ➀ PM810U ➁ PM820U ➂ PM850U ➃ PM870U ➀ PM810RD ➁ PM820RD ➂ PM850RD ➃ PM870RD ➀ PM810MG ➁ PM820MG ➂ PM850MG ➃ PM870MG ➀ PM810UMG ➁ PM820UMG ➂ PM850UMG ➃ PM870UMG ➀ PM810RDMG ➁ PM820RDMG ➂ PM850RDMG ➃ PM870RDMG Remote display with remote display adapter PM8RD PM8RDMG Remote display adapter PM8RDA Input/Output modules PM8M22, PM8M26, PM8M2222 PM810 logging module PM810LOG Cable (12 feet) extender kit for displays RJ11EXT Retrofit gasket (for 4 in. round hole mounting) PM8G CM2000 retrofit mounting adapter PM8MA Power meter with integrated display Power meter without display Power meter with remote display Accessories ➀ The power meter units for these models are identical and support the same features (see “Features” on page 7). ➁ The power meter units for these models are identical and support the same features (see “Features” on page 7). ➂ The power meter units for these models are identical and support the same features (see “Features” on page 7). ➃ The power meter units for these models are identical and support the same features (see “Features” on page 7). © 2011 Schneider Electric. All Rights Reserved. 5 PowerLogicTM Series 800 Power Meter 63230-500-225A2 3/2011 Chapter 1—Introduction Box Contents Table 1–6: Box contents based on model Model Description Box Contents • • • Power Meter with integrated display Hardware kit (63230-500-16) containing: — Two retainer clips — Template — Plug set — Terminator MCT2W Power Meter installation guides (EN, FR, ES, DE) • Power Meter specification guide • • • Power Meter without display Hardware kit (63230-500-16) containing: — Two retainer clips — Template — DIN Slide (installed at factory) — Plug set — Terminator MCT2W Power Meter installation guides (EN, FR, ES, DE) • Power Meter specification guide • • • • • Power Meter without display Remote display (PM8D) Remote display adapter (PM8RDA) Hardware kit (63230-500-16) containing: — Two retainer clips — Template — DIN Slide (installed at factory) — Plug set — Terminator MCT2W Hardware kit (63230-500-96) containing: — Communication cable (CAB12) — Mounting screws Hardware kit (63230-500-163) containing: • — Com 2 RS-485 4-wire plug — Crimp connector Power Meter installation guides (EN, FR, ES, DE) • Power Meter specification guide Power Meter with Integrated Display Power Meter without Display Power Meter with Remote Display 6 • © 2011 Schneider Electric. All Rights Reserved. PowerLogicTM Series 800 Power Meter Chapter 1—Introduction 63230-500-225A2 3/2011 Features Table 1–7: Series 800 Power Meter Features PM810 PM820 PM850 PM870 True rms metering to the 63rd harmonic (3) (3) Accepts standard CT and PT inputs 600 volt direct connection on voltage inputs High accuracy — 0.075% current and voltage (typical conditions) Min/max readings of metered data Input metering (five channels) with PM8M22, PM8M26, or PM8M2222 installed Power quality readings — THD Downloadable firmware Easy setup through the integrated or remote display (password protected) Setpoint-controlled alarm and relay functions On-board alarm logging Wide operating temperature range: –25° to +70°C for the power meter unit On-board: one Modbus RS485 (2-wire) PM8RD: one configurable Modbus RS232/RS485 (2- or 4-wire) Active energy accuracy: ANSI C12.20 Class 0.2S and IEC 62053-22 Class 0.5S Non-volatile clock (1) On-board data logging (2) 80 KB 800 KB 800 KB — — — Communications: Real-time harmonic magnitudes and angles (I and V): To the 31st harmonic (3) To the 63rd harmonic Waveform capture Standard — — Advanced — — — — — — — — — — — EN50160 evaluations NOTE: The PM850 performs EN50160 evaluations based on standard alarms, while the PM870 performs EN50160 evaluations based on disturbance alarms. ITI (CBEMA) and SEMI-F47 evaluations NOTE: The PM870 performs ITI (CBEMA) and SEMI-F47 evaluations based on disturbance alarms. Current and voltage sag/swell detection and logging (1) The Time Clock in the PM810 with PM810LOG is non-volatile. However, it is volatile in the PM810. (2) The on-board data logging memory in the PM810 with PM810LOG is 80 KB, but it is not available in the PM810. (3) The PM810 with PM810LOG and the PM820 monitor distortion to the 31st harmonic. Harmonic distortion is not monitored in the PM810. Firmware This user guide is written to be used with firmware version 11.xx and above. See “Identifying the Firmware Version, Model, and Serial Number” on page 70 for instructions on how to determine the firmware version. To download the latest firmware version, follow the steps below: 1. Using a web browser, go to http://www.Schneider-Electric.com. 2. Locate the Search box in the upper right corner of the home page. 3. In the Search box enter “PM8”. 4. In the drop-down box click on the selection “PM800 series”. 5. Locate the downloads area on the right side of the page and click on “Software/Firmware”. 6. Click on the applicable firmware version title (i.e. “PowerLogic Series 800 Power Meter Firmware version 12.100”). 7. Download and run the “xxx.exe” firmware upgrade file provided. © 2011 Schneider Electric. All Rights Reserved. 7 PowerLogicTM Series 800 Power Meter Chapter 1—Introduction 8 63230-500-225A2 3/2011 © 2011 Schneider Electric. All Rights Reserved. PowerLogicTM Series 800 Power Meter Chapter 2—Safety Precautions 63230-500-225A2 3/2011 Chapter 2—Safety Precautions DANGER HAZARD OF ELECTRIC SHOCK, EXPLOSION OR ARC FLASH • Apply appropriate personal protective equipment (PPE) and follow safe electrical practices. For example, in the United States, see NFPA 70E. • This equipment must only be installed and serviced by qualified electrical personnel. • NEVER work alone. • Before performing visual inspections, tests, or maintenance on this equipment, disconnect all sources of electric power. Assume that all circuits are live until they have been completely de-energized, tested, and tagged. Pay particular attention to the design of the power system. Consider all sources of power, including the possibility of backfeeding. • Turn off all power supplying this equipment before working on or inside equipment. • Always use a properly rated voltage sensing device to confirm that all power is off. • Beware of potential hazards and carefully inspect the work area for tools and objects that may have been left inside the equipment. • Use caution while removing or installing panels so that they do not extend into the energized bus; avoid handling the panels, which could cause personal injury. • The successful operation of this equipment depends upon proper handling, installation, and operation. Neglecting fundamental installation requirements may lead to personal injury as well as damage to electrical equipment or other property. • Before performing Dielectric (Hi-Pot) or Megger testing on any equipment in which the power meter is installed, disconnect all input and output wires to the power meter. High voltage testing may damage electronic components contained in the power meter. • Always use grounded external CTs for current inputs. Failure to follow these instructions will result in death or serious injury. © 2011 Schneider Electric. All Rights Reserved. 9 PowerLogicTM Series 800 Power Meter Chapter 2—Safety Precautions 10 63230-500-225A2 3/2011 © 2011 Schneider Electric. All Rights Reserved. PowerLogicTM Series 800 Power Meter Chapter 3—Operation 63230-500-225A2 3/2011 Chapter 3—Operation This section explains the features of the power meter display and the power meter setup procedures using this display. For a list of all power meter models containing an integrated display or a remote display, see Table 1–5 on page 5. Power Meter Display The power meter is equipped with a large, back-lit liquid crystal display (LCD). It can display up to five lines of information plus a sixth row of menu options. Figure 3–1 shows the different parts of the power meter display. Figure 3–1: Power Meter Display A. Type of measurement A B C D B. Screen title C. Alarm indicator D. Maintenance icon E. Bar chart (%) F. Units (A, V, etc.) M H. Menu item Selected menu indicator J. Button G. Display more menu items I. L K. Return to previous menu L. Values G PLSD110097 M. Phase E F K J I H How the Buttons Work The buttons are used to select menu items, display more menu items in a menu list, and return to previous menus. A menu item appears over one of the four buttons. Pressing a button selects the menu item and displays the menu item’s screen. When you have reached the highest menu level, a black triangle appears beneath the selected menu item. To return to the previous menu level, press the button below 1;. To scroll through the menu items in a menu list, press the button below ###: (see Figure 3–1). NOTE: Each time you read “press” in this manual, press and release the appropriate button beneath the menu item. For example, if you are asked to “Press PHASE,” you would press the button below the PHASE menu item. Changing Values When a value is selected, it flashes to indicate that it can be modified. A value is changed by doing the following: • • Press + (plus) or - (minus) to change numbers or scroll through available options. • To save your changes and move to the next field, press OK. If you are entering more than a single-digit number, press <-- to move to the next higher numeric position. Menu Overview Figure 3–2 on page 12, shows the first two levels of the power meter menu. Level 1 contains all of the top level menu items. Selecting a Level 1 menu item takes you to the corresponding Level 2 menu items. Additional menu levels may be provided, depending on the specific meter features and options. NOTE: Press ###: to scroll through all menu items on a given level. © 2011 Schneider Electric. All Rights Reserved. 11 PowerLogicTM Series 800 Power Meter Chapter 3—Operation 63230-500-225A2 3/2011 Figure 3–2: Abbreviated List of PM800 Menu Items in IEEE (IEC) Mode LEVEL 1 AMPS (I) VOLTS (U-V) LEVEL 2 PHASE I - DMD V L-L (U) UNBAL V L-N (V) PWR (PQS) PWR (PQS) PHASE ENERG (E) Wh VARh PF VAh TRUE P - DMD INC 1 DISPL HZ (F) THD V L-L (U) MINMX HARM MINMX 1 V L-L (U) V L-N (V) AMPS (I) V L-N (V) ALARM ACTIV HIST I/O D OUT D IN I VOLTS (U-V) UNBAL PWR (PQS) PF HZ (F) THD V THD I I A OUT A IN PM8M2222 TIMER CONTR 2 MAINT RESET METER SETUP DATE DIAG 4 METER ENERG (E) TIME REG 4 DMD LANG CLOCK 4 MINMX MODE COMMS (COM) 3 TIMER METER ALARM I/O PASSW TIMER ADVAN COMM1 PM8RD COMM2 D OUT [Digital KY Out] D IN [Digital In] PM8M2222, PM8M26, and PM8M22 PM8M2222 A OUT [Analog Out] A IN [Analog In] ➀ Available on the PM810 only when an optional Power Meter Logging Module (PM810LOG) is installed. Available on all other PM800 Series models. ➁ Available with some models. ➂ Both IEC and IEEE modes are available. Depending on the mode selected, menu labels will be different. See “Display Mode Change” on page 24 to select the desired mode. ➃ The PM810 has a volatile clock. The PM810 with an optional Power Meter Logging Module (PM810LOG), and all other PM800 Series models, have a non-volatile clock. 12 © 2011 Schneider Electric. All Rights Reserved. PowerLogicTM Series 800 Power Meter Chapter 3—Operation 63230-500-225A2 3/2011 Power Meter Setup Power meter setup is typically performed by using the meter’s front panel display. To configure a power meter without a display, you will need a means of communication between the power meter and your computer. Additionally, you will need to install PowerLogic Meter Configuration Software or PowerLogic ION Setup Software on your computer. These can be downloaded from the Schneider’s www.Schneider-Electric.com website. Power meter setup is performed through the meter’s maintenance (MAINT) option. Refer to Figure 3–2 on page 12. Setup features may be programmed individually or in any order. To access the Setup features, follow these steps: SETUP MODE Access 1. Press ###: to scroll through the Level 1 menu until you see MAINT. 2. Press MAINT. 3. Press SETUP. 4. Enter your password, then press OK. The SETUP MODE screen will be displayed. NOTE: The default password is 0000. 5. Press ###: to scroll through the setup features and select the one to be programmed. After programming a feature, you may continue through the remaining features by returning to the SETUP MODE screen and pressing ###: to scroll to additional features. Once you have selected the correct options for each setup parameter, press 1; until the SAVE CHANGES? prompt appears, then press YES. The meter will reset, briefly display the meter info screen, then automatically return to the main screen. Use the menu provided in Figure 3–2 on page 12 to locate the setup features described in the following topics: DATE Setup 1. Perform steps 1 through 5 of the SETUP MODE Access procedure on page 11. 2. Press ###: until DATE is visible. 3. Press DATE. 4. Enter the MONTH number. 5. Press OK. 6. Enter the DAY number. PLSD110218 8. Enter the YEAR number. 10. Select how the date is displayed: M/D/Y, Y/M/D, or D/M/Y). ! ! ""! 7. Press OK. 9. Press OK. 11. Press OK to return to the SETUP MODE screen. 12. Press1; to return to the main screen. 13. To verify the new settings, press MAINT > DIAG > CLOCK. NOTE: The clock in the PM810 is volatile. Each time the meter resets, the PM810 returns to the default clock date/time of 12:00 AM 01-01-1980. See “Date and Time Settings” on page 69 for more information. All other PM800 Series meters have a non-volatile clock which maintains the current date and time when the meter is reset. © 2011 Schneider Electric. All Rights Reserved. 13 PowerLogicTM Series 800 Power Meter Chapter 3—Operation 63230-500-225A2 3/2011 TIME Setup 1. Perform steps 1 through 5 of the SETUP MODE Access procedure on page 11. 2. Press ###: until TIME is visible. 3. Press TIME. 4. Enter the HOUR. 5. Press OK. 6. Enter the MIN (minutes). 7. Press OK. '() #$ %& PLSD110227 8. Enter the SEC (seconds). 9. Press OK. 10. Select how the time is displayed: 24H or AM/PM. 11. Press OK to return to the SETUP MODE screen. 12. Press 1; to return to the main screen. 13. To verify the new settings, press MAINT > DIAG > CLOCK. NOTE: The clock in the PM810 is volatile. Each time the meter resets, the PM810 returns to the default clock date/time of 12:00 AM 01-01-1980. See “Date and Time Settings” on page 69 for more information. All other PM800 Series meters have a non-volatile clock, which maintains the current date and time when the meter is reset. LANG (Language) Setup 1. Perform steps 1 through 5 of the SETUP MODE Access procedure on page 11. *++ 2. Press ###: until LANG is visible. 3. Press LANG. +* 4. Select the language: ENGL (English), FREN (French), SPAN (Spanish), GERMN (German), or RUSSN (Russian). 6. At the SETUP MODE screen, continue programming additional setup features or press1; until you are asked to save changes. 7. Press YES to save the changes. 14 PLSD110103 5. Press OK. © 2011 Schneider Electric. All Rights Reserved. PowerLogicTM Series 800 Power Meter Chapter 3—Operation 63230-500-225A2 3/2011 COMMS (Communications) Setup NOTE: If you are using PowerLogic software to set up the power meter, it is recommended you set up the communications features first. Refer to Table 3-1 for the meter’s default settings. Table 3–1: Communications Default Settings Communications Setting Protocol Default MB.RTU (Modbus RTU) Address 1 Baud Rate 9600 Parity Even The same procedure is used to program the settings for the COMMS, COMM 1, and COMM 2 options. 1. Perform steps 1 through 5 of the SETUP MODE Access procedure on page 11. 2. Press ###: until COMMS (communications) is visible. 3. Press COMMS (communications). 4. Select the required protocol: MB.RTU (Modbus RTU), Jbus, MB. A.8 (Modbus ASCII 8 bits), MB. A.7 (Modbus ASCII 7 bits). 5. Press OK. 7. Press OK. 8. Select the BAUD (baud rate). ,-( . PLSD110100 6. Enter the ADDR (power meter address). 9. Press OK. 10. Select the parity: EVEN, ODD, or NONE. 11. Press OK. 12. At the SETUP MODE screen, continue programming additional setup features or press1; until you are asked to save changes. 13. Press YES to save the changes. METER Setup This feature allows the user to configure the CTs, PTs, system frequency, and system wiring method. CTs Setup 1. Perform steps 1 through 5 of the SETUP MODE Access procedure on page 11. 2. Press ###: until METER is visible. 3. Press METER. 4. Press CT. 5. Enter the PRIM (CT primary) number. 6. Press OK. 7. Enter the SEC. (CT secondary) number. 9. At the SETUP MODE screen, continue programming additional setup features or press1; until you are asked to save changes. PLSD110106 8. Press OK. 10. Press YES to save the changes. © 2011 Schneider Electric. All Rights Reserved. 15 PowerLogicTM Series 800 Power Meter Chapter 3—Operation 63230-500-225A2 3/2011 PTs Setup 1. Perform steps 1 through 5 of the SETUP MODE Access procedure on page 11. 2. Press ###: until METER is visible. / 3. Press METER. 4. Press PT. 5. Enter the SCALE value: x1, x10, x100, NO PT (for direct connect). 6. Press OK. 7. Enter the PRIM (primary) value. PLSD110112 8. Press OK. 9. Enter the SEC. (secondary) value. 10. Press OK. * 11. At the SETUP MODE screen, continue programming additional setup features or press1; until you are asked to save changes. 12. Press YES to save the changes. HZ (System Frequency) Setup 1. Perform steps 1 through 5 of the SETUP MODE Access procedure on page 11. !0)#1(#$2 2. Press ###: until METER is visible. 3. Press METER. 4. Press ###: until HZ is visible. 5. Press HZ. 6. Select the frequency. 7. Press OK. PLSD110109 8. At the SETUP MODE screen, continue programming additional setup features or press1; until you are asked to save changes. 9. Press YES to save the changes. 3 04 SYS (System Type) Setup 1. Perform steps 1 through 5 of the SETUP MODE Access procedure on page 11. 5! 2. Press ###: until METER is visible. 3. Press METER. A 4. Press ###: until SYS is visible. B 5. Press SYS. 7. Press OK. 8. At the SETUP MODE screen, continue programming additional setup features or press1; until you are asked to save changes. C D PLSD110324 6. Select your system (SYS) type (D) based on the number of wires (A), the number of CTs (B), and the number of voltage connections (either direct connect or with PT) (C). 6 ! 9. Press YES to save the changes. 16 © 2011 Schneider Electric. All Rights Reserved. PowerLogicTM Series 800 Power Meter Chapter 3—Operation 63230-500-225A2 3/2011 ALARM (Alarms) Setup There is an extensive list of meter error conditions which can be monitored and cause an alarm. .. 1. Perform steps 1 through 5 of the SETUP MODE Access procedure on page 11. * 2. Press ###: until ALARM is visible. 3. Press ALARM. + 4. Press <- or -> to select the alarm option you want to edit. * 7. Press OK. PLSD110212 5. Press EDIT. 6. Select to ENABL (enable) or DISAB (disable) the alarm. 8. Select the PR (priority): NONE, HIGH, MED, or LOW. 9. Press OK. 10. Select how the alarm values are displayed: ABSOL (absolute value) or RELAT (percentage relative to the running average). .. 11. Enter the PU VALUE (pick-up value). 12. Press OK. 13. Enter the PU DELAY (pick-up delay). 14. Press OK. 15. Enter the DO VALUE (drop-out value). 18. Press OK. PLSD110311 16. Press OK. 17. Enter the DO DELAY (drop-out delay). + *! + *! 19. Press 1; to return to the alarm summary screen. 20. Press 1; to return to the SETUP MODE screen. 21. At the SETUP MODE screen, continue programming additional setup features or press1; until you are asked to save changes. 22. Press YES to save the changes. © 2011 Schneider Electric. All Rights Reserved. 17 PowerLogicTM Series 800 Power Meter Chapter 3—Operation 63230-500-225A2 3/2011 I/O (Input/Output) Setup 1. Perform steps 1 through 5 of the SETUP MODE Access procedure on page 11. ! 2. Press ###: until I/O is visible. 3. Press I/O. 5. Press EDIT. 6. Select the I/O mode based on the I/O type and the user selected mode: NORM., LATCH, TIMED, PULSE, or END OF. * / PLSD110221 NOTE: Analog inputs and outputs are available only with the PM8222 option module. 4. Press D OUT for digital output or D IN for digital input, or press A OUT for analog output or A IN for analog input. Use the ###: button to scroll through these selections. 7. Depending on the mode selected, the power meter will prompt you to enter the pulse weight, timer, and control. 8. Press OK. 9. Select EXT. (externally controlled via communications) or ALARM (controlled by an alarm). 10. Press 1; to return to the SETUP MODE screen. 11. At the SETUP MODE screen, continue programming additional setup features or press1; until you are asked to save changes. 12. Press YES to save the changes. PASSW (Password) Setup 1. Perform steps 1 through 5 of the SETUP MODE Access procedure on page 11. 6 2. Press ###: until PASSW (password) is visible. 3. Press PASSW. 4. Enter the SETUP password. 5. Press OK. 6. Enter the DIAG (diagnostics) password. 7. Press OK. 9. Press OK. 10. Enter the MN/MX (minimum/maximum reset) password. PLSD110224 8. Enter the ENERG (energy reset) password. + + "/ 11. Press OK. 12. At the SETUP MODE screen, continue programming additional setup features or press1; until you are asked to save changes. 13. Press YES to save the changes. 18 © 2011 Schneider Electric. All Rights Reserved. PowerLogicTM Series 800 Power Meter Chapter 3—Operation 63230-500-225A2 3/2011 TIMER (Operating Time Threshold) Setup 1. Perform steps 1 through 5 of the SETUP MODE Access procedure on page 11. 2. Press ###: until TIMER is visible. 3. Press TIMER. 5 4. Enter the 3-phase current average. NOTE: The power meter begins counting the operating time whenever the readings are equal to or above the average. .+ 6. At the SETUP MODE screen, continue programming additional setup features or press1; until you are asked to save changes. PLSD110257 5. Press OK. 7. Press YES to save the changes. ADVAN (Advanced) Power Meter Setup Features The Advanced Feature set contains several items which need to be programmed. To access these features, follow these steps: After programming a feature, you may continue through the remaining features by returning to the SETUP MODE screen and pressing ###: to scroll to additional features. Once you have selected the correct options for each setup parameter, press 1; until the SAVE CHANGES? prompt appears, then press YES. The meter will reset, briefly display the meter info screen, then automatically return to the main screen. ROT (Phase Rotation) Setup 1. Perform steps 1 through 5 of the SETUP MODE Access procedure on page 11. '7-78' 2. Press ###: until ADVAN (advanced setup) is visible. 3. Press ADVAN. 4. Press ###: until ROT (phase rotation) is visible. 5. Press ROT. 6. Select the phase rotation: ABC or CBA. 8. At the SETUP MODE screen, continue programming additional setup features or press1; until you are asked to save changes. PLSD110203 7. Press OK. 9. Press YES to save the changes. © 2011 Schneider Electric. All Rights Reserved. 19 PowerLogicTM Series 800 Power Meter Chapter 3—Operation 63230-500-225A2 3/2011 E-INC (Incremental Energy Interval) Setup 1. Perform steps 1 through 5 of the SETUP MODE Access procedure on page 11. +! 2. Press ###: until ADVAN (advanced setup) is visible. 3. Press ADVAN. 4. Press ###: until E-INC (incremental energy) is visible. .* 5. Press E-INC. 7. Press OK. 8. At the SETUP MODE screen, continue programming additional setup features or press1; until you are asked to save changes. PLSD110197 6. Enter the INTVL (interval). Range is 00 to 1440. 9. Press YES to save the changes. THD Calculation Setup 1. Perform steps 1 through 5 of the SETUP MODE Access procedure on page 11. -9$(9-78' 2. Press ###: until ADVAN (advanced setup) is visible. 3. Press ADVAN. :( 4. Press ###: until THD is visible. 5. Press THD. 6. Select the THD calculation: FUND or RMS. 8. At the SETUP MODE screen, continue programming additional setup features or press1; until you are asked to save changes. PLSD110206 7. Press OK. 9. Press YES to save the changes. VAR/PF Convention Setup 1. Perform steps 1 through 5 of the SETUP MODE Access procedure on page 11. 0';#78' 2. Press ###: until ADVAN (advanced setup) is visible. 3. Press ADVAN. 8### 4. Press ###: until PF is visible. 5. Press PF. 6. Select the Var/PF convention: IEEE or IEC. 8. At the SETUP MODE screen, continue programming additional setup features or press1; until you are asked to save changes. PLSD110209 7. Press OK. 9. Press YES to save the changes. 20 © 2011 Schneider Electric. All Rights Reserved. PowerLogicTM Series 800 Power Meter Chapter 3—Operation 63230-500-225A2 3/2011 Lock Resets Setup 1. Perform steps 1 through 5 of the SETUP MODE Access procedure on page 11. 9'$<#=#7=> 2. Press ###: until ADVAN (advanced setup) is visible. 3. Press ADVAN. 4. Press ###: until LOCK is visible. 5. Press LOCK. 7. Press OK. 8. At the SETUP MODE screen, continue programming additional setup features or press1; until you are asked to save changes. ! + ?"@A PLSD110200 6. Select Y (yes) or N (no) to enable or disable resets for PK.DMD, ENERG, MN/MX, and METER. #7#) 9. Press YES to save the changes. Alarm Backlight Setup 1. Perform steps 1 through 5 of the SETUP MODE Access procedure on page 11. * *+> 2. Press ###: until ADVAN (advanced setup) is visible. 3. Press ADVAN. 4. Press ###: until BLINK is visible. 5. Press BLINK. 6. Enter ON or OFF. 8. At the SETUP MODE screen, continue programming additional setup features or press1; until you are asked to save changes. PLSD110215 7. Press OK. 9. Press YES to save the changes. Bar Graph Setup 1. Perform steps 1 through 5 of the SETUP MODE Access procedure on page 11. -)B)-C=$-9# 2. Press ###: until ADVAN (advanced setup) is visible. 3. Press ADVAN. 4. Press ###: until BARGR is visible. 5. Press BARGR. 7. Select AUTO or MAN. If MAN is selected, press OK and enter the %CT*PT and KW (for PWR) or the %CT and A (for AMPS). 8. Press OK. PLSD110231 6. Press AMPS or PWR. 6 9. At the SETUP MODE screen, continue programming additional setup features or press1; until you are asked to save changes. 10. Press YES to save the changes. © 2011 Schneider Electric. All Rights Reserved. 21 PowerLogicTM Series 800 Power Meter Chapter 3—Operation 63230-500-225A2 3/2011 PQ Advanced Evaluation Setup 1. Perform steps 1 through 5 of the SETUP MODE Access procedure on page 11. 4;- 2. Press ###: until ADVAN (advanced setup) is visible. 3. Press ADVAN. 4. Press ###: until PQADV is visible. 5. Press PQADV. . 6. Select ON. 7. Press OK. 8. Change the nominal voltage (NOM V) value if desired (the default is 230). 9. Press OK to return to the SETUP MODE screen. 10. At the SETUP MODE screen, continue programming additional setup features or press1; until you are asked to save changes. 11. Press YES to save your changes and reset the power meter. Power Demand Configuration Setup 1. Perform steps 1 through 5 of the SETUP MODE Access procedure on page 11. 2. Press ###: until ADVAN (advanced setup) is visible. 'D#)0+ 3. Press ADVAN. 4. Press ###: until DMD is visible. 6. Select the demand configuration. Choices are COMMS, RCOMM, CLOCK, RCLCK, IENGY, THERM, SLIDE, BLOCK, RBLCK, INPUT, and RINPUT. 7. Press OK. PLSD110232 5. Press DMD (P-DMD, I-DMD). * .* 8. Enter the INTVL (interval) and press OK. 9. Enter the SUB-I (sub-interval) and press OK. 10. At the SETUP MODE screen, continue programming additional setup features or press1; until you are asked to save changes. 11. Press YES to save the changes. 22 © 2011 Schneider Electric. All Rights Reserved. PowerLogicTM Series 800 Power Meter Chapter 3—Operation 63230-500-225A2 3/2011 Power Meter Resets The Power Meter Resets Feature set contains several items. After resetting a feature, you may continue through the remaining features by returning to the RESET MODE screen and pressing ###: to scroll to additional features. Once you have reset the specific features, press 1; until the display returns to the main screen. Initialize the Power Meter Initializing the power meter resets the energy readings, minimum/maximum values, and operating times. To initialize the power meter, follow these steps: > 1. Press ###: to scroll through the Level 1 menu until you see MAINT. 2. Press MAINT. 3. Press RESET. 5. Press METER. 6. Enter the password (the default is 0000). 7. Press YES to initialize the power meter and to return to the RESET MODE screen. PLSD110285 4. Press ###: until METER is visible. ! 8. At the RESET MODE screen, continue resetting additional features or press1; until you return to the main screen. NOTE: We recommend initializing the power meter after you make changes to any of the following: CTs, PTs, frequency, or system type. Accumulated Energy Readings Reset 1. Press ###: to scroll through the Level 1 menu until you see MAINT. +!> 2. Press MAINT. 3. Press RESET. 4. Press ###: until ENERG is visible. 5. Press ENERG. 6. Enter the password (the default is 0000). © 2011 Schneider Electric. All Rights Reserved. PLSD110280 7. Press YES to reset the accumulated energy readings and to return to the RESET MODE screen. <6E <.E <.E ! 23 PowerLogicTM Series 800 Power Meter Chapter 3—Operation 63230-500-225A2 3/2011 Accumulated Demand Readings Reset 1. Press ###: to scroll through the Level 1 menu until you see MAINT. > 2. Press MAINT. 3. Press RESET. < 4. Press ###: until DMD is visible. < 5. Press DMD. 6. Enter the password (the default is 0000). PLSD110281 < 7. Press YES to reset the accumulated demand readings and to return to the RESET MODE screen. <6F <.F ! Minimum/Maximum Values Reset 1. Press ###: to scroll through the Level 1 menu until you see MAINT. "/> 2. Press MAINT. 3. Press RESET. 4. Press ###: until MINMX is visible. 5. Press MINMX. 6. Enter the password (the default is 0000). 7. Press YES to reset the minimum/maximum values and to return to the RESET MODE screen. PLSD110282 ! Display Mode Change 1. Press ###: to scroll through the Level 1 menu until you see MAINT. 0*> 2. Press MAINT. 3. Press RESET. 4. Press ###: until MODE is visible. 6. Press IEEE (default for Square D branded power meters) or IEC (default for Schneider Electric branded power meters) depending on the operating mode you want to use. NOTE: Resetting the mode changes the menu labels, power factor conventions, and THD calculations to match the standard mode selected. To customize the mode changes, see the register list. 24 PLSD110283 5. Press MODE. 4 © 2011 Schneider Electric. All Rights Reserved. PowerLogicTM Series 800 Power Meter Chapter 3—Operation 63230-500-225A2 3/2011 Accumulated Operating Time Reset 1. Press ###: to scroll through the Level 1 menu until you see MAINT. > 2. Press MAINT. 3. Press RESET. 4. Press ###: until TIMER is visible. 5. Press TIMER. 6. Enter the password (the default is 0000). NOTE: The accumulated days, hours, and minutes of operation are reset to zero when you press YES. PLSD110284 7. Press YES to reset the accumulated operating time and to return to the RESET MODE screen. ! ! Power Meter Diagnostics To view the power meter’s model, firmware version, serial number, read and write registers, or check the health status, you must access the HEALTH STATUS screen. After viewing a feature, you may continue through the remaining features by returning to the HEALTH STATUS screen and selecting one of the other options. Once you have viewed the specific features, press 1; until the display returns to the main screen. HEALTH STATUS screen NOTE: The wrench icon and the health status code display when a health problem is detected. For code 1, set up the Date/Time (see “DATE Setup” and “TIME Setup” on pages 11 and 12). For other codes, contact technical support. * PLSD110191 © 2011 Schneider Electric. All Rights Reserved. + * 25 PowerLogicTM Series 800 Power Meter Chapter 3—Operation 63230-500-225A2 3/2011 View the Meter Information 1. Press ###: to scroll through the Level 1 menu until you see MAINT. 0 2. Press MAINT. 3. Press DIAG (diagnostics) to open the HEALTH STATUS screen. . 4. On the HEALTH STATUS screen, press METER (meter information). . 5. View the meter information. 7. Press 1; to return to the HEALTH STATUS screen. NOTE: The wrench icon and the health status code display when a health problem is detected. For code 1, set up the Date/Time (see “DATE Setup” and “TIME Setup” on pages 11 and 12). For other codes, contact technical support. PLSD110094d 6. Press ###: to view more meter information. * G Read and Write Registers 1. Press ###: to scroll through the Level 1 menu until you see MAINT. "6+ 2. Press MAINT. 3. Press DIAG (diagnostics) to open the HEALTH STATUS screen. 4. On the HEALTH STATUS screen, Press REG (register). 6. Enter the REG. (register) number that contains the data you want to monitor. The register content will be displayed in both HEX (hexadecimal) and DEC (decimal) values. PLSD110194 5. Enter the password (the default is 0000). + / 7. Press 1; to return to the HEALTH STATUS screen. NOTE: For more information about using registers, see Appendix C—Using the Command Interface on page 83. View the Meter Date and TIme 1. Press ###: to scroll through the Level 1 menu until you see MAINT. H 2. Press MAINT. 3. Press DIAG (diagnostics) to open the HEALTH STATUS screen. . 4. On the HEALTH STATUS screen, press CLOCK (current date and time). . 5. View the date and time. 26 PLSD110327 6. Press 1; to return to the HEALTH STATUS screen. G © 2011 Schneider Electric. All Rights Reserved. PowerLogicTM Series 800 Power Meter Chapter 4—Metering Capabilities 63230-500-225A2 3/2011 Chapter 4—Metering Capabilities Real-Time Readings The power meter measures currents and voltages, and reports in real time the rms values for all three phases and neutral. In addition, the power meter calculates power factor, real power, reactive power, and more. Table 4–1 lists some of the real-time readings that are updated every second along with their reportable ranges. Table 4–1: One-second, Real-time Readings Real-time Readings Reportable Range Current Per-Phase 0 to 32,767 A Neutral 0 to 32,767 A 3-Phase Average 0 to 32,767 A % Unbalance 0 to 100.0% Voltage Line-to-Line, Per-Phase 0 to 1,200 kV Line-to-Line, 3-Phase Average 0 to 1,200 kV Line-to-Neutral, Per-Phase 0 to 1,200 kV Line-to-Neutral, 3-Phase Average 0 to 1,200 kV % Unbalance 0 to 100.0% Real Power Per-Phase 0 to ± 3,276.70 MW 3-Phase Total 0 to ± 3,276.70 MW Reactive Power Per-Phase 0 to ± 3,276.70 MVAR 3-Phase Total 0 to ± 3,276.70 MVAR Apparent Power Per-Phase 0 to ± 3,276.70 MVA 3-Phase Total 0 to ± 3,276.70 MVA Power Factor (True) Per-Phase –0.002 to 1.000 to +0.002 3-Phase Total –0.002 to 1.000 to +0.002 Power Factor (Displacement) Per-Phase –0.002 to 1.000 to +0.002 3-Phase Total –0.002 to 1.000 to +0.002 Frequency 45–65 Hz 23.00 to 67.00 Hz 350–450 Hz 350.00 to 450.00 Hz © 2011 Schneider Electric. All Rights Reserved. 27 PowerLogicTM Series 800 Power Meter Chapter 4—Metering Capabilities 63230-500-225A2 3/2011 Min/Max Values for Real-time Readings When certain one-second real-time readings reach their highest or lowest value, the power meter saves the values in its non-volatile memory. These values are called the minimum and maximum (min/max) values. The power meter stores the min/max values for the current month and previous month. After the end of each month, the power meter moves the current month’s min/max values into the previous month’s register space and resets the current month’s min/max values. The current month’s min/max values can be reset manually at any time using the power meter display or PowerLogic software. After the min/max values are reset, the power meter records the date and time. The real-time readings evaluated are: • • • • • • • • Min/Max Voltage L-L Min/Max Voltage L-N Min/Max Current Min/Max Voltage L-L, Unbalance Min/Max Voltage L-N, Unbalance Min/Max Total True Power Factor Min/Max Total Displacement Power Factor Min/Max Real Power Total • • • • • • • • Min/Max Reactive Power Total Min/Max Apparent Power Total Min/Max THD/thd Voltage L-L Min/Max THD/thd Voltage L-N Min/Max THD/thd Current Min/Max Frequency Min/Max Voltage N-ground (see the note below) Min/Max Current, Neutral (see the note below) NOTE: Min/Max values for Vng and In are not available from the display. Use the display to read registers (see “Read and Write Registers” on page 26) or use PowerLogic software. For each min/max value listed above, the power meter records the following attributes: • • • Date/Time of minimum value Minimum value Phase of recorded minimum value • • • Date/Time of maximum value Maximum value Phase of recorded maximum value NOTE: Phase of recorded min/max only applies to multi-phase quantities. NOTE: There are two ways to view the min/max values. 1- Use the power meter display to view the min/max values since the meter was last reset. 2- Use PowerLogic software to view a table with the instantaneous min/max values for the current and previous months. Power Factor Min/Max Conventions All running min/max values, except for power factor, are arithmetic minimum and maximum values. For example, the minimum phase A-B voltage is the lowest value in the range 0 to 1200 kV that has occurred since the min/max values were last reset. In contrast, because the power factor’s midpoint is unity (equal to one), the power factor min/max values are not true arithmetic minimums and maximums. Instead, the minimum value represents the measurement closest to -0 on a continuous scale for all real-time readings -0 to 1.00 to +0. The maximum value is the measurement closest to +0 on the same scale. Figure 4–1 shows the min/max values in a typical environment in which a positive power flow is assumed. In the figure, the minimum power factor is -0.7 (lagging) and the maximum is 0.8 (leading). Note that the minimum power factor need not be lagging, and the maximum power factor need not be leading. For example, if the power factor values ranged from -0.75 to -0.95, then the minimum power factor would be -0.75 (lagging) and the maximum power factor would be -0.95 (lagging). Both would be negative. Likewise, if the power factor ranged from +0.9 to +0.95, the minimum would be +0.95 (leading) and the maximum would be +0.90 (leading). Both would be positive in this case. 28 © 2011 Schneider Electric. All Rights Reserved. PowerLogicTM Series 800 Power Meter Chapter 4—Metering Capabilities 63230-500-225A2 3/2011 Figure 4–1: Power factor min/max example Minimum Power Factor -.7 (lagging) Maximum Power Factor .8 (leading) Range of Power Factor Value Unity 1.00 .8 .8 .6 Lag (–) .6 .4 .4 .2 .2 -0 LSD110165 Lead (+) +0 NOTE: Assumes a positive power flow An alternate power factor storage method is also available for use with analog outputs and trending. See “Using the Command Interface” on page 83 for the applicable registers. Power Factor Sign Conventions The power meter can be set to one of two power factor sign conventions: IEEE or IEC. The Series 800 Power Meter defaults to the IEEE power factor sign convention. Figure 4–2 illustrates the two sign conventions. For instructions on changing the power factor sign convention, refer to “ADVAN (Advanced) Power Meter Setup Features” on page 19. Figure 4–2: Power factor sign convention Reactive Power In Quadrant 2 watts negative (–) vars positive (+) power factor (–) Reverse Power Flow watts negative (–) vars negative (–) power factor (–) Quadrant 3 Reactive Power In Quadrant 2 Quadrant 1 watts positive (+) vars positive (+) power factor (+) Normal Power Flow watts negative (–) vars positive (+) power factor (+) Real Power In watts positive (+) vars negative (–) power factor (+) Reverse Power Flow watts negative (–) vars negative (–) power factor (–) Quadrant 4 Quadrant 3 IEC Power Factor Sign Convention Quadrant 1 watts positive (+) vars positive (+) power factor (–) Normal Power Flow Real Power In watts positive (+) vars negative (–) power factor (+) Quadrant 4 IEEE Power Factor Sign Convention Figure 4–3: Power Factor Display Example )(#0 © 2011 Schneider Electric. All Rights Reserved. The power factor sign is visible next to the power factor reading. I I I I * )* 29 PowerLogicTM Series 800 Power Meter Chapter 4—Metering Capabilities 63230-500-225A2 3/2011 Demand Readings The power meter provides a variety of demand readings, including coincident readings and predicted demands. Table 4–2 lists the available demand readings and their reportable ranges. Table 4–2: Demand Readings Demand Readings Reportable Range Demand Current, Per-Phase, 3Ø Average, Neutral Last Complete Interval 0 to 32,767 A Peak 0 to 32,767 A Average Power Factor (True), 3Ø Total Last Complete Interval –0.002 to 1.000 to +0.002 Coincident with kW Peak –0.002 to 1.000 to +0.002 Coincident with kVAR Peak –0.002 to 1.000 to +0.002 Coincident with kVA Peak –0.002 to 1.000 to +0.002 Demand Real Power, 3Ø Total Last Complete Interval 0 to ± 3276.70 MW Predicted 0 to ± 3276.70 MW Peak 0 to ± 3276.70 MW Coincident kVA Demand 0 to ± 3276.70 MVA Coincident kVAR Demand 0 to ± 3276.70 MVAR Demand Reactive Power, 3Ø Total Last Complete Interval 0 to ± 3276.70 MVAR Predicted 0 to ± 3276.70 MVAR Peak 0 to ± 3276.70 MVAR Coincident kVA Demand 0 to ± 3276.70 MVA Coincident kW Demand 0 to ± 3276.70 MW Demand Apparent Power, 3Ø Total Last Complete Interval 0 to ± 3276.70 MVA Predicted 0 to ± 3276.70 MVA Peak 0 to ± 3276.70 MVA Coincident kW Demand 0 to ± 3276.70 MW Coincident kVAR Demand 0 to ± 3276.70 MVAR Demand Power Calculation Methods Demand power is the energy accumulated during a specified period divided by the length of that period. How the power meter performs this calculation depends on the method you select. To be compatible with electric utility billing practices, the power meter provides the following types of demand power calculations: • • • Block Interval Demand Synchronized Demand Thermal Demand The default demand calculation is set to sliding block with a 15 minute interval. You can set up any of the demand power calculation methods using PowerLogic software. 30 © 2011 Schneider Electric. All Rights Reserved. PowerLogicTM Series 800 Power Meter Chapter 4—Metering Capabilities 63230-500-225A2 3/2011 Block Interval Demand In the block interval demand method, you select a “block” of time that the power meter uses for the demand calculation. You choose how the power meter handles that block of time (interval). Three different modes are possible: • Sliding Block. In the sliding block interval, you select an interval from 1 to 60 minutes (in 1-minute increments). If the interval is between 1 and 15 minutes, the demand calculation updates every 15 seconds. If the interval is between 16 and 60 minutes, the demand calculation updates every 60 seconds. The power meter displays the demand value for the last completed interval. • Fixed Block. In the fixed block interval, you select an interval from 1 to 60 minutes (in 1-minute increments). The power meter calculates and updates the demand at the end of each interval. • Rolling Block. In the rolling block interval, you select an interval and a sub-interval. The sub-interval must divide evenly into the interval. For example, you might set three 5-minute sub-intervals for a 15-minute interval. Demand is updated at each subinterval. The power meter displays the demand value for the last completed interval. Figure 4–4 below illustrates the three ways to calculate demand power using the block method. For illustration purposes, the interval is set to 15 minutes. Figure 4–4: Block Interval Demand Examples Calculation updates every 15 or 60 seconds 15 30 45 60 . Demand value is the average for the last completed interval 15-minute interval Time (sec) .. Sliding Block Demand value is the average for the last completed interval Calculation updates at the end of the interval 15-minute interval 15 15-minute interval 30 15-min 45 Time (min) Fixed Block Demand value is the average for the last completed interval Calculation updates at the end of the sub-interval (5 minutes) PLSD110131 15-minute interval © 2011 Schneider Electric. All Rights Reserved. 15 20 25 30 35 40 45 Time (min) Rolling Block 31 PowerLogicTM Series 800 Power Meter Chapter 4—Metering Capabilities 63230-500-225A2 3/2011 Synchronized Demand The demand calculations can be synchronized by accepting an external pulse input, a command sent over communications, or by synchronizing to the internal real-time clock. • Input Synchronized Demand. You can set up the power meter to accept an input such as a demand synch pulse from an external source. The power meter then uses the same time interval as the other meter for each demand calculation. You can use the standard digital input installed on the meter to receive the synch pulse. When setting up this type of demand, you select whether it will be input-synchronized block or inputsynchronized rolling block demand. The rolling block demand requires that you choose a sub-interval. • Command Synchronized Demand. Using command synchronized demand, you can synchronize the demand intervals of multiple meters on a communications network. For example, if a PLC input is monitoring a pulse at the end of a demand interval on a utility revenue meter, you could program the PLC to issue a command to multiple meters whenever the utility meter starts a new demand interval. Each time the command is issued, the demand readings of each meter are calculated for the same interval. When setting up this type of demand, you select whether it will be command-synchronized block or command-synchronized rolling block demand. The rolling block demand requires that you choose a sub-interval. See Appendix C—Using the Command Interface on page 83 for more information. • Clock Synchronized Demand (Requires PM810LOG). You can synchronize the demand interval to the internal real-time clock in the power meter. This enables you to synchronize the demand to a particular time, typically on the hour. The default time is 12:00 am. If you select another time of day when the demand intervals are to be synchronized, the time must be in minutes from midnight. For example, to synchronize at 8:00 am, select 480 minutes. When setting up this type of demand, you select whether it will be clock-synchronized block or clock-synchronized rolling block demand. The rolling block demand requires that you choose a sub-interval. Thermal Demand The thermal demand method calculates the demand based on a thermal response, which mimics thermal demand meters. The demand calculation updates at the end of each interval. You select the demand interval from 1 to 60 minutes (in 1-minute increments). In Figure 4–5 the interval is set to 15 minutes for illustration purposes. Figure 4–5: Thermal Demand Example The interval is a window of time that moves across the timeline. 99% 90% % of Load Last completed demand interval 0% Time (minutes) 15-minute interval next 15-minute interval Calculation updates at the end of each interval Demand Current The power meter calculates demand current using the thermal demand method. The default interval is 15 minutes, but you can set the demand current interval between 1 and 60 minutes in 1-minute increments. 32 © 2011 Schneider Electric. All Rights Reserved. PowerLogicTM Series 800 Power Meter Chapter 4—Metering Capabilities 63230-500-225A2 3/2011 Predicted Demand The power meter calculates predicted demand for the end of the present interval for kW, kVAR, and kVA demand. This prediction takes into account the energy consumption thus far within the present (partial) interval and the present rate of consumption. The prediction is updated every second. Figure 4–6 illustrates how a change in load can affect predicted demand for the interval. Figure 4–6: Predicted Demand Example Predicted demand is updated every second. Beginning of interval Demand for last completed interval 15-minute interval Predicted demand if load is added during interval; predicted demand increases to reflect increase demand Partial Interval Demand Predicted demand if no load is added. PLSD110137 Time 1:00 1:06 1:15 Change in Load Peak Demand In non-volatile memory, the power meter maintains a running maximum for the kWD, kVARD, and kVAD power values, called “peak demand.” The peak for each value is the highest average reading since the meter was last reset. The power meter also stores the date and time when the peak demand occurred. In addition to the peak demand, the power meter also stores the coinciding average 3-phase power factor. The average 3-phase power factor is defined as “demand kW/demand kVA” for the peak demand interval. Table 4–2 on page 30 lists the available peak demand readings from the power meter. You can reset peak demand values from the power meter display. From the Main Menu, select MAINT > RESET > DMD. You can also reset the values over the communications link by using software. NOTE: You should reset peak demand after changes to basic meter setup, such as CT ratio or system type. The power meter also stores the peak demand during the last incremental energy interval. See “Energy Readings” on page 35 for more about incremental energy readings. Generic Demand The power meter can perform any of the demand calculation methods, described earlier in this chapter, on up to 10 quantities that you choose using PowerLogic software. For generic demand, do the following: • • • Select the demand calculation method (thermal, block interval, or synchronized). Select the demand interval (from 5–60 minutes in 1–minute increments) and select the demand sub-interval (if applicable). Select the quantities on which to perform the demand calculation. You must also select the units and scale factor for each quantity. For each quantity in the demand profile, the power meter stores four values: • • • • Partial interval demand value Last completed demand interval value Minimum values (date and time for each is also stored) Peak demand value (date and time for each is also stored) © 2011 Schneider Electric. All Rights Reserved. 33 PowerLogicTM Series 800 Power Meter Chapter 4—Metering Capabilities 63230-500-225A2 3/2011 You can reset the minimum and peak values of the quantities in a generic demand profile by using one of two methods: • • Use PowerLogic software, or Use the command interface. Command 5115 resets the generic demand profile. See Appendix C—Using the Command Interface on page 83 for more about the command interface. Input Metering Demand The power meter has five input pulse metering channels, but only one digital input. Digital inputs can be added by installing one or more option modules (PM8M22, PM8M26, or PM8M2222). The input pulse metering channels count pulses received from one or more digital inputs assigned to that channel. Each channel requires a consumption pulse weight, consumption scale factor, demand pulse weight, and demand scale factor. The consumption pulse weight is the number of watt-hours or kilowatt-hours per pulse. The consumption scale factor is a factor of 10 multiplier that determines the format of the value. For example, if each incoming pulse represents 125 Wh, and you want consumption data in watt-hours, the consumption pulse weight is 125 and the consumption scale factor is zero. The resulting calculation is 125 x 100, which equals 125 watt-hours per pulse. If you want the consumption data in kilowatt-hours, the calculation is 125 x 10-3, which equals 0.125 kilowatt-hours per pulse.Time must be taken into account for demand data; so you begin by calculating demand pulse weight using the following formula: watt-hours 3600 seconds pulse watts = ---------------------------- ------------------------------------- ------------------pulse hour second If each incoming pulse represents 125 Wh, using the formula above you get 450,000 watts. If you want demand data in watts, the demand pulse weight is 450 and the demand scale factor is three. The calculation is 450 x 103, which equals 450,000 watts. If you want the demand data in kilowatts, the calculation is 450 x 100, which equals 450 kilowatts. NOTE: The power meter counts each input transition as a pulse. Therefore, an input transition of OFF-to-ON and ON-to-OFF will be counted as two pulses. For each channel, the power meter maintains the following information: • • • • Total consumption • Minimum demand—lowest demand value since the last reset of the input pulse demand. The date and time of the minimum demand is also saved. Last completed interval demand—calculated demand for the last completed interval. Partial interval demand—demand calculation up to the present point during the interval. Peak demand—highest demand value since the last reset of the input pulse demand. The date and time of the peak demand is also saved. To use the channels feature, first use the display to set up the digital inputs (see “I/O (Input/Output) Setup” on page 18). Then using PowerLogic software, you must set the I/O operating mode to Normal and set up the channels. The demand method and interval that you select applies to all channels. 34 © 2011 Schneider Electric. All Rights Reserved. PowerLogicTM Series 800 Power Meter Chapter 4—Metering Capabilities 63230-500-225A2 3/2011 Energy Readings The power meter calculates and stores accumulated energy values for real and reactive energy (kWh and kVARh) both into and out of the load, and also accumulates absolute apparent energy. Table 4–3 lists the energy values the power meter can accumulate. Table 4–3: Energy Readings Energy Reading, 3-Phase Reportable Range Shown on the Display Accumulated Energy Real (Signed/Absolute) -9,999,999,999,999,999 to 9,999,999,999,999,999 Wh Reactive (Signed/Absolute) -9,999,999,999,999,999 to 9,999,999,999,999,999 VARh Real (In) 0 to 9,999,999,999,999,999 Wh Real (Out) 0 to 9,999,999,999,999,999 Wh Reactive (In) 0 to 9,999,999,999,999,999 VARh Reactive (Out) 0 to 9,999,999,999,999,999 VARh Apparent 0 to 9,999,999,999,999,999 VAh 0000.000 kWh to 99,999.99 MWh and 0000.000 to 99,999.99 MVARh Accumulated Energy, Conditional Real (In) 0 to 9,999,999,999,999,999 Wh Real (Out) 0 to 9,999,999,999,999,999 Wh Reactive (In) 0 to 9,999,999,999,999,999 VARh Reactive (Out) 0 to 9,999,999,999,999,999 VARh Apparent 0 to 9,999,999,999,999,999 VAh These values not shown on the display. Readings are obtained only through the communications link. Accumulated Energy, Incremental Real (In) 0 to 999,999,999,999 Wh Real (Out) 0 to 999,999,999,999 Wh Reactive (In) 0 to 999,999,999,999 VARh Reactive (Out) 0 to 999,999,999,999 VARh Apparent 0 to 999,999,999,999 VAh These values not shown on the display. Readings are obtained only through the communications link. Reactive Energy Quadrant 1 0 to 999,999,999,999 VARh Quadrant 2 0 to 999,999,999,999 VARh Quadrant 3 0 to 999,999,999,999 VARh Quadrant 4 0 to 999,999,999,999 VARh These values not shown on the display. Readings are obtained only through the communications link. ➀ Not shown on the power meter display. The power meter can accumulate the energy values shown in Table 4–3 in one of two modes: signed or unsigned (absolute). In signed mode, the power meter considers the direction of power flow, allowing the magnitude of accumulated energy to increase and decrease. In unsigned mode, the power meter accumulates energy as a positive value, regardless of the direction of power flow. In other words, the energy value increases, even during reverse power flow. The default accumulation mode is unsigned. You can view accumulated energy from the display. The resolution of the energy value will automatically change through the range of 000.000 kWh to 000,000 MWh (000.000 kVAh to 000,000 MVARh), or it can be fixed. See Appendix C—Using the Command Interface on page 83 for the contents of the registers. For conditional accumulated energy readings, you can set the real, reactive, and apparent energy accumulation to OFF or ON when a particular condition occurs. You can do this over the communications link using a command, or from a digital input change. For example, you may want to track accumulated energy values during a particular process that is controlled by a PLC. The power meter stores the date and time of the last reset of conditional energy in non-volatile memory. © 2011 Schneider Electric. All Rights Reserved. 35 PowerLogicTM Series 800 Power Meter Chapter 4—Metering Capabilities 63230-500-225A2 3/2011 The power meter also provides an additional energy reading that is only available over the communications link: • Four-quadrant reactive accumulated energy readings. The power meter accumulates reactive energy (kVARh) in four quadrants as shown in Figure 4–7. The registers operate in unsigned (absolute) mode in which the power meter accumulates energy as positive. Figure 4–7: Reactive energy accumulates in four quadrants Reactive Power In Quadrant 2 watts negative (–) vars positive (+) Reverse Power Flow PLSD110171 watts negative (–) vars negative (–) Quadrant 3 Quadrant 1 watts positive (+) vars positive (+) Normal Power Flow Real Power In watts positive (+) vars negative (–) Quadrant 4 Energy-Per-Shift (PM810 with PM810LOG) The energy-per-shift feature allows the power meter to group energy usage based on three groups: 1st shift, 2nd shift, and 3rd shift. These groups provide a quick, historical view of energy usage and energy cost during each shift. All data is stored in non-volatile memory. Table 4–4: Energy-per-shift recorded values Category Recorded Values Time Scales • • • • • • Today Yesterday This Week Last Week This Month Last Month Energy • • Real Apparent Energy Cost • • • • • • Today Yesterday This Week Last Week This Month Last Month User Configuration • • • Meter Reading Date Meter Reading Time of Day 1st Day of the Week Configuration The start time of each shift is configured by setting registers using the display or by using PowerLogic software. Table 4-5 summarizes the quantities needed to configure energyper-shift using register numbers. 36 © 2011 Schneider Electric. All Rights Reserved. PowerLogicTM Series 800 Power Meter Chapter 4—Metering Capabilities 63230-500-225A2 3/2011 Table 4–5: Energy-per-shift recorded values Quantity Register Number(s) Description For each shift, enter the minutes from midnight at which the shift starts. Shift Start Time • • • 1st shift: 16171 2nd shift: 16172 3rd shift: 16173 • • • 1st shift: 16174 2nd shift: 16175 3rd shift: 16176 Defaults: 1st shift = 420 minutes (7:00 am) 2nd shift = 900 minutes (3:00 pm) 3rd shift = 1380 minutes (11:00 pm) Cost per kWHr Monetary Scale Factor Enter the cost per kWHr for each shift. The scale factor multiplied by the monetary units to determine the energy cost. 16177 Values: -3 to 3 Default: 0 Power Analysis Values The power meter provides a number of power analysis values that can be used to detect power quality problems, diagnose wiring problems, and more. Table 4–6 on page 38 summarizes the power analysis values. • THD. Total Harmonic Distortion (THD) is a quick measure of the total distortion present in a waveform and is the ratio of harmonic content to the fundamental. It provides a general indication of the “quality” of a waveform. THD is calculated for both voltage and current. The power meter uses the following equation to calculate THD, where H is the harmonic distortion: 2 H2 THD = + 2 H3 H • + 2 H4 + x 100% 1 thd. An alternate method for calculating Total Harmonic Distortion, used widely in Europe. It considers the total harmonic current and the total rms content rather than fundamental content in the calculation. The power meter calculates thd for both voltage and current. The power meter uses the following equation to calculate THD, where H is the harmonic distortion: H thd = 2 2 + H2 + 3 H 2 4 + x 100% Total rms • Displacement Power Factor. Power factor (PF) represents the degree to which voltage and current coming into a load are out of phase. Displacement power factor is based on the angle between the fundamental components of current and voltage. • Harmonic Values. Harmonics can reduce the capacity of the power system. The power meter determines the individual per-phase harmonic magnitudes and angles for all currents and voltages through the: — 31st harmonic (PM810 with PM810Log, and PM820) or — 63rd harmonic (PM850, PM870) The harmonic magnitudes can be formatted as either a percentage of the fundamental (default), a percentage of the rms value, or the actual rms value. Refer to “Operation with PQ Advanced Enabled” on page 99 for information on how to configure harmonic calculations. © 2011 Schneider Electric. All Rights Reserved. 37 PowerLogicTM Series 800 Power Meter Chapter 4—Metering Capabilities 63230-500-225A2 3/2011 Table 4–6: Power Analysis Values Value Reportable Range THD—Voltage, Current 3-phase, per-phase, neutral 0 to 3,276.7% thd—Voltage, Current 3-phase, per-phase, neutral 0 to 3,276.7% Fundamental Voltages (per phase) Magnitude 0 to 1,200 kV Angle 0.0 to 359.9° Fundamental Currents (per phase) Magnitude 0 to 32,767 A Angle 0.0 to 359.9° Miscellaneous Displacement P.F. (per phase, 3-phase) –0.002 to 1.000 to +0.002 Phase Rotation ABC or CBA Unbalance (current and voltage) ➀ 0.0 to 100.0% Individual Current and Voltage Harmonic Magnitudes ➁ 0 to 327.67% Individual Current and Voltage Harmonic Angles ➁ 0.0° to 359.9° ➀ Readings are obtained only through communications. ➁ Current and Voltage Harmonic Magnitude and Angles 2, 3, 4, 5, 6, 7, 8, 9, 10, 11, and 13 are shown on the display. 38 © 2011 Schneider Electric. All Rights Reserved. PowerLogicTM Series 800 Power Meter Chapter 5—Input/Output Capabilities 63230-500-225A2 3/2011 Chapter 5—Input/Output Capabilities Digital Inputs The power meter includes one solid-state digital input. A digital input is used to detect digital signals. For example, the digital input can be used to determine circuit breaker status, count pulses, or count motor starts. The digital input can also be associated with an external relay. You can log digital input transitions as events in the power meter’s on-board alarm log. The event is date and time stamped with resolution to the second. The power meter counts OFF-to-ON transitions for each input. You can view the count for each input using the Digital Inputs screen, and you can reset this value using the command interface. Figure 5–1 is an example of the Digital Inputs screen. Figure 5–1: Digital Inputs Screen A. Lit bargraph indicates that the input is ON. For analog inputs or outputs, the bargraph indicates the output percentage. B. SI is common to all meters and represents standard digital input. C. A-S1 and A-S2 represent I/O point numbers on the first (A) module. D. Use the arrow buttons to scroll through the remaining I/O points. Point numbers beginning with “B” are on the second module. A B PLSD110233 D C The digital input has three operating modes: • Normal—Use the normal mode for simple on/off digital inputs. In normal mode, digital inputs can be used to count KY pulses for demand and energy calculation. • Demand Interval Synch Pulse—you can configure any digital input to accept a demand synch pulse from a utility demand meter (see “Demand Synch Pulse Input” on page 40 of this chapter for more about this topic). For each demand profile, you can designate only one input as a demand synch input. • Conditional Energy Control—you can configure one digital input to control conditional energy (see “Reactive energy accumulates in four quadrants” on page 36 in Chapter 4—Metering Capabilities for more about conditional energy). NOTE: By default, the digital input is named DIG IN S02 and is set up for normal mode. For custom setup, use PowerLogic software to define the name and operating mode of the digital input. The name is a 16-character label that identifies the digital input. The operating mode is one of those listed above. © 2011 Schneider Electric. All Rights Reserved. 39 PowerLogicTM Series 800 Power Meter Chapter 5—Input/Output Capabilities 63230-500-225A2 3/2011 Demand Synch Pulse Input You can configure the power meter to accept a demand synch pulse from an external source, such as another demand meter. By accepting demand synch pulses through a digital input, the power meter can make its demand interval “window” match the other meter’s demand interval “window.” The power meter does this by “watching” the digital input for a pulse from the other demand meter. When it sees a pulse, it starts a new demand interval and calculates the demand for the preceding interval. The power meter then uses the same time interval as the other meter for each demand calculation. Figure 5–2 illustrates this option. See “Demand Readings” on page 30 in Chapter 4—Metering Capabilities for more about demand calculations. When in demand synch pulse operating mode, the power meter will not start or stop a demand interval without a pulse. The maximum allowable time between pulses is 60 minutes. If 66 minutes (110% of the demand interval) pass before a synch pulse is received, the power meter throws out the demand calculations and begins a new calculation when the next pulse is received. Once in synch with the billing meter, the power meter can be used to verify peak demand charges. Important facts about the power meter’s demand synch feature are listed below: • • • Any installed digital input can be set to accept a demand synch pulse. Each system can choose whether to use an external synch pulse, but only one demand synch pulse can be brought into the meter for each demand system. One input can be used to synchronize any combination of the demand systems. The demand synch feature can be set up using PowerLogic software. Figure 5–2: Demand synch pulse timing Normal Demand Mode External Synch Pulse Demand Timing Billing Meter Demand Timing Billing Meter Demand Timing Utility Meter Synch Pulse PLSD110140 Power Meter Demand Timing Power Meter Demand Timing (Slave to Master) Relay Output Operating Modes The relay output defaults to external control, but you can choose whether the relay is set to external or internal control: • External (remote) control—the relay is controlled either from a PC using PowerLogic software or a programmable logic controller using commands via communications. • Power meter alarm (internal) control—the relay is controlled by the power meter in response to a set-point controlled alarm condition, or as a pulse initiator output. Once you’ve set up a relay for power meter control, you can no longer operate the relay remotely. However, you can temporarily override the relay, using PowerLogic software. NOTE: If any basic setup parameters or I/O setup parameters are modified, all relay outputs will be de-energized. The 11 relay operating modes are as follows: • Normal — Externally Controlled: Energize the relay by issuing a command from a remote PC or programmable controller. The relay remains energized until a command to deenergize is issued from the remote PC or programmable controller, or until the 40 © 2011 Schneider Electric. All Rights Reserved. PowerLogicTM Series 800 Power Meter Chapter 5—Input/Output Capabilities 63230-500-225A2 3/2011 power meter loses control power. When control power is restored, the relay is not automatically re-energized. — Power Meter Alarm: When an alarm condition assigned to the relay occurs, the relay is energized. The relay is not de-energized until all alarm conditions assigned to the relay have dropped out, the power meter loses control power, or the alarms are over-ridden using PowerLogic software. If the alarm condition is still true when the power meter regains control power, the relay will be re-energized. • Latched — Remotely Controlled: Energize the relay by issuing a command from a remote PC or programmable controller. The relay remains energized until a command to deenergize is issued from a remote PC or programmable controller, or until the power meter loses control power. When control power is restored, the relay will not be reenergized. — Power Meter Controlled: When an alarm condition assigned to the relay occurs, the relay is energized. The relay remains energized—even after all alarm conditions assigned to the relay have dropped out—until a command to de-energize is issued from a remote PC or programmable controller, until the high priority alarm log is cleared from the display, or until the power meter loses control power. When control power is restored, the relay will not be re-energized if the alarm condition is not TRUE. • Timed — Remotely Controlled: Energize the relay by issuing a command from a remote PC or programmable controller. The relay remains energized until the timer expires, or until the power meter loses control power. If a new command to energize the relay is issued before the timer expires, the timer restarts. If the power meter loses control power, the relay will not be re-energized when control power is restored and the timer will reset to zero. — Power Meter Controlled: When an alarm condition assigned to the relay occurs, the relay is energized. The relay remains energized for the duration of the timer. When the timer expires, the relay will de-energize and remain de-energized. If the relay is on and the power meter loses control power, the relay will not be re-energized when control power is restored and the timer will reset to zero. • End Of Power Demand Interval This mode assigns the relay to operate as a synch pulse to another device. The output operates in timed mode using the timer setting and turns on at the end of a power demand interval. It turns off when the timer expires. • Absolute kWh Pulse This mode assigns the relay to operate as a pulse initiator with a user-defined number of kWh per pulse. In this mode, both forward and reverse real energy are treated as additive (as in a tie circuit breaker). • Absolute kVARh Pulse This mode assigns the relay to operate as a pulse initiator with a user-defined number of kVARh per pulse. In this mode, both forward and reverse reactive energy are treated as additive (as in a tie circuit breaker). • kVAh Pulse This mode assigns the relay to operate as a pulse initiator with a user-defined number of kVAh per pulse. Since kVA has no sign, the kVAh pulse has only one mode. • kWh In Pulse This mode assigns the relay to operate as a pulse initiator with a user-defined number of kWh per pulse. In this mode, only the kWh flowing into the load is considered. • kVARh In Pulse This mode assigns the relay to operate as a pulse initiator with a user-defined number of kVARh per pulse. In this mode, only the kVARh flowing into the load is considered. © 2011 Schneider Electric. All Rights Reserved. 41 PowerLogicTM Series 800 Power Meter Chapter 5—Input/Output Capabilities 63230-500-225A2 3/2011 • kWh Out Pulse This mode assigns the relay to operate as a pulse initiator with a user-defined number of kWh per pulse. In this mode, only the kWh flowing out of the load is considered. • kVARh Out Pulse This mode assigns the relay to operate as a pulse initiator with a user-defined number of kVARh per pulse. In this mode, only the kVARh flowing out of the load is considered. The last seven modes in the list above are for pulse initiator applications. All Series 800 Power Meters are equipped with one solid-state KY pulse output rated at 100 mA. The solid-state KY output provides the long life—billions of operations—required for pulse initiator applications. The KY output is factory configured with Name = KY, Mode = Normal, and Control = External. To set up custom values, press SETUP > I/O. For detailed instructions, see “I/O (Input/Output) Setup” on page 18. Then using PowerLogic software, you must define the following values for each mechanical relay output: • • • Name—A 16-character label used to identify the digital output. • Timer—You must set the timer if you select the timed mode or end of power demand interval mode (in seconds). • Control—You must set the relay to be controlled either remotely or internally (from the power meter) if you select the normal, latched, or timed mode. Mode—Select one of the operating modes listed above. Pulse Weight—You must set the pulse weight, the multiplier of the unit being measured, if you select any of the pulse modes (last 7 listed above). For instructions on setting up digital I/Os using software, see your software documentation or help file. Solid-state KY Pulse Output This section describes the pulse output capabilities of the power meter. For instructions on wiring the KY pulse output, see “Wiring the Solid-State KY Output” in the installation guide. The power meter’s digital output is generated by a solid-state device that can be used as a KY pulse output. This solid-state relay provides the extremely long life—billions of operations—required for pulse initiator applications. The KY output is a Form-A contact with a maximum rating of 100 mA. Because most pulse initiator applications feed solid-state receivers with low burdens, this 100 mA rating is adequate for most applications. When setting the kWh/pulse value, set the value based on a 2-wire pulse output. For instructions on calculating the correct value, see “Calculating the Kilowatthour-Per-Pulse Value” on page 43 in this chapter. The KY pulse output can be configured to operate in one of 11 operating modes. See “Relay Output Operating Modes” on page 40 for a description of the modes. 2-wire Pulse Initiator Figure 5–3 shows a pulse train from a 2-wire pulse initiator application. Figure 5–3: Two-wire pulse train Y K 1 2 3 PLSD110122 KY 42 ΔT © 2011 Schneider Electric. All Rights Reserved. PowerLogicTM Series 800 Power Meter Chapter 5—Input/Output Capabilities 63230-500-225A2 3/2011 In Figure 5–3, the transitions are marked as 1 and 2. Each transition represents the time when the relay contact closes. Each time the relay transitions, the receiver counts a pulse. The power meter can deliver up to 12 pulses per second in a 2-wire application. Fixed Pulse Output Fixed pulse output mode generates a fixed duration pulse output that can be associated with kWh consumption. Figure 5–4 shows the difference in pulse duration values when either TRANS mode or PULSE mode is selected. This mode selection is configured on the MAINT > IO > ADVAN menu. Figure 5–4: Fixed-pulse output TRANS & PULSE mode Pulse Weight = 0.02kWHr/pulse TRANS mode: Counts = 4 PULSE mode (100ms): 100 msec Setting in ADV mode: 10, 25, 50, 100, 150, 200, 300, 500, 1000 Counts = 8 0.02kW 0.04kW 0.06kW 0.08kW 0.1kW 0.12kW 0.14kW 0.16kW Calculating the Kilowatthour-Per-Pulse Value The following example illustrates how to calculate kilowatthours per pulse (pulse weight). To calculate this value, first determine the highest kW value you can expect and the required pulse rate. Remember the maximum number of pulses is 8 per second. In this example, the following conditions are set: • • The metered load should not exceed 1600 kW. About two KY pulses per second should normally occur. (If a higher load is reached, the number of pulses per second can increase and still stay within the set limits.) Step 1: Convert 1600 kW load into kWh/second. (1600 kW)(1 Hr) = 1600 kWh (1600 kWh) X kWh ------------------------------- = -----------------------1 hour 1 second (1600 kWh) X kWh ------------------------------------- = -----------------------3600 seconds 1 second X = 1600/3600 = 0.444 kWh/second Step 2: Calculate the kWh required per pulse. 0.444 kWh/second ------------------------------------------------- = 0.222 kWh/pulse 2 pulses/second Step 3: Adjust for the KY initiator (KY will give one pulse per two transitions of the relay). © 2011 Schneider Electric. All Rights Reserved. 43 PowerLogicTM Series 800 Power Meter Chapter 5—Input/Output Capabilities 63230-500-225A2 3/2011 0.222 kWh/second ------------------------------------------------- = 0.1111 kWh/pulse 2 Step 4: Round to nearest hundredth, since the power meter only accepts 0.01 kWh increments. Pulse Weight (Ke) = 0.11 kWh/pulse Analog Inputs With a PM8M2222 option module installed, a power meter can accept either voltage or current signals through the analog inputs on the option module. The power meter stores a minimum and a maximum value for each analog input. For technical specifications and instructions on installing and configuring the analog inputs on the PM8M2222, refer to the instruction bulletin (63230-502-200) that ships with the option module. To set up an analog input, you must first set it up from the display. From the SUMMARY screen, select MAINT > SETUP > I/O, then select the appropriate analog input option. Then, in PowerLogic software, define the following values for each analog input: • • • • Name—a 16-character label used to identify the analog input. • Report Range Upper Limit—the value the power meter reports when the input reaches the maximum value. When the input current is above highest valid reading, the Power Meter reports the upper limit. Units—the units of the monitored analog value (for example, “psi”). Scale factor—multiplies the units by this value (such as tenths or hundredths). Report Range Lower Limit—the value the Power Meter reports when the input reaches a minimum value. When the input current is below the lowest valid reading, the Power Meter reports the lower limit. For instructions on setting up analog inputs using software, see your software documentation or Help file. Analog Outputs This section describes the analog output capabilities when a PM8M2222 is installed on the Power Meter. For technical specifications and instructions on installing and configuring the analog outputs on the PM8M2222, refer to the instruction bulletin (63230-502-200) that ships with the option module. To set up an analog output, you must first set it up from the display. From the SUMMARY screen, select MAINT > SETUP > I/O, then select the appropriate analog output option. Then, in PowerLogic software, define the following values for each analog input • Name—a 16-character label used to identify the output. Default names are assigned, but can be customized • • Output register—the Power Meter register assigned to the analog output. • Upper Limit—the value equivalent to the maximum output current. When the register value is above the upper limit, the Power Meter outputs the maximum output current. Lower Limit—the value equivalent to the minimum output current. When the register value is below the lower limit, the Power Meter outputs the minimum output current. For instructions on setting up an analog output using software, see your software documentation or Help file. 44 © 2011 Schneider Electric. All Rights Reserved. PowerLogicTM Series 800 Power Meter Chapter 6—Alarms 63230-500-225A2 3/2011 Chapter 6—Alarms This section describes the alarm features on all Series 800 Power Meters. For information about advanced alarm features, go to “Advanced Alarms” on page 53. Basic Alarms The power meter can detect over 50 alarm conditions, including over or under conditions, digital input changes, phase unbalance conditions, and more. It also maintains a counter for each alarm to keep track of the total number of occurrences. A complete list of default basic alarm configurations are described in Table 6–5 on page 51 . In addition, you can set up your own custom alarms after installing an input/output module (PM8M22, PM8M26, or PM8M2222). When one or more alarm conditions are true, the power meter will execute a task automatically. When an alarm is active, the ! alarm icon appears in the upper-right corner of the power meter display. If a PM810LOG is installed on a PM810, PowerLogic software can be used to set up each alarm condition to force data log entries in a single data log file. For the PM820, PM850, and PM870 PowerLogic software can be used to set up each alarm condition to force data log entries in up to three user-defined data log files. See Chapter 7—Logging on page 57 for more about data logging. NOTE: PM820 only supports one data log. Table 6–1: Basic alarm features by model PM810 PM810 with PM810LOG PM820 PM850 PM870 Standard alarms 33 33 33 33 33 Open slots for additional standard alarms ➀ 7 ➀ 7 7 7 7 Digital 12 ➁ ➁ 12 ➁ 12 ➁ 12 12 No Yes Yes Yes Basic Alarm Feature Custom alarms No ➁ ➀ Available when an I/O module with analog IN/OUT is installed. ➁ Requires an input/output option module (PM8M22, PM8M26, or the PM8M2222). Basic Alarm Groups When using a default alarm, you first choose the alarm group that is appropriate for the application. Each alarm condition is assigned to one of these alarm groups: Whether you are using a default alarm or creating a custom alarm, you first choose the alarm group that is appropriate for the application. Each alarm condition is assigned to one of these alarm groups: • • • Standard—Standard alarms have a detection rate of 1 second and are useful for detecting conditions such as over current and under voltage. Up to 40 alarms can be set up in this alarm group. Digital—Digital alarms are triggered by an exception such as the transition of a digital input or the end of an incremental energy interval. Up to 12 alarms can be set up in this group. Custom—The power meter has many pre-defined alarms, but you can also set up your own custom alarms using PowerLogic software. For example, you may need to alarm on the ON-to-OFF transition of a digital input. To create this type of custom alarm: 1. Select the appropriate alarm group (digital in this case). 2. Select the type of alarm (described in Table 6–6 on page 52 ). 3. Give the alarm a name. 4. Save the custom alarm. After creating a custom alarm, you can configure it by applying priorities, setting pickups and dropouts (if applicable), and so forth. Both the power meter display and PowerLogic software can be used to set up standard, digital, and custom alarm types. © 2011 Schneider Electric. All Rights Reserved. 45 PowerLogicTM Series 800 Power Meter Chapter 6—Alarms 63230-500-225A2 3/2011 Setpoint-driven Alarms Many of the alarm conditions require that you define setpoints. This includes all alarms for over, under, and phase unbalance alarm conditions. Other alarm conditions such as digital input transitions and phase reversals do not require setpoints. For those alarm conditions that require setpoints, you must define the following information: • • • • Pickup Setpoint Pickup Delay Dropout Setpoint Dropout Delay NOTE: Alarms with both Pickup and Dropout setpoints set to zero are invalid. The following two figures will help you understand how the power meter handles setpointdriven alarms. Figure 6–1 shows what the actual alarm Log entries for Figure 6–2 might look like, as displayed by PowerLogic software. NOTE: The software does not actually display the codes in parentheses—EV1, EV2, Max1, Max2. These are only references to the codes in Figure 6–2. Figure 6–1: Sample alarm log entry (Max2) (EV1) (Max1) PLSD110219 (EV2) Figure 6–2: How the power meter handles setpoint-driven alarms Max2 Max1 Pickup Setpoint Dropout Setpoint Pickup Delay Dropout Delay EV2 PLSD110143 EV1 Alarm Period EV1—The power meter records the date and time that the pickup setpoint and time delay were satisfied, and the maximum value reached (Max1) during the pickup delay period (T). Also, the power meter performs any tasks assigned to the event such as waveform captures or forced data log entries. EV2—The power meter records the date and time that the dropout setpoint and time delay were satisfied, and the maximum value reached (Max2) during the alarm period. The power meter also stores a correlation sequence number (CSN) for each event (such as Under Voltage Phase A Pickup, Under Voltage Phase A Dropout). The CSN lets you relate pickups and dropouts in the alarm log. You can sort pickups and dropouts by CSN to correlate the pickups and dropouts of a particular alarm. The pickup and dropout entries of an alarm will have the same CSN. You can also calculate the duration of an event by looking at pickups and dropouts with the same CSN. 46 © 2011 Schneider Electric. All Rights Reserved. PowerLogicTM Series 800 Power Meter Chapter 6—Alarms 63230-500-225A2 3/2011 Priorities Each alarm also has a priority level. Use the priorities to distinguish between events that require immediate action and those that do not require action. • • • • High priority—if a high priority alarm occurs, the display informs you in two ways: the LED backlight on the display flashes until you acknowledge the alarm and the alarm icon blinks while the alarm is active. Medium priority—if a medium priority alarm occurs, the alarm icon blinks only while the alarm is active. Once the alarm becomes inactive, the alarm icon stops blinking and remains on the display. Low priority—if a low priority alarm occurs, the alarm icon blinks only while the alarm is active. Once the alarm becomes inactive, the alarm icon disappears from the display. No priority—if an alarm is set up with no priority, no visible representation will appear on the display. Alarms with no priority are not entered in the Alarm Log. See Chapter 7—Logging for alarm logging information. If multiple alarms with different priorities are active at the same time, the display shows the alarm message for the last alarm that occurred. For instructions on setting up alarms from the power meter display, see “ALARM (Alarms) Setup” on page 17. Viewing Alarm Activity and History 1. Press ###: until ALARM is visible. 2. Press ALARM. .. 3. View the active alarm listed on the power meter display. If there are no active alarms, the screen reads, “NO ACTIVE ALARM.” 4. If there are active alarms, press <--or --> to view a different alarm. 6. Press <-- or --> to view a different alarm’s history. 7. Press 1; to return to the SUMMARY screen. PLSD110258 5. Press HIST. G ; -2= ^5 . Types of Setpoint-controlled Functions This section describes some common alarm functions to which the following information applies: • Values that are too large to fit into the display may require scale factors. For more information on scale factors, refer to “Changing Scale Factors” on page 91. • Relays can be configured as normal, latched, or timed. See “Relay Output Operating Modes” on page 40 for more information. • When the alarm occurs, the power meter operates any specified relays. There are two ways to release relays that are in latched mode: — Issue a command to de-energize a relay. See Appendix C—Using the Command Interface on page 83 for instructions on using the command interface, or — Acknowledge the alarm in the high priority log to release the relays from latched mode. From the main menu of the display, press ALARM to view and acknowledge unacknowledged alarms. The list that follows shows the types of alarms available for some common alarm functions: NOTE: Voltage based alarm setpoints depend on your system configuration. Alarm setpoints for 3-wire systems are VL-L values while 4-wire systems are VL-N values. © 2011 Schneider Electric. All Rights Reserved. 47 PowerLogicTM Series 800 Power Meter Chapter 6—Alarms 63230-500-225A2 3/2011 Under-voltage: Pickup and dropout setpoints are entered in volts. The per-phase undervoltage alarm occurs when the per-phase voltage is equal to or below the pickup setpoint long enough to satisfy the specified pickup delay (in seconds). The under-voltage alarm clears when the phase voltage remains above the dropout setpoint for the specified dropout delay period. Over-voltage: Pickup and dropout setpoints are entered in volts. The per-phase overvoltage alarm occurs when the per-phase voltage is equal to or above the pickup setpoint long enough to satisfy the specified pickup delay (in seconds). The over-voltage alarm clears when the phase voltage remains below the dropout setpoint for the specified dropout delay period. Unbalance Current: Pickup and dropout setpoints are entered in tenths of percent, based on the percentage difference between each phase current with respect to the average of all phase currents. For example, enter an unbalance of 7% as 70. The unbalance current alarm occurs when the phase current deviates from the average of the phase currents, by the percentage pickup setpoint, for the specified pickup delay. The alarm clears when the percentage difference between the phase current and the average of all phases remains below the dropout setpoint for the specified dropout delay period. Unbalance Voltage: Pickup and dropout setpoints are entered in tenths of percent, based on the percentage difference between each phase voltage with respect to the average of all phase voltages. For example, enter an unbalance of 7% as 70. The unbalance voltage alarm occurs when the phase voltage deviates from the average of the phase voltages, by the percentage pickup setpoint, for the specified pickup delay. The alarm clears when the percentage difference between the phase voltage and the average of all phases remains below the dropout setpoint for the specified dropout delay (in seconds). Phase Loss—Current: Pickup and dropout setpoints are entered in amperes. The phase loss current alarm occurs when any current value (but not all current values) is equal to or below the pickup setpoint for the specified pickup delay (in seconds). The alarm clears when one of the following is true: • • All of the phases remain above the dropout setpoint for the specified dropout delay, or All of the phases drop below the phase loss pickup setpoint. If all of the phase currents are equal to or below the pickup setpoint, during the pickup delay, the phase loss alarm will not activate. This is considered an under current condition. It should be handled by configuring the under current alarm functions. Phase Loss—Voltage: Pickup and dropout setpoints are entered in volts. The phase loss voltage alarm occurs when any voltage value (but not all voltage values) is equal to or below the pickup setpoint for the specified pickup delay (in seconds). The alarm clears when one of the following is true: • • All of the phases remain above the dropout setpoint for the specified dropout delay (in seconds), OR All of the phases drop below the phase loss pickup setpoint. If all of the phase voltages are equal to or below the pickup setpoint, during the pickup delay, the phase loss alarm will not activate. This is considered an under voltage condition. It should be handled by configuring the under voltage alarm functions. Reverse Power: Pickup and dropout setpoints are entered in kilowatts or kVARs. The reverse power alarm occurs when the power flows in a negative direction and remains at or below the negative pickup value for the specified pickup delay (in seconds). The alarm clears when the power reading remains above the dropout setpoint for the specified dropout delay (in seconds). Phase Reversal: Pickup and dropout setpoints do not apply to phase reversal. The phase reversal alarm occurs when the phase voltage rotation differs from the default phase rotation. The power meter assumes that an ABC phase rotation is normal. If a CBA phase rotation is normal, the user must change the power meter’s phase rotation from ABC (default) to CBA. To change the phase rotation from the display, from the main menu select Setup > Meter > Advanced. For more information about changing the phase rotation setting of the power meter, refer to “ADVAN (Advanced) Power Meter Setup Features” on page 19. 48 © 2011 Schneider Electric. All Rights Reserved. PowerLogicTM Series 800 Power Meter Chapter 6—Alarms 63230-500-225A2 3/2011 Scale Factors A scale factor is the multiplier expressed as a power of 10. For example, a multiplier of 10 is represented as a scale factor of 1, since 101=10; a multiplier of 100 is represented as a scale factor of 2, since 102=100. This allows you to make larger values fit into the register. Normally, you do not need to change scale factors. If you are creating custom alarms, you need to understand how scale factors work so that you do not overflow the register with a number larger than what the register can hold. When PowerLogic software is used to set up alarms, it automatically handles the scaling of pickup and dropout setpoints. When creating a custom alarm using the power meter’s display, do the following: • • Determine how the corresponding metering value is scaled, and Take the scale factor into account when entering alarm pickup and dropout settings. Pickup and dropout settings must be integer values in the range of -32,767 to +32,767. For example, to set up an under voltage alarm for a 138 kV nominal system, decide upon a setpoint value and then convert it into an integer between -32,767 and +32,767. If the under voltage setpoint were 125,000 V, this would typically be converted to 12500 x 10 and entered as a setpoint of 12500. Six scale groups are defined (A through F). The scale factor is preset for all factoryconfigured alarms. Table 6–2 lists the available scale factors for each of the scale groups. If you need either an extended range or more resolution, select any of the available scale factors to suit your need. Refer to “Changing Scale Factors” on page 91 of Appendix C—Using the Command Interface. Table 6–2: Scale Groups Scale Group Measurement Range Scale Factor Amperes Scale Group A—Phase Current 0–327.67 A –2 0–3,276.7 A –1 0–32,767 A 0 (default) 0–327.67 kA 1 Amperes Scale Group B—Neutral Current 0–327.67 A –2 0–3,276.7 A –1 0–32,767 A 0 (default) 0–327.67 kA 1 Voltage 0–3,276.7 V Scale Group D—Voltage –1 0–32,767 V 0 (default) 0–327.67 kV 1 0–3,276.7 kV 2 Power 0–32.767 kW, kVAR, kVA Scale Group F—Power kW, kVAR, kVA © 2011 Schneider Electric. All Rights Reserved. –3 0–327.67 kW, kVAR, kVA –2 0–3,276.7 kW, kVAR, kVA –1 0–32,767 kW, kVAR, kVA 0 (default) 0–327.67 MW, MVAR, MVA 1 0–3,276.7 MW, MVAR, MVA 2 0–32,767 MW, MVAR, MVA 3 49 PowerLogicTM Series 800 Power Meter Chapter 6—Alarms 63230-500-225A2 3/2011 Scaling Alarm Setpoints This section is for users who do not have PowerLogic software and need to set up alarms from the power meter display. It explains how to scale alarm setpoints. When the power meter is equipped with a display, most metered quantities are limited to five characters (plus a positive or negative sign). The display will also show the engineering units applied to that quantity. To determine the proper scaling of an alarm setpoint, view the register number for the associated scale group. The scale factor is the number in the Dec column for that register. For example, the register number for Scale D to Phase Volts is 3212. If the number in the Dec column is 1, the scale factor is 10 (101=10). Remember that scale factor 1 in Table 6–3 on page 50 for Scale Group D is measured in kV. Therefore, to define an alarm setpoint of 125 kV, enter 12.5 because 12.5 multiplied by 10 is 125. Below is a table listing the scale groups and their register numbers. Table 6–3: Scale Group Register Numbers Scale Group Register Number Scale Group A—Phase Current 3209 Scale Group B—Neutral Current 3210 Scale Group C—Ground Current 3211 Scale Group D—Voltage 3212 Scale Group F—Power kW, kVAR, kVA 3214 Alarm Conditions and Alarm Numbers This section lists the power meter’s predefined alarm conditions. For each alarm condition, the following information is provided. • • • • • • • Alarm No.—a position number indicating where an alarm falls in the list. Alarm Description—a brief description of the alarm condition Abbreviated Display Name—an abbreviated name that describes the alarm condition but is limited to 15 characters that fit in the window of the power meter’s display. Test Register—the register number that contains the value (where applicable) that is used as the basis for a comparison to alarm pickup and dropout settings. Units—the unit that applies to the pickup and dropout settings. Scale Group—the scale group that applies to the test register’s metering value (A–F). For a description of scale groups, see “Scale Factors” on page 49. Alarm Type—a reference to a definition that provides details on the operation and configuration of the alarm. For a description of alarm types, refer to Table 6–6 on page 52 . Table 6– 4 lists the default alarm configuration - factory-enabled alarms. Table 6– 5 lists the default basic alarms by alarm number. Table 6– 6 lists the alarm types. Table 6–4: Default Alarm Configuration - Factory-enabled Alarms Alarm No. 50 Pickup Limit Standard Alarm Pickup Limit Time Delay Dropout Limit Dropout Limit Time Delay 19 Voltage Unbalance L-N 20 (2.0%) 300 20 (2.0%) 20 Max. Voltage Unbalance L-L 20 (2.0%) 300 20 (2.0%) 300 300 53 End of Incremental Energy Interval 0 0 0 0 55 Power-up Reset 0 0 0 0 © 2011 Schneider Electric. All Rights Reserved. PowerLogicTM Series 800 Power Meter Chapter 6—Alarms 63230-500-225A2 3/2011 Table 6–5: List of Default Basic Alarms by Alarm Number Alarm Number Alarm Description Abbreviated Test Display Name Register Units Scale Alarm Group➀ Type➁ Standard Speed Alarms (1 Second) 01 Over Current Phase A Over Ia 1100 Amperes A 010 02 Over Current Phase B Over Ib 1101 Amperes A 010 03 Over Current Phase C Over Ic 1102 Amperes A 010 04 Over Current Neutral Over In 1103 Amperes B 010 05 Current Unbalance, Max I Unbal Max 1110 Tenths % — 010 06 Current Loss Current Loss 3262 Amperes A 053 07 Over Voltage Phase A–N Over Van 1124 Volts D 010 08 Over Voltage Phase B–N Over Vbn 1125 Volts D 010 09 Over Voltage Phase C–N Over Vcn 1126 Volts D 010 10 Over Voltage Phase A–B Over Vab 1120 Volts D 010 11 Over Voltage Phase B–C Over Vbc 1121 Volts D 010 12 Over Voltage Phase C–A Over Vca 1122 Volts D 010 13 Under Voltage Phase A Under Van 1124 Volts D 020 14 Under Voltage Phase B Under Vbn 1125 Volts D 020 15 Under Voltage Phase C Under Vcn 1126 Volts D 020 16 Under Voltage Phase A–B Under Vab 1120 Volts D 020 17 Under Voltage Phase B–C Under Vbc 1121 Volts D 020 18 Under Voltage Phase C–A Under Vca 1122 Volts D 020 19 Voltage Unbalance L–N, Max V Unbal L-N Max 1136 Tenths % — 010 20 Voltage Unbalance L–L, Max V Unbal L-L Max 1132 Tenths % — 010 21 Voltage Loss (loss of A,B,C, but Voltage Loss not all) 3262 Volts D 052 22 Phase Reversal Phase Rev 3228 — — 051 23 Over kW Demand Over kW Dmd 2151 kW F 011 24 Lagging true power factor Lag True PF 1163 Thousandths — 055 25 Over THD of Voltage Phase A–N Over THD Van 1207 Tenths % — 010 26 Over THD of Voltage Phase B–N Over THD Vbn 1208 Tenths % — 010 27 Over THD of Voltage Phase C–N Over THD Vcn 1209 Tenths % — 010 28 Over THD of Voltage Phase A–B Over THD Vab 1211 Tenths % — 010 29 Over THD of Voltage Phase B–C Over THD Vbc 1212 Tenths % — 010 30 Over THD of Voltage Phase C–A Over THD Vca 1213 Tenths % — 010 31 Over kVA Demand Over kVA Dmd 2181 kVA F 011 32 Over kW Total Over kW Total 1143 kW F 011 Over kVA Total Over kVA Total 1151 kVA F 011 33 34-40 Reserved for additional analog alarms ➂ — — — — — 34-40 Reserved for custom alarms. — — — — — N/A — — 070 Digital 01 End of incremental energy interval End Inc Enr Int 02 End of power demand interval End Dmd Int N/A — — 070 03 Power up/Reset Pwr Up/Reset N/A — — 070 Digital Input OFF/ON DIG IN S02 2 — — 060 04 05-12 Reserved for additional digital alarms ➂ — — — — — 05-12 Reserved for custom alarms — — — — — ➀ Scale groups are described in Table 6–2 on page 49 . ➁ Alarm types are described in Table 6–6 on page 52 . ➂ Additional analog and digital alarms require a corresponding I/O module to be installed. © 2011 Schneider Electric. All Rights Reserved. 51 PowerLogicTM Series 800 Power Meter Chapter 6—Alarms 63230-500-225A2 3/2011 Table 6–6: Alarm Types Type Description Operation Standard Speed Over Value Alarm If the test register value exceeds the setpoint long enough to satisfy the pickup delay period, the alarm condition will be true. When the value in the test register falls below the dropout setpoint long enough to satisfy the dropout delay period, the alarm will drop out. Pickup and dropout setpoints are positive, delays are in seconds. Over Power Alarm If the absolute value in the test register exceeds the setpoint long enough to satisfy the pickup delay period, the alarm condition will be true. When absolute the value in the test register falls below the dropout setpoint long enough to satisfy the dropout delay period, the alarm will drop out. Pickup and dropout setpoints are positive, delays are in seconds. Over Reverse Power Alarm If the absolute value in the test register exceeds the setpoint long enough to satisfy the pickup delay period, the alarm condition will be true. When absolute the value in the test register falls below the dropout setpoint long enough to satisfy the dropout delay period, the alarm will drop out. This alarm will only hold true for reverse power conditions. Positive power values will not cause the alarm to occur. Pickup and dropout setpoints are positive, delays are in seconds. Under Value Alarm If the test register value is below the setpoint long enough to satisfy the pickup delay period, the alarm condition will be true. When the value in the test register rises above the dropout setpoint long enough to satisfy the dropout delay period, the alarm will drop out. Pickup and dropout setpoints are positive, delays are in seconds. Under Power Alarm If the absolute value in the test register is below the setpoint long enough to satisfy the pickup delay period, the alarm condition will be true. When the absolute value in the test register rises above the dropout setpoint long enough to satisfy the dropout delay period, the alarm will drop out. Pickup and dropout setpoints are positive, delays are in seconds. Phase Reversal The phase reversal alarm will occur whenever the phase voltage waveform rotation differs from the default phase rotation. The ABC phase rotation is assumed to be normal. If a CBA phase rotation is normal, the user should reprogram the power meter’s phase rotation ABC to CBA phase rotation. The pickup and dropout setpoints for phase reversal do not apply. Phase Loss, Voltage The phase loss voltage alarm will occur when any one or two phase voltages (but not all) fall to the pickup value and remain at or below the pickup value long enough to satisfy the specified pickup delay. When all of the phases remain at or above the dropout value for the dropout delay period, or when all of the phases drop below the specified phase loss pickup value, the alarm will drop out. Pickup and dropout setpoints are positive, delays are in seconds. Phase Loss, Current The phase loss current alarm will occur when any one or two phase currents (but not all) fall to the pickup value and remain at or below the pickup value long enough to satisfy the specified pickup delay. When all of the phases remain at or above the dropout value for the dropout delay period, or when all of the phases drop below the specified phase loss pickup value, the alarm will drop out. Pickup and dropout setpoints are positive, delays are in seconds. Leading Power Factor The leading power factor alarm will occur when the test register value becomes more leading than the pickup setpoint (such as closer to 0.010) and remains more leading long enough to satisfy the pickup delay period. When the value becomes equal to or less leading than the dropout setpoint, that is 1.000, and remains less leading for the dropout delay period, the alarm will drop out. Both the pickup setpoint and the dropout setpoint must be positive values representing leading power factor. Enter setpoints as integer values representing power factor in thousandths. For example, to define a dropout setpoint of 0.5, enter 500. Delays are in seconds. Lagging Power Factor The lagging power factor alarm will occur when the test register value becomes more lagging than the pickup setpoint (such as closer to –0.010) and remains more lagging long enough to satisfy the pickup delay period. When the value becomes equal to or less lagging than the dropout setpoint and remains less lagging for the dropout delay period, the alarm will drop out. Both the pickup setpoint and the dropout setpoint must be positive values representing lagging power factor. Enter setpoints as integer values representing power factor in thousandths. For example, to define a dropout setpoint of –0.5, enter 500. Delays are in seconds. 060 Digital Input On The digital input transition alarms will occur whenever the digital input changes from off to on. The alarm will dropout when the digital input changes back to on from off. The pickup and dropout setpoints and delays do not apply. 061 Digital Input Off The digital input transition alarms will occur whenever the digital input changes from on to off.The alarm will dropout when the digital input changes back to off from on. The pickup and dropout setpoints and delays do not apply. 070 Unary This is a internal signal from the power meter and can be used, for example, to alarm at the end of an interval or when the power meter is reset. Neither the pickup and dropout delays nor the setpoints apply. 010 011 012 020 021 051 052 053 054 055 Digital 52 © 2011 Schneider Electric. All Rights Reserved. PowerLogicTM Series 800 Power Meter Chapter 6—Alarms 63230-500-225A2 3/2011 Advanced Alarms This section describes the advanced alarm features found on the PM850 and the PM870. For information about basic alarm features, see “Basic Alarms” on page 45. Table 6 – 7: Advanced alarm features by model PM850 PM870 Boolean alarms Advanced Alarm Feature 10 10 Disturbance alarms — 12 Alarm levels Yes Yes Custom alarms Yes Yes Advanced Alarm Groups In addition to the basic alarm groups (see “Basic Alarm Groups” on page 45), the following advanced alarm groups are available. • Boolean—Boolean alarms use Boolean logic to combine up to four enabled alarms. You can choose from the Boolean logic operands: AND, NAND, OR, NOR, or XOR to combine your alarms. Up to 10 alarms can be set up in this group. • Disturbance (PM870)—Disturbance alarms have a detection rate of half a cycle and are useful for detecting voltage sags and swells. The Power Meter comes configured with 12 default voltage sag and swell alarms; current sag and swell alarms are available by configuring custom alarms. Up to 12 disturbance alarms can be set up in this group. For more information about disturbance monitoring, see Chapter 9—Disturbance Monitoring (PM870) on page 65. • Custom—The power meter has many pre-defined alarms, but you can also set up your own custom alarms using PowerLogic software. For example, you may need to alarm on a sag condition for current A. To create this type of custom alarm: 1. Select the appropriate alarm group (Disturbance in this case). 2. Delete any of the default alarms you are not using from the disturbance alarms group (for example, Sag Vbc). The Add button should be available now. 3. Click Add, then select Disturbance, Sag, and Current A. 4. Give the alarm a name. 5. Save the custom alarm. After creating a custom alarm, you can configure it by applying priorities, setting pickups and dropouts (if applicable), and so forth. PowerLogic software can be used to configure any of the advanced alarm types, but the power meter display cannot be used. Also, use PowerLogic software to delete an alarm and create a new alarm for evaluating other metered quantities. © 2011 Schneider Electric. All Rights Reserved. 53 PowerLogicTM Series 800 Power Meter Chapter 6—Alarms 63230-500-225A2 3/2011 Alarm Levels Using PowerLogic software with a PM850 or PM870, multiple alarms can be set up for one particular quantity (parameter) to create alarm “levels”. You can take different actions depending on the severity of the alarm. For example, you could set up two alarms for kW Demand. A default alarm already exists for kW Demand, but you could create another custom alarm for kW Demand, selecting different pickup points for it. The custom kW Demand alarm, once created, will appear in the standard alarm list. For illustration purposes, let’s set the default kW Demand alarm to 120 kW and the new custom alarm to 150 kW. One alarm named kW Demand ; the other kW Demand 150kW as shown in Figure 6–3. If you choose to set up two alarms for the same quantity, use slightly different names to distinguish which alarm is active. The display can hold up to 15 characters for each name. You can create up to 10 alarm levels for each quantity. Figure 6–3:Two alarms set up for the same quantity with different pickup and dropout set points kW Demand Alarm #43 Pick Up 150 Alarm #43 Drop Out 140 130 Alarm #26 Pick Up 120 Alarm #26 Drop Out 100 PLSD110156 Demand OK Approaching Peak Demand Peak Demand Exceeded kW Demand (default) Alarm #26 kW Demand with pickup of 120 kWd, medium priority Below Peak Demand OK Demand Time kW Demand 150 kW (custom) Alarm #43 kW Demand with pickup of 150 kWd, high priority Viewing Alarm Activity and History 1. Press ###: until ALARM is visible. 2. Press ALARM. .. 3. View the active alarm listed on the power meter display. If there are no active alarms, the screen reads, “NO ACTIVE ALARMS.” 4. If there are active alarms, press <--or -> to view a different alarm. 6. Press <-- or --> to view a different alarm’s history. 7. Press 1; to return to the SUMMARY screen. 54 PLSD110258 5. Press HIST. G ; -2= ^5 . © 2011 Schneider Electric. All Rights Reserved. PowerLogicTM Series 800 Power Meter Chapter 6—Alarms 63230-500-225A2 3/2011 Alarm Conditions and Alarm Numbers This section lists the power meter’s predefined alarm conditions. For each alarm condition, the following information is provided. • • • Alarm No.—a position number indicating where an alarm falls in the list. • Test Register—the register number that contains the value (where applicable) that is used as the basis for a comparison to alarm pickup and dropout settings. • • Units—the unit that applies to the pickup and dropout settings. • Alarm Type—a reference to a definition that provides details on the operation and configuration of the alarm. For a description of advanced alarm types, refer to Table 6–9. Alarm Description—a brief description of the alarm condition Abbreviated Display Name—an abbreviated name that describes the alarm condition, but is limited to 15 characters that fit in the window of the power meter’s display. Scale Group—the scale group that applies to the test register’s metering value (A–F). For a description of scale groups, see “Scale Factors” on page 49. Table 6–8 lists the preconfigured alarms by alarm number. Table 6–8: List of Default Disturbance Alarms by Alarm Number Alarm Number Alarm Description Abbreviated Test Display Name Register Units Scale Alarm Group➀ Type➁ Disturbance Monitoring (1/2 Cycle) (PM870) 41 Voltage Swell A Swell Van Volts D 080 42 Voltage Swell B Swell Vbn Volts D 080 43 Voltage Swell C Swell Vcn Volts D 080 44 Voltage Swell A–B Swell Vab Volts D 080 080 45 Voltage Swell B–C Swell Vbc Volts D 46 Voltage Swell C–A Swell Vca Volts D 080 47 Voltage Sag A–N Sag Van Volts D 080 080 48 Voltage Sag B–N Sag Vbn Volts D 49 Voltage Sag C–N Sag Vcn Volts D 080 50 Voltage Sag A–B Sag Vab Volts D 080 51 Voltage Sag B–C Sag Vbc Volts D 080 52 Voltage Sag C–A Sag Vca Volts D 080 ➀ Scale groups are described in Table 6–2 on page 49. ➁ Advanced Alarm types are described in Table 6–9 on page 56. NOTE: Current sag and swell alarms are enabled using PowerLogic software or by setting up custom alarms. To do this, delete any of the above default disturbance alarms, and then create a new current sag or swell alarm (see the example under the “Advanced Alarm Groups” on page 53.). Sag and swell alarms are available for all channels. © 2011 Schneider Electric. All Rights Reserved. 55 PowerLogicTM Series 800 Power Meter Chapter 6—Alarms 63230-500-225A2 3/2011 Table 6–9: Advanced Alarm Types Type Description Operation Boolean 100 101 102 103 104 Logic AND Logic NAND Logic OR Logic NOR Logic XOR The AND alarm will occur when all of the combined enabled alarms are true (up to 4). The alarm will drop out when any of the enabled alarms drops out. The NAND alarm will occur when any, but not all, or none of the combined enabled alarms are true. The alarm will drop out when all of the enabled alarms drop out, or all are true. The OR alarm will occur when any of the combined enabled alarms are true (up to 4). The alarm will drop out when all of the enabled alarms are false. The NOR alarm will occur when none of the combined enabled alarms are true (up to 4). The alarm will drop out when any of the enabled alarms are true. The XOR alarm will occur when only one of the combined enabled alarms is true (up to 4). The alarm will drop out when the enabled alarm drops out or when more than one alarm becomes true. Disturbance (PM870) 080 080 56 Voltage Swell The voltage swell alarms will occur whenever the continuous rms calculation is above the pickup setpoint and remains above the pickup setpoint for the specified number of cycles. When the continuous rms calculations fall below the dropout setpoint and remain below the setpoint for the specified number of cycles, the alarm will drop out. Pickup and dropout setpoints are positive and delays are in cycles. Voltage Sag The voltage sag alarms will occur whenever the continuous rms calculation is below the pickup setpoint and remains below the pickup setpoint for the specified number of cycles. When the continuous rms calculations rise above the dropout setpoint and remain above the setpoint for the specified number of cycles, the alarm will drop out. Pickup and dropout setpoints are positive and delays are in cycles. © 2011 Schneider Electric. All Rights Reserved. PowerLogicTM Series 800 Power Meter Chapter 7—Logging 63230-500-225A2 3/2011 Chapter 7—Logging Introduction This chapter briefly describes the following logs of the power meter: • • • • Alarm log Maintenance log Billing log User-defined data logs See the table below for a summary of logs supported by each power meter model. Table 7–1: Number of Logs Supported by Model Number of Logs per Model Log Type PM810 PM810 with PM810LOG PM820 PM850 PM870 Alarm Log 1 1 1 1 1 Maintenance Log 1 1 1 1 1 Billing Log — 1 1 1 1 Data Log 1 — 1 1 1 1 Data Log 2 — 1 1 Data Log 3 — 1 1 Data Log 4 — 1 1 Logs are files stored in the non-volatile memory of the power meter and are referred to as “on-board logs.” The amount of memory available depends on the model (see Table 7–2). Data and billing log files are preconfigured at the factory. You can accept the preconfigured logs or change them to meet your specific needs. Use PowerLogic software to set up and view all the logs. See your software’s online help or documentation for information about working with the power meter’s on-board logs. Table 7–2: Available Memory for On-board Logs Power Meter Model Total Memory Available PM810 0 KB PM810 with PM810LOG 80 KB PM820 80 KB PM850 800 KB PM870 800 KB Waveform captures are stored in the power meter’s memory, but they are not considered logs (see Chapter 8—Waveform Capture on page 63). Refer to “Memory Allocation for Log Files”on the next page for information about memory allocation in the power meter. © 2011 Schneider Electric. All Rights Reserved. 57 PowerLogicTM Series 800 Power Meter Chapter 7—Logging 63230-500-225A2 3/2011 Memory Allocation for Log Files Each file in the power meter has a maximum memory size. Memory is not shared between the different logs, so reducing the number of values recorded in one log will not allow more values to be stored in a different log. The following table lists the memory allocated to each log: Table 7–3: Memory Allocation for Each Log Max. Records Stored Max. Register Values Recorded Storage (Bytes) Alarm Log 100 11 2,200 All models Maintenance Log 40 4 320 All models Log Type Billing Log 5000 96 + 3 D/T 65,536 Power Meter Model PM810 with PM810LOGPM820 PM850 PM870 Data Log 1 1851 96 + 3 D/T 14,808 PM810 with PM810LOGPM820 PM850 PM870 Data Log 2 5000 96 + 3 D/T 393,216 Data Log 3 5000 96 + 3 D/T 393,216 Data Log 4 32,000 96 + 3 D/T 393,216 PM850 PM870 PM850 PM870 PM850 PM870 Alarm Log By default, the power meter can log the occurrence of any alarm condition. Each time an alarm occurs it is entered into the alarm log. The alarm log in the power meter stores the pickup and dropout points of alarms along with the date and time associated with these alarms. You select whether the alarm log saves data as first-in-first-out (FIFO) or fill and hold. With PowerLogic software, you can view and save the alarm log to disk, and reset the alarm log to clear the data out of the power meter’s memory. Alarm Log Storage The power meter stores alarm log data in non-volatile memory. The size of the alarm log is fixed at 100 records. Maintenance Log The power meter stores a maintenance log in non-volatile memory. The file has a fixed record length of four registers and a total of 40 records. The first register is a cumulative counter over the life of the power meter. The last three registers contain the date/time of when the log was updated. Table 7–4 describes the values stored in the maintenance log. These values are cumulative over the life of the power meter and cannot be reset. NOTE: Use PowerLogic software to view the maintenance log. 58 © 2011 Schneider Electric. All Rights Reserved. PowerLogicTM Series 800 Power Meter Chapter 7—Logging 63230-500-225A2 3/2011 Table 7–4: Values Stored in the Maintenance Log Record Number Value Stored 1 Time stamp of the last change 2 Date and time of the last power failure 3 Date and time of the last firmware download 4 Date and time of the last option module change 5 Date and time of the latest LVC update due to configuration errors detected during meter initialization 6–11 Reserved 12 Date and time the Present Month Min/Max was last reset 13 Date and time the Previous Month Min/Max was last reset 14 Date and time the Energy Pulse Output was overdriven 15 Date and time the Power Demand Min/Max was last reset 16 Date and time the Current Demand Min/Max was last reset 17 Date and time the Generic Demand Min/Max was last reset 18 Date and time the Input Demand Min/Max was last reset 19 Reserved 20 Date and time the Accumulated Energy value was last reset 21 Date and time the Conditional Energy value was last reset 22 Date and time the Incremental Energy value was last reset 23 Reserved 24 Date and time of the last Standard KY Output operation 25 Date and time of the last Discrete Output @A01 operation➀ 26 Date and time of the last Discrete Output @A02 operation➀ 27 Date and time of the last Discrete Output @A03 operation➀ 28 Date and time of the last Discrete Output @A04 operation➀ 29 Date and time of the last Discrete Output @A05 operation➀ 30 Date and time of the last Discrete Output @A06 operation➀ 31 Date and time of the last Discrete Output @A07 operation➀ 32 Date and time of the last Discrete Output @A08 operation➀ 33 Date and time of the last Discrete Output @B01 operation➀ 34 Date and time of the last Discrete Output @B02 operation➀ 35 Date and time of the last Discrete Output @B03 operation➀ 36 Date and time of the last Discrete Output @B04 operation➀ 37 Date and time of the last Discrete Output @B05 operation➀ 38 Date and time of the last Discrete Output @B06 operation➀ 39 Date and time of the last Discrete Output @B07 operation➀ 40 Date and time of the last Discrete Output @B08 operation➀ ➀ Additional outputs require option modules and are based on the I/O configuration of that particular module. © 2011 Schneider Electric. All Rights Reserved. 59 PowerLogicTM Series 800 Power Meter Chapter 7—Logging 63230-500-225A2 3/2011 Data Logs The PM810 with a PM810LOG records and stores readings at regularly scheduled intervals in one independent data log. This log is preconfigured at the factory. You can accept the preconfigured data log or change it to meet your specific needs. You can set up the data log to store the following information: The PM820 records and stores readings at regularly scheduled intervals in one independent data log. The PM850 and PM870 record and store meter readings at regularly scheduled intervals in up to three independent data logs. Some data log files are preconfigured at the factory. You can accept the preconfigured data logs or change them to meet your specific needs. You can set up each data log to store the following information: • Timed Interval—1 second to 24 hours for Data Log 1 • Timed Interval—1 second to 24 hours for Data Log 1, and 1 minute to 24 hours for Data Logs 2, 3 and 4 (how often the values are logged) • • • First-In-First-Out (FIFO) or Fill and Hold Values to be logged—up to 96 registers along with the date and time of each log entry START/STOP Time—each log has the ability to start and stop at a certain time during the day The default registers for Data Log 1 are listed in Table 7–5 below. Table 7–5: Default Data Log 1 Register List Description Number of Registers Data Type➀ Register Number Start Date/Time 3 D/T Current D/T Current, Phase A 1 integer 1100 Current, Phase B 1 integer 1101 Current, Phase C 1 integer 1102 Current, Neutral 1 integer 1103 Voltage A-B 1 integer 1120 Voltage B-C 1 integer 1121 Voltage C-A 1 integer 1122 Voltage A-N 1 integer 1124 Voltage B-N 1 integer 1125 Voltage C-N 1 integer 1126 True Power Factor, Phase A 1 signed integer 1160 True Power Factor, Phase B 1 signed integer 1161 True Power Factor, Phase C 1 signed integer 1162 True Power Factor, Total 1 signed integer 1163 Last Demand, Current, 3-Phase Average 1 integer 2000 Last Demand, Real Power, 3-Phase Total 1 integer 2150 Last Demand, Reactive Power, 3-Phase Total 1 integer 2165 Last Demand, Apparent Power 3-Phase Total 1 integer 2180 ➀ Refer to Appendix A for more information about data types. Use PowerLogic software to clear each data log file, independently of the others, from the power meter’s memory. For instructions on setting up and clearing data log files, refer to the PowerLogic software online help or documentation. 60 © 2011 Schneider Electric. All Rights Reserved. PowerLogicTM Series 800 Power Meter Chapter 7—Logging 63230-500-225A2 3/2011 Alarm-driven Data Log Entries The PM810 with a PM810LOG can detect over 50 alarm conditions, including over/under conditions, digital input changes, phase unbalance conditions, and more. (See Chapter 6—Alarms on page 45 for more information.) Use PowerLogic software to assign each alarm condition one or more tasks, including forcing data log entries into Data Log 1. The PM820, PM850, and PM870 can detect over 50 alarm conditions, including over/under conditions, digital input changes, phase unbalance conditions, and more. (See Chapter 6—Alarms on page 45 for more information.) Use PowerLogic software to assign each alarm condition one or more tasks, including forcing data log entries into one or more data log files. For example, assume you have defined three data log files. Using PowerLogic software, you could select an alarm condition such as “Overcurrent Phase A” and set up the power meter to force data log entries into any of the three log files each time the alarm condition occurs. Organizing Data Log Files (PM850, PM870) You can organize data log files in many ways. One possible way is to organize log files according to the logging interval. You might also define a log file for entries forced by alarm conditions. For example, you could set up three data log files as follows: Data Log 1: Log voltage every minute. Make the file large enough to hold 60 entries so that you could look back over the last hour’s voltage readings. Data Log 2: Log energy once every day. Make the file large enough to hold 31 entries so that you could look back over the last month and see daily energy use. Data Log 3: Report by exception. The report by exception file contains data log entries that are forced by the occurrence of an alarm condition. See the topic above, “Alarm-driven Data Log Entries”, for more information. NOTE: The same data log file can support both scheduled and alarm-driven entries. Billing Log The PM810 with a PM810LOG, PM820, PM850 and PM870 Power Meters store a configurable billing log that updates every 10 to 1,440 minutes (the default interval 60 minutes). Data is stored by month, day, and the specified interval in minutes. The log contains 24 months of monthly data and 32 days of daily data, but because the maximum amount of memory for the billing log is 64 KB, the number of recorded intervals varies based on the number of registers recorded in the billing log. For example, using all of the registers listed in Table 7–6, the billing log holds 12 days of data at 60-minute intervals. This value is calculated by doing the following: 1. Calculate the total number of registers used (see Table 7–6 on page 63 for the number of registers). In this example, all 26 registers are used. 2. Calculate the number of bytes used for the 24 monthly records. 24 records (26 registers x 2 bytes/register) = 1,248 3. Calculate the number of bytes used for the 32 daily records. 32 (26 x 2) = 1,664 4. Calculate the number of bytes used each day (based on 15 minute intervals). 96 (26 x 2) = 4,992 5. Calculate the number of days of 60-minute interval data recorded by subtracting the values from steps 2 and 3 from the total log file size of 65,536 bytes and then dividing by the value in step 4. (65,536 – 1,248 – 1,664) 4,992 = 12 days © 2011 Schneider Electric. All Rights Reserved. 61 PowerLogicTM Series 800 Power Meter Chapter 7—Logging 62 63230-500-225A2 3/2011 © 2011 Schneider Electric. All Rights Reserved. PowerLogicTM Series 800 Power Meter Chapter 7—Logging 63230-500-225A2 3/2011 Table 7–6: Billing Log Register List Description Number of Registers Data Type➀ Register Number Start Date/Time 3 D/T Current D/T Real Energy In 4 MOD10L4 1700 Reactive Energy In 4 MOD10L4 1704 Real Energy Out 4 MOD10L4 1708 Reactive Energy Out 4 MOD10L4 1712 Apparent Energy Total 4 MOD10L4 1724 Total PF 1 INT16 1163 3P Real Power Demand 1 INT16 2151 3P Apparent Power Demand 1 INT16 2181 ➀ Refer to Appendix A for more information about data types. Configure the Billing Log Logging Interval The billing log can be configured to update every 10 to 1,440 minutes. The default logging interval is 60 minutes. To set the logging interval you can use PowerLogic software, or you can use the power meter to write the logging interval to register 3085 (see “Read and Write Registers” on page 26). © 2011 Schneider Electric. All Rights Reserved. 63 PowerLogicTM Series 800 Power Meter Chapter 7—Logging 64 63230-500-225A2 3/2011 © 2011 Schneider Electric. All Rights Reserved. PowerLogicTM Series 800 Power Meter Chapter 8—Waveform Capture 63230-500-225A2 3/2011 Chapter 8—Waveform Capture Introduction This section explains the waveform capture capabilities of the following Power Meter models: • • PM850 PM870 See Table 8–1 for a summary of waveform capture features. Table 8–1: Waveform capture summary by model Waveform Capture Feature PM850 PM870 5 5 Manually By alarm Samples per cycle 128 Configurable* Channels (1 to 6) Number of waveform captures Waveform initiated: Configurable Configurable* Cycles 3 Configurable* Precycles 1 Configurable* * See Figure 8–1. Waveform Capture A waveform capture can be initiated manually or by an alarm trigger to analyze steadystate or disturbance events. This waveform provides information about individual harmonics, which PowerLogic software calculates through the 63rd harmonic. It also calculates total harmonic distortion (THD) and other power quality parameters. NOTE: Disturbance waveform captures are available in the PM870 only. In the PM850, the waveform capture records five individual three-cycle captures at 128 samples per cycle simultaneously on all six metered channels. In the PM870, there is a range of one to five waveform captures, but the number of cycles captured varies based on the number of samples per cycle and the number of channels selected in your software. Use Figure 8–1 to determine the number of cycles captured. Figure 8–1: PM870 Number of Cycles Captured PLSD110333 Number of Channels 6 30 15 7 3 5 35 15 9 4 4 45 20 10 5 3 60 30 15 7 2 90 45 20 10 1 185 90 45 20 16 32 64 128 Number of Samples per Cycle NOTE: The number of cycles shown above are the total number of cycles allowed (preevent cycles + event cycles = total cycles). © 2011 Schneider Electric. All Rights Reserved. 63 PowerLogicTM Series 800 Power Meter Chapter 8—Waveform Capture 63230-500-225A2 3/2011 Initiating a Waveform Using PowerLogic software from a remote PC, initiate a waveform capture manually by selecting the power meter and issuing the acquire command. The software will automatically retrieve the waveform capture from the power meter. You can display the waveform for all three phases, or zoom in on a single waveform, which includes a data block with extensive harmonic data. See your software’s online help or documentation for instructions. Waveform Storage The power meter can store multiple captured waveforms in its non-volatile memory. The number of waveforms stored is based on the number selected. There are a maximum of five stored waveforms. All stored waveform data is retained on power loss. Waveform Storage Modes There are two ways to store waveform captures: “FIFO” and “Fill and Hold.” FIFO mode allows the file to fill up the waveform capture file. After the file is full, the oldest waveform capture is removed, and the most recent waveform capture is added to the file. The Fill and Hold mode fills the file until the configured number of waveform captures is reached. New waveform captures cannot be added until the file is cleared. How the Power Meter Captures an Event When the power meter senses the trigger—that is, when the digital input transitions from OFF to ON, or an alarm condition is met—the power meter transfers the cycle data from its data buffer into the memory allocated for event captures. Channel Selection in PowerLogic Software Using PowerLogic software, you can select up to six channels to include in the waveform capture. See your software’s online help or documentation for instructions. 64 © 2011 Schneider Electric. All Rights Reserved. PowerLogicTM Series 800 Power Meter Chapter 9—Disturbance Monitoring (PM870) 63230-500-225A2 3/2011 Chapter 9—Disturbance Monitoring (PM870) This chapter provides background information about disturbance monitoring and describes how to use the PM870 to continuously monitor for disturbances on the current and voltage inputs. About Disturbance Monitoring Momentary voltage disturbances are an increasing concern for industrial plants, hospitals, data centers, and other commercial facilities because modern equipment used in those facilities tends to be more sensitive to voltage sags, swells, and momentary interruptions. The power meter can detect these events by continuously monitoring and recording current and voltage information on all metered channels. Using this information, you can diagnose equipment problems resulting from voltage sags or swells and identify areas of vulnerability, enabling you to take corrective action. The interruption of an industrial process because of an abnormal voltage condition can result in substantial costs, which manifest themselves in many ways: • • • • labor costs for cleanup and restart lost productivity damaged product or reduced product quality delivery delays and user dissatisfaction The entire process can depend on the sensitivity of a single piece of equipment. Relays, contactors, adjustable speed drives, programmable controllers, PCs, and data communication networks are all susceptible to power quality problems. After the electrical system is interrupted or shut down, determining the cause may be difficult. Several types of voltage disturbances are possible, each potentially having a different origin and requiring a separate solution. A momentary interruption occurs when a protective device interrupts the circuit that feeds a facility. Swells and over-voltages can damage equipment or cause motors to overheat. Perhaps the biggest power quality problem is the momentary voltage sag caused by faults on remote circuits. A voltage sag is a brief (1/2 cycle to 1 minute) decrease in rms voltage magnitude. A sag is typically caused by a remote fault somewhere on the power system, often initiated by a lightning strike. In Figure 9–1, the utility circuit breaker cleared the fault near plant D. The fault not only caused an interruption to plant D, but also resulted in voltage sags to plants A, B, and C. NOTE: The PM870 is able to detect sag and swell events less than 1/2 cycle duration. However, it may be impractical to have setpoints more sensitive than 10% for voltage and current fluctuations. © 2011 Schneider Electric. All Rights Reserved. 65 PowerLogicTM Series 800 Power Meter Chapter 9—Disturbance Monitoring (PM870) 63230-500-225A2 3/2011 Figure 9–1: A fault can cause a voltage sag on the whole system Utility Circuit Breakers with Reclosers 1 Plant A Utility Transformer 2 Plant B 3 Plant C X 4 Plant D Fault A fault near plant D, cleared by the utility circuit breaker, can still affect plants A, B, and C, resulting in a voltage sag. System voltage sags are much more numerous than interruptions, since a wider part of the distribution system is affected. And, if reclosers are operating, they may cause repeated sags. The PM870 can record recloser sequences, too. The waveform in Figure 9–2 shows the magnitude of a voltage sag, which persists until the remote fault is cleared. Figure 9–2: Waveform showing voltage sag caused by a remote fault and lasting five cycles With the information obtained from the PM870 during a disturbance, you can solve disturbance-related problems, including the following: • Obtain accurate measurement from your power system — Identify the number of sags, swells, or interruptions for evaluation — Accurately distinguish between sags and interruptions, with accurate recording of the time and date of the occurrence — Provide accurate data in equipment specification (ride-through, etc.) • Determine equipment sensitivity — Compare equipment sensitivity of different brands (contactor dropout, drive sensitivity, etc.) — Diagnose mysterious events such as equipment malfunctions, contactor dropout, computer glitches, etc. — Compare actual sensitivity of equipment to published standards 66 © 2011 Schneider Electric. All Rights Reserved. PowerLogicTM Series 800 Power Meter Chapter 9—Disturbance Monitoring (PM870) 63230-500-225A2 3/2011 — Use waveform capture to determine exact disturbance characteristics to compare with equipment sensitivity — Justify purchase of power conditioning equipment — Distinguish between equipment malfunctions and power system related problems • Develop disturbance prevention methods — Develop solutions to voltage sensitivity-based problems using actual data • Work with the utility — Discuss protection practices with the serving utility and negotiate suitable changes to shorten the duration of potential sags (reduce interruption time delays on protective devices) — Work with the utility to provide alternate “stiffer” services (alternate design practices) Capabilities of the PM870 During an Event The PM870 calculates rms magnitudes, based on 128 data points per cycle, every 1/2 cycle. This ensures that even sub-cycle duration rms variations are not missed. The power meter is configured with 12 default voltage disturbance alarms for all voltage channels. Current sag and swell alarms are available by configuring custom alarms. A maximum of 12 disturbance alarms are available. When the PM870 detects a sag or swell, it can perform the following actions: • Perform a waveform capture with a resolution from 185 cycles at 16 samples per cycle on one channel down to 3 cycles at 128 samples per cycle on all six channels of the metered current and voltage inputs (see Figure 8–1 on page 63). Use PowerLogic software to set up the event capture and retrieve the waveform. • Record the event in the alarm log. When an event occurs, the PM870 updates the alarm log with an event date and time stamp with 1 millisecond resolution for a sag or swell pickup, and an rms magnitude corresponding to the most extreme value of the sag or swell during the event pickup delay. Also, the PM870 can record the sag or swell dropout in the alarm log at the end of the disturbance. Information stored includes: a dropout time stamp with 1 millisecond resolution and a second rms magnitude corresponding to the most extreme value of the sag or swell. Use PowerLogic software to view the alarm log. NOTE: The Power Meter display has a 1 second resolution. • Force a data log entry in up to 3 independent data logs. Use PowerLogic software to set up and view the data logs. • • Operate any output relays when the event is detected. Indicate the alarm on the display by flashing the maintenance icon to show that a sag or swell event has occurred. © 2011 Schneider Electric. All Rights Reserved. 67 PowerLogicTM Series 800 Power Meter Chapter 9—Disturbance Monitoring (PM870) 68 63230-500-225A2 3/2011 © 2011 Schneider Electric. All Rights Reserved. PowerLogicTM Series 800 Power Meter Chapter 10—Maintenance and Troubleshooting 63230-500-225A2 3/2011 Chapter 10—Maintenance and Troubleshooting Introduction This chapter describes information related to maintenance of your power meter. The power meter does not contain any user-serviceable parts. If the power meter requires service, contact your local sales representative. Do not open the power meter. Opening the power meter voids the warranty. DANGER HAZARD OF ELECTRIC SHOCK, EXPLOSION, OR ARC FLASH • Do not attempt to service the power meter. CT and PT inputs may contain hazardous currents and voltages. • Only authorized service personnel from the manufacturer should service the power meter. Failure to follow these instructions will result in death or serious injury. CAUTION HAZARD OF EQUIPMENT DAMAGE • Do not perform a Dielectric (Hi-Pot) or Megger test on the power meter. High voltage testing of the power meter may damage the unit. • Before performing Hi-Pot or Megger testing on any equipment in which the power meter is installed, disconnect all input and output wires to the power meter. Failure to follow these instructions can result in injury or equipment damage. Power Meter Memory The power meter uses its non-volatile memory (RAM) to retain all data and metering configuration values. Under the operating temperature range specified for the power meter, this non-volatile memory has an expected life of up to 100 years. The power meter stores its data logs on a memory chip, which has a life expectancy of up to 20 years under the operating temperature range specified for the power meter. The life of the internal batterybacked clock is over 10 years at 25°C. NOTE: Life expectancy is a function of operating conditions; this does not constitute any expressed or implied warranty. Date and Time Settings The clock in the PM810 is volatile. Therefore, the PM810 returns to the default clock date/time of 12:00 AM 01-01-1980 each time the meter resets. Reset occurs when the meter loses control power or you change meter configuration parameters including selecting the time format (24-hr or AM/PM) or date format. To avoid resetting clock time more than once, always set the clock date and time last. The PM810LOG (optional module) provides a non-volatile clock in addition to on-board logging and individual harmonics readings for the PM810. © 2011 Schneider Electric. All Rights Reserved. 69 PowerLogicTM Series 800 Power Meter Chapter 10—Maintenance and Troubleshooting 63230-500-225A2 3/2011 Identifying the Firmware Version, Model, and Serial Number 1. From the first menu level, press ###: until MAINT is visible. 0 2. Press DIAG. 3. Press METER. 4. View the model, firmware (OS) version, and serial number. . 5. Press 1; to return to the MAINTENANCE screen. . PLSD110094d * G Viewing the Display in Different Languages The power meter can be set to use one of five different languages: English, French, and Spanish. Other languages are available. Please contact your local sales representative for more information about other language options. The power meter language can be selected by doing the following: 1. From the first menu level, press ###: until MAINT is visible. *++ 2. Press MAINT. 3. Press SETUP. +* 4. Enter your password, then press OK. 5. Press ###: until LANG is visible. 7. Select the language: ENGL (English), FREN (French), SPAN (Spanish), GERMN (German), or RUSSN (Russian). 8. Press OK. 9. Press1;. PLSD110103 6. Press LANG. 10. Press YES to save your changes. Technical Support For assistance with technical issues, contact your local Schneider Electric representative. 70 © 2011 Schneider Electric. All Rights Reserved. PowerLogicTM Series 800 Power Meter Chapter 10—Maintenance and Troubleshooting 63230-500-225A2 3/2011 Troubleshooting The information in Table 10–1 on page 72 describes potential problems and their possible causes. It also describes checks you can perform or possible solutions for each. If you still cannot resolve the problem after referring to this table, contact the your local Schneider Electric sales representative for assistance. DANGER HAZARD OF ELECTRIC SHOCK, EXPLOSION, OR ARC FLASH • Apply appropriate personal protective equipment (PPE) and follow safe electrical practices. For example, in the United States, see NFPA 70E. • This equipment must be installed and serviced only by qualified personnel. • Turn off all power supplying this equipment before working on or inside. • Always use a properly rated voltage sensing device to confirm that all power is off. • Carefully inspect the work area for tools and objects that may have been left inside the equipment. • Use caution while removing or installing panels so that they do not extend into the energized bus; avoid handling the panels which could cause personal injury. Failure to follow these instructions will result in death or serious injury. Heartbeat LED The heartbeat LED helps to troubleshoot the power meter. The LED works as follows: • • Normal operation — the LED flashes at a steady rate during normal operation. • Hardware — if the heartbeat LED remains lit and does not flash ON and OFF, there is a hardware problem. Do a hard reset of the power meter (turn OFF power to the power meter, then restore power to the power meter). If the heartbeat LED remains lit, contact your local sales representative. • Control power and display — if the heartbeat LED flashes, but the display is blank, the display is not functioning properly. If the display is blank and the LED is not lit, verify that control power is connected to the power meter. Communications — the LED flash rate changes as the communications port transmits and receives data. If the LED flash rate does not change when data is sent from the host computer, the power meter is not receiving requests from the host computer. © 2011 Schneider Electric. All Rights Reserved. 71 PowerLogicTM Series 800 Power Meter Chapter 10—Maintenance and Troubleshooting 63230-500-225A2 3/2011 Table 10–1: Troubleshooting Potential Problem Possible Cause Possible Solution The maintenance icon is illuminated on the power meter display. When the maintenance icon is illuminated, it indicates a potential hardware or firmware problem in the power meter. Go to DIAGNOSTICS > MAINTENANCE. Error messages display to indicate the reason the icon is illuminated. Note these error messages and call Technical Support, or contact your local sales representative for assistance. The display shows error code 3. Loss of control power or meter configuration has changed. Set date and time. The display is blank after applying control power to the power meter. The power meter may not be receiving the necessary power. • • Verify that the power meter line (L) and neutral (N) terminals (terminals 25 and 27) are receiving the necessary power. Verify that the heartbeat LED is blinking. Verify that the power meter is grounded as Power meter is grounded incorrectly. described in “Grounding the Power Meter” in the installation manual. Check that the correct values have been entered for power meter setup parameters (CT and PT ratings, System Type, Nominal Frequency, and so on). See “Power Meter Setup” on page 13 for setup instructions. Incorrect setup values. The data being displayed is inaccurate or not what you Incorrect voltage inputs. expect. Check power meter voltage input terminals L (8, 9, 10, 11) to verify that adequate voltage is present. Power meter is wired improperly. Check that all CTs and PTs are connected correctly (proper polarity is observed) and that they are energized. Check shorting terminals. See “Instrument Transformer Wiring: Troubleshooting Tables” on page 73. Initiate a wiring check using PowerLogic software. Power meter address is incorrect. Check to see that the power meter is correctly addressed. See “COMMS (Communications) Setup” on page 15 for instructions. Power meter baud rate is incorrect. Verify that the baud rate of the power meter matches the baud rate of all other devices on its communications link. See “COMMS (Communications) Setup” on page 15 for instructions. Cannot communicate with power meter from a remote Verify the power meter communications Communications lines are improperly personal computer. connections. Refer to the PM800-Series connected. Installation Guide. Check to see that a multipoint Communications lines are improperly communications terminator is properly installed. Refer to the PM800-Series terminated. Installation Guide. Incorrect route statement to power meter. 72 Check the route statement. Refer to your software online help or documentation for instructions on defining route statements. © 2011 Schneider Electric. All Rights Reserved. PowerLogicTM Series 800 Power Meter Appendix A—Instrument Transformer Wiring: Troubleshooting Tables 63230-500-225A2 3/2011 Appendix A—Instrument Transformer Wiring: Troubleshooting Tables Abnormal readings in an installed meter can sometimes signify improper wiring. This appendix is provided as an aid in troubleshooting potential wiring problems. Using This Appendix The following pages contain “Case” tables arranged in sections. These tables show a variety of symptoms and probable causes. Section I: Check these tables first. These are common problems for 3-wire and 4-wire systems that can occur regardless of system type. Section II: Check these tables if troubleshooting more complex 3-wire systems. Section III: Check these tables if troubleshooting more complex 4-wire systems. The symptoms listed are “ideal,” and some judgment should be exercised when troubleshooting. For example, if the kW reading is 25, but you know that it should be about 300 kW, go to a table where “kW = 0” is listed as one of the symptoms. Because it is nearly impossible to address all combinations of multiple wiring mistakes or other problems that can occur (e.g., blown PT fuses, missing PT neutral ground connection), this guide generally addresses only one wiring problem at a time. Before trying to troubleshoot wiring problems, it is imperative that all instantaneous readings be available for reference. Specifically, those readings should include the following: • • • • • • • What is Normal? line-to-line voltages line-to-neutral voltages phase currents power factor kW kVAR kVA Most power systems have a lagging (inductive) power factor. The only time a leading power factor is expected is if power factor correction capacitors are switched in or over-excited synchronous motors with enough capacitive kVARS are on-line to overcorrect the power factor to leading. Some uninterruptable power supplies (UPS) also produce a leading power factor. "Normal" lagging power system readings are as follows: • Positive kW = 3 V AB I 3Avg PF 3Avg 1000 • Negative kVAR = kVA – kW 1000 • kVA (always positive) = 3 V AB I 3Avg 1000 • PF 3Avg = lagging in the range 0.70 to 1.00 (for 4-wire systems, all phase PFs are about the same) • Phase currents approximately equal • Phase voltages approximately equal 2 2 A quick check for proper readings consists of kW comparisons (calculated using the previous equation and compared to the meter reading) and a reasonable lagging 3-phase average power factor reading. If these checks are okay, there is little reason to continue to check for wiring problems. © 2011 Schneider Electric All Rights Reserved 73 PowerLogicTM Series 800 Power Meter Appendix A—Instrument Transformer Wiring: Troubleshooting Tables 63230-500-225A2 3/2011 Section I: Common Problems for 3-Wire and 4-Wire Systems Section I—Case A Symptoms: 3-Wire and 4-Wire • Zero amps • Zero kW, kVAR, kVA Possible Causes • CT secondaries shorted. • Less than 2% load on power meter based on CT ratio. Example: with 100/5 CT's, at least 2A must flow through CT window for power meter to “wake up.” Section I—Case B Symptoms: 3-Wire and 4-Wire • Negative kW of expected magnitude • Positive kVAR • Normal lagging power factor Possible Causes • All three CT polarities backwards; could be CTs are physically mounted with primary polarity mark toward the load instead of toward source or secondary leads swapped. • All three PT polarities backwards; again, could be on primary or secondary. NOTE: Experience shows CTs are usually the problem. Section I—Case C Symptoms: 3-Wire and 4-Wire • 74 Frequency is an abnormal value; may or may not be a multiple of 50/60 Hz. Possible Causes • PTs primary and/or secondary neutral common not grounded (values as high as 275 Hz and as low as 10 Hz have been seen). • System grounding problem at the power distribution transformer (such as utility transformer), though this is not likely. © 2011 Schneider Electric All Rights Reserved PowerLogicTM Series 800 Power Meter Appendix A—Instrument Transformer Wiring: Troubleshooting Tables 63230-500-225A2 3/2011 Section II: 3-Wire System Troubleshooting Section II—Case A Symptoms: 3-Wire • Currents and voltages approximately balanced • kW = near 0 • kVAR = near 0 • PF can be any value, probably fluctuating Possible Causes • CT secondary leads are swapped (A-phase lead on C-phase terminal and vice versa). • PT secondary leads are swapped (A-phase lead on C-phase terminal and vice versa). Section II—Case B Symptoms: 3-Wire Possible Causes • Phase B current is 3 higher than A and C (except in System Type 31). • kVA = about half of the expected magnitude • kW and kVAR can be positive or negative, less • than about half of the expected magnitude. • PF can be any value, probably a low leading value. One CT polarity is backwards. Section II—Case C Symptoms: 3-Wire Possible Causes • V CA is 3 higher than V AB and V BC • kVA = about half of the expected magnitude • kW and kVAR can be positive or negative, less • than about half of the expected magnitude • PF can be any value, probably a low leading value One PT polarity is backwards. Section II—Case D Symptoms: 3-Wire • kW = 0 or low, with magnitude less than kVAR • kVAR = positive or negative with magnitude of close to what is expected for kW • kVA = expected magnitude • PF = near 0 up to about 0.7 lead Possible Causes • Either the two voltage leads are swapped OR the two current leads are swapped AND one instrument transformer has backwards polarity. (look for V CA = 3 high or phase B current = 3 high) • The power meter is metering a purely capacitive load (this is unusual); in this case kW and kVAR will be positive and PF will be near 0 lead. Section II—Case E Symptoms: 3-Wire • One phase current reads 0 • kVA = about 1/2 of the expected value • kW, kVAR, and power factor can be positive or negative of any value © 2011 Schneider Electric All Rights Reserved Possible Causes • The CT on the phase that reads 0 is short-circuited. • Less than 2% current (based on CT ratio) flowing through the CT on the phase that reads 0. 75 PowerLogicTM Series 800 Power Meter Appendix A—Instrument Transformer Wiring: Troubleshooting Tables 63230-500-225A2 3/2011 Section III: 4-Wire System Troubleshooting Section III—Case A Symptoms: 4-Wire Possible Causes • kW = 1/3 of the expected value • kVAR = 1/3 of the expected value • power factor = 1/3 of the expected value • All else is normal • One CT polarity is backwards. NOTE: The only way this problem will usually be detected is by the Quick Check procedure. It is very important to always calculate kW. In this case, it is the only symptom and will go unnoticed unless the calculation is done or someone notices backwards CT on a waveform capture. Section III—Case B Symptoms: 4-Wire Possible Causes • • kW = 1/3 of the expected value • kVAR = 1/3 of the expected value • 2 of the 3 line-to-line voltages are • power factor = 1/3 of the expected value • All else is normal One PT polarity is backwards. NOTE: The line-to-line voltage reading that does not reference the PT with backwards polarity will be the only correct reading. 3 low Example: V AB = 277, V BC = 480, V CA = 277 In this case, the A-phase PT polarity is backwards. reference V A . V BC is correct because it does not Section III—Case C Symptoms: 4-Wire Possible Causes • One line-to-neutral voltage is zero • 2 of the 3 line-to-line voltages are • kW = 2/3 of the expected value NOTE: The line-to-line voltage reading that does not reference the missing PT input will be the only correct reading. • kVAR = 2/3 of the expected value Example: • kVA = 2/3 of the expected value • Power factor may look abnormal • 3 low PT metering input missing (blown fuse, open phase disconnect, etc.) on the phase that reads zero. V AB = 277, V BC = 277, V CA = 480 In this case, the B-phase PT input is missing. reference V B . V CA is correct because it does not Section III—Case D Symptoms: 4-Wire 76 Possible Causes • 3-phase kW = 2/3 of the expected value • 3-phase kVAR = 2/3 of the expected value • The CT on the phase that reads 0 is short-circuited. • 3-phase kVA = 2/3 of the expected value • • One phase current reads 0 Less than 2% current (based on CT ratio) flowing through the CT on the phase that reads 0. • All else is normal © 2011 Schneider Electric All Rights Reserved PowerLogicTM Series 800 Power Meter Appendix A—Instrument Transformer Wiring: Troubleshooting Tables 63230-500-225A2 3/2011 Section III—Case E Symptoms: 4-Wire • kW = near 0 • kVA = near 0 • 3-phase average power factor flip-flopping lead and lag • Voltages, currents, and kVA are normal Possible Causes • Two CT secondary leads are swapped (A-phase on B-phase terminal, for example). • Two PT secondary leads are swapped (A-phase on B-phase terminal, for example). NOTE: In either case, the phase input that is not swapped will read normal lagging power factor. Section III—Case F Symptoms: 4-Wire • kW = negative and less than kVAR • KVAR = negative and close to value expected for kW • kVA = expected value • Power factor low and leading • Voltages and currents are normal Possible Causes • All three PT lead connections “rotated” counterclockwise: A-phase wire on C-phase terminal, B-phase wire on A-phase terminal, C-phase wire on Bphase terminal. • All three CT lead connections “rotated” clockwise: A-phase wire on B-phase terminal, B-phase wire on C-phase terminal, C-phase wire on A-phase terminal. Section III—Case G Symptoms: 4-Wire • kW = negative and less than kVAR • kVAR = positive and close to the value for kW Possible Causes • All three PT lead connections “rotated” clockwise: A-phase wire on B-phase terminal, B-phase wire on C-phase terminal, C-phase wire on A-phase terminal. • All three CT lead connections “rotated” counterclockwise: A-phase wire on C-phase terminal, B-phase wire on A-phase terminal, C-phase wire on Bphase terminal. NOTE: looks like kW and kVAR swapped places • kVA = expected value • Power factor low and lagging • Voltages and currents are normal © 2011 Schneider Electric All Rights Reserved 77 PowerLogicTM Series 800 Power Meter Appendix A—Instrument Transformer Wiring: Troubleshooting Tables 63230-500-225A2 3/2011 Field Example Readings from a 4-wire system • • • • • • • • • • • • • • kW = 25 kVAR = – 15 kVA = 27 I A = 904A I B = 910A I C = 931A I 3Avg = 908A V AB = 495V V BC = 491V V CA = 491V V AN = 287V V BN = 287V V CN = 284V PF 3Avg = 0.75 lag to 0.22 lead fluctuating Troubleshooting Diagnosis 78 • • Power factors cannot be correct . • Cannot calculate kW because 3-phase power factor cannot be right, so calculate kVA instead. • Calculated kVA = 3 V ab I 3Avg 1000 = 1.732 495 908 1000 = 778 kVA • • • Power meter reading is essentially zero compared to this value. • Since A-phase power factor is the only one that has a normal looking lagging value, suspect B and C-phase CT leads may be swapped. • After swapping B and C-phase CT leads, all readings went to the expected values; problem solved. None of the “Section II” symptoms exist, so proceed to the 4-wire troubleshooting (“Section IV”). 4-wire Case E looks similar. Since the PTs were connected to other power meters which were reading correctly, suspect two CT leads swapped. © 2011 Schneider Electric All Rights Reserved PowerLogicTM Series 800 Power Meter Appendix B—Register List 63230-500-225A2 3/2011 Appendix B—Register List Register List Access The register list corresponding to the latest firmware version can be found on line at the Schneider Electric website. 1. Using a web browser, go to: www.Schneider-Electric.com. 2. Locate the Search box in the upper right corner of the home page. 3. In the Search box enter “PM8”. 4. In the drop-down box click on the selection “PM800 series”. 5. Locate the downloads area on the right side of the page and click on “Software/Firmware”. 6. Click on the applicable register list then download the document file indicated. In addition you will find the latest firmware files and a firmware history file that describes the enhancements for each of the different firmware releases. About Registers For registers defined in bits, the rightmost bit is referred to as bit 00. Figure B–1 shows how bits are organized in a register. Figure B–1: Bits in a register High Byte 0 0 0 0 0 Low Byte 0 15 14 13 12 11 10 1 0 0 0 1 0 0 1 0 0 09 08 07 06 05 04 03 02 01 00 Bit No. The power meter registers can be used with MODBUS or JBUS protocols. Although the MODBUS protocol uses a zero-based register addressing convention and JBUS protocol uses a one-based register addressing convention, the power meter automatically compensates for the MODBUS offset of one. Regard all registers as holding registers where a 30,000 or 40,000 offset can be used. For example, Current Phase A will reside in register 31,100 or 41,100 instead of 1,100. Floating-point Registers Floating-point registers are also available. To enable floating-point registers, see “Enabling Floating-point Registers” on page 91. © 2011 Schneider Electric All Rights Reserved 79 PowerLogicTM Series 800 Power Meter Appendix B—Register List 63230-500-225A2 3/2011 How Date and Time are Stored in Registers The date and time are stored in a three-register compressed format. Each of the three registers, such as registers 1810 to 1812, contain a high and low byte value to represent the date and time in hexadecimal. Table B–1 lists the register and the portion of the date or time it represents. Table B–1: Date and Time Format Register Hi Byte Lo Byte Register 0 Month (1-12) Day (1-31) Register 1 Year (0-199) Hour (0-23) Register 2 Minute (0-59) Second (0-59) Table B–2 provides an example of the date and time. If the date was 01/25/00 at 11:06:59, the Hex value would be 0119, 640B, 063B. Breaking it down into bytes we have the following: Table B–2: Date and Time Byte Example Hexadecimal Value Hi Byte Lo Byte 0119 01 = month 19 = day 640B 64 = year 0B = hour 063B 06 = minute 3B = seconds NOTE: Date format is a 3 (6-byte) register compressed format. (Year 2001 is represented as 101 in the year byte.) How Signed Power Factor is Stored in the Register Each power factor value occupies one register. Power factor values are stored using signed magnitude notation (see Figure B–2). Bit number 15, the sign bit, indicates leading/lagging. A positive value (bit 15=0) always indicates leading. A negative value (bit 15=1) always indicates lagging. Bits 0–9 store a value in the range 0–1,000 decimal. For example the power meter would return a leading power factor of 0.5 as 500. Divide by 1,000 to get a power factor in the range 0 to 1.000. Figure B–2: Power Factor Register Format 15 14 13 12 11 10 0 Sign Bit 0=Leading 1=Lagging 0 0 0 9 8 7 6 5 4 3 2 1 0 0 Unused Bits Set to 0 Power Factor in the range 100-1000 (thousandths) When the power factor is lagging, the power meter returns a high negative value—for example, -31,794. This happens because bit 15=1 (for example, the binary equivalent of 31,794 is 1000001111001110). To get a value in the range 0 to 1,000, you need to mask bit 15. You do this by adding 32,768 to the value. An example will help clarify. Assume that you read a power factor value of -31,794. Convert this to a power factor in the range 0 to 1.000, as follows: -31,794 + 32,768 = 974 974/1,000 = .974 lagging power factor 80 © 2011 Schneider Electric All Rights Reserved PowerLogicTM Series 800 Power Meter Appendix B—Register List 63230-500-225A2 3/2011 Supported Modbus Commands Table B–3 provides the Modbus commands that the PM800 Series meters support. For an up-to-date register list, see ““Register List Access”” at the start of this chapter. Table B–3: Modbus Commands Command Description 0x03 Read holding registers 0x04 Read input registers 0x06 Preset single registers 0x10 Preset multiple registers Report ID Return String byte 1: 0x11 byte 2: number of bytes following without crc 0x11 byte 3: ID byte = 250 byte 4: status = 0xFF bytes 5+: ID string = PM8xx Power Meter last 2 bytes: CRC Read device identification, BASIC implementation (0x00, 0x01, 0x02 data), conformity level 1, Object Values 0x01: If register 4128 is 0, then “Schneider Electric. If register 4128 is 1, then “Square D” 0x2B 0x02: “PM8xx” 0x03: “Vxx.yyy” where xx.yyy is the OS version number. This is the reformatted version of register 7001. If the value for register 7001 is 11900, then the 0x03 data would be “V11.900” Resetting Registers Table B–4 provides the commands needed to reset many of the power meter features. You can perform these resets simply by writing the commands into register 4126. Table B–4: Register Listing—Reset Commands Reset Commands—Write commands to Register 4126. Command Parameters Notes 666 Restart demand metering 1115 Reset Meter 3211 Reset all alarms to default values 3320 De-energize digital output 3321 Energize digital output 3361 Reset digital output counter 3365 6209 Reset digital input counters Register Energy value to 7016 4000 7017 4001 7018 4002 7019 4003 7020 4004 7021 4005 Preset Energy Values 10001 Clear the Usage Timers. (Set to 0) 14255 Reset all Min/Max Values. (Sets values to defaults) 21212 Reset Peak Demand values. (Set to 0) 30078 Clear all Energy Accumulators. (Set to 0) © 2011 Schneider Electric All Rights Reserved 81 PowerLogicTM Series 800 Power Meter Appendix B—Register List 82 63230-500-225A2 3/2011 © 2011 Schneider Electric All Rights Reserved PowerLogicTM Series 800 Power Meter Appendix C—Using the Command Interface 63230-500-225A2 3/2011 Appendix C—Using the Command Interface Overview of the Command Interface The power meter provides a command interface, which can be used to issue commands that perform various operations such as controlling relays. Table C–1 lists the definitions for the registers.Table C–2 lists the available commands. The command interface is located in memory at registers 8000–8149. Table C–1: Location of the command interface Register Description 8000 This is the register where you write the commands. 8001–8015 These are the registers where you write the parameters for a command. Commands can have up to 15 parameters associated with them. 8017 Command pointer. This register holds the register number where the most recently entered command is stored. 8018 Results pointer. This register holds the register number where the results of the most recently entered command are stored. 8019 I/O data pointer. Use this register to point to data buffer registers where you can send additional data or return data. 8020–8149 These registers are for you (the user) to write information. Depending on which pointer places the information in the register, the register can contain status (from pointer 8017), results (from pointer 8018), or data (from pointer 8019). The registers will contain information such as whether the function is enabled or disabled, set to fill and hold, start and stop times, logging intervals, and so forth. By default, return data will start at 8020 unless you specify otherwise. When registers 8017 through 8019 are set to zero, no values are returned. When any or all of these registers contain a value, the value in the register “points” to a target register, which contains the status, error code, or I/O data (depending on the command) when the command is executed. Figure C–1 shows how these registers work. NOTE: You determine the register location where results will be written. Therefore, take care when assigning register values in the pointer registers; values may be corrupted when two commands use the same register. Figure C–1: Command interface pointer registers Register 8017 Register 8018 Register 8019 8020 Register 8020 1 (status of the last command) Register 8021 51 (error code caused by the last command) Register 8022 0 (data returned by the last command) 8021 8022 Refer to “Register List Access” on page 79 for instructions on accessing the complete register list. © 2011 Schneider Electric. All Rights Reserved. 83 PowerLogicTM Series 800 Power Meter Appendix C—Using the Command Interface 63230-500-225A2 3/2011 Issuing Commands To issue commands using the command interface, follow these general steps: 1. Write the related parameter(s) to the command parameter registers 8001–15. 2. Write the command code to command interface register 8000. If no parameters are associated with the command, then you need only to write the command code to register 8000. Table C–2 lists the command codes that can be written to the command interface into register 8000. Some commands have an associated register where you write parameters for that command. For example, when you write the parameter 9999 to register 8001 and issue command code 3351, all relays will be energized if they are set up for external control. Table C–2: Command Codes Command Code Command Parameter Register Parameters 1110 None None Causes soft reset of the unit (re-initializes the power meter). 1210 None None Clears the communications counters. Description Sets the system date and time. Values for the registers are: 1310 8001 Month 8002 Day 8003 Year 8004 Hour 8005 Minute 8006 Second 1410 None None Disables the revenue security switch 1411 None None Enables the revenue security switch Month (1–12) Day (1–31) Year (4-digit, for example 2000) Hour (Military time, for example 14 = 2:00pm) Minute (1–59) Second (1–59) Relay Outputs Relay Output Number ➀ Configures relay for external control. 3310 8001 3311 8001 3320 8001 3321 8001 Relay Output Number ➀ Energizes designated relay. 3330 8001 Relay Output Number ➀ 3340 8001 3341 8001 Relay Output Number ➀ Configures relay for internal control. Relay Output Number ➀ De-energizes designated relay. Releases specified relay from latched condition. Relay Output Number ➀ Releases specified relay from override control. Relay Output Number ➀ Places specified relay under override control. 3350 8001 9999 De-energizes all relays. 3351 8001 9999 Energizes all relays. 3361 8001 3362 8001 3363 8001 None Resets the operation counter for all relays. 3364 8001 None Resets the turn-on time for all relays. 3365 8001 Input Number ➀ 3366 8001 Input Number ➀ 3367 8001 None Relay Output Number ➀ Resets operation counter for specified relay. Relay Output Number ➀ Resets the turn-on time for specified relay. Resets the operation counter for specified input. Resets turn-on time for specified input. Resets the operation counter for all inputs. 3368 8001 None Resets turn-on time for all inputs. 3369 8001 None Resets all counters and timers for all I/Os. 3370 8001 3371 8001 3380 8001 9999 Disables all analog outputs. 3381 8002 9999 Enables all analog outputs. Analog Output Number ➀ Disables specified analog output. Analog Output Number ➀ Enables specified analog output. ➀ You must write to register 8001 the number that identifies which output you would like to use. To determine the identifying number, refer to“I/O Point Numbers” on page 86 for instructions. ➁ Data buffer location (register 8019) is the pointer to the first register where data will be stored. By default, return data begins at register 8020, although you can use any of the registers from 8020–8149. Take care when assigning pointers. Values may be corrupted if two commands are using the same register. Refer to “Register List Access” on page 79 for instructions on accessing the complete register list. 84 © 2011 Schneider Electric. All Rights Reserved. PowerLogicTM Series 800 Power Meter Appendix C—Using the Command Interface 63230-500-225A2 3/2011 Table C–2: Command Codes Command Code Command Parameter Register Parameters Description Resets 1522 None None 0 = Present and previous months Resets the alarm history log. 4110 8001 5110 None None Resets all demand registers. 5111 None None Resets current demand. 5113 None None Resets power demand. 5114 None None Resets input demand. 5115 None None Resets generic demand for first group of 10 quantities. 5210 None None Resets all min/max demand. 5211 None None Resets current min/max demand. 5213 None None Resets power min/max demand. 5214 None None Resets input min/max demand. 5215 None None Resets generic 1 min/max demand. 1 = Present month Resets min/max. 2 = Previous month Start new demand interval. Bit 0 = Power Demand 5910 8001 Bitmap 1 = Current Demand 2 = Input Metering Demand 3 = Generic Demand Profile Preset Accumulated Energies Requires the IO Data Pointer to point to registers where energy preset values are entered. All Accumulated energy values must be entered in the order in which they occur in registers 1700 to 1727. 6209 8019 I/O Data Pointer ➁ 6210 None None Clears all energies. 6211 None None Clears all accumulated energy values. 6212 None None Clears conditional energy values. 6213 None None Clears incremental energy values. 6214 None None Clears input metering accumulation. Resets the following parameters to IEEE or IEC defaults: 1 = IEEE 1. 2. 3. 4. 5. 6. Phase labels Menu labels Harmonic units PF sign THD denominator Date Format 6215 None 6320 None None Disables conditional energy accumulation. 6321 None None Enables conditional energy accumulation. 6910 None None Starts a new incremental energy interval. 7510 8001 1–3 7511 8001 File Number 2 = IEC Files Triggers data log entry. Bitmap where Bit 0 = Data Log 1, Bit 1 = Data Log 2, Bit 2 = Data Log 3, etc. Triggers single data log entry. ➀ You must write to register 8001 the number that identifies which output you would like to use. To determine the identifying number, refer to“I/O Point Numbers” on page 86 for instructions. ➁ Data buffer location (register 8019) is the pointer to the first register where data will be stored. By default, return data begins at register 8020, although you can use any of the registers from 8020–8149. Take care when assigning pointers. Values may be corrupted if two commands are using the same register. Refer to “Register List Access” on page 79 for instructions on accessing the complete register list. © 2011 Schneider Electric. All Rights Reserved. 85 PowerLogicTM Series 800 Power Meter Appendix C—Using the Command Interface 63230-500-225A2 3/2011 Table C–2: Command Codes Command Code Command Parameter Register Parameters Description Setup 9020 9021 None 8001 None Enter into setup mode. 1 = Save 2 = Do not save Exit setup mode and save all changes. ➀ You must write to register 8001 the number that identifies which output you would like to use. To determine the identifying number, refer to“I/O Point Numbers” on page 86 for instructions. ➁ Data buffer location (register 8019) is the pointer to the first register where data will be stored. By default, return data begins at register 8020, although you can use any of the registers from 8020–8149. Take care when assigning pointers. Values may be corrupted if two commands are using the same register. Refer to “Register List Access” on page 79 for instructions on accessing the complete register list. I/O Point Numbers All inputs and outputs of the power meter have a reference number and a label that correspond to the position of that particular input or output. • The reference number is used to manually control the input or output with the command interface. • The label is the default identifier that identifies that same input or output. The label appears on the display, in PowerLogic software, and on the option card. • See Table C–3 for a complete list of I/O Point Numbers Table C–3: I/O Point Numbers Module Standard I/O PM8M22 PM8M26 PM8M2222 I/O Point Number — KY S1 — — — 1 2 A-R1 A-R2 A-S1 A-S2 A-R1 A-R2 A-S1 A-S2 A-S3 A-S4 A-S5 A-S6 A-R1 A-R2 A-S1 A-S2 A-AI1 A-AI2 A-AO1 A-AO2 3 4 5 6 7 8 9 10 B-R1 B-R2 B-S1 B-S2 B-R1 B-R2 B-S1 B-S2 B-S3 B-S4 B-S5 B-S6 B-R1 B-R2 B-S1 B-S2 B-AI1 B-AI2 B-AO1 B-AO2 11 12 13 14 15 16 17 18 A B — — Operating Outputs from the Command Interface To operate an output from the command interface, first identify the relay using the I/O point number. Then, set the output to external control. For example, to energize output 1, write the commands as follows: 1. Write number 1 to register 8001. 2. Write command code 3310 to register 8000 to set the relay to external control. 3. Write command code 3321 to register 8000. If you look in the “Relay Outputs” section of Table C–2 on page 84, you’ll see that command code 3310 sets the relay to external control and command code 3321 is listed as the command used to energize a relay. Command codes 3310–3381 are for use with inputs and outputs. Refer to “Register List Access” on page 79 for instructions on accessing the complete register list. 86 © 2011 Schneider Electric. All Rights Reserved. PowerLogicTM Series 800 Power Meter Appendix C—Using the Command Interface 63230-500-225A2 3/2011 Using the Command Interface to Change Configuration Registers You can also use the command interface to change values in selected metering-related registers, such as setting the time of day of the clock or resetting generic demand. Two commands, 9020 and 9021, work together as part of the command interface procedure when you use it to change power meter configuration. You must first issue command 9020 to enter into setup mode, change the register, and then issue 9021 to save your changes and exit setup mode. Only one setup session is allowed at a time. While in this mode, if the power meter detects more than two minutes of inactivity, that is, if you do not write any register values or press any buttons on the display, the power meter will time out and restore the original configuration values. All changes will be lost. Also, if the power meter loses power or communications while in setup mode, your changes will be lost. The general procedure for changing configuration registers using the command interface is as follows: 1. Issue command 9020 in register 8000 to enter into setup mode. 2. Make changes to the appropriate register by writing the new value to that register. Perform register writes to all registers that you want to change. For instructions on reading and writing registers, see “Read and Write Registers” on page 26. 3. To save the changes, write the value 1 to register 8001. NOTE: Writing any other value except 1 to register 8001 lets you exit setup mode without saving your changes. 4. Issue command 9021 in register 8000 to initiate the save and reset the power meter. For example, the procedure to change the demand interval for current is as follows: 1. Issue command code 9020 in register 8000. 2. Write the new demand interval to register 1801. 3. Write 1 to register 8001. 4. Issue command code 9021 in register 8000. Refer to “Register List Access” on page 79 for instructions on accessing the complete register list. Conditional Energy Power meter registers 1728–1744 are conditional energy registers. Conditional energy can be controlled in one of two ways: • Over the communications link, by writing commands to the power meter’s command interface, or • By a digital input—for example, conditional energy accumulates when the assigned digital input is on, but does not accumulate when the digital input is off. The following procedures explain how to set up conditional energy for command interface control and for digital input control. The procedures refer to register numbers and command codes. For a listing of command codes, see Table C–2 on page 84. © 2011 Schneider Electric. All Rights Reserved. 87 PowerLogicTM Series 800 Power Meter Appendix C—Using the Command Interface 63230-500-225A2 3/2011 Command Interface Control • Set Control—To set control of conditional energy to the command interface: 1. 2. 3. 4. Write command code 9020 to register 8000. In register 3227, set bit 6 to 1 (preserve other bits that are ON). Write 1 to register 8001. Write command code 9021 to register 8000. • Start— To start conditional energy accumulation, write command code 6321 to register 8000. • Verify Setup—To verify proper setup, read register 1794. The register should read 1, indicating conditional energy accumulation is ON. • Stop—To stop conditional energy accumulation, write command code 6320 to register 8000. • Clear—To clear all conditional energy registers (1728-1747), write command code 6212 to register 8000. • Set Control—To configure conditional energy for digital input control: Digital Input Control 1. Write command code 9020 to register 8000. 2. In register 3227, set bit 6 to 0 (preserve other bits that are ON). 3. Configure the digital input that will drive conditional energy accumulation. For the appropriate digital input, write 3 to the Base +9 register. 4. Write 1 to register 8001. 5. Write command code 9021 to register 8000. • Clear—To clear all conditional energy registers (1728–1747), write command code 6212 to register 8000. • Verify Setup—To verify proper setup, read register 1794. The register should read 0 when the digital input is off, indicating that conditional energy accumulation is off. The register should read 1 when conditional energy accumulation is on. Incremental Energy The power meter’s incremental energy feature allows you to define a start time, end time, and time interval for incremental energy accumulation. At the end of each incremental energy period, the following information is available: • • • • • • • • • • • • Wh IN during the last completed interval (reg. 1748–1750) VARh IN during the last completed interval (reg. 1751–1753) Wh OUT during the last completed interval (reg. 1754–1756) VARh OUT during the last completed interval (reg. 1757–1759) VAh during the last completed interval (reg. 1760–1762) Date/time of the last completed interval (reg. 1763–1765) Peak kW demand during the last completed interval (reg. 1940) Date/Time of Peak kW during the last completed interval (reg. 1941–1943) Peak kVAR demand during the last completed interval (reg. 1945) Date/Time of Peak kVAR during the last completed interval (reg. 1946–1948) Peak kVA demand during the last completed interval (reg. 1950) Date/Time of Peak kVA during the last completed interval (reg. 1951–1953) The power meter can log the incremental energy data listed above. This logged data provides all the information needed to analyze energy and power usage against present or future utility rates. The information is especially useful for comparing different time-of-use rate structures. When using the incremental energy feature, remember that peak demands help minimize the size of the data log in cases of sliding or rolling demand. Shorter incremental energy periods make it easier to reconstruct a load profile analysis. 88 © 2011 Schneider Electric. All Rights Reserved. PowerLogicTM Series 800 Power Meter Appendix C—Using the Command Interface 63230-500-225A2 3/2011 Using Incremental Energy Incremental energy accumulation begins at the specified start time and ends at the specified end time. When the start time arrives, a new incremental energy period begins. The start and end time are specified in minutes from midnight. For example: Interval: 420 minutes (7 hours) Start time: 480 minutes (8:00 a.m.) End time = 1440 minutes (12:00 p.m.) The first incremental energy calculation will be from 8:00 a.m. to 3:00 p.m. (7 hours) as illustrated in Figure C–2. The next interval will be from 3:00 p.m. to 10:00 p.m., and the third interval will be from 10 p.m. to 12:00 p.m. because 12:00 p.m. is the specified end time. A new interval will begin on the next day at 8:00 a.m. Incremental energy accumulation will continue in this manner until the configuration is changed or a new interval is started by a remote master. Figure C–2: Incremental energy example PLSD110149 End Time 12 11 1s l terva t In 3r d 10 1 2 val ter In 9 Start Time 3 8 4 2n 7 d Int er val 5 6 1st Interval (7 hours) = 8:00 a.m. to 3:00 p.m 2nd Interval (7 hours) = 3:00 p.m. to 10:00 p.m 3rd Interval (2 hours) = 10:00 p.m. to 12:00 p.m • Set up—To set up incremental energy: 1. 2. 3. 4. 5. 6. Write command code 9020 to register 8000. In register 3230, write a start time (in minutes-from-midnight). For example, 8:00 am is 480 minutes. In register 3231, write an end time (in minutes-from-midnight). Write the desired interval length, from 0–1440 minutes, to register 3229. If incremental energy will be controlled from a remote master, such as a programmable controller, write 0 to the register. 7. Write 1 to register 8001. 8. Write command code 9021 to register 8000. • Start—To start a new incremental energy interval from a remote master, write command code 6910 to register 8000. © 2011 Schneider Electric. All Rights Reserved. 89 PowerLogicTM Series 800 Power Meter Appendix C—Using the Command Interface 63230-500-225A2 3/2011 Setting Up Individual Harmonic Calculations The PM810 with a PM810LOG can perform up to the 31st harmonic magnitude and angle calculations for each metered value and for each residual value. The Power Meter can perform harmonic magnitude and angle calculations for each metered value and for each residual value. The harmonic magnitude for current and voltage can be formatted as either a percentage of the fundamental (THD), as a percentage of the rms values (thd), or rms. The harmonic magnitude and angles are stored in a set of registers: 13,200–14,608. During the time that the power meter is refreshing harmonic data, the power meter posts a value of 0 in register 3246. When the set of harmonic registers is updated with new data, the power meter posts a value of 1 in register 3246. The power meter can be configured to hold the values in these registers for up to 60 metering update cycles once the data processing is complete. The power meter has three operating modes for harmonic data processing: disabled, magnitude only, and magnitude and angles. Because of the extra processing time necessary to perform these calculations, the factory default operating mode is magnitudes only. To configure the harmonic data processing, write to the registers described in Table C–4: Table C–4: Registers for Harmonic Calculations Reg No. Value Description Harmonic processing; 3240 0, 1, 2 0 = disabled 1 = magnitudes only enabled 2 = magnitudes and angles enabled Harmonic magnitude formatting for voltage; 3241 0, 1, 2 0 = % of fundamental (default) 1 = % of rms 2 = rms Harmonic magnitude formatting for current; 3242 0, 1, 2 0 = % of fundamental (default) 1 = % of rms 2 = rms 3243 10–60 seconds This register shows the harmonics refresh interval (default is 30 seconds). 3244 0–60 seconds This register shows the time remaining before the next harmonic data update. 3245 0,1 This register indicates whether harmonic data processing is complete: 0 = processing incomplete 1 = processing complete Refer to “Register List Access” on page 79 for instructions on accessing the complete register list. 90 © 2011 Schneider Electric. All Rights Reserved. PowerLogicTM Series 800 Power Meter Appendix C—Using the Command Interface 63230-500-225A2 3/2011 Changing Scale Factors The power meter stores instantaneous metering data in 16-bit single registers. A value held in each register must be an integer between –32,767 and +32,767. Because some values for metered current, voltage, and power readings fall outside this range, the power meter uses multipliers, or scale factors. This enables the power meter to extend the range of metered values that it can record. The power meter stores these multipliers as scale factors. A scale factor is the multiplier expressed as a power of 10. For example, a multiplier of 10 is represented as a scale factor of 1, since 101=10; a multiplier of 100 is represented as a scale factor of 2, since 102=100. You can change the default value of 1 to other values such as 10, 100, or 1,000. However, these scale factors are automatically selected when you set up the power meter, either from the display or by using PowerLogic software. If the power meter displays “overflow” for any reading, change the scale factor to bring the reading back into a range that fits in the register. For example, because the register cannot store a number as large as 138,000, a 138 kV system requires a multiplier of 10. 138,000 is converted to 13,800 x 10. The power meter stores this value as 13,800 with a scale factor of 1 (because 101=10). Scale factors are arranged in scale groups. You can use the command interface to change scale factors on a group of metered values. However, be aware of these important points if you choose to change scale factors: • We strongly recommend that you do not change the default scale factors, which are automatically selected by PowerLogic hardware and software. • When using custom software to read power meter data over the communications link, you must account for these scale factors. To correctly read any metered value with a scale factor other than 0, multiply the register value read by the appropriate power of 10. • As with any change to basic meter setup, when you change a scale factor, all min/max and peak demand values should be reset. Enabling Floating-point Registers For each register in integer format, the power meter includes a duplicate set of registers in floating-point format. The floating point registers are disabled by default, but they can be turned ON by doing the following: NOTE: See “Read and Write Registers” on page 26 for instructions on how to read and write registers. 1. Read register 11700 (Current Phase A in floating-point format). If floating-point registers are OFF, you will see -32,768. 2. Write command code 9020 to register 8000. 3. Write 1 to register 3248. 4. Write 1 to register 8001. 5. Write command code 9021 to register 8000. 6. Read register 11700. You will see a value of 1, which indicates floating-point registers are ON. NOTE: Values such as current phase A are not shown in floating-point format on the display even though floating-point registers are ON. To view floating-point values, read the floating-point registers using the display or PowerLogic software. Refer to “Register List Access” on page 79 for instructions on accessing the complete register list. © 2011 Schneider Electric. All Rights Reserved. 91 PowerLogicTM Series 800 Power Meter Appendix C—Using the Command Interface 92 63230-500-225A2 3/2011 © 2011 Schneider Electric. All Rights Reserved. PowerLogicTM Series 800 Power Meter Appendix D—Advanced Power Quality Evaluations 63230-500-225A2 3/2011 Appendix D—Advanced Power Quality Evaluations The information in this appendix applies to the following models: • • PM850—EN50160 (evaluation only) PM870—EN50160, ITI (CBEMA), and SEMI-F47 Power Quality Standards The Advanced Power Quality feature includes power quality (PQ) evaluations according to the European standard EN50160 and the SEMI-F47/ITI (CBEMA) specifications. The PM870 registers data under both standards. The PM850 can report data under the EN50160 standard only. For instructions on how to enable these evaluation features, see “PQ Advanced Evaluation Setup” on page 22. SEMI-F47/ITI (CBEMA) Specification The SEMI-F47-200 Specification for Semiconductor Processing Equipment Voltage Sag Immunity was approved by the Global Facilities Committee and is the direct responsibility of the North American Facilities Committee. This standard is very similar to the Information Technical Industry (ITI) Council standard. Semiconductor factories require high levels of power quality due to the sensitivity of equipment and process controls. Semiconductor processing equipment is especially vulnerable to voltage sags. The SEMI-F47 standard addresses specifications for semiconductor processing equipment voltage sag immunity. It does not include over-voltage conditions, voltage sag durations less than 0.05 seconds (50 milliseconds), or voltage sag duration greater than 1.0 seconds. If necessary, the ITI CBEMA-curve can be used to specify additional requirements. Refer to the Schneider Electric POWERLOGIC Web Pages Instruction Bulletin (document # 63230-304-207) for more information on using the web pages on the ECC to view SEMI-47 and ITI(CBEMA) data. Table D–1: Categorized disturbance levels (% of nominal) Sag levels Swell levels 80% — 90% 110% — 120% 70% — 80% 120% — 140% 40% — 70% 140% — 200% 0% — 40% 200% — 500% Table D–2: Duration categories Duration < 20 msec 20 msec — 500 msec 500 msec — 10 sec >10 sec © 2011 Schneider Electric. All Rights Reserved. 93 PowerLogicTM Series 800 Power Meter 63230-500-225A2 3/2011 Appendix D—Advanced Power Quality Evaluations Figure D–1: ITI (CBEMA) Curve ITI (CBEMA) Curve Percent of Nominal Voltage (RMS or Peak Equivalent) 500 400 Prohibited Region 300 Voltage Tolerance Envelope Applicable to 120, 120/208, and 120/240 Nominal Voltages 200 140 120 100 110 90 No Interruption In Function Region 80 70 40 No Damage Region 0 20 ms 0.5 s 10 s Duration in Seconds (s) Steady State Table D–3: Categorized disturbance levels (F-47) Sag levels 80% — 90% 70% — 80% 50% — 70% 0% — 50% Table D–4: Duration categories Duration < 50 msec 50 msec — 200 msec 200 msec — 500 msec 500 msec — 1000 msec >1000 msec Figure D–2: Voltage Sag ride-through capability Duration of Voltage Sag in Seconds Perecent of Equipment Nominal Voltage 0.05 100 0.10 0.20 0.50 1.00 90 80 70 60 50 40 30 20 10 0 94 © 2011 Schneider Electric. All Rights Reserved. PowerLogicTM Series 800 Power Meter Appendix D—Advanced Power Quality Evaluations 63230-500-225A2 3/2011 EN50160:2000 Specification EN50160:2000 “Voltage characteristics of electricity supplied by public distribution systems” is a European standard that defines the quality of the voltage a customer can expect from the electric utility. Although this is a European standard, it can be applied globally. The PM850 and the PM870 evaluates the following electrical characteristics in accordance with EN50160: Table D–5: EN50160 Evaluation for the PM850 and PM870 Feature PM850 PM870 Evaluation During Normal Operation (Meter-based Data) Frequency 3 Supply voltage variations 3 3 3 Supply voltage unbalance 3 3 Harmonic voltage 3 3 Total Harmonic Distortion 3 3 ➀ Evaluations During Abnormal Operations (Alarm-based Data) Magnitude of rapid voltage changes Supply voltage dips Short interruptions of the supply voltage Long interruptions of the supply voltage Temporary power frequency over-voltages 3 ➁ 3 ➁ 3 ➁ 3 ➁ 3 3 ➁ 3 3 ➁ 3 ➁ 3 ➁ ➀ The PM850 performs EN50160 evaluations based on standard alarms, while the PM870 performs EN50160 evaluations on disturbance alarms. ➁ These features must be configured using register writes. See Table D–11 on page 99 for a list of configuration and status registers. As illustrated in Table D–5, the EN50160 evaluations performed by the PM850 and the PM870 can be divided into two categories. The first category performs evaluations during normal operation utilizing meter data. The second category performs evaluations during abnormal operation utilizing either standard alarms (PM850) or disturbance alarms (PM870). The EN50160:2000 Specification sets limits for most of the evaluations. These limits are built into the PM850 and the PM870 firmware. You can configure registers for other evaluations and change them from the default values. How Evaluation Results Are Reported The PM850 and the PM870 reports evaluation data in register entries and alarm log entries. Table D–6 describes the register entries for the evaluation data. Table D–6: Register Entries Register Number Description 3910 Summary bitmap of active evaluations that reports which areas of evaluation are active in the PM850 and the PM870. 3911 Summary bitmap of evaluation status that reports the pass/fail status of each area of evaluation. Portal registers Detail bitmap of evaluation status that reports the pass/fail status of the evaluation of each individual data item. Detailed data summary information is also available for each of the evaluations for the present interval and for the previous interval. You can access this data over a communications link using Modbus block reads of “portal” registers. Refer to “Evaluation During Normal Operation” on page 96 for additional information. Log entries for the evaluation data include: • On-board alarm log entry for diagnostic alarms: When the status of an area of evaluation is outside the range of acceptable values, an entry is made in the on-board alarm log. This entry provides notification of the exception for a specific area of evaluation. This notification is reported only in PowerLogic software and does not appear on the local display. © 2011 Schneider Electric. All Rights Reserved. 95 PowerLogicTM Series 800 Power Meter 63230-500-225A2 3/2011 Appendix D—Advanced Power Quality Evaluations • On-board alarm log entry for alarms: PM850 and the PM870 alarms are used to perform some of the evaluations. If an on-board alarm log is enabled, an entry will be made in the on-board alarm log when any of these alarms pick up or drop out. NOTE: Enabling PQ Advanced evaluation does not guarantee that the on-board alarm log or waveform files are enabled or properly configured to record these events. You should consider your requirements and configure these files and the event captures triggered by the various alarms to provide any additional data that would be helpful to diagnose or document an exception to this standard. Possible Configurations Through Register Writes This section describes the changes you can make to configurations for the EN50160 evaluation through register writes in the PM850 and the PM870. Refer to “Advanced Power Quality Evaluation System Configuration and Status Registers [EN50160 and SEMI-F47/ITI (CBEMA)]” on page 99 for register assignments. • Select the first day of the week for evaluations. You can define the first day of the week to be used for the EN50160 evaluations in register 3905. • Define the voltage interruption. The standard defines an interruption as voltage less than 1% of nominal voltage. Because some locations require a different definition, you can configure this value in register 3906. • Define allowable range of slow voltage variations. The standard defines the allowable range of slow voltage variations to be ±10% of nominal voltage. Because some locations require a different definition, you can configure this value in register 3907. Evaluation During Normal Operation1 When the EN50160 evaluation is enabled, the PM850 and the PM870 evaluates metered data under normal operating conditions, “excluding situations arising from faults or voltage interruptions.” For this evaluation, normal operating conditions are defined as all phase voltages greater than the definition of interruption. The standard specifies acceptable ranges of operation for these data items. This section describes how the EN50160 standard addresses metered data. Power Frequency EN50160 states that the nominal frequency of the supply voltage shall be 50 Hz. Under normal operating conditions, the power meter will perform the valuation based on the nominal frequency set on the meter. • for systems with synchronous connection to an interconnected system: — 50 Hz 1% during 99.5% of a year — 50 Hz + 4 to -6% for 100% of the time • for systems with no synchronous connection to an interconnected system (for example, power systems on some islands): — 50 Hz 2% during 95% of a week — 50 Hz 15% for 100% of the time NOTE: The same range of percentages are used for 60 Hz systems. Supply Voltage Variations EN50160 states that, under normal operating conditions, excluding situations arising from faults or voltage interruptions: 1 96 • during each period of one week 95% of the ten minute mean rms values of the supply voltage shall be within the range of Un 10%. • all ten minute mean rms values of the supply voltage shall be within the range of Un +10% to -15%. EN 50160:2000, Voltage characteristics of electricity supplied by public distribution systems. © 2011 Schneider Electric. All Rights Reserved. PowerLogicTM Series 800 Power Meter Appendix D—Advanced Power Quality Evaluations 63230-500-225A2 3/2011 Supply Voltage Unbalance EN50160 states that, under normal operating conditions, during each period of one week, 95% of the ten minute mean rms values of the negative phase sequence component of the supply voltage shall be within the range 0–2% of the positive phase sequence component. Harmonic Voltage EN50160 states that, under normal operating conditions, during each period of one week, 95% of the ten minute mean rms values of each individual harmonic voltage shall be less than or equal to the value given in Table D–7. Additionally, the THD of the supply voltage shall be less than 8%. Table D–7: Values of individual harmonic voltages at the supply terminals for orders up to 25 in % of nominal voltage Odd Harmonics Not Multiples of 3 Multiples of 3 Order h Relative Voltage Order h 5 6% 3 5% 2 2% 7 5% 9 1.5% 4 1% 11 3.5% 15 0.5% 6...24 0.5% 13 3% 21 0.5% 17 2% 19 1.5% 23 1.5% Relative Voltage Even Harmonics Order h Relative Voltage 25 NOTE: No values are given for harmonics of order higher than 25, as they are usually small, but largely unpredictable because of resonance effects. Evaluations During Abnormal Operation Count of Magnitude of Rapid Voltage Changes The standard does not specify the rate of change of the voltage for this evaluation. For this evaluation, the PM850 and the PM870 counts a change of 5% nominal and 10% nominal from one one-second meter cycle to the next one-second meter cycle. It counts rapid voltage decreases and increases separately. The interval for accumulation of these events is one week. You can configure the number of allowable events per week in register 3917. (Default = -32768 = Pass/Fail evaluation disabled.) Detection and Classification of Supply Voltage Dips According to EN50160, voltage dips are generally caused by faults in installations or the electrical utility distribution system. The faults are unpredictable and frequency varies depending on the type of power system and where events are monitored. Under normal operating conditions, the number of voltage dips expected may be anywhere from less than a hundred to nearly a thousand. The majority of voltage dips last less than one second with a depth less than 60%. However, voltage dips of greater depth and duration can occasionally occur. In some regions, voltage dips with depths between 10% and 15% of the nominal voltage are common because of the switching of loads at a customer’s installation. Supply voltage dips are under-voltage events that last from 10 ms to 1 minute. Magnitudes are the minimum rms values during the event. Disturbance alarms are used to detect these events in the PM870. Standard speed under-voltage alarms are used to detect these events in the PM850. The standard does not specifically address how to classify supply voltage dips or how many are allowable. Table D–8 shows how the PM850 and the PM870 detect and classify the dips for each phase voltage. © 2011 Schneider Electric. All Rights Reserved. 97 PowerLogicTM Series 800 Power Meter 63230-500-225A2 3/2011 Appendix D—Advanced Power Quality Evaluations Table D–8: Voltage dip classifications Duration (t) seconds Depth (D) % Nominal 1 t<3 3 t < 10 10 t < 20 20 t < 60 60 t < 180 Total 10 D < 15 15 D < 30 30 D < 45 45 D < 60 60 D < 75 75 D < 90 90 D < 99 Total You can configure the number of allowable events per week for each range of Depth in registers 3920 – 3927. (Default = -32768 = Pass/Fail evaluation disabled.) Detection of Interruptions of the Supply Voltage The standard defines an interruption as voltage less than 1% of nominal voltage. Because some locations require a different definition, you can configure this value in register 3906. Interruptions are classified as “short” if duration 3 minutes or “long” otherwise. The PM850 and the PM870 classifies interruptions as shown in Table D–9. Table D–9: Voltage interruptions Duration (t) seconds t<1 1 t < 2 2 t < 5 5 t< 10 10 t < 20 t < 20 60 60 t < 180 t < 180 600 600 t < 1200 1200 t Total You can configure the number of allowable short interruptions per year in register 3918 (Default = -32768 = Pass/Fail evaluation disabled). You can configure the number of allowable long interruptions per year in register 3919. (Default = -32768 = Pass/Fail evaluation disabled.) Detecting and Classifying Temporary Power Frequency Over-voltages As stated in EN50160, a temporary power frequency over-voltage generally appears during a fault in the electrical utility power distribution system or in a customer’s installation, and disappears when the fault is cleared. Usually, the over-voltage may reach the value of phase-to-phase voltage because of a shift of the neutral point of the three-phase voltage system. Under certain circumstances, a fault occurring upstream from a transformer will produce temporary over-voltages on the low voltage side for the time during which the fault current flows. Such over-voltages will generally not exceed 1.5 kV rms. Table D–10 shows how the PM850 and the PM870 detect and classify the over-voltages for each phase voltage. NOTE: Disturbance alarms are used to detect these events in the PM870. In the PM850, standard speed over-voltage alarms are used to detect these events. Table D–10: Over-voltages Duration (t) seconds Magnitude (M) % Nominal 1 t < 3 3 t < 10 10 t < 20 20 t < 60 60 t < 180 Total 110 < M 115 115 < M 130 130 < M 145 145 < M 160 160 < M 175 175 < M 200 M > 200 Total You can configure the number of allowable events per week for each range of magnitude in registers 3930 – 3937. (Default = -32768 = Pass/Fail evaluation disabled.) 98 © 2011 Schneider Electric. All Rights Reserved. PowerLogicTM Series 800 Power Meter Appendix D—Advanced Power Quality Evaluations 63230-500-225A2 3/2011 Operation with PQ Advanced Enabled This section describes how PM850 and PM870 EN50160 evaluation operation is affected when PQ Advanced evaluation is enabled. Resetting Statistics You can reset statistics for the EN50160 evaluations with the command 11100. A parameter value of 9999 will reset all items. A timestamp is provided in registers for each item indicating when the last reset was performed. This command is disabled when revenue security is active. NOTE: You should reset statistics when you enable EN50160 for the first time and also whenever you make any changes to the basic meter setup such as changing the nominal voltage. See “Setting Up PQ Advanced Evaluation from the Display” on page 104. Harmonic Calculations When PQ Advanced evaluation is enabled, the harmonic calculations will be set to update every 10 seconds. You can select the format of the harmonic calculations to be %Nominal, %Fundamental, or %RMS. Time Intervals Time intervals are synchronized with the Trending and Forecasting feature. For additional information, refer to the Schneider Electric POWERLOGIC Web Pages Instruction Bulletin (document # 63230-304-207). Weekly values will be posted at midnight of the morning of the “First Day of Week” configured in register 3905. Yearly values will be based on the calendar year. All of the EN50160 data is stored in non-volatile memory once per hour or when an event occurs. In the event of a meter reset, up to one hour of routine meter evaluation data will be lost. Advanced Power Quality Evaluation System Configuration and Status Registers [EN50160 and SEMI-F47/ITI (CBEMA)] Table D–11 lists registers for system configuration and status evaluation. Table D–11: PQ Advanced Evaluation System Configuration and Status Registers Register Number Description Enable/Disable PQ Advanced Evaluation 3900 1 0 = Disable (default) 1 = Enable 3901 1 3902 1 Nominal Voltage, (copied from register 3234 for reference) Default = 230 Voltage Selection for 4-Wire Systems 0 = Line-to-Neutral (default) 1 = Line-to-Line 3903 1 3904 1 Nominal Frequency, Hz (copied from register 3208 for reference) Default = 60 Frequency configuration 0 = system with synchronous connection to interconnected system (default) 1 = system without synchronous connection to interconnected system First Day of Week (EN50160 only) 1 = Sunday 2 = Monday (default) 3905 1 3 = Tuesday 4 = Wednesday 5 = Thursday 6 = Friday 7 = Saturday © 2011 Schneider Electric. All Rights Reserved. 99 PowerLogicTM Series 800 Power Meter 63230-500-225A2 3/2011 Appendix D—Advanced Power Quality Evaluations Table D–11: PQ Advanced Evaluation System Configuration and Status Registers Register Number Description 3906 1 3907 1 3908 1 Reserved 3909 1 Reserved Definition of Interruption (EN50160 only) 0 – 10% Nominal (default = 1) Allowable Range of Slow Voltage Variations (EN50160 only) 1 – 20% Nominal (default = 10) Bitmap of active evaluations Bit 00 – Summary bit – at least one EN50160 evaluation is active Bit 01 – Frequency Bit 02 – Supply voltage variations Bit 03 – Magnitude of rapid voltage changes Bit 04 – Not used Bit 05 – Supply voltage dips Bit 06 – Short interruptions of the supply voltage 3910 1 Bit 07 – Long interruptions of the supply voltage Bit 08 – Temporary power frequency over-voltages Bit 09 – Not used Bit 10 – Supply voltage unbalance Bit 11 – Harmonic voltage Bit 12 – THD Bit 13 – Not used Bit 14 – Not used Bit 15 – Not used Bitmap of evaluation status summary Bit 00 – Summary bit – at least one EN50160 evaluation has failed. Bit 01 – Frequency Bit 02 – Supply voltage variations Bit 03 – Magnitude of rapid voltage changes Bit 04 – Not used Bit 05 – Supply voltage dips Bit 06 – Short interruptions of the supply voltage 3911 1 Bit 07 – Long interruptions of the supply voltage Bit 08 – Temporary power frequency over-voltages Bit 09 – Not used Bit 10 – Supply voltage unbalance Bit 11 – Harmonic voltage Bit 12 – THD Bit 13 – Not used Bit 14 – Not used Bit 15 – Not used 100 3912 2 Count of 10-second intervals present year 3914 2 Count of 10-second intervals this week 3916 1 Count of 10-minute intervals this week 3917 1 3918 1 3919 1 3920 8 3930 8 Number of allowable rapid voltage changes per week Default = -32768 = Pass/Fail evaluation disabled Number of allowable short interruptions per year Default = -32768 = Pass/Fail evaluation disabled Number of allowable long interruptions per year Default = -32768 = Pass/Fail evaluation disabled Number of allowable voltage dips per week for each range of Depth Default = -32768 = Pass/Fail evaluation disabled Number of allowable over-voltages per week for each range of Magnitude Default = -32768 = Pass/Fail evaluation disabled © 2011 Schneider Electric. All Rights Reserved. PowerLogicTM Series 800 Power Meter Appendix D—Advanced Power Quality Evaluations 63230-500-225A2 3/2011 EN50160 Evaluation Data Available Over a Communications Link Portal Registers Evaluation data is available over communications via “portal” register reads. Each data item is assigned a portal register number. A block read of the specified size at that address will return the data for that item. In general, if the block size is smaller than specified, the data returned will be 0x8000 (-32768) to indicate the data is invalid. If the block size is larger than specified, the data for the item will be returned and the remaining registers will be padded with 0x8000. Refer to Table D–12 for portal register descriptions. Table D–12: Portal Register Descriptions Portal Description Size Data Register number of Metered Quantity (can be used to confirm data item being reported) Register value (present metered value) Average value (at end of last completed averaging time period) Minimum value during the last completed averaging time period Maximum value during the last completed averaging time period Minimum value during this interval Maximum value during this interval Minimum value during the last interval 53432 – 53434 Summary of Meter Data 33 Evaluations by Item Maximum value during the last interval Percent in Evaluation Range 1 this interval Percent in Evaluation Range 2 this interval (when applicable) Percent in Evaluation Range 1 last interval Percent in Evaluation Range 2 last interval (when applicable) Count of average values in Evaluation Range 1 (MOD10L2) Count of average values in Evaluation Range 2 (MOD10L2) Count of total valid averages for Evaluation of Range 1 (MOD10L2) Count of total valid averages for Evaluation of Range 2 (MOD10L2) Date/Time Last Excursion Range 1 (4-register format) Date/Time Last Excursion Range 2 (4-register format) Date/Time Last Reset (4-register format) Count of rapid voltage increases this week 53435 – 53437 Summary of Rapid Voltage 12 Changes by Phase Count of rapid voltage decreases this week Count of rapid voltage increases last week Count of rapid voltage decreases last week Date/Time last rapid voltage change (4-register format) Date/Time last reset (4-register format) 53438 – 53440 53441 – 53443 Summary of Voltage Dips 104 by Phase This Week Summary of Voltage Dips 104 by Phase Last Week Count of dips by magnitude & duration this week (96 values) [See “Detection and Classification of Supply Voltage Dips” on page 97.] Date/Time last voltage dip (4-register format) Date/Time last reset (4-register format) Count of dips by magnitude & duration last week (96 values) [See “Detection and Classification of Supply Voltage Dips” on page 97. Date/Time last voltage dip (4-register format) Date/Time last reset (4-register format) Flag indicating interruption is active Elapsed seconds for interruption in progress Count of short interruptions this year 53444 – 53447 Summary of Supply Voltage Interruptions 3-Phase and by Phase Count of long interruption this year Count of short interruptions last year 34 Count of long interruptions last year Count of interruptions by duration this year (10 values) [See “Detection of Interruptions of the Supply Voltage” on page 98.] Count of interruptions by duration last year (10 values) [See “Detection of Interruptions of the Supply Voltage” on page 98.] Date/Time of last interruption (4-register format) Date/Time of last reset (4-register format) © 2011 Schneider Electric. All Rights Reserved. 101 PowerLogicTM Series 800 Power Meter 63230-500-225A2 3/2011 Appendix D—Advanced Power Quality Evaluations Table D–12: Portal Register Descriptions Portal Data 53448 – 53449 Temporary Power Frequency 104 Over-voltages by Phase This Week Count of over-voltages by magnitude & duration this week (96 values) [See “Detecting and Classifying Temporary Power Frequency Overvoltages” on page 98.] 53450 – 53452 Temporary Power Frequency 104 Over-voltages by Phase Last Week Count of over-voltages by magnitude & duration last week (96 values) [See “Detecting and Classifying Temporary Power Frequency Overvoltages” on page 98.] 53312 102 Description Size Evaluation Summary Bitmap 18 Date/Time last over-voltage (4-register format) Date/Time last reset (4-register format) Date/Time last over-voltage (4-register format) Date/Time last reset (4-register format) Register 2 – Bitmap of evaluation Register 1 – Bitmap of active status summary (same as register evaluations (same as register 3910) 3911) Bit set when evaluation is active Bit set when evaluation fails Bit 00 – Summary bit – at least one Bit 00 – Summary bit – at least one EN50160 evaluation is active EN50160 evaluation has failed Bit 01 – Frequency Bit 01 – Frequency Bit 02 – Supply voltage variations Bit 02 – Supply voltage variations Bit 03 – Magnitude of rapid voltage Bit 03 – Magnitude of rapid voltage changes changes Bit 04 – Not used Bit 04 – Not used Bit 05 – Supply voltage dips Bit 05 – Supply voltage dips Bit 06 – Short interruptions of the Bit 06 – Short interruptions of the supply voltage supply voltage Bit 07 – Long interruptions of the Bit 07 – Long interruptions of the supply voltage supply voltage Bit 08 – Temporary power frequency Bit 08 – Temporary power frequency over-voltages over-voltages Bit 09 – Not used Bit 09 – Not used Bit 10 – Supply voltage unbalance Bit 10 – Supply voltage unbalance Bit 11 – Harmonic voltage Bit 11 – Harmonic voltage Bit 12 – THD Bit 12 – THD Bit 13 – Not used Bit 13 – Not used Bit 14 – Not used Bit 14 – Not used Bit 15 – Not used Bit 15 – Not used Register 3 (Range 1)/Register 11 (Range 2) – Bitmap of evaluation status of individual evaluations Register 4 (Range 1)/Register 12 (Range 2) – Bitmap of evaluation status of individual evaluations Bit 00 – Frequency Bit 00 – Va H7 Bit 01 – Va Bit 01 – Va H8 Bit 02 – Vb Bit 02 – Va H9 Bit 03 – Vc Bit 03 – Va H10 Bit 04 – Not used Bit 04 – Va H11 Bit 05 – Not used Bit 05 – Va H12 Bit 06 – Not used Bit 06 – Va H13 Bit 07 – Voltage Unbalance Bit 07 – Va H14 Bit 08 – THD Va Bit 08 – Va H15 Bit 09 – THD Vb Bit 09 – Va H16 Bit 10 – THD Vc Bit 10 – Va H17 Bit 11 – Va H2 Bit 11 – Va H18 Bit 12 – Va H3 Bit 12 – Va H19 Bit 13 – Va H4 Bit 13 – Va H20 Bit 14 – Va H5 Bit 14 – Va H21 Bit 15 – Va H6 Bit 15 – Va H22 © 2011 Schneider Electric. All Rights Reserved. PowerLogicTM Series 800 Power Meter Appendix D—Advanced Power Quality Evaluations 63230-500-225A2 3/2011 Table D–12: Portal Register Descriptions Portal © 2011 Schneider Electric. All Rights Reserved. Description Size Data Register 5 (Range 1)/Register 13 (Range 2) – Bitmap of evaluation status of individual evaluations Register 6 (Range 1)/Register 14 (Range 2) – Bitmap of evaluation status of individual evaluations Bit 00 – Va H23 Bit 00 – Vb H15 Bit 01 – Va H24 Bit 01 – Vb H16 Bit 02 – Va H25 Bit 02 – Vb H17 Bit 03 – Vb H2 Bit 03 – Vb H18 Bit 04 – Vb H3 Bit 04 – Vb H19 Bit 05 – Vb H4 Bit 05 – Vb H20 Bit 06 – Vb H5 Bit 06 – Vb H21 Bit 07 – Vb H6 Bit 07 – Vb H22 Bit 08 – Vb H7 Bit 08 – Vb H23 Bit 09 – Vb H8 Bit 09 – Vb H24 Bit 10 – Vb H9 Bit 10 – Vb H25 Bit 11 – Vb H10 Bit 11 – Vc H2 Bit 12 – Vb H11 Bit 12 – Vc H3 Bit 13 – Vb H12 Bit 13 – Vc H4 Bit 14 – Vb H13 Bit 14 – Vc H5 Bit 15 – Vb H14 Bit 15 – Vc H6 Register 7 (Range 1)/Register 15 (Range 2) – Bitmap of evaluation status of individual evaluations Register 8 (Range 1)/Register 16 (Range 2) – Bitmap of evaluation status of individual evaluations Bit 00 – Vc H7 Bit 00 – Vc H23 Bit 01 – Vc H8 Bit 01 – Vc H24 Bit 02 – Vc H9 Bit 02 – Vc H25 Bit 03 – Vc H10 Bit 03 – V 3PH Bit 04 – Vc H11 Bit 04 – KW 3PH Bit 05 – Vc H12 Bit 05 – KVAR 3PH Bit 06 – Vc H13 Bit 06 – Ia Bit 07 – Vc H14 Bit 07 – Ib Bit 08 – Vc H15 Bit 08 – Ic Bit 09 – Vc H16 Bit 09 – Ia H3 Bit 10 – Vc H17 Bit 10 – Ib H3 Bit 11 – Vc H18 Bit 11 – Ic H3 Bit 12 – Vc H19 Bit 12 – Ia H5 Bit 13 – Vc H20 Bit 13 – Ib H5 Bit 14 – Vc H21 Bit 14 – Ic H5 Bit 15 – Vc H22 Bit 15 – Ia H7 Register 9 (Range 1)/Register 17 (Range 2) – Bitmap of evaluation status of individual evaluations Register 10 (Range 1)/Register 18 (Range 2) – Bitmap of evaluation status of individual evaluations Bit 00 – Ib H7 Bit 00 – Reserved Bit 01 – Ic H7 Bit 01 – Reserved Bit 02 – Ia H9 Bit 02 – Reserved Bit 03 – Ib H9 Bit 03 – Reserved Bit 04 – Ic H9 Bit 04 – Reserved Bit 05 – Ia H11 Bit 05 – Reserved Bit 06 – Ib H11 Bit 06 – Reserved Bit 07 – Ic H11 Bit 07 – Reserved Bit 08 – Ia H13 Bit 08 – Not used Bit 09 – Ib H13 Bit 09 – Not used Bit 10 – Ic H13 Bit 10 – Not used Bit 11 – Reserved Bit 11 – Not used Bit 12 – Reserved Bit 12 – Not used Bit 13 – Reserved Bit 13 – Not used Bit 14 – Reserved Bit 14 – Not used Bit 15 – Reserved Bit 15 – Not used 103 PowerLogicTM Series 800 Power Meter 63230-500-225A2 3/2011 Appendix D—Advanced Power Quality Evaluations Alarms Allocated for PQ Advanced Evaluations To accomplish some of the evaluations required and to provide a record of events in the on-board alarm log, the PM850 uses standard alarms, and the PM870 uses disturbance alarms. When the evaluation is enabled, certain alarm positions will be claimed and automatically configured for use in the evaluation. You cannot use these alarms for other purposes while the evaluation is enabled. These alarms include: • • • Over Voltage (PM850): Standard speed alarm positions 35-37 Under Voltage (PM850): Standard speed alarm positions 38-40 Disturbance for Voltage Swells and Sags (PM870): Disturbance alarm positions 1-3 and 7-9 NOTE: The position depends on the system type (register 3902). “PQ Advanced” is included in the alarm label for alarms being used by this evaluation. Setting Up PQ Advanced Evaluation from the Display To set up the PQ Advanced evaluation in the power meter, you need to perform these steps using the meter set-up procedure: 1. Enable the PQ Advanced evaluation. By default, the PQ Advanced evaluation is disabled. To enable the evaluation, use the display (see “PQ Advanced Evaluation Setup” on page 22). 2. Select the nominal voltage of your system. NOTE: The EN50160 standard defines nominal voltage for low-voltage systems to be 230V line-to-line for 3-wire systems or 230V line-to-neutral for 4-wire systems. Therefore, the default value for Nominal Voltage is 230. If the application is a medium-voltage system, or if you want the evaluations to be based on some other nominal voltage, you can configure this value using the display only. PowerLogic software does not allow configuration of nominal voltage 3. Select the nominal frequency of your system. NOTE: The EN50160 standard defines nominal frequency as 50 Hz, but the PM850 and the PM870 can also evaluate 60 Hz systems. They cannot evaluate nominal frequency for 400 Hz systems. The default nominal frequency in the PM850 and the PM870 is 60 Hz. To change the default, from the display Main Menu, select Setup > Meter > Frequency. From PowerLogic software, see the online help file. 4. Reset the PQ Advanced Statistics. a. Write 9999 in register 8001. b. Write 11100 in register 8000. Refer to “Resetting Statistics” on page 99. 5. Reset the ITI (CBEMA) and SEMI F-47 Statistics. a. Write 9999 in register 8001. b. Write 11200 in register 8000. Refer to “Resetting Statistics” on page 99. 104 © 2011 Schneider Electric. All Rights Reserved. PowerLogicTM Series 800 Power Meter Glossary 63230-500-225A2 3/2011 Glossary Terms accumulated energy—energy can accumulate in either signed or unsigned (absolute) mode. In signed mode, the direction of power flow is considered, and the accumulated energy magnitude may increase and decrease. In absolute mode, energy accumulates as a positive, regardless of the power flow direction. active alarm—an alarm that has been set up to trigger, when certain conditions are met, the execution of a task or notification. An icon in the upper-right corner of the meter indicates that an alarm is active (!). See also enabled alarm and disabled alarm. baud rate—specifies how fast data is transmitted across a network port. block interval demand— power demand calculation method for a block of time. Includes three ways to apply calculating to that block of time; sliding block, fixed block, or rolling block methods. communications link—a chain of devices connected by a communications cable to a communications port. current transformer (CT)—current transformer for current inputs. demand—average value of a quantity, such as power, over a specified interval of time. device address—defines where the power meter resides in the power monitoring system. disabled alarm—an alarm which has been configured but which is currently “turned off”; i.e, the alarm will not execute its associated task even when its conditions are met. See also enabled alarm and active alarm. enabled alarm—an alarm that has been configured and “turned on” and will execute its associated task when its conditions are met. See also disabled alarm and active alarm. © 2011 Schneider Electric. All Rights Reserved. event—the occurrence of an alarm condition, such as Under-voltage Phase A, configured in the power meter. firmware—operating system within the power meter. fixed block—an interval selected from 1 to 60 minutes (in 1-minute increments). The power meter calculates and updates the demand at the end of each interval. float—a 32-bit floating point value returned by a register (see Register List on page 79). The upper 16-bits are in the lowest-numbered register pair. For example, in the register 4010/11, 4010 contains the upper 16-bits while 4011 contains the lower 16-bits. frequency—number of cycles in one second. line-to-line voltages—measurement of the rms line-to-line voltages of the circuit. line-to-neutral voltages —measurement of the rms line-toneutral voltages of the circuit. maximum demand current—highest demand current measured in amperes since the last reset of demand. maximum demand real power —highest demand real power measured since the last rest of demand. maximum demand voltage—highest demand voltage measured since the last reset of demand voltage. maximum demand (peak demand) —highest average load during a specific time interval. maximum value—highest value recorded of the instantaneous quantity such as Phase A Current, Phase A Voltage, etc., since the last reset of the minimums and maximums. minimum value—lowest value recorded of the instantaneous quantity such as Phase A Current, Phase A Voltage, etc., since the last reset of the minimums and maximums. 105 PowerLogicTM Series 800 Power Meter Glossary 63230-500-225A2 3/2011 nominal—typical or average. parity—refers to binary numbers sent over the communications link. An extra bit is added so that the number of ones in the binary number is either even or odd, depending on your configuration. Used to detect errors in the transmission of data. partial interval demand—calculation of energy thus far in a present interval. Equal to energy accumulated thus far in the interval divided by the length of the complete interval. phase currents (rms)—measurement in amperes of the rms current for each of the three phases of the circuit. See also maximum value. phase rotation—phase rotations refers to the order in which the instantaneous values of the voltages or currents of the system reach their maximum positive values. Two phase rotations are possible: A-B-C or A-C-B. potential transformer (PT)—also known as a voltage transformer power factor (PF)—true power factor is the ratio of real power to apparent power using the complete harmonic content of real and apparent power. Calculated by dividing watts by volt amperes. Power factor is the difference between the total power your utility delivers and the portion of total power that does useful work. Power factor is the degree to which voltage and current to a load are out of phase. real power—calculation of the real power (3-phase total and per-phase real power calculated) to obtain kilowatts. rms—root mean square. Power meters are true rms sensing devices. rolling block—a selected interval and sub-interval that the power meter uses for demand calculation. The subinterval must divide evenly into the interval. Demand is updated at each sub-interval, and the power meter displays the demand value for the last completed interval. sag/swell—fluctuation (decreasing or increasing) in voltage or current in the electrical system being monitored. See also, voltage sag and voltage swell. scale factor—multipliers that the power meter uses to make values fit into the register where information is stored. safety extra low voltage (SELV) circuit—a SELV circuit is expected to always be below a hazardous voltage level. short integer—a signed 16-bit integer (see Register List on page 79). sliding block—an interval selected from 1 to 60 minutes (in 1-minute increments). If the interval is between 1 and 15 minutes, the demand calculation updates every 15 seconds. If the interval is between 16 and 60 minutes, the demand calculation updates every 60 seconds. The power meter displays the demand value for the last completed interval. system type—a unique code assigned to each type of system wiring configuration of the power meter. thermal demand—demand calculation based on thermal response. Total Harmonic Distortion (THD or thd)—indicates the degree to which the volt-age or current signal is distorted in a circuit. total power factor—see power factor. true power factor—see power factor. unsigned integer—an unsigned 16-bit integer (see Register List Access on page 79). unsigned long integer—an unsigned 32-bit value returned by a register (Register List Access on page 79). The upper 16-bits are in the lowestnumbered register pair. For example, in the register pair 4010 and 4011, 4010 contains the upper 16-bits while 4011 contains the lower 16-bits. VAR—volt ampere reactive. voltage sag—a brief decrease in effective voltage for up to one minute in duration. voltage swell—increase in effective voltage for up to one minute in duration. 106 © 2011 Schneider Electric. All Rights Reserved. PowerLogicTM Series 800 Power Meter Glossary 63230-500-225A2 3/2011 Abbreviations and Symbols A—Ampere kVA—Kilovolt-Ampere A IN—Analog Input kVAD—Kilovolt-Ampere demand A OUT—Analog Output kVAR—Kilovolt-Ampere reactive ABSOL—Absolute Value kVARD—Kilovolt-Ampere reactive demand ACCUM—Accumulated ACTIV—Active ADDR—Power meter address ADVAN—Advanced screen AMPS—Amperes BARGR—Bargraph COINC—Demand values occurring at the same time as a peak demand value kVARH—Kilovolt-Ampere reactive hour kW—Kilowatt kWD—Kilowatt demand kWH—Kilowatthours kWH/P—Kilowatthours per pulse kWMAX—Kilowatt maximum demand LANG—Language COMMS—Communications LOWER—Lower Limit COND—Conditional Energy Control MAG—Magnitude CONTR—Contrast MAINT—Maintenance screen CPT—Control Power Transformer MAMP—Milliamperes CT—see current transformer on page 105 MB A7—MODBUS ASCII 7 Bits DEC—Decimal MBRTU—MODBUS RTU D IN—Digital Input MIN—Minimum DIAG—Diagnostic MINS—Minutes DISAB—Disabled DISPL—Displacement MINMX—Minimum and maximum values D OUT—Digital Output MSEC—Milliseconds DMD—Demand MVAh—Megavolt ampere hour DO—Drop Out Limit MVARh—Megavolt ampere reactive hour ENABL—Enabled ENDOF—End of demand interval ENERG—Energy MB A8—MODBUS ASCII 8 Bits MWh—Megawatt hour NORM—Normal mode F—Frequency O.S.—Operating System (firmware version) HARM—Harmonics P—Real power HEX—Hexadecimal PAR—Parity HIST—History PASSW—Password HZ—Hertz Pd—Real power demand I—Current PF—Power factor I/O—Input/Output Ph—Real energy IMAX—Current maximum demand PM—Power meter © 2011 Schneider Electric. All Rights Reserved. 107 PowerLogicTM Series 800 Power Meter Glossary 63230-500-225A2 3/2011 PQS—Real, reactive, apparent power PQSd—Real, reactive, apparent power demand PR—Alarm Priority PRIM—Primary PT—Number of voltage connections (see potential transformer on page 106) PU—Pick Up Limit PULSE—Pulse output mode PWR—Power Q—Reactive power Qd—Reactive power demand Qh—Reactive energy R.S.—Firmware reset system version RELAT—Relative value in % REG—Register Number S—Apparent power S.N.—Power meter serial number SCALE—see scale factor on page 106 Sd—Apparent power demand SECON—Secondary SEC—Seconds Sh—Apparent Energy SUB-I—Sub-interval THD—Total Harmonic Distortion U—Voltage line to line UNBAL—Unbalance UPPER—Upper limit V—Voltage VAh—Volt amp hour VARh—Volt amp reactive hour VMAX—Maximum voltage VMIN—Minimum voltage Wh—Watthour 108 © 2011 Schneider Electric. All Rights Reserved. PowerLogicTM Series 800 Power Meter Index 63230-500-225A2 3/2011 Index Numerics 3-wire systems 104 A accumulate energy signed or unsigned more 35 active evaluations 95 address device address 72 alarm onboard 96 alarm backlight setup 21 alarm levels with different pickups and dropouts 54 alarm log description 58 alarms abbreviated names defined 51, 55 alarm conditions 45, 50, 55 alarm groups 45 alarm numbers 51, 55 alarm types 50, 51, 52, 55, 56 Boolean 53 creating data log entries 61 custom alarms 45, 53 digital 45 disturbance 53 EN50160 Evaluation positions 104 introduction to 45 levels 54 multiple alarms 54 priorities 47 scaling alarm setpoints 49, 50 setpoints 46 setup 17 standard 45 test registers 51, 55 types 47 analog input set up 44 analog output 44 B bar graph setup 21 baud rate 72 billing log 61 configure log interval 62 data calculation 61 register list 62 block interval demand method 31 Boolean alarms 53 logic gates 56 box contents 6 C calculating duration of an event 46 watthours per pulse 43 changing scale factors 49 © 2011 Schneider Electric All Rights Reserved Channel Selection 64 clock view 26 clock synchronized demand 32 command interface changing configuration registers 86 issuing commands 84 operating outputs 86 overview 83 registers for 83 scale factors 90 command synchronized demand 32 communications problems with PC communication 72 setup 15 conditional energy controlling from the command interface 87 register for 87 controlling relays 40 correlation sequence number 46 CT setup 15 custom alarms 45, 53 D data log 60 clearing the logs 60 forcing data log entries 67 organizing log files 61 storage in power meter 69 date setup 13 view 26 default password 13 demand current 32 generic 33 predicted 33 thermal 32 demand current calculation 32 demand power calculation 30 demand power calculation methods 32 demand readings 30 demand current 32 demand power calculation methods 30 peak demand 33 predicted demand 33 reset 24 demand synch pulse method 40 diagnostic alarms EN50160 Evaluation 95 diagnostics password 18 digital alarms 45 digital inputs 39 digital input alarms 45 operating modes 39 receiving a synch pulse 32 Digital Inputs screen 39 109 PowerLogicTM Series 800 Power Meter Index 63230-500-225A2 3/2011 displacement power factor described 37 display menu overview 11 operating 11 disturbance alarms 53 disturbance monitoring and the utility company 67 overview 65 dropout and pickup setpoints 46 E EN50160 Evaluation 3-wire systems 104 accumulation interval 97 active evaluations 95 alarm positions 104 allowable events 98 block read 101 block size 101 configure day of the week 96 define voltage interruption 96 depth in registers 98 diagnostic alarms 95 enabling 22 evaluation status 95 harmonic calculations 99 mean rms values 97 meter cycle 97 metered data 96 minimum rms values 97 nominal frequency 96, 104 nominal voltage 98, 104 4-wire systems 104 pass/fail evaluation 97, 98 portal registers 101 power frequency 96 register writes 96 setting up 104 slow voltage range 96 statistics reset 99 supply voltage 97 dips 97 unbalance 97 variations 96 system configuration registers 99 time intervals 99 timestamp 99 trending and forecasting 99 upstream 98 voltage dips 97 energy conditional energy registers 87 password 18 energy readings 35, 36 reactive accumulated 36 reset 23 equipment sensitivity disturbance monitoring for 66 evaluation status 95 event log © 2011 Schneider Electric All Rights Reserved calculating duration of event 46 correlation sequence number 46 data storage 58 F features 7 firmware 7 fixed block 31 floating-point registers enabling 79, 80 G generic demand calculation 33 H harmonic calculations EN50160 Evaluation 99 setting up individual calculations 89 values 37 high priority alarms 47 Hi-Pot testing 69 I I/O position numbers 86 setup 18 incremental energy 88 interval 33 using with the command interface 88 incremental energy interval setup 20 initialize power meter 23 input digital input 39 input synchronized demand 32 input/output setup 18 inputs accepting pulse from another meter 32 digital input alarms 45 digital inputs operating modes 39 issuing commands 84 K KY 42 calculating watt hours per pulse 43 L labels for inputs and outputs 86 language setup 14 lock resets setup 21 logic gates for Boolean alarms 56 logs 57 alarm log 58 billing log 61 clearing data logs 60 data log 60 maintenance log 58 organizing data log files 61 low priority alarms 47 M maintenance logs 58 maintenance icon 72 110 PowerLogicTM Series 800 Power Meter Index 63230-500-225A2 3/2011 stored log values 59 medium priority alarms 47 megger testing 69 memory power meter memory 69 menu 11 meter information 26 metered values demand readings 30 energy readings 35 real-time readings 27 minimum/maximum password 18 minimum/maximum values reset 24 mode reset 24 monitoring disturbance 65 N no priority alarms 47 nominal frequency EN50160 Evaluation 104 nominal voltage 4-wire systems 104 EN50160 Evaluation 98, 104 non-volatile memory 99 nonvolatile memory 69 O onboard alarm 96 on-board logs 57 operating time reset 25 operating time threshold set up 19 operation 11 problems with the power meter 72 using the command interface 83 outputs analog 44 fixed pulse 43 overvoltage alarm type 48 P password default 13 diagnostics 18 energy 18 minimum/maximum 18 setup 18 peak demand calculation 33 phase loss alarm type for current 48 alarm type for voltage 48 phase reversal alarm type 48 phase rotation setup 19 pickups and dropouts scale factors 49 setpoints 46 PLC synchronizing demand with 32 power analysis values 37, 38 power demand configuration © 2011 Schneider Electric All Rights Reserved setup 22 power factor 37 min/max conventions 28 storage of 80 power meter accessories 5 described 1 firmware 7 hardware 2 initialization 23 instrumentation summary 1 models 5 reset 23 setup 13 with display parts 2, 4 power quality problems 65 predicted demand calculation 33 problems see troubleshooting 71 protocols register addressing convention 79 PT setup 16 Q quantities used in alarm levels 54 R read registers 26 readings demand 30 real-time readings 27 min/max values 28 recording data in logs 60 events in the event log 67 register list 79 register writes EN50160 Evaluation 96 registers addressing conventions 79 billing log 62 EN50160 Evaluation 95 configuration 99 portal 101 floating-point 79, 80 for conditional energy 87 power factor format 80 read 26 using the command interface 86 write 26 relay operating modes absolute kVARh pulse 41 absolute kWh pulse 41 end of demand interval 41 kVAh pulse 41 kVAR out pulse 42 kVARh in pulse 41 kWh in pulse 41 kWh out pulse 42 latched 41 normal 40 timed 41 111 PowerLogicTM Series 800 Power Meter Index 63230-500-225A2 3/2011 relays internal or external control of 40 operating using command interface 84 reset accumulated operating time 25 demand readings 24 energy readings 23 minimum/maximum values 24 mode 24 power meter 23 resets of peak demand values 33 values in generic demand profile 34 reverse power alarm type 48 rolling block 31 route statement 72 S sag/swell description 65 scale factors 49 changing scale factors 90 scale groups 49 scaling alarm setpoints 50 scale groups 49 set up analog outputs 44 custom alarms 45, 53 individual harmonic calculations 89 setup 13 alarm backlight 21 alarms 17 bar graph 21 communications 15 CT 15 date 13 I/O 18 incremental energy interval 20 input/output 18 language 14 lock resets 21 password 18 phase rotation 19 power demand configuration 22 PT 16 system type 16 THD calculation 20 time 14 VAR/PF convention 20 sliding block 31 SMS 104 standard alarms 45 steady-state harmonics 63 synchronized demand clock 32 command 32 input 32 synchronizing demand interval to internal clock 32 demand interval to multiple meters 32 to PLC command 32 system type setup 16 © 2011 Schneider Electric All Rights Reserved T testing dielectric (hi-pot) test 69 megger test 69 THD 63 setup 20 thd calculation method 37 thermal demand method 32 time setup 14 view 26 time intervals EN50160 Evaluation 99 total harmonic distortion 37, 63 transients 65 trending and forecasting EN50160 Evaluation 99 troubleshooting instrument transformer wiring 73 types of alarms 52, 56 U unbalance current alarm type 48 unbalance voltage alarm type 48 undervoltage alarm type 48 V VAR sign conventions 29 VAR/PF convention setup 20 view clock 26 view date and time 26 viewing meter information 26 voltage disturbance monitoring 65 voltage sag 65, 66 power meter capabilities during 67 using waveform captures to detect 66 voltage swell power meter capabilities during 67 W watthours calculating watthours per KYZ pulse 43 waveform capture 63 waveform captures power meter memory 64 storage of waveforms 64 using to detect voltage sag 66 wiring troubleshooting 72 write registers 26 112 PowerLogic™ Power Meter 800 User Guide Schneider Electric 295 Tech Park Drive, Suite 100 Lavergne, TN 37086 USA For technical support: [email protected] (00) + 1 250 544 3010 Contact your local Schneider Electric sales representative for assistance or go to www.schneider-electric.com PowerLogic is a trademark of Schneider Electric, Other trademarks are the property of their respective owners. Electrical equipment should be installed, operated, serviced, and maintained only by qualified personnel. No responsibility is assumed by Schneider Electric for any consequences arising out of the use of this material. 63230-500-225A2 3/2011 Replaces 63230-500-225A1, dated 6/2006 © 2006 - 2011 Schneider Electric All Rights Reserved