1
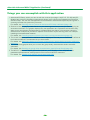
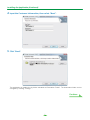
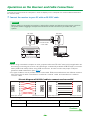
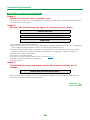
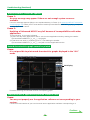
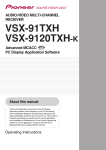
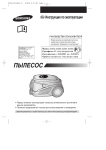
Operating Instructions – Advanced MCACC PC Display Application Software – audio/video multi-channel receiver About this manual These are the Operating Instructions for an application which displays on your computer screen the listening room reverberation frequency characteristics, the speakers’ group delay characteristics and the MCACC parameters measured by the Advanced MCACC function of your SC-27, SC-25 or SC-9540. It explains everything you need to know to use the application, from installation to troubleshooting. You will need to operate the receiver to use this application, so please refer also to the Operating Instructions supplied with the receiver. About the Advanced MCACC Application The functions of the Advanced MCACC application are used with the same purpose as the “Reverb View” and “Group Delay” functions of the receiver itself (see pages 116 and 120 (SC-27, SC-25)/102 and 105 (SC9540) of the receiver’s Operating Instructions), namely to display the reverberation characteristics of the listening environment and the group delay characteristics of the speakers. Using a computer provides cleaner, more easily readable graphs. The application can also be used to display the measurement values stored in the receiver’s MCACC memory. Requirements for using the application on your PC • The computer must be a PC functioning with one of the following operating systems: Microsoft® Windows® Vista Home Basic/Home Premium/Ultimate SP1, Windows® XP Professional/Home Edition SP3 or Windows® 2000 Professional SP4. • The monitor must have a display resolution of 800 x 600 dots (SVGA) or greater. • An RS-232C port connector is necessary for graphical output. Refer to the PC’s operating instructions and/or the PC manufacturer for more information on making the proper port settings. Microsoft®, Windows®Vista, Windows®XP and Windows®2000 are either registered trademarks or trademarks of Microsoft Corporation in the United States and/or other countries. Main features of the application 1. Displays 3D graphs of the reverberation frequency characteristics of your room. You can choose to see these measurements both with and without the equalization performed by this receiver (before and after calibration). 2. Allows you to display 3D graphics of the group delay characteristics of the different speakers. (The values before and after calibration can be displayed.) 3. Allows you to display a list of the Advanced MCACC parameters (the results of measurements). 4. Allows you to view graphs in a number of different formats. 5. Allows you to save the various measured data on the computer. 6. Allows you to make memos about the conditions in your room when you made the measurements, etc. 7. Allows you to print the various graphs and the MCACC measurement values. Continue 2 About the Advanced MCACC Application (Continued) Things you can accomplish with this application 1. Advanced EQ Setup, which you can do with the receiver (see page 116 (SC-27, SC-25)/102 (SC9540) of the receiver’s Operating Instructions), allows you to choose the optimum time period for auto EQ setup. You can use this application’s reverberation characteristics (Reverb) as a guide in choosing the best time period for your room. For details, see Deciding the time period for Advanced EQ Setup calibration (page 19). 2. Skewed reverb frequency characteristics in your listening room can prevent you from enjoying an accurate sound field. The graphs displayed by this application are a powerful tool because they allow you to check these reverb frequency characteristics at a glance. You can also check the effectiveness of steps that you take to improve the acoustics of your listening room, for example, installing sound absorbent material. For details, see Checking steps to improve your room’s reverb characteristics (page 21). 3. The reverb characteristics after calibration can be displayed. This lets you to check the EQ effects of the Advanced MCACC measurements you have made. For details, see About the display of the reverb characteristics graphs before and after calibration (page 23). 4. The Group Delay graphs allow you to check the group delay characteristics before and after calibration. For details, see Reading the group delay characteristics graph (Group Delay) (page 25). 5. The MCACC parameter display (Parameters) allows you to display on the computer all the parameters (measurement values) stored in the receiver’s MCACC memories. For details, see Display of the MCACC parameters (page 26). 3 Installing the Application Install this application on your PC by using the downloaded installer. You will find the installer in the folder that you specified when you downloaded the application. If a previous version of the Advanced MCACC application (“Ver. 1.1”, “Ver. 1.4”, “Ver. 2.0” or “Ver. 2.1”) is installed on your computer, please update the application. For details, see Updating the application (page 27). 1 Double click the “PioneerAdvancedMCACC_e_ver_*_*.exe” file . The number after “ver” in the filename is the version number of the installer. Depending on the current configuration of your PC, the InstallShield Wizard can take some time to appear. 2 Click “Next”. 3 (If you agree to the contents of the License Agreement), select “I accept the terms in the license agreement”, then select “Next”. The destination selection screen of the installer appears. Continue Troubleshooting If an error occurs when you double click and you are unable to proceed with the installation. 4 Installing the Application (Continued) 4 Input the Customer Information, then select “Next”. 5 Click “Next”. The application is installed in the folder indicated at “Destination Folder”. The destination folder can be changed by clicking “Change...”. Continue 5 Installing the Application (Continued) 6 Choose “Install”. A shortcut icon 7 is created on the desktop. Click “Finish”. The installation is complete. 6 Operations on the Receiver and Cable Connections Connect the receiver and the computer in order to display on the computer the various data measured on the receiver itself. 1 Connect the receiver to your PC with an RS-232C cable. Caution Before making or changing connections, switch off the power and disconnect the power cord from the power outlet. Plugging in components should be the last connection you make with your system. RS-232C RS-232C Female-female cross cable INPUT SELECTOR MASTER VOLUME PHASE CONTROL ADVANCED MCACC PQLS HDMI STANDBY/ON PC SC-27/SC-25/SC-9540 Note • When using a notebook computer or other computer without an RS-232C terminal, this application can be used by connecting the receiver via USB using a commercially available USB-RS-232C conversion cable (USB-Serial cable). When using USB connections, be sure to select the proper COM port number for data transmission (see page 9). • The type of cable to use is a female-female cross cable. Different manufacturers use different names to refer to this type of cable. Sometimes it is called an “interlink” cable, and sometimes it is called a “reverse” cable. Pin-out diagram of RS-232C cable to connect receiver and PC Dsub 9-pin female Dsub 9-pin female Dsub 9-pin female Dsub 9-pin female • The following cable has been proved to ensure system operation. Brand Cable Part NO. Belkin Pro Series Serial Direct Cable-10 feet F3B207-10 Continue 7 Operations on the Receiver and Cable Connections (Continued) 2 Perform the “Full Auto MCACC” operation on the receiver. (See page 46 (SC-27, SC-25)/42 (SC-9540) of the receiver’s Operating Instructions.) The measurements here are not required if the “Full Auto MCACC” operation has already been performed before connecting the RS-232C cable. Proceed to step 3. 3 Select “Output PC” from “MCACC Data Check”. (See page 118 (SC-27, SC-25)/104 (SC-9540) of the receiver’s Operating Instructions.) The message “Start the MCACC application on your PC” appears on the monitor screen and the receiver enters the transmission standby mode. It is ready to send data to your PC. 2.MCACC Data Check 2g.Output PC A/V RECEIVER A/V RECEIVER a. Speaker Setting b. Channel Level c. Speaker Distance d. Standing Wave e. Acoustic Cal EQ f. Group Delay g. Output PC Exit Start the MCACC application on your PC. Exit Return Cancel This completes the preparations for sending the measurement data to your PC. (To send the data, proceed to the next section Application Operations.) Note • The graphs for both before calibration (“Before”) and after calibration (“After”) can be displayed on the screen displaying the reverberation characteristics graphs after Full Auto MCACC measurements (“Reverb”), but note that the graph displayed for the characteristics after calibration is a prediction of the reverberation characteristics after Full Auto MCACC with the EQ Type : SYMMETRY. For details, see About the display of the reverb characteristics graphs before and after calibration (page 23). If you want to check the graph of the actually measured reverberation characteristics after MCACC calibration (not the prediction), measure the reverb characteristics again after calibration. For details, see Displaying the reverb characteristics after EQ calibration (actually measured values) (page 24). 8 Applications Operations This section explains operations that you do in the application, from receiving measurement data to displaying graphs and saving the data. Receiving measurement data 1 Double click the application shortcut icon on the PC desktop. You can also start the application by selecting “Program” “Pioneer Corporation” “Advanced MCACC” from the “Start” menu. The application starts. 2 Select “Receive” under “File” on the menu bar. 3 Select the number of the COM port to which the RS-232C cable is connected. A COM port between “COM1” and “COM8” can be selected. If you do not know which COM port number to select, try selecting each port in turn, beginning with “COM1”. COM port selection box Note For more information about COM port settings, either refer to the operating instructions of your PC or contact your PC’s manufacturer. Continue Troubleshooting If an error occurs when you select “Receive” and no data is sent. 9 Application Operations (Continued) 4 Select the type of data to be received, then select “OK”. Select “Reverb” to receive the data for the room’s reverb characteristics, “Group Delay” to receive the data for the speakers’ group delay characteristics and “MCACC Parameters” to receive the data for the various MCACC parameters (measurements results). Type of data Data transmission starts. When reception finishes the received data appear. Note • The data used to display the reverberation characteristics graph (Reverb), the group delay characteristics graph (Group Delay) and the MCACC parameters are not deleted even when the receiver’s power is turned off. However, for the data used to display the reverberation characteristics graph (Reverb) and the group delay characteristics graph the data stored in the receiver is overwritten when the reverberations are measured again. If you wish to display graphs of multiple sets of data, use the data transfer function to store the data on a computer each time you measure the reverberations. • In order to avoid malfunction, after the completion of the data transmission, unplug the RS-232C cable connecting your PC and the receiver. Continue 10 Application Operations (Continued) Graph and parameter displays (names and functions of parts) When measurement data is received, the graphs and parameters display window appears. The display window is divided into two items, “Reverb”, “Group Delay” and “Parameters”. Select the desired tab to switch to that window and display the respective details. Reverb (graph of the room’s reverberation frequency characteristics) The display can be switched between the reverb characteristics graphs before and after calibration. You can switch the display between individual displays for the different channels/frequencies or a list display of all the channels/frequencies (ALL). Below we explain the different parts of the individual displays and the ALL display, using the channel display as an example. Individual display (Example: Front channel) 1 6 2 7 8 9 10 11 3 12 13 4 14 5 15 ALL display Continue 11 Application Operations (Continued) Group Delay (graph of the speaker’s group delay characteristics) You can switch the display between the speaker’s group delay characteristics before calibration and the speaker’s group delay characteristics after calibration. You can also switch between the group delay characteristics for all channels and the group delay characteristics for individual channels. 1 6 2 7 9 10 16 11 12 17 14 18 MCACC Parameters (list display of MCACC parameters) A list of the measurements in all the MCACC memories is displayed. It is also possible to display the measurements in the individual MCACC memories. 1 6 2 19 12 Continue 12 Application Operations (Continued) 1 Menu bar and menu icons You can choose the following commands from the application menus. File Open Opens a file that has been saved on the PC (see page 17). Close Closes a file. Save Save measurement data in a file (see page 16).a Save As Receive Receives measurement data (see page 9). Print Prints the current individual graph.b Preview Displays a preview screen to show how the printed page will appear.b Exit Exits the application. a. Choose “Save As” if you which to save already saved data with a different name. b. It is not possible to print or preview items that have not been received (items for which there is no data). Display The way in which the graphs are displayed can be changed. Graph Type (Reverb display only) Demo Graph 2D : Displayed in two dimensions. Graph 3D : Displayed in three dimensions. The reverb characteristics graph display type can be changed. Each Ch: All the channels are displayed individually. The “Each Ch” display type is set when EQ calibration is performed with the reverberation type set to “ALL CH ADJ”. Pair Ch: Composite reverb characteristics for the left and right pairs of the “Front”, “Surround” and “Surr Back” channels are displayed. The “Pair Ch” display type is set when EQ calibration is performed with the reverberation type set to “SYMMETRY” or “FRONT ALIGN”. Displays 3D graphs with rotating.a a. To finish, reselect and uncheck the box. Continue 13 Application Operations (Continued) Window Cascade Cascades files.a Tile Tiles files.a Minimize Minimizes the window. Arrange Arranges minimized icons.a a. Available when two or more files are open. Help Glossary Displays definitions of terms related to the MCACC function and this application. Version Info Displays the version of the application. 2 Display item selection tab A graph for the selected item or the MCACC parameter list is displayed. 3 Level [dB] The level axis. 4 Time [msec] The time axis. 5 Channel memo (only available when the channels are displayed on the reverb characteristics graph) Allows you to record a short memo about each channel. 6 Date and time Display the date (yyyy.mm.dd) and time when the measurement data was transferred to the PC. 7 Before and After selection buttons Select “Before” to display the graph of the characteristics before calibration, “After” to display the characteristics after calibration. 8 Channel and frequency switch buttons Ch: Selects channel display mode (frequencies are displayed along graph depth axes). Freq: Selects frequency display mode (channels are displayed along graph depth axes). 9 All/individual display switch menu Allows you to select All display or individual display (Left, Center, etc.). 10 Graph adjustment bar Z: Increases or reduces the display unit for the graph’s vertical axis scale (Level [dB] or Group Delay [msec]). M: Moves the display position of the graph’s vertical axis scale (Level [dB] or Group Delay [msec]). E: Moves the viewpoint of 3D graphs vertically. (Cannot be changed for 2D graphs.) R: Moves the viewpoint of 3D graphs horizontally. (Cannot be changed for 2D graphs.) Continue 14 Application Operations (Continued) 11 Bar Graph Changes the type of graph display. The display switches between the band graph and bar graph by pressing this button. Reverb: Move the time axis. Group Delay: Move the frequency axis. 12 File memo Memos concerning the file (conditions at the time of measurement, etc.) can be stored for the different items. 13 Reverb type Indicates whether the reverb characteristics are before calibration (EQ OFF) or after calibration (EQ ON). (For the reverb characteristics after calibration, the EQ calibration curve is displayed.) 14 Legend Shows which colors in the graphs correspond to which channels or frequencies. When the speaker’s group delay characteristics graph is displayed, the following channels are indicated (maximum): F: Front, C: Center, S: Surround, SB: Surround back 15 Freq [Hz]/Channel In channel display mode, it becomes the frequency axis. In frequency display mode, it becomes the channel axis. 16 Group Delay [msec] This axis indicates the group delay amount (length of group delay time). 17 Freq [Hz] This is the frequency axis. 18 Channel This is the channel axis. 19 List display/individual display selector buttons All the MCACC memories are displayed when “ALL Memory” is selected, individual MCACC memories are displayed when set for individual displays (“Memory1”, etc.). Continue 15 Application Operations (Continued) Saving graphs in data files You can save measurement data received from the receiver on your PC. Data received at one time is saved in one file. 1 To save measure data, choose “Save” from the “File” menu. If you have data that has already been saved and want to save it under a new name, choose “Save As”. 2 Check the save location, assign a file name, then click “Save”. The data is saved in a CSV format file (the file extension is “.csv”). When you are finished saving data, you should (using the receiver controls) press “RETURN” to exit the Reverb Output PC screen. This takes the receiver out of transmission standby mode. (See page 120 (SC-27, SC-25)/106 (SC-9540) of the receiver’s Operating Instructions.) Note The CSV format file is often used to transfer data to applications such as databases and spreadsheets. You can use these applications to view the numeric values in your measurement data. However, if you use another application to edit the data and then save the file, the Advanced MCACC application may be unable to open the file. Continue 16 Application Operations (Continued) Opening data files You can open and display two or more data files to compare the data in the files. 1 Select “Open” from the “File” menu in the menu bar. 2 Select a file to display and click “Open”. The previously saved measurement data is displayed. Exiting the application 1 Select “Exit” from the “File” menu. The application closes. 17 How to Interpret the Graphs As indicated in Things you can accomplish with this application (page 3), the reverb characteristics graph can be used as reference when determining the calibration time position with the receiver’s “Advanced EQ Setup” function. It is also a valuable means for checking the effect of measures taken to improve the acoustics of the room. The display can be switched between the reverb characteristics graphs before and after calibration. For details, see About the display of the reverb characteristics graphs before and after calibration (page 23). The group delay characteristics graph can be used to check the group delay characteristics (before calibration) of the speakers being used and the effect of calibration with the Full Band Phase Control function. For details, refer to Reading the group delay characteristics graph (Group Delay) on page 25 How to interpret reverb graphs (Reverb) The graphs show changes in microphone input level along a time axis, beginning from a state of quiet at time 0, when test tones begin to be output, and continuing while a constant level of sound is output from the speakers. • If there is absolutely no reverberation in your room, the graph will look like figure A below. • If there is reverberation, the graph will show a gradual accumulation of acoustic power, as shown in figure B. Note • Due to an effect known as “group delay”, lower frequencies may take longer to be generated than higher frequencies (this is most obvious when comparing the frequencies around 0 ms). • If a graph extends beyond the display range, or almost fills it, you can change the display by using the Z (Zoom) control on the graph adjustment bar, adjusting the display range of the Level [dB] scale so that the whole graph is visible. • Since channel level and speaker distance settings are displayed in the graphical output, it is best to make sure these settings (made in the Auto MCACC “ALL” or “Channel Level” setup) are adjusted properly before reverb measurement. • Even in cases where there is a great difference in the output levels of different frequencies (the frequency characteristics of the room are poor), the frequency characteristics of individual channels can be set closer to flat using the “SYMMETRY” or “ALL CH ADJ” calibration settings in the receiver’s “Auto MCACC” function. (For details, see page 110 (SC-27, SC-25)/96 (SC-9540) of the receiver’s Operating Instructions.) • It is usually not possible to calculate the equalization values employed by the receiver’s Acoustic Cal EQ function simply by viewing the graphs displayed on your PC. (This is because the automatic adjustments made by Acoustic Cal EQ function take account of factors such as equalization band interference and analytical filter characteristics, to achieve the optimum characteristic profile.) • There may be differences on the reverb characteristics graphs after measurements with the Full Auto MCACC function as compared to after measurements with the Reverb Measurement function (Manual MCACC “EQ Professional”) due to the standing wave control setting. With Full Auto MCACC, the reverberations are measured with standing wave controlled, so the reverb characteristics graph does not reflect the influence of the standing waves. By contrast, with Reverb Measurement, the reverberations are measured without standing wave control, so you can check the reverb characteristics including the influence of the standing waves. If you want to check the acoustics of the room (with the standing waves), we recommend using Reverb Measurement. Continue 18 How to Interpret the Graphs (Continued) Deciding the time period for Advanced EQ Setup calibration With conventional MCACC EQ calibration, the microphone input’s data acquisition time was fixed at between 80 and 160 [ms] (red part of Figure 1). By contrast, with the receiver’s Advanced EQ Setup function allowing more professional equalization, the customer can select individual points between 0 and 80 [ms] (with a 20 ms width) (blue part of Figure 1). Note You can specify the time period setting using the “Advanced EQ Setup” in the “EQ Professional” sub-menu (in the “Manual MCACC” menu). This setting is not required if you’re satisfied with the results of the “Full Auto MCACC” setup (For details, see page 116 (SC-27, SC-25)/102 (SC-9540) of the receiver’s Operating Instructions). Figure 1 Comparison of microphone data acquisition time periods Level (dB) EQ calibration time range Conventional MCACC EQ selectable for Advanced calibration time range EQ Setup function (fixed) (selected automatically for Full Auto MCACC) Time (in ms) To decide the time period for Advanced EQ Setup calibration, view the graphs of the measured reverb characteristics, and refer to the following three patterns. Pattern 1: Different reverb characteristics for high and low frequencies In rooms with reverb characteristics like those shown in Figure 2, lower frequencies often seem overly reverberant compared to higher frequencies (i.e. the room sounds ‘boomy’). With conventional MCACC EQ calibration, data between 80 and 160 [ms] (red part of Figure 2) was acquired, so the low frequency volume was deemed high and the high frequency volume deemed low, and the equalization curve was calibrated with the high frequencies somewhat boosted. However, for the characteristics of the sound reaching the ear directly within about 40 ms, there is enough volume that there is no real need to boost the high frequencies, so with equalization using the conventional MCACC EQ calibration the high frequencies sometimes sounded too strong. Therefore, the Acoustic Cal EQ may result in a room where high frequencies sound shrill. In cases like this, setting the time period for Advanced EQ Setup to 30 to 50 msec (the blue area in Figure 2) to adjust for sounds coming directly from the speakers can flatten the frequency response for direct sounds (including initial reflections) and give a better-balanced sound field. Figure 2 Low frequencies Level (dB) High frequencies Time period point to be selected Time (in ms) Continue 19 How to Interpret the Graphs (Continued) Pattern 2: Different reverb characteristics for different channels If the reverb characteristics differ for the different channels as shown in Figure 3, equalization using the conventional Acoustic Cal EQ acquired data between 80 and 160 [ms] (red part of Figure 3), so equalization was performed to gradually equalize the tone of the different channels for 80 ms from the time the sound was emitted from the speakers and after (it was not possible to equalize the response of the direct sound). However, the sense of placement and movement of the acoustic image and the unity of the sound from the different speakers is influenced not by the reverberations but by the direct sound from the speakers (including the early reflected sound). In cases like this, you should use Advanced EQ Setup and set the time period to 30 to 50 msec (the blue area in Figure 3). This allows the characteristics of direct sounds to be balanced for each channel, giving an ideal sound field with good acoustic positioning and movement. Figure 3 Front left channel Level (dB) Front right channel Time period point to be selected Time (in ms) Pattern 3: Similar reverb characteristics for high and low frequencies and all channels As shown in Figure 4, when the reverb characteristics for all channels are similar across all frequencies, your sound experience will probably not be adversely affected by reverberation. We recommend calibrating with a time of about 60 to 80 [ms] (green part of Figure 4) specified at Advanced EQ Setup. This produces a total calibration for both direct sounds and reverberations, resulting in an ideal sound field. Figure 4 Level (dB) Time period point to be selected Front left low frequencies Front right low frequencies Front left high frequencies Front right high frequencies Time (in ms) Note • If you are not sure which time period to specify in Advanced EQ Setup, start by trying 30 to 50 msec. If the graphs show an unusual reverb curve for a specific frequency, the cause may be some accidental variation. Instead of selecting 30 to 50 msec, try another time period. • Another good method is to try various time periods in Advanced EQ Setup and select the one which sounds the best. • Time period settings cannot be made on the PC. They can only be made on the GUI screen output from the receiver’s video outputs, using the receiver’s Advanced EQ Setup function. Continue 20 How to Interpret the Graphs (Continued) Checking steps to improve your room’s reverb characteristics The reverb characteristics of your listening room graphs are evident from the graphs. For your reference, the following four examples explain how different types of rooms appear in the graphs. Case 1: Graph rises to right across all frequencies This is probably a room with a good deal of reverberation. If possible, we recommend that you try installing some sound absorbent material to create a deader acoustic space according to your preference. Case 2: Specific channel shows unusual reverb characteristics There is probably some object near the speaker which affects sound reproduction. If possible, we recommend that you try to reduce the influence of that object. Continue 21 How to Interpret the Graphs (Continued) Case 3: Specific frequency shows unusual reverb characteristics There is probably something in the room that affects the reproduction of that frequency. If possible, try to find an arrangement that reduces the effect. Case 4: A specific channel is slow to start This can happen when a speaker is unstable. If possible, we recommend that you try to stabilize the speaker stand, to bring the characteristics of that channel into line with the other channels. Note In all of these cases, when the “Full Auto MCACC” operation is performed, the calibration time position is selected automatically in consideration of the room’s characteristics so that the optimum sound field can be achieved. (See page 46 (SC-27, SC-25)/42 (SC-9540) of the receiver’s Operating Instructions.) When measurements are made with the “Auto MCACC” function, automatic calibration taking the reverberations into consideration is only performed when “ALL”, “Keep SP System” or “EQ Pro & S-Wave” is selected at “Auto MCACC”. (See page 110 (SC-27, SC-25)/96 (SC-9540) of the receiver’s Operating Instructions.) Continue 22 How to Interpret the Graphs (Continued) About the display of the reverb characteristics graphs before and after calibration By comparing the reverberation characteristics graphs before and after calibration, you can check how the reverb characteristics have been calibrated. Select “Before” to display the graph of the reverberation characteristics before EQ calibration, “After” to display the graph of the reverb characteristics after EQ calibration. If you want to check the actually measured reverb characteristics after EQ calibration, see Displaying the reverb characteristics after EQ calibration (actually measured values) (page 24). Graph of reverb characteristics before calibration You can see that the reverb characteristics of the various frequencies of the different channels are uneven. Graph of reverb characteristics after calibration You can see that compared to the graph before calibration the lines for the individual frequencies move vertically in parallel by the amount of equalization and converge near the specified point on the time axis (30-50 ms by default). Note • The graphs displaying reverb measurements both before and after calibration are displayed in 2-D for comparison purposes. Continue 23 How to Interpret the Graphs (Continued) About the types of displays of the graph for the reverb characteristics after EQ calibration For “SYMMETRY” or “FRONT ALIGN” • The display type is set to “Pair Ch” (page 13). For reasons of the properties of the different EQ curves, when the “Each Ch” display type is set, the reverb characteristics for the different channels do not line up properly. • The reverb characteristics prior to calibration are displayed in the “Each Ch” mode, so if you want to compare the characteristics before and after calibration, set the display type prior to calibration to “Pair Ch”. This way the number of channels before and after calibration are the same, allowing you to compare. For “ALL CH ADJ” • The display type is set to “Each Ch” (page 13). For reasons of the properties of the EQ curves, when the “Pair Ch” display type is set, the reverb characteristics for the different pairs of channels do not line up properly. • Since the “Each Ch” display type is set both before and after calibration, the graphs can be compared as such. Displaying the reverb characteristics after EQ calibration (actually measured values) The graphs for before and after calibration can be displayed at the screen displaying the graphs of the reverberation characteristics after Full Auto MCACC measurements, but note that the graph displayed here for the characteristics after calibration is a prediction of the reverb characteristics after MCACC calibration. If you want to check the graph of the actually measured reverberation characteristics after MCACC calibration (not the prediction), you must re-measure the reverb characteristics after calibration. To do so, follow the procedure described below. 1 Connect the receiver to your PC with an RS-232C cable. If the “Full Auto MCACC” operation has never been performed, conduct the “Full Auto MCACC” operation here. (See page 46 (SC-27, SC-25)/42 (SC-9540) of the receiver’s Operating Instructions.) 2 Select the “EQ Professional” option for “Manual MCACC”, and perform with “Reverb Measurement” set to “EQ ON”. (See page 116 (SC-27, SC-25)/102 (SC9540) of the receiver’s Operating Instructions.) Measure the room’s reverb characteristics after equalization with the microphone at the same position as when the “Full Auto MCACC” operation was performed. The measurements are performed with the EQ values stored in the MCACC memory selected on the receiver, so before measuring the reverb characteristics, select the MCACC memory to be measured after equalization. 3 Receive and save the data by selecting “Output PC” from “MCACC Data Check”. You can display the graph of the reverberation characteristics actually measured after EQ calibration by displaying the Reverb graph and selecting “After”. Continue 24 How to Interpret the Graphs (Continued) Reading the group delay characteristics graph (Group Delay) Group delay characteristics graphs for before and after calibration can be displayed. By comparing the two, it is possible to check in detail the group delay characteristics of the speakers being used and the effect of calibration using the Full Band Phase Control function. Group delay characteristics graph for before calibration This graph lets you check that the low frequency band is delayed with respect to the high frequency band (that a group delay is occurring) for the different channels. Group delay characteristics graph for after calibration This graphs shows you that the delay time difference between bands has been reduced and that the group delay has been calibrated for the different channels. Note Depending on the speakers being used, the listening environment, etc., the group delay characteristics graphs may be displayed with sharp angles. With actual calibration, however, so as not to tarnish the natural sound, compensation is not performed for characteristics that rise and fall at extremely sharp angles and but instead with priority on group delay characteristics between the different speakers, so there is no adverse effect on the sound quality. 25 Display of the MCACC parameters In addition to the reverberation frequency characteristics and group delay characteristics data measured with the Advanced MCACC function, all the parameters (results of measurements) set in the MCACC memories can be checked on the computer. Parameters that can be displayed 1. Speaker Setting (Speaker system and crossover frequency) 2. Channel Level (Speaker output level) 3. Speaker Distance (Distance to the speaker) 4. Standing Wave Control (Standing wave control filter) 5. Acoustic Cal EQ (Calibration of the listening environment’s frequency characteristics)a 6. X-Curve (Tonal balance of the speaker system for movie soundtracks) a. In addition to the EQ calibration values stored in each MCACC memory, the EQ calibration curve name (“Symmetry”, “All Ch Adjust” or “Front Align”) is also displayed. Furthermore, “Custom” is displayed for memories for which the equalizer has been adjusted manually. Measurements of the reverb characteristics after calibration (page 24) are performed applying the EQ calibration curves for these memories. Displays of the different memories It is possible to receive and display the data for all the MCACC memories (MEMORY1 to MEMORY6), but also possible to display the data for the individual memories. Memory1 Note When there are items that cannot fit on the display, move the scroll bar on the screen to display the remaining data. Continue 26 Updating, Deleting and Repairing the Application Updating the application A new installer is made available on the download site whenever the Advanced MCACC application is updated. You can download the new installer and use it to overwrite (update) the application on your PC. Note To check the version of your application, choose “Help” “Version Info” from the menu bar. A window showing the version (Version 2.2, etc.) appears. 1 Double click the new downloaded installer . The InstallShield Wizard appears. Perform steps 2 to 5 of Installing the Application (page 4) to update the application. Note The application may not operate properly if two versions of it are installed on the same computer. If you wish to return to a previous version of the application, uninstall (delete) the currently installed version first, then reinstall the previous version. Continue 27 Updating, Deleting and Repairing the Application (Continued) Deleting the application You can use either of the following methods to uninstall (delete) the application from your PC. Method 1: Delete from the Control Panel of the PC From the Start menu, click “Setting” “Control Panel” “Add/Remove Programs”. Method 2: Use the installer file for the currently installed version to delete the application Note The application cannot be deleted by launching the installer file of a version different from the installed version. To do so, launch the installer file for the same version. 1 Double click the “PioneerAdvancedMCACC_e_ver_*_*.exe” file . The InstallShield Wizard appears. 2 Select “Next”. 3 Select “Remove”, then select “Next”. Continue 28 Updating, Deleting and Repairing the Application (Continued) 4 Select “Remove”. 5 Click “Finish”. This completes the deletion of the application. Continue 29 Updating, Deleting and Repairing the Application (Continued) Repairing the application The repair function can be used for example if desktop shortcuts have been deleted, etc., to restore the application to the same conditions as when it was first installed. Note The application cannot be repaired by launching the installer file of a version different from the installed version. To do so, launch the installer file for the same version. 1 Double-click the installer file for the currently installed version. The InstallShield Wizard appears. 2 Select “Next”. 3 Select “Repair”, then select “Next”. Continue 30 Updating, Deleting and Repairing the Application (Continued) 4 Select “Install”. 5 Click “Finish”. This completes the repairing of the application. Modifying the application With the application for the SC-27, SC-25 or SC-9540, “Modify” cannot be used. 31 Troubleshooting As you use the Advanced MCACC application, errors can occur for a variety of reasons, such as incompatibilities with other applications and the current configuration of your PC. If an error occurs, refer to the troubleshooting points below. If the trouble cannot be rectified even after checking the points listed below, ask the Pioneer Customer Support Division (USA) or Customer Satisfaction Department (Canada). Pioneer Electronics Service Inc. TEL: 800-421-1404 Pioneer Electronics of Canada, Inc. Customer Satisfaction Department TEL: 1-877-283-5901 The application is unstable, or does not work normally Cause 1: If your PC does not meet the requirements for using this application, the application can be unstable, very slow, or freeze up. Check to be sure that your PC meets the requirements for using this application. (See page 2.) You cannot use this application unless your PC meets all of the requirements. Cause 2: Even if the required conditions for the computer environment are met, if many files are opened in the application and all are displayed with the MCACC Parameters option, an error message may appear due to lack of computer memory. If an error message like the one shown below appears, either close some of the opened files, or quit the application itself then restart it. If you want to compare many files, we recommend printing them out using the Print function and comparing them on paper. Not enough storage is available to process this command. Advanced MCACC cannot be installed Cause 1: An error message may appear if there are not enough system resources available. If an error message like the one shown below appears, re-start the PC, then start the installer (PioneerAdvancedMCACC_e_ver_*_*.exe) with no other applications active. The InstallShield Engine (iKernel.exe) could not be installed. The system cannot read from the specified device. Cause 2: Installation of Advanced MCACC may fail because of incompatibilities with other applications. Try the following, in the order indicated. 1) If there are any other applications active, exit the other applications and try starting the installer (PioneerAdvancedMCACC_e_ver_*_*.exe) again. 2) If that does not work, try restarting your PC, and starting the installer (PioneerAdvancedMCACC_e_ver_*_*.exe) with no other applications active. Continue 32 Troubleshooting (Continued) Cannot send measurement data to PC Cause 1: Random transmission errors sometimes occur. Even if an error occurred on your first attempt, try sending the data again. Sometimes the transmission succeeds when you try again. Cause 2: Messages like the following may appear if a transmission error occurs. Timeout occurred. Command error occurred. Please try again. Send failed. Try the following, in the order indicated. 1) In the GUI screen of the receiver, check that “Start the MCACC application on your PC” is displayed. (This message indicates that the receiver is ready to send data to the PC.) 2) Check that the RS-232C cable is properly connected. (Be sure to switch off all components and disconnect their power cord from the power outlets before changing any cable connections.) 3) Exit any other active applications. 4) Check the COM port number. 5) Check the type of RS-232C cable to use is correct (page 7). 6) Restart the Advanced MCACC application. 7) Restart your PC. Cause 3: The following message may appear and the data transmission may be not available. Cannot open the serial port (COM*). Refer to the operation manual for PC or the application software using the COM port, and make the connecting COM port available for transmission. Continue 33 Troubleshooting (Continued) Advanced MCACC cannot be updated Cause 1: An error message may appear if there are not enough system resources available. If an error message appears (like the one explained above in Cause 1) of Advanced MCACC cannot be installed (page 32), restart your PC and start the installer (PioneerAdvancedMCACC_e_ver_*_*.exe) with no other applications active. Cause 2: Updating of Advanced MCACC may fail because of incompatibilities with other applications. Try the following, in the order indicated. 1) If there are any other applications active, exit the other applications and try starting the installer (PioneerAdvancedMCACC_e_ver_*_*.exe) again. 2) If that does not work, try restarting your PC, and starting the installer (PioneerAdvancedMCACC_e_ver_*_*.exe) with no other applications active. Reverb characteristics graph cannot be printed Cause: It is not possible to print reverb characteristics graphs displayed in the “ALL” mode. ALL display Print after selecting an individual channel or frequency graph. Some functions in application operation cannot be used Cause: You may not properly use the application software not corresponding to your receiver. Check the model number of your receiver and use the application software corresponding to it. Continue 34 Troubleshooting (Continued) The receiver causes a malfunction when it is connected to the PC with an RS-232C cable Cause: When the receiver is connected to your PC with an RS-232C cable, the power of the receiver may be automatically switched on when you operate the PC. Unplug the cable when not in use. EQ response in the graph (following calibration) does not appear flat Cause 1: The slope of the graph indicates the reverb characteristics. The reverb characteristics of the room itself cannot be corrected by equalization alone, so the angle of the graphs’ slope is the same before and after calibration. Through calibration, the graphs for the different frequencies move horizontally by the amount of the equalization. For the results of calibration, you can check that the graphs line up at a specific point on the time axis. The reverb characteristics themselves (the shape of the graph) do not change unless the listening environment is improved. (See pages 18 to 20.) Cause 2: For various reasons, the frequency characteristic graphs may not become flat even when equalization is performed with the “SYMMETRY” or “ALL CH ADJ” functions. With MCACC, calibration is performed automatically to achieve the optimum sound quality, but without any unreasonable calibration. Adjustments made with the “Manual MCACC” setup do not change the graph Cause: Despite level adjustments being made, the filters used for analysis may not display these adjustments in the graphical output. However, these adjustments are taken this into account by the filters dedicated to overall system calibration. Lower frequencies do not seem to have been calibrated for SMALL speakers Cause: Low frequency calibration with the equalizer is not performed for speakers that are set to “SMALL”, but the reverb characteristics display shows the pure characteristics of the sound output from the speakers, so it indicates the characteristics with no low frequency calibration. With MCACC, optimum calibration is performed in function of the speakers’ sound reproduction capacities, so there is no problem for low frequency calibration of speakers that are set to “SMALL”. 35 PIONEER CORPORATION 4-1, Meguro 1-Chome, Meguro-ku, Tokyo 153-8654, Japan PIONEER ELECTRONICS (USA) INC. P.O. BOX 1540, Long Beach, California 90801-1540, U.S.A. TEL: (800) 421-1404 PIONEER ELECTRONICS OF CANADA, INC. 300 Allstate Parkway, Markham, Ontario L3R 0P2, Canada TEL: 1-877-283-5901, 905-479-4411 PIONEER EUROPE NV Haven 1087, Keetberglaan 1, B-9120 Melsele, Belgium TEL: 03/570.05.11 PIONEER ELECTRONICS ASIACENTRE PTE. LTD. 253 Alexandra Road, #04-01, Singapore 159936 TEL: 65-6472-7555 PIONEER ELECTRONICS AUSTRALIA PTY. LTD. 178-184 Boundary Road, Braeside, Victoria 3195, Australia, TEL: (03) 9586-6300 PIONEER ELECTRONICS DE MEXICO S.A. DE C.V. Blvd.Manuel Avila Camacho 138 10 piso Col.Lomas de Chapultepec, Mexico,D. F. 11000 TEL: 55-9178-427 0 K002_B_En Published by Pioneer Corporation. Copyright © 2009 Pioneer Corporation. All rights reserved. <ARB7435-A>