1
Intel® Xeon® Processor E5-2600
Product Family Uncore Performance
Monitoring Guide
March 2012
Reference Number: 327043-001
®
INFORMATION IN THIS DOCUMENT IS PROVIDED IN CONNECTION WITH INTEL PRODUCTS. NO LICENSE, EXPRESS OR IMPLIED,
BY ESTOPPEL OR OTHERWISE, TO ANY INTELLECTUAL PROPERTY RIGHTS IS GRANTED BY THIS DOCUMENT. EXCEPT AS
PROVIDED IN INTEL'S TERMS AND CONDITIONS OF SALE FOR SUCH PRODUCTS, INTEL ASSUMES NO LIABILITY WHATSOEVER,
AND INTEL DISCLAIMS ANY EXPRESS OR IMPLIED WARRANTY, RELATING TO SALE AND/OR USE OF INTEL PRODUCTS INCLUDING
LIABILITY OR WARRANTIES RELATING TO FITNESS FOR A PARTICULAR PURPOSE, MERCHANTABILITY, OR INFRINGEMENT OF ANY
PATENT, COPYRIGHT OR OTHER INTELLECTUAL PROPERTY RIGHT. Intel products are not intended for use in medical, life saving,
life sustaining applications.
A "Mission Critical Application" is any application in which failure of the Intel Product could result, directly or indirectly, in personal
injury or death. SHOULD YOU PURCHASE OR USE INTEL'S PRODUCTS FOR ANY SUCH MISSION CRITICAL APPLICATION, YOU
SHALL INDEMNIFY AND HOLD INTEL AND ITS SUBSIDIARIES, SUBCONTRACTORS AND AFFILIATES, AND THE DIRECTORS,
OFFICERS, AND EMPLOYEES OF EACH, HARMLESS AGAINST ALL CLAIMS COSTS, DAMAGES, AND EXPENSES AND REASONABLE
ATTORNEYS' FEES ARISING OUT OF, DIRECTLY OR INDIRECTLY, ANY CLAIM OF PRODUCT LIABILITY, PERSONAL INJURY, OR DEATH
ARISING IN ANY WAY OUT OF SUCH MISSION CRITICAL APPLICATION, WHETHER OR NOT INTEL OR ITS SUBCONTRACTOR WAS
NEGLIGENT IN THE DESIGN, MANUFACTURE, OR WARNING OF THE INTEL PRODUCT OR ANY OF ITS PARTS.
Intel may make changes to specifications and product descriptions at any time, without notice.
Designers must not rely on the absence or characteristics of any features or instructions marked “reserved” or “undefined.” Intel
reserves these for future definition and shall have no responsibility whatsoever for conflicts or incompatibilities arising from future
changes to them.
Code names represented in this document are only for use by Intel to identify a product, technology, or service in development,
that has not been made commercially available to the public, i.e., announced, launched or shipped. It is not a “commercial” name
for products or services and is not intended to function as a trademark.
The Intel® 64 architecture processors may contain design defects or errors known as errata, which may cause the product to deviate
from published specifications. Current characterized errata are available on request.
Hyper-Threading Technology requires a computer system with an Intel® processor supporting Hyper-Threading Technology and
an HT Technology enabled chipset, BIOS and operating system. Performance will vary depending on the specific hardware and
software you use. For more information, see http://www.intel.com/technology/hyperthread/index.htm; including details on which processors
support HT Technology.
Intel® Virtualization Technology requires a computer system with an enabled Intel® processor, BIOS, virtual machine monitor
(VMM) and for some uses, certain platform software enabled for it. Functionality, performance or other benefits will vary depending
on hardware and software configurations. Intel® Virtualization Technology-enabled BIOS and VMM applications are currently in
development.
64-bit computing on Intel architecture requires a computer system with a processor, chipset, BIOS, operating system, device drivers and applications enabled for Intel® 64 architecture. Processors will not operate (including 32-bit operation) without an Intel®
64 architecture-enabled BIOS. Performance will vary depending on your hardware and software configurations. Consult with your
system vendor for more information.
Contact your local Intel sales office or your distributor to obtain the latest specifications and before placing your product order.
Copies of documents which have an order number and are referenced in this document, or other Intel literature, may be obtained
by calling 1-800-548-4725, or by visiting Intel's Web Site.
Intel, Pentium, Intel Xeon, Intel NetBurst, Intel Core Solo, Intel Core Duo, Intel Core 2 Duo, Intel Core 2 Extreme, Intel Pentium
D, Itanium, Intel SpeedStep, MMX, and VTune are trademarks or registered trademarks of Intel Corporation or its subsidiaries in
the United States and other countries.
Copyright © 2012 Intel Corporation. All rights reserved.
*Other names and brands may be claimed as the property of others.
2
Reference Number: 327043-001
Contents
1
Introduction .............................................................................................................. 9
1.1
Introduction ....................................................................................................... 9
1.2
Uncore PMON Overview........................................................................................ 9
1.3
Section References ............................................................................................ 10
1.4
Uncore PMON - Typical Control/Counter Logic ....................................................... 11
1.5
Uncore PMU Summary Tables ............................................................................. 12
1.6
On Parsing and Using Derived Events ................................................................... 14
1.6.1 On Common Terms found in Derived Events .............................................. 15
2
Intel® Xeon® Processor E5-2600 Product Family Uncore Performance Monitoring. 17
2.1
Uncore Per-Socket Performance Monitoring Control................................................ 17
2.1.1 Setting up a Monitoring Session ............................................................... 17
2.1.2 Reading the Sample Interval.................................................................... 18
2.2
UBox Performance Monitoring ............................................................................. 19
2.2.1 Overview of the UBox ............................................................................. 19
2.2.2 UBox Performance Monitoring Overview .................................................... 19
2.2.3 UBox Performance Monitors ..................................................................... 19
2.2.3.1 UBox Box Level PMON State ....................................................... 19
2.2.3.2 UBox PMON state - Counter/Control Pairs..................................... 20
2.2.4 UBox Performance Monitoring Events ........................................................ 21
2.2.5 UBOX Box Events Ordered By Code .......................................................... 21
2.2.6 UBOX Box Performance Monitor Event List ................................................. 21
2.3
Caching Agent (Cbo) Performance Monitoring........................................................ 22
2.3.1 Overview of the CBo ............................................................................... 22
2.3.2 CBo Performance Monitoring Overview ...................................................... 23
2.3.2.1 Special Note on CBo Occupancy Events........................................ 23
2.3.3 CBo Performance Monitors....................................................................... 24
2.3.3.1 CBo Box Level PMON State......................................................... 27
2.3.3.2 CBo PMON state - Counter/Control Pairs ...................................... 27
2.3.3.3 CBo Filter Register (Cn_MSR_PMON_BOX_FILTER) ........................ 28
2.3.4 CBo Performance Monitoring Events.......................................................... 30
2.3.4.1 An Overview: ........................................................................... 30
2.3.4.2 Acronyms frequently used in CBo Events: .................................... 30
2.3.4.3 The Queues: ............................................................................ 31
2.3.5 CBo Events Ordered By Code ................................................................... 31
2.3.6 CBO Box Common Metrics (Derived Events)............................................... 32
2.3.7 CBo Performance Monitor Event List.......................................................... 34
2.4
Home Agent (HA) Performance Monitoring ............................................................ 45
2.4.1 Overview of the Home Agent ................................................................... 45
2.4.2 HA Performance Monitoring Overview........................................................ 46
2.4.3 HA Performance Monitors ........................................................................ 46
2.4.3.1 HA Box Level PMON State .......................................................... 46
2.4.3.2 HA PMON state - Counter/Control Pairs ........................................ 47
2.4.4 HA Performance Monitoring Events ........................................................... 49
2.4.4.1 On the Major HA Structures: ...................................................... 49
2.4.5 HA Box Events Ordered By Code .............................................................. 50
2.4.6 HA Box Common Metrics (Derived Events) ................................................. 50
2.4.7 HA Box Performance Monitor Event List ..................................................... 51
2.5
Memory Controller (iMC) Performance Monitoring .................................................. 59
2.5.1 Overview of the iMC ............................................................................... 59
2.5.2 Functional Overview ............................................................................... 59
2.5.3 iMC Performance Monitoring Overview....................................................... 59
2.5.4 iMC Performance Monitors ....................................................................... 60
Reference Number: 327043-001
3
2.6
2.7
2.8
2.9
2.10
4
2.5.4.1 MC Box Level PMON State ..........................................................60
2.5.4.2 MC PMON state - Counter/Control Pairs ........................................61
2.5.5 iMC Performance Monitoring Events...........................................................62
2.5.5.1 An Overview:............................................................................62
2.5.6 iMC Box Events Ordered By Code ..............................................................63
2.5.7 iMC Box Common Metrics (Derived Events) ................................................63
2.5.8 iMC Box Performance Monitor Event List ....................................................64
Power Control (PCU) Performance Monitoring ........................................................72
2.6.1 Overview of the PCU ...............................................................................72
2.6.2 PCU Performance Monitoring Overview ......................................................72
2.6.3 PCU Performance Monitors .......................................................................72
2.6.3.1 PCU Box Level PMON State .........................................................73
2.6.3.2 PCU PMON state - Counter/Control Pairs.......................................74
2.6.3.3 Intel® PCU Extra Registers - Companions to PMON HW ..................76
2.6.4 PCU Performance Monitoring Events ..........................................................76
2.6.4.1 An Overview:............................................................................76
2.6.5 PCU Box Events Ordered By Code .............................................................78
2.6.6 PCU Box Common Metrics (Derived Events)................................................79
2.6.7 PCU Box Performance Monitor Event List....................................................79
Intel® QPI Link Layer Performance Monitoring.......................................................87
2.7.1 Overview of the Intel® QPI Box................................................................87
2.7.2 Intel® QPI Performance Monitoring Overview .............................................87
2.7.3 Intel® QPI Performance Monitors..............................................................88
2.7.3.1 Intel® QPI Box Level PMON State ...............................................88
2.7.3.2 Intel® QPI PMON state - Counter/Control Pairs .............................89
2.7.3.3 Intel® QPI Registers for Packet Mask/Match Facility.......................90
2.7.3.4 Intel® QPI Extra Registers - Companions to PMON HW...................94
2.7.4 Intel® QPI LL Performance Monitoring Events.............................................94
2.7.4.1 An Overview .............................................................................94
2.7.4.2 Acronyms frequently used in Intel® QPI Events: ...........................95
2.7.5 Intel® QPI LL Box Events Ordered By Code................................................95
2.7.6 Intel QPI LL Box Common Metrics (Derived Events) .....................................96
2.7.7 Intel® QPI LL Box Performance Monitor Event List ......................................98
R2PCIe Performance Monitoring ......................................................................... 111
2.8.1 Overview of the R2PCIe Box................................................................... 111
2.8.2 R2PCIe Performance Monitoring Overview ................................................ 111
2.8.3 R2PCIe Performance Monitors................................................................. 112
2.8.3.1 R2PCIe Box Level PMON State................................................... 112
2.8.3.2 R2PCIe PMON state - Counter/Control Pairs ................................ 113
2.8.4 R2PCIe Performance Monitoring Events.................................................... 114
2.8.4.1 An Overview ........................................................................... 114
2.8.5 R2PCIe Box Events Ordered By Code ....................................................... 114
2.8.6 R2PCIe Box Common Metrics (Derived Events) ......................................... 114
2.8.7 R2PCIe Box Performance Monitor Event List ............................................. 115
R3QPI Performance Monitoring .......................................................................... 119
2.9.1 Overview of the R3QPI Box .................................................................... 119
2.9.2 R3QPI Performance Monitoring Overview ................................................. 119
2.9.3 R3QPI Performance Monitors .................................................................. 120
2.9.3.1 R3QPI Box Level PMON State .................................................... 120
2.9.3.2 R3QPI PMON state - Counter/Control Pairs.................................. 121
2.9.4 R3QPI Performance Monitoring Events ..................................................... 122
2.9.4.1 An Overview ........................................................................... 122
2.9.5 R3QPI Box Events Ordered By Code ........................................................ 122
2.9.6 R3QPI Box Common Metrics (Derived Events)........................................... 123
2.9.7 R3QPI Box Performance Monitor Event List............................................... 123
Packet Matching Reference................................................................................ 131
Reference Number: 327043-001
Figures
1-1
1-2
Uncore Sub-system Block Diagram of Intel Xeon Processor E5-2600 Family ................ 9
Perfmon Control/Counter Block Diagram............................................................... 11
Tables
1-1
1-2
1-3
2-1
2-2
2-3
2-4
2-5
2-8
2-9
2-10
2-11
2-12
2-13
2-33
2-34
2-35
2-36
2-37
2-38
2-39
2-59
2-60
2-61
2-62
2-63
2-73
2-74
2-75
2-76
2-77
2-78
2-79
2-80
2-84
2-85
2-86
2-87
2-88
2-89
2-90
2-91
2-92
Per-Box Performance Monitoring Capabilities......................................................... 10
MSR Space Uncore Performance Monitoring Registers............................................. 12
PCICFG Space Uncore Performance Monitoring Registers ........................................ 13
UBox Performance Monitoring MSRs..................................................................... 19
U_MSR_PMON_CTL{1-0} Register – Field Definitions ............................................. 20
U_MSR_PMON_CTR{1-0} Register – Field Definitions ............................................. 20
U_MSR_PMON_FIXED_CTL Register – Field Definitions ........................................... 21
U_MSR_PMON_FIXED_CTR Register – Field Definitions ........................................... 21
CBo Performance Monitoring MSRs ...................................................................... 24
Cn_MSR_PMON_BOX_CTL Register – Field Definitions ............................................ 27
Cn_MSR_PMON_CTL{3-0} Register – Field Definitions............................................ 27
Cn_MSR_PMON_CTR{3-0} Register – Field Definitions ........................................... 28
Cn_MSR_PMON_BOX_FILTER Register – Field Definitions ........................................ 29
Opcode Match by IDI Packet Type for Cn_MSR_PMON_BOX_FILTER.opc ................... 29
HA Performance Monitoring MSRs ........................................................................ 46
HA_PCI_PMON_BOX_CTL Register – Field Definitions ............................................. 47
HA_PCI_PMON_CTL{3-0} Register – Field Definitions ............................................. 47
HA_PCI_PMON_CTR{3-0} Register – Field Definitions ............................................ 48
HA_PCI_PMON_BOX_OPCODEMATCH Register – Field Definitions ............................ 48
HA_PCI_PMON_BOX_ADDRMATCH1 Register – Field Definitions ............................... 48
HA_PCI_PMON_BOX_ADDRMATCH0 Register – Field Definitions ............................... 49
iMC Performance Monitoring MSRs ....................................................................... 60
MC_CHy_PCI_PMON_BOX_CTL Register – Field Definitions...................................... 60
MC_CHy_PCI_PMON_CTL{3-0} Register – Field Definitions ..................................... 61
MC_CHy_PCI_PMON_FIXED_CTL Register – Field Definitions ................................... 62
MC_CHy_PCI_PMON_CTR{FIXED,3-0} Register – Field Definitions ........................... 62
PCU Performance Monitoring MSRs ...................................................................... 72
PCU_MSR_PMON_BOX_CTL Register – Field Definitions .......................................... 73
PCU_MSR_PMON_CTL{3-0} Register – Field Definitions .......................................... 74
PCU_MSR_PMON_CTR{3-0} Register – Field Definitions ......................................... 75
PCU_MSR_PMON_BOX_FILTER Register – Field Definitions ...................................... 76
PCU_MSR_CORE_C6_CTR Register – Field Definitions............................................. 76
PCU_MSR_CORE_C3_CTR Register – Field Definitions............................................. 76
PCU Configuration Examples ............................................................................... 77
Intel® QPI Performance Monitoring Registers........................................................ 88
Q_Py_PCI_PMON_BOX_CTL Register – Field Definitions .......................................... 89
Q_Py_PCI_PMON_CTL{3-0} Register – Field Definitions.......................................... 89
Q_Py_PCI_PMON_CTR{3-0} Register – Field Definitions ......................................... 90
Q_Py_PCI_PMON_PKT_MATCH1 Registers............................................................. 91
Q_Py_PCI_PMON_PKT_MATCH0 Registers............................................................. 91
Q_Py_PCI_PMON_PKT_MASK1 Registers............................................................... 92
Q_Py_PCI_PMON_PKT_MASK0 Registers............................................................... 92
Message Events Derived from the Match/Mask filters.............................................. 93
Reference Number: 327043-001
5
2-93
2-104
2-105
2-106
2-107
2-118
2-119
2-120
2-121
2-142
2-143
2-144
6
QPI_RATE_STATUS Register – Field Definitions ......................................................94
R2PCIe Performance Monitoring Registers ........................................................... 112
R2_PCI_PMON_BOX_CTL Register – Field Definitions ............................................ 112
R2_PCI_PMON_CTL{3-0} Register – Field Definitions............................................ 113
R2_PCI_PMON_CTR{3-0} Register – Field Definitions ........................................... 113
R3QPI Performance Monitoring Registers ............................................................ 120
R3_Ly_PCI_PMON_BOX_CTL Register – Field Definitions ....................................... 120
R3_Ly_PCI_PMON_CTL{2-0} Register – Field Definitions....................................... 121
R3_Ly_PCI_PMON_CTR{2-0} Register – Field Definitions ...................................... 121
Intel® QuickPath Interconnect Packet Message Classes ........................................ 131
Opcode Match by Message Class ........................................................................ 131
Opcodes (Alphabetical Listing) ........................................................................... 132
Reference Number: 327043-001
Revision History
Revision
327043-001
Description
Initial release.
Date
March 2012
§
Reference Number: 327043-001
7
8
Reference Number: 327043-001
Introduction
1
Introduction
1.1
Introduction
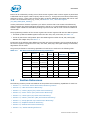
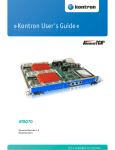
The uncore subsystem of the Intel® Xeon® processor E5-2600 product family is shown in Figure 1-1.
The uncore subsystem also applies to the Intel® Xeon® processor E5-1600 product family in a
single-socket platform1. The uncore sub-system consists of a variety of components, ranging from the
CBox caching agent to the power controller unit (PCU), integrated memory controller (iMC) and home
agent (HA), to name a few. Most of these components provide similar performance monitoring
capabilities.
Figure 1-1.
Uncore Sub-system Block Diagram of Intel Xeon Processor E5-2600 Family
1.2
Uncore PMON Overview
The uncore performance monitoring facilities are organized into per-component performance
monitoring (or ‘PMON’) units. A PMON unit within an uncore component may contain one of more
sets of counter registers. With the exception of the UBox, each PMON unit provides a unit-level
control register to synchronize actions across the counters within the box (e.g., to start/stop
counting).
1. The uncore sub-system in Intel® CoreTM i7-3930K and i7-3820 processors are derived from
above, hence most of the descriptions of this document also apply.
Reference Number: 327043-001
9
Introduction
Events can be collected by reading a set of local counter registers. Each counter register is paired with
a dedicated control register used to specify what to count (i.e. through the event select/umask fields)
and how to count it. Some units provide the ability to specify additional information that can be used
to ‘filter’ the monitored events (e.g., C-box; see Section 2.3.3.3, “CBo Filter Register
(Cn_MSR_PMON_BOX_FILTER)”).
Uncore performance monitors represent a per-socket resource that is not meant to be affected by
context switches and thread migration performed by the OS, it is recommended that the monitoring
software agent establish a fixed affinity binding to prevent cross-talk of event counts from different
uncore PMU.
The programming interface of the counter registers and control registers fall into two address spaces:
• Accessed by MSR are PMON registers within the Cbo units, PCU, and U-Box, see Table 1-2.
• Access by PCI device configuration space are PMON registers within the HA, iMC, Intel® QPI,
R2PCIe and R3QPI units, see Table 1-3.
Irrespective of the address-space difference and with only minor exceptions, the bit-granular layout of
the control registers to program event code, unit mask, start/stop, and signal filtering via threshold/
edge detect are the same.
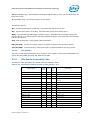
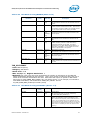
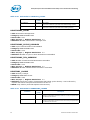
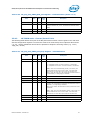
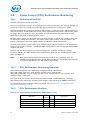
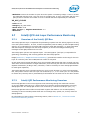
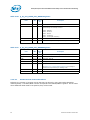
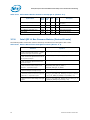
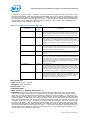
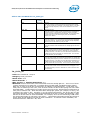
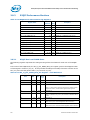
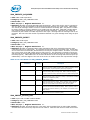
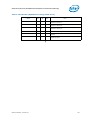
The general performance monitoring capabilities of each box are outlined in the following table.
Table 1-1.
Per-Box Performance Monitoring Capabilities
Box
C-Box
HA
# Counters/
Box
# Queue
Enabled
Bus
Lock?
4
1
N
8
Packet Match/
Mask Filters?
Bit Width
Y
44
1
4
4
Y
Y
48
iMC
1
(4 channels)
4 (+1)
(per channel)
4
N
N
48
PCU
1
4 (+2)
4
N
N
48
QPI
1
(2 ports)
4
(per port)
4
N
Y?
48
R2PCIe
1.3
# Boxes
1
4
1
N
N
44
R3QPI
1
(2 links)
3
1
N
N
44
U-Box
1
2 (+1)
0
N/A
N
44
Section References
The following sections provide a breakdown of the performance monitoring capabilities for each box.
• Section 2.1, “Uncore Per-Socket Performance Monitoring Control”
• Section 2.2, “UBox Performance Monitoring”
• Section 2.3, “Caching Agent (Cbo) Performance Monitoring”
• Section 2.6, “Power Control (PCU) Performance Monitoring”
• Section 2.4, “Home Agent (HA) Performance Monitoring”
• Section 2.5, “Memory Controller (iMC) Performance Monitoring”
• Section 2.7, “Intel® QPI Link Layer Performance Monitoring”
• Section 2.9, “R3QPI Performance Monitoring”
• Section 2.8, “R2PCIe Performance Monitoring”
• Section 2.10, “Packet Matching Reference”
10
Reference Number: 327043-001
Introduction
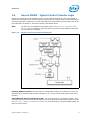
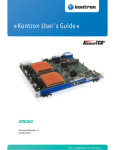
1.4
Uncore PMON - Typical Control/Counter Logic
Following is a diagram of the standard perfmon counter block illustrating how event information is
routed and stored within each counter and how its paired control register helps to select and filter the
incoming information. Details for how control bits affect event information is presented in each of the
box subsections of Chapter 2, with some summary information below.
Note:
The PCU uses an adaptation of this block (refer to Section 2.6.3, “PCU Performance
Monitors” more information). Also note that only a subset of the available control bits
are presented in the diagram.
Figure 1-2.
Perfmon Control/Counter Block Diagram
Selecting What To Monitor: The main task of a configuration register is to select the event to be
monitored by its respective data counter. Setting the .ev_sel and .umask fields performs the event
selection.
Telling HW that the Control Register Is Set: .en bit must be set to 1 to enable counting. Once
counting has been enabled in the box and global level of the Performance Monitoring Hierarchy (refer
to Section 2.1.1, “Setting up a Monitoring Session” for more information), the paired data register will
begin to collect events.
Reference Number: 327043-001
11
Introduction
Additional control bits include:
Applying a Threshold to Incoming Events: .thresh - since most counters can increment by a
value greater than 1, a threshold can be applied to generate an event based on the outcome of the
comparison. If the .thresh is set to a non-zero value, that value is compared against the incoming
count for that event in each cycle. If the incoming count is >= the threshold value, then the event
count captured in the data register will be incremented by 1.
Using the threshold field to generate additional events can be particularly useful when applied to a
queue occupancy count. For example, if a queue is known to contain eight entries, it may be useful to
know how often it contains 6 or more entires (i.e. Almost Full) or when it contains 1 or more entries
(i.e. Not Empty).
Note:
The .invert and .edge_det bits follow the threshold comparison in sequence. If a user
wishes to apply these bits to events that only increment by 1 per cycle, .thresh must be
set to 0x1.
Inverting the Threshold Comparison: .invert - Changes the .thresh test condition to ‘<‘.
Counting State Transitions Instead of per-Cycle Events: .edge_det - Rather than accumulating
the raw count each cycle (for events that can increment by 1 per cycle), the register can capture
transitions from no event to an event incoming (i.e. the ‘Rising Edge’).
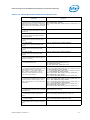
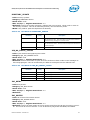
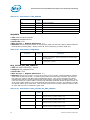
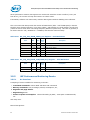
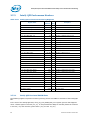
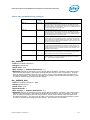
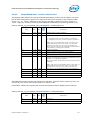
1.5
Uncore PMU Summary Tables
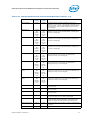
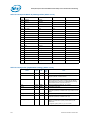
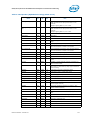
Following is a list of the registers provided in the Uncore for Performance Monitoring. It should be
noted that the PMON interfaces are split between MSR space (U, CBo and PCU) and PCICFG space.
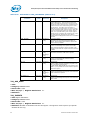
Table 1-2.
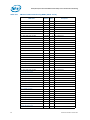
MSR Space Uncore Performance Monitoring Registers (Sheet 1 of 2)
Box
MSR Addresses
Description
C-Box Counters
C-Box 7
0xDF9-0xDF6
0xDF4
0xDF3-0xDF0
0xDE4
C-Box 6
0xDD9-0xDD6
0xDD4
0xDD3-0xDD0
0xDC4
C-Box 5
0xDB9-0xDB6
0xDB4
0xDB3-0xDB0
0xDA4
C-Box 4
0xD99-0xD96
0xD94
0xD93-0xD90
0xD84
C-Box 3
0xD79-0xD76
0xD74
0xD73-0xD70
12
Counter Registers
Counter Filters
Counter Config Registers
Box Control
Counter Registers
Counter Filters
Counter Config Registers
Box Control
Counter Registers
Counter Filters
Counter Config Registers
Box Control
Counter Registers
Counter Filters
Counter Config Registers
Box Control
Counter Registers
Counter Filters
Counter Config Registers
Reference Number: 327043-001
Introduction
Table 1-2.
MSR Space Uncore Performance Monitoring Registers (Sheet 2 of 2)
Box
MSR Addresses
Description
0xD64
C-Box 2
0xD59-0xD56
0xD54
0xD53-0xD50
0xD44
C-Box 1
0xD39-0xD36
0xD34
0xD33-0xD30
0xD24
C-Box 0
0xD19-0xD16
0xD14
0xD13-0xD10
0xD04
Box Control
Counter Registers
Counter Filters
Counter Config Registers
Box Control
Counter Registers
Counter Filters
Counter Config Registers
Box Control
Counter Registers
Counter Filters
Counter Config Registers
Box Control
PCU Counters
0xC39-0xC36
Counter Registers
0xC24
Box Control
0xC34
Counter Filters
0xC33-0xC30
Counter Config Registers
0x3FC-0x3FD
Fixed Counters (Non-PMON)
0xC17-0xC16
Counter Registers
0xC11-0xC10
Counter Config Registers
0xC09-0xC08
Fixed Counter/Config Register
U-Box Counters
For U-Box
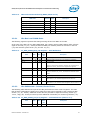
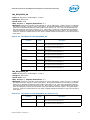
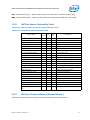
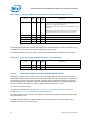
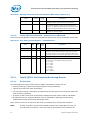
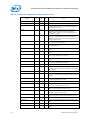
Table 1-3.
PCICFG Space Uncore Performance Monitoring Registers (Sheet 1 of 2)
Box
PCICFG Register
Addresses
Description
R3QPI
D19:F5,6
F(5,6) for Link 0,1
F4
R2PCIe
Counter Config Registers
B4-A0
Counter Registers
D19:F1
F4
iMC
Reference Number: 327043-001
Box Control
E0-D8
Box Control
E4-D8
Counter Config Registers
BC-A0
Counter Registers
F(0,1,4,5) For Channel 0,1,2,3
D16:F0,1,4,5
F4
Box Control
F0
Counter Config Register (Fixed)
13
Introduction
Table 1-3.
PCICFG Space Uncore Performance Monitoring Registers (Sheet 2 of 2)
Box
PCICFG Register
Addresses
Description
E4-D8
HA
D4-D0
Counter Register (Fixed)
BC-A0
Counter Registers (General)
D14:F1
F4
QPI
QPI Misc
Counter Config Registers
BC-A0
Counter Registers
48-40
Opcode/Addr Match Filters
D8,9:F2
D(8,9) for Port 0,1
Box Control
E4-D8
Counter Config Registers
BC-A0
Counter Registers
D8,9:F6
D(8,9) for Port 0,1
23C-238
Mask 0,1
22C-228
Match 0,1
D8,9:F0
D(8,9) for Port 0,1
D4
1.6
Box Control
E4-D8
F4
QPI Mask/Match
Counter Config Registers (General)
QPI Rate Status
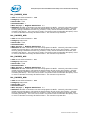
On Parsing and Using Derived Events
For many of the sections in the chapter covering the Performance Monitoring capabilites of each box,
a set of commonly measured metrics or ‘Derived Events’ have been included. For the most part,
these derived events are simple mathetmatical combinations of events found within the box. (e.g.
[SAMPLE]) However, there are some extensions to the notation used by the metrics.
Following is a breakdown of a Derived Event to illustrate many of the notations used. To calculcate
“Average Number of Data Read Entries that Miss the LLC when the TOR is not empty”.
(TOR_OCCUPANCY.MISS_OPCODE / COUNTER0_OCCUPANCY{edge_det,thresh=0x1}))
with:Cn_MSR_PMON_BOX_FILTER.opc=0x182.
Requires programming an extra control register (often for filtering):
• For a single field: with:Register_Name.field=value1
• For multiple fields: with:Register_Name.{field1,field2,...}={value1,value2,...}
• e.g., with:Cn_MSR_PMON_BOX_FILTER.{opc,nid}={0x182,my_node}
Requires reading a fixed data register
• For the case where the metric requires the information contained in a fixed data register, the
pnemonic for the register will be included in the equation. Software will be responsible for
configuring the data register and setting it to start counting with the other events used by the
metric.
14
Reference Number: 327043-001
Introduction
• e.g., POWER_THROTTLE_CYCLES.RANKx / MC_Chy_PCI_PMON_CTR_FIXED
Requires more input to software to determine the specific event/subevent
• In some cases, there may be multiple events/subevents that cover the same information across
multiple like hardware units. Rather than manufacturing a derived event for each combination,
the derived event will use a lower case variable in the event name.
• e.g., POWER_CKE_CYCLES.RANKx / MC_Chy_PCI_PMON_CTR_FIXED where ‘x’ is a variable to cover
events POWER_CKE_CYCLES.RANK0 through POWER_CKE_CYCLES.RANK7
Requires setting extra control bits in the register the event has been programmed in:
• event_name[.subevent_name]{ctrl_bit[=value],}
• e.g., COUNTER0_OCCUPANCY{edge_det,thresh=0x1}
NOTE: If there is no [=value] specified it is assumed that the bit must be set to 1.
Requires gathering of extra information outside the box (often for common terms):
• See following section for a breakdown of common terms found in Derived Events.
1.6.1
On Common Terms found in Derived Events
To convert a Latency term from a count of clocks to a count of nanoseconds:
• (Latency Metric) - {Box}_CLOCKTICKS * (1000 / UNCORE_FREQUENCY)
To convert a Bandwidth term from a count of raw bytes at the operating clock to GB/sec:
• ((Traffic Metric in Bytes) / (SAMPLE_INTERVAL / (TSC_SPEED * 1000000))) /
GB_CONVERSION
• e.g., For READ_MEM_BW, an event derived from iMC:CAS_COUNT.RD * 64, which is the amount
of memory bandwidth consumed by read requests, put ‘READ_MEM_BW’ into the bandwidth term
to convert the measurement from raw bytes to GB/sec.
Following are some other terms that may be found within Metrics and how they should be interpreted.
• GB_CONVERSION: 1024^3
• TSC_SPEED: Time Stamp Counter frequency in MHz
• SAMPLE_INTERVAL = TSC end time - TSC start time.
§
Reference Number: 327043-001
15
Introduction
16
Reference Number: 327043-001
Intel® Xeon® Processor E5-2600 Product Family Uncore Performance Monitoring
2
Intel® Xeon® Processor E52600 Product Family Uncore
Performance Monitoring
2.1
Uncore Per-Socket Performance Monitoring
Control
The uncore PMON does not support interrupt based sampling. To manage the large number of counter
registers distributed across many units and collect event data efficiently, this section describes the
hierarchical technique to start/stop/restart event counting that a software agent may need to perform
during a monitoring session.
2.1.1
Setting up a Monitoring Session
On HW reset, all the counters are disabled. Enabling is hierarchical. So the following steps, which
include programming the event control registers and enabling the counters to begin collecting events,
must be taken to set up a monitoring session. Section 2.1.2 covers the steps to stop/re-start counter
registers during a monitoring session.
For each box in which events will be measured: Skip (a) and (b) for U-Box monitoring.
a) Enable each box to accept the freeze signal to start/stop/re-start all counter registers in that box
e.g., set Cn_MSR_PMON_BOX_CTL.frz_en to 1
Note:
Recommended: set the .frz_en bits during the setup phase for each box a user intends
to monitor, and left alone for the duration of the monitoring session.
b) Freeze the box’s counters while setting up the monitoring session.
e.g., set Cn_MSR_PMON_BOX_CTL.frz to 1
For each event to be measured within each box:
c) Enable counting for each monitor
e.g. Set C0_MSR_PMON_CTL2.en to 1
Note:
Recommended: set the .en bit for all counters in each box a user intends to monitor,
and left alone for the duration of the monitoring session.
d) Select event to monitor if the event control register hasn’t been programmed:
Reference Number: 327043-001
17
Intel® Xeon® Processor E5-2600 Product Family Uncore Performance Monitoring
Program the .ev_sel and .umask bits in the control register with the encodings necessary to capture
the requested event along with any signal conditioning bits (.thresh/.edge_det/.invert) used to qualify
the event.
e.g., Set C0_MSR_PMON_CT2.{ev_sel, umask} to {0x03, 0x1} in order to capture
LLC_VICTIMS.M_STATE in CBo 0’s C0_MSR_PMON_CTR2.
Note:
It is also important to program any additional filter registers used to further qualify the
events (e.g., setting the opcode match field in Cn_MSR_BOX_FILTER to qualify
TOR_INSERTS by a specific opcode).
Back to the box level:
e) Reset counters in each box to ensure no stale values have been acquired from previous sessions.
• For each CBo, set Cn_MSR_PMON_BOX_CTL[1:0] to 0x2.
• For each Intel® QPI Port, set Q_Py_PCI_PMON_BOX_CTL[1:0] to 0x2.
• Set PCU_MSR_PMON_BOX_CTL[1:0] to 0x2.
• For each Link, set R3QPI_PCI_PMON_BOX_CTL[1:0] to 0x2.
• Set R2PCIE_PCI_PMON_BOX_CTL[1:0] to 0x2.
Note:
The UBox does not have a Unit Control register and neither the iMC nor the HA have a
reset bit in their Unit Control register. The counters in the UBox, the HA each populated
DRAM channel in the iMC will need to be manually reset by writing a 0 in each data
register.
Back to the box level:
f) Commence counting at the box level by unfreezing the counters in each box
e.g., set Cn_MSR_PMON_BOX_CTL.frz to 0
And with that, counting will begin.
Note:
The UBox does not have a Unit Control register. Once enabled and programmed with a
valid event, they will be collecting events. For somewhat better synchronization, a user
can keep the U_MSR_PMON_CTL.ev_sel at 0x0 while enabled and write it with a valid
value just prior to unfreezing the registers in other boxes.
2.1.2
Reading the Sample Interval
Software can poll the counters whenever it chooses.
a) Polling - before reading, it is recommended that software freeze the counters in each box in which
counting is to take place (by setting *_PMON_BOX_CTL.frz_en and .frz to 1). After reading the event
counts from the counter registers, the monitoring agent can choose to reset the event counts to avoid
event-count wrap-around; or resume the counter register without resetting their values. The latter
choice will require the monitoring agent to check and adjust for potential wrap-around situations.
18
Reference Number: 327043-001
Intel® Xeon® Processor E5-2600 Product Family Uncore Performance Monitoring
2.2
UBox Performance Monitoring
2.2.1
Overview of the UBox
The UBox serves as the system configuration controller for the Intel Xeon Processor E5-2600 family
uncore.
In this capacity, the UBox acts as the central unit for a variety of functions:
• The master for reading and writing physically distributed registers across the uncore using the
Message Channel.
• The UBox is the intermediary for interrupt traffic, receiving interrupts from the sytem and
dispatching interrupts to the appropriate core.
• The UBox serves as the system lock master used when quiescing the platform (e.g., Intel® QPI
bus lock).
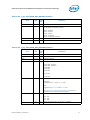
2.2.2
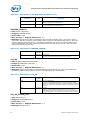
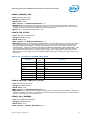
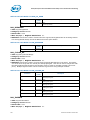
UBox Performance Monitoring Overview
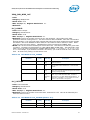
The UBox supports event monitoring through two programmable 44-bit wide counters
(U_MSR_PMON_CTR{1:0}), and a 48-bit fixed counter which increments each u-clock. Each of these
counters can be programmed (U_MSR_PMON_CTL{1:0}) to monitor any UBox event.
For information on how to setup a monitoring session, refer to Section 2.1, “Uncore Per-Socket
Performance Monitoring Control”.
2.2.3
UBox Performance Monitors
Table 2-1.
UBox Performance Monitoring MSRs
MSR
Address
Size
(bits)
U_MSR_PMON_CTR1
0x0C17
64
U-Box PMON Counter 1
U_MSR_PMON_CTR0
0x0C16
64
U-Box PMON Counter 0
U_MSR_PMON_CTL1
0x0C11
64
U-Box PMON Control for Counter 1
U_MSR_PMON_CTL0
0x0C10
32
U-Box PMON Control for Counter 0
U_MSR_PMON_UCLK_FIXED_CTR
0x0C09
64
U-Box PMON UCLK Fixed Counter
U_MSR_PMON_UCLK_FIXED_CTL
0x0C08
32
U-Box PMON UCLK Fixed Counter Control
MSR Name
2.2.3.1
Description
UBox Box Level PMON State
The following registers represent the state governing all box-level PMUs in the UBox.
U
Reference Number: 327043-001
19
Intel® Xeon® Processor E5-2600 Product Family Uncore Performance Monitoring
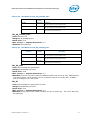
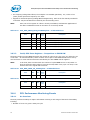
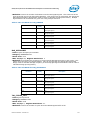
2.2.3.2
UBox PMON state - Counter/Control Pairs
The following table defines the layout of the UBox performance monitor control registers. The main
task of these configuration registers is to select the event to be monitored by their respective data
counter (.ev_sel, .umask). Additional control bits are provided to shape the incoming events (e.g.
.invert, .edge_det, .thresh) as well as provide additional functionality for monitoring software (.rst).
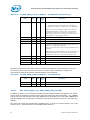
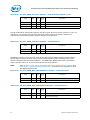
Table 2-2.
U_MSR_PMON_CTL{1-0} Register – Field Definitions
Field
Bits
Attr
0
Description
rsv
31:29
thresh
28:24
RW
0
Threshold used in counter comparison.
23
RW
0
Invert comparison against Threshold.
invert
RV
HW
Reset
Val
Reserved (?)
0 - comparison will be ‘is event increment >= threshold?’.
1 - comparison is inverted - ‘is event increment < threshold?’
NOTE: .invert is in series following .thresh, Due to this, the
.thresh field must be set to a non-0 value. For events that
increment by no more than 1 per cycle, set .thresh to 0x1.
Also, if .edge_det is set to 1, the counter will increment when a 1
to 0 transition (i.e. falling edge) is detected.
en
22
RW
0
Local Counter Enable.
rsv
21:20
RV
0
Reserved. SW must write to 0 for proper operation.
rsv
19
RV
0
Reserved (?)
edge_det
18
RW
0
When set to 1, rather than measuring the event in each cycle it
is active, the corresponding counter will increment when a 0 to 1
transition (i.e. rising edge) is detected.
When 0, the counter will increment in each cycle that the event
is asserted.
NOTE: .edge_det is in series following .thresh, Due to this, the
.thresh field must be set to a non-0 value. For events that
increment by no more than 1 per cycle, set .thresh to 0x1.
rst
17
WO
0
When set to 1, the corresponding counter will be cleared to 0.
umask
15:8
RW
0
Select subevents to be counted within the selected event.
ev_sel
7:0
RW
0
Select event to be counted.
The UBox performance monitor data registers are 44-bit wide. Should a counter overflow (a carry out
from bit 43), the counter will wrap and continue to collect events.
If accessible, software can continuously read the data registers without disabling event collection.
Table 2-3.
U_MSR_PMON_CTR{1-0} Register – Field Definitions
Field
rsv
event_count
Bits
Attr
HW
Reset
Val
Description
63:44
RV
0
Reserved (?)
43:0
RW-V
0
44-bit performance event counter
The Global UBox PMON registers also include a fixed counter that increments at UCLK for each cycle it
is enabled.
20
Reference Number: 327043-001
Intel® Xeon® Processor E5-2600 Product Family Uncore Performance Monitoring
Table 2-4.
U_MSR_PMON_FIXED_CTL Register – Field Definitions
Field
rsv
en
Table 2-5.
HW
Rese
t Val
Attr
31:23
RV
0
Description
Reserved (?)
22
RW
0
Enable counter when global enable is set.
rsv
21:20
RV
0
Reserved. SW must write to 0 for proper operation.
rsv
19:0
RV
0
Reserved (?)
U_MSR_PMON_FIXED_CTR Register – Field Definitions
Field
rsv
event_count
2.2.4
Bits
Bits
Attr
HW
Reset
Val
Description
63:44
RV
0
Reserved (?)
43:0
RW-V
0
48-bit performance event counter
UBox Performance Monitoring Events
The set of events that can be monitored in the UBox are summarized in Section 2.2.
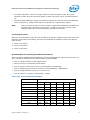
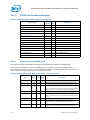
2.2.5
UBOX Box Events Ordered By Code
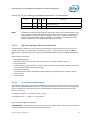
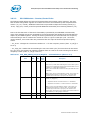
The following table summarizes the directly measured UBOX Box events.
Table 2-6.
Performance Monitor Events for UBOX
Event
Code
Extra
Select
Bit
Ctrs
Max
Inc/
Cyc
EVENT_MSG
0x42
0
0-1
1
VLW Received
LOCK_CYCLES
0x44
0
0-1
1
IDI Lock/SplitLock Cycles
Symbol Name
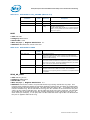
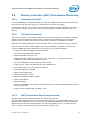
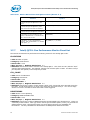
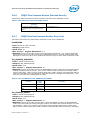
2.2.6
Description
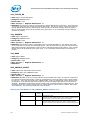
UBOX Box Performance Monitor Event List
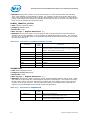
The section enumerates the uncore performance monitoring events for the UBOX Box.
EVENT_MSG
•
•
•
•
•
Title: VLW Received
Category: EVENT_MSG Events
Event Code: 0x42
Max. Inc/Cyc: 1, Register Restrictions: 0-1
Definition: Virtual Logical Wire (legacy) message were received from Uncore.
to filter on using NCUPMONCTRLGLCTR.ThreadID.
Reference Number: 327043-001
Specify the thread
21
Intel® Xeon® Processor E5-2600 Product Family Uncore Performance Monitoring
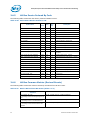
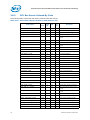
Table 2-7.
Unit Masks for EVENT_MSG
Extension
umask
[15:8]
VLW_RCVD
bxxxxxxx1
MSI_RCVD
bxxxxxx1x
IPI_RCVD
bxxxxx1xx
DOORBELL_RCVD
bxxxx1xxx
INT_PRIO
bxxx1xxxx
Description
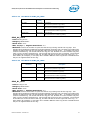
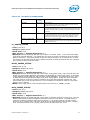
LOCK_CYCLES
•
•
•
•
•
Title: IDI Lock/SplitLock Cycles
Category: LOCK Events
Event Code: 0x44
Max. Inc/Cyc: 1, Register Restrictions: 0-1
Definition: Number of times an IDI Lock/SplitLock sequence was started
2.3
Caching Agent (Cbo) Performance Monitoring
2.3.1
Overview of the CBo
The LLC coherence engine (CBo) manages the interface between the core and the last level cache
(LLC). All core transactions that access the LLC are directed from the core to a CBo via the ring
interconnect. The CBo is responsible for managing data delivery from the LLC to the requesting core.
It is also responsible for maintaining coherence between the cores within the socket that share the
LLC; generating snoops and collecting snoop responses from the local cores when the MESIF protocol
requires it.
So, if the CBo fielding the core request indicates that a core within the socket owns the line (for a
coherent read), the request is snooped to that local core. That same CBo will then snoop all peers
which might have the address cached (other cores, remote sockets, etc) and send the request to the
appropriate Home Agent for conflict checking, memory requests and writebacks.
In the process of maintaining cache coherency within the socket, the CBo is the gate keeper for all
Intel® QuickPath Interconnect (Intel® QPI) messages that originate in the core and is responsible for
ensuring that all Intel® QPI messages that pass through the socket’s LLC remain coherent.
The CBo manages local conflicts by ensuring that only one request is issued to the system for a
specific cacheline.
The uncore contains up to eight instances of the CBo, each assigned to manage a distint 2.5MB slice
of the processor’s total LLC capacity. A slice that can be up to 20-way set associative. For processors
with fewer than 8 2.5MB LLC slices, the CBo Boxes or missing slices will still be active and track ring
traffic caused by their co-located core even if they have no LLC related traffic to track (i.e. hits/
misses/snoops).
Every physical memory address in the system is uniquely associated with a single CBo instance via a
proprietary hashing algorithm that is designed to keep the distribution of traffic across the CBo
instances relatively uniform for a wide range of possible address patterns. This enables the individual
CBo instances to operate independently, each managing its slice of the physical address space without
any CBo in a given socket ever needing to communicate with the other CBos in that same socket.
22
Reference Number: 327043-001
Intel® Xeon® Processor E5-2600 Product Family Uncore Performance Monitoring
2.3.2
CBo Performance Monitoring Overview
Each of the CBos in the uncore supports event monitoring through four 44-bit wide counters
(Cn_MSR_PMON_CTR{3:0}). Event programming in the CBo is restricted such that each events can
only be measured in certain counters within the CBo. For example, counter 0 is dedicated to
occupancy events. No other counter may be used to capture occupancy events.
• Counter 0: Queue-occupancy-enabled counter that tracks all events
• Counter 1: Basic counter that tracks all but queue occupancy events
• Counter 2: Basic counter that tracks ring events and the occupancy companion event
(COUNTER0_EVENT).
• Counter 3: Basic counter that tracks ring events and the occupancy companion event
(COUNTER0_EVENT).
CBo counter 0 can increment by a maximum of 20 per cycle; counters 1-3 can increment by 1 per
cycle.
Some uncore performance events that monitor transaction activities require additional details that
must be programmed in a filter register. Each Cbo provides one filter register and allows only one
such event be programmed at a given time, see Section 2.3.3.3.
For information on how to setup a monitoring session, refer to Section 2.1, “Uncore Per-Socket
Performance Monitoring Control”.
2.3.2.1
Special Note on CBo Occupancy Events
Although only counter 0 supports occupancy events, it is possible to program coounters 1-3 to
monitor the same occupancy event by selecting the “OCCUPANCY_COUNTER0” event code on
counters 1-3.
This allows:
• Thresholding on all four counters.
While one can monitor no more than one queue at a time, it is possible to setup different queue
occupancy thresholds on each of the four counters. For example, if one wanted to monitor the
IRQ, one could setup thresholds of 1, 7, 14, and 18 to get a picture of the time spent at different
occupancies in the IRQ.
• Average Latency and Average Occupancy
It can be useful to monitor the average occupancy in a queue as well as the average number of
items in the queue. One could program counter 0 to accumulate the occupancy, counter 1 with
the queue’s allocations event, and counter 2 with the OCCUPANCY_COUNTER0 event and a
threshold of 1. Latency could then be calculated by counter 0 / counter 1, and occupancy by
counter 0 / counter 2.
Reference Number: 327043-001
23
Intel® Xeon® Processor E5-2600 Product Family Uncore Performance Monitoring
2.3.3
CBo Performance Monitors
Table 2-8.
CBo Performance Monitoring MSRs (Sheet 1 of 4)
MSR Name
MSR
Address
Size
(bits)
Description
CBo 0 PMON Registers
Generic Counters
C0_MSR_PMON_CTR3
0x0D19
64
CBo 0 PMON Counter 3
C0_MSR_PMON_CTR2
0x0D18
64
CBo 0 PMON Counter 2
C0_MSR_PMON_CTR1
0x0D17
64
CBo 0 PMON Counter 1
C0_MSR_PMON_CTR0
0x0D16
64
CBo 0 PMON Counter 0
Box-Level Filter
C0_MSR_PMON_BOX_FILTER
0x0D14
32
CBo 0 PMON Filter
Generic Counter Control
C0_MSR_PMON_CTL3
0x0D13
32
CBo 0 PMON Control for Counter 3
C0_MSR_PMON_CTL2
0x0D12
32
CBo 0 PMON Control for Counter 2
C0_MSR_PMON_CTL1
0x0D11
32
CBo 0 PMON Control for Counter 1
C0_MSR_PMON_CTL0
0x0D10
32
CBo 0 PMON Control for Counter 0
Box-Level Control/Status
C0_MSR_PMON_BOX_CTL
0x0D04
32
CBo 0 PMON Box-Wide Control
CBo 1 PMON Registers
Generic Counters
C1_MSR_PMON_CTR3
0x0D39
64
CBo 1 PMON Counter 3
C1_MSR_PMON_CTR2
0x0D38
64
CBo 1 PMON Counter 2
C1_MSR_PMON_CTR1
0x0D37
64
CBo 1 PMON Counter 1
C1_MSR_PMON_CTR0
0x0D36
64
CBo 1 PMON Counter 0
Box-Level Filter
C1_MSR_PMON_BOX_FILTER
0x0D34
32
CBo 1 PMON Filter
Generic Counter Control
C1_MSR_PMON_CTL3
0x0D33
32
CBo 1 PMON Control for Counter 3
C1_MSR_PMON_CTL2
0x0D32
32
CBo 1 PMON Control for Counter 2
C1_MSR_PMON_CTL1
0x0D31
32
CBo 1 PMON Control for Counter 1
C1_MSR_PMON_CTL0
0x0D30
32
CBo 1 PMON Control for Counter 0
Box-Level Control/Status
C1_MSR_PMON_BOX_CTL
0x0D24
32
CBo 1 PMON Box-Wide Control
CBo 2 PMON Registers
Generic Counters
C2_MSR_PMON_CTR3
0x0D59
64
CBo 2 PMON Counter 3
C2_MSR_PMON_CTR2
0x0D58
64
CBo 2 PMON Counter 2
C2_MSR_PMON_CTR1
0x0D57
64
CBo 2 PMON Counter 1
C2_MSR_PMON_CTR0
0x0D56
64
CBo 2 PMON Counter 0
Box-Level Filter
24
Reference Number: 327043-001
Intel® Xeon® Processor E5-2600 Product Family Uncore Performance Monitoring
Table 2-8.
CBo Performance Monitoring MSRs (Sheet 2 of 4)
MSR Name
C2_MSR_PMON_BOX_FILTER
MSR
Address
Size
(bits)
0x0D54
32
Description
CBo 2 PMON Filter
Generic Counter Control
C2_MSR_PMON_CTL3
0x0D53
32
CBo 2 PMON Control for Counter 3
C2_MSR_PMON_CTL2
0x0D52
32
CBo 2 PMON Control for Counter 2
C2_MSR_PMON_CTL1
0x0D51
32
CBo 2 PMON Control for Counter 1
C2_MSR_PMON_CTL0
0x0D50
32
CBo 2 PMON Control for Counter 0
Box-Level Control/Status
C2_MSR_PMON_BOX_CTL
0x0D44
32
CBo 2 PMON Box-Wide Control
CBo 3 PMON Registers
Generic Counters
C3_MSR_PMON_CTR3
0x0D79
64
CBo 3 PMON Counter 3
C3_MSR_PMON_CTR2
0x0D78
64
CBo 3 PMON Counter 2
C3_MSR_PMON_CTR1
0x0D77
64
CBo 3 PMON Counter 1
C3_MSR_PMON_CTR0
0x0D76
64
CBo 3 PMON Counter 0
Box-Level Filter
C3_MSR_PMON_BOX_FILTER
0x0D74
32
CBo 3 PMON Filter
Generic Counter Control
C3_MSR_PMON_CTL3
0x0D73
32
CBo 3 PMON Control for Counter 3
C3_MSR_PMON_CTL2
0x0D72
32
CBo 3 PMON Control for Counter 2
C3_MSR_PMON_CTL1
0x0D71
32
CBo 3 PMON Control for Counter 1
C3_MSR_PMON_CTL0
0x0D70
32
CBo 3 PMON Control for Counter 0
Box-Level Control/Status
C3_MSR_PMON_BOX_CTL
0x0D64
32
CBo 3 PMON Box-Wide Control
CBo 4 PMON Registers
Generic Counters
C4_MSR_PMON_CTR3
0x0D99
64
CBo 4 PMON Counter 3
C4_MSR_PMON_CTR2
0x0D98
64
CBo 4 PMON Counter 2
C4_MSR_PMON_CTR1
0x0D97
64
CBo 4 PMON Counter 1
C4_MSR_PMON_CTR0
0x0D96
64
CBo 4 PMON Counter 0
Box-Level Filter
C4_MSR_PMON_BOX_FILTER
0x0D94
32
CBo 4 PMON Filter
Generic Counter Control
C4_MSR_PMON_CTL3
0x0D93
32
CBo 4 PMON Control for Counter 3
C4_MSR_PMON_CTL2
0x0D92
32
CBo 4 PMON Control for Counter 2
C4_MSR_PMON_CTL1
0x0D91
32
CBo 4 PMON Control for Counter 1
C4_MSR_PMON_CTL0
0x0D90
32
CBo 4 PMON Control for Counter 0
Box-Level Control/Status
C4_MSR_PMON_BOX_CTL
Reference Number: 327043-001
0x0D84
32
CBo 4 PMON Box-Wide Control
25
Intel® Xeon® Processor E5-2600 Product Family Uncore Performance Monitoring
Table 2-8.
CBo Performance Monitoring MSRs (Sheet 3 of 4)
MSR Name
MSR
Address
Size
(bits)
Description
CBo 5 PMON Registers
Generic Counters
C5_MSR_PMON_CTR3
0x0DB9
64
CBo 5 PMON Counter 3
C5_MSR_PMON_CTR2
0x0DB8
64
CBo 5 PMON Counter 2
C5_MSR_PMON_CTR1
0x0DB7
64
CBo 5 PMON Counter 1
C5_MSR_PMON_CTR0
0x0DB6
64
CBo 5 PMON Counter 0
Box-Level Filter
C5_MSR_PMON_BOX_FILTER
0x0DB4
32
CBo 5 PMON Filter
Generic Counter Control
C5_MSR_PMON_CTL3
0x0DB3
32
CBo 5 PMON Control for Counter 3
C5_MSR_PMON_CTL2
0x0DB2
32
CBo 5 PMON Control for Counter 2
C5_MSR_PMON_CTL1
0x0DB1
32
CBo 5 PMON Control for Counter 1
C5_MSR_PMON_CTL0
0x0DB0
32
CBo 5 PMON Control for Counter 0
Box-Level Control/Status
C5_MSR_PMON_BOX_CTL
0x0DA4
32
CBo 5 PMON Box-Wide Control
CBo 6 PMON Registers
Generic Counters
C6_MSR_PMON_CTR3
0x0DD9
64
CBo 6 PMON Counter 3
C6_MSR_PMON_CTR2
0x0DD8
64
CBo 6 PMON Counter 2
C6_MSR_PMON_CTR1
0x0DD7
64
CBo 6 PMON Counter 1
C6_MSR_PMON_CTR0
0x0DD6
64
CBo 6 PMON Counter 0
Box-Level Filter
C6_MSR_PMON_BOX_FILTER
0x0DD4
32
CBo 6 PMON Filter
Generic Counter Control
C6_MSR_PMON_CTL3
0x0DD3
32
CBo 6 PMON Control for Counter 3
C6_MSR_PMON_CTL2
0x0DD2
32
CBo 6 PMON Control for Counter 2
C6_MSR_PMON_CTL1
0x0DD1
32
CBo 6 PMON Control for Counter 1
C6_MSR_PMON_CTL0
0x0DD0
32
CBo 6 PMON Control for Counter 0
Box-Level Control/Status
C6_MSR_PMON_BOX_CTL
0x0DC4
32
CBo 6 PMON Box-Wide Control
CBo 7 PMON Registers
Generic Counters
C7_MSR_PMON_CTR3
0x0DF9
64
CBo 7 PMON Counter 3
C7_MSR_PMON_CTR2
0x0DF8
64
CBo 7 PMON Counter 2
C7_MSR_PMON_CTR1
0x0DF7
64
CBo 7 PMON Counter 1
C7_MSR_PMON_CTR0
0x0DF6
64
CBo 7 PMON Counter 0
Box-Level Filter
C7_MSR_PMON_BOX_FILTER
0x0DF4
32
CBo 7 PMON Filter
Generic Counter Control
26
Reference Number: 327043-001
Intel® Xeon® Processor E5-2600 Product Family Uncore Performance Monitoring
Table 2-8.
CBo Performance Monitoring MSRs (Sheet 4 of 4)
MSR
Address
MSR Name
Size
(bits)
Description
C7_MSR_PMON_CTL3
0x0DF3
32
CBo 7 PMON Control for Counter 3
C7_MSR_PMON_CTL2
0x0DF2
32
CBo 7 PMON Control for Counter 2
C7_MSR_PMON_CTL1
0x0DF1
32
CBo 7 PMON Control for Counter 1
C7_MSR_PMON_CTL0
0x0DF0
32
CBo 7 PMON Control for Counter 0
Box-Level Control/Status
C7_MSR_PMON_BOX_CTL
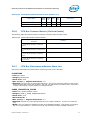
2.3.3.1
0x0DE4
32
CBo 7 PMON Box-Wide Control
CBo Box Level PMON State
The following registers represent the state governing all box-level PMUs in the CBo.
In the case of the CBo, the Cn_MSR_PMON_BOX_CTL register governs what happens when a freeze
signal is received (.frz_en). It also provides the ability to manually freeze the counters in the box
(.frz) and reset the generic state (.rst_ctrs and .rst_ctrl).
Table 2-9.
Cn_MSR_PMON_BOX_CTL Register – Field Definitions
Field
rsv
Bits
Attr
31:18
RV
HW
Reset
Val
0
Description
Reserved (?)
rsv
17
RV
0
Reserved; SW must write to 0 else behavior is undefined.
frz_en
16
WO
0
Freeze Enable.
If set to 1 and a freeze signal is received, the counters will be
stopped or ‘frozen’, else the freeze signal will be ignored.
rsv
15:9
RV
0
Reserved (?)
frz
8
WO
0
Freeze.
If set to 1 and the .frz_en is 1, the counters in this box will be
frozen.
rsv
7:2
RV
0
Reserved (?)
rst_ctrs
1
WO
0
Reset Counters.
When set to 1, the Counter Registers will be reset to 0.
rst_ctrl
0
WO
0
Reset Control.
When set to 1, the Counter Control Registers will be reset to 0.
U
2.3.3.2
CBo PMON state - Counter/Control Pairs
The following table defines the layout of the CBo performance monitor control registers. The main
task of these configuration registers is to select the event to be monitored by their respective data
counter (.ev_sel, .umask). Additional control bits are provided to shape the incoming events (e.g.
.invert, .edge_det, .thresh) as well as provide additional functionality for monitoring software (.rst).
Table 2-10. Cn_MSR_PMON_CTL{3-0} Register – Field Definitions (Sheet 1 of 2)
Field
thresh
Reference Number: 327043-001
Bits
Attr
31:24
RW-V
HW
Reset
Val
Description
0
Threshold used in counter comparison.
27
Intel® Xeon® Processor E5-2600 Product Family Uncore Performance Monitoring
Table 2-10. Cn_MSR_PMON_CTL{3-0} Register – Field Definitions (Sheet 2 of 2)
Field
invert
Bits
23
Attr
RW-V
HW
Reset
Val
0
Description
Invert comparison against Threshold.
0 - comparison will be ‘is event increment >= threshold?’.
1 - comparison is inverted - ‘is event increment < threshold?’
NOTE: .invert is in series following .thresh, Due to this, the
.thresh field must be set to a non-0 value. For events that
increment by no more than 1 per cycle, set .thresh to 0x1.
Also, if .edge_det is set to 1, the counter will increment when a 1
to 0 transition (i.e. falling edge) is detected.
en
22
rsv
RW-V
0
Local Counter Enable.
21:20
RV
0
Reserved; SW must write to 0 else behavior is undefined.
tid_en
19
RW-V
0
TID Filter Enable
edge_det
18
RW-V
0
When set to 1, rather than measuring the event in each cycle it
is active, the corresponding counter will increment when a 0 to 1
transition (i.e. rising edge) is detected.
When 0, the counter will increment in each cycle that the event
is asserted.
NOTE: .edge_det is in series following .thresh, Due to this, the
.thresh field must be set to a non-0 value. For events that
increment by no more than 1 per cycle, set .thresh to 0x1.
rst
17
WO
0
When set to 1, the corresponding counter will be cleared to 0.
rsv
16
RV
0
Reserved. SW must write to 0 else behavior is undefined.
umask
15:8
RW-V
0
Select subevents to be counted within the selected event.
ev_sel
7:0
RW-V
0
Select event to be counted.
The CBo performance monitor data registers are 44b wide. Should a counter overflow (a carry out
from bit 43), the counter will wrap and continue to collect events.If accessible, software can
continuously read the data registers without disabling event collection.
Table 2-11. Cn_MSR_PMON_CTR{3-0} Register – Field Definitions
Field
rsv
event_count
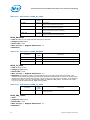
2.3.3.3
Bits
Attr
HW
Reset
Val
Description
63:44
RV
0
Reserved (?)
43:0
RW-V
0
44-bit performance event counter
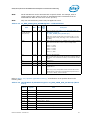
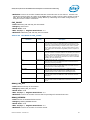
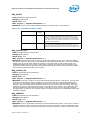
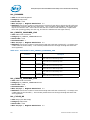
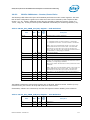
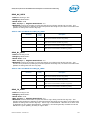
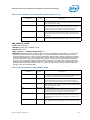
CBo Filter Register (Cn_MSR_PMON_BOX_FILTER)
In addition to generic event counting, each CBo provides a MATCH register that allows a user to filter
various traffic as it applies to specific events (see Event Section for more information). LLC_LOOKUP
may be filtered by the cacheline state, QPI_CREDITS may be filtered by link while TOR_INSERTS and
TOR_OCCUPANCY may be filtered by the opcode of the queued request as well as the corresponding
NodeID.
Any of the CBo events may be filtered by Thread/Core-ID. To do so, the control register’s .tid_en bit
must be set to 1 and the tid field in the FILTER register filled out.
28
Reference Number: 327043-001
Intel® Xeon® Processor E5-2600 Product Family Uncore Performance Monitoring
Note:
Not all transactions can be associated with a specific thread. For example, when a
snoop triggers a WB, it does not have an associated thread. Transactions that are
associated with PCIe will come from “0x1E” (b11110).
Note:
Only one of these filtering criteria may be applied at a time.
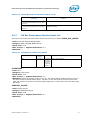
Table 2-12. Cn_MSR_PMON_BOX_FILTER Register – Field Definitions
Field
Bits
opc
(7b IDI Opcode?
w/top 2b 0x3)
31:23
Atrtr
RW
HW
Reset
Val
0
Description
Match on Opcode (see Table 2-13, “Opcode Match by
IDI Packet Type for
Cn_MSR_PMON_BOX_FILTER.opc”)
NOTE: Only tracks opcodes that come from the IRQ. It is not
possible to track snoops (from IPQ) or other transactions from
the ISMQ.
state
22:18
RW
0
Select state to monitor for LLC_LOOKUP event. Setting multiple
bits in this field will allow a user to track multiple states.
b1xxxx
bx1xxx
bxx1xx
bxxx1x
bxxxx1
-
‘F’ state.
‘M’ state
‘E’ state.
‘S’ state.
‘I’ state.
nid
17:10
0
0
Match on Target NodeID.
NID is a mask filter with each bit representing a different Node in
the system. 0x01 would filter on NID 0, 0x2 would filter on NID
1, etc
rsv
9:8
RV
0
Reserved (?)
rsv
7:5
RV
0
Reserved (?)
tid
4:0
0
0
[3:1] Core-ID
[0] Thread 1/0
When .tid_en is 0; the specified counter will count ALL events
Thread-ID 0xF is reserved for non-associated requests such as: LLC victims - PMSeq - External Snoops
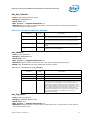
Refer to Table 2-144, “Opcodes (Alphabetical Listing)” for definitions of the opcodes found in the
following table.
Table 2-13. Opcode Match by IDI Packet Type for Cn_MSR_PMON_BOX_FILTER.opc (Sheet
1 of 2)
opc
Value
Opcode
Defn
0x180
RFO
Demand Data RFO
0x181
CRd
Demand Code Read
0x182
DRd
Demand Data Read
0x187
PRd
Partial Reads (UC)
0x18C
WCiLF
Streaming Store - Full
0x18D
WCiL
Streaming Store - Partial
0x190
PrefRFO
Prefetch RFO into LLC but don’t pass to L2. Includes Hints
0x191
PrefCode
Prefetch Code into LLC but don’t pass to L2. Includes Hints
0x192
PrefData
Prefetch Data into LLC but don’t pass to L2. Includes Hints
Reference Number: 327043-001
29
Intel® Xeon® Processor E5-2600 Product Family Uncore Performance Monitoring
Table 2-13. Opcode Match by IDI Packet Type for Cn_MSR_PMON_BOX_FILTER.opc (Sheet
2 of 2)
opc
Value
Opcode
Defn
0x194
PCIWiLF
PCIe Write (non-allocating)
0x195
PCIPRd
PCIe UC Read
0x19C
PCIItoM
PCIe Write (allocating)
0x19E
PCIRdCur
PCIe read current
0x1C4
WbMtoI
Request writeback Modified invalidate line
0x1C5
WbMtoE
Request writeback Modified set to Exclusive
0x1C8
ItoM
Request Invalidate Line
0x1E4
PCINSRd
PCIe Non-Snoop Read
0x1E5
PCINSWr
PCIe Non-Snoop Write (partial)
0x1E6
PCINSWrF
PCIe Non-Snoop Read (full)
2.3.4
CBo Performance Monitoring Events
2.3.4.1
An Overview:
The performance monitoring events within the CBo include all events internal to the LLC as well as
events which track ring related activity at the CBo/Core ring stops.
CBo performance monitoring events can be used to track LLC access rates, LLC hit/miss rates, LLC
eviction and fill rates, and to detect evidence of back pressure on the LLC pipelines. In addition, the
CBo has performance monitoring events for tracking MESI state transitions that occur as a result of
data sharing across sockets in a multi-socket system. And finally, there are events in the CBo for
tracking ring traffic at the CBo/Core sink inject points.
Every event in the CBo is from the point of view of the LLC and is not associated with any specific core
since all cores in the socket send their LLC transactions to all CBos in the socket. However, the PMON
logic in the CBo provides a thread-id field in the Cn_MSR_PMON_BOX_FILTER register which can be
applied to the CBo events to obtain the interactions between specific cores and threads.
There are separate sets of counters for each CBo instance. For any event, to get an aggregate count
of that event for the entire LLC, the counts across the CBo instances must be added together. The
counts can be averaged across the CBo instances to get a view of the typical count of an event from
the perspective of the individual CBos. Individual per-CBo deviations from the average can be used to
identify hot-spotting across the CBos or other evidences of non-uniformity in LLC behavior across the
CBos. Such hot-spotting should be rare, though a repetitive polling on a fixed physical address is one
obvious example of a case where an analysis of the deviations across the CBos would indicate hotspotting.
2.3.4.2
Acronyms frequently used in CBo Events:
The Rings:
AD (Address) Ring - Core Read/Write Requests and Intel QPI Snoops. Carries Intel QPI requests and
snoop responses from C to Intel® QPI.
BL (Block or Data) Ring - Data == 2 transfers for 1 cache line
30
Reference Number: 327043-001
Intel® Xeon® Processor E5-2600 Product Family Uncore Performance Monitoring
AK (Acknowledge) Ring - Acknowledges Intel® QPI to CBo and CBo to Core. Carries snoop responses
from Core to CBo.
IV (Invalidate) Ring - CBo Snoop requests of core caches
Internal CBo Queues:
IRQ - Ingress Request Queue on AD Ring. Associated with requests from core.
IPQ - Ingress Probe Queue on AD Ring. Associated with snoops from Intel® QPI LL.
ISMQ - Ingress Subsequent Messages (response queue). Associated with messages responses to
ingress requests (e.g. data responses, Intel QPI complete messages, core snoop response messages
and GO reset queue).
TOR - Table Of Requests. Tracks pending CBo transactions.
RxR (aka IGR) - “Receive from Ring” referring to Ingress (requests from the Cores) queues.
TxR (aka EGR) - “Transmit to Ring” referring to Egress (requests headed for the Ring) queues.
2.3.4.3
The Queues:
There are several internal occupancy queue counters, each of which is 5bits wide and dedicated to its
queue: IRQ, IPQ, ISMQ, QPI_IGR, IGR, EGR and the TOR.
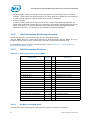
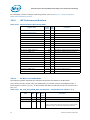
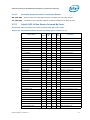
2.3.5
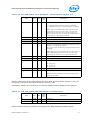
CBo Events Ordered By Code
The following table summarizes the directly measured CBO Box events.
Table 2-14. Performance Monitor Events for CBO (Sheet 1 of 2)
Event
Code
Ctrs
Max
Inc/
Cyc
CLOCKTICKS
0x00
0-3
1
Uncore Clocks
TxR_INSERTS
0x02
0-1
1
Egress Allocations
TxR_ADS_USED
0x04
0-1
1
RING_BOUNCES
0x05
0-1
1
RING_SRC_THRTL
0x07
0-1
1
RxR_OCCUPANCY
0x11
0
20
RxR_EXT_STARVED
0x12
0-1
1
Ingress Arbiter Blocking Cycles
RxR_INSERTS
0x13
0-1
1
Ingress Allocations
Symbol Name
Description
Number of LLC responses that bounced on
the Ring.
Ingress Occupancy
RING_AD_USED
0x1B
2-3
1
AD Ring In Use
RING_AK_USED
0x1C
2-3
1
AK Ring In Use
RING_BL_USED
0x1D
2-3
1
BL Ring in Use
RING_IV_USED
0x1E
2-3
1
BL Ring in Use
COUNTER0_OCCUPANCY
0x1F
1-3
20
ISMQ_DRD_MISS_OCC
0x21
0-1
20
RxR_IPQ_RETRY
0x31
0-1
1
Probe Queue Retries
RxR_IRQ_RETRY
0x32
0-1
1
Ingress Request Queue Rejects
Reference Number: 327043-001
Counter 0 Occupancy
31
Intel® Xeon® Processor E5-2600 Product Family Uncore Performance Monitoring
Table 2-14. Performance Monitor Events for CBO (Sheet 2 of 2)
Event
Code
Ctrs
Max
Inc/
Cyc
RxR_ISMQ_RETRY
0x33
0-1
1
ISMQ Retries
LLC_LOOKUP
0x34
0-1
1
Cache Lookups
TOR_INSERTS
0x35
0-1
1
TOR Inserts
TOR_OCCUPANCY
0x36
0
20
TOR Occupancy
LLC_VICTIMS
0x37
0-1
1
Lines Victimized
MISC
0x39
0-1
1
Cbo Misc
Symbol Name
2.3.6
Description
CBO Box Common Metrics (Derived Events)
The following table summarizes metrics commonly calculated from CBO Box events.
Table 2-15. Metrics Derived from CBO Events (Sheet 1 of 3)
Symbol Name:
Definition
32
Equation
AVG_INGRESS_DEPTH:
Average Depth of the Ingress Queue
through the sample interval
RxR_OCCUPANCY.IRQ / SAMPLE_INTERVAL
AVG_INGRESS_LATENCY:
Average Latency of Requests through the
Ingress Queue in Uncore Clocks
RxR_OCCUPANCY.IRQ / RxR_INSERTS.IRQ
AVG_INGRESS_LATENCY_WHEN_NE:
Average Latency of Requests through the
Ingress Queue in Uncore Clocks when Ingress
Queue has at least one entry
RxR_OCCUPANCY.IRQ /
COUNTER0.OCCUPANCY{edge_det,thresh=0x1}
AVG_TOR_DRDS_MISS_WHEN_NE:
Average Number of Data Read Entries that
Miss the LLC when the TOR is not empty.
(TOR_OCCUPANCY.MISS_OPCODE /
COUNTER0_OCCUPANCY{edge_det,thresh=0x1}))
with:Cn_MSR_PMON_BOX_FILTER.opc=0x182
AVG_TOR_DRDS_WHEN_NE:
Average Number of Data Read Entries when
the TOR is not empty.
(TOR_OCCUPANCY.OPCODE /
COUNTER0_OCCUPANCY{edge_det,thresh=0x1})
with:Cn_MSR_PMON_BOX_FILTER.opc=0x182
AVG_TOR_DRD_HIT_LATENCY:
Average Latency of Data Reads through the
TOR that hit the LLC
((TOR_OCCUPANCY.OPCODE TOR_OCCUPANCY.MISS_OPCODE) / (TOR_INSERTS.OPCODE TOR_INSERTS.MISS_OPCODE))
with:Cn_MSR_PMON_BOX_FILTER.opc=0x182
AVG_TOR_DRD_LATENCY:
Average Latency of Data Read Entries
making their way through the TOR
(TOR_OCCUPANCY.OPCODE / TOR_INSERTS.OPCODE)
with:Cn_MSR_PMON_BOX_FILTER.opc=0x182
AVG_TOR_DRD_LOC_MISS_LATENCY:
Average Latency of Data Reads through the
TOR that miss the LLC and were satsified by
Locally HOMed Memory. Only valid at
processor level == don't add counts across
Cbos. NOTE: Count imperfect. Will be
polluted by remote hits where memory's
home node is local memory.
(TOR_OCCUPANCY.MISS_OPCODE /
TOR_INSERTS.MISS_OPCODE)
with:Cn_MSR_PMON_BOX_FILTER.{opc,nid}={0x182,my_node
}
AVG_TOR_DRD_MISS_LATENCY:
Average Latency of Data Reads through the
TOR that miss the LLC
(TOR_OCCUPANCY.MISS_OPCODE /
TOR_INSERTS.MISS_OPCODE)
with:Cn_MSR_PMON_BOX_FILTER.opc=0x182
Reference Number: 327043-001
Intel® Xeon® Processor E5-2600 Product Family Uncore Performance Monitoring
Table 2-15. Metrics Derived from CBO Events (Sheet 2 of 3)
Symbol Name:
Definition
Equation
AVG_TOR_DRD_REM_MISS_LATENCY:
Average Latency of Data Reads through the
TOR that miss the LLC and were satsified by a
Remote cache or Remote Memory. Only valid
at processor level == don't add counts across
Cbos.
(TOR_OCCUPANCY.MISS_OPCODE /
TOR_INSERTS.MISS_OPCODE)
with:Cn_MSR_PMON_BOX_FILTER.{opc,nid}={0x182,other_no
des}
CYC_INGRESS_BLOCKED:
Cycles the Ingress Request Queue arbiter
was Blocked
RxR_EXT_STARVED.IRQ / SAMPLE_INTERVAL
CYC_INGRESS_STARVED:
Cycles the Ingress Request Queue was in
Internal Starvation
RxR_INT_STARVED.IRQ / SAMPLE_INTERVAL
CYC_USED_DNEVEN:
Cycles Used in the Down direction, Even
polarity
RING_BL_USED.DN_EVEN / SAMPLE_INTERVAL
CYC_USED_DNODD:
Cycles Used in the Down direction, Odd
polarity
RING_BL_USED.DN_ODD / SAMPLE_INTERVAL
CYC_USED_UPEVEN:
Cycles Used in the Up direction, Even
polarity
RING_BL_USED.UP_EVEN / SAMPLE_INTERVAL
CYC_USED_UPODD:
Cycles Used in the Up direction, Odd
polarity
RING_BL_USED.UP_ODD / SAMPLE_INTERVAL
INGRESS_REJ_V_INS:
Ratio of Ingress Request Entries that were
rejected vs. inserted
RxR_INSERTS.IRQ_REJECTED / RxR_INSERTS.IRQ
LLC_DRD_MISS_PCT:
LLC Data Read miss ratio
LLC_LOOKUP.DATA_READ
(Cn_MSR_PMON_BOX_FILTER.state=0x1) /
LLC_LOOKUP.DATA_READ
(Cn_MSR_PMON_BOX_FILTER.state=0x1F)
LLC_DRD_RFO_MISS_TO_LOC_MEM:
LLC Data Read and RFO misses satisfied by
locally HOMed memory. Only valid at
processor level == don't add counts across
Cbos. NOTE: Count imperfect. Will be
polluted by remote hits where memory's
home node is local memory.
(TOR_INSERTS.NID_MISS_OPCODE
with:Cn_MSR_PMON_BOX_FILTER.{opc,nid}={0x182,my_node
} + TOR_INSERTS.NID_MISS_OPCODE
with:Cn_MSR_PMON_BOX_FILTER.{opc,nid}={0x180,my_node
} ) / (TOR_INSERTS.NID_MISS_OPCODE
with:Cn_MSR_PMON_BOX_FILTER.{opc,nid}={0x182,0xF} +
TOR_INSERTS.NID_MISS_OPCODE
with:Cn_MSR_PMON_BOX_FILTER.{opc,nid}={0x180,0xF} )
LLC_DRD_RFO_MISS_TO_REM_MEM:
LLC Data Read and RFO misses satisfied by
a remote cache or remote memory. Only
valid at processor level == don't add counts
across Cbos.
(TOR_INSERTS.NID_MISS_OPCODE
with:Cn_MSR_PMON_BOX_FILTER.{opc,nid}={0x182,other_no
des} + TOR_INSERTS.NID_MISS_OPCODE
with:Cn_MSR_PMON_BOX_FILTER.{opc,nid}={0x180,other_no
des} ) / (TOR_INSERTS.NID_MISS_OPCODE
with:Cn_MSR_PMON_BOX_FILTER.{opc,nid}={0x182,0xF} +
TOR_INSERTS.NID_MISS_OPCODE
with:Cn_MSR_PMON_BOX_FILTER.{opc,nid}={0x180,0xF} )
LLC_MPI:
LLC Misses Per Instruction (code, read, RFO
and prefetches)
LLC_LOOKUP.ANY (Cn_MSR_PMON_BOX_FILTER.state=0x1) /
INST_RETIRED.ALL (on Core)
LLC_PCIE_DATA_BYTES:
LLC Miss Data from PCIe in Number of
Bytes
TOR_INSERTS.OPCODE
with:Cn_MSR_PMON_BOX_FILTER.opc=0x19C * 64
LLC_RFO_MISS_PCT:
LLC RFO Miss Ratio
(TOR_INSERTS.MISS_OPCODE / TOR_INSERTS.OPCODE)
with:Cn_MSR_PMON_BOX_FILTER.opc=0x180
MEM_WB_BYTES:
Data written back to memory in Number of
Bytes
LLC_VICTIMS.M_STATE * 64
Reference Number: 327043-001
33
Intel® Xeon® Processor E5-2600 Product Family Uncore Performance Monitoring
Table 2-15. Metrics Derived from CBO Events (Sheet 3 of 3)
Symbol Name:
Definition
Equation
PCIE_DATA_BYTES:
Data from PCIe in Number of Bytes
(TOR_INSERTS.OPCODE
with:Cn_MSR_PMON_BOX_FILTER.opc=0x194 +
TOR_INSERTS.OPCODE
with:Cn_MSR_PMON_BOX_FILTER.opc=0x19C) * 64
RING_THRU_DNEVEN_BYTES:
Ring throughput in the Down direction,
Even polarity in Bytes
RING_BL_USED.DN_EVEN * 32
RING_THRU_DNODD_BYTES:
Ring throughput in the Down direction, Odd
polarity in Bytes
RING_BL_USED.DN_ODD * 32
RING_THRU_UPEVEN_BYTES:
Ring throughput in the Up direction, Even
polarity in Bytes
RING_BL_USED.UP_EVEN * 32
RING_THRU_UPODD_BYTES:
Ring throughput in the Up direction, Odd
polarity in Bytes
RING_BL_USED.UP_ODD * 32
Note:
LLC_MPI only makes sense when measured either in the processor or at the system
level. There is no correlation between a specific CBo andthe instructions retired in a
specific core. Therefore it is necessary to add the LLC_LOOKUP term across all CBos
and divide by either all instructions retired in a core or all instructions retired across all
cores.
2.3.7
CBo Performance Monitor Event List
The section enumerates the performance monitoring events for the CBO Box.
CLOCKTICKS
•
•
•
•
•
Title: Uncore Clocks
Category: UCLK Events
Event Code: 0x00
Max. Inc/Cyc: 1, Register Restrictions: 0-3
Definition:
COUNTER0_OCCUPANCY
•
•
•
•
•
34
Title: Counter 0 Occupancy
Category: OCCUPANCY Events
Event Code: 0x1F
Max. Inc/Cyc: 20, Register Restrictions: 1-3
Definition: Since occupancy counts can only be captured in the Cbo's 0 counter, this event allows a
user to capture occupancy related information by filtering the Cb0 occupancy count captured in
Counter 0. The filtering available is found in the control register - threshold, invert and edge
detect. E.g. setting threshold to 1 can effectively monitor how many cycles the monitored queue
has an entry.
Reference Number: 327043-001
Intel® Xeon® Processor E5-2600 Product Family Uncore Performance Monitoring
ISMQ_DRD_MISS_OCC
•
•
•
•
•
Title:
Category: ISMQ Events
Event Code: 0x21
Max. Inc/Cyc: 20, Register Restrictions: 0-1
Definition:
LLC_LOOKUP
•
•
•
•
•
Title: Cache Lookups
Category: CACHE Events
Event Code: 0x34
Max. Inc/Cyc: 1, Register Restrictions: 0-1
Definition: Counts the number of times the LLC was accessed - this includes code, data,
prefetches and hints coming from L2. This has numerous filters available. Note the non-standard
filtering equation. This event will count requests that lookup the cache multiple times with multiple
increments. One must ALWAYS set filter mask bit 0 and select a state or states to match. Otherwise, the event will count nothing. CBoGlCtrl[22:18] bits correspond to [FMESI] state.
• NOTE: Bit 0 of the umask must always be set for this event. This allows us to match a given state
(or states). The state is programmed in Cn_MSR_PMON_BOX_FILTER.state. The state field is a bit
mask, so you can select (and monitor) multiple states at a time. 0 = I (miss), 1 = S, 2 = E, 3 = M,
4 = F. For example, if you wanted to monitor F and S hits, you could set 10010b in the 5-bit state
field. To monitor any lookup, set the field to 0x1F.
Table 2-16. Unit Masks for LLC_LOOKUP
Extension
umask
[15:8]
Filter Dep
Description
DATA_READ
b00000011
CBoFilter[2
2:18]
Data Read Request:
Read transactions
WRITE
b00000101
CBoFilter[2
2:18]
Write Requests:
This includes all write transactions -- both Cachable
and UC.
REMOTE_SNOOP
b00001001
CBoFilter[2
2:18]
External Snoop Request:
Filters for only snoop requests coming from the remote
socket(s) through the IPQ.
NID
b01000001
CBoFilter[2
2:18],
CBoFilter[1
7:10]
RTID:
Match a given RTID destination NID. The NID is
programmed in Cn_MSR_PMON_BOX_FILTER.nid. In
conjunction with STATE = I, it is possible to monitor
misses to specific NIDs in the system.
LLC_VICTIMS
•
•
•
•
•
Title: Lines Victimized
Category: CACHE Events
Event Code: 0x37
Max. Inc/Cyc: 1, Register Restrictions: 0-1
Definition: Counts the number of lines that were victimized on a fill. This can be filtered by the
state that the line was in.
Table 2-17. Unit Masks for LLC_VICTIMS (Sheet 1 of 2)
Extension
umask
[15:8]
Filter Dep
Description
M_STATE
bxxxxxxx1
Lines in M state
E_STATE
bxxxxxx1x
Lines in E state
Reference Number: 327043-001
35
Intel® Xeon® Processor E5-2600 Product Family Uncore Performance Monitoring
Table 2-17. Unit Masks for LLC_VICTIMS (Sheet 2 of 2)
Extension
umask
[15:8]
S_STATE
bxxxxx1xx
MISS
bxxxx1xxx
NID
bx1xxxxxx
Filter Dep
Description
Lines in S State
CBoFilter[1
7:10]
Victimized Lines that Match NID:
The NID is programmed in
Cn_MSR_PMON_BOX_FILTER.nid. In conjunction with
STATE = I, it is possible to monitor misses to specific
NIDs in the system.
MISC
•
•
•
•
•
Title: Cbo Misc
Category: MISC Events
Event Code: 0x39
Max. Inc/Cyc: 1, Register Restrictions: 0-1
Definition: Miscellaneous events in the Cbo.
Table 2-18. Unit Masks for MISC
Extension
umask
[15:8]
Description
RSPI_WAS_FSE
bxxxxxxx1
Silent Snoop Eviction:
Counts the number of times when a Snoop hit in FSE states and
triggered a silent eviction. This is useful because this information is
lost in the PRE encodings.
WC_ALIASING
bxxxxxx1x
Write Combining Aliasing:
Counts the number of times that a USWC write (WCIL(F)) transaction
hit in the LLC in M state, triggering a WBMtoI followed by the USWC
write. This occurs when there is WC aliasing.
STARTED
bxxxxx1xx
RFO_HIT_S
bxxxx1xxx
RFO HitS:
Number of times that an RFO hit in S state. This is useful for
determining if it might be good for a workload to use RspIWB instead
of RspSWB.
RING_AD_USED
•
•
•
•
•
36
Title: AD Ring In Use
Category: RING Events
Event Code: 0x1B
Max. Inc/Cyc: 1, Register Restrictions: 2-3
Definition: Counts the number of cycles that the AD ring is being used at this ring stop. This
includes when packets are passing by and when packets are being sunk, but does not include when
packets are being sent from the ring stop. We really have two rings in JKT -- a clockwise ring and a
counter-clockwise ring. On the left side of the ring, the "UP" direction is on the clockwise ring and
"DN" is on the counter-clockwise ring. On the right side of the ring, this is reversed. The first half
of the CBos are on the left side of the ring, and the 2nd half are on the right side of the ring. In
other words (for example), in a 4c part, Cbo 0 UP AD is NOT the same ring as CBo 2 UP AD because
they are on opposite sides of the ring.
Reference Number: 327043-001
Intel® Xeon® Processor E5-2600 Product Family Uncore Performance Monitoring
Table 2-19. Unit Masks for RING_AD_USED
Extension
umask
[15:8]
Description
UP_EVEN
bxxxxxxx1
Up and Even:
Filters for the Up and Even ring polarity.
UP_ODD
bxxxxxx1x
Up and Odd:
Filters for the Up and Odd ring polarity.
DOWN_EVEN
bxxxxx1xx
Down and Even:
Filters for the Down and Even ring polarity.
DOWN_ODD
bxxxx1xxx
Down and Odd:
Filters for the Down and Odd ring polarity.
RING_AK_USED
•
•
•
•
•
Title: AK Ring In Use
Category: RING Events
Event Code: 0x1C
Max. Inc/Cyc: 1, Register Restrictions: 2-3
Definition: Counts the number of cycles that the AK ring is being used at this ring stop. This
includes when packets are passing by and when packets are being sunk, but does not include when
packets are being sent from the ring stop.We really have two rings in JKT -- a clockwise ring and a
counter-clockwise ring. On the left side of the ring, the "UP" direction is on the clockwise ring and
"DN" is on the counter-clockwise ring. On the right side of the ring, this is reversed. The first half
of the CBos are on the left side of the ring, and the 2nd half are on the right side of the ring. In
other words (for example), in a 4c part, Cbo 0 UP AD is NOT the same ring as CBo 2 UP AD because
they are on opposite sides of the ring.
Table 2-20. Unit Masks for RING_AK_USED
Extension
umask
[15:8]
Description
UP_EVEN
bxxxxxxx1
Up and Even:
Filters for the Up and Even ring polarity.
UP_ODD
bxxxxxx1x
Up and Odd:
Filters for the Up and Odd ring polarity.
DOWN_EVEN
bxxxxx1xx
Down and Even:
Filters for the Down and Even ring polarity.
DOWN_ODD
bxxxx1xxx
Down and Odd:
Filters for the Down and Odd ring polarity.
RING_BL_USED
•
•
•
•
•
Title: BL Ring in Use
Category: RING Events
Event Code: 0x1D
Max. Inc/Cyc: 1, Register Restrictions: 2-3
Definition: Counts the number of cycles that the BL ring is being used at this ring stop. This
includes when packets are passing by and when packets are being sunk, but does not include when
packets are being sent from the ring stop.We really have two rings in JKT -- a clockwise ring and a
counter-clockwise ring. On the left side of the ring, the "UP" direction is on the clockwise ring and
"DN" is on the counter-clockwise ring. On the right side of the ring, this is reversed. The first half
of the CBos are on the left side of the ring, and the 2nd half are on the right side of the ring. In
other words (for example), in a 4c part, Cbo 0 UP AD is NOT the same ring as CBo 2 UP AD because
they are on opposite sides of the ring.
Reference Number: 327043-001
37
Intel® Xeon® Processor E5-2600 Product Family Uncore Performance Monitoring
Table 2-21. Unit Masks for RING_BL_USED
Extension
umask
[15:8]
Description
UP_EVEN
bxxxxxxx1
Up and Even:
Filters for the Up and Even ring polarity.
UP_ODD
bxxxxxx1x
Up and Odd:
Filters for the Up and Odd ring polarity.
DOWN_EVEN
bxxxxx1xx
Down and Even:
Filters for the Down and Even ring polarity.
DOWN_ODD
bxxxx1xxx
Down and Odd:
Filters for the Down and Odd ring polarity.
RING_BOUNCES
•
•
•
•
•
Title: Number of LLC responses that bounced on the Ring.
Category: RING Events
Event Code: 0x05
Max. Inc/Cyc: 1, Register Restrictions: 0-1
Definition:
Table 2-22. Unit Masks for RING_BOUNCES
Extension
umask
[15:8]
Description
AK_CORE
bxxxxxx1x
Acknowledgements to core
BL_CORE
bxxxxx1xx
Data Responses to core
IV_CORE
bxxxx1xxx
Snoops of processor's cache.
RING_IV_USED
•
•
•
•
•
Title: BL Ring in Use
Category: RING Events
Event Code: 0x1E
Max. Inc/Cyc: 1, Register Restrictions: 2-3
Definition: Counts the number of cycles that the IV ring is being used at this ring stop. This
includes when packets are passing by and when packets are being sunk, but does not include when
packets are being sent from the ring stop. There is only 1 IV ring in JKT. Therefore, if one wants to
monitor the "Even" ring, they should select both UP_EVEN and DN_EVEN. To monitor the "Odd"
ring, they should select both UP_ODD and DN_ODD.
Table 2-23. Unit Masks for RING_IV_USED
Extension
ANY
umask
[15:8]
b00001111
Description
Any:
Filters any polarity
RING_SRC_THRTL
•
•
•
•
•
38
Title:
Category: RING Events
Event Code: 0x07
Max. Inc/Cyc: 1, Register Restrictions: 0-1
Definition:
Reference Number: 327043-001
Intel® Xeon® Processor E5-2600 Product Family Uncore Performance Monitoring
RxR_EXT_STARVED
•
•
•
•
•
Title: Ingress Arbiter Blocking Cycles
Category: INGRESS Events
Event Code: 0x12
Max. Inc/Cyc: 1, Register Restrictions: 0-1
Definition: Counts cycles in external starvation. This occurs when one of the ingress queues is
being starved by the other queues.
Table 2-24. Unit Masks for RxR_EXT_STARVED
Extension
umask
[15:8]
Description
IRQ
bxxxxxxx1
IPQ:
IRQ is externally starved and therefore we are blocking the IPQ.
IPQ
bxxxxxx1x
IRQ:
IPQ is externally startved and therefore we are blocking the IRQ.
ISMQ
bxxxxx1xx
ISMQ:
ISMQ is externally starved and therefore we are blocking both IRQ
and IPQ.
ISMQ_BIDS
bxxxx1xxx
ISMQ_BID:
Number of times that the ISMQ Bid.
RxR_INSERTS
•
•
•
•
•
•
Title: Ingress Allocations
Category: INGRESS Events
Event Code: 0x13
Max. Inc/Cyc: 1, Register Restrictions: 0-1
Definition: Counts number of allocations per cycle into the specified Ingress queue.
NOTE: IRQ_REJECTED should not be Ored with the other umasks.
Table 2-25. Unit Masks for RxR_INSERTS
Extension
umask
[15:8]
Description
IRQ
bxxxxxxx1
IRQ
IRQ_REJECTED
bxxxxxx1x
IRQ Rejected
IPQ
bxxxxx1xx
IPQ
VFIFO
bxxx1xxxx
VFIFO:
Counts the number of allocations into the IRQ Ordering FIFO. In JKT,
it is necessary to keep IO requests in order. Therefore, they are
allocated into an ordering FIFO that sits next to the IRQ, and must be
satisfied from the FIFO in order (with respect to each other). This
event, in conjunction with the Occupancy Accumulator event, can be
used to calculate average lifetime in the FIFO. Transactions are
allocated into the FIFO as soon as they enter the Cachebo (and the
IRQ) and are deallocated from the FIFO as soon as they are
deallocated from the IRQ.
RxR_IPQ_RETRY
•
•
•
•
•
Title: Probe Queue Retries
Category: INGRESS_RETRY Events
Event Code: 0x31
Max. Inc/Cyc: 1, Register Restrictions: 0-1
Definition: Number of times a snoop (probe) request had to retry. Filters exist to cover some of
the common cases retries.
Reference Number: 327043-001
39
Intel® Xeon® Processor E5-2600 Product Family Uncore Performance Monitoring
Table 2-26. Unit Masks for RxR_IPQ_RETRY
Extension
umask
[15:8]
Description
ANY
bxxxxxxx1
Any Reject:
Counts the number of times that a request form the IPQ was retried
because of a TOR reject. TOR rejects from the IPQ can be caused by
the Egress being full or Address Conflicts.
FULL
bxxxxxx1x
No Egress Credits:
Counts the number of times that a request form the IPQ was retried
because of a TOR reject from the Egress being full. IPQ requests
make use of the AD Egress for regular responses, the BL egress to
forward data, and the AK egress to return credits.
ADDR_CONFLICT
bxxxxx1xx
Address Conflict:
Counts the number of times that a request form the IPQ was retried
because of a TOR reject from an address conflicts. Address conflicts
out of the IPQ should be rare. They will generally only occur if two
different sockets are sending requests to the same address at the
same time. This is a true "conflict" case, unlike the IPQ Address
Conflict which is commonly caused by prefetching characteristics.
QPI_CREDITS
bxxx1xxxx
No Intel® QPI Credits
RxR_IRQ_RETRY
•
•
•
•
•
Title: Ingress Request Queue Rejects
Category: INGRESS_RETRY Events
Event Code: 0x32
Max. Inc/Cyc: 1, Register Restrictions: 0-1
Definition:
Table 2-27. Unit Masks for RxR_IRQ_RETRY (Sheet 1 of 2)
Extension
40
umask
[15:8]
Description
ANY
bxxxxxxx1
Any Reject:
Counts the number of IRQ retries that occur. Requests from the IRQ
are retried if they are rejected from the TOR pipeline for a variety of
reasons. Some of the most common reasons include if the Egress is
full, there are no RTIDs, or there is a Physical Address match to
another outstanding request.
FULL
bxxxxxx1x
No Egress Credits:
Counts the number of times that a request from the IRQ was retried
because it failed to acquire an entry in the Egress. The egress is the
buffer that queues up for allocating onto the ring. IRQ requests can
make use of all four rings and all four Egresses. If any of the queues
that a given request needs to make use of are full, the request will be
retried.
ADDR_CONFLICT
bxxxxx1xx
Address Conflict:
Counts the number of times that a request from the IRQ was retried
because of an address match in the TOR. In order to maintain
coherency, requests to the same address are not allowed to pass
each other up in the Cbo. Therefore, if there is an outstanding
request to a given address, one cannot issue another request to that
address until it is complete. This comes up most commonly with
prefetches. Outstanding prefetches occasionally will not complete
their memory fetch and a demand request to the same address will
then sit in the IRQ and get retried until the prefetch fills the data into
the LLC. Therefore, it will not be uncommon to see this case in high
bandwidth streaming workloads when the LLC Prefetcher in the core
is enabled.
Reference Number: 327043-001
Intel® Xeon® Processor E5-2600 Product Family Uncore Performance Monitoring
Table 2-27. Unit Masks for RxR_IRQ_RETRY (Sheet 2 of 2)
Extension
umask
[15:8]
Description
RTID
bxxxx1xxx
No RTIDs:
Counts the number of times that requests from the IRQ were retried
because there were no RTIDs available. RTIDs are required after a
request misses the LLC and needs to send snoops and/or requests to
memory. If there are no RTIDs available, requests will queue up in
the IRQ and retry until one becomes available. Note that there are
multiple RTID pools for the different sockets. There may be cases
where the local RTIDs are all used, but requests destined for remote
memory can still acquire an RTID because there are remote RTIDs
available. This event does not provide any filtering for this case.
QPI_CREDITS
bxxx1xxxx
No Intel® QPI Credits:
Number of requests rejects because of lack of Intel® QPI Ingress
credits. These credits are required in order to send transactions to
the Intel® QPI agent. Please see the QPI_IGR_CREDITS events for
more information.
RxR_ISMQ_RETRY
•
•
•
•
•
Title: ISMQ Retries
Category: INGRESS_RETRY Events
Event Code: 0x33
Max. Inc/Cyc: 1, Register Restrictions: 0-1
Definition: Number of times a transaction flowing through the ISMQ had to retry. Transaction pass
through the ISMQ as responses for requests that already exist in the Cbo. Some examples include:
when data is returned or when snoop responses come back from the cores.
Table 2-28. Unit Masks for RxR_ISMQ_RETRY
Extension
umask
[15:8]
Description
ANY
bxxxxxxx1
Any Reject:
Counts the total number of times that a request from the ISMQ
retried because of a TOR reject. ISMQ requests generally will not
need to retry (or at least ISMQ retries are less common than IRQ
retries). ISMQ requests will retry if they are not able to acquire a
needed Egress credit to get onto the ring, or for cache evictions that
need to acquire an RTID. Most ISMQ requests already have an RTID,
so eviction retries will be less common here.
FULL
bxxxxxx1x
No Egress Credits:
Counts the number of times that a request from the ISMQ retried
because of a TOR reject caused by a lack of Egress credits. The
egress is the buffer that queues up for allocating onto the ring. If
any of the Egress queues that a given request needs to make use of
are full, the request will be retried.
RTID
bxxxx1xxx
No RTIDs:
Counts the number of times that a request from the ISMQ retried
because of a TOR reject caused by no RTIDs. M-state cache evictions
are serviced through the ISMQ, and must acquire an RTID in order to
write back to memory. If no RTIDs are available, they will be retried.
QPI_CREDITS
bxxx1xxxx
No Intel® QPI Credits
IIO_CREDITS
bxx1xxxxx
No IIO Credits:
Number of times a request attempted to acquire the NCS/NCB credit
for sending messages on BL to the IIO. There is a single credit in
each CBo that is shared between the NCS and NCB message classes
for sending transactions on the BL ring (such as read data) to the
IIO.
Reference Number: 327043-001
41
Intel® Xeon® Processor E5-2600 Product Family Uncore Performance Monitoring
RxR_OCCUPANCY
•
•
•
•
•
•
Title: Ingress Occupancy
Category: INGRESS Events
Event Code: 0x11
Max. Inc/Cyc: 20, Register Restrictions: 0
Definition: Counts number of entries in the specified Ingress queue in each cycle.
NOTE: IRQ_REJECTED should not be Ored with the other umasks.
Table 2-29. Unit Masks for RxR_OCCUPANCY
Extension
umask
[15:8]
Description
IRQ
bxxxxxxx1
IRQ
IRQ_REJECTED
bxxxxxx1x
IRQ Rejected
IPQ
bxxxxx1xx
IPQ
VFIFO
bxxx1xxxx
VFIFO:
Accumulates the number of used entries in the IRQ Ordering FIFO in
each cycle. In JKT, it is necessary to keep IO requests in order.
Therefore, they are allocated into an ordering FIFO that sits next to
the IRQ, and must be satisfied from the FIFO in order (with respect
to each other). This event, in conjunction with the Allocations event,
can be used to calculate average lifetime in the FIFO. This event can
be used in conjunction with the Not Empty event to calculate average
queue occupancy. Transactions are allocated into the FIFO as soon as
they enter the Cachebo (and the IRQ) and are deallocated from the
FIFO as soon as they are deallocated from the IRQ.
TOR_INSERTS
•
•
•
•
•
Title: TOR Inserts
Category: TOR Events
Event Code: 0x35
Max. Inc/Cyc: 1, Register Restrictions: 0-1
Definition: Counts the number of entries successfuly inserted into the TOR that match qualifications specified by the subevent. There are a number of subevent 'filters' but only a subset of the
subevent combinations are valid. Subevents that require an opcode or NID match require the
Cn_MSR_PMON_BOX_FILTER.{opc, nid} field to be set. If, for example, one wanted to count DRD
Local Misses, one should select "MISS_OPC_MATCH" and set Cn_MSR_PMON_BOX_FILTER.opc to
DRD (0x182).
Table 2-30. Unit Masks for TOR_INSERTS (Sheet 1 of 2)
Extension
42
umask
[15:8]
Filter Dep
CBoFilter[3
1:23]
Description
OPCODE
b00000001
Opcode Match:
Transactions inserted into the TOR that match an
opcode (matched by
Cn_MSR_PMON_BOX_FILTER.opc)
EVICTION
b00000100
Evictions:
Eviction transactions inserted into the TOR. Evictions
can be quick, such as when the line is in the F, S, or E
states and no core valid bits are set. They can also be
longer if either CV bits are set (so the cores need to be
snooped) and/or if there is a HitM (in which case it is
necessary to write the request out to memory).
WB
b00010000
Writebacks:
Write transactions inserted into the TOR. This does
not include "RFO", but actual operations that contain
data being sent from the core.
Reference Number: 327043-001
Intel® Xeon® Processor E5-2600 Product Family Uncore Performance Monitoring
Table 2-30. Unit Masks for TOR_INSERTS (Sheet 2 of 2)
Extension
umask
[15:8]
Filter Dep
Description
CBoFilter[3
1:23]
Miss Opcode Match:
Miss transactions inserted into the TOR that match an
opcode.
MISS_OPCODE
b00000011
MISS_ALL
b00001010
NID_OPCODE
b01000001
CBoFilter[3
1:23],
CBoFilter[1
7:10]
NID and Opcode Matched:
Transactions inserted into the TOR that match a NID
and an opcode.
NID_EVICTION
b01000100
CBoFilter[1
7:10]
NID Matched Evictions:
NID matched eviction transactions inserted into the
TOR.
NID_ALL
b01001000
CBoFilter[1
7:10]
NID Matched:
All NID matched (matches an RTID destination)
transactions inserted into the TOR. The NID is
programmed in Cn_MSR_PMON_BOX_FILTER.nid. In
conjunction with STATE = I, it is possible to monitor
misses to specific NIDs in the system.
NID_WB
b01010000
CBoFilter[1
7:10]
NID Matched Writebacks:
NID matched write transactions inserted into the TOR.
NID_MISS_OPCODE
b01000011
CBoFilter[3
1:23],
CBoFilter[1
7:10]
NID and Opcode Matched Miss:
Miss transactions inserted into the TOR that match a
NID and an opcode.
NID_MISS_ALL
b01001010
CBoFilter[1
7:10]
NID Matched Miss All:
All NID matched miss requests that were inserted into
the TOR.
Miss All:
All Miss requests inserted into the TOR. 'Miss' means
the allocation requires an RTID. This generally means
that the request was sent to memory or MMIO.
TOR_OCCUPANCY
•
•
•
•
•
Title: TOR Occupancy
Category: TOR Events
Event Code: 0x36
Max. Inc/Cyc: 20, Register Restrictions: 0
Definition: For each cycle, this event accumulates the number of valid entries in the TOR that
match qualifications specified by the subevent. There are a number of subevent 'filters' but only a
subset of the subevent combinations are valid. Subevents that require an opcode or NID match
require the Cn_MSR_PMON_BOX_FILTER.{opc, nid} field to be set. If, for example, one wanted to
count DRD Local Misses, one should select "MISS_OPC_MATCH" and set
Cn_MSR_PMON_BOX_FILTER.opc to DRD (0x182)
Table 2-31. Unit Masks for TOR_OCCUPANCY (Sheet 1 of 2)
Extension
umask
[15:8]
OPCODE
b00000001
EVICTION
b00000100
Reference Number: 327043-001
Filter Dep
CBoFilter[3
1:23]
Description
Opcode Match:
TOR entries that match an opcode (matched by
Cn_MSR_PMON_BOX_FILTER.opc).
Evictions:
Number of outstanding eviction transactions in the
TOR. Evictions can be quick, such as when the line is
in the F, S, or E states and no core valid bits are set.
They can also be longer if either CV bits are set (so the
cores need to be snooped) and/or if there is a HitM (in
which case it is necessary to write the request out to
memory).
43
Intel® Xeon® Processor E5-2600 Product Family Uncore Performance Monitoring
Table 2-31. Unit Masks for TOR_OCCUPANCY (Sheet 2 of 2)
Extension
umask
[15:8]
Filter Dep
Description
ALL
b00001000
Any:
All valid TOR entries. This includes requests that
reside in the TOR for a short time, such as LLC Hits
that do not need to snoop cores or requests that get
rejected and have to be retried through one of the
ingress queues. The TOR is more commonly a
bottleneck in skews with smaller core counts, where
the ratio of RTIDs to TOR entries is larger. Note that
there are reserved TOR entries for various request
types, so it is possible that a given request type be
blocked with an occupancy that is less than 20. Also
note that generally requests will not be able to
arbitrate into the TOR pipeline if there are no available
TOR slots.
MISS_OPCODE
b00000011
MISS_ALL
b00001010
NID_OPCODE
b01000001
CBoFilter[3
1:23],
CBoFilter[1
7:10]
NID and Opcode Matched:
TOR entries that match a NID and an opcode.
NID_EVICTION
b01000100
CBoFilter[1
7:10]
NID Matched Evictions:
Number of outstanding NID matched eviction
transactions in the TOR .
NID_ALL
b01001000
CBoFilter[1
7:10]
NID Matched:
Number of NID matched outstanding requests in the
TOR. The NID is programmed in
Cn_MSR_PMON_BOX_FILTER.nid.In conjunction with
STATE = I, it is possible to monitor misses to specific
NIDs in the system.
NID_MISS_OPCODE
b01000011
CBoFilter[3
1:23],
CBoFilter[1
7:10]
NID and Opcode Matched Miss:
Number of outstanding Miss requests in the TOR that
match a NID and an opcode.
NID_MISS_ALL
b01001010
CBoFilter[1
7:10]
NID Matched:
Number of outstanding Miss requests in the TOR that
match a NID.
CBoFilter[3
1:23]
Miss Opcode Match:
TOR entries for miss transactions that match an
opcode. This generally means that the request was
sent to memory or MMIO.
Miss All:
Number of outstanding miss requests in the TOR.
'Miss' means the allocation requires an RTID. This
generally means that the request was sent to memory
or MMIO.
TxR_ADS_USED
•
•
•
•
•
Title:
Category: EGRESS Events
Event Code: 0x04
Max. Inc/Cyc: 1, Register Restrictions: 0-1
Definition:
TxR_INSERTS
•
•
•
•
•
44
Title: Egress Allocations
Category: EGRESS Events
Event Code: 0x02
Max. Inc/Cyc: 1, Register Restrictions: 0-1
Definition: Number of allocations into the Cbo Egress. The Egress is used to queue up requests
destined for the ring.
Reference Number: 327043-001
Intel® Xeon® Processor E5-2600 Product Family Uncore Performance Monitoring
Table 2-32. Unit Masks for TxR_INSERTS
Extension
umask
[15:8]
Description
AD_CACHE
bxxxxxxx1
AD - Cachebo:
Ring transactions from the Cachebo destined for the AD ring. Some
example include outbound requests, snoop requests, and snoop
responses.
AK_CACHE
bxxxxxx1x
AK - Cachebo:
Ring transactions from the Cachebo destined for the AK ring. This is
commonly used for credit returns and GO responses.
BL_CACHE
bxxxxx1xx
BL - Cacheno:
Ring transactions from the Cachebo destined for the BL ring. This is
commonly used to send data from the cache to various destinations.
IV_CACHE
bxxxx1xxx
IV - Cachebo:
Ring transactions from the Cachebo destined for the IV ring. This is
commonly used for snoops to the cores.
AD_CORE
bxxx1xxxx
AD - Corebo:
Ring transactions from the Corebo destined for the AD ring. This is
commonly used for outbound requests.
AK_CORE
bxx1xxxxx
AK - Corebo:
Ring transactions from the Corebo destined for the AK ring. This is
commonly used for snoop responses coming from the core and
destined for a Cachebo.
BL_CORE
bx1xxxxxx
BL - Corebo:
Ring transactions from the Corebo destined for the BL ring. This is
commonly used for transfering writeback data to the cache.
2.4
Home Agent (HA) Performance Monitoring
2.4.1
Overview of the Home Agent
The HA is responsible for the protocol side of memory interactions, including coherent and noncoherent home agent protocols (as defined in the Intel® QuickPath Interconnect Specification).
Additionally, the HA is responsible for ordering memory reads/writes, coming in from the modular
Ring, to a given address such that the iMC (memory controller).
In other words, it is the coherency agent responsible for guarding the memory controller. All requests
for memory attached to the coupled iMC must first be ordered through the HA. As such, it provides
several functions:
• Interface between Ring and iMC:
Regardless of the memory technology, the Home Agent receives memory read and write requests
from the modular ring. It checks the memory transaction type, detects and resolves the coherent
conflict, and finally schedules a corresponding transaction to the memory controller. It is also
responsible for returning the response and completion to the requester.
• Conflict Manager:
All requests must go through conflict management logic in order to ensure coherent consistency.
In other words, the view of data must be the same across all coherency agents regardless of who
is reading or modifying the data. On Intel® QPI, the home agent is responsible for tracking all
requests to a given address and ensuring that the results are consistent.
• Memory Access Ordering Control:
• The Home Agent guarantees the ordering of RAW, WAW and WAR. Home Snoop Protocol Support
(for parts with Directory Support):
Reference Number: 327043-001
45
Intel® Xeon® Processor E5-2600 Product Family Uncore Performance Monitoring
The Home Agent supports Intel® QPI’s home snoop protocol by initiating snoops on behalf of
requests. Closely tied to the directory feature, the home agent has the ability to issue snoops to
the peer caching agents for requests based on the directory information.
• Directory Support:
In order to satisfy performance requirements for the 4 socket and scalable DP segments, the
Home Agent implements a snoop directory which tracks all cachelines residing behind this Home
Agent. This directory is used to reduce the snoop traffic when Intel® QPI bandwidth would
otherwise be strained. The directory is not intended for typical 2S topologies.
2.4.2
HA Performance Monitoring Overview
The HA Box supports event monitoring through four 48-bit wide counters
(HA_PCI_PMON_CTR{3:0}). Each of these counters can be programmed (HA_PCI_PMON_CTL{3:0})
to capture any HA event. The HA counters will increment by a maximum of 8b per cycle.
For information on how to setup a monitoring session, refer to Section 2.1, “Uncore Per-Socket
Performance Monitoring Control”.
2.4.3
HA Performance Monitors
Table 2-33. HA Performance Monitoring MSRs
Register Name
PCICFG Base Address
HA PMON Registers
PCICFG
Address
Size
(bits)
Description
Dev:Func
D14:F1
Box-Level Control/Status
HA_PCI_PMON_BOX_CTL
F4
32
HA PMON Box-Wide Control
Generic Counter Control
HA_PCI_PMON_CTL3
E4
32
HA PMON Control for Counter 3
HA_PCI_PMON_CTL2
E0
32
HA PMON Control for Counter 2
HA_PCI_PMON_CTL1
DC
32
HA PMON Control for Counter 1
HA_PCI_PMON_CTL0
D8
32
HA PMON Control for Counter 0
Generic Counters
HA_PCI_PMON_CTR3
BC+B8
32x2
HA PMON Counter 3
HA_PCI_PMON_CTR2
B4+B0
32x2
HA PMON Counter 2
HA_PCI_PMON_CTR1
AC+A8
32x2
HA PMON Counter 1
HA_PCI_PMON_CTR0
A4+A0
32x2
HA PMON Counter 0
Box-Level Filter
2.4.3.1
HA_PCI_PMON_BOX_OPCODEMATCH
48
32
HA PMON Opcode Match
HA_PCI_PMON_BOX_ADDRMATCH1
44
32
HA PMON Address Match 1
HA_PCI_PMON_BOX_ADDRMATCH0
40
32
HA PMON Address Match 0
HA Box Level PMON State
The following registers represent the state governing all box-level PMUs in the HA Box.
46
Reference Number: 327043-001
Intel® Xeon® Processor E5-2600 Product Family Uncore Performance Monitoring
In the case of the HA, the HA_PCI_PMON_BOX_CTL register governs what happens when a freeze
signal is received (.frz_en). It also provides the ability to manually freeze the counters in the box
(.frz).
Table 2-34. HA_PCI_PMON_BOX_CTL Register – Field Definitions
Field
Bits
Attr
HW
Reset
Val
Description
rsv
31:18
RV
0
Reserved (?)
rsv
17
RV
0
Reserved; SW must write to 0 else behavior is undefined.
frz_en
16
WO
0
Freeze Enable.
If set to 1 and a freeze signal is received, the counters will be
stopped or ‘frozen’, else the freeze signal will be ignored.
2.4.3.2
rsv
15:9
RV
0
Reserved (?)
frz
8
WO
0
Freeze.
If set to 1 and the .frz_en is 1, the counters in this box will be
frozen.
rsv
7:2
RV
0
Reserved (?)
rsv
1:0
RV
0
Reserved; SW must write to 0 else behavior is undefined.
HA PMON state - Counter/Control Pairs
The following table defines the layout of the HA performance monitor control registers. The main task
of these configuration registers is to select the event to be monitored by their respective data counter
(.ev_sel, .umask). Additional control bits are provided to shape the incoming events (e.g. .invert,
.edge_det, .thresh).
Table 2-35. HA_PCI_PMON_CTL{3-0} Register – Field Definitions (Sheet 1 of 2)
Field
thresh
invert
HW
Reset
Val
Description
RW-V
0
Threshold used in counter comparison.
RW-V
0
Invert comparison against Threshold.
Bits
Attr
31:24
23
0 - comparison will be ‘is event increment >= threshold?’.
1 - comparison is inverted - ‘is event increment < threshold?’
NOTE: .invert is in series following .thresh, Due to this, the
.thresh field must be set to a non-0 value. For events that
increment by no more than 1 per cycle, set .thresh to 0x1.
Also, if .edge_det is set to 1, the counter will increment when a 1
to 0 transition (i.e. falling edge) is detected.
en
22
RW-V
0
Local Counter Enable.
rsv
21:20
RV
0
Reserved. SW must write to 0 else behavior is undefined.
rsv
19
RV
0
Reserved (?)
edge_det
18
RW-V
0
When set to 1, rather than measuring the event in each cycle it
is active, the corresponding counter will increment when a 0 to 1
transition (i.e. rising edge) is detected.
When 0, the counter will increment in each cycle that the event
is asserted.
NOTE: .edge_det is in series following .thresh, Due to this, the
.thresh field must be set to a non-0 value. For events that
increment by no more than 1 per cycle, set .thresh to 0x1.
Reference Number: 327043-001
47
Intel® Xeon® Processor E5-2600 Product Family Uncore Performance Monitoring
Table 2-35. HA_PCI_PMON_CTL{3-0} Register – Field Definitions (Sheet 2 of 2)
Field
rsv
Bits
Attr
HW
Reset
Val
Description
17:16
RV
0
Reserved. SW must write to 0 else behavior is undefined.
umask
15:8
RW-V
0
Select subevents to be counted within the selected event.
ev_sel
7:0
RW-V
0
Select event to be counted.
The HA performance monitor data registers are 48-bit wide. Should a counter overflow (a carry out
from bit 47), the counter will wrap and continue to collect events.If accessible, software can
continuously read the data registers without disabling event collection.
Table 2-36. HA_PCI_PMON_CTR{3-0} Register – Field Definitions
Field
rsv
event_count
Bits
Attr
HW
Reset
Val
Description
63:48
RV
0
Reserved (?)
47:0
RW-V
0
48-bit performance event counter
In addition to generic event counting, each HA provides a pair of Address Match registers and an
Opcode Match register that allow a user to filter incoming packet traffic according to the packet
Opcode, Message Class and Physical Address. The ADDR_OPC_MATCH.FILT event is provided to
capture the filter match as an event. The fields are laid out as follows:
Note:
Refer to Table 2-142, “Intel® QuickPath Interconnect Packet Message Classes” and
Table 2-143, “Opcode Match by Message Class” to determine the encodings of the BBox Match Register fields.
Table 2-37. HA_PCI_PMON_BOX_OPCODEMATCH Register – Field Definitions
Field
Bits
Attr
HW
Reset
Val
Description
rsv
31:6
RV
0
Reserved (?)
opc
5:0
RWS
0
Match to this incoming (? which polarity?) opcode
Table 2-38. HA_PCI_PMON_BOX_ADDRMATCH1 Register – Field Definitions
Field
rsv
hi_addr
48
Bits
Attr
HW
Reset
Val
Description
31:14
RV
0
Reserved (?)
13:0
RWS
0
Match to this System Address - Most Significant 14b of cache
aligned address [45:32]
Reference Number: 327043-001
Intel® Xeon® Processor E5-2600 Product Family Uncore Performance Monitoring
Table 2-39. HA_PCI_PMON_BOX_ADDRMATCH0 Register – Field Definitions
Field
lo_addr
rsv
HW
Reset
Val
HW
Reset
Val
31:6
RWS
0
Match to this System Address - Least Significant 26b of cache
aligned address [31:6]
5:0
RV
0
Reserved (?)
Bits
Description
Note:
The address comparison always ignores the lower 12 bits of the physical address, even
if they system is interleaving between sockets at the cache-line level. Therefore, this
mask will always match to an OS virtual page, even if only a fraction of that page is
mapped to the Home Agent under investigation. The mask is not adjusted for large
pages, so matches will only be allowed within 4K granularity.
2.4.4
HA Performance Monitoring Events
The performance monitoring events within the HA include all events internal to the HA as well as
events which track ring related activity at the HA ring stops. Internal events include the ability to
track Directory Activity, Direct2Core Activity, iMC Read/Write Traffic, time spent dealing with Conflicts,
etc.
Other notable event types:
• iMC RPQ/WPQ Events
Determine cycles the HA is stuck without credits in to the iMCs read/write queues.
• Ring Stop Events
To track Egress and ring utilization (broken down by direction and ring type) statistics, as well as
ring credits between the HA and Intel® QPI.
• Local/Remote Filtering
A number of HA events is extended to support filtering the origination from a local or remote
caching agent .
• Snoop Latency
2.4.4.1
On the Major HA Structures:
The 128-entry TF (Tracker File) holds all transactions that arrive in the HA from the time they arrive
until they are completed and leave the HA. Transactions could stay in this structure much longer than
they are needed. TF is the critical resource each transaction needs before being sent to the iMC
(memory controller)
TF average occupancy == (valid cnt * 128 / cycles)
TF average latency == (valid cnt * 128 / inserts)
Other Internal HA Queues of Interest:
TxR (aka EGR) - The HA has Egress (responses) queues for each ring (AD, AK, BL) as well as queues
to track credits the HA has to push traffic onto those rings.
Reference Number: 327043-001
49
Intel® Xeon® Processor E5-2600 Product Family Uncore Performance Monitoring
2.4.5
HA Box Events Ordered By Code
The following table summarizes the directly measured HA Box events.
Table 2-40. Performance Monitor Events for HA
Symbol Name
2.4.6
Event
Code
Ctrs
Max
Inc/
Cyc
Description
CLOCKTICKS
0x00
0-3
1
uclks
REQUESTS
0x01
0-3
1
Read and Write Requests
TRACKER_INSERTS
0x06
0-3
1
Tracker Allocations
CONFLICT_CYCLES
0x0B
0-3
1
Conflict Checks
DIRECTORY_LOOKUP
0x0C
0-3
1
Directory Lookups
DIRECTORY_UPDATE
0x0D
0-3
1
Directory Updates
TxR_AK_NDR
0x0E
0-3
1
Outbound NDR Ring Transactions
TxR_AD
0x0F
0-3
1
Outbound NDR Ring Transactions
TxR_BL
0x10
0-3
1
Outbound DRS Ring Transactions to Cache
DIRECT2CORE_COUNT
0x11
0-3
1
Direct2Core Messages Sent
DIRECT2CORE_CYCLES_DISABLED
0x12
0-3
1
Cycles when Direct2Core was Disabled
DIRECT2CORE_TXN_OVERRIDE
0x13
0-3
1
Number of Reads that had Direct2Core
Overridden
RPQ_CYCLES_NO_REG_CREDITS
0x15
0-3
4
iMC RPQ Credits Empty - Regular
WPQ_CYCLES_NO_REG_CREDITS
0x18
0-3
4
HA iMC CHN0 WPQ Credits Empty - Regular
IMC_WRITES
0x1A
0-3
1
HA to iMC Full Line Writes Issued
TAD_REQUESTS_G0
0x1B
0-3
2
HA Requests to a TAD Region - Group 0
TAD_REQUESTS_G1
0x1C
0-3
2
HA Requests to a TAD Region - Group 1
IMC_RETRY
0x1E
0-3
1
Retry Events
ADDR_OPC_MATCH
0x20
0-3
1
Intel® QPI Address/Opcode Match
IGR_NO_CREDIT_CYCLES
0x22
0-3
1
Cycles without Intel® QPI Ingress Credits
TxR_AD_CYCLES_FULL
0x2A
0-3
1
AD Egress Full
TxR_AK_CYCLES_FULL
0x32
0-3
1
AK Egress Full
TxR_BL_CYCLES_FULL
0x36
0-3
1
BL Egress Full
HA Box Common Metrics (Derived Events)
The following table summarizes metrics commonly calculated from HA Box events.
Table 2-41. Metrics Derived from HA Events (Sheet 1 of 2)
Symbol Name:
Definition
50
Equation
PCT_CYCLES_BL_FULL:
Percentage of time the BL Egress Queue is
full
TxR_BL_CYCLES_FULL.ALL / SAMPLE_INTERVAL
PCT_CYCLES_CONFLICT:
Percentage of time in Conflict Resolution
CONFLICT_CYCLES.CONFLICT / SAMPLE_INTERVAL
PCT_CYCLES_D2C_DISABLED:
Percentage of time that Direct2Core was
disabled.
DIRECT2CORE_CYCLES_DISABLED / SAMPLE_INTERVAL
Reference Number: 327043-001
Intel® Xeon® Processor E5-2600 Product Family Uncore Performance Monitoring
Table 2-41. Metrics Derived from HA Events (Sheet 2 of 2)
Symbol Name:
Definition
2.4.7
Equation
PCT_RD_REQUESTS:
Percentage of HA traffic that is from Read
Requests
REQUESTS.READS / (REQUESTS.READS + REQUESTS.WRITES)
PCT_WR_REQUESTS:
Percentage of HA traffic that is from Write
Requests
REQUESTS.WRITES / (REQUESTS.READS +
REQUESTS.WRITES)
HA Box Performance Monitor Event List
The section enumerates the performance monitoring events for the HA Box.ADDR_OPC_MATCH
•
•
•
•
•
Title: Intel® QPI Address/Opcode Match
Category: ADDR_OPCODE_MATCH Events
Event Code: 0x20
Max. Inc/Cyc: 1, Register Restrictions: 0-3
Definition:
Table 2-42. Unit Masks for ADDR_OPC_MATCH
Extension
FILT
umask
[15:8]
b00000011
Filter Dep
HA_AddrMa
tch0[31:6],
HA_AddrMa
tch1[13:0],
HA_Opcode
Match[5:0]
Description
Address & Opcode Match
CLOCKTICKS
•
•
•
•
•
Title: uclks
Category: UCLK Events
Event Code: 0x00
Max. Inc/Cyc: 1, Register Restrictions: 0-3
Definition: Counts the number of uclks in the HA. This will be slightly different than the count in
the Ubox because of enable/freeze delays. The HA is on the other side of the die from the fixed
Ubox uclk counter, so the drift could be somewhat larger than in units that are closer like the Intel®
QPI Agent.
CONFLICT_CYCLES
•
•
•
•
•
Title: Conflict Checks
Category: CONFLICTS Events
Event Code: 0x0B
Max. Inc/Cyc: 1, Register Restrictions: 0-3
Definition:
Reference Number: 327043-001
51
Intel® Xeon® Processor E5-2600 Product Family Uncore Performance Monitoring
Table 2-43. Unit Masks for CONFLICT_CYCLES
umask
[15:8]
Extension
Description
NO_CONFLICT
bxxxxxxx1
No Conflict:
Counts the number of cycles that we are NOT handling conflicts.
CONFLICT
bxxxxxx1x
Conflict Detected:
Counts the number of cycles that we are handling conflicts.
DIRECT2CORE_COUNT
•
•
•
•
•
Title: Direct2Core Messages Sent
Category: DIRECT2CORE Events
Event Code: 0x11
Max. Inc/Cyc: 1, Register Restrictions: 0-3
Definition: Number of Direct2Core messages sent
DIRECT2CORE_CYCLES_DISABLED
•
•
•
•
•
Title: Cycles when Direct2Core was Disabled
Category: DIRECT2CORE Events
Event Code: 0x12
Max. Inc/Cyc: 1, Register Restrictions: 0-3
Definition: Number of cycles in which Direct2Core was disabled
DIRECT2CORE_TXN_OVERRIDE
•
•
•
•
•
Title: Number of Reads that had Direct2Core Overridden
Category: DIRECT2CORE Events
Event Code: 0x13
Max. Inc/Cyc: 1, Register Restrictions: 0-3
Definition: Number of Reads where Direct2Core overridden
DIRECTORY_LOOKUP
•
•
•
•
•
Title: Directory Lookups
Category: DIRECTORY Events
Event Code: 0x0C
Max. Inc/Cyc: 1, Register Restrictions: 0-3
Definition: Counts the number of transactions that looked up the directory. Can be filtered by
requests that had to snoop and those that did not have to.
• NOTE: Only valid for parts that implement the Directory
Table 2-44. Unit Masks for DIRECTORY_LOOKUP
Extension
52
umask
[15:8]
Description
SNP
bxxxxxxx1
Snoop Needed:
Filters for transactions that had to send one or more snoops because
the directory bit was set.
NO_SNP
bxxxxxx1x
Snoop Not Needed:
Filters for transactions that did not have to send any snoops because
the directory bit was clear.
Reference Number: 327043-001
Intel® Xeon® Processor E5-2600 Product Family Uncore Performance Monitoring
DIRECTORY_UPDATE
•
•
•
•
•
Title: Directory Updates
Category: DIRECTORY Events
Event Code: 0x0D
Max. Inc/Cyc: 1, Register Restrictions: 0-3
Definition: Counts the number of directory updates that were required. These result in writes to
the memory controller. This can be filtered by directory sets and directory clears.
• NOTE: Only valid for parts that implement the Directory
Table 2-45. Unit Masks for DIRECTORY_UPDATE
Extension
umask
[15:8]
Description
SET
bxxxxxxx1
Directory Set:
Filter for directory sets. This occurs when a remote read transaction
requests memory, bringing it to a remote cache.
CLEAR
bxxxxxx1x
Directory Clear:
Filter for directory clears. This occurs when snoops were sent and all
returned with RspI.
ANY
bxxxxxx11
Any Directory Update
IGR_NO_CREDIT_CYCLES
•
•
•
•
•
Title: Cycles without Intel® QPI Ingress Credits
Category: QPI_IGR_CREDITS Events
Event Code: 0x22
Max. Inc/Cyc: 1, Register Restrictions: 0-3
Definition: Counts the number of cycles when the HA does not have credits to send messages to
the Intel® QPI Agent. This can be filtered by the different credit pools and the different links.
Table 2-46. Unit Masks for IGR_NO_CREDIT_CYCLES
Extension
umask
[15:8]
Description
AD_QPI0
bxxxxxxx1
AD to Intel® QPI Link 0
AD_QPI1
bxxxxxx1x
AD to Intel® QPI Link 1
BL_QPI0
bxxxxx1xx
BL to Intel® QPI Link 0
BL_QPI1
bxxxx1xxx
BL to Intel® QPI Link 1
IMC_RETRY
•
•
•
•
•
Title: Retry Events
Category: IMC_MISC Events
Event Code: 0x1E
Max. Inc/Cyc: 1, Register Restrictions: 0-3
Definition:
IMC_WRITES
•
•
•
•
•
Title: HA to iMC Full Line Writes Issued
Category: IMC_WRITES Events
Event Code: 0x1A
Max. Inc/Cyc: 1, Register Restrictions: 0-3
Definition: Counts the total number of full line writes issued from the HA into the memory controller. This counts for all four channels. It can be filtered by full/partial and ISOCH/non-ISOCH.
Reference Number: 327043-001
53
Intel® Xeon® Processor E5-2600 Product Family Uncore Performance Monitoring
Table 2-47. Unit Masks for IMC_WRITES
Extension
umask
[15:8]
Description
FULL
bxxxxxxx1
Full Line Non-ISOCH
PARTIAL
bxxxxxx1x
Partial Non-ISOCH
FULL_ISOCH
bxxxxx1xx
ISOCH Full Line
PARTIAL_ISOCH
bxxxx1xxx
ISOCH Partial
ALL
b00001111
All Writes
REQUESTS
•
•
•
•
•
Title: Read and Write Requests
Category: REQUESTS Events
Event Code: 0x01
Max. Inc/Cyc: 1, Register Restrictions: 0-3
Definition: Counts the total number of read requests made into the Home Agent. Reads include all
read opcodes (including RFO). Writes include all writes (streaming, evictions, HitM, etc).
Table 2-48. Unit Masks for REQUESTS
Extension
umask
[15:8]
Description
READS
b00000011
Reads:
Incoming ead requests. This is a good proxy for LLC Read Misses
(including RFOs).
WRITES
b00001100
Writes:
Incoming write requests.
RPQ_CYCLES_NO_REG_CREDITS
•
•
•
•
•
Title: iMC RPQ Credits Empty - Regular
Category: RPQ_CREDITS Events
Event Code: 0x15
Max. Inc/Cyc: 4, Register Restrictions: 0-3
Definition: Counts the number of cycles when there are no "regular" credits available for posting
reads from the HA into the iMC. In order to send reads into the memory controller, the HA must
first acquire a credit for the iMC's RPQ (read pending queue). This queue is broken into regular
credits/buffers that are used by general reads, and "special" requests such as ISOCH reads. This
count only tracks the regular credits Common high banwidth workloads should be able to make use
of all of the regular buffers, but it will be difficult (and uncommon) to make use of both the regular
and special buffers at the same time. One can filter based on the memory controller channel. One
or more channels can be tracked at a given time.
Table 2-49. Unit Masks for RPQ_CYCLES_NO_REG_CREDITS
Extension
54
umask
[15:8]
Description
CHN0
bxxxxxxx1
Channel 0:
Filter for memory controller channel 0 only.
CHN1
bxxxxxx1x
Channel 1:
Filter for memory controller channel 1 only.
CHN2
bxxxxx1xx
Channel 2:
Filter for memory controller channel 2 only.
CHN3
bxxxx1xxx
Channel 3:
Filter for memory controller channel 3 only.
Reference Number: 327043-001
Intel® Xeon® Processor E5-2600 Product Family Uncore Performance Monitoring
TAD_REQUESTS_G0
•
•
•
•
•
Title: HA Requests to a TAD Region - Group 0
Category: TAD Events
Event Code: 0x1B
Max. Inc/Cyc: 2, Register Restrictions: 0-3
Definition: Counts the number of HA requests to a given TAD region. There are up to 11 TAD (target address decode) regions in each home agent. All requests destined for the memory controller
must first be decoded to determine which TAD region they are in. This event is filtered based on
the TAD region ID, and covers regions 0 to 7. This event is useful for understanding how applications are using the memory that is spread across the different memory regions. It is particularly
useful for "Monroe" systems that use the TAD to enable individual channels to enter self-refresh to
save power.
Table 2-50. Unit Masks for TAD_REQUESTS_G0
Extension
umask
[15:8]
Description
REGION0
bxxxxxxx1
TAD Region 0:
Filters request made to TAD Region 0
REGION1
bxxxxxx1x
TAD Region 1:
Filters request made to TAD Region 1
REGION2
bxxxxx1xx
TAD Region 2:
Filters request made to TAD Region 2
REGION3
bxxxx1xxx
TAD Region 3:
Filters request made to TAD Region 3
REGION4
bxxx1xxxx
TAD Region 4:
Filters request made to TAD Region 4
REGION5
bxx1xxxxx
TAD Region 5:
Filters request made to TAD Region 5
REGION6
bx1xxxxxx
TAD Region 6:
Filters request made to TAD Region 6
REGION7
b1xxxxxxx
TAD Region 7:
Filters request made to TAD Region 7
TAD_REQUESTS_G1
•
•
•
•
•
Title: HA Requests to a TAD Region - Group 1
Category: TAD Events
Event Code: 0x1C
Max. Inc/Cyc: 2, Register Restrictions: 0-3
Definition: Counts the number of HA requests to a given TAD region. There are up to 11 TAD (target address decode) regions in each home agent. All requests destined for the memory controller
must first be decoded to determine which TAD region they are in. This event is filtered based on
the TAD region ID, and covers regions 8 to 10. This event is useful for understanding how applications are using the memory that is spread across the different memory regions. It is particularly
useful for "Monroe" systems that use the TAD to enable individual channels to enter self-refresh to
save power.
Table 2-51. Unit Masks for TAD_REQUESTS_G1 (Sheet 1 of 2)
Extension
umask
[15:8]
Description
REGION8
bxxxxxxx1
TAD Region 8:
Filters request made to TAD Region 8
REGION9
bxxxxxx1x
TAD Region 9:
Filters request made to TAD Region 9
Reference Number: 327043-001
55
Intel® Xeon® Processor E5-2600 Product Family Uncore Performance Monitoring
Table 2-51. Unit Masks for TAD_REQUESTS_G1 (Sheet 2 of 2)
Extension
umask
[15:8]
Description
REGION10
bxxxxx1xx
TAD Region 10:
Filters request made to TAD Region 10
REGION11
bxxxx1xxx
TAD Region 11:
Filters request made to TAD Region 11
TRACKER_INSERTS
•
•
•
•
•
Title: Tracker Allocations
Category: TRACKER Events
Event Code: 0x06
Max. Inc/Cyc: 1, Register Restrictions: 0-3
Definition: Counts the number of allocations into the local HA tracker pool. This can be used in
conjunction with the occupancy accumulation event in order to calculate average latency. One cannot filter between reads and writes. HA trackers are allocated as soon as a request enters the HA
and is released after the snoop response and data return (or post in the case of a write) and the
response is returned on the ring.
Table 2-52. Unit Masks for TRACKER_INSERTS
Extension
ALL
umask
[15:8]
b00000011
Description
All Requests:
Requests coming from both local and remote sockets.
TxR_AD
•
•
•
•
•
Title: Outbound NDR Ring Transactions
Category: OUTBOUND_TX Events
Event Code: 0x0F
Max. Inc/Cyc: 1, Register Restrictions: 0-3
Definition: Counts the number of outbound transactions on the AD ring. This can be filtered by
the NDR and SNP message classes. See the filter descriptions for more details.
Table 2-53. Unit Masks for TxR_AD
Extension
umask
[15:8]
Description
NDR
bxxxxxxx1
Non-data Responses:
Filter for outbound NDR transactions sent on the AD ring. NDR
stands for "non-data response" and is generally used for completions
that do not include data. AD NDR is used for transactions to remote
sockets.
SNP
bxxxxxx1x
Snoops:
Filter for outbound SNP transactions sent on the ring. These
transactions are generally snoops being sent out to either remote or
local caching agents. This should be zero if Early Snoop is enabled.
TxR_AD_CYCLES_FULL
•
•
•
•
•
56
Title: AD Egress Full
Category: AD_EGRESS Events
Event Code: 0x2A
Max. Inc/Cyc: 1, Register Restrictions: 0-3
Definition: AD Egress Full
Reference Number: 327043-001
Intel® Xeon® Processor E5-2600 Product Family Uncore Performance Monitoring
Table 2-54. Unit Masks for TxR_AD_CYCLES_FULL
Extension
umask
[15:8]
Description
SCHED0
bxxxxxxx1
Scheduler 0:
Filter for cycles full from scheduler bank 0
SCHED1
bxxxxxx1x
Scheduler 1:
Filter for cycles full from scheduler bank 1
ALL
bxxxxxx11
All:
Cycles full from both schedulers
TxR_AK_CYCLES_FULL
•
•
•
•
•
Title: AK Egress Full
Category: AK_EGRESS Events
Event Code: 0x32
Max. Inc/Cyc: 1, Register Restrictions: 0-3
Definition: AK Egress Full
Table 2-55. Unit Masks for TxR_AK_CYCLES_FULL
Extension
umask
[15:8]
Description
SCHED0
bxxxxxxx1
Scheduler 0:
Filter for cycles full from scheduler bank 0
SCHED1
bxxxxxx1x
Scheduler 1:
Filter for cycles full from scheduler bank 1
ALL
bxxxxxx11
All:
Cycles full from both schedulers
TxR_AK_NDR
•
•
•
•
•
Title: Outbound NDR Ring Transactions
Category: OUTBOUND_TX Events
Event Code: 0x0E
Max. Inc/Cyc: 1, Register Restrictions: 0-3
Definition: Counts the number of outbound NDR transactions sent on the AK ring. NDR stands for
"non-data response" and is generally used for completions that do not include data. AK NDR is
used for messages to the local socket.
TxR_BL
•
•
•
•
•
Title: Outbound DRS Ring Transactions to Cache
Category: OUTBOUND_TX Events
Event Code: 0x10
Max. Inc/Cyc: 1, Register Restrictions: 0-3
Definition: Counts the number of DRS messages sent out on the BL ring.
the destination.
Reference Number: 327043-001
This can be filtered by
57
Intel® Xeon® Processor E5-2600 Product Family Uncore Performance Monitoring
Table 2-56. Unit Masks for TxR_BL
Extension
umask
[15:8]
Description
DRS_CACHE
bxxxxxxx1
Data to Cache:
Filter for data being sent to the cache.
DRS_CORE
bxxxxxx1x
Data to Core:
Filter for data being sent directly to the requesting core.
DRS_QPI
bxxxxx1xx
Data to Intel® QPI:
Filter for data being sent to a remote socket over Intel® QPI.
TxR_BL_CYCLES_FULL
•
•
•
•
•
Title: BL Egress Full
Category: BL_EGRESS Events
Event Code: 0x36
Max. Inc/Cyc: 1, Register Restrictions: 0-3
Definition: BL Egress Full
Table 2-57. Unit Masks for TxR_BL_CYCLES_FULL
Extension
umask
[15:8]
Description
SCHED0
bxxxxxxx1
Scheduler 0:
Filter for cycles full from scheduler bank 0
SCHED1
bxxxxxx1x
Scheduler 1:
Filter for cycles full from scheduler bank 1
ALL
bxxxxxx11
All:
Cycles full from both schedulers
WPQ_CYCLES_NO_REG_CREDITS
•
•
•
•
•
Title: HA iMC CHN0 WPQ Credits Empty - Regular
Category: WPQ_CREDITS Events
Event Code: 0x18
Max. Inc/Cyc: 4, Register Restrictions: 0-3
Definition: Counts the number of cycles when there are no "regular" credits available for posting
writes from the HA into the iMC. In order to send writes into the memory controller, the HA must
first acquire a credit for the iMC's WPQ (write pending queue). This queue is broken into regular
credits/buffers that are used by general writes, and "special" requests such as ISOCH writes. This
count only tracks the regular credits Common high banwidth workloads should be able to make use
of all of the regular buffers, but it will be difficult (and uncommon) to make use of both the regular
and special buffers at the same time. One can filter based on the memory controller channel. One
or more channels can be tracked at a given time.
Table 2-58. Unit Masks for WPQ_CYCLES_NO_REG_CREDITS
Extension
58
umask
[15:8]
Description
CHN0
bxxxxxxx1
Channel 0:
Filter for memory controller channel 0 only.
CHN1
bxxxxxx1x
Channel 1:
Filter for memory controller channel 1 only.
CHN2
bxxxxx1xx
Channel 2:
Filter for memory controller channel 2 only.
CHN3
bxxxx1xxx
Channel 3:
Filter for memory controller channel 3 only.
Reference Number: 327043-001
Intel® Xeon® Processor E5-2600 Product Family Uncore Performance Monitoring
2.5
Memory Controller (iMC) Performance Monitoring
2.5.1
Overview of the iMC
The integrated Memory Controller provides the interface to DRAM and communicates to the rest of
the uncore through the Home Agent (i.e. the iMC does not connect to the Ring).
In conjunction with the HA, the memory controller also provides a variety of RAS features, such as
ECC, lockstep, memory access retry, memory scrubbing, thermal throttling, mirroring, and rank
sparing.
2.5.2
Functional Overview
The memory controller is the interface between the home Home Agent (HA) and DRAM, translating
read and write commands into specific memory commands and schedules them with respect to
memory timing. The other main function of the memory controller is advanced ECC support.
Because of the data path affinity to the HA data path, the HA is paired with the memory controller.
The Intel Xeon Processor E5-2600 supports four channels of DDR3 or metaRAM. For DDR3, the
number of DIMMs per channel depends on the speed it is running and the package.
• Support for unbuffered DDR3 and registered DDR3
• Up to four independent DDR3 channels
• Eight independent banks per rank
• Support for DDR3 frequencies of 800,1067, 1333, 1600 GT/s.
dependent on the number of DIMMs per channel.
The speed achievable is
• Up to three DIMMs per channel (depends on the speed)
• Support for x4, x8 and x16 data lines per native DDR3 device
• ECC support (correct any error within a x4 device)
• Lockstep support for x8 chipfail
• Open or closed page policy
• Channel Mirroring per socket
• Demand and Patrol Scrubbing support
• Memory Initialization
• Poisoning Support
• Support for LR-DIMMs (load reduced) for a buffered memory solution demanding higher capacity
memory subsytems.
• Support for low voltage DDR3 (LV-DDR3, 1.35V)
2.5.3
iMC Performance Monitoring Overview
The iMC supports event monitoring through four 48-bit wide counters
(MC_CHy_PCI_PMON_CTR{3:0}) and one fixed counter (MC_CHy_PCI_PMON_FIXED_CTR) for each
DRAM channel (of which there are 4 in Intel Xeon Processor E5-2600 family) the MC is attached to.
Each of these counters can be programmed (MC_CHy_PCI_PMON_CTL{3:0}) to capture any MC
event. The MC counters will increment by a maximum of 8b per cycle.
Reference Number: 327043-001
59
Intel® Xeon® Processor E5-2600 Product Family Uncore Performance Monitoring
For information on how to setup a monitoring session, refer to Section 2.1, “Uncore Per-Socket
Performance Monitoring Control”.
2.5.4
iMC Performance Monitors
Table 2-59. iMC Performance Monitoring MSRs
PCICFG
Address
Register Name
PCICFG Base Address
Size
(bits)
Description
Dev:Func
MC Channel 0 PMON Registers
D16:F0
MC Channel 1 PMON Registers
D16:F1
MC Channel 2 PMON Registers
D16:F4
MC Channel 3 PMON Registers
D16:F5
Box-Level Control/Status
MC_CHy_PCI_PMON_BOX_CTL
F4
32
MC Channel y PMON Box-Wide Control
Generic Counter Control
MC_CHy_PCI_PMON_FIXED_CTL
F0
32
MC Channel y PMON Control for Fixed Counter
MC_CHy_PCI_PMON_CTL3
E4
32
MC Channel y PMON Control for Counter 3
MC_CHy_PCI_PMON_CTL2
E0
32
MC Channel y PMON Control for Counter 2
MC_CHy_PCI_PMON_CTL1
DC
32
MC Channel y PMON Control for Counter 1
MC_CHy_PCI_PMON_CTL0
D8
32
MC Channel y PMON Control for Counter 0
Generic Counters
2.5.4.1
MC_CHy_PCI_PMON_FIXED_CTR
D4+D0
32x2
MC Channel y PMON Fixed Counter
MC_CHy_PCI_PMON_CTR3
BC+B8
32x2
MC Channel y PMON Counter 3
MC_CHy_PCI_PMON_CTR2
B4+B0
32x2
MC Channel y PMON Counter 2
MC_CHy_PCI_PMON_CTR1
AC+A8
32x2
MC Channel y PMON Counter 1
MC_CHy_PCI_PMON_CTR0
A4+A0
32x2
MC Channel y PMON Counter 0
MC Box Level PMON State
The following registers represent the state governing all box-level PMUs in the MC Boxes.
In the case of the MC, the MC_CHy_PCI_PMON_BOX_CTL register governs what happens when a
freeze signal is received (.frz_en). It also provides the ability to manually freeze the counters in the
box (.frz) .
Table 2-60. MC_CHy_PCI_PMON_BOX_CTL Register – Field Definitions (Sheet 1 of 2)
Field
Bits
Attr
HW
Reset
Val
Description
rsv
31:18
RV
0
Reserved (?)
rsv
17
RV
0
Reserved; SW must write to 0 else behavior is undefined.
frz_en
16
WO
0
Freeze Enable.
If set to 1 and a freeze signal is received, the counters will be
stopped or ‘frozen’, else the freeze signal will be ignored.
60
Reference Number: 327043-001
Intel® Xeon® Processor E5-2600 Product Family Uncore Performance Monitoring
Table 2-60. MC_CHy_PCI_PMON_BOX_CTL Register – Field Definitions (Sheet 2 of 2)
Field
Bits
Attr
HW
Reset
Val
Description
rsv
15:9
RV
0
Reserved (?)
frz
8
WO
0
Freeze.
If set to 1 and the .frz_en is 1, the counters in this box will be
frozen.
rsv
7:2
RV
0
Reserved (?)
rsv
1:0
RV
0
Reserved; SW must write to 0 else behavior is undefined.
U
2.5.4.2
MC PMON state - Counter/Control Pairs
The following table defines the layout of the MC performance monitor control registers. The main task
of these configuration registers is to select the event to be monitored by their respective data counter
(.ev_sel, .umask). Additional control bits are provided to shape the incoming events (e.g. .invert,
.edge_det, .thresh).
Table 2-61. MC_CHy_PCI_PMON_CTL{3-0} Register – Field Definitions
Field
thresh
invert
Bits
Attr
HW
Reset
Val
Description
31:24
RW-V
0
Threshold used in counter comparison.
23
RW-V
0
Invert comparison against Threshold.
0 - comparison will be ‘is event increment >= threshold?’.
1 - comparison is inverted - ‘is event increment < threshold?’
NOTE: .invert is in series following .thresh, Due to this, the
.thresh field must be set to a non-0 value. For events that
increment by no more than 1 per cycle, set .thresh to 0x1.
Also, if .edge_det is set to 1, the counter will increment when a 1
to 0 transition (i.e. falling edge) is detected.
en
rsv
22
RW-V
0
Local Counter Enable.
21:20
RV
0
Reserved. SW must write to 0 else behavior is undefined.
rsv
19
RV
0
Reserved (?)
edge_det
18
RW-V
0
When set to 1, rather than measuring the event in each cycle it
is active, the corresponding counter will increment when a 0 to 1
transition (i.e. rising edge) is detected.
When 0, the counter will increment in each cycle that the event
is asserted.
NOTE: .edge_det is in series following .thresh, Due to this, the
.thresh field must be set to a non-0 value. For events that
increment by no more than 1 per cycle, set .thresh to 0x1.
rsv
17:16
RV
0
Reserved. SW must write to 0 else behavior is undefined.
umask
15:8
RW-V
0
Select subevents to be counted within the selected event.
ev_sel
7:0
RW-V
0
Select event to be counted.
Reference Number: 327043-001
61
Intel® Xeon® Processor E5-2600 Product Family Uncore Performance Monitoring
All MC performance monitor data registers are 48-bit wide. Should a counter overflow (a carry out
from bit 47), the counter will wrap and continue to collect events.
If accessible, software can continuously read the data registers without disabling event collection.
This is a counter that always tracks the number of DRAM clocks (dclks - half of DDR speed) in the iMC.
The dclk never changes frequency (on a given system), and therefore is a good measure of wall clock
(unlike the Uncore clock which can change frequency based on system load). This clock is generally a
bit slower than the uclk (~800MHz to ~1.066GHz) and therefore has less fidelity.
Table 2-62. MC_CHy_PCI_PMON_FIXED_CTL Register – Field Definitions
Field
Bits
rsv
31:24
rsv
en
Attr
HW
Reset
Val
Description
RV
0
Reserved (?)
23
RV
0
Reserved. SW must write to 0 else behavior is undefined.
22
RW-V
0
Local Counter Enable.
rsv
21:20
RV
0
Reserved. SW must write to 0 else behavior is undefined.
rst
19
WO
0
When set to 1, the corresponding counter will be cleared to 0.
rsv
18:0
RV
0
Reserved (?)
Table 2-63. MC_CHy_PCI_PMON_CTR{FIXED,3-0} Register – Field Definitions
Field
rsv
event_count
Bits
Attr
HW
Reset
Val
Description
63:48
RV
0
Reserved (?)
47:0
RW-V
0
48-bit performance event counter
2.5.5
iMC Performance Monitoring Events
2.5.5.1
An Overview:
A sampling of events available for monitoring in the iMC:
• Translated commands: Various Read and Write CAS commands
• Memory commands: CAS, Precharge, Refresh, Preemptions, etc,
• Page hits and page misses.
• Page Closing Events
• Control of power consumption: Thermal Throttling by Rank, Time spent in CKE ON mode,
etc.
and many more.
Internal iMC Queues:
62
Reference Number: 327043-001
Intel® Xeon® Processor E5-2600 Product Family Uncore Performance Monitoring
RPQ - Read Pending Queue.
NOTE: HA also tracks some information related to the iMC’s RPQ.
WPQ - Write Pending Queue.
2.5.6
NOTE: HA also tracks some information related to the iMC’s WPQ.
iMC Box Events Ordered By Code
The following table summarizes the directly measured iMC Box events.
Table 2-64. Performance Monitor Events for iMC
Event
Code
Ctrs
Max
Inc/
Cyc
ACT_COUNT
0x01
0-3
1
DRAM Activate Count
PRE_COUNT
0x02
0-3
1
DRAM Precharge commands.
Symbol Name
2.5.7
Description
CAS_COUNT
0x04
0-3
1
DRAM RD_CAS and WR_CAS Commands.
DRAM_REFRESH
0x05
0-3
1
Number of DRAM Refreshes Issued
DRAM_PRE_ALL
0x06
0-3
1
DRAM Precharge All Commands
MAJOR_MODES
0x07
0-3
1
Cycles in a Major Mode
PREEMPTION
0x08
0-3
1
Read Preemption Count
ECC_CORRECTABLE_ERRORS
0x09
0-3
1
ECC Correctable Errors
RPQ_INSERTS
0x10
0-3
1
Read Pending Queue Allocations
RPQ_CYCLES_NE
0x11
0-3
1
Read Pending Queue Not Empty
RPQ_CYCLES_FULL
0x12
0-3
1
Read Pending Queue Full Cycles
WPQ_INSERTS
0x20
0-3
1
Write Pending Queue Allocations
WPQ_CYCLES_NE
0x21
0-3
1
Write Pending Queue Not Empty
WPQ_CYCLES_FULL
0x22
0-3
1
Write Pending Queue Full Cycles
WPQ_READ_HIT
0x23
0-3
1
Write Pending Queue CAM Match
WPQ_WRITE_HIT
0x24
0-3
1
Write Pending Queue CAM Match
1
POWER_THROTTLE_CYCLES
0x41
0-3
POWER_SELF_REFRESH
0x43
0-3
Throttle Cycles for Rank 0
Clock-Enabled Self-Refresh
RPQ_OCCUPANCY
0x80
0-3
22
Read Pending Queue Occupancy
WPQ_OCCUPANCY
0x81
0-3
32
Write Pending Queue Occupancy
CKE_ON_CYCLES by Rank
POWER_CKE_CYCLES
0x83
0-3
16
POWER_CHANNEL_DLLOFF
0x84
0-3
1
Channel DLLOFF Cycles
POWER_CHANNEL_PPD
0x85
0-3
4
Channel PPD Cycles
POWER_CRITICAL_THROTTLE_CYCL
ES
0x86
0-3
1
Critical Throttle Cycles
iMC Box Common Metrics (Derived Events)
The following table summarizes metrics commonly calculcated from iMC Box events.
Reference Number: 327043-001
63
Intel® Xeon® Processor E5-2600 Product Family Uncore Performance Monitoring
Table 2-65. Metrics Derived from iMC Events
Symbol Name:
Definition
2.5.8
Equation
MEM_BW_READS:
Memory bandwidth consumed by reads.
Expressed in bytes.
(CAS_COUNT.RD * 64)
MEM_BW_TOTAL:
Total memory bandwidth. Expressed in
bytes.
MEM_BW_READS + MEM_BW_WRITES
MEM_BW_WRITES:
Memory bandwidth consumed by writes
Expressed in bytes.
(CAS_COUNT.WR * 64)
PCT_CYCLES_CRITICAL_THROTTLE:
The percentage of cycles all DRAM ranks in
critical thermal throttling
POWER_CRITICAL_THROTTLE_CYCLES /
MC_Chy_PCI_PMON_CTR_FIXED
PCT_CYCLES_DLOFF:
The percentage of cycles all DRAM ranks in
CKE slow (DLOFF) mode
POWER_CHANNEL_DLOFF / MC_Chy_PCI_PMON_CTR_FIXED
PCT_CYCLES_DRAM_RANKx_IN_CKE:
The percentage of cycles DRAM rank (x)
spent in CKE ON mode.
POWER_CKE_CYCLES.RANKx / MC_Chy_PCI_PMON_CTR_FIXED
PCT_CYCLES_DRAM_RANKx_IN_THR:
The percentage of cycles DRAM rank (x)
spent in thermal throttling.
POWER_THROTTLE_CYCLES.RANKx /
MC_Chy_PCI_PMON_CTR_FIXED
PCT_CYCLES_PPD:
The percentage of cycles all DRAM ranks in
PPD mode
POWER_CHANNEL_PPD / MC_Chy_PCI_PMON_CTR_FIXED
PCT_CYCLES_SELF_REFRESH:
The percentage of cycles Memory is in self
refresh power mode
POWER_SELF_REFRESH / MC_Chy_PCI_PMON_CTR_FIXED
PCT_RD_REQUESTS:
Percentage of read requests from total
requests.
RPQ_INSERTS / (RPQ_INSERTS + WPQ_INSERTS)
PCT_REQUESTS_PAGE_EMPTY:
Percentage of memory requests that
resulted in Page Empty
(ACT_COUNT - PRE_COUNT.PAGE_MISS)/ (CAS_COUNT.RD +
CAS_COUNT.WR)
PCT_REQUESTS_PAGE_HIT:
Percentage of memory requests that
resulted in Page Hits
1 - (PCT_REQUESTS_PAGE_EMPTY +
PCT_REQUESTS_PAGE_MISS)
PCT_REQUESTS_PAGE_MISS:
Percentage of memory requests that
resulted in Page Misses
PRE_COUNT.PAGE_MISS / (CAS_COUNT.RD + CAS_COUNT.WR)
PCT_WR_REQUESTS:
Percentage of write requests from total
requests.
WPQ_INSERTS / (RPQ_INSERTS + WPQ_INSERTS)
iMC Box Performance Monitor Event List
The section enumerates the performance monitoring events for the iMC Box.
ACT_COUNT
•
•
•
•
64
Title: DRAM Activate Count
Category: ACT Events
Event Code: 0x01
Max. Inc/Cyc: 1, Register Restrictions: 0-3
Reference Number: 327043-001
Intel® Xeon® Processor E5-2600 Product Family Uncore Performance Monitoring
• Definition: Counts the number of DRAM Activate commands sent on this channel. Activate commands are issued to open up a page on the DRAM devices so that it can be read or written to with a
CAS. One can calculate the number of Page Misses by subtracting the number of Page Miss precharges from the number of Activates.
CAS_COUNT
•
•
•
•
•
Title: DRAM RD_CAS and WR_CAS Commands.
Category: CAS Events
Event Code: 0x04
Max. Inc/Cyc: 1, Register Restrictions: 0-3
Definition: DRAM RD_CAS and WR_CAS Commands
Table 2-66. Unit Masks for CAS_COUNT
Extension
umask
[15:8]
Description
RD_REG
bxxxxxxx1
All DRAM RD_CAS (w/ and w/out auto-pre):
Counts the total number or DRAM Read CAS commands issued on
this channel. This includes both regular RD CAS commands as well
as those with implicit Precharge. AutoPre is only used in systems
that are using closed page policy. We do not filter based on major
mode, as RD_CAS is not issued during WMM (with the exception of
underfills).
RD_UNDERFILL
bxxxxxx1x
Underfill Read Issued:
Counts the number of underfill reads that are issued by the memory
controller. This will generally be about the same as the number of
partial writes, but may be slightly less because of partials hitting in
the WPQ. While it is possible for underfills to be issed in both WMM
and RMM, this event counts both.
RD
b00000011
All DRAM Reads (RD_CAS + Underfills):
Counts the total number of DRAM Read CAS commands issued on
this channel (including underfills).
WR_WMM
bxxxxx1xx
DRAM WR_CAS (w/ and w/out auto-pre) in Write Major Mode:
Counts the total number or DRAM Write CAS commands issued on
this channel while in Write-Major-Mode.
WR_RMM
bxxxx1xxx
DRAM WR_CAS (w/ and w/out auto-pre) in Read Major Mode:
Counts the total number of Opportunistic" DRAM Write CAS
commands issued on this channel while in Read-Major-Mode.
WR
b00001100
All DRAM WR_CAS (both Modes):
Counts the total number of DRAM Write CAS commands issued on
this channel.
ALL
b00001111
All DRAM WR_CAS (w/ and w/out auto-pre):
Counts the total number of DRAM CAS commands issued on this
channel.
DRAM_PRE_ALL
•
•
•
•
•
Title: DRAM Precharge All Commands
Category: DRAM_PRE_ALL Events
Event Code: 0x06
Max. Inc/Cyc: 1, Register Restrictions: 0-3
Definition: Counts the number of times that the precharge all command was sent.
DRAM_REFRESH
•
•
•
•
•
Title: Number of DRAM Refreshes Issued
Category: DRAM_REFRESH Events
Event Code: 0x05
Max. Inc/Cyc: 1, Register Restrictions: 0-3
Definition: Counts the number of refreshes issued.
Reference Number: 327043-001
65
Intel® Xeon® Processor E5-2600 Product Family Uncore Performance Monitoring
Table 2-67. Unit Masks for DRAM_REFRESH
Extension
umask
[15:8]
PANIC
bxxxxxx1x
HIGH
bxxxxx1xx
Description
ECC_CORRECTABLE_ERRORS
•
•
•
•
•
Title: ECC Correctable Errors
Category: ECC Events
Event Code: 0x09
Max. Inc/Cyc: 1, Register Restrictions: 0-3
Definition: Counts the number of ECC errors detected and corrected by the iMC on this channel.
This counter is only useful with ECC DRAM devices. This count will increment one time for each correction regardless of the number of bits corrected. The iMC can correct up to 4 bit errors in independent channel mode and 8 bit erros in lockstep mode.
MAJOR_MODES
•
•
•
•
•
Title: Cycles in a Major Mode
Category: MAJOR_MODES Events
Event Code: 0x07
Max. Inc/Cyc: 1, Register Restrictions: 0-3
Definition: Counts the total number of cycles spent in a major mode (selected by a filter) on the
given channel. Major modea are channel-wide, and not a per-rank (or dimm or bank) mode.
Table 2-68. Unit Masks for MAJOR_MODES
Extension
umask
[15:8]
Description
READ
bxxxxxxx1
Read Major Mode:
Read Major Mode is the default mode for the iMC, as reads are
generally more critical to forward progress than writes.
WRITE
bxxxxxx1x
Write Major Mode:
This mode is triggered when the WPQ hits high occupancy and causes
writes to be higher priority than reads. This can cause blips in the
available read bandwidth in the system and temporarily increase read
latencies in order to achieve better bus utilizations and higher
bandwidth.
PARTIAL
bxxxxx1xx
Partial Major Mode:
This major mode is used to drain starved underfill reads. Regular
reads and writes are blocked and only underfill reads will be
processed.
ISOCH
bxxxx1xxx
Isoch Major Mode:
We group these two modes together so that we can use four counters
to track each of the major modes at one time. These major modes
are used whenever there is an ISOCH txn in the memory controller.
In these mode, only ISOCH transactions are processed.
POWER_CHANNEL_DLLOFF
•
•
•
•
•
•
66
Title: Channel DLLOFF Cycles
Category: POWER Events
Event Code: 0x84
Max. Inc/Cyc: 1, Register Restrictions: 0-3
Definition: Number of cycles when all the ranks in the channel are in CKE Slow (DLLOFF) mode.
NOTE: IBT = Input Buffer Termination = Off
Reference Number: 327043-001
Intel® Xeon® Processor E5-2600 Product Family Uncore Performance Monitoring
POWER_CHANNEL_PPD
•
•
•
•
•
Title: Channel PPD Cycles
Category: POWER Events
Event Code: 0x85
Max. Inc/Cyc: 4, Register Restrictions: 0-3
Definition: Number of cycles when all the ranks in the channel are in PPD mode. If IBT=off is
enabled, then this can be used to count those cycles. If it is not enabled, then this can count the
number of cycles when that could have been taken advantage of.
• NOTE: IBT = Input Buffer Termination = On
POWER_CKE_CYCLES
•
•
•
•
•
Title: CKE_ON_CYCLES by Rank
Category: POWER Events
Event Code: 0x83
Max. Inc/Cyc: 16, Register Restrictions: 0-3
Definition: Number of cycles spent in CKE ON mode. The filter allows you to select a rank to monitor. If multiple ranks are in CKE ON mode at one time, the counter will ONLY increment by one
rather than doing accumulation. Multiple counters will need to be used to track multiple ranks
simultaneously. There is no distinction between the different CKE modes (APD, PPDS, PPDF). This
can be determined based on the system programming. These events should commonly be used
with Invert to get the number of cycles in power saving mode. Edge Detect is also useful here.
Make sure that you do NOT use Invert with Edge Detect (this just confuses the system and is not
necessary).
Table 2-69. Unit Masks for POWER_CKE_CYCLES
Extension
umask
[15:8]
Description
RANK0
bxxxxxxx1
DIMM ID
RANK1
bxxxxxx1x
DIMM ID
RANK2
bxxxxx1xx
DIMM ID
RANK3
bxxxx1xxx
DIMM ID
RANK4
bxxx1xxxx
DIMM ID
RANK5
bxx1xxxxx
DIMM ID
RANK6
bx1xxxxxx
DIMM ID
RANK7
b1xxxxxxx
DIMM ID
POWER_CRITICAL_THROTTLE_CYCLES
•
•
•
•
•
Title: Critical Throttle Cycles
Category: POWER Events
Event Code: 0x86
Max. Inc/Cyc: 1, Register Restrictions: 0-3
Definition: Counts the number of cycles when the iMC is in critical thermal throttling. When this
happens, all traffic is blocked. This should be rare unless something bad is going on in the platform.
There is no filtering by rank for this event.
POWER_SELF_REFRESH
•
•
•
•
Title: Clock-Enabled Self-Refresh
Category: POWER Events
Event Code: 0x43
Max. Inc/Cyc: , Register Restrictions: 0-3
Reference Number: 327043-001
67
Intel® Xeon® Processor E5-2600 Product Family Uncore Performance Monitoring
• Definition: Counts the number of cycles when the iMC is in self-refresh and the iMC still has a
clock. This happens in some package C-states. For example, the PCU may ask the iMC to enter
self-refresh even though some of the cores are still processing. One use of this is for Monroe technology. Self-refresh is required during package C3 and C6, but there is no clock in the iMC at this
time, so it is not possible to count these cases.
POWER_THROTTLE_CYCLES
•
•
•
•
•
Title: Throttle Cycles for Rank 0
Category: POWER Events
Event Code: 0x41
Max. Inc/Cyc: 1, Register Restrictions: 0-3
Definition: Counts the number of cycles while the iMC is being throttled by either thermal constraints or by the PCU throttling. It is not possible to distinguish between the two. This can be filtered by rank. If multiple ranks are selected and are being throttled at the same time, the counter
will only increment by 1.
Table 2-70. Unit Masks for POWER_THROTTLE_CYCLES
Extension
umask
[15:8]
Description
RANK0
bxxxxxxx1
DIMM ID:
Thermal throttling is performed per DIMM. We support 3 DIMMs per
channel. This ID allows us to filter by ID.
RANK1
bxxxxxx1x
DIMM ID
RANK2
bxxxxx1xx
DIMM ID
RANK3
bxxxx1xxx
DIMM ID
RANK4
bxxx1xxxx
DIMM ID
RANK5
bxx1xxxxx
DIMM ID
RANK6
bx1xxxxxx
DIMM ID
RANK7
b1xxxxxxx
DIMM ID
PREEMPTION
•
•
•
•
•
Title: Read Preemption Count
Category: PREEMPTION Events
Event Code: 0x08
Max. Inc/Cyc: 1, Register Restrictions: 0-3
Definition: Counts the number of times a read in the iMC preempts another read or write. Generally reads to an open page are issued ahead of requests to closed pages. This improves the page
hit rate of the system. However, high priority requests can cause pages of active requests to be
closed in order to get them out. This will reduce the latency of the high-priority request at the
expense of lower bandwidth and increased overall average latency.
Table 2-71. Unit Masks for PREEMPTION
Extension
68
umask
[15:8]
Description
RD_PREEMPT_RD
bxxxxxxx1
Read over Read Preemption:
Filter for when a read preempts another read.
RD_PREEMPT_WR
bxxxxxx1x
Read over Write Preemption:
Filter for when a read preempts a write.
Reference Number: 327043-001
Intel® Xeon® Processor E5-2600 Product Family Uncore Performance Monitoring
PRE_COUNT
•
•
•
•
•
Title: DRAM Precharge commands.
Category: PRE Events
Event Code: 0x02
Max. Inc/Cyc: 1, Register Restrictions: 0-3
Definition: Counts the number of DRAM Precharge commands sent on this channel.
Table 2-72. Unit Masks for PRE_COUNT
Extension
umask
[15:8]
Description
PAGE_MISS
bxxxxxxx1
Precharges due to page miss:
Counts the number of DRAM Precharge commands sent on this
channel as a result of page misses. This does not include explicit
precharge commands sent with CAS commands in Auto-Precharge
mode. This does not include PRE commands sent as a result of the
page close counter expiration.
PAGE_CLOSE
bxxxxxx1x
Precharge due to timer expiration:
Counts the number of DRAM Precharge commands sent on this
channel as a result of the page close counter expiring. This does not
include implicit precharge commands sent in auto-precharge mode.
RPQ_CYCLES_FULL
•
•
•
•
•
Title: Read Pending Queue Full Cycles
Category: RPQ Events
Event Code: 0x12
Max. Inc/Cyc: 1, Register Restrictions: 0-3
Definition: Counts the number of cycles when the Read Pending Queue is full. When the RPQ is
full, the HA will not be able to issue any additional read requests into the iMC. This count should be
similar count in the HA which tracks the number of cycles that the HA has no RPQ credits, just
somewhat smaller to account for the credit return overhead. We generally do not expect to see
RPQ become full except for potentially during Write Major Mode or while running with slow DRAM.
This event only tracks non-ISOC queue entries.
RPQ_CYCLES_NE
•
•
•
•
•
Title: Read Pending Queue Not Empty
Category: RPQ Events
Event Code: 0x11
Max. Inc/Cyc: 1, Register Restrictions: 0-3
Definition: Counts the number of cycles that the Read Pending Queue is not empty. This can then
be used to calculate the average occupancy (in conjunction with the Read Pending Queue Occupancy count). The RPQ is used to schedule reads out to the memory controller and to track the
requests. Requests allocate into the RPQ soon after they enter the memory controller, and need
credits for an entry in this buffer before being sent from the HA to the iMC. They deallocate after
the CAS command has been issued to memory. This filter is to be used in conjunction with the
occupancy filter so that one can correctly track the average occupancies for schedulable entries and
scheduled requests.
RPQ_INSERTS
•
•
•
•
•
Title: Read Pending Queue Allocations
Category: RPQ Events
Event Code: 0x10
Max. Inc/Cyc: 1, Register Restrictions: 0-3
Definition: Counts the number of allocations into the Read Pending Queue. This queue is used to
schedule reads out to the memory controller and to track the requests. Requests allocate into the
RPQ soon after they enter the memory controller, and need credits for an entry in this buffer before
Reference Number: 327043-001
69
Intel® Xeon® Processor E5-2600 Product Family Uncore Performance Monitoring
being sent from the HA to the iMC. They deallocate after the CAS command has been issued to
memory. This includes both ISOCH and non-ISOCH requests.
RPQ_OCCUPANCY
•
•
•
•
•
Title: Read Pending Queue Occupancy
Category: RPQ Events
Event Code: 0x80
Max. Inc/Cyc: 22, Register Restrictions: 0-3
Definition: Accumulates the occupancies of the Read Pending Queue each cycle. This can then be
used to calculate both the average occupancy (in conjunction with the number of cycles not empty)
and the average latency (in conjunction with the number of allocations). The RPQ is used to schedule reads out to the memory controller and to track the requests. Requests allocate into the RPQ
soon after they enter the memory controller, and need credits for an entry in this buffer before
being sent from the HA to the iMC. They deallocate after the CAS command has been issued to
memory.
WPQ_CYCLES_FULL
•
•
•
•
•
Title: Write Pending Queue Full Cycles
Category: WPQ Events
Event Code: 0x22
Max. Inc/Cyc: 1, Register Restrictions: 0-3
Definition: Counts the number of cycles when the Write Pending Queue is full. When the WPQ is
full, the HA will not be able to issue any additional read requests into the iMC. This count should be
similar count in the HA which tracks the number of cycles that the HA has no WPQ credits, just
somewhat smaller to account for the credit return overhead.
WPQ_CYCLES_NE
•
•
•
•
•
Title: Write Pending Queue Not Empty
Category: WPQ Events
Event Code: 0x21
Max. Inc/Cyc: 1, Register Restrictions: 0-3
Definition: Counts the number of cycles that the Write Pending Queue is not empty. This can then
be used to calculate the average queue occupancy (in conjunction with the WPQ Occupancy Accumulation count). The WPQ is used to schedule write out to the memory controller and to track the
writes. Requests allocate into the WPQ soon after they enter the memory controller, and need credits for an entry in this buffer before being sent from the HA to the iMC. They deallocate after being
issued to DRAM. Write requests themselves are able to complete (from the perspective of the rest
of the system) as soon they have "posted" to the iMC. This is not to be confused with actually performing the write to DRAM. Therefore, the average latency for this queue is actually not useful for
deconstruction intermediate write latencies.
WPQ_INSERTS
•
•
•
•
•
70
Title: Write Pending Queue Allocations
Category: WPQ Events
Event Code: 0x20
Max. Inc/Cyc: 1, Register Restrictions: 0-3
Definition: Counts the number of allocations into the Write Pending Queue. This can then be used
to calculate the average queuing latency (in conjunction with the WPQ occupancy count). The WPQ
is used to schedule write out to the memory controller and to track the writes. Requests allocate
into the WPQ soon after they enter the memory controller, and need credits for an entry in this buffer before being sent from the HA to the iMC. They deallocate after being issued to DRAM. Write
requests themselves are able to complete (from the perspective of the rest of the system) as soon
they have "posted" to the iMC.
Reference Number: 327043-001
Intel® Xeon® Processor E5-2600 Product Family Uncore Performance Monitoring
WPQ_OCCUPANCY
•
•
•
•
•
Title: Write Pending Queue Occupancy
Category: WPQ Events
Event Code: 0x81
Max. Inc/Cyc: 32, Register Restrictions: 0-3
Definition: Accumulates the occupancies of the Write Pending Queue each cycle. This can then be
used to calculate both the average queue occupancy (in conjunction with the number of cycles not
empty) and the average latency (in conjunction with the number of allocations). The WPQ is used
to schedule write out to the memory controller and to track the writes. Requests allocate into the
WPQ soon after they enter the memory controller, and need credits for an entry in this buffer before
being sent from the HA to the iMC. They deallocate after being issued to DRAM. Write requests
themselves are able to complete (from the perspective of the rest of the system) as soon they have
"posted" to the iMC. This is not to be confused with actually performing the write to DRAM. Therefore, the average latency for this queue is actually not useful for deconstruction intermediate write
latencies. So, we provide filtering based on if the request has posted or not. By using the "not
posted" filter, we can track how long writes spent in the iMC before completions were sent to the
HA. The "posted" filter, on the other hand, provides information about how much queueing is actually happenning in the iMC for writes before they are actually issued to memory. High average
occupancies will generally coincide with high write major mode counts.
WPQ_READ_HIT
•
•
•
•
•
Title: Write Pending Queue CAM Match
Category: WPQ Events
Event Code: 0x23
Max. Inc/Cyc: 1, Register Restrictions: 0-3
Definition: Counts the number of times a request hits in the WPQ (write-pending queue). The iMC
allows writes and reads to pass up other writes to different addresses. Before a read or a write is
issued, it will first CAM the WPQ to see if there is a write pending to that address. When reads hit,
they are able to directly pull their data from the WPQ instead of going to memory. Writes that hit
will overwrite the existing data. Partial writes that hit will not need to do underfill reads and will
simply update their relevant sections.
WPQ_WRITE_HIT
•
•
•
•
•
Title: Write Pending Queue CAM Match
Category: WPQ Events
Event Code: 0x24
Max. Inc/Cyc: 1, Register Restrictions: 0-3
Definition: Counts the number of times a request hits in the WPQ (write-pending queue). The iMC
allows writes and reads to pass up other writes to different addresses. Before a read or a write is
issued, it will first CAM the WPQ to see if there is a write pending to that address. When reads hit,
they are able to directly pull their data from the WPQ instead of going to memory. Writes that hit
will overwrite the existing data. Partial writes that hit will not need to do underfill reads and will
simply update their relevant sections.
Reference Number: 327043-001
71
Intel® Xeon® Processor E5-2600 Product Family Uncore Performance Monitoring
2.6
Power Control (PCU) Performance Monitoring
2.6.1
Overview of the PCU
The PCU is the primary Power Controller.
The uncore implements a power control unit acting as a core/uncore power and thermal manager. It
runs its firmware on an internal micro-controller and coordinates the socket’s power states.
The PCU algorithmically governs the P-state of the processor, C-state of the core and the package Cstate of the socket. It also enables the core to go to a higher performance state (“turbo mode”) when
the proper set of conditions are met. Conversely, the PCU will throttle the processor to a lower
performance state when a thermal violation occurs.
Through specific events, the OS and the PCU will either promote or demote the C-State of each core
by altering the voltage and frequency. The system power state (S-state) of all the sockets in the
system is managed by the server legacy bridge in coordination with all socket PCUs.
The PCU communicates to all the other units through multiple PMLink interfaces on-die and Message
Channel to access their registers. The OS and BIOS communicates to the PCU thru standardized MSR
registers and ACPI.
The PCU also acts as the interface to external management controllers via PECI and voltage
regulators (NPTM). The DMI interface is the communication path from the southbridge for system
power management.
Note:
Many power saving features are tracked as events in their respective units. For
example, Intel® QPI Link Power saving states and Memory CKE statistics are captured
in the Intel® QPI Perfmon and iMC Perfmon respectively.
2.6.2
PCU Performance Monitoring Overview
The uncore PCU supports event monitoring through four 48-bit wide counters
(PCU_MSR_PMON_CTR{3:0}). Each of these counters can be programmed
(PCU_MSR_PMON_CTL{3:0}) to monitor any PCU event. The PCU counters can increment by a
maximum of 4b (?) per cycle.
Two extra 64-bit counters are also provided in the PCU to track C-State Residency. Although
documented in this manual for reference, these counters exist outside of the PMON infrastructure.
For information on how to setup a monitoring session, refer to Section 2.1, “Uncore Per-Socket
Performance Monitoring Control”.
2.6.3
PCU Performance Monitors
Table 2-73. PCU Performance Monitoring MSRs (Sheet 1 of 2)
MSR Name
MSR
Address
Size
(bits)
Description
Generic Counters
72
PCU_MSR_PMON_CTR3
0x0C39
64
PCU PMON Counter 3
PCU_MSR_PMON_CTR2
0x0C38
64
PCU PMON Counter 2
PCU_MSR_PMON_CTR1
0x0C37
64
PCU PMON Counter 1
Reference Number: 327043-001
Intel® Xeon® Processor E5-2600 Product Family Uncore Performance Monitoring
Table 2-73. PCU Performance Monitoring MSRs (Sheet 2 of 2)
MSR
Address
MSR Name
PCU_MSR_PMON_CTR0
0x0C36
Size
(bits)
64
Description
PCU PMON Counter 0
Box-Level Filter
PCU_MSR_PMON_BOX_FILTER
0x0C34
32
PCU PMON Filter
Generic Counter Control
PCU_MSR_PMON_CTL3
0x0C33
32
PCU PMON Control for Counter 3
PCU_MSR_PMON_CTL2
0x0C32
32
PCU PMON Control for Counter 2
PCU_MSR_PMON_CTL1
0x0C31
32
PCU PMON Control for Counter 1
PCU_MSR_PMON_CTL0
0x0C30
32
PCU PMON Control for Counter 0
Box-Level Control/Status
PCU_MSR_PMON_BOX_CTL
0x0C24
32
PCU PMON Box-Wide Control
Fixed (Non-PMON) Counters
2.6.3.1
PCU_MSR_CORE_C6_CTR
0x03FD
64
Fixed C-State Residency Counter
PCU_MSR_CORE_C3_CTR
0x03FC
64
Fixed C-State Residency Counter
PCU Box Level PMON State
The following registers represent the state governing all box-level PMUs in the PCU.
In the case of the PCU, the PCU_MSR_PMON_BOX_CTL register governs what happens when a freeze
signal is received (.frz_en). It also provides the ability to manually freeze the counters in the box
(.frz) and reset the generic state (.rst_ctrs and .rst_ctrl).
The PCU provides two extra MSRs that provide additional static performance information to software
but exist outside of the PMON infrastructure (e.g. they can’t be frozen or reset). They are included for
the convenience of software developers need to efficiently access this data.
Table 2-74. PCU_MSR_PMON_BOX_CTL Register – Field Definitions
Field
Bits
Attr
HW
Reset
Val
Description
rsv
31:18
RV
0
Reserved (?)
rsv
17
RV
0
Reserved; SW must write to 0 else behavior is undefined.
frz_en
16
WO
0
Freeze Enable.
If set to 1 and a freeze signal is received, the counters will be
stopped or ‘frozen’, else the freeze signal will be ignored.
rsv
15:9
RV
0
Reserved (?)
frz
8
WO
0
Freeze.
If set to 1 and the .frz_en is 1, the counters in this box will be
frozen.
rsv
7:2
RV
0
Reserved (?)
rst_ctrs
1
WO
0
Reset Counters.
When set to 1, the Counter Registers will be reset to 0.
rst_ctrl
0
WO
0
Reset Control.
When set to 1, the Counter Control Registers will be reset to 0.
Reference Number: 327043-001
73
Intel® Xeon® Processor E5-2600 Product Family Uncore Performance Monitoring
U
2.6.3.2
PCU PMON state - Counter/Control Pairs
The following table defines the layout of the PCU performance monitor control registers. The main
task of these configuration registers is to select the event to be monitored by their respective data
counter (.ev_sel, .umask). Additional control bits are provided to shape the incoming events (e.g.
.invert, .edge_det, .thresh) as well as provide additional functionality for monitoring software (.rst).
Due to the fact that much of the PCU’s functionality is provided by an embedded microcontroller,
many of the available events are generated by the microcontroller and handed off to the hardware for
capture by the PMON registers. Among the events generated by the microcontroller are occupancy
events allowing a user to measure the number of cores in a given C-state per-cycle. Given this
unique situation, extra control bits are provided to filter the ouput of the these special occupancy
events.
- .occ_invert - Changes the .thresh test condition to ‘<‘ for the occupancy events (when .ev_sel[7] is
set to 1)
- .occ_edge_det - Rather than accumulating the raw count each cycle (for events that can increment
by 1 per cycle), the register can capture transitions from no event to an event incoming for the PCU’s
occupancy events (when .ev_sel[7] is set to 1).
Table 2-75. PCU_MSR_PMON_CTL{3-0} Register – Field Definitions (Sheet 1 of 2)
Field
occ_edge_det
Bits
31
Attr
RW-V
HW
Reset
Val
0
Description
Enables edge detect for occupancy events (.ev_sel[7] is 1)
When set to 1, rather than measuring the event in each cycle it
is active, the corresponding counter will increment when a 0 to 1
transition (i.e. rising edge) is detected.
When 0, the counter will increment in each cycle that the event
is asserted.
NOTE: .edge_det is in series following .thresh, Due to this, the
.thresh field must be set to a non-0 value. For events that
increment by no more than 1 per cycle, set .thresh to 0x1.
occ_invert
30
RW-V
0
Invert comparison against Threshold for the PCU Occupancy
events (.ev_sel[7] is 1)
0 - comparison will be ‘is event increment >= threshold?’.
1 - comparison is inverted - ‘is event increment < threshold?’
NOTE: .invert is in series following .thresh, Due to this, the
.thresh field must be set to a non-0 value. For events that
increment by no more than 1 per cycle, set .thresh to 0x1.
Also, if .edge_det is set to 1, the counter will increment when a 1
to 0 transition (i.e. falling edge) is detected.
rsv
thresh
74
29
RV
0
Reserved. SW must write to 0 for proper operation.
28:24
RW-V
0
Threshold used in counter comparison.
Reference Number: 327043-001
Intel® Xeon® Processor E5-2600 Product Family Uncore Performance Monitoring
Table 2-75. PCU_MSR_PMON_CTL{3-0} Register – Field Definitions (Sheet 2 of 2)
Field
invert
Bits
23
Attr
RW-V
HW
Reset
Val
0
Description
Invert comparison against Threshold.
0 - comparison will be ‘is event increment >= threshold?’.
1 - comparison is inverted - ‘is event increment < threshold?’
NOTE: .invert is in series following .thresh, Due to this, the
.thresh field must be set to a non-0 value. For events that
increment by no more than 1 per cycle, set .thresh to 0x1.
Also, if .edge_det is set to 1, the counter will increment when a 1
to 0 transition (i.e. falling edge) is detected.
en
22
RW-V
0
Local Counter Enable.
rsv
21:20
RV
0
Reserved. SW must write to 0 for proper operation.
rsv
19
RV
0
Reserved (?)
edge_det
18
RW-V
0
When set to 1, rather than measuring the event in each cycle it
is active, the corresponding counter will increment when a 0 to 1
transition (i.e. rising edge) is detected.
When 0, the counter will increment in each cycle that the event
is asserted.
NOTE: .edge_det is in series following .thresh, Due to this, the
.thresh field must be set to a non-0 value. For events that
increment by no more than 1 per cycle, set .thresh to 0x1.
rst
17
WO
0
When set to 1, the corresponding counter will be cleared to 0.
rsv
16
RV
0
Reserved (?)
15:14
RW-V
0
Select which of three occupancy counters to use.
occ_sel
01 - Cores in C0
10 - Cores in C3
11 - Cores in C6
rsv
ev_sel
13:8
RV
0
Reserved (?)
7:0
RW-V
0
Select event to be counted.
NOTE: Bit 7 denotes whether the event requires the use of an
occupancy subcounter.
The PCU performance monitor data registers are 48-bit wide. Should a counter overflow (a carry out
from bit 47), the counter will wrap and continue to collect events.
If accessible, software can continuously read the data registers without disabling event collection.
Table 2-76. PCU_MSR_PMON_CTR{3-0} Register – Field Definitions
Field
rsv
event_count
Bits
Attr
HW
Reset
Val
Description
63:48
RV
0
Reserved (?)
47:0
RW-V
0
48-bit performance event counter
Context sensitive filtering is provided for through the PCU_MSR_PMON_BOX_FILTER register.
Reference Number: 327043-001
75
Intel® Xeon® Processor E5-2600 Product Family Uncore Performance Monitoring
• For frequency/voltage band filters, the multipler is at 100MHz granularity. So, a value of 32
(0x20) would represent a frequency of 3.2GHz.
• Support for limited Frequency/Voltage Band histogramming. Each of the four bands provided for
in the filter may be simultaneous tracked by the corresonding event
Note:
Since use of the register as a filter is heavily overloaded, simultaneous application of
this filter to additional events in the same run is severely limited
Table 2-77. PCU_MSR_PMON_BOX_FILTER Register – Field Definitions
Field
Attr
HW
Reset
Val
Description
rsv
63:48
RV
0
Reserved (?)
filt31_24
31:24
RW-V
0
Band 3 - For Voltage/Frequency Band Event
filt23_16
23:16
RW-V
0
Band 2 - For Voltage/Frequency Band Event
filt15_8
filt7_0
2.6.3.3
Bits
15:8
RW-V
0
Band 1 - For Voltage/Frequency Band Event
7:0
RW-V
0
Band 0 - For Voltage/Frequency Band Event
Intel® PCU Extra Registers - Companions to PMON HW
The PCU includes two extra MSRs that track the number of cycles a core (any core) is in either the C3
or C6 state. As mentioned before, these counters are not part of the PMON infrastructure so they
can’t be frozen or reset with the otherwise controlled by the PCU PMON control registers.
Note:
To be clear, these counters track the number of cycles some core is in C3/6 state. It
does not track the total number of cores in the C3/6 state in any cycle. For that, a user
should refer to the regular PCU event list.
Table 2-78. PCU_MSR_CORE_C6_CTR Register – Field Definitions
Field
event_count
Bits
63:0
Attr
HW
Reset
Val
RW-V
0
Description
64-bit performance event counter
Table 2-79. PCU_MSR_CORE_C3_CTR Register – Field Definitions
Field
event_count
Bits
63:0
Attr
HW
Reset
Val
RW-V
0
Description
64-bit performance event counter
2.6.4
PCU Performance Monitoring Events
2.6.4.1
An Overview:
The PCU provides the ability to capture information covering a wide range of the PCU’s functionality
including:
• Number of cores in a given C-state per-cycle
76
Reference Number: 327043-001
Intel® Xeon® Processor E5-2600 Product Family Uncore Performance Monitoring
• Core State Transitions - there are a larger number of events provided to track when cores
transition C-state, when the enter/exit specific C-states, when they receive a C-state demotion,
etc.
• Frequency/Voltage Banding - ability to measure the number of cycles the uncore was operating
within a frequency or voltage ‘band’ that can be specified in a seperate filter register.
Note:
Given the nature of many of the PCU events, a great deal of additional information can
be measured by setting the .edge_det bit. By doing so, an event such as “Cycles
Changing Frequency” becomes “Number of Frequency Transitions.
On Occupancy Events:
Because it is not possible to "sync" the PCU occupancy counters by employing tricks such as bus lock
before the events start incrementing, the PCU has provided fixed occupancy counters to track the
major queues.
1. Cores in C0 (4 bits)
2. Cores in C3 (4 bits)
3. Cores in C6 (4 bits)
Some Examples for Unlocking More Advanced Features:
The PCU perfmon implementation/programming is more complicated than many of the other units. As
such, it is best to describe how to use them with a couple examples.
• Case 1: Voltage Transtion Cycles (Simple Event)
• Case 2: Cores in C0 (Occupancy Accumulation)
• Case 3: Cycles w/ more than 4 cores in C0 (Occupancy Threshholding)
• Case 4: Transitions into more than 4 cores in C0 (Threshholding + Edge Detect)
• Case 5: Voltage Transition Cycles w/ > 4 Cores in C0
• Case 6: Cycles w/ <4 Cores in C0 and Freq < 2.0GHz
Table 2-80. PCU Configuration Examples
Case
Config
1
2
3
4
5
6
EventSelect
0x03
0x00
0x00
0x00
0x03
0x0B
UseOccupancy
0x0
0x1
0x1
0x1
0x1
0x1
OccSelect
0x00
0x01
0x01
0x01
0x01
0x01
Threshhold
0x0
0x0
0x5
0x5
0x5
0x4
Invert
0x0
0x0
0x0
0x0
0x0
0x1
Edge Detect
0x0
0x0
0x0
0x0
0x0
0x0
OccInvert
0x0
0x0
0x0
0x0
0x0
0x1
OccEdgeDetect
0x0
0x0
0x0
0x1
0x0
0x0
Filter
0x00
0x00
0x00
0x00
0x00
0x14
Reference Number: 327043-001
77
Intel® Xeon® Processor E5-2600 Product Family Uncore Performance Monitoring
2.6.5
PCU Box Events Ordered By Code
The following table summarizes the directly measured PCU Box events.
Table 2-81. Performance Monitor Events for PCU (Sheet 1 of 2)
Event
Code
Extra
Select
Bit
Ctrs
Max
Inc/
Cyc
CLOCKTICKS
0x00
0
0-3
1
pclk Cycles
VOLT_TRANS_CYCLES_INCREASE
0x01
0
0-3
1
Cycles Increasing Voltage
Symbol Name
78
Description
VOLT_TRANS_CYCLES_DECREASE
0x02
0
0-3
1
Cycles Decreasing Voltage
VOLT_TRANS_CYCLES_CHANGE
0x03
0
0-3
1
Cycles Changing Voltage
FREQ_MAX_LIMIT_THERMAL_CYCLE
S
0x04
0
0-3
1
Thermal Strongest Upper Limit
Cycles
FREQ_MAX_POWER_CYCLES
0x05
0
0-3
1
Power Strongest Upper Limit Cycles
FREQ_MAX_OS_CYCLES
0x06
0
0-3
1
OS Strongest Upper Limit Cycles
FREQ_MAX_CURRENT_CYCLES
0x07
0
0-3
1
Current Strongest Upper Limit
Cycles
PROCHOT_INTERNAL_CYCLES
0x09
0
0-3
1
Internal Prochot
PROCHOT_EXTERNAL_CYCLES
0x0A
0
0-3
1
External Prochot
FREQ_BAND0_CYCLES
0x0B
0
0-3
1
Frequency Residency
FREQ_BAND1_CYCLES
0x0C
0
0-3
1
Frequency Residency
FREQ_BAND2_CYCLES
0x0D
0
0-3
1
Frequency Residency
FREQ_BAND3_CYCLES
0x0E
0
0-3
1
Frequency Residency
DEMOTIONS_CORE0
0x1E
0
0-3
1
Core C State Demotions
DEMOTIONS_CORE1
0x1F
0
0-3
1
Core C State Demotions
DEMOTIONS_CORE2
0x20
0
0-3
1
Core C State Demotions
DEMOTIONS_CORE3
0x21
0
0-3
1
Core C State Demotions
DEMOTIONS_CORE4
0x22
0
0-3
1
Core C State Demotions
DEMOTIONS_CORE5
0x23
0
0-3
1
Core C State Demotions
DEMOTIONS_CORE6
0x24
0
0-3
1
Core C State Demotions
DEMOTIONS_CORE7
0x25
0
0-3
1
Core C State Demotions
MEMORY_PHASE_SHEDDING_CYCLE
S
0x2F
0
0-3
1
Memory Phase Shedding Cycles
VR_HOT_CYCLES
0x32
0
0-3
1
VR Hot
POWER_STATE_OCCUPANCY
0x80
0
0-3
8
Number of cores in C0
FREQ_TRANS_CYCLES
0x00
1
0-3
1
Cycles spent changing Frequency
FREQ_MIN_IO_P_CYCLES
0x01
1
0-3
1
IO P Limit Strongest Lower Limit
Cycles
FREQ_MIN_PERF_P_CYCLES
0x02
1
0-3
1
Perf P Limit Strongest Lower Limit
Cycles
CORE0_TRANSITION_CYCLES
0x03
1
0-3
1
Core C State Transition Cycles
CORE1_TRANSITION_CYCLES
0x04
1
0-3
1
Core C State Transition Cycles
CORE2_TRANSITION_CYCLES
0x05
1
0-3
1
Core C State Transition Cycles
CORE3_TRANSITION_CYCLES
0x06
1
0-3
1
Core C State Transition Cycles
CORE4_TRANSITION_CYCLES
0x07
1
0-3
1
Core C State Transition Cycles
CORE5_TRANSITION_CYCLES
0x08
1
0-3
1
Core C State Transition Cycles
CORE6_TRANSITION_CYCLES
0x09
1
0-3
1
Core C State Transition Cycles
Reference Number: 327043-001
Intel® Xeon® Processor E5-2600 Product Family Uncore Performance Monitoring
Table 2-81. Performance Monitor Events for PCU (Sheet 2 of 2)
Event
Code
Extra
Select
Bit
Ctrs
Max
Inc/
Cyc
CORE7_TRANSITION_CYCLES
0x0A
1
0-3
1
Core C State Transition Cycles
TOTAL_TRANSITION_CYCLES
0x0B
1
0-3
1
Total Core C State Transition Cycles
Symbol Name
2.6.6
Description
PCU Box Common Metrics (Derived Events)
The following table summarizes metrics commonly calculated from PCU Box events.
Table 2-82. Metrics Derived from PCU Events
Symbol Name:
Definition
2.6.7
Equation
CYC_FREQ_CURRENT_LTD:
Cycles the Max Frequency is limited by
current
FREQ_MAX_CURRENT_CYCLES / CLOCKTICKS
CYC_FREQ_OS_LTD:
Cycles the Max Frequency is limited by the
OS
FREQ_MAX_OS_CYCLES / CLOCKTICKS
CYC_FREQ_POWER_LTD:
Cycles the Max Frequency is limited by
power
FREQ_MAX_POWER_CYCLES / CLOCKTICKS
CYC_FREQ_THERMAL_LTD:
Cycles the Max Frequency is limited by
thermal issues
FREQ_MAX_CURRENT_CYCLES / CLOCKTICKS
PCU Box Performance Monitor Event List
The section enumerates the performance monitoring events for the PCU Box.
CLOCKTICKS
•
•
•
•
•
Title: pclk Cycles
Category: PCLK Events
Event Code: 0x00
Max. Inc/Cyc: 1, Register Restrictions: 0-3
Definition: The PCU runs off a fixed 800 MHz clock. This event counts the number of pclk cycles
measured while the counter was enabled. The pclk, like the Memory Controller's dclk, counts at a
constant rate making it a good measure of actual wall time.
CORE0_TRANSITION_CYCLES
•
•
•
•
•
•
Title: Core C State Transition Cycles
Category: CORE_C_STATE_TRANSITION Events
Event Code: 0x03
Extra Select Bit: Y
Max. Inc/Cyc: 1, Register Restrictions: 0-3
Definition: Number of cycles spent performing core C state transitions. There is one event per
core.
• NOTE: This only tracks the hardware portion in the RCFSM (CFCFSM). This portion is just doing
the core C state transition. It does not include any necessary frequency/voltage transitions.
Reference Number: 327043-001
79
Intel® Xeon® Processor E5-2600 Product Family Uncore Performance Monitoring
CORE1_TRANSITION_CYCLES
•
•
•
•
•
•
Title: Core C State Transition Cycles
Category: CORE_C_STATE_TRANSITION Events
Event Code: 0x04
Extra Select Bit: Y
Max. Inc/Cyc: 1, Register Restrictions: 0-3
Definition: Number of cycles spent performing core C state transitions. There is one event per
core.
CORE2_TRANSITION_CYCLES
•
•
•
•
•
•
Title: Core C State Transition Cycles
Category: CORE_C_STATE_TRANSITION Events
Event Code: 0x05
Extra Select Bit: Y
Max. Inc/Cyc: 1, Register Restrictions: 0-3
Definition: Number of cycles spent performing core C state transitions. There is one event per
core.
CORE3_TRANSITION_CYCLES
•
•
•
•
•
•
Title: Core C State Transition Cycles
Category: CORE_C_STATE_TRANSITION Events
Event Code: 0x06
Extra Select Bit: Y
Max. Inc/Cyc: 1, Register Restrictions: 0-3
Definition: Number of cycles spent performing core C state transitions. There is one event per
core.
CORE4_TRANSITION_CYCLES
•
•
•
•
•
•
Title: Core C State Transition Cycles
Category: CORE_C_STATE_TRANSITION Events
Event Code: 0x07
Extra Select Bit: Y
Max. Inc/Cyc: 1, Register Restrictions: 0-3
Definition: Number of cycles spent performing core C state transitions. There is one event per
core.
CORE5_TRANSITION_CYCLES
•
•
•
•
•
•
80
Title: Core C State Transition Cycles
Category: CORE_C_STATE_TRANSITION Events
Event Code: 0x08
Extra Select Bit: Y
Max. Inc/Cyc: 1, Register Restrictions: 0-3
Definition: Number of cycles spent performing core C state transitions. There is one event per
core.
Reference Number: 327043-001
Intel® Xeon® Processor E5-2600 Product Family Uncore Performance Monitoring
CORE6_TRANSITION_CYCLES
•
•
•
•
•
•
Title: Core C State Transition Cycles
Category: CORE_C_STATE_TRANSITION Events
Event Code: 0x09
Extra Select Bit: Y
Max. Inc/Cyc: 1, Register Restrictions: 0-3
Definition: Number of cycles spent performing core C state transitions. There is one event per
core.
CORE7_TRANSITION_CYCLES
•
•
•
•
•
•
Title: Core C State Transition Cycles
Category: CORE_C_STATE_TRANSITION Events
Event Code: 0x0A
Extra Select Bit: Y
Max. Inc/Cyc: 1, Register Restrictions: 0-3
Definition: Number of cycles spent performing core C state transitions. There is one event per
core.
DEMOTIONS_CORE0
•
•
•
•
•
•
Title: Core C State Demotions
Category: CORE_C_STATE_TRANSITION Events
Event Code: 0x1E
Max. Inc/Cyc: 1, Register Restrictions: 0-3
Filter Dependency: PCUFilter[7:0]
Definition: Counts the number of times when a configurable cores had a C-state demotion
DEMOTIONS_CORE1
•
•
•
•
•
•
Title: Core C State Demotions
Category: CORE_C_STATE_TRANSITION Events
Event Code: 0x1F
Max. Inc/Cyc: 1, Register Restrictions: 0-3
Filter Dependency: PCUFilter[7:0]
Definition: Counts the number of times when a configurable cores had a C-state demotion
DEMOTIONS_CORE2
•
•
•
•
•
Title: Core C State Demotions
Category: CORE_C_STATE_TRANSITION Events
Event Code: 0x20
Max. Inc/Cyc: 1, Register Restrictions: 0-3
Definition: Counts the number of times when a configurable cores had a C-state demotion
DEMOTIONS_CORE3
•
•
•
•
•
•
Title: Core C State Demotions
Category: CORE_C_STATE_TRANSITION Events
Event Code: 0x21
Max. Inc/Cyc: 1, Register Restrictions: 0-3
Filter Dependency: PCUFilter[7:0]
Definition: Counts the number of times when a configurable cores had a C-state demotion
Reference Number: 327043-001
81
Intel® Xeon® Processor E5-2600 Product Family Uncore Performance Monitoring
DEMOTIONS_CORE4
•
•
•
•
•
•
Title: Core C State Demotions
Category: CORE_C_STATE_TRANSITION Events
Event Code: 0x22
Max. Inc/Cyc: 1, Register Restrictions: 0-3
Filter Dependency: PCUFilter[7:0]
Definition: Counts the number of times when a configurable cores had a C-state demotion
DEMOTIONS_CORE5
•
•
•
•
•
•
Title: Core C State Demotions
Category: CORE_C_STATE_TRANSITION Events
Event Code: 0x23
Max. Inc/Cyc: 1, Register Restrictions: 0-3
Filter Dependency: PCUFilter[7:0]
Definition: Counts the number of times when a configurable cores had a C-state demotion
DEMOTIONS_CORE6
•
•
•
•
•
•
Title: Core C State Demotions
Category: CORE_C_STATE_TRANSITION Events
Event Code: 0x24
Max. Inc/Cyc: 1, Register Restrictions: 0-3
Filter Dependency: PCUFilter[7:0]
Definition: Counts the number of times when a configurable cores had a C-state demotion
DEMOTIONS_CORE7
•
•
•
•
•
•
Title: Core C State Demotions
Category: CORE_C_STATE_TRANSITION Events
Event Code: 0x25
Max. Inc/Cyc: 1, Register Restrictions: 0-3
Filter Dependency: PCUFilter[7:0]
Definition: Counts the number of times when a configurable cores had a C-state demotion
FREQ_BAND0_CYCLES
•
•
•
•
•
•
Title: Frequency Residency
Category: FREQ_RESIDENCY Events
Event Code: 0x0B
Max. Inc/Cyc: 1, Register Restrictions: 0-3
Filter Dependency: PCUFilter[7:0]
Definition: Counts the number of cycles that the uncore was running at a frequency greater than
or equal to the frequency that is configured in the filter. One can use all four counters with this
event, so it is possible to track up to 4 configurable bands. One can use edge detect in conjunction
with this event to track the number of times that we transitioned into a frequency greater than or
equal to the configurable frequency. One can also use inversion to track cycles when we were less
than the configured frequency.
• NOTE: The PMON control registers in the PCU only update on a frequency transition. Changing
the measuring threshold during a sample interval may introduce errors in the counts. This is especially true when running at a constant frequency for an extended period of time. There is a corner
case here: we set this code on the GV transition. So, if we never GV we will never call this code.
This event does not include transition times. It is handled on fast path.
82
Reference Number: 327043-001
Intel® Xeon® Processor E5-2600 Product Family Uncore Performance Monitoring
FREQ_BAND1_CYCLES
•
•
•
•
•
•
Title: Frequency Residency
Category: FREQ_RESIDENCY Events
Event Code: 0x0C
Max. Inc/Cyc: 1, Register Restrictions: 0-3
Filter Dependency: PCUFilter[15:8]
Definition: Counts the number of cycles that the uncore was running at a frequency greater than
or equal to the frequency that is configured in the filter. One can use all four counters with this
event, so it is possible to track up to 4 configurable bands. One can use edge detect in conjunction
with this event to track the number of times that we transitioned into a frequency greater than or
equal to the configurable frequency. One can also use inversion to track cycles when we were less
than the configured frequency.
• NOTE: The PMON control registers in the PCU only update on a frequency transition. Changing
the measuring threshold during a sample interval may introduce errors in the counts. This is especially true when running at a constant frequency for an extended period of time. There is a corner
case here: we set this code on the GV transition. So, if we never GV we will never call this code.
This event does not include transition times. It is handled on fast path.
FREQ_BAND2_CYCLES
•
•
•
•
•
•
Title: Frequency Residency
Category: FREQ_RESIDENCY Events
Event Code: 0x0D
Max. Inc/Cyc: 1, Register Restrictions: 0-3
Filter Dependency: PCUFilter[23:16]
Definition: Counts the number of cycles that the uncore was running at a frequency greater than
or equal to the frequency that is configured in the filter. One can use all four counters with this
event, so it is possible to track up to 4 configurable bands. One can use edge detect in conjunction
with this event to track the number of times that we transitioned into a frequency greater than or
equal to the configurable frequency. One can also use inversion to track cycles when we were less
than the configured frequency.
• NOTE: The PMON control registers in the PCU only update on a frequency transition. Changing
the measuring threshold during a sample interval may introduce errors in the counts. This is especially true when running at a constant frequency for an extended period of time. There is a corner
case here: we set this code on the GV transition. So, if we never GV we will never call this code.
This event does not include transition times. It is handled on fast path.
FREQ_BAND3_CYCLES
•
•
•
•
•
•
Title: Frequency Residency
Category: FREQ_RESIDENCY Events
Event Code: 0x0E
Max. Inc/Cyc: 1, Register Restrictions: 0-3
Filter Dependency: PCUFilter[31:24]
Definition: Counts the number of cycles that the uncore was running at a frequency greater than
or equal to the frequency that is configured in the filter. One can use all four counters with this
event, so it is possible to track up to 4 configurable bands. One can use edge detect in conjunction
with this event to track the number of times that we transitioned into a frequency greater than or
equal to the configurable frequency. One can also use inversion to track cycles when we were less
than the configured frequency.
• NOTE: The PMON control registers in the PCU only update on a frequency transition. Changing
the measuring threshold during a sample interval may introduce errors in the counts. This is especially true when running at a constant frequency for an extended period of time. There is a corner
case here: we set this code on the GV transition. So, if we never GV we will never call this code.
This event does not include transition times. It is handled on fast path.
Reference Number: 327043-001
83
Intel® Xeon® Processor E5-2600 Product Family Uncore Performance Monitoring
FREQ_MAX_CURRENT_CYCLES
•
•
•
•
•
•
Title: Current Strongest Upper Limit Cycles
Category: FREQ_MAX_LIMIT Events
Event Code: 0x07
Max. Inc/Cyc: 1, Register Restrictions: 0-3
Definition: Counts the number of cycles when current is the upper limit on frequency.
NOTE: This is fast path, will clear our other limits when it happens. The slow loop portion, which
covers the other limits, can double count EDP. Clearing should fix this up in the next fast path
event, but this will happen. Add up all the cycles and it wontmakesense,butthegeneraldistributionistrue.'
FREQ_MAX_LIMIT_THERMAL_CYCLES
•
•
•
•
•
Title: Thermal Strongest Upper Limit Cycles
Category: FREQ_MAX_LIMIT Events
Event Code: 0x04
Max. Inc/Cyc: 1, Register Restrictions: 0-3
Definition: Counts the number of cycles when thermal conditions are the upper limit on frequency.
This is related to the THERMAL_THROTTLE CYCLES_ABOVE_TEMP event, which always counts cycles
when we are above the thermal temperature. This event (STRONGEST_UPPER_LIMIT) is sampled
at the output of the algorithm that determines the actual frequency, while THERMAL_THROTTLE
looks at the input.
FREQ_MAX_OS_CYCLES
•
•
•
•
•
•
Title: OS Strongest Upper Limit Cycles
Category: FREQ_MAX_LIMIT Events
Event Code: 0x06
Max. Inc/Cyc: 1, Register Restrictions: 0-3
Definition: Counts the number of cycles when the OS is the upper limit on frequency.
NOTE: Essentially, this event says the OS is getting the frequency it requested.
FREQ_MAX_POWER_CYCLES
•
•
•
•
•
Title: Power Strongest Upper Limit Cycles
Category: FREQ_MAX_LIMIT Events
Event Code: 0x05
Max. Inc/Cyc: 1, Register Restrictions: 0-3
Definition: Counts the number of cycles when power is the upper limit on frequency.
FREQ_MIN_IO_P_CYCLES
•
•
•
•
•
•
84
Title: IO P Limit Strongest Lower Limit Cycles
Category: FREQ_MIN_LIMIT Events
Event Code: 0x01
Extra Select Bit: Y
Max. Inc/Cyc: 1, Register Restrictions: 0-3
Definition: Counts the number of cycles when IO P Limit is preventing us from dropping the frequency lower. This algorithm monitors the needs to the IO subsystem on both local and remote
sockets and will maintain a frequency high enough to maintain good IO BW. This is necessary for
when all the IA cores on a socket are idle but a user still would like to maintain high IO Bandwidth.
Reference Number: 327043-001
Intel® Xeon® Processor E5-2600 Product Family Uncore Performance Monitoring
FREQ_MIN_PERF_P_CYCLES
•
•
•
•
•
•
Title: Perf P Limit Strongest Lower Limit Cycles
Category: FREQ_MIN_LIMIT Events
Event Code: 0x02
Extra Select Bit: Y
Max. Inc/Cyc: 1, Register Restrictions: 0-3
Definition: Counts the number of cycles when Perf P Limit is preventing us from dropping the frequency lower. Perf P Limit is an algorithm that takes input from remote sockets when determining
if a socket should drop it's frequency down. This is largely to minimize increases in snoop and
remote read latencies.
FREQ_TRANS_CYCLES
•
•
•
•
•
•
Title: Cycles spent changing Frequency
Category: FREQ_TRANS Events
Event Code: 0x00
Extra Select Bit: Y
Max. Inc/Cyc: 1, Register Restrictions: 0-3
Definition: Counts the number of cycles when the system is changing frequency. This can not be
filtered by thread ID. One can also use it with the occupancy counter that monitors number of
threads in C0 to estimate the performance impact that frequency transitions had on the system.
MEMORY_PHASE_SHEDDING_CYCLES
•
•
•
•
•
Title: Memory Phase Shedding Cycles
Category: MEMORY_PHASE_SHEDDING Events
Event Code: 0x2F
Max. Inc/Cyc: 1, Register Restrictions: 0-3
Definition: Counts the number of cycles that the PCU has triggered memory phase shedding. This
is a mode that can be run in the iMC physicals that saves power at the expense of additional
latency.
• NOTE: Is this the package C one? Yes
POWER_STATE_OCCUPANCY
•
•
•
•
•
Title: Number of cores in C0
Category: POWER_STATE_OCC Events
Event Code: 0x80
Max. Inc/Cyc: 8, Register Restrictions: 0-3
Definition: This is an occupancy event that tracks the number of cores that are in C0. It can be
used by itself to get the average number of cores in C0, with threshholding to generate histograms,
or with other PCU events and occupancy triggering to capture other details.
Table 2-83. Unit Masks for POWER_STATE_OCCUPANCY
Extension
umask
[15:8]
CORES_C0
b01000000
CORES_C3
b10000000
CORES_C6
b11000000
Reference Number: 327043-001
Description
85
Intel® Xeon® Processor E5-2600 Product Family Uncore Performance Monitoring
PROCHOT_EXTERNAL_CYCLES
•
•
•
•
•
Title: External Prochot
Category: PROCHOT Events
Event Code: 0x0A
Max. Inc/Cyc: 1, Register Restrictions: 0-3
Definition: Counts the number of cycles that we are in external PROCHOT mode. This mode is
triggered when a sensor off the die determines that something off-die (like DRAM) is too hot and
must throttle to avoid damaging the chip.
PROCHOT_INTERNAL_CYCLES
•
•
•
•
•
Title: Internal Prochot
Category: PROCHOT Events
Event Code: 0x09
Max. Inc/Cyc: 1, Register Restrictions: 0-3
Definition: Counts the number of cycles that we are in Interal PROCHOT mode. This mode is triggered when a sensor on the die determines that we are too hot and must throttle to avoid damaging
the chip.
TOTAL_TRANSITION_CYCLES
•
•
•
•
•
•
Title: Total Core C State Transition Cycles
Category: CORE_C_STATE_TRANSITION Events
Event Code: 0x0B
Extra Select Bit: Y
Max. Inc/Cyc: 1, Register Restrictions: 0-3
Definition: Number of cycles spent performing core C state transitions across all cores.
VOLT_TRANS_CYCLES_CHANGE
•
•
•
•
•
Title: Cycles Changing Voltage
Category: VOLT_TRANS Events
Event Code: 0x03
Max. Inc/Cyc: 1, Register Restrictions: 0-3
Definition: Counts the number of cycles when the system is changing voltage. There is no filtering
supported with this event. One can use it as a simple event, or use it conjunction with the occupancy events to monitor the number of cores or threads that were impacted by the transition. This
event is calculated by or'ing together the increasing and decreasing events.
VOLT_TRANS_CYCLES_DECREASE
•
•
•
•
•
Title: Cycles Decreasing Voltage
Category: VOLT_TRANS Events
Event Code: 0x02
Max. Inc/Cyc: 1, Register Restrictions: 0-3
Definition: Counts the number of cycles when the system is decreasing voltage. There is no filtering supported with this event. One can use it as a simple event, or use it conjunction with the occupancy events to monitor the number of cores or threads that were impacted by the transition.
VOLT_TRANS_CYCLES_INCREASE
•
•
•
•
86
Title: Cycles Increasing Voltage
Category: VOLT_TRANS Events
Event Code: 0x01
Max. Inc/Cyc: 1, Register Restrictions: 0-3
Reference Number: 327043-001
Intel® Xeon® Processor E5-2600 Product Family Uncore Performance Monitoring
• Definition: Counts the number of cycles when the system is increasing voltage. There is no filtering supported with this event. One can use it as a simple event, or use it conjunction with the occupancy events to monitor the number of cores or threads that were impacted by the transition.
VR_HOT_CYCLES
•
•
•
•
•
Title: VR Hot
Category: VR_HOT Events
Event Code: 0x32
Max. Inc/Cyc: 1, Register Restrictions: 0-3
Definition:
2.7
Intel® QPI Link Layer Performance Monitoring
2.7.1
Overview of the Intel® QPI Box
The Intel® QPI Link Layer is responsible for packetizing requests from the caching agent on the way
out to the system interface. As such, it shares responsibility with the CBo(s) as the Intel QPI caching
agent(s). It is responsible for converting CBo requests to Intel QPI messages (i.e. snoop generation
and data response messages from the snoop response) as well as converting/forwarding ring
messages to Intel QPI packets and vice versa.
The Intel® QPI is split into two separate layers. The Intel® QPI LL (link layer) is responsible for
generating, transmitting, and receiving packets with the Intel® QPI link.
R3QPI (Section 2.9, “R3QPI Performance Monitoring”) provides the interface to the Ring for the Link
Layer. It is also the point where VNA/VN0 link credits are acquired.
In each Intel Xeon processor E5-2600, there are two Intel® QPI agents that share a single ring stop.
These links can be connected to a single destination (such as in DP), but also can be connected to two
separate destinations (4s Ring or sDP). Therefore, it will be necessary to count Intel® QPI statistics
for each agent seperately.
The Intel® QPI Link Layer processes two flits per cycle in each direction. In order to accommodate
this, many of the events in the Link Layer can increment by 0, 1, or 2 in each cycle. It is not possible
to monitor Rx (received) and Tx (transmitted) flit information at the same time on the same counter.
2.7.2
Intel® QPI Performance Monitoring Overview
Each Intel® QPI Port in the uncore supports event monitoring through four 48b wide counters
(Q_Py_PCI_PMON_CTR/CTL{3:0}). Each of these four counters can be programmed to count any
Intel® QPI event. The Intel® QPI counters can increment by a maximum of 6b per cycle (???).
Each Intel® QPI Port also includes a mask/match register that allows a user to match packets,
according to various standard packet fields such as message class, opcode, etc, as they leave the
Intel® QPI Port.
For information on how to setup a monitoring session, refer to Section 2.1, “Uncore Per-Socket
Performance Monitoring Control”.
Reference Number: 327043-001
87
Intel® Xeon® Processor E5-2600 Product Family Uncore Performance Monitoring
2.7.3
Intel® QPI Performance Monitors
Table 2-84. Intel® QPI Performance Monitoring Registers
Register Name
PCICFG Base Address
PCICFG
Address
Size
(bits)
Description
Dev:Func
QPI Port 0 PMON Registers
D8:F2
QPI Port 1 PMON Registers
D9:F2
Box-Level Control/Status
Q_Py_PCI_PMON_BOX_CTL
F4
32
QPI Port y PMON Box-Wide Control
E4
32
QPI Port y PMON Control for Counter 3
Generic Counter Control
Q_Py_PCI_PMON_CTL3
Q_Py_PCI_PMON_CTL2
E0
32
QPI Port y PMON Control for Counter 2
Q_Py_PCI_PMON_CTL1
DC
32
QPI Port y PMON Control for Counter 1
Q_Py_PCI_PMON_CTL0
D8
32
QPI Port y PMON Control for Counter 0
Generic Counters
Q_Py_PCI_PMON_CTR3
BC+B8
32x2
QPI Port y PMON Counter 3
Q_Py_PCI_PMON_CTR2
B4+B0
32x2
QPI Port y PMON Counter 2
Q_Py_PCI_PMON_CTR1
AC+A8
32x2
QPI Port y PMON Counter 1
Q_Py_PCI_PMON_CTR0
A4+A0
32x2
QPI Port y PMON Counter 0
QPI Mask/Match Port 0 PMON Registers
D8:F6
QPI Mask/Match Port 1 PMON Registers
D9:F6
Box-Level Filters
Q_Py_PCI_PMON_PKT_MASK1
23C
32
QPI Port y PMON Packet Filter Mask 1
Q_Py_PCI_PMON_PKT_MASK0
238
32
QPI Port y PMON Packet Filter Mask 0
Q_Py_PCI_PMON_PKT_MATCH1
22C
32
QPI Port y PMON Packet Filter Match 1
Q_Py_PCI_PMON_PKT_MATCH0
228
32
QPI Port y PMON Packet Filter Mask 0
32
QPI Rate Status
QPI Misc Register Port 0
D8:F0
QPI Misc Register Port 1
D9:F1
Misc (Non-PMON) Counters
QPI_RATE_STATUS
2.7.3.1
0xD4
Intel® QPI Box Level PMON State
The following registers represent the state governing all box-level PMUs in each Port of the Intel® QPI
Box.
In the case of the Intel® QPI Ports, the Q_Py_PCI_PMON_BOX_CTL register governs what happens
when a freeze signal is received (.frz_en). It also provides the ability to manually freeze the counters
in the box (.frz) and reset the generic state (.rst_ctrs and .rst_ctrl).
88
Reference Number: 327043-001
Intel® Xeon® Processor E5-2600 Product Family Uncore Performance Monitoring
Table 2-85. Q_Py_PCI_PMON_BOX_CTL Register – Field Definitions
Field
rsv
Bits
Attr
31:18
RV
HW
Reset
Val
0
Description
Reserved (?)
rsv
17
RV
0
Reserved; SW must write to 0 else behavior is undefined.
frz_en
16
WO
0
Freeze Enable.
If set to 1 and a freeze signal is received, the counters will be
stopped or ‘frozen’, else the freeze signal will be ignored.
rsv
15:9
RV
0
Reserved (?)
frz
8
WO
0
Freeze.
If set to 1 and the .frz_en is 1, the counters in this box will be
frozen.
rsv
7:2
RV
0
Reserved (?)
rst_ctrs
1
WO
0
Reset Counters.
When set to 1, the Counter Registers will be reset to 0.
rst_ctrl
0
WO
0
Reset Control.
When set to 1, the Counter Control Registers will be reset to 0.
U
2.7.3.2
Intel® QPI PMON state - Counter/Control Pairs
The following table defines the layout of the Intel® QPI performance monitor control registers. The
main task of these configuration registers is to select the event to be monitored by their respective
data counter (.ev_sel, .umask, .ev_sel_ext). Additional control bits are provided to shape the
incoming events (e.g. .invert, .edge_det, .thresh) as well as provide additional functionality for
monitoring software (.rst).
Table 2-86. Q_Py_PCI_PMON_CTL{3-0} Register – Field Definitions (Sheet 1 of 2)
Field
thresh
invert
HW
Reset
Val
Description
RW-V
0
Threshold used in counter comparison.
RW-V
0
Invert comparison against Threshold.
Bits
Attr
31:24
23
0 - comparison will be ‘is event increment >= threshold?’.
1 - comparison is inverted - ‘is event increment < threshold?’
NOTE: .invert is in series following .thresh, Due to this, the
.thresh field must be set to a non-0 value. For events that
increment by no more than 1 per cycle, set .thresh to 0x1.
Also, if .edge_det is set to 1, the counter will increment when a 1
to 0 transition (i.e. falling edge) is detected.
en
22
RW-V
0
Local Counter Enable.
ev_sel_ext
21
RW-V
0
Extentsion bit to the Event Select field.
rsv
20
RV
0
Reserved. SW must write to 0 for proper operation.
rsv
19
RV
0
Reserved (?)
Reference Number: 327043-001
89
Intel® Xeon® Processor E5-2600 Product Family Uncore Performance Monitoring
Table 2-86. Q_Py_PCI_PMON_CTL{3-0} Register – Field Definitions (Sheet 2 of 2)
Field
Bits
edge_det
18
Attr
RW-V
HW
Reset
Val
0
Description
When set to 1, rather than measuring the event in each cycle it
is active, the corresponding counter will increment when a 0 to 1
transition (i.e. rising edge) is detected.
When 0, the counter will increment in each cycle that the event
is asserted.
NOTE: .edge_det is in series following .thresh, Due to this, the
.thresh field must be set to a non-0 value. For events that
increment by no more than 1 per cycle, set .thresh to 0x1.
rst
17
WO
0
When set to 1, the corresponding counter will be cleared to 0.
rsv
16
RV
0
Reserved. SW must write to 0 else behavior is undefined.
umask
15:8
RW-V
0
Select subevents to be counted within the selected event.
ev_sel
7:0
RW-V
0
Select event to be counted.
The Intel® QPI performance monitor data registers are 48b wide.Should a counter overflow (a carry
out from bit 47), the counter will wrap and continue to collect events.
If accessible, software can continuously read the data registers without disabling event collection.
Table 2-87. Q_Py_PCI_PMON_CTR{3-0} Register – Field Definitions
Field
rsv
Bits
HW
Reset
Val
Description
63:48
RV
0
Reserved (?)
47:0
RW-V
0
48-bit performance event counter
event_count
2.7.3.3
Attr
Intel® QPI Registers for Packet Mask/Match Facility
In addition to generic event counting, each port of the Intel® QPI Link Layer provides two pairs of
MATCH/MASK registers that allow a user to filter packet traffic serviced (crossing from an input port to
an output port) by the Intel® QPI Link Layer. Filtering can be performed according to the packet
Opcode, Message Class, Response, HNID and Physical Address. Program the selected Intel® QPI LL
counter to capture CTO_COUNT in order to capture the filter match as an event.
To use the match/mask facility :
a) Program the match/mask regs (see Table 2-88, “Q_Py_PCI_PMON_PKT_MATCH1 Registers”
through Table 2-91, “Q_Py_PCI_PMON_PKT_MASK0 Registers”).
b) Set the counter’s control register event select to 0x38 (CTO_COUNT) to capture the mask/match
as a performance event.
The following table contains the packet traffic that can be monitored if one of the mask/match
registers was chosen to select the event.
90
Reference Number: 327043-001
Intel® Xeon® Processor E5-2600 Product Family Uncore Performance Monitoring
Table 2-88. Q_Py_PCI_PMON_PKT_MATCH1 Registers
Bits
HW
Reset
Val
---
31:20
0x0
Reserved; Must write to 0 else behavior is undefined.
RDS
19:16
0x0
Response Data State (valid when MC == DRS and Opcode == 0x02). Bit settings are mutually exclusive.
Field
Description
b1000
b0100
b0010
b0001
b0000
--RNID_3_0
-
Modified
Exclusive
Shared
Forwarding
Invalid (Non-Coherent)
15:4
0x0
Reserved; Must write to 0 else behavior is undefined.
3:0
0x0
Remote Node ID(3:0 - Leat Significant Bits)
Table 2-89. Q_Py_PCI_PMON_PKT_MATCH0 Registers
Bits
HW
Reset
Val
31
0x0
Remote Node ID(Bit 4 - Most Significant Bit)
---
30:18
0x0
Reserved; Must write to 0 else behavior is undefined.
DNID
17:13
0x0
Destination Node ID
12:9
0x0
Message Class
Field
RNID_4
MC
Description
b0000
b0001
b0010
b0011
b0100
--b1100
--b1110
OPC
8:5
0x0
HOM - Requests
HOM - Responses
NDR
SNP
NCS
NCB
DRS
Opcode
DRS,NCB:
[8] Packet Size, 0 == 9 flits, 1 == 11 flits
NCS:
[8] Packet Size, 0 == 1 or 2 flits, 1 == 3 flits
See Section 2.10, “Packet Matching Reference” for a listing of
opcodes that may be filtered per message class.
VNW
4:3
0x0
Virtual Network
b00 - VN0
b01 - VN1
b1x - VNA
---
Reference Number: 327043-001
2:0
0x0
Reserved; Must write to 0 else behavior is undefined.
91
Intel® Xeon® Processor E5-2600 Product Family Uncore Performance Monitoring
Table 2-90. Q_Py_PCI_PMON_PKT_MASK1 Registers
Field
Bits
HW
Reset
Val
Description
---
31:20
0x0
Reserved; Must write to 0 else behavior is undefined.
RDS
19:16
0x0
Response Data State (valid when MC == DRS and Opcode == 0x02). Bit settings are mutually exclusive.
b1000
b0100
b0010
b0001
b0000
--RNID_3_0
-
Modified
Exclusive
Shared
Forwarding
Invalid (Non-Coherent)
15:4
0x0
Reserved; Must write to 0 else behavior is undefined.
3:0
0x0
Remote Node ID(3:0 - Leat Significant Bits)
Table 2-91. Q_Py_PCI_PMON_PKT_MASK0 Registers
Bits
HW
Reset
Val
31
0x0
Remote Node ID(Bit 4 - Most Significant Bit)
---
30:18
0x0
Reserved; Must write to 0 else behavior is undefined.
DNID
17:13
0x0
Destination Node ID
MC
12:9
0x0
Message Class
OPC
8:5
0x0
Opcode
Field
RNID_4
Description
See Section 2.10, “Packet Matching Reference” for a listing of
opcodes that may be filtered per message class.
2.7.3.3.1
VNW
4:3
0x0
Virtual Network
---
2:0
0x0
Reserved; Must write to 0 else behavior is undefined.
Events Derived from Packet Filters
Following is a selection of common events that may be derived by using the Intel® QPI packet
matching facility. The Match/Mask columns correspond to the Match0/Mask0 registers. For the cases
where additional fields need to be specified, they will be noted.
92
Reference Number: 327043-001
Intel® Xeon® Processor E5-2600 Product Family Uncore Performance Monitoring
Table 2-92. Message Events Derived from the Match/Mask filters (Sheet 1 of 2)
Match
[12:0]
Mask
[12:0]
DRS.AnyDataC
0x1C00
0x1F80
Any Data Response message containing a cache line in
response to a core request. The AnyDataC messages are only
sent to an S-Box. The metric DRS.AnyResp - DRS.AnyDataC
will compute the number of DRS writeback and non snoop
write messages.
DRS.DataC_M
0x1C00
&&
Match1
[19:16]
0x8
0x1FE0
&&
Mask1
[19:16]
0xF
Data Response message of a cache line in M state that is
response to a core request. The DRS.DataC_M messages are
only sent to Intel® QPI.
DRS.DataC_E
0x1C00
&&
Match1
[19:16]
0x4
0x1FE0
&&
Mask1
[19:16]
0xF
Data Response message of a cache line in E state that is
response to a core request. The DRS.DataC_E messages are
only sent to Intel® QPI.
DRS.DataC_F
0x1C00
&&
Match1
[19:16]
0x1
0x1FE0
&&
Mask1
[19:16]
0xF
Data Response message of a cache line in F state that is
response to a core request. The DRS.DataC_F messages are
only sent to Intel® QPI.
DRS.DataC_E_Cmp
0x1C40
&&
Match1
[19:16]
0x4
0x1FE0
&&
Mask1
[19:16]
0xF
Complete Data Response message of a cache line in E state
that is response to a core request. The DRS.DataC_E
messages are only sent to Intel® QPI.
DRS.DataC_F_Cmp
0x1C40
&&
Match1
[19:16]
0x1
0x1FE0
&&
Mask1
[19:16]
0xF
Complete Data Response message of a cache line in F state
that is response to a core request. The DRS.DataC_F
messages are only sent to Intel® QPI.
DRS.DataC_E_FrcAc
kCnflt
0x1C20
&&
Match1
[19:16]
0x4
0x1FE0
&&
Mask1
[19:16]
0xF
Force Acknowledge Data Response message of a cache line in
E state that is response to a core request. The DRS.DataC_E
messages are only sent to Intel® QPI.
DRS.DataC_F_FrcAc
kCnflt
0x1C20
&&
Match1
[19:16]
0x1
0x1FE0
&&
Mask1
[19:16]
0xF
Force Acknowledge Data Response message of a cache line in
F state that is response to a core request. The DRS.DataC_F
messages are only sent to Intel® QPI.
DRS.WbIData
0x1C80
0x1FE0
Data Response message for Write Back data where cacheline is
set to the I state.
DRS.WbSData
0x1CA0
0x1FE0
Data Response message for Write Back data where cacheline is
set to the S state.
DRS.WbEData
0x1CC0
0x1FE0
Data Response message for Write Back data where cacheline is
set to the E state.
DRS.AnyResp
0x1C00
0x1E00
Any Data Response message. A DRS message can be either 9
flits for a full cache line or 11 flits for partial data.
DRS.AnyResp9flits
0x1C00
0x1F00
Any Data Response message that is 11 flits in length. An 11
flit DRS message contains partial data. Each 8 byte chunk
contains an enable field that specifies if the data is valid.
DRS.AnyResp11flits
0x1D00
0x1F00
Any Non Data Response completion message. A NDR message
is 1 on flit.
NCB.AnyResp
0x1800
0x1E00
Any Non-Coherent Bypass response message.
Field
Reference Number: 327043-001
Description
93
Intel® Xeon® Processor E5-2600 Product Family Uncore Performance Monitoring
Table 2-92. Message Events Derived from the Match/Mask filters (Sheet 2 of 2)
Match
[12:0]
Mask
[12:0]
NCB.AnyMsg9flits
0x1800
0x1F00
Any Non-Coherent Bypass message that is 9 flits in length. A
9 flit NCB message contains a full 64 byte cache line.
NCB.AnyMsg11flits
0x1900
0x1F00
Any Non-Coherent Bypass message that is 11 flits in length.
An 11 flit NCB message contains either partial data or an
interrupt. For NCB 11 flit data messages, each 8 byte chunk
contains an enable field that specifies if the data is valid.
NCB.AnyInt
0x1900
0x1F80
Any Non-Coherent Bypass interrupt message. NCB interrupt
messages are 11 flits in length.
Field
2.7.3.4
Description
Intel® QPI Extra Registers - Companions to PMON HW
The uncore’s Intel® QPI box includes an extra MSR that provides the current Intel® QPI transfer rate.
Table 2-93. QPI_RATE_STATUS Register – Field Definitions
Field
rsv
Bits
Attr
HW
Reset
Val
Description
31:5
RV
0
Reserved. SW must write to 0 for proper operation.
slow_mode
4
RO-V
0
Slow Mode
Reflects the current slow mode status being driven to the PLL
This will be set out of reset to bring Intel® QPI in slow mode.
And is only expected to be set when QPI_rate is set to 6.4 GT/s.
rsv
3
RV
0
Reserved. SW must write to 0 for proper operation.
2:0
RO-V
11b
QPI Rate
This reflects the current QPI rte setting into the PLL
010 - 5.6 GT/s
011 - 6.4 GT/s
100 - 7.2 GT/s
101 - 8 GT/s
110 - 8.8 GT/s
111 - 9.6 GT/s
other - Reserved
qpi_rate
2.7.4
Intel® QPI LL Performance Monitoring Events
2.7.4.1
An Overview
The Intel® QPI Link Layer provides events to gather information on topics such as:
• Tracking incoming (ring bound)/outgoing (system bound) transactions,
• Various queue that track those transactions,
• The Link Layer’s power consumption as expressed by the time spent in the Link power states L0p
(half of lanes are disabled).
• A variety of static events such as Direct2Core statistics and when output credit is unavailable.
• Of particular interest, total link utilization may be calculated by capturing and subtracting
transmitted/received idle flits from Intel® QPI clocks.
Many of these events can be further broken down by message class, including link utilization.
Note:
94
In order to measure several of the available events in the Intel® QPI Link Layer, an
extra bit (b16) must be set. These cases will be documented in the full Event List.
Reference Number: 327043-001
Intel® Xeon® Processor E5-2600 Product Family Uncore Performance Monitoring
2.7.4.2
Acronyms frequently used in Intel® QPI Events:
RxL (aka IGR) - “Receive from Link” referring to Ingress (requests from the Ring) queues.
TxL (aka EGR) - “Transmit to Link” referring to Egress (requests headed for the Ring) queues.
2.7.5
Intel® QPI LL Box Events Ordered By Code
The following table summarizes the directly measured Intel QPI LL Box events.
Table 2-94. Performance Monitor Events for Intel® QPI LL (Sheet 1 of 2)
Symbol Name
Event
Code
Extra
Select
Bit
Ctrs
Max
Inc/
Cyc
Description
TxL_FLITS_G0
0x00
0
0-3
2
Flits Transferred - Group 0
RxL_FLITS_G0
0x01
0
0-3
2
Flits Received - Group 0
TxL_INSERTS
0x04
0
0-3
1
Tx Flit Buffer Allocations
TxL_BYPASSED
0x05
0
0-3
1
Tx Flit Buffer Bypassed
TxL_CYCLES_NE
0x06
0
0-3
1
Tx Flit Buffer Cycles not Empty
TxL_OCCUPANCY
0x07
0
0-3
1
Tx Flit Buffer Occupancy
RxL_INSERTS
0x08
0
0-3
1
Rx Flit Buffer Allocations
RxL_BYPASSED
0x09
0
0-3
1
Rx Flit Buffer Bypassed
RxL_CYCLES_NE
0x0A
0
0-3
1
RxQ Cycles Not Empty
RxL_OCCUPANCY
0x0B
0
0-3
128
RxQ Occupancy - All Packets
TxL0_POWER_CYCLES
0x0C
0
0-3
1
Cycles in L0
TxL0P_POWER_CYCLES
0x0D
0
0-3
1
Cycles in L0p
RxL0_POWER_CYCLES
0x0F
0
0-3
1
Cycles in L0
RxL0P_POWER_CYCLES
0x10
0
0-3
1
Cycles in L0p
L1_POWER_CYCLES
0x12
0
0-3
1
Cycles in L1
DIRECT2CORE
0x13
0
0-3
1
Direct 2 Core Spawning
CLOCKTICKS
0x14
0
0-3
1
Number of qfclks
TxL_FLITS_G1
0x00
1
0-3
2
Flits Transferred - Group 1
TxL_FLITS_G2
0x01
1
0-3
2
Flits Transferred - Group 2
RxL_FLITS_G1
0x02
1
0-3
2
Flits Received - Group 1
RxL_FLITS_G2
0x03
1
0-3
2
Flits Received - Group 2
RxL_INSERTS_DRS
0x09
1
0-3
1
Rx Flit Buffer Allocations - DRS
RxL_INSERTS_NCB
0x0A
1
0-3
1
Rx Flit Buffer Allocations - NCB
RxL_INSERTS_NCS
0x0B
1
0-3
1
Rx Flit Buffer Allocations - NCS
RxL_INSERTS_HOM
0x0C
1
0-3
1
Rx Flit Buffer Allocations - HOM
RxL_INSERTS_SNP
0x0D
1
0-3
1
Rx Flit Buffer Allocations - SNP
RxL_INSERTS_NDR
0x0E
1
0-3
1
Rx Flit Buffer Allocations - NDR
RxL_OCCUPANCY_DRS
0x15
1
0-3
128
RxQ Occupancy - DRS
RxL_OCCUPANCY_NCB
0x16
1
0-3
128
RxQ Occupancy - NCB
RxL_OCCUPANCY_NCS
0x17
1
0-3
128
RxQ Occupancy - NCS
RxL_OCCUPANCY_HOM
0x18
1
0-3
128
RxQ Occupancy - HOM
RxL_OCCUPANCY_SNP
0x19
1
0-3
128
RxQ Occupancy - SNP
RxL_OCCUPANCY_NDR
0x1A
1
0-3
128
RxQ Occupancy - NDR
Reference Number: 327043-001
95
Intel® Xeon® Processor E5-2600 Product Family Uncore Performance Monitoring
Table 2-94. Performance Monitor Events for Intel® QPI LL (Sheet 2 of 2)
2.7.6
Symbol Name
Event
Code
Extra
Select
Bit
Ctrs
Max
Inc/
Cyc
VNA_CREDIT_RETURN_OCCUPANCY
0x1B
1
0-3
128
VNA_CREDIT_RETURNS
0x1C
1
0-3
1
RxL_CREDITS_CONSUMED_VNA
0x1D
1
0-3
1
VNA Credit Consumed
RxL_CREDITS_CONSUMED_VN0
0x1E
1
0-3
1
VN0 Credit Consumed
CTO_COUNT
0x38
1
0-3
2
Count of CTO Events
Description
VNA Credits Pending Return Occupancy
VNA Credits Returned
Intel QPI LL Box Common Metrics (Derived Events)
The following table summarizes metrics commonly calculated from Intel QPI LL Box events.
Table 2-95. Metrics Derived from Intel QPI LL Events (Sheet 1 of 3)
Symbol Name:
Definition
96
Equation
DATA_FROM_QPI:
Data received from QPI in bytes ( = DRS +
NCB Data messages received from QPI)
DRS_DATA_MSGS_FROM_QPI + NCB_DATA_MSGS_FROM_QPI
DATA_FROM_QPI_TO_HA_OR_IIO:
Data received from QPI forwarded to HA or
IIO. Expressed in Bytes
DATA_FROM_QPI - DATA_FROM_QPI_TO_LLC
DATA_FROM_QPI_TO_LLC:
Data received from QPI forwarded to LLC.
Expressed in Bytes
DIRECT2CORE.SUCCESS * 64
DATA_FROM_QPI_TO_NODEx:
Data packets received from QPI sent to
Node ID 'x'. Expressed in bytes
DRS_DataC_FROM_QPI_TO_NODEx +
DRS_WRITE_FROM_QPI_TO_NODEx +
NCB_DATA_FROM_QPI_TO_NODEx
DRS_DATA_MSGS_FROM_QPI:
DRS Data Messges From QPI in bytes
(RxL_FLITS_G1.DRS_DATA * 8)
DRS_DataC_FROM_QPI_TO_NODEx:
DRS DataC packets received from QPI sent
to Node ID 'x'. Expressed in bytes
(CTO_COUNT
with:{Q_Py_PCI_PMON_PKT_MATCH0{[12:0],dnid}={0x1C00,
x} Q_Py_PCI_PMON_PKT_MASK0[17:0]=0x3FF80) * 64
DRS_FULL_CACHELINE_MSGS_FROM_QPI:
DRS Full Cacheline Data Messges From QPI
in bytes
(CTO_COUNT
with:{Q_Py_PCI_PMON_PKT_MATCH0[12:0]=0x1C00,Q_Py_PC
I_PMON_PKT_MASK0[12:0]=0x1F00}) * 64)
Reference Number: 327043-001
Intel® Xeon® Processor E5-2600 Product Family Uncore Performance Monitoring
Table 2-95. Metrics Derived from Intel QPI LL Events (Sheet 2 of 3)
Symbol Name:
Definition
Equation
DRS_F_OR_E_FROM_QPI:
DRS response in F or E states received from
QPI in bytes. To calculate the total data
response for each cache line state, it's
necessary to add the contribution from three
flavors {DataC, DataC_FrcAckCnflt,
DataC_Cmp} of data response packets for
each cache line state.
((CTO_COUNT
with:{Q_Py_PCI_PMON_PKT_MATCH0[12:0]=0x1C00,
Q_Py_PCI_PMON_PKT_MASK0[12:0]=0x1FE0,
Q_Py_PCI_PMON_PKT_MATCH1[19:16]=0x4,
Q_Py_PCI_PMON_PKT_MASK0[19:16]=0xF }) + (CTO_COUNT
with:{Q_Py_PCI_PMON_PKT_MATCH0[12:0]=0x1C00,
Q_Py_PCI_PMON_PKT_MASK0[12:0]=0x1FE0,
Q_Py_PCI_PMON_PKT_MATCH1[19:16]=0x1,
Q_Py_PCI_PMON_PKT_MASK0[19:16]=0xF }) + (CTO_COUNT
with:{Q_Py_PCI_PMON_PKT_MATCH0[12:0]=0x1C40,
Q_Py_PCI_PMON_PKT_MASK0[12:0]=0x1FE0,
Q_Py_PCI_PMON_PKT_MATCH1[19:16]=0x4,
Q_Py_PCI_PMON_PKT_MASK0[19:16]=0xF }) + (CTO_COUNT
with:{Q_Py_PCI_PMON_PKT_MATCH0[12:0]=0x1C40,
Q_Py_PCI_PMON_PKT_MASK0[12:0]=0x1FE0,
Q_Py_PCI_PMON_PKT_MATCH1[19:16]=0x1,
Q_Py_PCI_PMON_PKT_MASK0[19:16]=0xF }) + (CTO_COUNT
with:{Q_Py_PCI_PMON_PKT_MATCH0[12:0]=0x1C20,
Q_Py_PCI_PMON_PKT_MASK0[12:0]=0x1FE0,
Q_Py_PCI_PMON_PKT_MATCH1[19:16]=0x4,
Q_Py_PCI_PMON_PKT_MASK0[19:16]=0xF }) + (CTO_COUNT
with:{Q_Py_PCI_PMON_PKT_MATCH0[12:0]=0x1C20,
Q_Py_PCI_PMON_PKT_MASK0[12:0]=0x1FE0,
Q_Py_PCI_PMON_PKT_MATCH1[19:16]=0x1,
Q_Py_PCI_PMON_PKT_MASK0[19:16]=0xF })) * 64
DRS_M_FROM_QPI:
DRS response in M state received from QPI
in bytes
(CTO_COUNT
with:{Q_Py_PCI_PMON_PKT_MATCH0[12:0]=0x1C00,
Q_Py_PCI_PMON_PKT_MASK0[12:0]=0x1FE0,
Q_Py_PCI_PMON_PKT_MATCH1[19:16]=0x8,
Q_Py_PCI_PMON_PKT_MASK0[19:16]=0xF }) * 64
DRS_PTL_CACHELINE_MSGS_FROM_QPI:
DRS Partial Cacheline Data Messges From
QPI in bytes
(CTO_COUNT
with:{Q_Py_PCI_PMON_PKT_MATCH0[12:0]=0x1D00,
Q_Py_PCI_PMON_PKT_MASK0[12:0]=0x1F00}) * 64
DRS_WB_FROM_QPI:
DRS writeback packets received from QPI in
bytes. This is the sum of Wb{I,S,E} DRS
packets
DRS_WbI_FROM_QPI + DRS_WbS_FROM_QPI +
DRS_WbE_FROM_QPI
DRS_WRITE_FROM_QPI_TO_NODEx:
DRS Data packets (Any - DataC) received
from QPI sent to Node ID 'x'. Expressed in
bytes
((CTO_COUNT
with:{Q_Py_PCI_PMON_PKT_MATCH0{[12:0],dnid}={0x1C00,
x} Q_Py_PCI_PMON_PKT_MASK0[17:0]=0x3FE00) (CTO_COUNT
with:{Q_Py_PCI_PMON_PKT_MATCH0{[12:0],dnid}={0x1C00,
x} Q_Py_PCI_PMON_PKT_MASK0[17:0]=0x3FF80)) * 64
DRS_WbE_FROM_QPI:
DRS writeback 'change to E state' packets
received from QPI in bytes
(CTO_COUNT
with:{Q_Py_PCI_PMON_PKT_MATCH0[12:0]=0x1CC0,
Q_Py_PCI_PMON_PKT_MASK0[12:0]=0x1FE0) * 64
DRS_WbI_FROM_QPI:
DRS writeback 'change to I state' packets
received from QPI in bytes
(CTO_COUNT
with:{Q_Py_PCI_PMON_PKT_MATCH0[12:0]=0x1C80,
Q_Py_PCI_PMON_PKT_MASK0[12:0]=0x1FE0) * 64
DRS_WbS_FROM_QPI:
DRS writeback 'change to S state' packets
received from QPI in bytes
(CTO_COUNT
with:{Q_Py_PCI_PMON_PKT_MATCH0[12:0]=0x1CA0,
Q_Py_PCI_PMON_PKT_MASK0[12:0]=0x1FE0) * 64
NCB_DATA_FROM_QPI_TO_NODEx:
NCB Data packets (Any - Interrupts)
received from QPI sent to Node ID 'x'.
Expressed in bytes
((CTO_COUNT
with:{Q_Py_PCI_PMON_PKT_MATCH0{[12:0],dnid}={0x1800,
x} Q_Py_PCI_PMON_PKT_MASK0[17:0]=0x3FE00) (CTO_COUNT
with:{Q_Py_PCI_PMON_PKT_MATCH0{[12:0],dnid}={0x1900,
x} Q_Py_PCI_PMON_PKT_MASK0[17:0]=0x3FF80)) * 64
NCB_DATA_MSGS_FROM_QPI:
NCB Data Messages From QPI in bytes
(RxL_FLITS_G2.NCB_DATA * 8)
PCT_LINK_CRC_RETRY_CYCLES:
Percent of Cycles the QPI link layer is in
retry mode due to CRC errors
RxL_CRC_CYCLES_IN_LLR / CLOCKTICKS
Reference Number: 327043-001
97
Intel® Xeon® Processor E5-2600 Product Family Uncore Performance Monitoring
Table 2-95. Metrics Derived from Intel QPI LL Events (Sheet 3 of 3)
Symbol Name:
Definition
2.7.7
Equation
PCT_LINK_FULL_POWER_CYCLES:
Percent of Cycles the QPI link is at Full
Power
RxL0_POWER_CYCLES / CLOCKTICKS
PCT_LINK_HALF_DISABLED_CYCLES:
Percent of Cycles the QPI link in power
mode where half of the lanes are disabled.
RxL0p_POWER_CYCLES / CLOCKTICKS
PCT_LINK_SHUTDOWN_CYCLES:
Percent of Cycles the QPI link is Shutdown
L1_POWER_CYCLES / CLOCKTICKS
QPI_LINK_UTIL:
Percentage of cycles that QPI Link was
utilized. Calculated from 1 - Number of idle
flits - time the link was 'off'
(RxL_FLITS_G0.DATA + RxL_FLITS_G0.NON_DATA) / (2 *
CLOCKTICKS)
QPI_SPEED:
QPI Speed - In GT/s (GigaTransfers /
Second) - Max QPI Bandwidth is 2 * ROUND
( QPI Speed , 0)
ROUND ((CLOCKTICKS / (CLOCKTICKS * QPI_VALUES)) *
TSC_SPEED, 0 ) * ( 8 / 1000)
Intel® QPI LL Box Performance Monitor Event List
The section enumerates the performance monitoring events for the Intel® QPI LL Box.
CLOCKTICKS
•
•
•
•
•
Title: Number of qfclks
Category: CFCLK Events
Event Code: 0x14
Max. Inc/Cyc: 1, Register Restrictions: 0-3
Definition: Counts the number of clocks in the Intel® QPI LL. This clock runs at 1/8th the "GT/s"
speed of the Intel® QPI link. For example, a 8GT/s link will have qfclk or 1GHz. JKT does not support dynamic link speeds, so this frequency is fixed.
CTO_COUNT
•
•
•
•
•
•
Title: Count of CTO Events
Category: CTO Events
Event Code: 0x38
Extra Select Bit: Y
Max. Inc/Cyc: 2, Register Restrictions: 0-3
Definition: Counts the number of CTO (cluster trigger outs) events that were asserted across the
two slots. If both slots trigger in a given cycle, the event will increment by 2. You can use edge
detect to count the number of cases when both events triggered.
DIRECT2CORE
•
•
•
•
•
98
Title: Direct 2 Core Spawning
Category: DIRECT2CORE Events
Event Code: 0x13
Max. Inc/Cyc: 1, Register Restrictions: 0-3
Definition: Counts the number of DRS packets that we attempted to do direct2core on. There are
4 mutually exlusive filters. Filter [0] can be used to get successful spawns, while [1:3] provide the
different failure cases. Note that this does not count packets that are not candidates for
Direct2Core. The only candidates for Direct2Core are DRS packets destined for Cbos.
Reference Number: 327043-001
Intel® Xeon® Processor E5-2600 Product Family Uncore Performance Monitoring
Table 2-96. Unit Masks for DIRECT2CORE
Extension
umask
[15:8]
Description
SUCCESS
bxxxxxxx1
Spawn Success:
The spawn was successful. There were sufficient credits, and the
message was marked to spawn direct2core.
FAILURE_CREDITS
bxxxxxx1x
Spawn Failure - Egress Credits:
The spawn failed because there were not enough Egress credits. Had
there been enough credits, the spawn would have worked as the RBT
bit was set.
FAILURE_RBT
bxxxxx1xx
Spawn Failure - RBT Not Set:
The spawn failed because the route-back table (RBT) specified that
the transaction should not trigger a direct2core tranaction. This is
common for IO transactions. There were enough Egress credits.
FAILURE_CREDITS_RBT
bxxxx1xxx
Spawn Failure - Egress and RBT:
The spawn failed because there were not enough Egress credits AND
the RBT bit was not set.
L1_POWER_CYCLES
•
•
•
•
•
Title: Cycles in L1
Category: POWER Events
Event Code: 0x12
Max. Inc/Cyc: 1, Register Restrictions: 0-3
Definition: Number of Intel® QPI qfclk cycles spent in L1 power mode. L1 is a mode that totally
shuts down a Intel® QPI link. Use edge detect to count the number of instances when the Intel®
QPI link entered L1. Link power states are per link and per direction, so for example the Tx direction could be in one state while Rx was in another. Because L1 totally shuts down the link, it takes a
good amount of time to exit this mode.
RxL0P_POWER_CYCLES
•
•
•
•
•
Title: Cycles in L0p
Category: POWER_RX Events
Event Code: 0x10
Max. Inc/Cyc: 1, Register Restrictions: 0-3
Definition: Number of Intel® QPI qfclk cycles spent in L0p power mode. L0p is a mode where we
disable 1/2 of the Intel® QPI lanes, decreasing our bandwidth in order to save power. It increases
snoop and data transfer latencies and decreases overall bandwidth. This mode can be very useful
in NUMA optimized workloads that largely only utilize Intel® QPI for snoops and their responses.
Use edge detect to count the number of instances when the Intel® QPI link entered L0p. Link
power states are per link and per direction, so for example the Tx direction could be in one state
while Rx was in another.
• NOTE: Using .edge_det to count transitions does not function if L1_POWER_CYCLES
RxL0_POWER_CYCLES
•
•
•
•
•
Title: Cycles in L0
Category: POWER_RX Events
Event Code: 0x0F
Max. Inc/Cyc: 1, Register Restrictions: 0-3
Definition: Number of Intel® QPI qfclk cycles spent in L0 power mode in the Link Layer. L0 is the
default mode which provides the highest performance with the most power. Use edge detect to
count the number of instances that the link entered L0. Link power states are per link and per
direction, so for example the Tx direction could be in one state while Rx was in another. The phy
layer sometimes leaves L0 for training, which will not be captured by this event.
Reference Number: 327043-001
99
Intel® Xeon® Processor E5-2600 Product Family Uncore Performance Monitoring
RxL_BYPASSED
•
•
•
•
•
Title: Rx Flit Buffer Bypassed
Category: RXQ Events
Event Code: 0x09
Max. Inc/Cyc: 1, Register Restrictions: 0-3
Definition: Counts the number of times that an incoming flit was able to bypass the flit buffer and
pass directly across the BGF and into the Egress. This is a latency optimization, and should generally be the common case. If this value is less than the number of flits transfered, it implies that
there was queueing getting onto the ring, and thus the transactions saw higher latency.
RxL_CREDITS_CONSUMED_VN0
•
•
•
•
•
•
Title: VN0 Credit Consumed
Category: RX_CREDITS_CONSUMED Events
Event Code: 0x1E
Extra Select Bit: Y
Max. Inc/Cyc: 1, Register Restrictions: 0-3
Definition: Counts the number of times that an RxQ VN0 credit was consumed (i.e. message uses
a VN0 credit for the Rx Buffer). This includes packets that went through the RxQ and those that
were bypasssed.
Table 2-97. Unit Masks for RxL_CREDITS_CONSUMED_VN0
Extension
umask
[15:8]
Description
DRS
bxxxxxxx1
DRS:
VN0 credit for the DRS message class.
NCB
bxxxxxx1x
NCB:
VN0 credit for the NCB message class.
NCS
bxxxxx1xx
NCS:
VN0 credit for the NCS message class.
HOM
bxxxx1xxx
HOM:
VN0 credit for the HOM message class.
SNP
bxxx1xxxx
SNP:
VN0 credit for the SNP message class.
NDR
bxx1xxxxx
NDR:
VN0 credit for the NDR message class.
RxL_CREDITS_CONSUMED_VNA
•
•
•
•
•
•
Title: VNA Credit Consumed
Category: RX_CREDITS_CONSUMED Events
Event Code: 0x1D
Extra Select Bit: Y
Max. Inc/Cyc: 1, Register Restrictions: 0-3
Definition: Counts the number of times that an RxQ VNA credit was consumed (i.e. message uses
a VNA credit for the Rx Buffer). This includes packets that went through the RxQ and those that
were bypasssed.
RxL_CYCLES_NE
•
•
•
•
Title: RxQ Cycles Not Empty
Category: RXQ Events
Event Code: 0x0A
Max. Inc/Cyc: 1, Register Restrictions: 0-3
100
Reference Number: 327043-001
Intel® Xeon® Processor E5-2600 Product Family Uncore Performance Monitoring
• Definition: Counts the number of cycles that the Intel® QPI RxQ was not empty. Generally, when
data is transmitted across Intel® QPI, it will bypass the RxQ and pass directly to the ring interface.
If things back up getting transmitted onto the ring, however, it may need to allocate into this buffer,
thus increasing the latency. This event can be used in conjunction with the Flit Buffer Occupancy
Accumulator event to calculate the average occupancy.
RxL_FLITS_G0
•
•
•
•
•
Title: Flits Received - Group 0
Category: FLITS_RX Events
Event Code: 0x01
Max. Inc/Cyc: 2, Register Restrictions: 0-3
Definition: Counts the number of flits received from the Intel® QPI Link. It includes filters for
Idle, protocol, and Data Flits. Each "flit" is made up of 80 bits of information (in addition to some
ECC data). In full-width (L0) mode, flits are made up of four "fits", each of which contains 20 bits
of data (along with some additional ECC data). In half-width (L0p) mode, the fits are only 10 bits,
and therefore it takes twice as many fits to transmit a flit. When one talks about Intel® QPI
"speed" (for example, 8.0 GT/s), the "transfers" here refer to "fits". Therefore, in L0, the system
will transfer 1 "flit" at the rate of 1/4th the Intel® QPI speed. One can calculate the bandwidth of
the link by taking: flits*80b/time. Note that this is not the same as "data" bandwidth. For example, when we are transfering a 64B cacheline across Intel® QPI, we will break it into 9 flits -- 1 with
header information and 8 with 64 bits of actual "data" and an additional 16 bits of other information. To calculate "data" bandwidth, one should therefore do: data flits * 8B / time (for L0) or 4B
instead of 8B for L0p.
Table 2-98. Unit Masks for RxL_FLITS_G0
Extension
umask
[15:8]
Description
IDLE
bxxxxxxx1
Idle and Null Flits:
Number of flits received over Intel® QPI that do not hold protocol
payload. When Intel® QPI is not in a power saving state, it
continuously transmits flits across the link. When there are no
protocol flits to send, it will send IDLE and NULL flits across. These
flits sometimes do carry a payload, such as credit returns, but are
generall not considered part of the Intel® QPI bandwidth.
DATA
bxxxxxx1x
Data Tx Flits:
Number of data flitsreceived over Intel® QPI. Each flit contains 64b
of data. This includes both DRS and NCB data flits (coherent and
non-coherent). This can be used to calculate the data bandwidth of
the Intel® QPI link. One can get a good picture of the Intel® QPIlink characteristics by evaluating the protocol flits, data flits, and idle/
null flits. This does not include the header flits that go in data
packets.
NON_DATA
bxxxxx1xx
Non-Data protocol Tx Flits:
Number of non-NULL non-data flits received across Intel® QPI. This
basically tracks the protocol overhead on the Intel® QPI link. One
can get a good picture of the Intel® QPI-link characteristics by
evaluating the protocol flits, data flits, and idle/null flits. This
includes the header flits for data packets.
RxL_FLITS_G1
•
•
•
•
•
•
Title: Flits Received - Group 1
Category: FLITS_RX Events
Event Code: 0x02
Extra Select Bit: Y
Max. Inc/Cyc: 2, Register Restrictions: 0-3
Definition: Counts the number of flits received from the Intel® QPI Link. This is one of three
"groups" that allow us to track flits. It includes filters for SNP, HOM, and DRS message classes.
Each "flit" is made up of 80 bits of information (in addition to some ECC data). In full-width (L0)
mode, flits are made up of four "fits", each of which contains 20 bits of data (along with some additional ECC data). In half-width (L0p) mode, the fits are only 10 bits, and therefore it takes twice as
many fits to transmit a flit. When one talks about Intel® QPI "speed" (for example, 8.0 GT/s), the
Reference Number: 327043-001
101
Intel® Xeon® Processor E5-2600 Product Family Uncore Performance Monitoring
"transfers" here refer to "fits". Therefore, in L0, the system will transfer 1 "flit" at the rate of 1/4th
the Intel® QPI speed. One can calculate the bandwidth of the link by taking: flits*80b/time. Note
that this is not the same as "data" bandwidth. For example, when we are transfering a 64B cacheline across Intel® QPI, we will break it into 9 flits -- 1 with header information and 8 with 64 bits of
actual "data" and an additional 16 bits of other information. To calculate "data" bandwidth, one
should therefore do: data flits * 8B / time.
Table 2-99. Unit Masks for RxL_FLITS_G1
Extension
umask
[15:8]
Description
SNP
bxxxxxxx1
SNP Flits:
Counts the number of snoop request flits received over Intel® QPI.
These requests are contained in the snoop channel. This does not
include snoop responses, which are received on the home channel.
HOM_REQ
bxxxxxx1x
HOM Request Flits:
Counts the number of data request received over Intel® QPI on the
home channel. This basically counts the number of remote memory
requests received over Intel® QPI. In conjunction with the local read
count in the Home Agent, one can calculate the number of LLC
Misses.
HOM_NONREQ
bxxxxx1xx
HOM Non-Request Flits:
Counts the number of non-request flits received over Intel® QPI on
the home channel. These are most commonly snoop responses, and
this event can be used as a proxy for that.
HOM
b00000110
HOM Flits:
Counts the number of flits received over Intel® QPI on the home
channel.
DRS_DATA
bxxxx1xxx
DRS Data Flits:
Counts the total number of data flits received over Intel® QPI on the
DRS (Data Response) channel. DRS flits are used to transmit data
with coherency. This does not count data flits received over the NCB
channel which transmits non-coherent data. This includes only the
data flits (not the header).
DRS_NONDATA
bxxx1xxxx
DRS Header Flits:
Counts the total number of protocol flits received over Intel® QPI on
the DRS (Data Response) channel. DRS flits are used to transmit
data with coherency. This does not count data flits received over the
NCB channel which transmits non-coherent data. This includes only
the header flits (not the data). This includes extended headers.
DRS
b00011000
DRS Flits (both Header and Data):
Counts the total number of flits received over Intel® QPI on the DRS
(Data Response) channel. DRS flits are used to transmit data with
coherency. This does not count data flits received over the NCB
channel which transmits non-coherent data.
RxL_FLITS_G2
•
•
•
•
•
•
Title: Flits Received - Group 2
Category: FLITS_RX Events
Event Code: 0x03
Extra Select Bit: Y
Max. Inc/Cyc: 2, Register Restrictions: 0-3
Definition: Counts the number of flits received from the Intel® QPI Link. This is one of three
"groups" that allow us to track flits. It includes filters for NDR, NCB, and NCS message classes.
Each "flit" is made up of 80 bits of information (in addition to some ECC data). In full-width (L0)
mode, flits are made up of four "fits", each of which contains 20 bits of data (along with some additional ECC data). In half-width (L0p) mode, the fits are only 10 bits, and therefore it takes twice as
many fits to transmit a flit. When one talks about Intel® QPI "speed" (for example, 8.0 GT/s), the
"transfers" here refer to "fits". Therefore, in L0, the system will transfer 1 "flit" at the rate of 1/4th
the Intel® QPI speed. One can calculate the bandwidth of the link by taking: flits*80b/time. Note
that this is not the same as "data" bandwidth. For example, when we are transfering a 64B cacheline across Intel® QPI, we will break it into 9 flits -- 1 with header information and 8 with 64 bits of
actual "data" and an additional 16 bits of other information. To calculate "data" bandwidth, one
should therefore do: data flits * 8B / time.
102
Reference Number: 327043-001
Intel® Xeon® Processor E5-2600 Product Family Uncore Performance Monitoring
Table 2-100. Unit Masks for RxL_FLITS_G2
Extension
umask
[15:8]
Description
NDR_AD
bxxxxxxx1
Non-Data Response Rx Flits - AD:
Counts the total number of flits received over the NDR (Non-Data
Response) channel. This channel is used to send a variety of protocol
flits including grants and completions. This is only for NDR packets to
the local socket which use the AK ring.
NDR_AK
bxxxxxx1x
Non-Data Response Rx Flits - AK:
Counts the total number of flits received over the NDR (Non-Data
Response) channel. This channel is used to send a variety of protocol
flits including grants and completions. This is only for NDR packets
destined for Route-thru to a remote socket.
NCB_DATA
bxxxxx1xx
Non-Coherent data Rx Flits:
Number of Non-Coherent Bypass data flits. These flits are generally
used to transmit non-coherent data across Intel® QPI. This does not
include a count of the DRS (coherent) data flits. This only counts the
data flits, not the NCB headers.
NCB_NONDATA
bxxxx1xxx
Non-Coherent non-data Rx Flits:
Number of Non-Coherent Bypass non-data flits. These packets are
generally used to transmit non-coherent data across Intel® QPI, and
the flits counted here are for headers and other non-data flits. This
includes extended headers.
NCB
b00001100
Non-Coherent Rx Flits:
Number of Non-Coherent Bypass flits. These packets are generally
used to transmit non-coherent data across Intel® QPI.
NCS
bxxx1xxxx
Non-Coherent standard Rx Flits:
Number of NCS (non-coherent standard) flits received over Intel®
QPI. This includes extended headers.
RxL_INSERTS
•
•
•
•
•
Title: Rx Flit Buffer Allocations
Category: RXQ Events
Event Code: 0x08
Max. Inc/Cyc: 1, Register Restrictions: 0-3
Definition: Number of allocations into the Intel® QPI Rx Flit Buffer. Generally, when data is transmitted across Intel® QPI, it will bypass the RxQ and pass directly to the ring interface. If things
back up getting transmitted onto the ring, however, it may need to allocate into this buffer, thus
increasing the latency. This event can be used in conjunction with the Flit Buffer Occupancy event
in order to calculate the average flit buffer lifetime.
RxL_INSERTS_DRS
•
•
•
•
•
•
Title: Rx Flit Buffer Allocations - DRS
Category: RXQ Events
Event Code: 0x09
Extra Select Bit: Y
Max. Inc/Cyc: 1, Register Restrictions: 0-3
Definition: Number of allocations into the Intel® QPI Rx Flit Buffer. Generally, when data is transmitted across Intel® QPI, it will bypass the RxQ and pass directly to the ring interface. If things
back up getting transmitted onto the ring, however, it may need to allocate into this buffer, thus
increasing the latency. This event can be used in conjunction with the Flit Buffer Occupancy event
in order to calculate the average flit buffer lifetime. This monitors only DRS flits.
Reference Number: 327043-001
103
Intel® Xeon® Processor E5-2600 Product Family Uncore Performance Monitoring
RxL_INSERTS_HOM
•
•
•
•
•
•
Title: Rx Flit Buffer Allocations - HOM
Category: RXQ Events
Event Code: 0x0C
Extra Select Bit: Y
Max. Inc/Cyc: 1, Register Restrictions: 0-3
Definition: Number of allocations into the Intel® QPI Rx Flit Buffer. Generally, when data is transmitted across Intel® QPI, it will bypass the RxQ and pass directly to the ring interface. If things
back up getting transmitted onto the ring, however, it may need to allocate into this buffer, thus
increasing the latency. This event can be used in conjunction with the Flit Buffer Occupancy event
in order to calculate the average flit buffer lifetime. This monitors only HOM flits.
RxL_INSERTS_NCB
•
•
•
•
•
•
Title: Rx Flit Buffer Allocations - NCB
Category: RXQ Events
Event Code: 0x0A
Extra Select Bit: Y
Max. Inc/Cyc: 1, Register Restrictions: 0-3
Definition: Number of allocations into the Intel® QPI Rx Flit Buffer. Generally, when data is transmitted across Intel® QPI, it will bypass the RxQ and pass directly to the ring interface. If things
back up getting transmitted onto the ring, however, it may need to allocate into this buffer, thus
increasing the latency. This event can be used in conjunction with the Flit Buffer Occupancy event
in order to calculate the average flit buffer lifetime. This monitors only NCB flits.
RxL_INSERTS_NCS
•
•
•
•
•
•
Title: Rx Flit Buffer Allocations - NCS
Category: RXQ Events
Event Code: 0x0B
Extra Select Bit: Y
Max. Inc/Cyc: 1, Register Restrictions: 0-3
Definition: Number of allocations into the Intel® QPI Rx Flit Buffer. Generally, when data is transmitted across Intel® QPI, it will bypass the RxQ and pass directly to the ring interface. If things
back up getting transmitted onto the ring, however, it may need to allocate into this buffer, thus
increasing the latency. This event can be used in conjunction with the Flit Buffer Occupancy event
in order to calculate the average flit buffer lifetime. This monitors only NCS flits.
RxL_INSERTS_NDR
•
•
•
•
•
•
Title: Rx Flit Buffer Allocations - NDR
Category: RXQ Events
Event Code: 0x0E
Extra Select Bit: Y
Max. Inc/Cyc: 1, Register Restrictions: 0-3
Definition: Number of allocations into the Intel® QPI Rx Flit Buffer. Generally, when data is transmitted across Intel® QPI, it will bypass the RxQ and pass directly to the ring interface. If things
back up getting transmitted onto the ring, however, it may need to allocate into this buffer, thus
increasing the latency. This event can be used in conjunction with the Flit Buffer Occupancy event
in order to calculate the average flit buffer lifetime. This monitors only NDR flits.
104
Reference Number: 327043-001
Intel® Xeon® Processor E5-2600 Product Family Uncore Performance Monitoring
RxL_INSERTS_SNP
•
•
•
•
•
•
Title: Rx Flit Buffer Allocations - SNP
Category: RXQ Events
Event Code: 0x0D
Extra Select Bit: Y
Max. Inc/Cyc: 1, Register Restrictions: 0-3
Definition: Number of allocations into the Intel® QPI Rx Flit Buffer. Generally, when data is transmitted across Intel® QPI, it will bypass the RxQ and pass directly to the ring interface. If things
back up getting transmitted onto the ring, however, it may need to allocate into this buffer, thus
increasing the latency. This event can be used in conjunction with the Flit Buffer Occupancy event
in order to calculate the average flit buffer lifetime. This monitors only SNP flits.
RxL_OCCUPANCY
•
•
•
•
•
Title: RxQ Occupancy - All Packets
Category: RXQ Events
Event Code: 0x0B
Max. Inc/Cyc: 128, Register Restrictions: 0-3
Definition: Accumulates the number of elements in the Intel® QPI RxQ in each cycle. Generally,
when data is transmitted across Intel® QPI, it will bypass the RxQ and pass directly to the ring
interface. If things back up getting transmitted onto the ring, however, it may need to allocate into
this buffer, thus increasing the latency. This event can be used in conjunction with the Flit Buffer
Not Empty event to calculate average occupancy, or with the Flit Buffer Allocations event to track
average lifetime.
RxL_OCCUPANCY_DRS
•
•
•
•
•
•
Title: RxQ Occupancy - DRS
Category: RXQ Events
Event Code: 0x15
Extra Select Bit: Y
Max. Inc/Cyc: 128, Register Restrictions: 0-3
Definition: Accumulates the number of elements in the Intel® QPI RxQ in each cycle. Generally,
when data is transmitted across Intel® QPI, it will bypass the RxQ and pass directly to the ring
interface. If things back up getting transmitted onto the ring, however, it may need to allocate into
this buffer, thus increasing the latency. This event can be used in conjunction with the Flit Buffer
Not Empty event to calculate average occupancy, or with the Flit Buffer Allocations event to track
average lifetime. This monitors DRS flits only.
RxL_OCCUPANCY_HOM
•
•
•
•
•
•
Title: RxQ Occupancy - HOM
Category: RXQ Events
Event Code: 0x18
Extra Select Bit: Y
Max. Inc/Cyc: 128, Register Restrictions: 0-3
Definition: Accumulates the number of elements in the Intel® QPI RxQ in each cycle. Generally,
when data is transmitted across Intel® QPI, it will bypass the RxQ and pass directly to the ring
interface. If things back up getting transmitted onto the ring, however, it may need to allocate into
this buffer, thus increasing the latency. This event can be used in conjunction with the Flit Buffer
Not Empty event to calculate average occupancy, or with the Flit Buffer Allocations event to track
average lifetime. This monitors HOM flits only.
Reference Number: 327043-001
105
Intel® Xeon® Processor E5-2600 Product Family Uncore Performance Monitoring
RxL_OCCUPANCY_NCB
•
•
•
•
•
•
Title: RxQ Occupancy - NCB
Category: RXQ Events
Event Code: 0x16
Extra Select Bit: Y
Max. Inc/Cyc: 128, Register Restrictions: 0-3
Definition: Accumulates the number of elements in the Intel® QPI RxQ in each cycle. Generally,
when data is transmitted across Intel® QPI, it will bypass the RxQ and pass directly to the ring
interface. If things back up getting transmitted onto the ring, however, it may need to allocate into
this buffer, thus increasing the latency. This event can be used in conjunction with the Flit Buffer
Not Empty event to calculate average occupancy, or with the Flit Buffer Allocations event to track
average lifetime. This monitors NCB flits only.
RxL_OCCUPANCY_NCS
•
•
•
•
•
•
Title: RxQ Occupancy - NCS
Category: RXQ Events
Event Code: 0x17
Extra Select Bit: Y
Max. Inc/Cyc: 128, Register Restrictions: 0-3
Definition: Accumulates the number of elements in the Intel® QPI RxQ in each cycle. Generally,
when data is transmitted across Intel® QPI, it will bypass the RxQ and pass directly to the ring
interface. If things back up getting transmitted onto the ring, however, it may need to allocate into
this buffer, thus increasing the latency. This event can be used in conjunction with the Flit Buffer
Not Empty event to calculate average occupancy, or with the Flit Buffer Allocations event to track
average lifetime. This monitors NCS flits only.
RxL_OCCUPANCY_NDR
•
•
•
•
•
•
Title: RxQ Occupancy - NDR
Category: RXQ Events
Event Code: 0x1A
Extra Select Bit: Y
Max. Inc/Cyc: 128, Register Restrictions: 0-3
Definition: Accumulates the number of elements in the Intel® QPI RxQ in each cycle. Generally,
when data is transmitted across Intel® QPI, it will bypass the RxQ and pass directly to the ring
interface. If things back up getting transmitted onto the ring, however, it may need to allocate into
this buffer, thus increasing the latency. This event can be used in conjunction with the Flit Buffer
Not Empty event to calculate average occupancy, or with the Flit Buffer Allocations event to track
average lifetime. This monitors NDR flits only.
RxL_OCCUPANCY_SNP
•
•
•
•
•
•
Title: RxQ Occupancy - SNP
Category: RXQ Events
Event Code: 0x19
Extra Select Bit: Y
Max. Inc/Cyc: 128, Register Restrictions: 0-3
Definition: Accumulates the number of elements in the Intel® QPI RxQ in each cycle. Generally,
when data is transmitted across Intel® QPI, it will bypass the RxQ and pass directly to the ring
interface. If things back up getting transmitted onto the ring, however, it may need to allocate into
this buffer, thus increasing the latency. This event can be used in conjunction with the Flit Buffer
Not Empty event to calculate average occupancy, or with the Flit Buffer Allocations event to track
average lifetime. This monitors SNP flits only.
106
Reference Number: 327043-001
Intel® Xeon® Processor E5-2600 Product Family Uncore Performance Monitoring
TxL0P_POWER_CYCLES
•
•
•
•
•
Title: Cycles in L0p
Category: POWER_TX Events
Event Code: 0x0D
Max. Inc/Cyc: 1, Register Restrictions: 0-3
Definition: Number of Intel® QPI qfclk cycles spent in L0p power mode. L0p is a mode where we
disable 1/2 of the Intel® QPI lanes, decreasing our bandwidth in order to save power. It increases
snoop and data transfer latencies and decreases overall bandwidth. This mode can be very useful
in NUMA optimized workloads that largely only utilize Intel® QPI for snoops and their responses.
Use edge detect to count the number of instances when the Intel® QPI link entered L0p. Link
power states are per link and per direction, so for example the Tx direction could be in one state
while Rx was in another.
• NOTE: Using .edge_det to count transitions does not function if L1_POWER_CYCLES
TxL0_POWER_CYCLES
•
•
•
•
•
Title: Cycles in L0
Category: POWER_TX Events
Event Code: 0x0C
Max. Inc/Cyc: 1, Register Restrictions: 0-3
Definition: Number of Intel® QPI qfclk cycles spent in L0 power mode in the Link Layer. L0 is the
default mode which provides the highest performance with the most power. Use edge detect to
count the number of instances that the link entered L0. Link power states are per link and per
direction, so for example the Tx direction could be in one state while Rx was in another. The phy
layer sometimes leaves L0 for training, which will not be captured by this event.
TxL_BYPASSED
•
•
•
•
•
Title: Tx Flit Buffer Bypassed
Category: TXQ Events
Event Code: 0x05
Max. Inc/Cyc: 1, Register Restrictions: 0-3
Definition: Counts the number of times that an incoming flit was able to bypass the Tx flit buffer
and pass directly out the Intel® QPI Link. Generally, when data is transmitted across Intel® QPI, it
will bypass the TxQ and pass directly to the link. However, the TxQ will be used with L0p and when
LLR occurs, increasing latency to transfer out to the link.
TxL_CYCLES_NE
•
•
•
•
•
Title: Tx Flit Buffer Cycles not Empty
Category: TXQ Events
Event Code: 0x06
Max. Inc/Cyc: 1, Register Restrictions: 0-3
Definition: Counts the number of cycles when the TxQ is not empty. Generally, when data is transmitted across Intel® QPI, it will bypass the TxQ and pass directly to the link. However, the TxQ will
be used with L0p and when LLR occurs, increasing latency to transfer out to the link.
TxL_FLITS_G0
•
•
•
•
•
Title: Flits Transferred - Group 0
Category: FLITS_TX Events
Event Code: 0x00
Max. Inc/Cyc: 2, Register Restrictions: 0-3
Definition: Counts the number of flits transmitted across the Intel® QPI Link. It includes filters for
Idle, protocol, and Data Flits. Each "flit" is made up of 80 bits of information (in addition to some
ECC data). In full-width (L0) mode, flits are made up of four "fits", each of which contains 20 bits
of data (along with some additional ECC data). In half-width (L0p) mode, the fits are only 10 bits,
and therefore it takes twice as many fits to transmit a flit. When one talks about Intel® QPI
Reference Number: 327043-001
107
Intel® Xeon® Processor E5-2600 Product Family Uncore Performance Monitoring
"speed" (for example, 8.0 GT/s), the "transfers" here refer to "fits". Therefore, in L0, the system
will transfer 1 "flit" at the rate of 1/4th the Intel® QPI speed. One can calculate the bandwidth of
the link by taking: flits*80b/time. Note that this is not the same as "data" bandwidth. For example, when we are transfering a 64B cacheline across Intel® QPI, we will break it into 9 flits -- 1 with
header information and 8 with 64 bits of actual "data" and an additional 16 bits of other information. To calculate "data" bandwidth, one should therefore do: data flits * 8B / time (for L0) or 4B
instead of 8B for L0p.
Table 2-101. Unit Masks for TxL_FLITS_G0
Extension
umask
[15:8]
Description
IDLE
bxxxxxxx1
Idle and Null Flits:
Number of flits transmitted over Intel® QPI that do not hold protocol
payload. When Intel® QPI is not in a power saving state, it
continuously transmits flits across the link. When there are no
protocol flits to send, it will send IDLE and NULL flits across. These
flits sometimes do carry a payload, such as credit returns, but are
generall not considered part of the Intel® QPI bandwidth.
DATA
bxxxxxx1x
Data Tx Flits:
Number of data flits transmitted over Intel® QPI. Each flit contains
64b of data. This includes both DRS and NCB data flits (coherent and
non-coherent). This can be used to calculate the data bandwidth of
the Intel® QPI link. One can get a good picture of the Intel® QPIlink characteristics by evaluating the protocol flits, data flits, and idle/
null flits. This does not include the header flits that go in data
packets.
NON_DATA
bxxxxx1xx
Non-Data protocol Tx Flits:
Number of non-NULL non-data flits transmitted across Intel® QPI.
This basically tracks the protocol overhead on the Intel® QPI link.
One can get a good picture of the Intel® QPI-link characteristics by
evaluating the protocol flits, data flits, and idle/null flits. This
includes the header flits for data packets.
TxL_FLITS_G1
•
•
•
•
•
•
Title: Flits Transferred - Group 1
Category: FLITS_TX Events
Event Code: 0x00
Extra Select Bit: Y
Max. Inc/Cyc: 2, Register Restrictions: 0-3
Definition: Counts the number of flits trasmitted across the Intel® QPI Link. This is one of three
"groups" that allow us to track flits. It includes filters for SNP, HOM, and DRS message classes.
Each "flit" is made up of 80 bits of information (in addition to some ECC data). In full-width (L0)
mode, flits are made up of four "fits", each of which contains 20 bits of data (along with some additional ECC data). In half-width (L0p) mode, the fits are only 10 bits, and therefore it takes twice as
many fits to transmit a flit. When one talks about Intel® QPI "speed" (for example, 8.0 GT/s), the
"transfers" here refer to "fits". Therefore, in L0, the system will transfer 1 "flit" at the rate of 1/4th
the Intel® QPI speed. One can calculate the bandwidth of the link by taking: flits*80b/time. Note
that this is not the same as "data" bandwidth. For example, when we are transfering a 64B cacheline across Intel® QPI, we will break it into 9 flits -- 1 with header information and 8 with 64 bits of
actual "data" and an additional 16 bits of other information. To calculate "data" bandwidth, one
should therefore do: data flits * 8B / time.
108
Reference Number: 327043-001
Intel® Xeon® Processor E5-2600 Product Family Uncore Performance Monitoring
Table 2-102. Unit Masks for TxL_FLITS_G1
Extension
umask
[15:8]
Description
SNP
bxxxxxxx1
SNP Flits:
Counts the number of snoop request flits transmitted over Intel®
QPI. These requests are contained in the snoop channel. This does
not include snoop responses, which are transmitted on the home
channel.
HOM_REQ
bxxxxxx1x
HOM Request Flits:
Counts the number of data request transmitted over Intel® QPI on
the home channel. This basically counts the number of remote
memory requests transmitted over Intel® QPI. In conjunction with
the local read count in the Home Agent, one can calculate the
number of LLC Misses.
HOM_NONREQ
bxxxxx1xx
HOM Non-Request Flits:
Counts the number of non-request flits transmitted over Intel® QPI
on the home channel. These are most commonly snoop responses,
and this event can be used as a proxy for that.
HOM
b00000110
HOM Flits:
Counts the number of flits transmitted over Intel® QPI on the home
channel.
DRS_DATA
bxxxx1xxx
DRS Data Flits:
Counts the total number of data flits transmitted over Intel® QPI on
the DRS (Data Response) channel. DRS flits are used to transmit
data with coherency. This does not count data flits transmitted over
the NCB channel which transmits non-coherent data. This includes
only the data flits (not the header).
DRS_NONDATA
bxxx1xxxx
DRS Header Flits:
Counts the total number of protocol flits transmitted over Intel® QPI
on the DRS (Data Response) channel. DRS flits are used to transmit
data with coherency. This does not count data flits transmitted over
the NCB channel which transmits non-coherent data. This includes
only the header flits (not the data). This includes extended headers.
DRS
b00011000
DRS Flits (both Header and Data):
Counts the total number of flits transmitted over Intel® QPI on the
DRS (Data Response) channel. DRS flits are used to transmit data
with coherency.
TxL_FLITS_G2
•
•
•
•
•
•
Title: Flits Transferred - Group 2
Category: FLITS_TX Events
Event Code: 0x01
Extra Select Bit: Y
Max. Inc/Cyc: 2, Register Restrictions: 0-3
Definition: Counts the number of flits trasmitted across the Intel® QPI Link. This is one of three
"groups" that allow us to track flits. It includes filters for NDR, NCB, and NCS message classes.
Each "flit" is made up of 80 bits of information (in addition to some ECC data). In full-width (L0)
mode, flits are made up of four "fits", each of which contains 20 bits of data (along with some additional ECC data). In half-width (L0p) mode, the fits are only 10 bits, and therefore it takes twice as
many fits to transmit a flit. When one talks about Intel® QPI "speed" (for example, 8.0 GT/s), the
"transfers" here refer to "fits". Therefore, in L0, the system will transfer 1 "flit" at the rate of 1/4th
the Intel® QPI speed. One can calculate the bandwidth of the link by taking: flits*80b/time. Note
that this is not the same as "data" bandwidth. For example, when we are transfering a 64B cacheline across Intel® QPI, we will break it into 9 flits -- 1 with header information and 8 with 64 bits of
actual "data" and an additional 16 bits of other information. To calculate "data" bandwidth, one
should therefore do: data flits * 8B / time.
Reference Number: 327043-001
109
Intel® Xeon® Processor E5-2600 Product Family Uncore Performance Monitoring
Table 2-103. Unit Masks for TxL_FLITS_G2
Extension
umask
[15:8]
Description
NDR_AD
bxxxxxxx1
Non-Data Response Tx Flits - AD:
Counts the total number of flits transmitted over the NDR (Non-Data
Response) channel. This channel is used to send a variety of protocol
flits including grants and completions. This is only for NDR packets to
the local socket which use the AK ring.
NDR_AK
bxxxxxx1x
Non-Data Response Tx Flits - AK:
Counts the total number of flits transmitted over the NDR (Non-Data
Response) channel. This channel is used to send a variety of protocol
flits including grants and completions. This is only for NDR packets
destined for Route-thru to a remote socket.
NCB_DATA
bxxxxx1xx
Non-Coherent data Tx Flits:
Number of Non-Coherent Bypass data flits. These flits are generally
used to transmit non-coherent data across Intel® QPI. This does not
include a count of the DRS (coherent) data flits. This only counts the
data flits, not te NCB headers.
NCB_NONDATA
bxxxx1xxx
Non-Coherent non-data Tx Flits:
Number of Non-Coherent Bypass non-data flits. These packets are
generally used to transmit non-coherent data across Intel® QPI, and
the flits counted here are for headers and other non-data flits. This
includes extended headers.
NCB
b00001100
Non-Coherent Bypass Tx Flits:
Number of Non-Coherent Bypass flits. These packets are generally
used to transmit non-coherent data across Intel® QPI.
NCS
bxxx1xxxx
Non-Coherent standard Tx Flits:
Number of NCS (non-coherent standard) flits transmitted over Intel®
QPI. This includes extended headers.
TxL_INSERTS
•
•
•
•
•
Title: Tx Flit Buffer Allocations
Category: TXQ Events
Event Code: 0x04
Max. Inc/Cyc: 1, Register Restrictions: 0-3
Definition: Number of allocations into the Intel® QPI Tx Flit Buffer. Generally, when data is transmitted across Intel® QPI, it will bypass the TxQ and pass directly to the link. However, the TxQ will
be used with L0p and when LLR occurs, increasing latency to transfer out to the link. This event can
be used in conjunction with the Flit Buffer Occupancy event in order to calculate the average flit
buffer lifetime.
TxL_OCCUPANCY
•
•
•
•
•
Title: Tx Flit Buffer Occupancy
Category: TXQ Events
Event Code: 0x07
Max. Inc/Cyc: 1, Register Restrictions: 0-3
Definition: Accumulates the number of flits in the TxQ. Generally, when data is transmitted across
Intel® QPI, it will bypass the TxQ and pass directly to the link. However, the TxQ will be used with
L0p and when LLR occurs, increasing latency to transfer out to the link. This can be used with the
cycles not empty event to track average occupancy, or the allocations event to track average lifetime in the TxQ.
110
Reference Number: 327043-001
Intel® Xeon® Processor E5-2600 Product Family Uncore Performance Monitoring
VNA_CREDIT_RETURNS
•
•
•
•
•
•
Title: VNA Credits Returned
Category: VNA_CREDIT_RETURN Events
Event Code: 0x1C
Extra Select Bit: Y
Max. Inc/Cyc: 1, Register Restrictions: 0-3
Definition: Number of VNA credits returned.
VNA_CREDIT_RETURN_OCCUPANCY
•
•
•
•
•
•
Title: VNA Credits Pending Return - Occupancy
Category: VNA_CREDIT_RETURN Events
Event Code: 0x1B
Extra Select Bit: Y
Max. Inc/Cyc: 128, Register Restrictions: 0-3
Definition: Number of VNA credits in the Rx side that are waitng to be returned back across the
link.
2.8
R2PCIe Performance Monitoring
2.8.1
Overview of the R2PCIe Box
R2PCIe represents the interface between the Ring and IIO traffic to/from PCIe.
2.8.2
R2PCIe Performance Monitoring Overview
The R2PCIe Box supports event monitoring through four 44b wide counters (R2_PCI_PMON_CTR/
CTL{3:0}). Each of these four counters can be programmed to count almost any R2PCIe event (see
NOTE for exceptions). the R2PCIe counters can increment by a maximum of 5b per cycle (???).
For information on how to setup a monitoring session, refer to Section 2.1, “Uncore Per-Socket
Performance Monitoring Control”.
Note:
Only counter 0 can be used for tracking occupancy events.
used for ring utilization events.
Reference Number: 327043-001
Only counters 2&3 can be
111
Intel® Xeon® Processor E5-2600 Product Family Uncore Performance Monitoring
2.8.3
R2PCIe Performance Monitors
Table 2-104. R2PCIe Performance Monitoring Registers
PCICFG
Address
Register Name
PCICFG Base Address
Size
(bits)
Description
Dev:Func
R2PCIe PMON Registers
D19:F1
Box-Level Control/Status
R2_PCI_PMON_BOX_CTL
F4
32
R2PCIe PMON Box-Wide Control
Generic Counter Control
R2_PCI_PMON_CTL3
E4
32
R2PCIe PMON Control for Counter 3
R2_PCI_PMON_CTL2
E0
32
R2PCIe PMON Control for Counter 2
R2_PCI_PMON_CTL1
DC
32
R2PCIe PMON Control for Counter 1
R2_PCI_PMON_CTL0
D8
32
R2PCIe PMON Control for Counter 0
32x2
R2PCIe PMON Counter 3
Generic Counters
R2_PCI_PMON_CTR3
2.8.3.1
BC+B8
R2_PCI_PMON_CTR2
B4+B0
32x2
R2PCIe PMON Counter 2
R2_PCI_PMON_CTR1
AC+A8
32x2
R2PCIe PMON Counter 1
R2_PCI_PMON_CTR0
A4+A0
32x2
R2PCIe PMON Counter 0
R2PCIe Box Level PMON State
The following registers represent the state governing all box-level PMUs in the R2PCIe Box.
In the case of the R2PCIe, the R2_PCI_PMON_BOX_CTL register governs what happens when a
freeze signal is received (.frz_en). It also provides the ability to manually freeze the counters in the
box (.frz) and reset the generic state (.rst_ctrs and .rst_ctrl).
Table 2-105. R2_PCI_PMON_BOX_CTL Register – Field Definitions
Field
rsv
Bits
Attr
31:18
RV
HW
Reset
Val
0
Description
Reserved (?)
rsv
17
RV
0
Reserved; SW must write to 0 else behavior is undefined.
frz_en
16
WO
0
Freeze Enable.
If set to 1 and a freeze signal is received, the counters will be
stopped or ‘frozen’, else the freeze signal will be ignored.
112
rsv
15:9
RV
0
Reserved (?)
frz
8
WO
0
Freeze.
If set to 1 and the .frz_en is 1, the counters in this box will be
frozen.
rsv
7:2
RV
0
Reserved (?)
rst_ctrs
1
WO
0
Reset Counters.
When set to 1, the Counter Registers will be reset to 0.
rst_ctrl
0
WO
0
Reset Control.
When set to 1, the Counter Control Registers will be reset to 0.
Reference Number: 327043-001
Intel® Xeon® Processor E5-2600 Product Family Uncore Performance Monitoring
2.8.3.2
R2PCIe PMON state - Counter/Control Pairs
The following table defines the layout of the R2PCIe performance monitor control registers. The main
task of these configuration registers is to select the event to be monitored by their respective data
counter (.ev_sel, .umask). Additional control bits are provided to shape the incoming events (e.g.
.invert, .edge_det, .thresh) as well as provide additional functionality for monitoring software (.rst).
Table 2-106. R2_PCI_PMON_CTL{3-0} Register – Field Definitions
Field
thresh
invert
HW
Reset
Val
Description
RW-V
0
Threshold used in counter comparison.
RW-V
0
Invert comparison against Threshold.
Bits
Attr
31:24
23
0 - comparison will be ‘is event increment >= threshold?’.
1 - comparison is inverted - ‘is event increment < threshold?’
NOTE: .invert is in series following .thresh, Due to this, the
.thresh field must be set to a non-0 value. For events that
increment by no more than 1 per cycle, set .thresh to 0x1.
Also, if .edge_det is set to 1, the counter will increment when a 1
to 0 transition (i.e. falling edge) is detected.
en
22
RW-V
0
Local Counter Enable.
rsv
21:20
RV
0
Reserved. SW must write to 0 for proper operation.
rsv
19
RV
0
Reserved (?)
edge_det
18
RW-V
0
When set to 1, rather than measuring the event in each cycle it
is active, the corresponding counter will increment when a 0 to 1
transition (i.e. rising edge) is detected.
When 0, the counter will increment in each cycle that the event
is asserted.
NOTE: .edge_det is in series following .thresh, Due to this, the
.thresh field must be set to a non-0 value. For events that
increment by no more than 1 per cycle, set .thresh to 0x1.
rst
17
WO
0
When set to 1, the corresponding counter will be cleared to 0.
rsv
16
RV
0
Reserved. SW must write to 0 else behavior is undefined.
umask
15:8
RW-V
0
Select subevents to be counted within the selected event.
ev_sel
7:0
RW-V
0
Select event to be counted.
The R2PCIe performance monitor data registers are 44-bit wide. Should a counter overflow (a carry
out from bit 43), the counter will wrap and continue to collect events.
If accessible, software can continuously read the data registers without disabling event collection.
Table 2-107. R2_PCI_PMON_CTR{3-0} Register – Field Definitions
Field
rsv
event_count
Reference Number: 327043-001
Bits
Attr
HW
Reset
Val
Description
63:44
RV
0
Reserved (?)
43:0
RW-V
0
44-bit performance event counter
113
Intel® Xeon® Processor E5-2600 Product Family Uncore Performance Monitoring
2.8.4
R2PCIe Performance Monitoring Events
2.8.4.1
An Overview
R2PCIe provides events to track information related to all the traffic passing through it’s boundaries.
• IIO credit tracking - credits rejected, acquired and used all broken down by message Class.
• Ring Stop Events
To track Ingress/Egress Traffic and Ring Utilization (broken down by direction and ring type)
statistics.
2.8.5
R2PCIe Box Events Ordered By Code
The following table summarizes the directly measured R2PCIe Box events.
Table 2-108. Performance Monitor Events for R2PCIe
Symbol Name
Event
Code
Ctrs
Max
Inc/
Cyc
0x1
0-3
1
CLOCKTICKS
2.8.6
Description
Number of uclks in domain
RING_AD_USED
0x07
0-3
1
R2 AD Ring in Use
RING_AK_USED
0x08
0-3
1
R2 AK Ring in Use
RING_BL_USED
0x09
0-3
1
R2 BL Ring in Use
RING_IV_USED
0x0A
0-3
1
R2 IV Ring in Use
RxR_CYCLES_NE
0x10
0-1
1
Ingress Cycles Not Empty
RxR_AK_BOUNCES
0x12
0
1
AK Ingress Bounced
TxR_CYCLES_NE
0x23
0
1
Egress Cycles Not Empty
TxR_INSERTS
0x24
0
1
Egress Allocations
TxR_CYCLES_FULL
0x25
0
1
Egress Cycles Full
R2PCIe Box Common Metrics (Derived Events)
The following table summarizes metrics commonly calculated from R2PCIe Box events.
Table 2-109. Metrics Derived from R2PCIe Events (Sheet 1 of 2)
Symbol Name:
Definition
114
Equation
CYC_USED_DNEVEN:
Cycles Used in the Down direction, Even
polarity
RING_BL_USED.CCW_EVEN / SAMPLE_INTERVAL
CYC_USED_DNODD:
Cycles Used in the Down direction, Odd
polarity
RING_BL_USED.CCW_ODD / SAMPLE_INTERVAL
CYC_USED_UPEVEN:
Cycles Used in the Up direction, Even
polarity
RING_BL_USED.CW_EVEN / SAMPLE_INTERVAL
CYC_USED_UPODD:
Cycles Used in the Up direction, Odd
polarity
RING_BL_USED.CW_ODD / SAMPLE_INTERVAL
Reference Number: 327043-001
Intel® Xeon® Processor E5-2600 Product Family Uncore Performance Monitoring
Table 2-109. Metrics Derived from R2PCIe Events (Sheet 2 of 2)
Symbol Name:
Definition
2.8.7
Equation
IIO_RDS_TO_RING_IN_BYTES:
IIO Reads, data transmitted to Ring in
Bytes
TxR_INSERTS.BL * 32
RING_THRU_DNEVEN_BYTES:
Ring throughput in the Down direction,
Even polarity in Bytes
RING_BL_USED.CCW_EVEN * 32
RING_THRU_DNODD_BYTES:
Ring throughput in the Down direction, Odd
polarity in Bytes
RING_BL_USED.CCW_ODD * 32
RING_THRU_UPEVEN_BYTES:
Ring throughput in the Up direction, Even
polarity in Bytes
RING_BL_USED.CW_EVEN * 32
RING_THRU_UPODD_BYTES:
Ring throughput in the Up direction, Odd
polarity in Bytes
RING_BL_USED.CW_ODD * 32
R2PCIe Box Performance Monitor Event List
The section enumerates the performance monitoring events for the R2PCIe Box.
CLOCKTICKS
•
•
•
•
•
Title: Number of uclks in domain
Category: UCLK Events
Event Code: 0x1
Max. Inc/Cyc: 1, Register Restrictions: 0-3
Definition: Counts the number of uclks in the R2PCIe uclk domain. This could be slightly different
than the count in the Ubox because of enable/freeze delays. However, because the R2PCIe is close
to the Ubox, they generally should not diverge by more than a handful of cycles.
RING_AD_USED
•
•
•
•
•
Title: R2 AD Ring in Use
Category: RING Events
Event Code: 0x07
Max. Inc/Cyc: 1, Register Restrictions: 0-3
Definition: Counts the number of cycles that the AD ring is being used at this ring stop. This
includes when packets are passing by and when packets are being sunk, but does not include when
packets are being sent from the ring stop.
Table 2-110. Unit Masks for RING_AD_USED
Extension
umask
[15:8]
Description
CW_EVEN
bxxxxxxx1
Clockwise and Even:
Filters for the Clockwise and Even ring polarity.
CW_ODD
bxxxxxx1x
Clockwise and Odd:
Filters for the Clockwise and Odd ring polarity.
CCW_EVEN
bxxxxx1xx
Counterclockwise and Even:
Filters for the Counterclockwise and Even ring polarity.
CCW_ODD
bxxxx1xxx
Counterclockwise and Odd:
Filters for the Counterclockwise and Odd ring polarity.
Reference Number: 327043-001
115
Intel® Xeon® Processor E5-2600 Product Family Uncore Performance Monitoring
RING_AK_USED
•
•
•
•
•
Title: R2 AK Ring in Use
Category: RING Events
Event Code: 0x08
Max. Inc/Cyc: 1, Register Restrictions: 0-3
Definition: Counts the number of cycles that the AK ring is being used at this ring stop. This
includes when packets are passing by and when packets are being sunk, but does not include when
packets are being sent from the ring stop.
Table 2-111. Unit Masks for RING_AK_USED
Extension
umask
[15:8]
Description
CW_EVEN
bxxxxxxx1
Clockwise and Even:
Filters for the Clockwise and Even ring polarity.
CW_ODD
bxxxxxx1x
Clockwise and Odd:
Filters for the Clockwise and Odd ring polarity.
CCW_EVEN
bxxxxx1xx
Counterclockwise and Even:
Filters for the Counterclockwise and Even ring polarity.
CCW_ODD
bxxxx1xxx
Counterclockwise and Odd:
Filters for the Counterclockwise and Odd ring polarity.
RING_BL_USED
•
•
•
•
•
Title: R2 BL Ring in Use
Category: RING Events
Event Code: 0x09
Max. Inc/Cyc: 1, Register Restrictions: 0-3
Definition: Counts the number of cycles that the BL ring is being used at this ring stop. This
includes when packets are passing by and when packets are being sunk, but does not include when
packets are being sent from the ring stop.
Table 2-112. Unit Masks for RING_BL_USED
Extension
umask
[15:8]
Description
CW_EVEN
bxxxxxxx1
Clockwise and Even:
Filters for the Clockwise and Even ring polarity.
CW_ODD
bxxxxxx1x
Clockwise and Odd:
Filters for the Clockwise and Odd ring polarity.
CCW_EVEN
bxxxxx1xx
Counterclockwise and Even:
Filters for the Counterclockwise and Even ring polarity.
CCW_ODD
bxxxx1xxx
Counterclockwise and Odd:
Filters for the Counterclockwise and Odd ring polarity.
RING_IV_USED
•
•
•
•
•
Title: R2 IV Ring in Use
Category: RING Events
Event Code: 0x0A
Max. Inc/Cyc: 1, Register Restrictions: 0-3
Definition: Counts the number of cycles that the IV ring is being used at this ring stop. This
includes when packets are passing by and when packets are being sunk, but does not include when
packets are being sunk into the ring stop. The IV ring is unidirectional. Whether UP or DN is used
is dependent on the system programming. Thereofore, one should generally set both the UP and
DN bits for a given polarity (or both) at a given time.
116
Reference Number: 327043-001
Intel® Xeon® Processor E5-2600 Product Family Uncore Performance Monitoring
Table 2-113. Unit Masks for RING_IV_USED
Extension
ANY
umask
[15:8]
b00001111
Description
Any:
Filters any polarity
RxR_AK_BOUNCES
•
•
•
•
•
Title: AK Ingress Bounced
Category: INGRESS Events
Event Code: 0x12
Max. Inc/Cyc: 1, Register Restrictions: 0
Definition: Counts the number of times when a request destined for the AK ingress bounced.
RxR_CYCLES_NE
•
•
•
•
•
Title: Ingress Cycles Not Empty
Category: INGRESS Events
Event Code: 0x10
Max. Inc/Cyc: 1, Register Restrictions: 0-1
Definition: Counts the number of cycles when the R2PCIe Ingress is not empty. This tracks one of
the three rings that are used by the R2PCIe agent. This can be used in conjunction with the R2PCIe
Ingress Occupancy Accumulator event in order to calculate average queue occupancy. Multiple
ingress buffers can be tracked at a given time using multiple counters.
Table 2-114. Unit Masks for RxR_CYCLES_NE
Extension
umask
[15:8]
Description
DRS
bxxxx1xxx
DRS:
DRS Ingress Queue
NCB
bxxx1xxxx
NCB:
NCB Ingress Queue
NCS
bxx1xxxxx
NCS:
NCS Ingress Queue
TxR_CYCLES_FULL
•
•
•
•
•
Title: Egress Cycles Full
Category: EGRESS Events
Event Code: 0x25
Max. Inc/Cyc: 1, Register Restrictions: 0
Definition: Counts the number of cycles when the R2PCIe Egress buffer is full.
Table 2-115. Unit Masks for TxR_CYCLES_FULL
Extension
umask
[15:8]
Description
AD
bxxxxxxx1
AD:
AD Egress Queue
AK
bxxxxxx1x
AK:
AK Egress Queue
BL
bxxxxx1xx
BL:
BL Egress Queue
Reference Number: 327043-001
117
Intel® Xeon® Processor E5-2600 Product Family Uncore Performance Monitoring
TxR_CYCLES_NE
•
•
•
•
•
Title: Egress Cycles Not Empty
Category: EGRESS Events
Event Code: 0x23
Max. Inc/Cyc: 1, Register Restrictions: 0
Definition: Counts the number of cycles when the R2PCIe Egress is not empty. This tracks one of
the three rings that are used by the R2PCIe agent. This can be used in conjunction with the R2PCIe
Egress Occupancy Accumulator event in order to calculate average queue occupancy. Only a single
Egress queue can be tracked at any given time. It is not possible to filter based on direction or
polarity.
Table 2-116. Unit Masks for TxR_CYCLES_NE
Extension
umask
[15:8]
Description
AD
bxxxxxxx1
AD:
AD Egress Queue
AK
bxxxxxx1x
AK:
AK Egress Queue
BL
bxxxxx1xx
BL:
BL Egress Queue
TxR_INSERTS
•
•
•
•
•
Title: Egress Allocations
Category: EGRESS Events
Event Code: 0x24
Max. Inc/Cyc: 1, Register Restrictions: 0
Definition: Counts the number of allocations into the R2PCIe Egress. This tracks one of the three
rings that are used by the R2PCIe agent. This can be used in conjunction with the R2PCIe Egress
Occupancy Accumulator event in order to calculate average queue latency. Only a single Egress
queue can be tracked at any given time. It is not possible to filter based on direction or polarity.
118
Reference Number: 327043-001
Intel® Xeon® Processor E5-2600 Product Family Uncore Performance Monitoring
2.9
R3QPI Performance Monitoring
2.9.1
Overview of the R3QPI Box
R3QPI is the interface between the Intel® QPI Link Layer, which packetizes requests, and the Ring.
R3QPI is the interface between the ring and the Intel® QPI Link Layer. It is responsible for
translating between ring prototcol packets and flits that are used for transmitting data across the
Intel® QPI interface. It performs credit checking between the local Intel® QPI LL, the remote Intel®
QPI LL and other agents onthe local ring.
The R3QPI agent provides several functions:
• Interface between Ring and Intel® QPI:
One of the primary attributes of the ring is its ability to convey Intel® QPI semantics with no
translation. For example, this architecture enables initiators to communicate with a local Home
agent in exactly the same way as a remote Home agent on another socket. With this philosophy,
the R3QPI block is lean and does very little with regards to the Intel® QPI protocol aside from
mirror the request between the ring and the Intel® QPI interface.
• Intel® QPI routing:
In order to optimize layout and latency, both full width Intel® QPI interfaces share the same ring
stop. Therefore, a Intel® QPI packet might be received on one interrface and simply forwarded
along on the other Intel® QPI interface. The R3QPI has sufficient routing logic to determine if a
request, snoop or response is targeting the local socket or if it should be forwarded along to the
other interface. This routing remains isolated to R3QPI and does not impede traffic on the Ring.
• Intel® QPI Home Snoop Protocol (with early snoop optimizations for DP):
The R3QPI agent implements a latency-reducing optimization for dual sockets which issues
snoops within the socket for incoming requests as well as a latency-reducing optimzation to
return data satisfying Direct2Core (D2C) requests.
2.9.2
R3QPI Performance Monitoring Overview
Each R3QPI Link in the uncore supports event monitoring through three 44b wide counters
(R3_Ly_PCI_PMON_CTR/CTL{2:0}). Each of these three counters can be programmed to count
almost any R3QPI event (see NOTE for exceptions). the R3QPI counters can increment by a maximum
of 5b per cycle (???).
For information on how to setup a monitoring session, refer to Section 2.1, “Uncore Per-Socket
Performance Monitoring Control”.
Note:
Only counter 0 can be used for tracking occupancy events. Only counter 2 can be used
to count ring events.
Reference Number: 327043-001
119
Intel® Xeon® Processor E5-2600 Product Family Uncore Performance Monitoring
2.9.3
R3QPI Performance Monitors
Table 2-118. R3QPI Performance Monitoring Registers
PCICFG
Address
Register Name
PCICFG Base Address
Size
(bits)
Description
Dev:Func
R3QPI Link 0 PMON Registers
D19:F5
R3QPI Link 1 PMON Registers
D19:F6
Box-Level Control/Status
R3_Ly_PCI_PMON_BOX_CTL
F4
32
R3QPI Link y PMON Box-Wide Control
Generic Counter Control
R3_Ly_PCI_PMON_CTL2
E0
32
R3QPI Link y PMON Control for Counter 2
R3_Ly_PCI_PMON_CTL1
DC
32
R3QPI Link y PMON Control for Counter 1
R3_Ly_PCI_PMON_CTL0
D8
32
R3QPI Link y PMON Control for Counter 0
32x2
R3QPI Link y PMON Counter 2
Generic Counters
2.9.3.1
R3_Ly_PCI_PMON_CTR2
B4+B0
R3_Ly_PCI_PMON_CTR1
AC+A8
32x2
R3QPI Link y PMON Counter 1
R3_Ly_PCI_PMON_CTR0
A4+A0
32x2
R3QPI Link y PMON Counter 0
R3QPI Box Level PMON State
The following registers represent the state governing all box-level PMUs for each Link of the R3QPI
Box.
In the case of the R3QPI Links, the R3_Ly_PCI_PMON_BOX_CTL register governs what happens when
a freeze signal is received (.frz_en). It also provides the ability to manually freeze the counters in the
box (.frz) and reset the generic state (.rst_ctrs and .rst_ctrl).
Table 2-119. R3_Ly_PCI_PMON_BOX_CTL Register – Field Definitions
Field
Bits
Attr
HW
Reset
Val
Description
rsv
31:18
RV
0
Reserved (?)
rsv
17
RV
0
Reserved; SW must write to 0 else behavior is undefined.
frz_en
16
WO
0
Freeze Enable.
If set to 1 and a freeze signal is received, the counters will be
stopped or ‘frozen’, else the freeze signal will be ignored.
rsv
15:9
RV
0
Reserved (?)
frz
8
WO
0
Freeze.
If set to 1 and the .frz_en is 1, the counters in this box will be
frozen.
rsv
7:2
RV
0
Reserved (?)
rst_ctrs
1
WO
0
Reset Counters.
When set to 1, the Counter Registers will be reset to 0.
rst_ctrl
0
WO
0
Reset Control.
When set to 1, the Counter Control Registers will be reset to 0.
U
120
Reference Number: 327043-001
Intel® Xeon® Processor E5-2600 Product Family Uncore Performance Monitoring
2.9.3.2
R3QPI PMON state - Counter/Control Pairs
The following table defines the layout of the R3QPI performance monitor control registers. The main
task of these configuration registers is to select the event to be monitored by their respective data
counter (.ev_sel, .umask). Additional control bits are provided to shape the incoming events (e.g.
.invert, .edge_det, .thresh) as well as provide additional functionality for monitoring software (.rst).
Table 2-120. R3_Ly_PCI_PMON_CTL{2-0} Register – Field Definitions
Field
thresh
invert
HW
Reset
Val
Description
RW-V
0
Threshold used in counter comparison.
RW-V
0
Invert comparison against Threshold.
Bits
Attr
31:24
23
0 - comparison will be ‘is event increment >= threshold?’.
1 - comparison is inverted - ‘is event increment < threshold?’
NOTE: .invert is in series following .thresh, Due to this, the
.thresh field must be set to a non-0 value. For events that
increment by no more than 1 per cycle, set .thresh to 0x1.
Also, if .edge_det is set to 1, the counter will increment when a 1
to 0 transition (i.e. falling edge) is detected.
en
22
RW-V
0
Local Counter Enable.
rsv
21:20
RV
0
Reserved. SW must write to 0 for proper operation.
rsv
19
RV
0
Reserved (?)
edge_det
18
RW-V
0
When set to 1, rather than measuring the event in each cycle it
is active, the corresponding counter will increment when a 0 to 1
transition (i.e. rising edge) is detected.
When 0, the counter will increment in each cycle that the event
is asserted.
NOTE: .edge_det is in series following .thresh, Due to this, the
.thresh field must be set to a non-0 value. For events that
increment by no more than 1 per cycle, set .thresh to 0x1.
rst
17
WO
0
When set to 1, the corresponding counter will be cleared to 0.
rsv
16
RV
0
Reserved. SW must write to 0 else behavior is undefined.
umask
15:8
RW-V
0
Select subevents to be counted within the selected event.
ev_sel
7:0
RW-V
0
Select event to be counted.
The R3QPI performance monitor data registers are 44b wide. Should a counter overflow (a carry out
from bit 43), the counter will wrap and continue to collect events.
If accessible, software can continuously read the data registers without disabling event collection.
Table 2-121. R3_Ly_PCI_PMON_CTR{2-0} Register – Field Definitions
Field
rsv
event_count
Reference Number: 327043-001
Bits
Attr
HW
Reset
Val
Description
63:44
RV
0
Reserved (?)
43:0
RW-V
0
44-bit performance event counter
121
Intel® Xeon® Processor E5-2600 Product Family Uncore Performance Monitoring
2.9.4
R3QPI Performance Monitoring Events
2.9.4.1
An Overview
R3QPI provides events to track information related to all the traffic passing through it’s boundaries.
• VN/IIO credit tracking - in addition to tracking the occupancy of the full VNA queue, R3QPI
provides a great deal of additional information: credits rejected, acquired and used often broken
down by Message Class.
• Ring Stop Events
To track Ingress/Egress Traffic and Ring Utilization (broken down by direction and ring type)
statistics.
2.9.5
R3QPI Box Events Ordered By Code
The following table summarizes the directly measured R3QPI Box events.
Table 2-122. Performance Monitor Events for R3QPI
Symbol Name
CLOCKTICKS
122
Event
Code
Ctrs
Max
Inc/
Cyc
Description
0x1
0-2
RING_AD_USED
0x07
0-2
Number of uclks in domain
RING_AK_USED
0x08
0-2
1
R3 AK Ring in Use
RING_BL_USED
0x09
0-2
1
R3 BL Ring in Use
RING_IV_USED
0x0A
0-2
1
R3 IV Ring in Use
RxR_CYCLES_NE
0x10
0-1
1
Ingress Cycles Not Empty
1
R3 AD Ring in Use
RxR_INSERTS
0x11
0-1
1
Ingress Allocations
RxR_BYPASSED
0x12
0-1
1
Ingress Bypassed
RxR_OCCUPANCY
0x13
0
32
IIO_CREDITS_ACQUIRED
0x20
0-1
1
to IIO BL Credit Acquired
Ingress Occupancy Accumulator
IIO_CREDITS_REJECT
0x21
0-1
1
to IIO BL Credit Rejected
IIO_CREDITS_USED
0x22
0-1
1
to IIO BL Credit In Use
TxR_CYCLES_NE
0x23
0-1
1
Egress Cycles Not Empty
TxR_INSERTS
0x24
0-1
1
Egress Allocations
TxR_CYCLES_FULL
0x25
0-1
1
Egress Cycles Full
TxR_NACK
0x26
0-1
1
Egress NACK
VNA_CREDIT_CYCLES_OUT
0x31
0-1
1
Cycles with no VNA credits available
VNA_CREDIT_CYCLES_USED
0x32
0-1
1
Cycles with 1 or more VNA credits in use
VNA_CREDITS_ACQUIRED
0x33
0-1
4
VNA credit Acquisitions
VNA_CREDITS_REJECT
0x34
0-1
1
VNA Credit Reject
VN0_CREDITS_USED
0x36
0-1
1
VN0 Credit Used
VN0_CREDITS_REJECT
0x37
0-1
1
VN0 Credit Acquisition Failed on DRS
Reference Number: 327043-001
Intel® Xeon® Processor E5-2600 Product Family Uncore Performance Monitoring
2.9.6
R3QPI Box Common Metrics (Derived Events)
The following table summarizes metrics commonly calculated from R3QPI Box events.
Table 2-123. Metrics Derived from R3QPI Events
Symbol Name:
Definition
Equation
QPI_RDS_TO_RING_IN_BYTES:
QPI Reads, data transmitted to Ring in
Bytes
2.9.7
TxR_INSERTS.BL * 32
R3QPI Box Performance Monitor Event List
The section enumerates the performance monitoring events for the R3QPI Box.
CLOCKTICKS
•
•
•
•
•
Title: Number of uclks in domain
Category: UCLK Events
Event Code: 0x1
Max. Inc/Cyc: , Register Restrictions: 0-2
Definition: Counts the number of uclks in the Intel® QPI uclk domain. This could be slightly different than the count in the Ubox because of enable/freeze delays. However, because the Intel®
QPI Agent is close to the Ubox, they generally should not diverge by more than a handful of cycles.
IIO_CREDITS_ACQUIRED
•
•
•
•
•
Title: to IIO BL Credit Acquired
Category: IIO_CREDITS Events
Event Code: 0x20
Max. Inc/Cyc: 1, Register Restrictions: 0-1
Definition: Counts the number of times the NCS/NCB/DRS credit is acquried in the Intel® QPI for
sending messages on BL to the IIO. There is one credit for each of these three message classes
(three credits total). NCS is used for reads to PCIe space, NCB is used for transfering data without
coherency, and DRS is used for transfering data with coherency (cachable PCI transactions). This
event can only track one message class at a time.
Table 2-124. Unit Masks for IIO_CREDITS_ACQUIRED
Extension
umask
[15:8]
DRS
bxxxx1xxx
NCB
bxxx1xxxx
NCS
bxx1xxxxx
Description
IIO_CREDITS_REJECT
•
•
•
•
•
Title: to IIO BL Credit Rejected
Category: IIO_CREDITS Events
Event Code: 0x21
Max. Inc/Cyc: 1, Register Restrictions: 0-1
Definition: Counts the number of times that a request attempted to acquire an NCS/NCB/DRS
credit in the Intel® QPI for sending messages on BL to the IIO but was rejected because no credit
was available. There is one credit for each of these three message classes (three credits total).
NCS is used for reads to PCIe space, NCB is used for transfering data without coherency, and DRS is
Reference Number: 327043-001
123
Intel® Xeon® Processor E5-2600 Product Family Uncore Performance Monitoring
used for transfering data with coherency (cachable PCI transactions). This event can only track one
message class at a time.
Table 2-125. Unit Masks for IIO_CREDITS_REJECT
Extension
umask
[15:8]
DRS
bxxxx1xxx
NCB
bxxx1xxxx
NCS
bxx1xxxxx
Description
IIO_CREDITS_USED
•
•
•
•
•
Title: to IIO BL Credit In Use
Category: IIO_CREDITS Events
Event Code: 0x22
Max. Inc/Cyc: 1, Register Restrictions: 0-1
Definition: Counts the number of cycles when the NCS/NCB/DRS credit is in use in the Intel® QPI
for sending messages on BL to the IIO. There is one credit for each of these three message classes
(three credits total). NCS is used for reads to PCIe space, NCB is used for transfering data without
coherency, and DRS is used for transfering data with coherency (cachable PCI transactions). This
event can only track one message class at a time.
Table 2-126. Unit Masks for IIO_CREDITS_USED
Extension
umask
[15:8]
DRS
bxxxx1xxx
NCB
bxxx1xxxx
NCS
bxx1xxxxx
Description
RING_AD_USED
•
•
•
•
•
Title: R3 AD Ring in Use
Category: RING Events
Event Code: 0x07
Max. Inc/Cyc: 1, Register Restrictions: 0-2
Definition: Counts the number of cycles that the AD ring is being used at this ring stop. This
includes when packets are passing by and when packets are being sunk, but does not include when
packets are being sent from the ring stop.
Table 2-127. Unit Masks for RING_AD_USED
Extension
124
umask
[15:8]
Description
CW_EVEN
bxxxxxxx1
Clockwise and Even:
Filters for the Clockwise and Even ring polarity.
CW_ODD
bxxxxxx1x
Clockwise and Odd:
Filters for the Clockwise and Odd ring polarity.
CCW_EVEN
bxxxxx1xx
Counterclockwise and Even:
Filters for the Counterclockwise and Even ring polarity.
CCW_ODD
bxxxx1xxx
Counterclockwise and Odd:
Counts the number of cycles that the AK ring is being used at this
ring stop. This includes when packets are passing by and when
packets are being sunk, but does not include when packets are being
sent from the ring stop.
Reference Number: 327043-001
Intel® Xeon® Processor E5-2600 Product Family Uncore Performance Monitoring
RING_AK_USED
•
•
•
•
•
Title: R3 AK Ring in Use
Category: RING Events
Event Code: 0x08
Max. Inc/Cyc: 1, Register Restrictions: 0-2
Definition: Counts the number of cycles that the AK ring is being used at this ring stop. This
includes when packets are passing by and when packets are being sent, but does not include when
packets are being sunk into the ring stop.
Table 2-128. Unit Masks for RING_AK_USED
Extension
umask
[15:8]
Description
CW_EVEN
bxxxxxxx1
Clockwise and Even:
Filters for the Clockwise and Even ring polarity.
CW_ODD
bxxxxxx1x
Clockwise and Odd:
Filters for the Clockwise and Odd ring polarity.
CCW_EVEN
bxxxxx1xx
Counterclockwise and Even:
Filters for the Counterclockwise and Even ring polarity.
CCW_ODD
bxxxx1xxx
Counterclockwise and Odd:
Filters for the Counterclockwise and Odd ring polarity.
RING_BL_USED
•
•
•
•
•
Title: R3 BL Ring in Use
Category: RING Events
Event Code: 0x09
Max. Inc/Cyc: 1, Register Restrictions: 0-2
Definition: Counts the number of cycles that the BL ring is being used at this ring stop. This
includes when packets are passing by and when packets are being sunk, but does not include when
packets are being sent from the ring stop.
Table 2-129. Unit Masks for RING_BL_USED
Extension
umask
[15:8]
Description
CW_EVEN
bxxxxxxx1
Clockwise and Even:
Filters for the Clockwise and Even ring polarity.
CW_ODD
bxxxxxx1x
Clockwise and Odd:
Filters for the Clockwise and Odd ring polarity.
CCW_EVEN
bxxxxx1xx
Counterclockwise and Even:
Filters for the Counterclockwise and Even ring polarity.
CCW_ODD
bxxxx1xxx
Counterclockwise and Odd:
Filters for the Counterclockwise and Odd ring polarity.
RING_IV_USED
•
•
•
•
•
Title: R3 IV Ring in Use
Category: RING Events
Event Code: 0x0A
Max. Inc/Cyc: 1, Register Restrictions: 0-2
Definition: Counts the number of cycles that the IV ring is being used at this ring stop. This
includes when packets are passing by and when packets are being sent, but does not include when
packets are being sunk into the ring stop. The IV ring is unidirectional. Whether UP or DN is used
is dependent on the system programming. Thereofore, one should generally set both the UP and
DN bits for a given polarity (or both) at a given time.
Reference Number: 327043-001
125
Intel® Xeon® Processor E5-2600 Product Family Uncore Performance Monitoring
Table 2-130. Unit Masks for RING_IV_USED
Extension
ANY
umask
[15:8]
b00001111
Description
Any:
Filters any polarity
RxR_BYPASSED
•
•
•
•
•
Title: Ingress Bypassed
Category: INGRESS Events
Event Code: 0x12
Max. Inc/Cyc: 1, Register Restrictions: 0-1
Definition: Counts the number of times when the Ingress was bypassed and an incoming transaction was bypassed directly across the BGF and into the qfclk domain.
Table 2-131. Unit Masks for RxR_BYPASSED
Extension
AD
umask
[15:8]
Description
bxxxxxxx1
RxR_CYCLES_NE
•
•
•
•
•
Title: Ingress Cycles Not Empty
Category: INGRESS Events
Event Code: 0x10
Max. Inc/Cyc: 1, Register Restrictions: 0-1
Definition: Counts the number of cycles when the Intel® QPI Ingress is not empty. This tracks
one of the three rings that are used by the Intel® QPI agent. This can be used in conjunction with
the Intel® QPI Ingress Occupancy Accumulator event in order to calculate average queue occupancy. Multiple ingress buffers can be tracked at a given time using multiple counters.
Table 2-132. Unit Masks for RxR_CYCLES_NE
Extension
umask
[15:8]
Description
HOM
bxxxxxxx1
HOM:
HOM Ingress Queue
SNP
bxxxxxx1x
SNP:
SNP Ingress Queue
NDR
bxxxxx1xx
NDR:
NDR Ingress Queue
DRS
bxxxx1xxx
DRS:
DRS Ingress Queue
NCB
bxxx1xxxx
NCB:
NCB Ingress Queue
NCS
bxx1xxxxx
NCS:
NCS Ingress Queue
RxR_INSERTS
•
•
•
•
Title: Ingress Allocations
Category: INGRESS Events
Event Code: 0x11
Max. Inc/Cyc: 1, Register Restrictions: 0-1
126
Reference Number: 327043-001
Intel® Xeon® Processor E5-2600 Product Family Uncore Performance Monitoring
• Definition: Counts the number of allocations into the Intel® QPI Ingress. This tracks one of the
three rings that are used by the Intel® QPI agent. This can be used in conjunction with the Intel®
QPI Ingress Occupancy Accumulator event in order to calculate average queue latency. Multiple
ingress buffers can be tracked at a given time using multiple counters.
Table 2-133. Unit Masks for RxR_INSERTS
Extension
umask
[15:8]
Description
HOM
bxxxxxxx1
HOM:
HOM Ingress Queue
SNP
bxxxxxx1x
SNP:
SNP Ingress Queue
NDR
bxxxxx1xx
NDR:
NDR Ingress Queue
DRS
bxxxx1xxx
DRS:
DRS Ingress Queue
NCB
bxxx1xxxx
NCB:
NCB Ingress Queue
NCS
bxx1xxxxx
NCS:
NCS Ingress Queue
RxR_OCCUPANCY
•
•
•
•
•
Title: Ingress Occupancy Accumulator
Category: INGRESS Events
Event Code: 0x13
Max. Inc/Cyc: 32, Register Restrictions: 0
Definition: Accumulates the occupancy of a given Intel® QPI Ingress queue in each cycles. This
tracks one of the three ring Ingress buffers. This can be used with the Intel® QPI Ingress Not
Empty event to calculate average occupancy or the Intel® QPI Ingress Allocations event in order to
calculate average queuing latency.
Table 2-134. Unit Masks for RxR_OCCUPANCY
Extension
umask
[15:8]
Description
HOM
bxxxxxxx1
HOM:
HOM Ingress Queue
SNP
bxxxxxx1x
SNP:
SNP Ingress Queue
NDR
bxxxxx1xx
NDR:
NDR Ingress Queue
DRS
bxxxx1xxx
DRS:
DRS Ingress Queue
NCB
bxxx1xxxx
NCB:
NCB Ingress Queue
NCS
bxx1xxxxx
NCS:
NCS Ingress Queue
TxR_CYCLES_FULL
•
•
•
•
•
Title: Egress Cycles Full
Category: EGRESS Events
Event Code: 0x25
Max. Inc/Cyc: 1, Register Restrictions: 0-1
Definition: Counts the number of cycles when the R2PCIe Egress buffer is full.
Reference Number: 327043-001
127
Intel® Xeon® Processor E5-2600 Product Family Uncore Performance Monitoring
TxR_CYCLES_NE
•
•
•
•
•
Title: Egress Cycles Not Empty
Category: EGRESS Events
Event Code: 0x23
Max. Inc/Cyc: 1, Register Restrictions: 0-1
Definition: Counts the number of cycles when the Intel® QPI Egress is not empty. This tracks one
of the three rings that are used by the Intel® QPI agent. This can be used in conjunction with the
Intel® QPI Egress Occupancy Accumulator event in order to calculate average queue occupancy.
Only a single Egress queue can be tracked at any given time. It is not possible to filter based on
direction or polarity.
TxR_INSERTS
•
•
•
•
•
Title: Egress Allocations
Category: EGRESS Events
Event Code: 0x24
Max. Inc/Cyc: 1, Register Restrictions: 0-1
Definition: Counts the number of allocations into the Intel® QPI Egress. This tracks one of the
three rings that are used by the Intel® QPI agent. This can be used in conjunction with the Intel®
QPI Egress Occupancy Accumulator event in order to calculate average queue latency. Only a single
Egress queue can be tracked at any given time. It is not possible to filter based on direction or
polarity.
TxR_NACK
•
•
•
•
•
Title: Egress NACK
Category: EGRESS Events
Event Code: 0x26
Max. Inc/Cyc: 1, Register Restrictions: 0-1
Definition:
VN0_CREDITS_REJECT
•
•
•
•
•
Title: VN0 Credit Acquisition Failed on DRS
Category: LINK_VN0_CREDITS Events
Event Code: 0x37
Max. Inc/Cyc: 1, Register Restrictions: 0-1
Definition: Number of times a request failed to acquire a DRS VN0 credit. In order for a request to
be transferred across Intel® QPI, it must be guaranteed to have a flit buffer on the remote socket
to sink into. There are two credit pools, VNA and VN0. VNA is a shared pool used to achieve high
performance. The VN0 pool has reserved entries for each message class and is used to prevent
deadlock. Requests first attempt to acquire a VNA credit, and then fall back to VN0 if they fail. This
therefore counts the number of times when a request failed to acquire either a VNA or VN0 credit
and is delayed. This should generally be a rare situation.
Table 2-139. Unit Masks for VN0_CREDITS_REJECT (Sheet 1 of 2)
Extension
128
umask
[15:8]
Description
HOM
bxxxxxxx1
HOM Message Class:
Filter for the Home (HOM) message class. HOM is generally used to
send requests, request responses, and snoop responses.
SNP
bxxxxxx1x
SNP Message Class:
Filter for Snoop (SNP) message class. SNP is used for outgoing
snoops. Note that snoop responses flow on the HOM message class.
Reference Number: 327043-001
Intel® Xeon® Processor E5-2600 Product Family Uncore Performance Monitoring
Table 2-139. Unit Masks for VN0_CREDITS_REJECT (Sheet 2 of 2)
Extension
umask
[15:8]
Description
NDR
bxxxxx1xx
NDR Message Class:
NDR packets are used to transmit a variety of protocol flits including
grants and completions (CMP).
DRS
bxxxx1xxx
DRS Message Class:
Filter for Data Response (DRS). DRS is generally used to transmit
data with coherency. For example, remote reads and writes, or
cache to cache transfers will transmit their data using DRS.
NCB
bxxx1xxxx
NCB Message Class:
Filter for Non-Coherent Broadcast (NCB). NCB is generally used to
transmit data without coherency. For example, non-coherent read
data returns.
NCS
bxx1xxxxx
NCS Message Class:
Filter for Non-Coherent Standard (NCS). NCS is commonly used for
Ö
VN0_CREDITS_USED
•
•
•
•
•
Title: VN0 Credit Used
Category: LINK_VN0_CREDITS Events
Event Code: 0x36
Max. Inc/Cyc: 1, Register Restrictions: 0-1
Definition: Number of times a VN0 credit was used on the DRS message channel. In order for a
request to be transferred across Intel® QPI, it must be guaranteed to have a flit buffer on the
remote socket to sink into. There are two credit pools, VNA and VN0. VNA is a shared pool used to
achieve high performance. The VN0 pool has reserved entries for each message class and is used
to prevent deadlock. Requests first attempt to acquire a VNA credit, and then fall back to VN0 if
they fail. This counts the number of times a VN0 credit was used. Note that a single VN0 credit
holds access to potentially multiple flit buffers. For example, a transfer that uses VNA could use 9
flit buffers and in that case uses 9 credits. A transfer on VN0 will only count a single credit even
though it may use multiple buffers.
Table 2-140. Unit Masks for VN0_CREDITS_USED
Extension
umask
[15:8]
Description
HOM
bxxxxxxx1
HOM Message Class:
Filter for the Home (HOM) message class. HOM is generally used to
send requests, request responses, and snoop responses.
SNP
bxxxxxx1x
SNP Message Class:
Filter for Snoop (SNP) message class. SNP is used for outgoing
snoops. Note that snoop responses flow on the HOM message class.
NDR
bxxxxx1xx
NDR Message Class:
NDR packets are used to transmit a variety of protocol flits including
grants and completions (CMP).
DRS
bxxxx1xxx
DRS Message Class:
Filter for Data Response (DRS). DRS is generally used to transmit
data with coherency. For example, remote reads and writes, or
cache to cache transfers will transmit their data using DRS.
NCB
bxxx1xxxx
NCB Message Class:
Filter for Non-Coherent Broadcast (NCB). NCB is generally used to
transmit data without coherency. For example, non-coherent read
data returns.
NCS
bxx1xxxxx
NCS Message Class:
Filter for Non-Coherent Standard (NCS). NCS is commonly used for
Ö
Reference Number: 327043-001
129
Intel® Xeon® Processor E5-2600 Product Family Uncore Performance Monitoring
VNA_CREDITS_ACQUIRED
•
•
•
•
•
Title: VNA credit Acquisitions
Category: LINK_VNA_CREDITS Events
Event Code: 0x33
Max. Inc/Cyc: 4, Register Restrictions: 0-1
Definition: Number of Intel® QPI VNA Credit acquisitions. This event can be used in conjunction
with the VNA In-Use Accumulator to calculate the average lifetime of a credit holder. VNA credits
are used by all message classes in order to communicate across Intel® QPI. If a packet is unable
to acquire credits, it will then attempt to use credts from the VN0 pool. Note that a single packet
may require multiple flit buffers (i.e. when data is being transfered). Therefore, this event will
increment by the number of credits acquired in each cycle. Filtering based on message class is not
provided. One can count the number of packets transfered in a given message class using an qfclk
event.
VNA_CREDITS_REJECT
•
•
•
•
•
Title: VNA Credit Reject
Category: LINK_VNA_CREDITS Events
Event Code: 0x34
Max. Inc/Cyc: 1, Register Restrictions: 0-1
Definition: Number of attempted VNA credit acquisitions that were rejected because the VNA
credit pool was full (or almost full). It is possible to filter this event by message class. Some packets use more than one flit buffer, and therefore must acquire multiple credits. Therefore, one could
get a reject even if the VNA credits were not fully used up. The VNA pool is generally used to provide the bulk of the Intel® QPI bandwidth (as opposed to the VN0 pool which is used to guarantee
forward progress). VNA credits can run out if the flit buffer on the receiving side starts to queue up
substantially. This can happen if the rest of the uncore is unable to drain the requests fast enough.
Table 2-141. Unit Masks for VNA_CREDITS_REJECT
Extension
umask
[15:8]
Description
HOM
bxxxxxxx1
HOM Message Class:
Filter for the Home (HOM) message class. HOM is generally used to
send requests, request responses, and snoop responses.
SNP
bxxxxxx1x
SNP Message Class:
Filter for Snoop (SNP) message class. SNP is used for outgoing
snoops. Note that snoop responses flow on the HOM message class.
NDR
bxxxxx1xx
NDR Message Class:
NDR packets are used to transmit a variety of protocol flits including
grants and completions (CMP).
DRS
bxxxx1xxx
DRS Message Class:
Filter for Data Response (DRS). DRS is generally used to transmit
data with coherency. For example, remote reads and writes, or
cache to cache transfers will transmit their data using DRS.
NCB
bxxx1xxxx
NCB Message Class:
Filter for Non-Coherent Broadcast (NCB). NCB is generally used to
transmit data without coherency. For example, non-coherent read
data returns.
NCS
bxx1xxxxx
NCS Message Class:
Filter for Non-Coherent Standard (NCS).
VNA_CREDIT_CYCLES_OUT
•
•
•
•
•
Title: Cycles with no VNA credits available
Category: LINK_VNA_CREDITS Events
Event Code: 0x31
Max. Inc/Cyc: 1, Register Restrictions: 0-1
Definition: Number of Intel® QPI uclk cycles when the transmitted has no VNA credits available
and therefore cannot send any requests on this channel. Note that this does not mean that no flits
130
Reference Number: 327043-001
Intel® Xeon® Processor E5-2600 Product Family Uncore Performance Monitoring
can be transmitted, as those holding VN0 credits will still (potentially) be able to transmit. Generally it is the goal of the uncore that VNA credits should not run out, as this can substantially throttle
back useful Intel® QPI bandwidth.
VNA_CREDIT_CYCLES_USED
•
•
•
•
•
Title: Cycles with 1 or more VNA credits in use
Category: LINK_VNA_CREDITS Events
Event Code: 0x32
Max. Inc/Cyc: 1, Register Restrictions: 0-1
Definition: Number of Intel® QPI uclk cycles with one or more VNA credits in use. This event can
be used in conjunction with the VNA In-Use Accumulator to calculate the average number of used
VNA credits.
2.10
Packet Matching Reference
In the Intel® QPI Link Layer, the performance monitoring infrastructure allows a user to filter packet
traffic according to certain fields. A couple common fields, the Message Class/Opcode fields, have
been summarized in the following tables.
Table 2-142. Intel® QuickPath Interconnect Packet Message Classes
Code
Name
Definition
b0000
HOM0
Home - Requests
b0001
HOM1
Home - Responses
b0010
NDR
Non-Data Responses
b0011
SNP
Snoops
b0100
NCS
Non-Coherent Standard
NCB
Non-Coherent Bypass
DRS
Data Response
--b1100
--b1110
Table 2-143. Opcode Match by Message Class (Sheet 1 of 2)
Opc
HOM0
HOM1
SNP
DRS
0000
RdCur
RspI
SnpCur
DataC_(FEIMS)
0001
RdCode
RspS
SnpCode
DataC_(FEIMS)_FrcAck
Cnflt
0010
RdData
---
SnpData
DataC_(FEIMS)_Cmp
0011
NonSnpRd
---
---
DataNc
0100
RdInvOwn
RspCnflt
SnpInvOwn
WbIData
0101
InvXtoI
---
SnpInvXtoI
WbSData
0110
EvctCln
RspCnfltOwn
---
WbEData
0111
NonSnpWr
---
---
NonSnpWrData
1000
InvItoE
RspFwd
SnpInvItoE
WbIDataPtl
1001
AckCnfltWbI
RspFwdI
---
---
1010
---
RspFwdS
---
WbEDataPtl
1011
---
RspFwdIWb
---
NonSnpWrdataPtl
1100
WbMtoI
RspFwdSWb
---
---
Reference Number: 327043-001
131
Intel® Xeon® Processor E5-2600 Product Family Uncore Performance Monitoring
Table 2-143. Opcode Match by Message Class (Sheet 2 of 2)
Opc
HOM0
HOM1
SNP
DRS
1101
WbMtoE
RspIWb
---
---
1110
WbMtoS
RspSWb
---
---
1111
AckCnflt
---
PrefetchHint
---
Opc
NDR
NCB
NCS
0000
Gnt_Cmp
NcWr
NcRd
0001
Gnt_FrcAckCnflt
WcWr
IntAck
0010
---
---
---
0011
---
---
FERR
0100
CmpD
---
NcRdPtl
0101
AbortTO
---
NcCfgRd
0110
---
---
---
0111
---
---
NcIORd
1000
Cmp
NcMsgB
---
1001
FrcAckCnlft
IntLogical
NcCfgWr
1010
Cmp_FwdCode
IntPhysical
---
1011
Cmp_FwdInvOwn
IntPrioUpd
NcIOWr
1100
Cmp_FwdInvItoE
NcWrPtl
NcMsgS
1101
---
WcWrPtl
NcP2PS
1110
---
NcP2PB
---
1111
---
DebugData
---
Table 2-144. Opcodes (Alphabetical Listing) (Sheet 1 of 4)
Name
132
Opc
MC
Gen
By?
Desc
AbortTO
0101
NDR
AckCnflt
1111
HOM0
Acknowledge receipt of Data_* and Cmp/FrcAckCnflt,
signal a possible conflict scenario.
Abort Time-out Response
AckCnfltWbI
1001
HOM0
In addition to signaling AckCnflt, the caching agent has
also written the dirty cache line data plus any partial
write data back to memory in a WBiData[Ptl] message
and transitioned the cache line state to I.
Cmp
1000
NDR
Uo
CmpD
0100
NDR
Uo
Cmp_FwdCode
1010
NDR
Complete request, forward the line in F (or S) state to the
requestor specified, invalidate local copy or leave it in S
state.
Cmp_FwdInvItoE
1100
NDR
Complete request, invalidate local copy
Cmp_FwdInvOwn
1011
NDR
Complete request, forward the line in E or M state to the
requestor specified, invalidate local copy
DataC_(FEIMS)
0000
DRS
Data Response in (FEIMS) state
NOTE: Set RDS field to specify which state is to be
measured.
- Supports getting data in E, F, I or M state
All snoop responses gathered, no conflicts
Completion with Data
Reference Number: 327043-001
Intel® Xeon® Processor E5-2600 Product Family Uncore Performance Monitoring
Table 2-144. Opcodes (Alphabetical Listing) (Sheet 2 of 4)
Name
Gen
By?
Desc
Opc
MC
DataC_(FEIMS)_Cmp
0010
DRS
Data Response in (FEIMS) state, Complete
NOTE: Set RDS field to specify which state is to be
measured.
- Supports getting data in E, F or I state
DataC_(FEIMS)_FrcAckC
nflt
0001
DRS
Data Response in (FEIMS) state, Force Acknowledge
NOTE: Set RDS field to specify which state is to be
measured.
- Supports getting data in E, F or I state
DataNc
0011
DRS
DebugData
1111
NCB
EvctCln
0110
HOM0
FERR
0011
NCS
Uo
Non-Coherent Data
Debug Data
Clean cache line eviction notification to home agent.
Legacy floating point error indication from CPU to legacy
bridge
FrcAckCnlft
1001
NDR
All snoop responses gathered, force an AckCnflt
Gnt_Cmp
0000
NDR
Signal completion and Grant E state ownership without
data to an InvItoE or ‘null data’ to an InvXtoI
Gnt_FrcAckCnflt
0001
NDR
Signal FrcAckCnflt and Grant E state ownership without
data to an InvItoE or ‘null data’ to an InvXtoI
IntAck
0001
NCS
Interrupt acknowledge to legacy 8259 interrupt controller
IntLogical
1001
NCB
Ui, Uo
Logical mode interrupt to processor
IntPhysical
1010
NCB
Ui, Uo
Physical mode interrupt to processor
IntPrioUpd
1011
NCB
Ui, Uo
Interrupt priority update message to source interrupt
agents.
InvItoE
1000
HOM0
Invalidate to E state requests exclusive ownership of a
cache line without data.
InvXtoI
0101
HOM0
Flush a cache line from all caches (that is, downgrade all
clean copies to I and cause any dirty copy to be written
back to memory).
NcCfgRd
0101
NCS
Ui
Ui
Configuration read from configuration space
NcCfgWr
1001
NCS
NcIORd
0111
NCS
Configuration write to configuration space
NcIOWr
1011
NCS
NcMsgB
1000
NCB
Ui, Uo
NcMsgS
1100
NCS
Ui, Uo
NcP2PB
1110
NCB
Peer-to-peer transaction between I/O entities (noncoherent bypass channel)
NcP2PS
1101
NCS
Peer-to-peer transaction between I/O entities. (Noncoherent standard channel)
NcRd
0000
NCS
Ui
Read from non-coherent memory mapped I/O space
NcRdPtl
0100
NCS
Ui
Partial read from non-coherent memory mapped I/O
space
NcWr
0000
NCB
Read from legacy I/O space
Write to legacy I/O space
Non-coherent Message (non-coherent bypass channel)
Non-coherent Message (Non-coherent standard channel)
Write to non-coherent memory mapped I/O space
NcWrPtl
1100
NCB
NonSnpRd
0011
HOM0
NonSnpWr
0111
HOM0
NonSnpWrData
0111
DRS
Non cache coherent write data
NonSnpWrDataPtl
1011
DRS
Partial (byte-masked) non cache coherent write data
Reference Number: 327043-001
Ui
Partial write to non-coherent memory mapped I/O space
Non-Snoop (uncached) read
Non-Snoop (uncached) write
133
Intel® Xeon® Processor E5-2600 Product Family Uncore Performance Monitoring
Table 2-144. Opcodes (Alphabetical Listing) (Sheet 3 of 4)
Name
134
Opc
MC
Gen
By?
Desc
PrefetchHint
1111
SNP
RdCode
0001
HOM0
Read cache line in F (or S, if the F state not supported)
Snoop Prefetch Hint
RdCur
0000
HOM0
Request a cache line in I. Typically issued by I/O proxy
entities, RdCur is used to obtain a coherent snapshot of
an uncached cache line.
RdData
0010
HOM0
Read cache line in either E or F (or S, if F state not
supported). The choice between F (or S) and E is
determined by whether or not per caching agent has
cache line in S state.
RdInvOwn
0100
HOM0
Read Invalidate Own requests a cache line in M or E
state. M or E is determined by whether requester is
forwarded an M copy by a peer caching agent or sent an
E copy by home agent.
RspCnflt
0100
HOM1
Peer is left with line in I or S state, and the peer has a
conflicting outstanding request.
RspCnfltOwn
0110
HOM1
Peer has a buried M copy for this line with an outstanding
conflicting request.
RspFwd
1000
HOM1
Peer has sent data to requestor with no change in cache
state
RspFwdI
1001
HOM1
Peer has sent data to requestor and is left with line in I
state
RspFwdIWb
1011
HOM1
Peer has sent data to requestor and a WbIData to the
home, and is left with line in I state
RspFwdS
1010
HOM1
Peer has sent data to requestor and is left with line in S
state
RspFwdSWb
1100
HOM1
Peer has sent data to requestor and a WbSData to the
home, and is left with line in S state
RspI
0000
HOM1
Peer left with line in I-state
RspIWb
1101
HOM1
Peer has evicted the data with an in-flight WbIData[Ptl]
message to the home and has not sent any message to
the requestor.
RspS
0001
HOM1
Peer left with line in S-state
RspSWb
1110
HOM1
Peer has sent a WbSData message to the home, has not
sent any message to the requestor and is left with line in
S-state
SnpCode
0001
SNP
Snoop Code (get data in F or S state)
- Supports getting data in F state
SnpCur
0000
SNP
Snoop to get data in I state
SnpData
0010
SNP
Snoop Data (get data in E, F or S state)
- Supports getting data in E or F state
SnpInvItoE
1000
SNP
Snoop Invalidate to E state. To invalidate peer caching
agent, flushing any M state data to home
SnpInvOwn
0100
SNP
Snoop Invalidate Own (get data in E or M state)
- Supports getting data in E state
SnpInvXtoI
0101
SNP
Snoop Invalidate Writeback M to I state. To invalidate
peer caching agent, flushing any M state data to home.
WbEData
0110
DRS
Writeback data, downgrade to E state
WbEDataPtl
1010
DRS
Partial (byte-masked) writeback data, downgrade to E
state
WbIData
0100
DRS
Writeback data, downgrade to I state
WbIDataPtl
1000
DRS
Partial (byte-masked) writeback data, downgrade to I
state
Reference Number: 327043-001
Intel® Xeon® Processor E5-2600 Product Family Uncore Performance Monitoring
Table 2-144. Opcodes (Alphabetical Listing) (Sheet 4 of 4)
Name
Gen
By?
Desc
Opc
MC
WbMtoI
1100
HOM0
Write a cache line in M state back to memory and
transition its state to I.
WbMtoE
1101
HOM0
Write a cache line in M state back to memory and
transition its state to E.
WbMtoS
1110
HOM0
Write a cache line in M state back to memory and
transition its state to S.
WbSData
0101
DRS
Writeback data, downgrade to S state
WcWr
0001
NCB
Write combinable write to non-coherent memory mapped
I/O space
WcWrPtl
1101
NCB
Partial write combinable write to non-coherent memory
mapped I/O space
§
Reference Number: 327043-001
135
Intel® Xeon® Processor E5-2600 Product Family Uncore Performance Monitoring
136
Reference Number: 327043-001