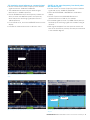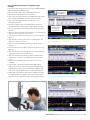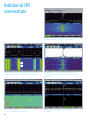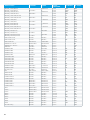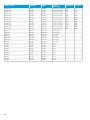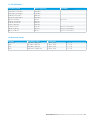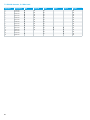
1
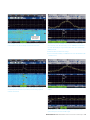
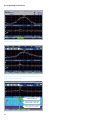
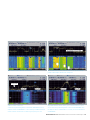
R&S®PR100 Radio Interference Detection and Analysis Application brochure Short-range detection in mobile radio networks Applicable products from Rohde & Schwarz: portable receiver active directional antenna Application Brochure | 01.00 JJ R&S®HE300 Radiomonitoring & Radiolocation JJ R&S®PR100 Table of Contents Introduction..............................................................................................................................................................................................................3 RFI and the user channel.........................................................................................................................................................................................4 Terminology..............................................................................................................................................................................................................5 2.1 RFI indicators.....................................................................................................................................................................................................5 2.2 Downlink RFI......................................................................................................................................................................................................5 2.3 Uplink RFI...........................................................................................................................................................................................................5 2.4 Co-channel interferer.........................................................................................................................................................................................5 2.5 Adjacent channel interferer...............................................................................................................................................................................6 2.6 Narrowband RFI.................................................................................................................................................................................................6 2.7 Broadband RFI....................................................................................................................................................................................................6 2.8 FOSiG method....................................................................................................................................................................................................6 2.9 Non-FOSiG..........................................................................................................................................................................................................6 2.10 Scan modes......................................................................................................................................................................................................6 2.11 Spectrum and spectrogram, waterfall diagram...............................................................................................................................................6 2.12 R&S®HE300 active directional antenna: direction finding, triangulation, localization....................................................................................7 2.13 R&S®PRView software: documentation and editing............................................................................................................................................7 Optimum RFI detection settings for the R&S®PR100...............................................................................................................................................8 3.1 General tips for locating RFI...............................................................................................................................................................................8 3.2 Settings for interference detection with the R&S®HE300 active directional antenna......................................................................................8 3.3 Interfering signal adjacent to a wanted signal..................................................................................................................................................9 3.4 RFI on the same frequency, but shortly after the wanted signal......................................................................................................................9 3.5 Short-time RFI hidden in stable wanted signals..............................................................................................................................................10 Detecting RFI in the uplink band...........................................................................................................................................................................11 4.1 Preparation, preliminary checks, tips...............................................................................................................................................................11 4.2 RFI detection method.......................................................................................................................................................................................12 Detecting RFI in the downlink band......................................................................................................................................................................17 5.1 Preparation, preliminary checks, tips...............................................................................................................................................................17 5.2 R&S®PR100 base station downlink spectral analysis......................................................................................................................................18 Additional RFI screenshots....................................................................................................................................................................................22 Cellular bands, paging bands, non-licensed services, broadcast..........................................................................................................................23 7.1 ITU ISM bands.................................................................................................................................................................................................27 7.2 Bluetooth® bands.............................................................................................................................................................................................27 7.3 WLAN channels, 2.4 GHz band........................................................................................................................................................................28 R&S®FSHx, R&S®TSMx, R&S®ROMES....................................................................................................................................................................29 Ordering information..............................................................................................................................................................................................31 2 Introduction This application brochure serves as a guideline and manual for mobile radio network field technicians and radio engineers tasked with detecting radio interference. Rohde & Schwarz offers a comprehensive product portfolio for the analysis of various mobile radio network systems including 2G, 3G and next-generation wireless-communications technologies. Radio frequency interference (RFI) is defined as an unwanted signal that originates from an internal or an external source. Internal RFI may stem from faulty channel or code planning (e.g. incorrect TCH reuse factor) or double scrambling code provisioning. To detect this type of interference, Rohde & Schwarz offers coverage measurement tools and network scanners that can scan GSM, UMTS and CDMA2000® frequencies in parallel. Rohde & Schwarz has additional application sheets that describe this product family. Another internal source of interference is the base s tation subsystem. Faulty components such as antennas, RF cables, connectors, filters, duplexers, power amplifiers and guy wires can produce intermodulation, harmonics, passive fractional spectral emissions and other types of interference. In some cases, even working components can cause radio interference together with plates, wires and metal boxes. Rohde & Schwarz offers the R&S®FSH4 and R&S®FSH8 handheld spectrum analyzers, including a twoport vector network analyzer with VSWR bridge, for identifying faulty components. An additional application sheet is available on this topic. This application brochure is based on the R&S®PR100 portable receiver and the R&S®HE300 active directional antenna for the detection of external RFI sources, which can originate from licensed or non-licensed radio services. Direct or up- and downconverted carriers from various sources can interfere with the uplink and downlink channels in the mobile radio network bands. Rohde & Schwarz R&S®PR100 Radio Interference D etection and Analysis 3 RFI and the user channel Today’s wireless telecommunications systems use digital modulation for upconversion in the transmitters and digital demodulation for downconversion in the receivers. In-phase/quadrature-phase modulation/demodulation technology is used in all latest-model mobile phones and base stations (e.g. GMSK, BPSK, 8PSK, QPSK, 16QAM). A distinction is made between (super) heterodyne and homodyne receiver technology. Both types generate a symbol rate at the end and subsequently a bit rate containing the different physical channels, which in turn represent a group of dedicated users and a control channel. When discussing RFI, the focus is on non-government authority signals that appear as "normal" GSM, CDMA or WCDMA signals. Interfering signals generate additional noise inside the receiver in the user channel. This noise decreases the S/N ratio, leading to diminished radio coverage. To detect the symbol rates, each modulation scheme requires a specific S/N ratio. Higher modulation schemes such as 8PSK or QAM need a higher ratio than simple FM systems because they require higher bandwidth. If the noise increases due to an interferer, the ability of the demodulator to distinguish between different symbol rates is reduced. This leads to a bit error rate (BER) that may not impact voice channels, but can affect the control and data payload channels. The worst case is a dropped call, cell handover failure or a reduced data rate for the customer application. If the noise increases by 6 dB, the maximum usable distance will be reduced by half compared to a normal noise floor. This example illustrates the importance of detecting and analyzing interference. 4 Terminology The following is a list of common terms associated with the detection of interference in mobile radio network systems: JJ RFI indicators, impact of RFI on mobile radio networks JJ Downlink RFI (forward base frequency band), mobile interference JJ Uplink RFI (reverse base frequency band), base station interference JJ Co-channel interferer JJ Adjacent channel interferer JJ Narrowband RFI in relation to user channel bandwidth JJ Broadband RFI in relation to user channel bandwidth JJ Fade-out signal (FOSiG) method, disruption of the base station transmit signal JJ R&S®PR100 modes: frequency, memory and panorama scan JJ R&S®PR100: spectrum and spectrogram, waterfall diagram JJ R&S®HE300 active directional antenna: direction finding, triangulation, localization JJ R&S®PRView software: documentation and editing JJ R&S®GX430 software: radio system classifier application 2.2 Downlink RFI Cellular networks use a lower frequency band for the uplink (reverse baseband) from the mobile phone to the base station and a higher frequency band for the downlink (forward baseband). The bands are separated u sing duplex spacing. There are some exceptions such as cdmaOne, where the uplink and downlink channels may overlap within a specific channel range. Downlink RFI occurs in the receiver band of the mobile phone, e.g. if the interference originates from a high transmit location such as the roof of a building or a hill. If the interference is short-range, such as from a wireless video transmitter in a store, it will affect only a small number of mobile phones. 2.3 Uplink RFI Uplink RFI affects the base station receiver band and ultimately all mobile phones since they have to increase transmit power depending on the strength of the RFI signal. The impact on CDMA-based systems is increased PN noise, lower data rates and a decrease in voice quality due to unscrambling problems in the rake receiver. Cellular networks use sector antennas with an angle between 30° and 180°. In some cases omnidirectional antennas are utilized. The base antenna direction can be used to locate the interferer. 2.1 RFI indicators RFI can cause mobile-originated or mobile-terminated calls to be interrupted or dropped. Handover scenarios will not work properly and data rates for schemes such as HSDPA, HSUPA, GPRS, EDGE and EV-DO can be decreased due to demodulation errors in the uplink or downlink receiver components. RFI signals can also be intermittent, such as when a private WiFi router is switched on and off in the morning or evening. The faulty transmit filter interferes with the WCDMA downlink channel. Blocked cells and low voice quality can be an indication of RFI. Radio access network (RAN) counters in operation and maintenance (O & M) systems are used to collect data related to problems in the radio access network caused by SGSN or GGSN network elements. When voice q uality, signal quality or latency thresholds are exceeded, a specific counter is incremented. Although there are many types of counters, only one or two are required to detect the presence of RFI. Direct transmitted, mixed signals and PIM: RFI can be a direct transmitted signal (or harmonics of it) or a mixed signal from up- or downconversion systems such as active conversion or passive intermodulation signals (PIM). If no direct service is related to the frequency band, the RFI could be a harmonic of any order or a converted signal due to an oscillating amplifier or passive intermodulation caused by faulty cable connectors or partially broken antennas, for instance. 2.4 Co-channel interferer Example: GSM, 200 kHz channel spacing, up to 600 kHz bandwidth due to GSMK modulation. If channel TCH 21 is used for sector A, TCH 22 and TCH 23 cannot be used for sectors B and C. If a signal is transmitted in TCH 21, this is referred to as co-channel RFI. Rohde & Schwarz R&S®PR100 Radio Interference D etection and Analysis 5 2.5 Adjacent channel interferer Following the example from 2.4, an interfering signal is referred to as an adjacent channel interferer if it is located in TCH 22 or 23. In other words, it is located either one channel higher or lower than the user channel (21). 2.6 Narrowband RFI Different cellular standards use different types of modulation such as cdmaOne 1.23 MHz, WCDMA 5 MHz and GSM 200 kHz. Depending on the RFI bandwidth in relation to the interfered user channel, the term "narrowband" applies if the ratio is less than 20 %. An AM audio transmitter with 15 kHz bandwidth in the WCDMA downlink band is considered a narrowband interferer, which could drive the mobile receiver into compression depending on the signal strength. On the other hand, a 15 kHz interferer bandwidth transmitted in a paging network with 30 kHz channel bandwidth is no longer considered narrowband RFI. 2.7 Broadband RFI Broadband RFI occurs if the interferer bandwidth is more than 20 % of the user channel bandwidth. For example, a WiFi transmitter with 2 MHz bandwidth and a faulty transmitter filter could impact the CDMA2000® band, reducing the signal level by 40 dB. 2.8 FOSiG method The best way to detect, locate and analyze RFI signals is to switch off the wanted signal in the observed channel or band. The downside is interruption of service to all customers in the affected sector. The upside is a channel with a normal noise floor and isolation of the RFI signal. This is the preferred method depending on the extent of the service interruption (e.g. total service disruption). 2.9 Non-FOSiG RFI sometimes appears only for a few seconds or a fraction of a second. The affected channels are typically located in high-use, high-turnover areas such as inner cities and financial districts. This eliminates the option of switching off the base station signal for an extended period of time during the day. The alternative is to switch off the signal in the middle of the night during low-activity periods or to perform an analysis during the day. The R&S®PR100 portable receiver provides an overview of the signal power for the specific channel or band. 6 2.10 Scan modes The R&S®PR100 offers three scan modes: scan mode: used for scanning a specific frequency range with userdefined parameters; step size between 1 Hz and 1 GHz JJ Memory scan mode: for scanning channels stored in a specific memory range of the device. The user can set parameters such as frequency, demodulation type, bandwidth and squelch for each line in a memory table. This could be a channel table for any type of interferer such as a 35 MHz standard for RC model airplanes JJ Panorama scan mode: used as a "quasi spectrum analyzer" for a wide s canning range without scanning. Step size, start/stop frequency and sampling analog RF p anorama scan resolution can be set. Decreasing the resolution increases the measurement time depending on the RFI signal. For optimal results, start with the highest resolution and reduce it according to the RFI signal JJ Frequency 2.11 Spectrum and spectrogram, waterfall diagram In fixed frequency mode (FFM) or RX mode, the R&S®PR100 provides two displays, allowing the user to set the following parameters for two different signals: frequency, IF bandwidth, demodulation bandwidth, demodulation type and markers. The display will show the IF spectrum for a specific center frequency with a maximum IF bandwidth of 10 MHz. For direct demodulation, different types are available (AM, FM, LSB, USB, ISB, CW, I/Q, PULSE). The IF bandwidth ranges from 1 kHz to 10 MHz. The demodulation bandwidth can be set between 150 Hz and 500 kHz. To search for short-time RFI signals, the RFI amplitude variation must be shown as a function of time. This is referred to as the spectrogram or waterfall view. The most recent measurements are displayed on the top line of the waterfall view. Compared to the single spectrum IF view, the signals are now easier to detect. For instance, a radio-controlled garage door opener, which operates close to some cellular bands at 866 MHz, will not appear in the spectrum view when used only for a second. Instead, it will show up as a narrowband vertical line in the waterfall view. Stopping the recording makes it easier to analyze the signal. 2.12 R&S®HE300 active directional antenna: direction finding, triangulation, localization 2.13 R&S®PRView software: documentation and editing RFI detection should initially be carried out with an omnidirectional antenna in order to gain an overview of the disturbed band or channel. As a second step for uplink interference detection, a diversity base antenna should be used, followed by the R&S®HE300 active directional antenna for the range between 500 MHz and 7.5 GHz. When an RFI signal has been detected in any scan mode or in the fixed frequency mode, select the RX only or RX + SPECTRUM mode from the DISPLAY MODE menu. RFI signal strength, measured in dBµV or dBm, is displayed numerically and graphically with a horizontal bar. The R&S®PR100 can be connected to the R&S®PRView software via a LAN or USB interface. The R&S®PRView software can be used for tasks such as screenshots or editing memory scan lists, antenna lists, and k-factor lists. An audio tone that can be heard via loudspeaker or headphones also provides an indication of RFI signal strength. By moving the R&S®HE300 in a continuous circle, the direction of maximum signal strength is found as soon as the audio tone reaches its maximum pitch. However, the influence of the environment has to be taken into account. In urban areas, for example, reflections from coated windows on office buildings can cause measurement errors. It is therefore advisable to perform measurements from several positions. GPS position and compass angle should be noted on a map for RFI transmitter position triangulation. This procedure requires experience and knowledge of wave propagation and wavelengths, particularly inside buildings. Rohde & Schwarz R&S®PR100 Radio Interference D etection and Analysis 7 Optimum RFI detection settings for the R&S®PR100 3.1 General tips for locating RFI JJ Start with a wideband panorama scan with coarse r esolution (PSCAN, RBW, e.g. 100 kHz) for maximum scan speed JJ Set the measurement time to the minimum value of 500 µs, for maximum scan speed JJ After identifying a frequency range of interest, restrict the start and stop frequency of the panorama scan to this band and decrease the PSCAN RBW in order to increase resolution and sensitivity JJ Switch to DUAL SPECTRUM mode and select the frequency of interest with the RX marker while running the panorama scan JJ Stop the panorama scan; the receiver will automatically switch to fixed frequency realtime operation with a maximum IF bandwidth of 10 MHz JJ The signal can be analyzed in detail by zooming in or out, performing demodulation tasks, etc. JJ The fixed frequency mode (FFM) takes full advantage of the sophisticated signal processing capabilities of the R&S®PR100 such as maximum monitoring speed and performance 3.2 Settings for interference detection with the R&S®HE300 active directional antenna JJ Tune the R&S®PR100 to the center frequency of the t arget interference signal JJ The demodulation bandwidth must be equal to or greater than the bandwidth of the interfering signal to achieve maximum sensitivity JJ If the demodulation bandwidth is too narrow, the R&S®PR100 will measure only part of the RF level, thus reducing system sensitivity JJ The demodulation type is not critical since it does not influence the measurement JJ Switch off automatic frequency control (AFC) and switch off manual gain control (MGC) to avoid automated tuning effects inside the receiver that cannot be controlled and which can affect the measurement results JJ Switch off the SQUELCH function JJ Switch on the AVG detector for the level measurement path for a stable level reading JJ Increase the measurement time to 200 ms for additional stability JJ Switch on the TONE function to listen to the audio tone; this helps locate a signal without constantly looking at the dBµV level reading on the display JJ Adjust the audio tone (for most comfort) to a medium power level by using the center knob on top of the receiver JJ If the signal of interest is too strong, switch on the attenuator (ATT) to prevent receiver overload Dual spectrum mode for fast transition between broadband PSCAN and Level measurement of signal at center frequency and its acoustical narrowband IF analysis. representation by means of the Tone function. 8 3.3 Interfering signal adjacent to a wanted signal JJ Set the receiver to the center frequency of the wanted signal and use the 10 MHz IF bandwidth JJ The wideband view shows only the wanted signal (white arrow in 10 MHz spectrum) JJ Use the ZOOM function (center frequency remains the same) to locate the additional peak in the spectrum, which may be the interfering signal (white arrow in 1 MHz spectrum) JJ For a smooth curve, select the AVERAGE function on the display JJ Increase the measurement time to 100 ms or more 3.4 RFI on the same frequency, but shortly after the wanted signal JJ Set the receiver to a center frequency near the wanted signal and use the 10 MHz IF bandwidth JJ Select the SPECTRUM + WATERFALL combination display JJ Set the IF spectrum to MAX HOLD and use a measurement time of 100 ms, for example JJ The wanted signal at 'Arrow 1' (a GSM mobile phone) is followed by an interfering signal with unstable timing at 'Arrow 2' JJ Both signals disappear from the spectrum view at the time of the screenshot, but they can easily be monitored in the waterfall diagram RFI close to a wanted carrier is hard to find if IF spectrum setting is too wide. Arrow 2 Arrow 1 By zooming in, the RFI signal can be clearly identified. RFI shortly after the wanted signal is clearly visible in the waterfall diagram. Rohde & Schwarz R&S®PR100 Radio Interference D etection and Analysis 9 3.5 Short-time RFI hidden in stable wanted signals JJ Use the panorama scan to display the spectrum of the GSM downlink from 925 MHz to 960 MHz JJ Short-time RFI signals are difficult to identify among the many signals that are displayed JJ By activating the differential measurement mode, the receiver stores a reference spectrum received when DIFF MODE is pressed JJ Each newly calculated spectrum is subtracted from the stored reference spectrum JJ As a result, stable signals that are present in both spectra are suppressed JJ New signals not present when DIFF MODE was pressed are then made visible JJ This significantly reduces the number of peaks in the spectrum that must be analyzed The large number of signals makes it difficult to identify time-variant signals. The differential mode enables the operator to easily identify a signal that was not present at the time when the reference spectrum was stored. 10 Detecting RFI in the uplink band 4.1 Preparation, preliminary checks, tips Make sure there are no base station hardware alarms related to power amplifiers (VSWR problems), TMA, duplexers, combiners and microwave, fiber-optic or DSL links. Check the GPS module if the base station has one (clocking reference). An unstable clock reference can lead to an incorrect base station transmit or receive center frequency. From the RAN management system, retrieve a list of interfered channels that have been identified with counters for events such as dropped calls, blocked calls and dropped handovers. 4.1.1 FOSiG method FOSiG method in the uplink band means that no mobile TX signal is available, which isolates the interfering signal for detection JJ This is accomplished by blocking the specific channel via an O & M command for the controlling unit (no adjacent channels) JJ If the entire channel is blocked by RFI, switch off the base station downlink signal so that no broadcast information is available for mobile phones (no uplink traffic) JJ The 4.1.2 Non-FOSiG method The non-FOSiG method does not permit the suppression of user signals. A composite user and interferer signal is provided instead. If the base station cannot be switched off due to high traffic levels, delay this procedure until the early m orning hours when traffic is lower (2:00 to 4:00 a.m., for example) or wait until there is no activity (provided the RFI is present!). If the uplink channel is not taken out of service, the noise level will increase, especially in CDMA systems. Depending on the distance between the mobile phone and the base station, the uplink signal may be clear in urban areas. Rohde & Schwarz R&S®PR100 Radio Interference D etection and Analysis 11 4.2 RFI detection method 4.2.1 Scanning overview Strong signals close to transmitter locations can cause intermodulation in the frontend of the R&S®PR100. External band filters are recommended in this case. Connect an omnidirectional antenna matched to the frequency range of interest, set the uplink band start and stop frequency in the panorama scan mode and use an RBW of 100 kHz. The following examples are based on WCDMA band 1, 200 kHz channel spacing, 3.84 MHz channel bandwidth, 1.92 GHz to 1.98 GHz uplink band, 2.11 GHz to 2.17 GHz downlink band: JJ For a more detailed analysis of the RFI, switch the display mode to DUAL SPECTRUM JJ Stop the PSCAN; the IF-PAN will immediately display the RFI signal JJ Press DISPLAY, press the ZOOM softkey and decrease the IF bandwidth ▷ the RFI signal is spread further JJ Press the RANGE softkey to improve the resolution of the RFI power level JJ RFI may be a continuous or non-continuous signal JJ The RFI bandwidth may be constant or it may vary JJ A spectrogram or 2D waterfall analysis is available to display the frequency and time domain on a single screen JJ If the RFI cannot be detected with the normal spectrum or dual spectrum display, select the SPECTRUM + WATERFALL DISPLAY mode JJ Start again with 100 kHz RBW and stepwise reduce the RBW to increase the sensitivity and resolution – which will also increase the scan time, however JJ Press the MARKER softkey on the display menu and select LINES to measure the start and stop time of non-continuous signals JJ Select DELTA MARKER to measure the frequency offset Narrowband RFI UMTS mobile uplink TX signal WCDMA band 1 uplink The screenshot above displays the band 1 uplink PSCAN sweep. A UMTS phone transmits on channel 10 and occupies 3.84 MHz bandwidth. The center line shows a continuous narrowband RFI signal close to 1950 MHz ▷ RX marker. RFI zoomed Dual spectrum display after PSCAN stop. The interferer signal can be better identified in the upper IF-PAN screen. Intermittent Intermittent Single event! Continuous Continuous WCDMA band 1 dual screen with spectrum and waterfall screen. Several RFI signals are present; two are continuous and two are intermittent. Two individual RFI events are indicated. 12 Time domain The lines can be positioned to meet user requirements. Narrowband RFI Spectrum and waterfall screen: two mobile phones transmitting in the WCDMA uplink band. 4.2.2 Locating the direction of strongest signal strength JJ Connect a directional antenna such as the R&S®HE200 or R&S®HE300 to the R&S®PR100 JJ Switch to RX or RX + SPECTRUM display mode JJ Switch off the AFC and squelch function JJ Select the appropriate frequency, making sure the RBW of the demodulation path is higher than the RFI bandwidth to achieve best sensitivity JJ Select the appropriate antenna model from the configuration menu JJ Zoom the signal, press the PEAK softkey, select the target interferer signal with the left and right arrows JJ Turn on the audio tone function and set the volume level to mid-range JJ Move the directional antenna clockwise or counterclockwise while listening to the audio tone JJ The higher the pitch of the audio tone, the stronger the signal JJ The direction of the signal source is located when the audio tone reaches its peak JJ Note the position and direction and move to another position JJ Perform the same procedure and note the position and direction JJ The point at which the two signals cross represents the geographic position of the RFI source JJ Take into account that reflecting walls, windows and metal plates in u rban areas may cause measurement e rrors JJ Note: The detected RFI position may be a point of reflection JJ If the signal is analog-demodulated (FM, AM, USB or LSB voice), listen to it by selecting the corresponding demodulation setting. Press the MOD+ or MOD- keys and select enough bandwidth for clear demodulation JJ Additional classification methods are available through the R&S®GX430 PC software, which can classify and decode various modulation types and coding schemes Antenna model Calculated level with antenna p arameters Tone function R&S®HE300 handle with 500 MHz to 3.5 GHz log-periodic module. Level measurement of signal at center frequency and its acoustical representation by means of the Tone function. Rohde & Schwarz R&S®PR100 Radio Interference D etection and Analysis 13 4.2.3 Uplink scanning via base station diversity antenna connection Some OAM alarms and messages rely on values measured in the base station. This includes increased noise in the uplink band when there is no call a ctivity, increasing numbers of dropped calls, inferior voice quality and handover problems. One unconventional method of detecting and locating RFI involves connecting the R&S®PR100 directly to the receive antenna. This enables the uplink band to be monitored directly at the antenna instead of through the base station. such as the antenna pattern, gain, directivity and band sensitivity can be monitored JJ If the base station is in service, placing bandpass filters in front of the R&S®PR100 is highly recommended (the use of external DC blocks is also required in case DC voltage is present on the RF cable) JJ Some base station systems use an internal LNA, which can be connected to a monitor port in front of or behind an LNA stage or directly to the antenna feeder cable JJ Disconnect the diversity receive antenna from the BTS and connect it to the R&S®PR100. This ensures reception of the desired uplink band without interference from TX signals JJ Use the PSCAN mode, select a frequency range that is 10 % wider than the uplink band of the cellular network being monitored JJ Perform the measurements as outlined in 4.2.1 JJ The Ethernet interface can be used for remote viewing with the R&S®PRView software, remote control with the R&S®RAMON software and service classification using the R&S®GX430 software. Initiate a waterfall screenshot if an alarm from an RAN system indicates the presence of RFI Broadband FM RFI JJ Parameters Indication of potential harmonics or mixed signals, continuous or intermittent. AM RFI AM-modulated RFI with sideband signals. AM RFI, zoomed AM RFI, zoomed Narrowband RFI Multiple narrowband interferer signals inside WCDMA band 1, channel 10. 14 AM RFI, zoomed Dual screen display mode, higher AM signal resolution. Broadband RFI due to faulty switching power supplies GSM 900 MHz uplink band with broadband RFI due to faulty switching Occupied spectrum for GSM900 mobile phone in normal mode, dual power supplies in LC plasma displays used for advertisements. screen display. Lower RF-PAN displays the full GSM900 uplink band and the upper part displays a single zoomed mobile TCH uplink channel with GMSK spectrum. JJ Different marker, delta and line settings JJ For a more detailed analysis, the RMS detector of the demodulation path should be used Defective TX filter in a GSM mobile phone, GSM 1800 MHz band. The Interference from a broadband digital signal on the same GSM 900 MHz occupied spectrum exceeds the specified spectrum mask ▷ adjacent channel. channels are blocked. Use the DIFF mode in the PSCAN display mode to suppress the user signal, leaving only the short-time RFI signal. Rohde & Schwarz R&S®PR100 Radio Interference D etection and Analysis 15 4.2.4 Uplink RFI screenshots Lower curve: DIFF mode activated to display a wanted signal ▷ waiting for interferer signal to appear. Upper curve: DIFF mode activated, GSM uplink mobile TX signal and interferer signal. Lower curve: DIFF mode activated, short-time interferer signal is displayed in PSCAN mode. Difference mode activated, interferer available in PSCAN mode Difference mode activated, GSM s ignal eliminated, no RFI present Difference mode inactive, only GSM user signal present, no interferer DIFF mode with spectrum and waterfall screen. 16 Detecting RFI in the downlink band 5.1 Preparation, preliminary checks, tips Make sure there are no base station hardware alarms related to power amplifiers (VSWR problems), TMA, duplexers, combiners and microwave, fiber-optic or DSL links. Check the GPS module if the base station has one (clocking reference). An unstable clock reference can lead to an incorrect base station transmit or receive center frequency. From the RAN management system, retrieve a list of interfered channels that have been identified with counters for events such as dropped calls, blocked calls and dropped handovers 5.1.1 FOSiG method The FOSiG method in the downlink band means that no mobile TX signal is available, which isolates the interfering signal for detection. This is accomplished by blocking the specific channel via an O & M command for the controlling unit (no adjacent channels) JJ If the entire channel is blocked by RFI, switch off the base station downlink signal so that no broadcast information is available for mobile phones (no uplink traffic) 5.1.2 Non-FOSiG method The non-FOSiG method does not permit the suppression of base station signals. A composite base station and interferer signal is provided instead. JJ If the base station cannot be switched off due to high traffic levels, reduce the TX power JJ If the downlink signal remains in service, the noise level will increase, especially in CDMA systems. Depending on the distance between the mobile phone and the base station, the uplink signal may be clear in urban areas JJ Determine what a normal downlink signal looks like in the spectrum and waterfall JJ Technologies such as GSM and TETRA are TDMA-based systems in contrast to C2K, UMTS, TD-SCDMA, which are code-domain-accessed systems that work on the same frequency with different codes 5.1.3 General tips for detecting RFI in the downlink band RFI in the downlink band reduces the mobile phone receiver’s ability to demodulate and decode the physical channels, which leads to lower voice quality and decreased data rates for packet-switched services. Key performance indicators (KPIs) such as call setup times, latency times and handover times will be impacted. JJ Error correction in the baseband component of the r eceiver is effective up to a certain BER, beyond which calls can drop or handovers can fail JJ An RFI signal with –80 dBm/10 kHz bandwidth is a relative power value. The impact of the RFI depends on the signal strength of the base station downlink. Mobile phones in close proximity to the base station or at the outer edge of the cell range calculate different C/I values because the signal strength of the base station varies JJ Locating the cause of service reduction (RFI) could also be accomplished with coverage and QoS m easurement systems such as R&S®ROMES. These systems can perform a full uplink and downlink analysis, including all KPI measurements and GPS data logging, which together provide the optimal tools for detecting RFI in the affected area 5.1.4 RFI sources in the downlink band The base station can also be a source of RFI, e.g. when faulty TX filters create spectrum interference in adjacent channels. QPSK modulation for WCDMA is characterized by steep filter slopes, eliminating the need for complete user channel separation. The UARFCN of the adjacent operator is 200 kHz outside of the 5 MHz bandwidth of the other operator ▷ analyze BTS with the R&S®FSH4. JJ Antenna blades, wires and soldered components can cause PIM due to faulty connections or metal corrosion ▷ analyze the cabling and antenna components with the R&S®FSH4 handheld spectrum analyzer JJ Incorrect channel or scrambling code planning, crosstalk from other network operators ▷ use the R&S®ROMES software plus the R&S®TSMx to scan the network JJ The most challenging sources of RFI are not related to commercial operator base station systems as mentioned previously. Other sources that should be considered include: Nonharmonic RF within switching power supplies close to shopping windows, railway stations, street lamps, flat lighting, LCD or plasma flat screens, computers, kitchen appliances WW Rohde & Schwarz R&S®PR100 Radio Interference D etection and Analysis 17 WW WW WW WW WW WW WW WW Audio and video transmitters using AM, FM FSK and AFSK modulation in various ISM or professional bands typically found in schools, universities, concert halls and sports arenas. They are sometimes used to monitor building and garage entrances as an example. Even when outside of the desired band, they can produce harmonics caused by defective TX filters or intermodulate with other signals Illegal (non-licensed) GSM, UMTS, CDMA2000®, TETRA and WiMAX™ repeaters used to extend coverage in hotels, ports and on private property Short-range wireless communications: Bluetooth®, RF USB, ZigBee, WLAN, RFID, DECT Hobby RC electronics: 35 MHz, 40 MHz, 72 MHz, 433 MHz, 2.4 GHz Amateur radio signals, which can intermodulate with commercial services Various wireless consumer electronics products from other countries that use different frequencies (e.g. USA versus Europe) Computer cables, power line communications that have powerful spike spectra RFI fading caused by multipath propagation ▷ perform fading analysis with R&S®TSMx scanners GSM1800 downlink band, markers active. RFI in the downlink channel is a common cause of mobile phone service reduction. Relying on the R&S®PR100 together with network quality analysis tools is therefore highly recommended. A decrease in service quality can be detected immediately by using the R&S®ROMES software and a mobile phone. The two figures show a mobile phone operating at 1858.2 MHz with RFI from a direct adjacent channel at 1858.4 MHz. With normal 400 kHz channel spacing, the next usable channel should be at 1858.8 MHz. 5.2 R&S®PR100 base station downlink spectral analysis an omnidirectional antenna and set the frequency range of interest. Choose PSCAN mode with RBW of 100 kHz, set the downlink band with start and stop frequency or select a stored user preset with GSM, CDMA2000®, WCDMA, TETRA band values JJ Spectrum and waterfall display is the first choice JJ If needed, run the marker menu with marker, delta marker and lines on the screen JJ For GSM systems, a frequency reuse factor is used to separate channels due to the special envelope of a GMSK-modulated carrier, which occupies much more than 200 kHz of bandwidth JJ Rohde & Schwarz FFT technology in the R&S®PR100 permits the d etection of leakage transmit power Broadband RFI emitted by switching power supplies: supermarket WCDMA band 1 downlink spectrum and waterfall analysis, six channels on air. JJ Connect Broadband RFI e mitted by switching power supplies close to railway stations TETRA downlink band 4, four channels on air. 18 Narrowband RFI close to 227 MHz DAB channels between 200 MHz and 235 MHz. All three DAB channels have problems related to the spectral envelope ▷ may be caused by a defective filter or amplifier. Narrowband RFI 1858.2 MHz 1858.4 MHz 1852.4 MHz 1852.8 MHz Adjacent channel interference Right GSM downlink channel setting, one in between channel is not in A continuously transmitting BCCH is detected at 1858.2 MHz while the use. A continuously transmitting BCCH is detected at 1852.4 MHz while adjacent channel at 1858.4 MHz is in burst mode ▷ the GMSK envelopes the adjacent channel at 1852.6 MHz is not used; the next used channel is of both channels interfere with one another ▷ frequency reuse rule. at 1852.8 MHz. Rohde & Schwarz R&S®PR100 Radio Interference D etection and Analysis 19 Zoom to 2 MHz. Peak function Peak function Zoom function Zoom function Zoom to 50 kHz. Zoom function Zoom function The zoom function expands the IF display for a more detailed analysis of the RFI. 20 Zoom to 10 kHz. 5.2.1 Locating the direction of highest signal strength JJ Connect a directional antenna such as the R&S®HE200 or R&S®HE300 to the R&S®PR100 JJ Switch to RX or RX + SPECTRUM display mode JJ Switch off the AFC and squelch function JJ Select the appropriate frequency; RBW should be higher than the RFI bandwidth to achieve best sensitivity JJ Select the appropriate antenna model from the configuration menu JJ Zoom the signal, press the PEAK softkey, select the zoomed interferer signal with the left and right arrows JJ Turn on the audio tone function and select a mid-range volume JJ Move the directional antenna clockwise or counterclockwise while listening to the audio tone JJ The higher the pitch of the audio tone, the stronger the signal JJ The direction of the signal source is located when the audio tone reaches its peak JJ Note the position and direction and move to another position JJ Perform the same procedure and note the position and direction JJ The point at which the two signals cross represents the geographic position of the RFI source JJ Take into account that reflecting walls, windows and metal plates in urban areas may cause measurement errors JJ Note: The detected RFI position may be a point of reflection JJ If the signal is analog-modulated (FM, AM, USB or LSB voice), listen to it by selecting the corresponding demodulation setting. Press the MOD+ or MOD- keys and select enough bandwidth for clear demodulation JJ Additional classification methods are available through the R&S®GX430 PC software, which can classify and decode various modulation types and coding schemes R&S®HE300 handle with 500 MHz to 3.5 GHz log-periodic module. Demodulation path RBW depending on RFI bandwidth! R&S®HE300 active directional antenna selected from RX configuration menu Display mode: RX + SPECTRUM, UMTS DL RFI at 2142.659 MHz, IF realtime span of 10 MHz The bandwidsth for the IF spectrum and for the level measurement path can be set independently from each other. IF realtime span of 1 MHz, tone function activated: Listen to the tone while rotating the R&S®HE300 active directional antenna. Marker menu selected: 2nd RFI signal IF realtime span of 500 kHz. Rohde & Schwarz R&S®PR100 Radio Interference D etection and Analysis 21 Additional RFI screenshots 433 MHz ISM non-licensed band TX signal: garage door opener; occupied bandwidth nearly 2 MHz! Low-cost device without TX filter. WCDMA TX bandwidth problem in WCDMA downlink band: defective 433 MHz ISM non-licensed band TX signal: garage door opener; amplifier and/or faulty duplex filter and/or intermodulating antenna 1st harmonic, occupied bandwidth nearly 500 kHz! Low-cost device system. without TX filter. Bluetooth® hopping signals: 433 MHz ISM non-licensed band TX signal: garage door opener; Europe + US band: 2.402 MHz to 2483.5 MHz. 2nd harmonics. 22 Cellular bands, paging bands, non-licensed services, broadcast The following list is an overview of available commercial and professional cellular mobile networks. Although this is a partial list, it is still useful for calculating harmonics and upmixed or downmixed RFI emissions. The websites of the various networks and agencies (e.g. FCC, ANSI, ITU, 3GPP, ETSI, TETRA Forum, WiMAX Forum) contain detailed information. Service name Downlink Uplink Signal bandwidth CH # start CH # stop cdmaOne US Cellular 870 MHz 825 MHz 1.23 MHz 1 799 cdmaOne US Cellular 870 MHz 825 MHz 1.23 MHz 990 1023 cdmaOne US PCS 1930 MHz 1850 MHz 1.23 MHz 1 1199 cdmaOne Korea PCS 1840 MHz 1750 MHz 1.23 MHz 0 599 cdmaOne Japan 860 MHz 915 MHz 1.23 MHz 1 799 cdmaOne Japan 843 MHz 898 MHz 1.23 MHz 801 1039 cdmaOne Japan 832 MHz 887 MHz 1.23 MHz 1041 1199 cdmaOne China-1 934.9875 MHz 889.9875 MHz 1.23 MHz 0 1000 cdmaOne China-1 917.0125 MHz 872.0125 MHz 1.23 MHz 1329 2047 cdmaOne China-2 934.9875 MHz 889.9875 MHz 1.23 MHz 0 1000 cdmaOne China-2 917.0125 MHz 872.0125 MHz 1.23 MHz 1329 2047 cdma2k_0 N.A. Cellular 870 MHz 825 MHz 1.23 MHz 1 799 cdma2k_0 N.A. Cellular 870 MHz 825 MHz 1.23 MHz 990 1023 cdma2k_0 Korea 870 MHz 825 MHz 1.23 MHz 1 799 cdma2k_0 Korea 870 MHz 825 MHz 1.23 MHz 990 1023 cdma2k_1 N.A. PCS 1930 MHz 1850 MHz 1.23 MHz 0 1199 cdma2k_2 TACS Band 934.9875 MHz 889.9875 MHz 1.23 MHz 0 1000 cdma2k_2 TACS Band 916.9875 MHz 871.9875 MHz 1.23 MHz 1329 2047 cdma2k_3 JTACS Band 860 MHz 915 MHz 1.23 MHz 1 799 cdma2k_3 JTACS Band 843 MHz 898 MHz 1.23 MHz 801 1039 cdma2k_3 JTACS Band 832 MHz 887 MHz 1.23 MHz 1041 1199 cdma2k_3 JTACS Band 838 MHz 893 MHz 1.23 MHz 1201 1600 cdma2k_4 Korea PCS 1840 MHz 1750 MHz 1.23 MHz 0 599 cdma2k_5 NMT-25k-450 460 MHz 450 MHz 1.23 MHz 1 300 cdma2k_5 NMT-25k-450 421 MHz 411 MHz 1.23 MHz 539 871 cdma2k_5 NMT-20k-450 461.01 MHz 451.01 MHz 1.23 MHz 1039 1473 cdma2k_5 NMT-20k-450 489 MHz 479 MHz 1.23 MHz 1792 2016 cdma2k_6 IMT-2000 2110 MHz 1920 MHz 1.23 MHz 0 1199 cdma2k_7 N.A. 700 MHz Cell 746 MHz 776 MHz 1.23 MHz 0 359 cdma2k_8 GSM Band 1805 MHz 1710 MHz 1.23 MHz 0 1499 cdma2k_9 GSM Band 925 MHz 880 MHz 1.23 MHz 0 699 cdma2k-10 SMR 800 Band 851 MHz 806 MHz 1.23 MHz 0 719 cdma2k-10 SMR 800 Band 935 MHz 896 MHz 1.23 MHz 720 919 cdma2k-11 400 PAMR Band 460 MHz 450 MHz 1.23 MHz 1 400 cdma2k-11 400 PAMR Band 420 MHz 410 MHz 1.23 MHz 472 871 cdma2k-11 400 PAMR Band 489 MHz 479 MHz 1.23 MHz 1536 1715 Rohde & Schwarz R&S®PR100 Radio Interference D etection and Analysis 23 Service name Downlink Uplink Signal bandwidth CH # start CH # stop WCDMA_1 2100 (Band 1) 0 1922.4 MHz 5 MHz 9612 9888 WCDMA_1 2100 (Band 1) 2112.4 MHz 0 5 MHz 10562 10838 WCDMA_2 1900 (NA PCS) 0 1852.4 MHz 5 MHz 9262 9538 WCDMA_2 1900 (NA PCS) 1932.4 MHz 0 5 MHz 9662 9938 WCDMA_2 1900 Addl (NA PCS) 0 1852.5 MHz 5 MHz 12 287 WCDMA_2 1900 Addl (NA PCS) 1932.5 MHz 0 5 MHz 412 687 WCDMA_3 1800 (DCS) 0 1712.4 MHz 5 MHz 8562 8913 WCDMA_3 1800 (DCS) 1807.4 MHz 0 5 MHz 9037 9388 WCDMA_4 2100 (Band 4) 0 1712.4 MHz 5 MHz 8562 8763 WCDMA_4 2100 (Band 4) 2112.4 MHz 0 5 MHz 10562 10763 WCDMA_4 2100 Addl (Band 4) 0 1712.5 MHz 5 MHz 1162 1362 WCDMA_4 2100 Addl (Band 4) 2112.5 MHz 0 5 MHz 1462 1662 WCDMA_5 850 (US Cell) 0 826.4 MHz 5 MHz 4132 4233 WCDMA_5 850 (US Cell) 871.4 MHz 0 5 MHz 4357 4458 WCDMA_5 850 Addl (US Cell) 0 826.5 MHz 5 MHz 782 862 WCDMA_5 850 Addl (US Cell) 871.5 MHz 0 5 MHz 1007 1087 NADC IS136 Cellular 870 MHz 825 MHz 30 kHz 1 799 NADC IS136 Cellular 870 MHz 825 MHz 30 kHz 990 1023 NADC IS136 PCS 1930.02 MHz 1849.98 MHz 30 kHz 1 1999 SMR 800 Hz to 25 kHz 850.9875 MHz 805.9875 MHz 25 kHz 1 600 SMR 800 Hz to 12.5 kHz 851 MHz 806 MHz 25 kHz 1 1199 SMR 1500 1501 MHz 1453 MHz 25 kHz 1 479 GSM/EDGE 450 460.6 MHz 450.6 MHz 200 kHz 259 293 GSM/EDGE 480 489 MHz 479 MHz 200 kHz 306 340 GSM/EDGE 750 777 MHz 747 MHz 200 kHz 438 511 GSM/EDGE 850 869200 kHz 824200 kHz 200 kHz 128 251 GSM-E/EDGE 900 935 MHz 890 MHz 200 kHz 0 124 GSM-E/EDGE 900 935 MHz 890 MHz 200 kHz 975 1023 GSM-P/EDGE 900 935 MHz 890 MHz 200 kHz 1 124 GSM-R/EDGE 900 935 MHz 890 MHz 200 kHz 0 124 GSM-R/EDGE 900 935 MHz 890 MHz 200 kHz 955 1023 GSM/EDGE 1800 1805.2 MHz 1710.2 MHz 200 kHz 512 885 GSM/EDGE 1900 1930.2 MHz 1850.2 MHz 200 kHz 512 810 PDC1500 (JDC) 1477 MHz 1525 MHz 30 kHz 0 960 PHS 1895.15 MHz 1895.15 MHz 200 kHz 1 77 AMPS EIA 553 870 MHz 825 MHz 30 kHz 1 799 AMPS EIA 553 870 MHz 825 MHz 30 kHz 990 1023 N-AMPS IS-88 M 870 MHz 825 MHz 10 kHz 1 799 N-AMPS IS-88 M 870 MHz 825 MHz 10 kHz 990 1023 N-AMPS IS-88 L 869.99 MHz 824.99 MHz 10 kHz 1 799 N-AMPS IS-88 L 869.99 MHz 824.99 MHz 10 kHz 990 1023 N-AMPS IS-88 U 870.01 MHz 825.01 MHz 10 kHz 1 799 N-AMPS IS-88 U 870.01 MHz 825.01 MHz 10 kHz 990 1023 TACS 934.9875 MHz 889.9875 MHz 25 kHz 1 1000 ETACS 934.9875 MHz 889.9875 MHz 25 kHz 0 1000 ETACS 934.9875 MHz 889.9875 MHz 25 kHz 1329 2047 NTACS 860 MHz 915 MHz 12.5 kHz 1 799 NTACS 843 MHz 898 MHz 12.5 kHz 800 1039 NTACS 832 MHz 887 MHz 12.5 kHz 1040 1199 JTACS 860 MHz 915 MHz 20 kHz 0 798 JTACS 843 MHz 898 MHz 20 kHz 800 1038 JTACS 832 MHz 887 MHz 20 kHz 1040 1198 PDC 800 Analog 843 MHz 898 MHz 25 kHz 0 1680 24 Service name Downlink Uplink Signal bandwidth CH # start CH # stop NMT-411 25 kHz 421 MHz 411 MHz 25 kHz 539 871 NMT-450 25 kHz 460 MHz 450 MHz 25 kHz 1 300 NMT-450 20 kHz 461 MHz 451.01 MHz 20 kHz 1039 1473 NMT-470 20 kHz 489 MHz 479 MHz 20 kHz 1792 2016 NMT-900 934.9875 MHz 889.9875 MHz 25 kHz 1 1000 NMT-900 (offset) 935.025 MHz 890.025 MHz 25 kHz 1025 2023 MATS-E 934.9875 MHz 889.9875 MHz 25 kHz 1 1000 C-450 (SA) 454.98 MHz 464.98 MHz 20 kHz 1 247 C-450 (P) 463.0375 MHz 453.0375 MHz 20 kHz 1 887 1xEVDO_0 N.A. Cellular 870 MHz 825 MHz 1.23 MHz 1 799 1xEVDO_0 N.A. Cellular 870 MHz 825 MHz 1.23 MHz 990 1023 1xEVDO_0 Korea 870 MHz 825 MHz 1.23 MHz 1 799 1xEVDO_0 Korea 870 MHz 825 MHz 1.23 MHz 990 1023 1xEVDO_1 N.A. PCS 1930 MHz 1850 MHz 1.23 MHz 0 1199 1xEVDO_2 TACS Band 934.9875 MHz 889.9875 MHz 1.23 MHz 0 1000 1xEVDO_2 TACS Band 916.9875 MHz 871.9875 MHz 1.23 MHz 1329 2047 1xEVDO_3 JTACS Band 860 MHz 915 MHz 1.23 MHz 1 799 1xEVDO_3 JTACS Band 843 MHz 898 MHz 1.23 MHz 801 1039 1xEVDO_3 JTACS Band 832 MHz 887 MHz 1.23 MHz 1041 1199 1xEVDO_3 JTACS Band 838 MHz 893 MHz 1.23 MHz 1201 1600 1xEVDO_4 Korea PCS 1840 MHz 1750 MHz 1.23 MHz 0 599 1xEVDO_5 NMT-25k-450 460 MHz 450 MHz 1.23 MHz 1 300 1xEVDO_5 NMT-25k-450 421 MHz 411 MHz 1.23 MHz 539 871 1xEVDO_5 NMT-20k-450 461.01 MHz 451.01 MHz 1.23 MHz 1039 1473 1xEVDO_5 NMT-20k-450 489 MHz 479 MHz 1.23 MHz 1792 2016 1xEVDO_6 IMT-2000 2110 MHz 1920 MHz 1.23 MHz 0 1199 1xEVDO_7 N.A. 700 MHz Cell 746 MHz 776 MHz 1.23 MHz 0 359 1xEVDO_8 GSM Band 1805 MHz 1710 MHz 1.23 MHz 0 1499 1xEVDO_9 GSM Band 925 MHz 880 MHz 1.23 MHz 0 699 1xEVDO-10 SMR 800 Band 851 MHz 806 MHz 1.23 MHz 0 719 1xEVDO-10 SMR 800 Band 935 MHz 896 MHz 1.23 MHz 720 919 1xEVDO-11 400 PAMR Band 460 MHz 450 MHz 1.23 MHz 1 400 1xEVDO-11 400 PAMR Band 420 MHz 410 MHz 1.23 MHz 472 871 1xEVDO-11 400 PAMR Band 489 MHz 479 MHz 1.23 MHz 1536 1715 TD-SCDMA (A Band) 1900.8 MHz 1900.8 MHz 1.6 MHz 9504 9596 TD-SCDMA (A Band) 2010.8 MHz 2010.8 MHz 1.6 MHz 10054 10121 TD-SCDMA (B Band) 1850.8 MHz 1850.8 MHz 1.6 MHz 9254 9546 TD-SCDMA (B Band) 1930.8 MHz 1930.8 MHz 1.6 MHz 9654 9946 TD-SCDMA (C Band) 1910.8 MHz 1910.8 MHz 1.6 MHz 9554 9646 TD-SCDMA (D Band) 2570.8 MHz 2570.8 MHz 1.6 MHz 12854 13096 TD-SCDMA (E Band) 2300.8 MHz 2300.8 MHz 1.6 MHz 11504 11996 iDEN_1 800 MHz (Standard) 851 MHz 806 MHz 25 kHz 1 1199 iDEN_2 800 MHz (Extended) 851 MHz 806 MHz 25 kHz 1 1519 iDEN_4 900 MHz 935.00625 MHz 896.00625 MHz 25 kHz 1 398 iDEN_5 1.5 GHz 1501 MHz 1453 MHz 25 kHz 1 479 LTE Band-1 2110 MHz 1920 MHz 1.4 MHz to 20 MHz 0 599 LTE Band-2 1930 MHz 1850 MHz 1.4 MHz to 20 MHz 600 1199 LTE Band-3 1805 MHz 1710 MHz 1.4 MHz to 20 MHz 1200 1949 LTE Band-4 2110 MHz 1710 MHz 1.4 MHz to 20 MHz 1950 2399 LTE Band-5 869 MHz 824 MHz 1.4 MHz to 20 MHz 2400 2649 LTE Band-6 875 MHz 830 MHz 1.4 MHz to 20 MHz 2650 2749 LTE Band-7 2620 MHz 2500 MHz 1.4 MHz to 20 MHz 2750 3449 LTE Band-8 925 MHz 880 MHz 1.4 MHz to 20 MHz 3450 3799 LTE Band-9 1844.9 MHz 1749.9 MHz 1.4 MHz to 20 MHz 3800 4149 LTE Band-10 2110 MHz 1710 MHz 1.4 MHz to 20 MHz 4150 4749 LTE Band-11 1475.9 MHz 1427.9 MHz 1.4 MHz to 20 MHz 4750 4999 Rohde & Schwarz R&S®PR100 Radio Interference D etection and Analysis 25 Service name Downlink Uplink Signal bandwidth CH # start CH # stop LTE Band-12 728 MHz 698 MHz 1.4 MHz to 20 MHz 5000 5179 LTE Band-13 746 MHz 777 MHz 1.4 MHz to 20 MHz 5180 5279 LTE Band-14 758 MHz 788 MHz 1.4 MHz to 20 MHz 5280 5379 LTE Band-17 734 MHz 704 MHz 1.4 MHz to 20 MHz 5730 5849 LTE Band-33 1900 MHz 1900 MHz 1.4 MHz to 20 MHz 36000 36199 LTE Band-34 2010 MHz 2010 MHz 1.4 MHz to 20 MHz 36200 36349 LTE Band-35 1850 MHz 1850 MHz 1.4 MHz to 20 MHz 36350 36949 LTE Band-36 1930 MHz 1930 MHz 1.4 MHz to 20 MHz 36950 37549 LTE Band-37 1910 MHz 1910 MHz 1.4 MHz to 20 MHz 37550 37749 LTE Band-38 2570 MHz 2570 MHz 1.4 MHz to 20 MHz 37750 38249 LTE Band-39 1880 MHz 1880 MHz 1.4 MHz to 20 MHz 38250 38649 LTE Band-40 2300 MHz 2300 MHz 1.4 MHz to 20 MHz 38650 39649 WiMAX-1 2300 MHz 2300 MHz 5/8.75/10 MHz WiMAX-2 2305 MHz 2305 MHz 3.5/5/10 MHz WiMAX-2 2345 MHz 2345 MHz 3.5/5/10 MHz WiMAX-3 2496 MHz 2496 MHz 5/10 MHz WiMAX-4 3300 MHz 3300 MHz 5/7/10 MHz WiMAX-5 3400 MHz 3400 MHz 5/7/10 MHz WiMAX-5 3600 MHz 3800 MHz 5/7/10 MHz TETRA-1 336 MHz 300 MHz 25 kHz TETRA-2 360 MHz 350 MHz 25 kHz TETRA-3 390 MHz 380 MHz 25 kHz TETRA-4 395 MHz 385 MHz 25 kHz TETRA-5 420 MHz 410 MHz 25 kHz TETRA-6 425 MHz 415 MHz 25 kHz TETRA-7 460 MHz 450 MHz 25 kHz TETRA-8 465 MHz 455 MHz 25 kHz TETRA-9 851 MHz 806 MHz 25 kHz TETRA-10 915 MHz 870 MHz 25 kHz 26 7.1 ITU ISM bands Frequency range Center frequency Availability 6.765 MHz to 6.795 MHz 6.780 MHz subject to local acceptance 13.553 MHz to 13.567 MHz 13.560 MHz 26.957 MHz to 27.283 MHz 27.120 MHz 40.66 MHz to 40.70 MHz 40.68 MHz 433.05 MHz to 434.79 MHz 433.92 MHz 902 MHz to 928 MHz 915 MHz 2.400 GHz to 2.500 GHz 2.450 GHz 5.725 GHz to 5.875 GHz 5.800 GHz 24 GHz to 24.25 GHz 24.125 GHz region 2 only 61 GHz to 61.5 GHz 61.25 GHz subject to local acceptance 122 GHz to 123 GHz 122.5 GHz subject to local acceptance 244 GHz to 246 GHz 245 GHz subject to local acceptance 7.2 Bluetooth® bands Country Frequency range RF channels Europe, USA 2400 MHz to 2483.5 MHz f = 2402 + k MHz k = 0,...,78 Japan 2471 MHz to 2497 MHz f = 2473 + k MHz k = 0,...,22 Spain 2445 MHz to 2475 MHz f = 2449 + k MHz k = 0,...,22 France 2446.5 MHz to 2483.5 MHz f = 2454 + k MHz k = 0,...,22 Rohde & Schwarz R&S®PR100 Radio Interference D etection and Analysis 27 7.3 WLAN channels, 2.4 GHz band Channel Frequency 1 2412 MHz 2 2417 MHz 3 2422 MHz 4 2427 MHz 5 2432 MHz 6 2437 MHz 7 2442 MHz 8 2447 MHz 9 2452 MHz 10 2457 MHz 11 2462 MHz 12 2467 MHz 13 2472 MHz 14 2484 MHz 28 FCC ● ● ● ● ● ● ● ● ● ● ● ● Canada ● ● ● ● ● ● ● ● ● ● ● ETSI ● ● ● ● ● ● ● ● ● ● ● ● ● Spain France ● ● ● ● ● ● Japan ● ● ● ● ● ● ● ● ● ● ● ● ● ● R&S®FSHx, R&S®TSMx, R&S®ROMES The R&S®FSHView software allows the remote, long-term monitoring of RFI. Ask your local sales representative for a demo. Rohde & Schwarz offers sophisticated coverage and drive test systems for scanning 2G, 3G, WiMAX™ and LTE networks (e.g. the R&S®TSMx scanners and the R&S®ROMES drive test software). RFI internal signals are often generated due to faulty base station system components such as defective non-linear amplifiers as well as cable faults and antenna problems. A scanner is used together with a test mobile phone to perform network quality and KPI analyses, including full layer-3 r eports for voice, data and video. Rohde & Schwarz offers the R&S®FSH4 or R&S®FSH8 handheld spectrum analyzers with full two-port scalar/vector network analysis capability. Featuring built-in DTF, power measurements and 3G code domain analyses, they are the ideal solution for fast and accurate measurements. These handheld spectrum analyzers can be remotely controlled via a USB or Ethernet interface. The results are displayed on a city map or listed together with the route track information to enable the user to determine coverage gaps, poor handover areas and faulty cell planning, for instance. The operating time on a single battery is approximately four hours. Features such as SD card storage, display snapshot function and user profile GUI provide flexible control of the instrument. Ready for base station installation and maintenance; up to 8 GHz spectrum analysis and vector network analysis. Rohde & Schwarz R&S®PR100 Radio Interference D etection and Analysis 29 A light version, running on a Symbian OS-based phone, measures all necessary air interface parameters. JJ Autonomous 3GPP walk test system for indoor and outdoor applications JJ With external (Bluetooth®) or built-in GPS (N95 only) JJ Low investment costs (CAPEX); additional control software for standard test mobile phones JJ Easy operation (measurement ON, measurement OFF) JJ Flexible handling of task files (GSM, GPRS, EDGE, WCDMA, HSDPA) JJ Storage of measurement data on the test mobile phone as well as data transmission to an FTP server or via USB cable JJ User-definable input frequency range from 30 MHz to 6 GHz JJ Two independent RF and signal processing paths, each with a bandwidth of 20 MHz JJ Integrated preselection for high intermodulation suppression while dynamic range is high JJ Support of WiMAX™ IEEE 802.16e measurements together with the R&S®ROMES drive test software (R&S®TSMW-K28) JJ I/Q baseband measurement with Gigabit interface (R&S®TSMW-K1) JJ Future-ready software-defined architecture JJ Integrated GPS Fully configurable via the R&S®FSHView software, remote control via Ethernet. 30 Ordering information Designation Base unit Portable Receiver Software options Panorama Scan Internal Recording Remote Control Field Strength Measurement Accessories Battery Pack Suitcase Kit Carrying Holster Soft Carrying Bag 12 V Car Adapter Recommended extras Active Directional Antenna HF Option for Portable Directional Antenna Type Order No. R&S®PR100 4071.9006.02 R&S®PR100-PS R&S®PR100-IR R&S®PR100-Control R&S®PR100-FS 4071.9306.02 4071.9358.02 4071.9406.02 4071.9506.02 R&S®PR100-BP R&S®PR100-SC R&S®HA-Z222 R&S®HA-Z220 R&S®HA-Z202 4071.9206.02 4071.9258.02 1309.6198.00 1309.6175.00 1309.6117.00 R&S®HE300 R&S®HE300HF 4067.5900.02 4067.6806.02 For additional information about antennas, receivers, spectrum analyzers and field strength measurement equipment, visit Rohde & Schwarz on the Internet at www.rohde-schwarz.com. Rohde & Schwarz offers complete solutions for field strength and power measurements for a variety of applications. CDMA2000® is a registered trademark of the Telecommunications Industry Association (TIA – USA). The Bluetooth® word mark and logos are registered trademarks owned by Bluetooth SIG, Inc. and any use of such marks by Rohde & Schwarz is under license. “WiMAX Forum“ is a registered trademark of the WiMAX Forum. “WiMAX,“ the WiMAX Forum logo, “WiMAX Forum Certified,“ and the WiMAX Forum Certified logo are trademarks of the WiMAX Forum. Rohde & Schwarz R&S®PR100 Radio Interference D etection and Analysis 31 Rohde & Schwarz GmbH & Co. KG Europe, Africa, Middle East +49 89 4129 137 74 [email protected] North America 1 888 TEST RSA (1 888 837 8772) R&S® is a registered trademark of Rohde & Schwarz GmbH & Co. KG [email protected] Trade names are trademarks of the owners | Printed in Germany (kr/sk) Latin America +1 410 910 7988 | [email protected] R&S®PR100 | PD 5213.9870.92 | Version 01.00 | November 2009 Asia/Pacific +65 65 13 04 88 | [email protected] Data without tolerance limits is not binding | Subject to change www.rohde-schwarz.com © 2009 Rohde & Schwarz GmbH Co. KG | 81671 München, Germany