1
Intel® Dialogic® System Software
Diagnostics Guide
September 2006
05-1935-007
INFORMATION IN THIS DOCUMENT IS PROVIDED IN CONNECTION WITH INTEL® PRODUCTS. NO LICENSE, EXPRESS OR IMPLIED, BY
ESTOPPEL OR OTHERWISE, TO ANY INTELLECTUAL PROPERTY RIGHTS IS GRANTED BY THIS DOCUMENT. EXCEPT AS PROVIDED IN
INTEL'S TERMS AND CONDITIONS OF SALE FOR SUCH PRODUCTS, INTEL ASSUMES NO LIABILITY WHATSOEVER, AND INTEL DISCLAIMS
ANY EXPRESS OR IMPLIED WARRANTY, RELATING TO SALE AND/OR USE OF INTEL PRODUCTS INCLUDING LIABILITY OR WARRANTIES
RELATING TO FITNESS FOR A PARTICULAR PURPOSE, MERCHANTABILITY, OR INFRINGEMENT OF ANY PATENT, COPYRIGHT OR OTHER
INTELLECTUAL PROPERTY RIGHT. Intel products are not intended for use in medical, life saving, life sustaining, critical control or safety systems, or
nuclear facility applications.
Intel may make changes to specifications and product descriptions at any time, without notice.
This Intel® Dialogic® System Software Diagnostics Guide as well as the software described in it is furnished under license and may only be used or
copied in accordance with the terms of the license. The information in this manual is furnished for informational use only, is subject to change without
notice, and should not be construed as a commitment by Intel Corporation. Intel Corporation assumes no responsibility or liability for any errors or
inaccuracies that may appear in this document or any software that may be provided in association with this document.
Except as permitted by such license, no part of this document may be reproduced, stored in a retrieval system, or transmitted in any form or by any
means without the express written consent of Intel Corporation.
Copyright © 2002-2006, Intel Corporation
Dialogic, Intel, Intel logo, and Intel NetStructure are trademarks or registered trademarks of Intel Corporation or its subsidiaries in the United States
and other countries.
* Other names and brands may be claimed as the property of others.
Publication Date: September 2006
Document Number: 05-1935-007
Intel
1515 Route 10
Parsippany, NJ 07054
For Technical Support, visit the Intel Telecom Support Resources website at:
http://developer.intel.com/design/telecom/support
For Products and Services Information, visit the Intel Telecom and Compute Products website at:
http://www.intel.com/design/network/products/telecom
For Sales Offices and other contact information, visit the Buy Telecom Products page at:
http://www.intel.com/buy/networking/telecom.htm
System Software Diagnostics Guide – September 2006
Contents
Revision History . . . . . . . . . . . . . . . . . . . . . . . . . . . . . . . . . . . . . . . . . . . . . . . . . . . . . . . . . . . . . 11
About This Publication . . . . . . . . . . . . . . . . . . . . . . . . . . . . . . . . . . . . . . . . . . . . . . . . . . . . . . . 13
1
Diagnostics Overview . . . . . . . . . . . . . . . . . . . . . . . . . . . . . . . . . . . . . . . . . . . . . . . . . . . . . . . . 17
1.1
1.2
1.3
2
System Requirements . . . . . . . . . . . . . . . . . . . . . . . . . . . . . . . . . . . . . . . . . . . . . . . . . . . . . . . . 21
2.1
2.2
3
27
27
28
28
28
29
Preparation . . . . . . . . . . . . . . . . . . . . . . . . . . . . . . . . . . . . . . . . . . . . . . . . . . . . . . . . . . . . 31
Monitoring the Signal . . . . . . . . . . . . . . . . . . . . . . . . . . . . . . . . . . . . . . . . . . . . . . . . . . . . . 31
Monitoring the Status of Alarms. . . . . . . . . . . . . . . . . . . . . . . . . . . . . . . . . . . . . . . . . . . . . 33
Preparation . . . . . . . . . . . . . . . . . . . . . . . . . . . . . . . . . . . . . . . . . . . . . . . . . . . . . . . . . . . . 35
Checking the Protocol Configuration . . . . . . . . . . . . . . . . . . . . . . . . . . . . . . . . . . . . . . . . . 35
Debugging Software. . . . . . . . . . . . . . . . . . . . . . . . . . . . . . . . . . . . . . . . . . . . . . . . . . . . . . . . . . 41
7.1
7.2
7.3
8
Preparations . . . . . . . . . . . . . . . . . . . . . . . . . . . . . . . . . . . . . . . . . . . . . . . . . . . . . . . . . . .
Checking an Individual Board . . . . . . . . . . . . . . . . . . . . . . . . . . . . . . . . . . . . . . . . . . . . . .
Checking all the Boards in a System . . . . . . . . . . . . . . . . . . . . . . . . . . . . . . . . . . . . . . . . .
Unsupported Boards . . . . . . . . . . . . . . . . . . . . . . . . . . . . . . . . . . . . . . . . . . . . . . . . . . . . .
Tracing Firmware . . . . . . . . . . . . . . . . . . . . . . . . . . . . . . . . . . . . . . . . . . . . . . . . . . . . . . . .
Diagnosing a Control Processor or Signal Processor Fault on a Board . . . . . . . . . . . . . .
Diagnosing PSTN Protocol Issues . . . . . . . . . . . . . . . . . . . . . . . . . . . . . . . . . . . . . . . . . . . . . . 35
6.1
6.2
7
23
23
24
24
24
Diagnosing First Call Issues . . . . . . . . . . . . . . . . . . . . . . . . . . . . . . . . . . . . . . . . . . . . . . . . . . . 31
5.1
5.2
5.3
6
Starting the DMC . . . . . . . . . . . . . . . . . . . . . . . . . . . . . . . . . . . . . . . . . . . . . . . . . . . . . . . .
Launching a Diagnostic Tool . . . . . . . . . . . . . . . . . . . . . . . . . . . . . . . . . . . . . . . . . . . . . . .
Launching a Diagnostic Tool on a Remote Machine . . . . . . . . . . . . . . . . . . . . . . . . . . . . .
Viewing a Log File . . . . . . . . . . . . . . . . . . . . . . . . . . . . . . . . . . . . . . . . . . . . . . . . . . . . . . .
Specifying a Different Location for Log Files . . . . . . . . . . . . . . . . . . . . . . . . . . . . . . . . . . .
Checking DM3 Architecture Boards . . . . . . . . . . . . . . . . . . . . . . . . . . . . . . . . . . . . . . . . . . . . . 27
4.1
4.2
4.3
4.4
4.5
4.6
5
Hardware Requirements . . . . . . . . . . . . . . . . . . . . . . . . . . . . . . . . . . . . . . . . . . . . . . . . . . 21
Software Requirements . . . . . . . . . . . . . . . . . . . . . . . . . . . . . . . . . . . . . . . . . . . . . . . . . . . 21
Using the Diagnostics Management Console (DMC) . . . . . . . . . . . . . . . . . . . . . . . . . . . . . . . 23
3.1
3.2
3.3
3.4
3.5
4
Diagnostics Management Console (DMC) . . . . . . . . . . . . . . . . . . . . . . . . . . . . . . . . . . . . 17
Common Diagnostic Tasks . . . . . . . . . . . . . . . . . . . . . . . . . . . . . . . . . . . . . . . . . . . . . . . . 17
Tool Classification by Problem Type . . . . . . . . . . . . . . . . . . . . . . . . . . . . . . . . . . . . . . . . . 19
Troubleshooting Runtime Issues . . . . . . . . . . . . . . . . . . . . . . . . . . . . . . . . . . . . . . . . . . . . 41
Collecting System Data to Diagnose an Application Failure or Crash . . . . . . . . . . . . . . . . 44
Creating a System Configuration Archive . . . . . . . . . . . . . . . . . . . . . . . . . . . . . . . . . . . . . 44
Tracing CAS Signaling Using Global Call . . . . . . . . . . . . . . . . . . . . . . . . . . . . . . . . . . . . . . . . 47
8.1
8.2
8.3
Introduction . . . . . . . . . . . . . . . . . . . . . . . . . . . . . . . . . . . . . . . . . . . . . . . . . . . . . . . . . . . . 47
Requirements and Restrictions . . . . . . . . . . . . . . . . . . . . . . . . . . . . . . . . . . . . . . . . . . . . . 48
Enabling Tracing Using gc_StartTrace( ) . . . . . . . . . . . . . . . . . . . . . . . . . . . . . . . . . . . . 48
System Software Diagnostics Guide – September 2006
3
Contents
8.4
8.5
8.6
9
Tracing Multiple ISDN Trunks Using Global Call . . . . . . . . . . . . . . . . . . . . . . . . . . . . . . . . . . . 55
9.1
9.2
9.3
9.4
9.5
9.6
10
Description . . . . . . . . . . . . . . . . . . . . . . . . . . . . . . . . . . . . . . . . . . . . . . . . . . . . . . . . . . . . . 71
Guidelines. . . . . . . . . . . . . . . . . . . . . . . . . . . . . . . . . . . . . . . . . . . . . . . . . . . . . . . . . . . . . . 72
DMC Main Window . . . . . . . . . . . . . . . . . . . . . . . . . . . . . . . . . . . . . . . . . . . . . . . . . . . . . . . 72
DMC Configuration Dialog . . . . . . . . . . . . . . . . . . . . . . . . . . . . . . . . . . . . . . . . . . . . . . . . . 74
DigitDetector Reference . . . . . . . . . . . . . . . . . . . . . . . . . . . . . . . . . . . . . . . . . . . . . . . . . . . . . . . 77
14.1
14.2
14.3
15
Description . . . . . . . . . . . . . . . . . . . . . . . . . . . . . . . . . . . . . . . . . . . . . . . . . . . . . . . . . . . . . 69
Guidelines. . . . . . . . . . . . . . . . . . . . . . . . . . . . . . . . . . . . . . . . . . . . . . . . . . . . . . . . . . . . . . 69
Command Line Options . . . . . . . . . . . . . . . . . . . . . . . . . . . . . . . . . . . . . . . . . . . . . . . . . . . 69
Additional Configuration Options . . . . . . . . . . . . . . . . . . . . . . . . . . . . . . . . . . . . . . . . . . . . 70
Diagnostics Management Console (DMC) Reference . . . . . . . . . . . . . . . . . . . . . . . . . . . . . . . 71
13.1
13.2
13.3
13.4
14
Description . . . . . . . . . . . . . . . . . . . . . . . . . . . . . . . . . . . . . . . . . . . . . . . . . . . . . . . . . . . . . 65
Guidelines. . . . . . . . . . . . . . . . . . . . . . . . . . . . . . . . . . . . . . . . . . . . . . . . . . . . . . . . . . . . . . 65
Options . . . . . . . . . . . . . . . . . . . . . . . . . . . . . . . . . . . . . . . . . . . . . . . . . . . . . . . . . . . . . . . . 65
DebugAngel Reference . . . . . . . . . . . . . . . . . . . . . . . . . . . . . . . . . . . . . . . . . . . . . . . . . . . . . . . . 69
12.1
12.2
12.3
12.4
13
Description . . . . . . . . . . . . . . . . . . . . . . . . . . . . . . . . . . . . . . . . . . . . . . . . . . . . . . . . . . . . . 63
Guidelines. . . . . . . . . . . . . . . . . . . . . . . . . . . . . . . . . . . . . . . . . . . . . . . . . . . . . . . . . . . . . . 63
Options . . . . . . . . . . . . . . . . . . . . . . . . . . . . . . . . . . . . . . . . . . . . . . . . . . . . . . . . . . . . . . . . 64
CAS Trace Reference . . . . . . . . . . . . . . . . . . . . . . . . . . . . . . . . . . . . . . . . . . . . . . . . . . . . . . . . . 65
11.1
11.2
11.3
12
Introduction . . . . . . . . . . . . . . . . . . . . . . . . . . . . . . . . . . . . . . . . . . . . . . . . . . . . . . . . . . . . . 55
Requirements . . . . . . . . . . . . . . . . . . . . . . . . . . . . . . . . . . . . . . . . . . . . . . . . . . . . . . . . . . . 56
Enabling Tracing Using gc_StartTrace( ). . . . . . . . . . . . . . . . . . . . . . . . . . . . . . . . . . . . . 56
Disabling Tracing Using gc_StopTrace( ) . . . . . . . . . . . . . . . . . . . . . . . . . . . . . . . . . . . . . . 57
Reporting Trace Data via GCEV_TRACEDATA. . . . . . . . . . . . . . . . . . . . . . . . . . . . . . . . . 58
Setting the Trace Queue Size Using gc_SetConfigData( ). . . . . . . . . . . . . . . . . . . . . . . . . 60
CallInfo Reference . . . . . . . . . . . . . . . . . . . . . . . . . . . . . . . . . . . . . . . . . . . . . . . . . . . . . . . . . . . . 63
10.1
10.2
10.3
11
Disabling Tracing Using gc_StopTrace( ) . . . . . . . . . . . . . . . . . . . . . . . . . . . . . . . . . . . . . . 49
Reporting Trace Data via GCEV_TRACEDATA. . . . . . . . . . . . . . . . . . . . . . . . . . . . . . . . . 50
Setting the Trace Queue Size Using gc_SetConfigData( ). . . . . . . . . . . . . . . . . . . . . . . . . 52
Description . . . . . . . . . . . . . . . . . . . . . . . . . . . . . . . . . . . . . . . . . . . . . . . . . . . . . . . . . . . . . 77
Guidelines. . . . . . . . . . . . . . . . . . . . . . . . . . . . . . . . . . . . . . . . . . . . . . . . . . . . . . . . . . . . . . 77
Options . . . . . . . . . . . . . . . . . . . . . . . . . . . . . . . . . . . . . . . . . . . . . . . . . . . . . . . . . . . . . . . . 77
Dlgsnapshot Reference . . . . . . . . . . . . . . . . . . . . . . . . . . . . . . . . . . . . . . . . . . . . . . . . . . . . . . . 79
15.1
15.2
15.3
Description . . . . . . . . . . . . . . . . . . . . . . . . . . . . . . . . . . . . . . . . . . . . . . . . . . . . . . . . . . . . . 79
Guidelines. . . . . . . . . . . . . . . . . . . . . . . . . . . . . . . . . . . . . . . . . . . . . . . . . . . . . . . . . . . . . . 79
Options . . . . . . . . . . . . . . . . . . . . . . . . . . . . . . . . . . . . . . . . . . . . . . . . . . . . . . . . . . . . . . . . 80
16
DM3Insight Reference. . . . . . . . . . . . . . . . . . . . . . . . . . . . . . . . . . . . . . . . . . . . . . . . . . . . . . . . . 83
17
DM3post Reference . . . . . . . . . . . . . . . . . . . . . . . . . . . . . . . . . . . . . . . . . . . . . . . . . . . . . . . . . . . 85
17.1
17.2
17.3
18
4
Description . . . . . . . . . . . . . . . . . . . . . . . . . . . . . . . . . . . . . . . . . . . . . . . . . . . . . . . . . . . . . 85
Guidelines. . . . . . . . . . . . . . . . . . . . . . . . . . . . . . . . . . . . . . . . . . . . . . . . . . . . . . . . . . . . . . 85
Options . . . . . . . . . . . . . . . . . . . . . . . . . . . . . . . . . . . . . . . . . . . . . . . . . . . . . . . . . . . . . . . . 86
GCEV_TRACEDATA Reference . . . . . . . . . . . . . . . . . . . . . . . . . . . . . . . . . . . . . . . . . . . . . . . . . 89
System Software Diagnostics Guide – September 2006
Contents
18.1
18.2
18.3
18.4
18.5
18.6
19
Getver Reference . . . . . . . . . . . . . . . . . . . . . . . . . . . . . . . . . . . . . . . . . . . . . . . . . . . . . . . . . . . 103
19.1
19.2
19.3
20
Description. . . . . . . . . . . . . . . . . . . . . . . . . . . . . . . . . . . . . . . . . . . . . . . . . . . . . . . . . . . . 115
Guidelines . . . . . . . . . . . . . . . . . . . . . . . . . . . . . . . . . . . . . . . . . . . . . . . . . . . . . . . . . . . . 115
Options . . . . . . . . . . . . . . . . . . . . . . . . . . . . . . . . . . . . . . . . . . . . . . . . . . . . . . . . . . . . . . 119
Description. . . . . . . . . . . . . . . . . . . . . . . . . . . . . . . . . . . . . . . . . . . . . . . . . . . . . . . . . . . .
Guidelines . . . . . . . . . . . . . . . . . . . . . . . . . . . . . . . . . . . . . . . . . . . . . . . . . . . . . . . . . . . .
Options . . . . . . . . . . . . . . . . . . . . . . . . . . . . . . . . . . . . . . . . . . . . . . . . . . . . . . . . . . . . . .
Sample Scenarios . . . . . . . . . . . . . . . . . . . . . . . . . . . . . . . . . . . . . . . . . . . . . . . . . . . . . .
121
121
122
122
Phone Reference . . . . . . . . . . . . . . . . . . . . . . . . . . . . . . . . . . . . . . . . . . . . . . . . . . . . . . . . . . . 125
25.1
25.2
25.3
26
Description. . . . . . . . . . . . . . . . . . . . . . . . . . . . . . . . . . . . . . . . . . . . . . . . . . . . . . . . . . . . 113
Options . . . . . . . . . . . . . . . . . . . . . . . . . . . . . . . . . . . . . . . . . . . . . . . . . . . . . . . . . . . . . . 113
PDK Trace Reference . . . . . . . . . . . . . . . . . . . . . . . . . . . . . . . . . . . . . . . . . . . . . . . . . . . . . . . . 121
24.1
24.2
24.3
24.4
25
107
107
108
108
110
MercMon Reference . . . . . . . . . . . . . . . . . . . . . . . . . . . . . . . . . . . . . . . . . . . . . . . . . . . . . . . . . 115
23.1
23.2
23.3
24
Description. . . . . . . . . . . . . . . . . . . . . . . . . . . . . . . . . . . . . . . . . . . . . . . . . . . . . . . . . . . .
Command Line Interface . . . . . . . . . . . . . . . . . . . . . . . . . . . . . . . . . . . . . . . . . . . . . . . . .
Graphical User Interface (Windows only) . . . . . . . . . . . . . . . . . . . . . . . . . . . . . . . . . . . .
Information Collected by its_sysinfo . . . . . . . . . . . . . . . . . . . . . . . . . . . . . . . . . . . . . . . .
System Information Data Structuring . . . . . . . . . . . . . . . . . . . . . . . . . . . . . . . . . . . . . . . .
KernelVer Reference . . . . . . . . . . . . . . . . . . . . . . . . . . . . . . . . . . . . . . . . . . . . . . . . . . . . . . . . 113
22.1
22.2
23
Description. . . . . . . . . . . . . . . . . . . . . . . . . . . . . . . . . . . . . . . . . . . . . . . . . . . . . . . . . . . . 105
Guidelines . . . . . . . . . . . . . . . . . . . . . . . . . . . . . . . . . . . . . . . . . . . . . . . . . . . . . . . . . . . . 105
Options . . . . . . . . . . . . . . . . . . . . . . . . . . . . . . . . . . . . . . . . . . . . . . . . . . . . . . . . . . . . . . 105
Intel Telecom Subsystem Summary Tool Reference . . . . . . . . . . . . . . . . . . . . . . . . . . . . . . 107
21.1
21.2
21.3
21.4
21.5
22
Description. . . . . . . . . . . . . . . . . . . . . . . . . . . . . . . . . . . . . . . . . . . . . . . . . . . . . . . . . . . . 103
Options . . . . . . . . . . . . . . . . . . . . . . . . . . . . . . . . . . . . . . . . . . . . . . . . . . . . . . . . . . . . . . 103
Output . . . . . . . . . . . . . . . . . . . . . . . . . . . . . . . . . . . . . . . . . . . . . . . . . . . . . . . . . . . . . . . 104
ISDN Trace Reference . . . . . . . . . . . . . . . . . . . . . . . . . . . . . . . . . . . . . . . . . . . . . . . . . . . . . . . 105
20.1
20.2
20.3
21
Description. . . . . . . . . . . . . . . . . . . . . . . . . . . . . . . . . . . . . . . . . . . . . . . . . . . . . . . . . . . . . 89
Structure of Data - Tracing CAS Signaling . . . . . . . . . . . . . . . . . . . . . . . . . . . . . . . . . . . . 89
Structure of Data - Tracing ISDN Trunks . . . . . . . . . . . . . . . . . . . . . . . . . . . . . . . . . . . . . . 91
Payload Formats . . . . . . . . . . . . . . . . . . . . . . . . . . . . . . . . . . . . . . . . . . . . . . . . . . . . . . . . 91
Sample Parser . . . . . . . . . . . . . . . . . . . . . . . . . . . . . . . . . . . . . . . . . . . . . . . . . . . . . . . . . . 94
Sample Parser Output . . . . . . . . . . . . . . . . . . . . . . . . . . . . . . . . . . . . . . . . . . . . . . . . . . . 102
Description. . . . . . . . . . . . . . . . . . . . . . . . . . . . . . . . . . . . . . . . . . . . . . . . . . . . . . . . . . . . 125
Guidelines . . . . . . . . . . . . . . . . . . . . . . . . . . . . . . . . . . . . . . . . . . . . . . . . . . . . . . . . . . . . 125
Options . . . . . . . . . . . . . . . . . . . . . . . . . . . . . . . . . . . . . . . . . . . . . . . . . . . . . . . . . . . . . . 125
PSTN Diagnostics Tool Reference . . . . . . . . . . . . . . . . . . . . . . . . . . . . . . . . . . . . . . . . . . . . . 127
26.1
26.2
26.3
26.4
26.5
26.6
Description. . . . . . . . . . . . . . . . . . . . . . . . . . . . . . . . . . . . . . . . . . . . . . . . . . . . . . . . . . . .
Guidelines . . . . . . . . . . . . . . . . . . . . . . . . . . . . . . . . . . . . . . . . . . . . . . . . . . . . . . . . . . . .
Preparing to Run the PSTN Diagnostics Tool . . . . . . . . . . . . . . . . . . . . . . . . . . . . . . . . .
Running the PSTN Diagnostics Tool . . . . . . . . . . . . . . . . . . . . . . . . . . . . . . . . . . . . . . . .
Checking the pstndiag Log File . . . . . . . . . . . . . . . . . . . . . . . . . . . . . . . . . . . . . . . . . . . .
PSTN Diagnostics Menus . . . . . . . . . . . . . . . . . . . . . . . . . . . . . . . . . . . . . . . . . . . . . . . .
System Software Diagnostics Guide – September 2006
127
128
128
128
135
136
5
Contents
26.7
27
QScript Reference . . . . . . . . . . . . . . . . . . . . . . . . . . . . . . . . . . . . . . . . . . . . . . . . . . . . . . . . . . . 139
27.1
27.2
27.3
28
Description . . . . . . . . . . . . . . . . . . . . . . . . . . . . . . . . . . . . . . . . . . . . . . . . . . . . . . . . . . . . 141
Installing RTF . . . . . . . . . . . . . . . . . . . . . . . . . . . . . . . . . . . . . . . . . . . . . . . . . . . . . . . . . . 142
RTF Configuration File . . . . . . . . . . . . . . . . . . . . . . . . . . . . . . . . . . . . . . . . . . . . . . . . . . . 142
Restrictions and Limitations . . . . . . . . . . . . . . . . . . . . . . . . . . . . . . . . . . . . . . . . . . . . . . . 154
rtftool Command . . . . . . . . . . . . . . . . . . . . . . . . . . . . . . . . . . . . . . . . . . . . . . . . . . . . . . . . 156
Example RTF Configuration Files. . . . . . . . . . . . . . . . . . . . . . . . . . . . . . . . . . . . . . . . . . . 157
Configuring Remote RTF Logging . . . . . . . . . . . . . . . . . . . . . . . . . . . . . . . . . . . . . . . . . . 160
RTFManager Reference . . . . . . . . . . . . . . . . . . . . . . . . . . . . . . . . . . . . . . . . . . . . . . . . . . . . . . 163
29.1
29.2
29.3
29.4
29.5
29.6
29.7
29.8
30
Description . . . . . . . . . . . . . . . . . . . . . . . . . . . . . . . . . . . . . . . . . . . . . . . . . . . . . . . . . . . . 139
File Directories . . . . . . . . . . . . . . . . . . . . . . . . . . . . . . . . . . . . . . . . . . . . . . . . . . . . . . . . . 139
QScript Environment Variables. . . . . . . . . . . . . . . . . . . . . . . . . . . . . . . . . . . . . . . . . . . . . 140
Runtime Trace Facility (RTF) Reference . . . . . . . . . . . . . . . . . . . . . . . . . . . . . . . . . . . . . . . . . 141
28.1
28.2
28.3
28.4
28.5
28.6
28.7
29
PSTN Diagnostics Command Line Options . . . . . . . . . . . . . . . . . . . . . . . . . . . . . . . . . . . 137
Description . . . . . . . . . . . . . . . . . . . . . . . . . . . . . . . . . . . . . . . . . . . . . . . . . . . . . . . . . . . . 163
Guidelines. . . . . . . . . . . . . . . . . . . . . . . . . . . . . . . . . . . . . . . . . . . . . . . . . . . . . . . . . . . . . 164
Starting RTFManager . . . . . . . . . . . . . . . . . . . . . . . . . . . . . . . . . . . . . . . . . . . . . . . . . . . . 164
Main Window . . . . . . . . . . . . . . . . . . . . . . . . . . . . . . . . . . . . . . . . . . . . . . . . . . . . . . . . . . 164
General Tab . . . . . . . . . . . . . . . . . . . . . . . . . . . . . . . . . . . . . . . . . . . . . . . . . . . . . . . . . . . 166
Filtering Tab . . . . . . . . . . . . . . . . . . . . . . . . . . . . . . . . . . . . . . . . . . . . . . . . . . . . . . . . . . . 168
Log File Filtering . . . . . . . . . . . . . . . . . . . . . . . . . . . . . . . . . . . . . . . . . . . . . . . . . . . . . . . . 170
Advanced Tab. . . . . . . . . . . . . . . . . . . . . . . . . . . . . . . . . . . . . . . . . . . . . . . . . . . . . . . . . . 171
Status Monitor Reference . . . . . . . . . . . . . . . . . . . . . . . . . . . . . . . . . . . . . . . . . . . . . . . . . . . . . 173
30.1
30.2
30.3
Description . . . . . . . . . . . . . . . . . . . . . . . . . . . . . . . . . . . . . . . . . . . . . . . . . . . . . . . . . . . . 173
Guidelines. . . . . . . . . . . . . . . . . . . . . . . . . . . . . . . . . . . . . . . . . . . . . . . . . . . . . . . . . . . . . 173
Options . . . . . . . . . . . . . . . . . . . . . . . . . . . . . . . . . . . . . . . . . . . . . . . . . . . . . . . . . . . . . . . 173
Glossary . . . . . . . . . . . . . . . . . . . . . . . . . . . . . . . . . . . . . . . . . . . . . . . . . . . . . . . . . . . . . . . . . . . 175
Index . . . . . . . . . . . . . . . . . . . . . . . . . . . . . . . . . . . . . . . . . . . . . . . . . . . . . . . . . . . . . . . . . . . . . . 177
6
System Software Diagnostics Guide – September 2006
Contents
Figures
1
2
3
4
5
6
7
8
9
10
11
12
13
14
15
16
17
18
19
20
21
22
23
PSTN Diagnostics Tool - Board Level View . . . . . . . . . . . . . . . . . . . . . . . . . . . . . . . . . . . . . . . 32
PSTN Diagnostics Tool - Outbound Channel (Upper Pane) & Inbound Channel (Lower Pane) 36
PSTN Diagnostics Tool - Making a Call. . . . . . . . . . . . . . . . . . . . . . . . . . . . . . . . . . . . . . . . . . . 37
PSTN DIagnostics Tool - Call Completed and Released . . . . . . . . . . . . . . . . . . . . . . . . . . . . . 39
DMC Main Window . . . . . . . . . . . . . . . . . . . . . . . . . . . . . . . . . . . . . . . . . . . . . . . . . . . . . . . . . . 72
DMC Configuration Dialog . . . . . . . . . . . . . . . . . . . . . . . . . . . . . . . . . . . . . . . . . . . . . . . . . . . . . 75
PSTN Diagnostics Tool - System Level View . . . . . . . . . . . . . . . . . . . . . . . . . . . . . . . . . . . . . 129
PSTN Diagnostics Tool - View Bar . . . . . . . . . . . . . . . . . . . . . . . . . . . . . . . . . . . . . . . . . . . . . 130
Toggle Command Buttons . . . . . . . . . . . . . . . . . . . . . . . . . . . . . . . . . . . . . . . . . . . . . . . . . . . . 131
Direct Command Buttons. . . . . . . . . . . . . . . . . . . . . . . . . . . . . . . . . . . . . . . . . . . . . . . . . . . . . 131
Channel State Command Buttons . . . . . . . . . . . . . . . . . . . . . . . . . . . . . . . . . . . . . . . . . . . . . . 131
Outbound Call Control Command Buttons . . . . . . . . . . . . . . . . . . . . . . . . . . . . . . . . . . . . . . . 132
Inbound Call Command Buttons . . . . . . . . . . . . . . . . . . . . . . . . . . . . . . . . . . . . . . . . . . . . . . . 132
Call Hold Command Buttons . . . . . . . . . . . . . . . . . . . . . . . . . . . . . . . . . . . . . . . . . . . . . . . . . . 133
Call Transfer Command Buttons . . . . . . . . . . . . . . . . . . . . . . . . . . . . . . . . . . . . . . . . . . . . . . . 134
SendISDN Command Button. . . . . . . . . . . . . . . . . . . . . . . . . . . . . . . . . . . . . . . . . . . . . . . . . . 134
Misc. Commands Buttons . . . . . . . . . . . . . . . . . . . . . . . . . . . . . . . . . . . . . . . . . . . . . . . . . . . . 134
External Application Command Button . . . . . . . . . . . . . . . . . . . . . . . . . . . . . . . . . . . . . . . . . . 135
RTF Configuration File Tag Structure . . . . . . . . . . . . . . . . . . . . . . . . . . . . . . . . . . . . . . . . . . . 143
RTF Configuration File Edited to Configure the Client System . . . . . . . . . . . . . . . . . . . . . . . . 161
RTF Configuration File Edited to Configure the Server System . . . . . . . . . . . . . . . . . . . . . . . 161
RTFManager Filtering Tab. . . . . . . . . . . . . . . . . . . . . . . . . . . . . . . . . . . . . . . . . . . . . . . . . . . . 169
Example of Status Monitor Output. . . . . . . . . . . . . . . . . . . . . . . . . . . . . . . . . . . . . . . . . . . . . . 174
System Software Diagnostics Guide – September 2006
7
Contents
8
System Software Diagnostics Guide – September 2006
Contents
Tables
1
2
3
Structure of Data - Tracing CAS Signaling . . . . . . . . . . . . . . . . . . . . . . . . . . . . . . . . . . . . . . . . 90
Structure of GCEV_TRACEDATA Data for ISDN . . . . . . . . . . . . . . . . . . . . . . . . . . . . . . . . . . . 91
Log Files Archived by its_sysinfo. . . . . . . . . . . . . . . . . . . . . . . . . . . . . . . . . . . . . . . . . . . . . . . 109
System Software Diagnostics Guide – September 2006
9
Contents
10
System Software Diagnostics Guide – September 2006
Revision History
This revision history summarizes the changes made in each published version of this document.
Document No.
Publication Date
Description of Revisions
05-1935-007
September 2006
Diagnostics Overview: Added a new section: Diagnostics Management Console
(DMC).
System Requirements: New chapter. Includes JRE requirement.
Using the Diagnostics Management Console (DMC): New chapter.
Debugging Software: This chapter now includes a new version of Troubleshooting
Runtime Issues that contains an additional procedure for using the RTFManager
GUI.
Diagnostics Management Console (DMC) Reference: New chapter.
RTFManager Reference: New chapter.
Runtime Trace Facility (RTF) Reference: Added a new section: Configuring Remote
RTF Logging.
05-1935-006
April 2006
Getver Reference: Chapter revised to document the new version of this tool.
PDK Trace Reference: In Description, added information about which boards support
the tool.
Phone Reference: Removed reference to Audio Control tool.
QScript Reference: Removed Audio Control tool and CASSignal Editor from the list
of administrative utilities.
Runtime Trace Facility (RTF) Reference: Updated Module Tag section and removed
Table 3 since the most current list of modules is in the RTF configuration file.
Updated module and label names in RTF Configuration File and Example RTF
Configuration Files. Added information to maxbackups. Removed mention of
binary trace output since it is now all text output. Removed the following line
from the RTF configuration file: <!DOCTYPE RTFConfig SYSTEM
"RTFConfig.dtd" >.
Status Monitor Reference: Added an item to Guidelines: tool is not intended for use
with boards that are configured for ISDN.
Intel Telecom Subsystem Summary Tool Reference: Chapter revised to document
the new version of this tool.
05-1935-005
January 2006
Diagnostics Overview: Added reference to CAS and ISDN trace information.
Tracing Multiple ISDN Trunks Using Global Call: New chapter.
GCEV_TRACEDATA Reference: Revised this chapter to include information about
collecting ISDN trace information.
Runtime Trace Facility (RTF) Reference: Updated this chapter to document the new
version of RTF.
System Software Diagnostics Guide — September 2006
11
Revision History
Document No.
Publication Date
Description of Revisions
05-1935-004
September 2005
Checking all the Boards in a System: A new section in Checking DM3 Architecture
Boards.
Tracing CAS Signaling Using Global Call: New chapter.
Unsupported Boards: New section in Checking DM3 Architecture Boards.
DM3post Reference: Added information about the -r (reset) option and about using
DM3post to run POST on a chassis level.
Dlgsnapshot Reference: Description was rewritten because the autodump feature is
no longer enabled by default. Options section revised to include instructions for
enabling autodump.
GCEV_TRACEDATA Reference: New chapter.
Running the PSTN Diagnostics Tool: Expanded Option Buttons and Command
Buttons to list and describe all buttons.
QScript Reference: New chapter.
Runtime Trace Facility (RTF) Reference: Updated to include new Rtftool command,
information about Intel Runtime Tracing Dispatcher service and procedure for
using the Rtftool to export binary trace data into a readable file format.
Glossary: Added this section.
05-1935-003
September 2004
Checking DM3 Architecture Boards: New chapter
Diagnosing First Call Issues: New chapter
Diagnosing PSTN Protocol Issues: New chapter
Debugging Software: New chapter
PSTN Diagnostics Tool Reference: New chapter
Runtime Trace Facility (RTF) Reference: New chapter
Intel Telecom Subsystem Summary Tool Reference: New chapter
DebugView Reference: Removed this chapter
QError Reference: Removed this chapter
StrmStat Reference: Removed this chapter
TSP Config Reference: Removed this chapter
TSP Monitor Reference: Removed this chapter
TSP Tracer Reference: Removed this chapter
05-1935-002
November 2003
Global changes: Removed the chapters about DM3Stderr, DM3Trace, and
DM3Kdebug and all references to these tools.
Diagnostics Overview: Added references to new diagnostic tools.
How to Use This Publication: Updated chapter list to reflect additions and deletions.
CAS Trace Reference: New chapter
DebugAngel Reference: New chapter
Dlgsnapshot Reference: New chapter
PDK Trace Reference: New chapter
Status Monitor Reference: New chapter
TSP Config Reference: New chapter (previously in Administration Guide)
TSP Monitor Reference: New chapter (previously in Administration Guide)
TSP Tracer Reference: New chapter (previously in Administration Guide)
05-1935-001
12
November 2002
Initial version of document. Much of the information contained in this document was
previously contained in the DM3 Diagnostic Utilities Reference Guide, document
number 05-1484-005.
System Software Diagnostics Guide — September 2006
About This Publication
The following topics provide information about this publication:
• Purpose
• Intended Audience
• How to Use This Publication
• Related Information
Purpose
This guide describes the diagnostic tools included with the Intel® Dialogic® System Software
release and explains how to use them.
Intended Audience
This information is intended for:
• Distributors
• System Integrators
• Toolkit Developers
• Independent Software Vendors (ISVs)
• Value Added Resellers (VARs)
• Original Equipment Manufacturers (OEMs)
• End Users
How to Use This Publication
Refer to this document after you have installed the hardware and the Intel Dialogic system software
that includes the diagnostic tools.
The information in this guide is organized as follows:
• Chapter 1, “Diagnostics Overview” provides a brief overview of the diagnostic tools.
• Chapter 2, “System Requirements” lists the hardware and software requirements for using the
diagnostic tools.
System Software Diagnostics Guide — September 2006
13
About This Publication
Each of the following chapters discuss diagnostic tasks. Details about the tool used to perform the
task are provided in the tool reference chapters that follow these task chapters. This information is
cross-referenced between the task and reference chapters.
• Chapter 3, “Using the Diagnostics Management Console (DMC)”
• Chapter 4, “Checking DM3 Architecture Boards”
• Chapter 5, “Diagnosing First Call Issues”
• Chapter 6, “Diagnosing PSTN Protocol Issues”
• Chapter 7, “Debugging Software”
• Chapter 8, “Tracing CAS Signaling Using Global Call”
• Chapter 9, “Tracing Multiple ISDN Trunks Using Global Call”
The remaining chapters provide reference information about the diagnostic tools. The chapters are
organized in alphabetical order:
• Chapter 10, “CallInfo Reference” - The CallInfo tool detects call information using the DM3
board’s Telephony Service Provider (TSP) resource.
• Chapter 11, “CAS Trace Reference”- The CAS Trace tool enables you to track the bit level
transitions on a robbed bit or CAS line.
• Chapter 12, “DebugAngel Reference” - The DebugAngel tool provides low level firmware
tracing to aid in low level debugging.
• Chapter 13, “Diagnostics Management Console (DMC) Reference” - The DMC provides a
single portal from which you can launch diagnostic tools supplied with Intel® telecom
software. The DMC also enables you to locate the log files produced by these tools and view
them with the appropriate viewer.
• Chapter 14, “DigitDetector Reference” - The DigitDetector tool provides the ability to detect
digits at the local end of a channel connection.
• Chapter 15, “Dlgsnapshot Reference” - The dlgsnapshot tool uses Intel Dialogic system
software fault monitoring components to generate a core dump file when a Control Processor
(CP), Signal Processor (SP), or Shared RAM (SRAM) fault is detected on a DM3 board.
• Chapter 16, “DM3Insight Reference” - DM3Insight is a tool used to capture message and
stream traffic from the DM3 board device driver.
• Chapter 17, “DM3post Reference” - The DM3post tool can perform diagnostics on a stopped
board at any time to detect and isolate possible hardware faults. DM3post can also run POST
on the chassis level.
• Chapter 18, “GCEV_TRACEDATA Reference” - This chapter describes the data layout in the
GCEV_TRACEDATA so that a parser can be designed.
• Chapter 19, “Getver Reference” - The getver (Get Version) software application outputs
version information for files that are part of the Intel® Telecom software installation.
• Chapter 20, “ISDN Trace Reference” - The ISDNtrace tool provides the ability to track Layer
3 (Q.931) messages on the ISDN D-channel. ISDNtrace prints messages on the screen in real
time.
• Chapter 21, “Intel Telecom Subsystem Summary Tool Reference” - The Intel® Telecom
Subsystem Summary Tool (its_sysinfo) provides a simple way to collect information about
systems built using Intel telecom products.
14
System Software Diagnostics Guide — September 2006
About This Publication
• Chapter 22, “KernelVer Reference” - TheKernelVer tool can be used to verify whether or not a
processor has crashed.
• Chapter 23, “MercMon Reference” - MercMon provides counter information about DM3
board device drivers (Class Driver and Protocol Drivers).
• Chapter 24, “PDK Trace Reference” - The PDK Trace tool allows those who use a DM3 PDK
protocol to log specific information related to the operation of the protocol.
• Chapter 25, “Phone Reference” - The Phone tool uses the TSC and ToneGen instances and
requires a TSC component. The Phone tool can control a single DM3 resource channel (make
calls, wait for calls etc.), monitor channel and call states, and send call control operations to a
DM3 Global Call resource.
• Chapter 26, “PSTN Diagnostics Tool Reference” - The PSTN Diagnostics tool (pstndiag) is a
utility for diagnosing and troubleshooting public switched telephone network (PSTN)
connectivity problems on specific hardware products based on DM3 architecture.
• Chapter 27, “QScript Reference” - This chapter provides information about QScript utilities,
which are a subset of the diagnostic utilities.
• Chapter 28, “Runtime Trace Facility (RTF) Reference” - The RTF tool provides a mechanism
for tracing the execution path of various Intel Dialogic runtime libraries. The resulting log
file/debug stream output helps troubleshoot runtime issues for applications that are built with
Intel Dialogic software.
• Chapter 29, “RTFManager Reference” - RTFManager is a GUI for the Runtime Trace Facility
(RTF) diagnostic tool. RTF Manager allows you to easily configure logging and tracing levels.
Previously, users had to manually edit the RTF configuration file.
• Chapter 30, “Status Monitor Reference” - The Status Monitor tool enables you to track the
state of the TSC as well as the state of the bits on a robbed bit or CAS line.
Related Information
Refer to the following documents and websites for more information:
• Administration Guide
• SNMP Administration Guide
• Configuration Guide(s)
• Release Guide
• Release Update
• http://developer.intel.com/design/telecom/support/ (for technical support)
• http://www.intel.com/design/network/products/telecom/index.htm (for product information)
System Software Diagnostics Guide — September 2006
15
About This Publication
16
System Software Diagnostics Guide — September 2006
Diagnostics Overview
1.
1
This chapter presents an overview of the diagnostic tools and the debugging/troubleshooting tasks
that can be performed with them. The following topics are included:
• Diagnostics Management Console (DMC) . . . . . . . . . . . . . . . . . . . . . . . . . . . . . . . . . . 17
• Common Diagnostic Tasks . . . . . . . . . . . . . . . . . . . . . . . . . . . . . . . . . . . . . . . . . . . . . . 17
• Tool Classification by Problem Type. . . . . . . . . . . . . . . . . . . . . . . . . . . . . . . . . . . . . . . 19
1.1
Diagnostics Management Console (DMC)
The Diagnostics Management Console (DMC) provides a single portal from which you can launch
all the diagnostic tools supplied with Intel® telecom software. The DMC also enables you to locate
the log files produced by these tools and view them with the appropriate viewer.
The DMC allows you to launch the diagnostic tools remotely through the standard remote control
methods provided with the operating system, such as SSH or Remote Desktop.
For more information about the DMC, refer to the following chapters:
• Chapter 3, “Using the Diagnostics Management Console (DMC)”
• Chapter 13, “Diagnostics Management Console (DMC) Reference”
1.2
Common Diagnostic Tasks
This section provides a list of diagnostic tasks that can be performed by using the various
diagnostics tools. Another way to find the tool and procedure you need is to look at problem types.
Refer to Section 1.3, “Tool Classification by Problem Type”, on page 19.
Hardware and Firmware Diagnostics
The following tasks can be accomplished using the diagnostic tools:
Checking the hardware
You can use the Dm3post and KernelVer tools to troubleshoot the physical boards in your
system. Refer to these sections of the manual. Refer to the following chapters:
• Chapter 4, “Checking DM3 Architecture Boards”
• Chapter 17, “DM3post Reference”
• Chapter 22, “KernelVer Reference”
Checking the firmware
You can use the DebugAngel, MercMon, and PDK Trace tools to diagnose and trace problems
with a board’s firmware. Refer to the following:
System Software Diagnostics Guide — September 2006
17
Diagnostics Overview
• Section 4.5, “Tracing Firmware”, on page 28
• Chapter 12, “DebugAngel Reference”
• Chapter 23, “MercMon Reference”
• Chapter 24, “PDK Trace Reference”
Diagnosing a Control Processor, Signal Processor or Shared RAM Fault on a Board
You can use the dlgsnapshot tool to capture a core dump when a Control Processor (CP),
Signal Processor (SP), or Shared RAM (SRAM) fault is detected on a DM3 board. Refer to the
following:
• Section 4.6, “Diagnosing a Control Processor or Signal Processor Fault on a Board”, on
page 29
• Chapter 15, “Dlgsnapshot Reference”
Software and Application Diagnostics
The following tasks can be accomplished using the diagnostic tools:
Checking the network connections
You can use the PSTN Diagnostics, Digit Detector, and CallInfo tools to check your board’s
network connections. Refer to the following:
• Chapter 5, “Diagnosing First Call Issues”
• Chapter 26, “PSTN Diagnostics Tool Reference”
• Chapter 10, “CallInfo Reference”
Checking the PSTN protocol configuration
You can use the PSTN Diagnostics tool to check your board’s protocol configuration. Refer to
the following:
• Chapter 6, “Diagnosing PSTN Protocol Issues”
• Chapter 26, “PSTN Diagnostics Tool Reference”
Collecting CAS trace information
Inbound and outbound R2MF tones and CAS bit transitions/states can be traced using existing
Global Call APIs and a Global Call event (GCEV_TRACEDATA). This allows developers to
determine the root cause of protocol issues in a system that uses Intel NetStructure
DMT160TEC digital telephony interface boards. Refer to Chapter 8, “Tracing CAS Signaling
Using Global Call”.
Collecting system data to diagnose an application failure or crash
You can use the Intel Telecom Subsystem Summary Tool (its_sysinfo) to collect the system
data you will need to send to Intel’s Support Services to troubleshoot an application failure or
crash. Refer to the following:
• Section 7.2, “Collecting System Data to Diagnose an Application Failure or Crash”, on
page 44
• Chapter 21, “Intel Telecom Subsystem Summary Tool Reference”
Collecting ISDN trace information
The ISDNtrace tool described in Chapter 20, “ISDN Trace Reference” allows you to perform
tracing on only one trunk. The procedure described in Chapter 9, “Tracing Multiple ISDN
Trunks Using Global Call” allows you to collect ISDN D-channel trace information on two or
more trunks at the same time and the capture of the trace information can be dynamically
18
System Software Diagnostics Guide — September 2006
Diagnostics Overview
started and stopped via Global Call APIs. The trace information collected with this procedure
allows developers to determine the root cause of protocol issues in a system that uses Intel
NetStructure® DMT160TEC or DMN160TEC digital telephony interface boards.
Creating a system configuration archive
As part of a quality control effort, you might want to baseline your systems by retrieving all
available information using the Intel Telecom Subsystem Summary Tool (its_sysinfo). Refer to
the following:
• Section 7.3, “Creating a System Configuration Archive”, on page 44
• Chapter 21, “Intel Telecom Subsystem Summary Tool Reference”
Tracing Intel Dialogic Runtime Libraries
You can use the Runtime Trace Facility (RTF) tool to trace the execution path of various Intel
Dialogic runtime libraries. Refer to the following:
• Section 7.1, “Troubleshooting Runtime Issues”, on page 41
• Chapter 28, “Runtime Trace Facility (RTF) Reference”
• Chapter 29, “RTFManager Reference”
1.3
Tool Classification by Problem Type
This section groups the diagnostic tools by problem type. The list that follows can help you locate
the appropriate tool to use based on the problem you are having:
Board, Firmware, or Hardware Failures
To troubleshoot the physical boards in your system, use the following procedures and tools:
• Section 4.2, “Checking an Individual Board”, on page 27
• Section 4.3, “Checking all the Boards in a System”, on page 28
• Chapter 17, “DM3post Reference”
• Chapter 22, “KernelVer Reference”
To diagnose and trace problems with a board’s firmware, use the following procedures and
tools:
• Section 4.5, “Tracing Firmware”, on page 28
• Chapter 12, “DebugAngel Reference”
• Chapter 23, “MercMon Reference”
To capture a core dump when a Control Processor (CP), Signal Processor (SP), or Shared
RAM (SRAM) fault is detected on a DM3 board, refer to the following procedure and tool:
• Section 4.6, “Diagnosing a Control Processor or Signal Processor Fault on a Board”, on
page 29
• Chapter 15, “Dlgsnapshot Reference”
Debugging Software
You can use the Runtime Trace Facility (RTF) tool and Intel Telecom Subsystem Summary
Tool (its_sysinfo) for some general software debugging. Refer to the following:
• Section 7.1, “Troubleshooting Runtime Issues”, on page 41
• Section 7.2, “Collecting System Data to Diagnose an Application Failure or Crash”, on
page 44
System Software Diagnostics Guide — September 2006
19
Diagnostics Overview
• Section 7.3, “Creating a System Configuration Archive”, on page 44
• Chapter 28, “Runtime Trace Facility (RTF) Reference”
• Chapter 29, “RTFManager Reference”
• Chapter 21, “Intel Telecom Subsystem Summary Tool Reference”
Protocol Issues
Information about for collecting CAS and ISDN trace information is provided in the following
sections:
• Chapter 8, “Tracing CAS Signaling Using Global Call”
• Chapter 9, “Tracing Multiple ISDN Trunks Using Global Call”
• Chapter 18, “GCEV_TRACEDATA Reference”
The trace information collected with these procedures allows developers to determine the root
cause of protocol issues in a system that uses Intel NetStructure® DMT160TEC or
DMN160TEC digital telephony interface boards.
PSTN Connectivity
You can use the PSTN Diagnostics, Digit Detector, and CallInfo tools to check your board’s
network connections. Refer to the following:
• Chapter 5, “Diagnosing First Call Issues”
• Chapter 26, “PSTN Diagnostics Tool Reference”
• Chapter 10, “CallInfo Reference”
PSTN Protocol Debugging
You can use the PSTN Diagnostics tool to check your board’s protocol configuration. Refer to
the following:
• Chapter 6, “Diagnosing PSTN Protocol Issues”
• Chapter 26, “PSTN Diagnostics Tool Reference”
20
System Software Diagnostics Guide — September 2006
System Requirements
2.
2
This chapter provides information about the hardware/software requirements needed to run the
diagnostic tools. Topics include:
• Hardware Requirements . . . . . . . . . . . . . . . . . . . . . . . . . . . . . . . . . . . . . . . . . . . . . . . . 21
• Software Requirements . . . . . . . . . . . . . . . . . . . . . . . . . . . . . . . . . . . . . . . . . . . . . . . . . 21
2.1
Hardware Requirements
To use the diagnostic tools, your system must meet the following hardware requirements:
• Your system must meet the hardware requirements listed in the System Requirements chapter
of the Release Guide for the Intel® Dialogic® system release you are using.
• Your system must have at least one Intel® telecom board supported by the Intel Dialogic
system release you are using.
2.2
Software Requirements
To use the diagnostic tools, your system must meet the following software requirements:
• Your system must meet the software requirements listed in the System Requirements chapter
of the Release Guide for the Intel® Dialogic® system release you are using.
• The Intel Dialogic System Release must be installed on your system.
• Java Runtime Environment (JRE) version 1.5 must be installed on your system.
System Software Diagnostics Guide — September 2006
21
System Requirements
22
System Software Diagnostics Guide — September 2006
Using the Diagnostics
Management Console (DMC)
3.
3
This chapter describes how to use the Diagnostics Management Console (DMC) to launch the
diagnostic tools supplied with Intel® telecom software and view the log files produced by the tools.
The following information is included:
• Launching a Diagnostic Tool. . . . . . . . . . . . . . . . . . . . . . . . . . . . . . . . . . . . . . . . . . . . . 23
• Launching a Diagnostic Tool on a Remote Machine. . . . . . . . . . . . . . . . . . . . . . . . . . . 24
• Viewing a Log File . . . . . . . . . . . . . . . . . . . . . . . . . . . . . . . . . . . . . . . . . . . . . . . . . . . . 24
• Specifying a Different Location for Log Files . . . . . . . . . . . . . . . . . . . . . . . . . . . . . . . 24
For a description of the DMC and its windows and menus, refer to Chapter 13, “Diagnostics
Management Console (DMC) Reference”.
3.1
Starting the DMC
On Windows systems, you can start the DMC via the Start menu: Start > [Intel telecom software
release] > Diagnostics Management Console (DMC). The DMC application can be found in the
bin directory of the installed Intel telecom software.
On Linux systems, you can start the DMC from anywhere since the bin directory is part of the path.
The DMC application (DMC.jar) is the same for both Windows and Linux. You use DMC.bat to
launch the DMC on Windows and dmc.sh to launch the DMC on Linux.
3.2
Launching a Diagnostic Tool
Locate the tool you want in the list of local diagnostic applications (on the left side of the DMC
main window), click on it to highlight it, and then press Enter or select Execute application from
the File menu or press F5. You can also double-click on the tool name to launch it.
The DMC will execute the application via the command shell.
Related information:
• Section 3.3, “Launching a Diagnostic Tool on a Remote Machine”, on page 24
• Section 3.4, “Viewing a Log File”, on page 24
• Section 13.3.3, “Log File Panel”, on page 73
System Software Diagnostics Guide — September 2006
23
Using the Diagnostics Management Console (DMC)
3.3
Launching a Diagnostic Tool on a Remote Machine
To use a diagnostics tool on a remote machine, you must change settings on the DMC
Configuration Dialog.
1. Access the DMC Configuration Dialog by selecting Configuration from the Tools menu or
pressing F4.
2. Check the box next to Remote Execution of CLI Tools.
3. Enter the Remote Machine Name.
4. Enter the Remote Login UserName.
5. In the Remote Tool Path field, specify the path of the diagnostic tool that you will use
remotely via a CLI. You can use the Browse Path button to specify the path.
6. Click OK.
7. Locate the tool you want in the list of remote diagnostic applications (on the left side of the
DMC main window), click on it to highlight it, and then press Enter or select Execute
application from the File menu or press F5. You can also double-click on the tool name to
launch it.
Related information:
• Section 13.4, “DMC Configuration Dialog”, on page 74
• Section 3.2, “Launching a Diagnostic Tool”, on page 23 (local machine)
• Section 3.4, “Viewing a Log File”, on page 24
• Section 13.3.3, “Log File Panel”, on page 73
3.4
Viewing a Log File
To view a log file, locate the file you want in the log file list, click on it to highlight it, and then
press Enter or select Open log file from the File menu or use the CTRL+O shortcut. You can also
double-click on the log file name to view it. The viewer that is associated with a given log file and
located on the local machine will be used to view the log file.
For more information about locating log files and the log file list, refer to Section 13.3.3, “Log File
Panel”, on page 73.
3.5
Specifying a Different Location for Log Files
You can use the Browse button on the log file panel to locate log files. However, if you want to
change the default location in which the DMC will look for log files, you can specify it on the
DMC Configuration Dialog. You can access the DMC Configuration Dialog by selecting
24
System Software Diagnostics Guide — September 2006
Using the Diagnostics Management Console (DMC)
Configuration from the Tools menu or pressing F4. A Browse button allows you to select a
directory for the Log File Directory field.
Note:
If the user-defined variable is empty or not valid, the DMC will use the environment variable set up
during installation of the Intel telecom software: INTEL_DIALOGIC_DIR/log.
For more information about the DMC’s list of log files, refer to Section 13.3.3, “Log File Panel”,
on page 73.
System Software Diagnostics Guide — September 2006
25
Using the Diagnostics Management Console (DMC)
26
System Software Diagnostics Guide — September 2006
Checking DM3 Architecture
Boards
4.
4
This chapter provides procedures for checking the Intel NetStructure® on DM3 architecture
hardware and firmware in your system.
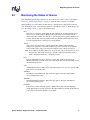
• Preparations . . . . . . . . . . . . . . . . . . . . . . . . . . . . . . . . . . . . . . . . . . . . . . . . . . . . . . . . . . 27
• Checking an Individual Board . . . . . . . . . . . . . . . . . . . . . . . . . . . . . . . . . . . . . . . . . . . . 27
• Checking all the Boards in a System . . . . . . . . . . . . . . . . . . . . . . . . . . . . . . . . . . . . . . . 28
• Unsupported Boards . . . . . . . . . . . . . . . . . . . . . . . . . . . . . . . . . . . . . . . . . . . . . . . . . . . 28
• Tracing Firmware . . . . . . . . . . . . . . . . . . . . . . . . . . . . . . . . . . . . . . . . . . . . . . . . . . . . . 28
• Diagnosing a Control Processor or Signal Processor Fault on a Board . . . . . . . . . . . . 29
4.1
Preparations
To find out which boards are in your system and which slots they are in, on Windows systems you
can use the Configuration Manager (DCM) and on Linux systems you can run ./config.sh to
get the board configuration tool. In both cases, the main menu will provide information about the
boards.
4.2
Checking an Individual Board
This section provides a procedure for using the DM3post tool to check an individual DM3
architecture board at any time to detect and isolate possible hardware faults. For more information
on this tool, refer to Chapter 17, “DM3post Reference”.
To use the DM3post tool to check a DM3 board, follow this procedure:
1. Make sure the board is in a “Stopped” state. This is necessary because DM3post will reset the
specified board, forcing the Control Processor (CP) POST diagnostics to run.
DM3post will then retrieve the POST results from the SRAM and provide a PASS/FAIL
indication. The board will remain in a stopped state and you will be required to restart the
board.
2. Run the DM3post command, specifying the slot and bus number of the board. For example,
the following command runs the DM3post tool on a board in slot 17, bus 0:
dm3post -s17 -b0
System Software Diagnostics Guide — September 2006
27
Checking DM3 Architecture Boards
3. You will get the following response:
Do you wish to continue (y/n)?
If you answer Y, the following will be printed to the screen:
dm3post processing...
The success/failure message will be printed to the screen when POST is complete.
4.3
Checking all the Boards in a System
The DM3post diagnostic utility provides an option to run POST on a chassis level. By using the
chassis option (-c), DM3post will retrieve the results of the last run POST for all DM3 boards in
the chassis. By using the chassis option (-c) with the reset (-r) option, you can run POST on all
DM3 boards in the system.
When using the chassis option, it is not necessary to provide the bus and slot numbers. Any option
other than the reset option will be ignored when using the chassis option.
In addition to output on the screen, more detailed output is logged to a log file, dm3post.log, by
default.
4.4
Unsupported Boards
The Intel® Dialogic® System Release software will not prevent you from installing an unsupported
board. However, the configuration manager will not show any unsupported boards. An error
message about the unsupported board(s) will appear in a log file in the log directory with the
following filename: rtf*.txt (for example, rtflog-10072005-14h47m25.639s.txt). The following is a
sample error message:
10/04 14:55:50.784 1792 1820 OAMSYSLOG ErrorEx
NCMAPI - Board bus-1,
slot-9, model-256, serialNumber-KU005523 is not supported in this release
4.5
Tracing Firmware
This section describes how to use the DebugAngel tool to perform low-level firmware tracing for
low-level debugging. For more information about the DebugAngel tool, refer to Chapter 12,
“DebugAngel Reference”.
DebugAngel polls the DM3 boards in the system and posts qPrintf( ) statements from the
resources and DM3 kernel to a log file.
To use DebugAngel, follow these steps:
1. Install the service and start it running in automatic mode by entering the following command:
DebugAngel -install
28
System Software Diagnostics Guide — September 2006
Checking DM3 Architecture Boards
2. When you need to refer to the firmware trace log, look in the log directory:
• On a Windows system, information is logged to the file DebugAngel.log in the
%INTEL_DIALOGIC_DIR%\log directory.
• On a Linux system, information is logged to the file debugangel.log in the
${INTEL_DIALOGIC_DIR}/log directory.
Command line options and configuration options for DebugAngel are provided in Chapter 12,
“DebugAngel Reference”.
4.6
Diagnosing a Control Processor or Signal
Processor Fault on a Board
This section describes how the Dlgsnapshot tool is used to capture a core dump when a Control
Processor (CP) or Signal Processor (SP) fault is detected on a DM3 board. For details about the
Dlgsnapshot tool, refer to Chapter 15, “Dlgsnapshot Reference”.
When a fault occurs, the board on which the fault occurred is stopped automatically without
interrupting the system and a core dump file is created in the log directory. The naming convention
for this file is described in Chapter 15, “Dlgsnapshot Reference”.
Windows systems: When a core dump file is generated, you can send a .zip file containing the
contents of the %INTEL_DIALOGIC_DIR%\log directory along with the Windows event viewer
system log file (*.evt) to Intel’s telecom support resources for debugging purposes.
Linux systems: When a core dump file is generated, you can send a .tar file containing the
contents of the ${INTEL_DIALOGIC_DIR}/log directory to Intel’s telecom support resources for
debugging purposes.
You can also run the Dlgsnapshot on demand from the command line. You must specify the print
buffer to be dumped. Other command line options include the AUID, processor number, logical ID,
physical slot number, PCI bus number, and PCI slot number. A description of all the command line
options is given in Chapter 15, “Dlgsnapshot Reference”.
When boards are downloaded and you run Dlgsnapshot manually, a question is posed about
running diagnostic firmware. You must confirm that you want Dlgsnapshot to stop the running
board and download diagnostic firmware.
System Software Diagnostics Guide — September 2006
29
Checking DM3 Architecture Boards
30
System Software Diagnostics Guide — September 2006
Diagnosing First Call Issues
5.
5
This chapter describes how to use the PSTN Diagnostics tool (pstndiag) to determine what is
preventing your system from successfully completing the first call.
• Preparation. . . . . . . . . . . . . . . . . . . . . . . . . . . . . . . . . . . . . . . . . . . . . . . . . . . . . . . . . . . 31
• Monitoring the Signal . . . . . . . . . . . . . . . . . . . . . . . . . . . . . . . . . . . . . . . . . . . . . . . . . . 31
• Monitoring the Status of Alarms . . . . . . . . . . . . . . . . . . . . . . . . . . . . . . . . . . . . . . . . . . 33
For more information about the pstndiag tool, refer to Chapter 26, “PSTN Diagnostics Tool
Reference”.
5.1
Preparation
Before you perform the procedures described in this chapter, refer to the following sections:
• Section 26.2, “Guidelines”, on page 128
• Section 26.3, “Preparing to Run the PSTN Diagnostics Tool”, on page 128
• Section 26.4.1, “Starting the PSTN Diagnostics Tool”, on page 128.
The main window displays a tree or hierarchy of the components in your system. Components
include all boards that have been downloaded in the system, all trunks within a board, and all
channels within a trunk.
5.2
Monitoring the Signal
Use the following procedure to verify that a connection exists between your board and the network
(or other device depending on your system setup):
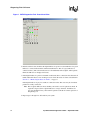
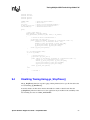
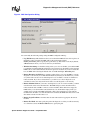
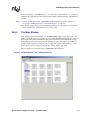
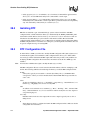
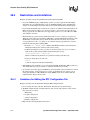
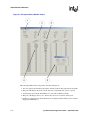
1. On the pstndiag tool’s main window, double-click on a specific board to display the board level
view and check the connection of all trunks on this board. A sample screen is illustrated in
Figure 1.
System Software Diagnostics Guide — September 2006
31
Diagnosing First Call Issues
Figure 1. PSTN Diagnostics Tool - Board Level View
2. In the board level view, check that the Signal indicator is green for each trunk. The color green
indicates a connection between the trunk and another device. The color grey indicates no
connection exists. (The various indicators for each trunk, Red, Yellow, Signal, and Loopback,
mimic the indicators on the physical board.)
3. If the Signal indicator is green for all trunks on the board, then a connection exists between all
trunks and another device. You can then proceed to check the status of alarms as described in
Section 5.3, “Monitoring the Status of Alarms”, on page 33.
If the Signal indicator is grey for a trunk, no connection exists. The cause may be a hardware
problem or a faulty connection.
Note: The Loopback indicator shows whether your board is set for loopback test mode. If
loopback is in place, the Loopback indicator is orange; otherwise, the indicator is
grey. You should not have your board in loopback test mode for normal operation of
the pstndiag tool.
4. Repeat steps 1 through 3 for all boards in your system.
32
System Software Diagnostics Guide — September 2006
Diagnosing First Call Issues
5.3
Monitoring the Status of Alarms
After determining that the Signal indicator for all boards in your system is green as described in
Section 5.2, “Monitoring the Signal”, on page 31, check the status of alarms on each trunk.
On the pstndiag tool’s main window, double-click on a specific board to display the board level
view and check the status of the following alarms on each trunk (see Figure 1, “PSTN Diagnostics
Tool - Board Level View”, on page 32 for an illustration):
Red
Red alarm. A red alarm is generated by the line (trunk) of the board being monitored to
report a loss of synchronization (RLOS) in the signal being received. This alarm is
declared after the condition has existed for a specific time period, typically defined as 2.5
seconds (default). The red alarm condition will exist until the synchronization has been
recovered and remains recovered for 12 seconds (default).
Yellow
Yellow alarm. A yellow alarm is generated by the line (trunk) of the board being
monitored to signify that a red alarm condition exists at the receiving (local) end. The
yellow alarm is sent as long as the red alarm condition exists at the receiver device.
Note: It’s possible for the Signal indicator to be green and a yellow or red alarm to be on at
the same time. This situation indicates a possible configuration problem (such as
trunk configuration mismatch) or hardware problem.
RAI
Remote Alarm Indication. If on, this box is yellow. This alarm is turned on by the
firmware indicating a problem on the remote end. In this situation, the Signal indicator for
the trunk will also be red.
AIS
Alarm Indication Service. This alarm can be turned on by you as a test on a specific trunk.
This alarm is not typically used.
TS16RAI
TS16 Remote Alarm Indication. This alarm only applies to E1 lines with Channel
Associated Signaling (CAS).
TS16AIS
TS16 Alarm Indication Service. This alarm only applies to E1 lines with Channel
Associated Signaling (CAS).
D Channel
D channel state. This alarm only applies to ISDN with Common Channel Signaling
(CCS). If the indicator is green, this means that the D channel is available. If the indicator
is grey, this means that the channel is not available.
System Software Diagnostics Guide — September 2006
33
Diagnosing First Call Issues
34
System Software Diagnostics Guide — September 2006
Diagnosing PSTN Protocol Issues
6.
6
This chapter describes how to check the protocol configuration using the PSTN Diagnostics
(pstndiag) tool.
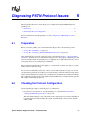
• Preparation. . . . . . . . . . . . . . . . . . . . . . . . . . . . . . . . . . . . . . . . . . . . . . . . . . . . . . . . . . . 35
• Checking the Protocol Configuration . . . . . . . . . . . . . . . . . . . . . . . . . . . . . . . . . . . . . . 35
For more information about the pstndiag tool, refer to Chapter 26, “PSTN Diagnostics Tool
Reference”.
6.1
Preparation
Before you use the pstndiag tool as described in this chapter, refer to the following sections:
• Section 26.2, “Guidelines”, on page 128
• Section 26.3, “Preparing to Run the PSTN Diagnostics Tool”, on page 128
After determining that a network connection exists as described in Chapter 5, “Diagnosing First
Call Issues”, check the protocol configuration. If the protocol is not properly configured, calls will
not be successfully made. To check the protocol configuration, you will make and receive calls on
your system. Protocols are configured on a trunk basis.
The procedure described in this section applies to a system with a loopback test setup or a system
using a network connection setup.
If you can successfully make and receive calls in a system with loopback test setup, you can rule
out any hardware problems. If you then test your system using a network connection setup, and are
unsuccessful in making and receiving calls, you will need to check the board configuration settings.
The configuration settings on the board and the switch should match; for example, the line type, the
line coding, and the signaling protocol.
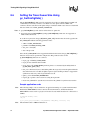
6.2
Checking the Protocol Configuration
Use the following procedure to check the protocol configuration:
1. If you have not already done so, start the pstndiag tool, as described in Section 26.4.1,
“Starting the PSTN Diagnostics Tool”, on page 128.
The main window displays a tree or hierarchy of the components in your system, including all
boards that have been downloaded in the system, all trunks within a board, and all channels
within a trunk.
System Software Diagnostics Guide — September 2006
35
Diagnosing PSTN Protocol Issues
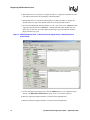
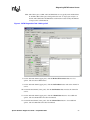
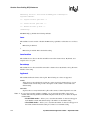
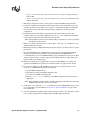
2. Shift-double-click on a channel (for example, Chan 0.1.1) to display the channel in the lower
pane. This channel will be the transmitting (outbound) channel.
3. Shift-double-click on a channel in another trunk (for example, Chan 0.2.1) to display the
channel in the lower pane. This channel will be the receiving (inbound) channel.
4. To view both inbound and outbound channels on your screen, click on the “1 System” button
(upper pane button) and select “Chan 0.1.1” (outbound channel). This channel level view
replaces the system level view and is displayed in the upper pane. The inbound channel is
displayed in the lower pane.
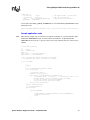
Figure 2. PSTN Diagnostics Tool - Outbound Channel (Upper Pane) & Inbound Channel
(Lower Pane)
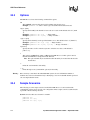
5. For the outbound channel (upper pane), click the CallInfo button to view additional options,
and select the Edit MakeCall Parameters option. A new set of fields is displayed.
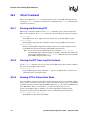
6. Enter the originating telephone number or extension in the OrigAddr field.
7. Enter the destination telephone number or extension in the DestAddr field.
36
System Software Diagnostics Guide — September 2006
Diagnosing PSTN Protocol Issues
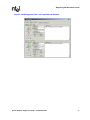
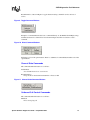
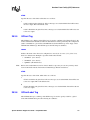
Note: The Call Progress, CallId, and ConCallId fields are not typically used and should not
be modified. The Call Progress field specifies the level of call progress analysis on
the line. The CallId and ConCallId fields contain internal values used by the firmware
to keep track of call information.
Figure 3. PSTN Diagnostics Tool - Making a Call
8. For the outbound channel (upper pane), click the MakeCall Parameters button to view
options, and select the CallInfo button.
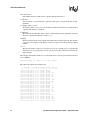
9. For the outbound channel (upper pane), click the SetChanState button and set the channel in
service.
10. For the inbound channel (lower pane), click the SetChanState button and set the channel in
service.
11. For the outbound channel (upper pane), click the Channel State button to view additional
options, and select Outbound Call Control Commands.
12. For the inbound channel (lower pane), click the Channel State button to view additional
options, and select Inbound Call Control Commands.
System Software Diagnostics Guide — September 2006
37
Diagnosing PSTN Protocol Issues
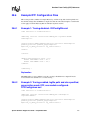
13. Click the MakeCall button to start the call. Notice that the CallInfo fields are updated after a
call is made, enabling you to monitor the state of the call. For example, the Called ID (DNIS)
field shows the telephone number dialed by a caller. The Caller ID (ANI) field shows the
telephone number of the incoming call. Also the CallState field shows the state of the call
(such as Connected or not) and the ChanState field shows the state of the channel (such as
Active or not).
14. For the inbound channel (lower pane), click the Accept button to accept the incoming call.
Notice that the CallState for the inbound channel will show “Accepted.” If the expected state is
not being displayed, it may indicate a protocol configuration problem.
15. For the inbound channel (lower pane), click the Answer button to answer the incoming call.
Notice that the CallState for the inbound channel now shows “Connected.” If the expected
state is not being displayed, it may indicate a protocol configuration problem.
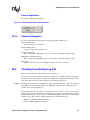
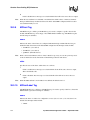
16. After you have verified that a call is successfully made, click the Release button for the
outbound channel to end the call. The CallState for the inbound channel will show
“Disconnected”. The CallState for the outbound channel will not change yet.
17. Click the Release button for the inbound channel to end the call. The CallState for the
outbound and inbound channels will show “Null / Normal”. The ChanState for the outbound
and inbound channels will show “Idle”. If the expected state is not being displayed, it may
indicate a protocol configuration problem.
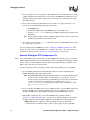
Note: In a channel level view, a log pane is displayed below the Text Log button. This log
pane only displays events for that particular channel. To change the view between text
format and graphical format, click the Text Log button.
38
System Software Diagnostics Guide — September 2006
Diagnosing PSTN Protocol Issues
Figure 4. PSTN DIagnostics Tool - Call Completed and Released
System Software Diagnostics Guide — September 2006
39
Diagnosing PSTN Protocol Issues
40
System Software Diagnostics Guide — September 2006
Debugging Software
7.
7
This chapter provides several procedures that can be useful for general software debugging:
• Troubleshooting Runtime Issues . . . . . . . . . . . . . . . . . . . . . . . . . . . . . . . . . . . . . . . . . . 41
• Collecting System Data to Diagnose an Application Failure or Crash . . . . . . . . . . . . . 44
• Creating a System Configuration Archive. . . . . . . . . . . . . . . . . . . . . . . . . . . . . . . . . . . 44
7.1
Troubleshooting Runtime Issues
This section describes how to use the Runtime Trace Facility (RTF) for tracing the execution path
of various runtime libraries. You can use the RTFManager GUI to customize the trace settings or
you can manually edit the RTF configuration file. Procedures for each of these approaches are
provided in the following sections:
• Using RTFManager to Customize Trace Settings
• Manually Editing the RTF Configuration File
Using RTFManager to Customize Trace Settings
You can use the RTFManager GUI to customize and activate the RTF’s tracing capabilities as
follows:
1. Start RTFManager:
• On Windows systems, RTFManager can be started from the Start menu. RTFManager is
in the program group for the Intel telecom software. RTFManager can also be started by
just typing “RTFManager” from the console.
• On Linux systems, RTFManager can be started by typing /usr/dialogic/RTFManager
or RTFManager if the executable is in the operating system’s executable searching path.
RTFManager’s main window appears.
2. From the Tools menu, select RTF Configuration... This launches the Runtime Trace Facility
Manager Configuration window. The Runtime Trace Facility Manager Configuration window
contains the following two tabs:
• General - The General tab is used to enable/disable RTF tracing and customize the format,
readability and location of the log files. Refer to Section 29.5, “General Tab”, on page 166
for more information.
• Filtering - The Filtering tab allows you to determine which libraries to trace and the trace
level (Debugging, Program Flow, Warnings, Errors) for each library. Refer to
Section 29.6, “Filtering Tab”, on page 168 for information about using the Filtering tab.
Adjust the settings on each of these tabs to suit your needs and click OK when you are
finished.
System Software Diagnostics Guide — September 2006
41
Debugging Software
3. Start your application. As your application runs, RTF will trace the runtime libraries according
to RTF configuration file settings that you created using the RTFManager GUI. Refer to the
individual entries in the log file or debug stream to review the trace statements generated by
the runtime libraries.
4. If you wish to dynamically edit the RTF trace levels while your application runs, it is not
necessary to stop the RTF. Instead, perform the following:
1. Start RTFManager.
2. Customize the RTF settings using RTFManager (as described above).
3. Issue the rtftool reload command to reload RTF configuration file and restart the
RTF engine.
Note: Keep in mind that changes made to the RTF configuration file will not be reflected in
the RTF output until the tool has been reloaded.
5. At any time, you can issue the rtftool command to pause/restart RTF. RTF will not provide
trace output while it is paused.
For more information about RTFManager, refer to Chapter 29, “RTFManager Reference”. This
chapter also tells you how to use RTFManager to customize the log file so that only certain trace
statements are displayed (refer to Section 29.7, “Log File Filtering”, on page 170).
Manually Editing the RTF Configuration File
Note:
If you run full RTF logging on high-density systems (1000 media channels), you may experience
I/O throughput degradation. It is recommended that you do not run RTF with full logging on highdensity systems or any field-deployed systems. Instead, use runtime filtering capabilities of the
RTF to only log the data you are interested in.
Use the following procedure to manually customize and activate the RTF’s tracing capabilities:
1. Locate the RTF configuration file. The default installation location is determined by the
INTEL_DIALOGIC_CFG environment variable.
Note: The INTEL_DIALOGIC_CFG environment variable is set when the Intel® Dialogic®
system software is installed. Refer to the Intel Dialogic System Release Software
Installation Guide for information about Intel Dialogic system software environment
variables. To determine the variable setting on a Linux system, type echo
$INTEL_DIALOGIC_CFG. To determine the variable setting on a Windows system,
type set INTEL_DIALOGIC_CFG.
2. If you are familiar with XML syntax, use any ASCII text editor to open the RTF configuration
file (RtfConfigWin.xml for Windows and RtfConfigLinux.xml for Linux). If you are not
familiar with XML syntax, open the RTF configuration file with XML editor software.
3. Edit the RTF configuration file to customize the RTF tracing capabilities. Refer to
Section 28.3, “RTF Configuration File”, on page 142 for complete information about editing
the RTF configuration file. The RTF configuration file includes the following XML tags:
• RTFConfig: This tag’s attributes configure the RTF. All other tags in the RTF
configuration file are children of this tag. This tag must appear one time in the RTF
42
System Software Diagnostics Guide — September 2006
Debugging Software
configuration file. The RTF tracing capabilities are turned on by default. Refer to
Section 28.3.1, “RTFConfig Tag”, on page 143 for complete information about the
RTFConfig tag. The RTFConfig tag includes the following child tags:
• Logfile: This is the first child tag of the RTFConfig tag. The Logfile tag’s attributes set the
parameters for the RTF logfile output. This tag is an optional part of the RTF
configuration file. Refer to Section 28.3.2, “Logfile Tag”, on page 145 for complete
information about the Logfile tag.
• Global: This is the second child tag of the RTFConfig tag. The Global tag is used to
specify the global configuration. Configuration settings at the global level are valid for all
modules in the RTF configuration file. When a module is traced at the global level, all
activity related to that particular module is traced. However, global tag settings have the
lowest priority; they can be override by settings in individual Module tags. Refer to
Section 28.3.3, “Global Tag”, on page 147 for complete information about the Global tag.
• Module: This is the third child tag of the RTFConfig tag. The Module tag is used to
specify the trace configuration for a particular module. The default RTF configuration
contains pre-defined module tags for traceable runtime libraries. You can edit the state
attributes of these pre-defined module tags or delete these pre-defined module tags. The
default setting for each module’s state attribute is 1, meaning that tracing is enabled by
default for each module in the .xml file. If you choose to delete modules, keep in mind that
the RtfConfigLinux.xml and RtfConfigWin.xml files must contain at least one Module tag.
Refer to Section 28.3.7, “Module Tag”, on page 150 for complete information about the
Module tag.
4. When you are finished editing the RTF configuration file, save and close the file.
5. Start your application. As your application runs, RTF will trace the runtime libraries according
to RTF configuration file settings. Refer to the individual entries in the log file or debug stream
to review the trace statements generated by the runtime libraries.
6. If you wish to dynamically edit the RTF trace levels while your application runs, it is not
necessary to stop the RTF. Instead, perform the following:
1. Open the RTF configuration file.
2. Customize the settings in the RTF configuration file.
3. Save and close the RTF configuration file.
4. Issue the rtftool reload command to reload RTF configuration file and restart the
RTF engine.
Note: Keep in mind that changes made to the RTF configuration file will not be reflected in
the RTF output until the tool has been reloaded.
7. At any time, you can issue the rtftool command to pause/restart RTF. RTF will not provide
trace output while it is paused.
• For more information about RTF and manually editing the configuration file, refer to
Chapter 28, “Runtime Trace Facility (RTF) Reference”.
Note:
If you run full RTF logging on high-density systems (1000 media channels), you may experience
I/O throughput degradation. It is recommended that you do not run RTF with full logging on highdensity systems or any field-deployed systems. Instead, use runtime filtering capabilities of the
RTF to only log the data you are interested in.
System Software Diagnostics Guide — September 2006
43
Debugging Software
7.2
Collecting System Data to Diagnose an Application
Failure or Crash
This section describes how to use the Intel® Telecom Subsystem Summary Tool (its_sysinfo) to
collect the system data you will need to send to Intel’s Support Services to troubleshoot an
application failure or crash.
Here are two sample scenarios in which you might use the its_sysinfo tool to gather system data:
• A telephony application you are running exits or gets terminated unexpectedly. At that point,
you would launch the Intel Telecom Subsystem Summary Tool (its_sysinfo) to collect the log
files and environment information to send to Intel’s Support Services using your credentials.
• Your telephony application doesn't work as expected. For example, an attempt to make a call
fails. At that point, you would run the Intel Telecom Subsystem Summary Tool to gather the
log files and environment information to send to Intel’s Support Services.
To familiarize yourself with the Intel Telecom Subsystem Summary Tool (its_sysinfo) and all the
data it collects, refer to Chapter 21, “Intel Telecom Subsystem Summary Tool Reference”.
Follow this procedure to use its_sysinfo to collect system data to pass along for troubleshooting:
1. Start the tool.
• Linux systems – On the command line, enter its_sysinfo filename where filename
is the name you want to give the zip file. The its_sysinfo tool will collect system
information and compress it into the zip file. If you do not specify any filename, then the
information gets compressed in a zip file with the default name its_sysinfo.zip.
• Windows systems:
1. Click on its_sysinfo.exe in %INTEL_DIALOGIC_DIR%\bin.
2. Click the Generate button. A dialog box appears on which you must name the
archive file into which you want the information to be collected. The default filename
is its_sysinfo.zip.
3. Click the Save button and its_sysinfo will start collecting information.
4. A pop-up window displaying “Data collection completed. Zip archive was created as
<zip file name>” will appear to indicate completion of its_sysinfo.exe execution.
Click the OK button. The archive file is in the location specified in the tool.
2. Use any standard compression/decompression tool (such as WinZip*) to extract and review the
data or send the zip file to Intel’s Support Services.
7.3
Creating a System Configuration Archive
This section describes how to use the Intel® Telecom Subsystem Summary Tool (its_sysinfo) to
create a system configuration archive.
As part of a quality control effort, you might want to baseline your systems by retrieving all
available information through its_sysinfo. You would archive this baseline system information and
44
System Software Diagnostics Guide — September 2006
Debugging Software
use it as a point of comparison to any system that exhibits erroneous behavior. This would provide
you with a means of performing an initial cause/effect analysis when you troubleshoot the problem.
To familiarize yourself with the Intel Telecom Subsystem Summary Tool (its_sysinfo) and all the
data it collects, refer to Chapter 21, “Intel Telecom Subsystem Summary Tool Reference”.
Follow this procedure to use its_sysinfo to create a system configuration archive:
1. Start the tool.
• Linux systems – On the command line, enter its_sysinfo filename where filename
is the name you want to give the zip file. The its_sysinfo tool will collect system
information and compress it into the zip file. If you do not specify any filename, then the
information gets compressed in a zip file with the default name its_sysinfo.zip.
• Windows systems:
1. Click on its_sysinfo.exe in %INTEL_DIALOGIC_DIR%\bin.
2. Click the Generate button. A dialog box appears on which you must name the
archive file into which you want the information to be collected. The default filename
is its_sysinfo.zip.
3. Click the Save button and its_sysinfo will start collecting information.
4. A pop-up window displaying “Data collection completed. Zip archive was created as
<zip file name>” will appear to indicate completion of its_sysinfo.exe execution.
Click the OK button. The archive file is in the location specified in the tool.
2. Retain the archive file as your baseline system information.
System Software Diagnostics Guide — September 2006
45
Debugging Software
46
System Software Diagnostics Guide — September 2006
Tracing CAS Signaling Using
Global Call
8.
8
This chapter describes how to trace CAS signaling in systems with Intel NetStructure®
DMT160TEC digital telephony interface boards using Global Call APIs and a Global Call event.
The following information is provided:
• Introduction . . . . . . . . . . . . . . . . . . . . . . . . . . . . . . . . . . . . . . . . . . . . . . . . . . . . . . . . . . 47
• Requirements and Restrictions . . . . . . . . . . . . . . . . . . . . . . . . . . . . . . . . . . . . . . . . . . . 48
• Enabling Tracing Using gc_StartTrace( ) . . . . . . . . . . . . . . . . . . . . . . . . . . . . . . . . . . . 48
• Disabling Tracing Using gc_StopTrace( ) . . . . . . . . . . . . . . . . . . . . . . . . . . . . . . . . . . . 49
• Reporting Trace Data via GCEV_TRACEDATA . . . . . . . . . . . . . . . . . . . . . . . . . . . . . 50
• Setting the Trace Queue Size Using gc_SetConfigData( ) . . . . . . . . . . . . . . . . . . . . . . 52
8.1
Introduction
Inbound and outbound R2MF tones and CAS bit transitions/states can be traced using existing
Global Call APIs and a Global Call event (GCEV_TRACEDATA). This allows developers to
determine the root cause of protocol issues in a system that uses Intel NetStructure DMT160TEC
digital telephony interface boards.
This capability provides a single interface through which every component on a DMT160TEC
board can send trace data to the host in a generic format. The application that runs on the host and
requires the trace data can start and stop the trace as needed using Global Call APIs. Trace data are
presented to the application via a Global Call event and the application is responsible for the
retrieval, processing, and logging of the traced data from the event.
Notes: 1. For more information about Global Call APIs, refer to the Global Call API for Linux and
Windows Operating Systems Library Reference.
2. Chapter 18, “GCEV_TRACEDATA Reference” describes the data layout in the
GCEV_TRACEDATA so that a parser can be designed for viewing the data. A sample parser and
sample parser output is also included.
Some use cases for performing this procedure are as follows:
• Troubleshoot protocol problems that occur after provisioning a span for a new carrier:
After some time of handling traffic, an unused span is provisioned for a new carrier for Least
Cost Routing (LCR). After the span is turned up, protocol problems occur. The protocol for the
inbound and outbound spans must be traced to capture the error condition and determine a fix.
Tracing can occur on two spans on the same board or on different boards. To gain a complete
understanding of the entire call path, the call on the inbound span needs to be traced as well as
the call on the outbound span.
System Software Diagnostics Guide — September 2006
47
Tracing CAS Signaling Using Global Call
• Trace newly deployed spans to make sure there are no protocol issues: A new platform
consisting of 32 E1s is deployed. All spans are turned up at about the same time. All active
spans are traced for up to the first minute of operation to determine if there are any protocol
issues.
8.2
Requirements and Restrictions
Following are the prerequisites for performing this procedure:
• Intel® Dialogic® System Release
• At least one Intel NetStructure DMT160TEC digital telephony interface board
• The following registry setting modification is required to support this feature’s functionality:
HKEY_LOCAL_MACHINE\SOFTWARE\Dialogic\Cheetah\MaxMMBReplySize
The value should be changed from 0x200 (512 decimal) to 0x400 (1024 decimal).
If you use this feature without modifying the registry key, you will get the following failure
event notifications: GCEV_TASKFAIL.
• The application is responsible for starting and stopping the tracing. This is done using Global
Call APIs.
• Traced data will be presented to the application via an event (GCEV_TRACEDATA).
• The application will be responsible for retrieving, processing, and logging the traced data
returned as a result of the traced data event.
• System performance dictates the maximum spans that can be traced. This will be determined
empirically.
8.3
Enabling Tracing Using gc_StartTrace( )
The gc_StartTrace( ) function starts the logging of debug information for a specific line device.
To use this feature, the line device must be the handle for a trunk or virtual board and the
tracefilename pointer should be set to NULL. After gc_StartTrace( ) returns success, instead of
logging to a file, the application will be notified of the availability of trace data via
GCEV_TRACEDATA. The trace will continue until a gc_StopTrace( ) function is called.
Sample application code
Note:
The following sample code was written for an application running on a system in which an Intel
NetStructure DMT160TEC board was used as the network interface, an Intel NetStructure
DMV2400A board was used as a play/record resource board, and the boards were connected via a
CT Bus.
#include
#include
#include
#include
48
<stdio.h>
<srllib.h>
<gclib.h>
<gcerr.h>
System Software Diagnostics Guide — September 2006
Tracing CAS Signaling Using Global Call
LINEDEV bdev;
int rc;
int value;
GC_INFO gc_error_info;
char devname[30];
/*
/*
/*
/*
/*
board level device number */
Return code */
value to be for specified parameter */
GlobalCall error information data */
Board/Trunk device name */
main()
{
/* Open a trunk device */
sprintf(dename, ":N_dtiB1:P_pdk_ar_r2_io");
if(gc_OpenEx(&bdev, devname, EV_SYNC, &ldev) != GC_SUCCESS)
{
/* Process the error as decided earlier */
gc_ErrorInfo( &gc_error_info );
printf ("Error: gc_OpenEx() on devname: %s, GC ErrorValue: 0x%hx - %s,
CCLibID: %i - %s, CC ErrorValue: 0x%lx - %s\n",
devname, gc_error_info.gcValue, gc_error_info.gcMsg,
gc_error_info.ccLibId, gc_error_info.ccLibName,
gc_error_info.ccValue, gc_error_info.ccMsg);
return (gc_error_info.gcValue);
}
rc = gc_StartTrace(bdev, NULL);
if (rc != GC_SUCCESS)
{
/* Process the error */
gc_ErrorInfo( &gc_error_info );
printf ("Error: gc_StartTrace() on devname: %s, GC ErrorValue: 0x%hx - %s,
CCLibID: %i - %s, CC ErrorValue: 0x%lx - %s\n",
devname, gc_error_info.gcValue, gc_error_info.gcMsg,
gc_error_info.ccLibId, gc_error_info.ccLibName,
gc_error_info.ccValue, gc_error_info.ccMsg);
return (gc_error_info.gcValue);
}
else
{
/* continue */
}
}
8.4
Disabling Tracing Using gc_StopTrace( )
The gc_StopTrace( ) function stops the logging of debug information for a specific line device that
was started using gc_StartTrace( ).
To use this feature, the line device must be the handle for a trunk or virtual board. After the
gc_StopTrace( ) function returns success, the application may be notified of the availability of the
last remaining trace data via GCEV_TRACEDATA.
Sample application code
Note:
The following sample code was written for an application running on a system in which an Intel
NetStructure DMT160TEC board was used as the network interface, an Intel NetStructure
DMV2400A board was used as a play/record resource board, and the boards were connected via a
CT Bus.
System Software Diagnostics Guide — September 2006
49
Tracing CAS Signaling Using Global Call
#include
#include
#include
#include
<stdio.h>
<srllib.h>
<gclib.h>
<gcerr.h>
LINEDEV bdev;
int rc;
int value;
GC_INFO gc_error_info;
char devname[30];
/*
/*
/*
/*
/*
board level device number */
Return code */
value to be for specified parameter */
GlobalCall error information data */
Board/Trunk device name */
main()
{
/* Open a trunk device */
/* Start Tracing */
.
.
/* Call Control activity, tracing captured */
.
.
.
/* Stop Tracing */
rc = gc_StopTrace(bdev);
if(rc != GC_SUCCESS) {
/* Process the error */
gc_ErrorInfo( &gc_error_info );
printf ("Error: gc_StopTrace() on devname: %s, GC ErrorValue: 0x%hx - %s,
CCLibID: %i - %s, CC ErrorValue: 0x%lx - %s\n",
devname, gc_error_info.gcValue, gc_error_info.gcMsg,
gc_error_info.ccLibId, gc_error_info.ccLibName,
gc_error_info.ccValue, gc_error_info.ccMsg);
return (gc_error_info.gcValue);
} else {
/* Continue */
}
}
8.5
Reporting Trace Data via GCEV_TRACEDATA
The GCEV_TRACEDATA event is an unsolicited event used to notify the user application of the
availability of tracing data. The user application should call gc_StartTrace( ) successfully to
enable receiving tracing data. The trace data is associated with the GCEV_TRACEDATA event via
the GC_TRACEDATA data structure, which includes sequence number, data size, and data buffer.
This data structure can be obtained by casting extevtdatap of METAEVENT. A proper result value
is also associated with GCEV_TRACEDATA, which can be obtained via the gc_ResultInfo( )
function.
The data structure GC_TRACEDATA associated with the GCEV_TRACEDATA event is defined in
gclib.h:
#define GCVAL_TRACEDATA_SIZE2048 /* Maximum data size of tracing data */
typedef struct {
unsigned long
seq_no;
unsigned short
data_size;
char
data_buf[GCVAL_TRACEDATA_SIZE];
} GC_TRACEDATA, * GC_TRACEDTAP;
50
/* the sequence number of tracing data*/
/* the size of tracing data */
/* memory buffer for tracing data */
System Software Diagnostics Guide — September 2006
Tracing CAS Signaling Using Global Call
A new result value GCRV_QUEUE_OVERFLOW associated with GCEV_TRACEDATA event is
defined in gcerr.h:
#define GCRV_QUEUE_OVERFLOW (GCRV_RESULT | 0x65) /* Queue overflow occurred - data overwritten
*/
Sample application code
Note:
The following sample code was written for an application running on a system in which an Intel
NetStructure DMT160TEC board was used as the network interface, an Intel NetStructure
DMV2400A board was used as a play/record resource board, and the boards were connected via a
CT Bus.
/*
* Do SRL event processing
*/
int
evttype;
char
tracedata[2048];
hdlcnt = 0;
hdls[ hdlcnt++ ] = GetGlobalCallHandle();
hdls[ hdlcnt++ ] = GetVoiceHandle();
/* Wait selectively for devices that belong to this thread */
rc = sr_waitevtEx( hdls, hdlcnt, PollTimeout_ms, &evtHdl);
if (rc != SR_TMOUT)
{
/*
* Update
*/
rc = gc_GetMetaEventEx(&g_Metaevent, evtHdl);
if (rc != GC_SUCCESS)
{
/* process error return */
gc_ErrorInfo( &gc_error_info );
printf ("Error: gc_GetMetaEventEx() on linedev: 0x%lx,
GC ErrorValue: 0x%hx - %s, CCLibID: %i - %s, CC ErrorValue: 0x%lx - %s\n",
metaevent.evtdev, gc_error_info.gcValue, gc_error_info.gcMsg,
gc_error_info.ccLibId, gc_error_info.ccLibName,
gc_error_info.ccValue, gc_error_info.ccMsg);
return (gc_error_info.gcValue);
}
evttype = metaevent.evttype;
rc = vProcessCallEvents( );
switch (evttype)
{
case GCEV_TRACEDATA:
{
memcpy((tracedata, metaevent.extevtdatap, sizeof(GC_TRACEDATA) );
/* decode the trace data */
break;
}
.
.
.
}
}
System Software Diagnostics Guide — September 2006
51
Tracing CAS Signaling Using Global Call
8.6
Setting the Trace Queue Size Using
gc_SetConfigData( )
The gc_SetConfigData( ) API is used for setting the size of the trace buffer in the host DM3 call
control library if overruns (overflow) occur. If the trace data queue in the host DM3 cclib
overflows, the data at the front of the queue will get overwritten and the cause value associated with
that data will be set to GCRV_QUEUE_OVERFLOW.
Notes: 1. gc_GetConfigData( ) can be used to retrieve the trace queue size.
2. Previously, the gc_GetConfigData( ) and gc_SetConfigData( ) APIs were not supported on
DM3 architecture boards.
To set the trace queue size, the gc_util_insert_parm_val( ) function must be used to populate the
GC_PARM_BLK with the following parameter values:
• setID = CCSET_TRACEDATA
• parmID = CCPARM_TRACEQ_SIZE
• data_size = sizeof(int)
• data = integer value
Once the GC_PARM_BLK has been populated with the desired values, the gc_SetConfigData( )
function can be issued to perform the configuration. The parameter values for the
gc_SetConfigData( ) function are as follows:
• target_type = GCTGT_CCLIB_NETIF
• target_id = the trunk line device handle
• target_datap = GC_PARM_BLKP parameter pointer, as constructed by the utility function
gc_util_insert_parm_val( )
• time_out = time interval (in seconds) during which the target object must be updated with the
data. If the interval is exceeded, the update request is ignored. This parameter is supported in
synchronous mode only, and it is ignored when set to 0.
• update_cond = GCUPDATE_IMMEDIATE
• request_idp = pointer to the location for storing the request ID
• mode = EV_ASYNC for asynchronous execution or EV_SYNC for synchronous execution
Sample application code
Note:
The following sample code was written for an application running on a system in which an Intel
NetStructure DMT160TEC board was used as the network interface, an Intel NetStructure
DMV2400A board was used as a play/record resource board, and the boards were connected via a
CT Bus.
GC_PARM_BLKP ParmBlkp = NULL;
long id;
gc_util_insert_parm_val(&ParmBlk, CCSET_TRACEDATA, CCPRM_TRACEQ, sizeof(int), 500);
Note:
52
The maximum value is 1000 and default is 32.
System Software Diagnostics Guide — September 2006
Tracing CAS Signaling Using Global Call
gc_SetConfigData(GCTGT_CCLIB_NETIF, bdev, ParmBlkp, 0, GCUPDATE_IMMEDIATE, &id, EV_ASYNC);
gc_util_delete_parm_blk(ParmBlkp);
if (sr_waitevt(-1) >= 0)
{
METAEVENT meta;
gc_GetMetaEvent(&meta);
switch(sr_getevttype())
{
case GCEV_SETCONFIGDATA:
printf("Received event GCEV_SETCONFIGDATA(ReqID=%d) on device %s
\n",((GC_RTCM_EVTDATA *)(meta.evtdatap))->request_ID,
ATDV_NAMEP(sr_getevtdev()));
break;
case GCEV_SETCONFIGDATA_FAIL
printf("Received event GCEV_SETCONFIGDATAFAIL(ReqID=%d) on device
%s, Error=%s\n",((GC_RTCM_EVTDATA *)(meta.evtdatap))->request_ID,
ATDV_NAMEP(sr_getevtdev()),
((GC_RTCM_EVTDATA *)(meta.evtdatap))->additional_msg);
break;
default:
printf("Received event 0x%x on device %s\n", sr_getevttype(),
ATDV_NAMEP(sr_getevtdev()));
break;
}
}
System Software Diagnostics Guide — September 2006
53
Tracing CAS Signaling Using Global Call
54
System Software Diagnostics Guide — September 2006
Tracing Multiple ISDN Trunks
Using Global Call
9.
9
This section describes how to collect ISDN D-channel trace information on multiple trunks.
• Introduction . . . . . . . . . . . . . . . . . . . . . . . . . . . . . . . . . . . . . . . . . . . . . . . . . . . . . . . . . . 55
• Requirements . . . . . . . . . . . . . . . . . . . . . . . . . . . . . . . . . . . . . . . . . . . . . . . . . . . . . . . . . 56
• Enabling Tracing Using gc_StartTrace( ) . . . . . . . . . . . . . . . . . . . . . . . . . . . . . . . . . . . 56
• Disabling Tracing Using gc_StopTrace( ) . . . . . . . . . . . . . . . . . . . . . . . . . . . . . . . . . . . 57
• Reporting Trace Data via GCEV_TRACEDATA . . . . . . . . . . . . . . . . . . . . . . . . . . . . . 58
• Setting the Trace Queue Size Using gc_SetConfigData( ) . . . . . . . . . . . . . . . . . . . . . . 60
9.1
Introduction
The ISDNtrace tool described in Chapter 20, “ISDN Trace Reference” allows you to perform
tracing on only one trunk. This procedure allows you to collect ISDN D-channel trace information
on two or more trunks at the same time and the capture of the trace information can be dynamically
started and stopped via Global Call APIs. The trace information collected with this procedure
allows developers to determine the root cause of protocol issues in a system that uses Intel
NetStructure® DMT160TEC or DMN160TEC digital telephony interface boards.
Caution:
Enabling ISDN tracing on a higher number of trunks will cause the call performance to be severely
degraded and must not be left permanently enabled in a production environment.
Trace data are presented to the application via an event (GCEV_TRACEDATA) and the application
is responsible for the retrieval, processing, and logging of the traced data from the event. Traced
data events will be generated for all signaling frames on the D-channel on both inbound and
outbound calls. Tracing is started by using the gc_StartTrace( ) API after the ISDN firmware
downloads. Tracing is stopped using the gc_StopTrace( ) API. This is described in Section 9.3,
“Enabling Tracing Using gc_StartTrace( )”, on page 56 and Section 9.4, “Disabling Tracing Using
gc_StopTrace( )”, on page 57.
The GCEV_TRACEDATA event is received asynchronously on a board device whenever a Layer 2
(LAP_D) INFORMATION frame is sent or received by the firmware. Refer to Chapter 18,
“GCEV_TRACEDATA Reference” for more information about the structure of
GCEV_TRACEDATA for ISDN.
System Software Diagnostics Guide — September 2006
55
Tracing Multiple ISDN Trunks Using Global Call
9.2
Requirements
This feature is only supported on Intel NetStructure® DMT160TEC and DMN160TEC boards.
Caution:
Do not permanently enable ISDN tracing on a large number of trunks in a production environment
or the call performance will be severely degraded.
Following are the prerequisites for performing this procedure:
• Intel® Dialogic® System Release
• Global Call Protocols
• At least one Intel NetStructure DMT160TEC or DMN160TEC digital telephony interface
board
Note: This feature is only supported on Intel NetStructure DMT160TEC and DMN160TEC
boards.
• The following registry setting modification is required to support this feature’s functionality:
HKEY_LOCAL_MACHINE\SOFTWARE\Dialogic\Cheetah\MaxMMBReplySize
The value should be changed from 0x200 (512 decimal) to 0x400 (1024 decimal).
If you use this feature without modifying the registry key, you will get the following failure
event notifications: GCEV_TASKFAIL.
• The application is responsible for starting and stopping the tracing. This is done using Global
Call APIs.
• Traced data will be presented to the application via an event (GCEV_TRACEDATA).
• The application will be responsible for retrieving, processing, and logging the traced data
returned as a result of the traced data event.
• System performance dictates the maximum trunks that can be traced. This will be determined
empirically.
9.3
Enabling Tracing Using gc_StartTrace( )
The gc_StartTrace( ) function starts the logging of debug information for a specific line device.
To use this feature, the line device must be the handle for a trunk or virtual board and the
tracefilename pointer should be set to NULL. After gc_StartTrace( ) returns success, instead of
logging to a file, the application will be notified of the availability of trace data via
GCEV_TRACEDATA. The trace will continue until a gc_StopTrace( ) function is called.
Sample application code
Note:
56
The following sample code was written for an application running on a system in which an Intel
NetStructure DMT160TEC board was used as the network interface, an Intel NetStructure
DMV2400A board was used as a play/record resource board, and the boards were connected via a
CT Bus.
System Software Diagnostics Guide — September 2006
Tracing Multiple ISDN Trunks Using Global Call
#include
#include
#include
#include
<stdio.h>
<srllib.h>
<gclib.h>
<gcerr.h>
LINEDEV bdev;
int rc;
int value;
GC_INFO gc_error_info;
char devname[30];
/*
/*
/*
/*
/*
board level device number */
Return code */
value to be for specified parameter */
GlobalCall error information data */
Board/Trunk device name */
main()
{
/* Open a trunk device */
sprintf(dename, ":N_dtiB1:P_isdn");
if(gc_OpenEx(&bdev, devname, EV_SYNC, &ldev) != GC_SUCCESS)
{
/* Process the error as decided earlier */
gc_ErrorInfo( &gc_error_info );
printf ("Error: gc_OpenEx() on devname: %s, GC ErrorValue: 0x%hx - %s,
CCLibID: %i - %s, CC ErrorValue: 0x%lx - %s\n",
devname, gc_error_info.gcValue, gc_error_info.gcMsg,
gc_error_info.ccLibId, gc_error_info.ccLibName,
gc_error_info.ccValue, gc_error_info.ccMsg);
return (gc_error_info.gcValue);
}
rc = gc_StartTrace(bdev, NULL);
if (rc != GC_SUCCESS)
{
/* Process the error */
gc_ErrorInfo( &gc_error_info );
printf ("Error: gc_StartTrace() on devname: %s, GC ErrorValue: 0x%hx - %s,
CCLibID: %i - %s, CC ErrorValue: 0x%lx - %s\n",
devname, gc_error_info.gcValue, gc_error_info.gcMsg,
gc_error_info.ccLibId, gc_error_info.ccLibName,
gc_error_info.ccValue, gc_error_info.ccMsg);
return (gc_error_info.gcValue);
}
else
{
/* continue */
}
}
9.4
Disabling Tracing Using gc_StopTrace( )
The gc_StopTrace( ) function stops the logging of debug information for a specific line device that
was started using gc_StartTrace( ).
To use this feature, the line device must be the handle for a trunk or virtual board. After the
gc_StopTrace( ) function returns success, the application may be notified of the availability of the
last remaining trace data via GCEV_TRACEDATA.
System Software Diagnostics Guide — September 2006
57
Tracing Multiple ISDN Trunks Using Global Call
Sample application code
Note:
The following sample code was written for an application running on a system in which an Intel
NetStructure DMT160TEC board was used as the network interface, an Intel NetStructure
DMV2400A board was used as a play/record resource board, and the boards were connected via a
CT Bus.
#include
#include
#include
#include
<stdio.h>
<srllib.h>
<gclib.h>
<gcerr.h>
LINEDEV bdev;
int rc;
int value;
GC_INFO gc_error_info;
char devname[30];
/*
/*
/*
/*
/*
board level device number */
Return code */
value to be for specified parameter */
GlobalCall error information data */
Board/Trunk device name */
main()
{
/* Open a trunk device */
/* Start Tracing */
.
.
/* Call Control activity, tracing captured */
.
.
.
/* Stop Tracing */
rc = gc_StopTrace(bdev);
if(rc != GC_SUCCESS) {
/* Process the error */
gc_ErrorInfo( &gc_error_info );
printf ("Error: gc_StopTrace() on devname: %s, GC ErrorValue: 0x%hx - %s,
CCLibID: %i - %s, CC ErrorValue: 0x%lx - %s\n",
devname, gc_error_info.gcValue, gc_error_info.gcMsg,
gc_error_info.ccLibId, gc_error_info.ccLibName,
gc_error_info.ccValue, gc_error_info.ccMsg);
return (gc_error_info.gcValue);
} else {
/* Continue */
}
}
9.5
Reporting Trace Data via GCEV_TRACEDATA
The GCEV_TRACEDATA event is an unsolicited event used to notify the user application of the
availability of tracing data. The user application should call gc_StartTrace( ) successfully to
enable receiving tracing data. The trace data is associated with the GCEV_TRACEDATA event via
the GC_TRACEDATA data structure, which includes sequence number, data size, and data buffer.
This data structure can be obtained by casting extevtdatap of METAEVENT. A proper result value
is also associated with GCEV_TRACEDATA, which can be obtained via the gc_ResultInfo( )
function.
The data structure GC_TRACEDATA associated with the GCEV_TRACEDATA event is defined in
gclib.h:
#define GCVAL_TRACEDATA_SIZE2048 /* Maximum data size of tracing data */
58
System Software Diagnostics Guide — September 2006
Tracing Multiple ISDN Trunks Using Global Call
typedef struct {
unsigned long
seq_no;
unsigned short
data_size;
char
data_buf[GCVAL_TRACEDATA_SIZE];
} GC_TRACEDATA, * GC_TRACEDTAP;
/* the sequence number of tracing data*/
/* the size of tracing data */
/* memory buffer for tracing data */
A new result value GCRV_QUEUE_OVERFLOW associated with GCEV_TRACEDATA event is
defined in gcerr.h:
#define GCRV_QUEUE_OVERFLOW (GCRV_RESULT | 0x65) /* Queue overflow occurred - data overwritten
*/
Sample application code
Note:
The following sample code was written for an application running on a system in which an Intel
NetStructure DMT160TEC board was used as the network interface, an Intel NetStructure
DMV2400A board was used as a play/record resource board, and the boards were connected via a
CT Bus.
/*
* Do SRL event processing
*/
int
evttype;
char
tracedata[2048];
hdlcnt = 0;
hdls[ hdlcnt++ ] = GetGlobalCallHandle();
hdls[ hdlcnt++ ] = GetVoiceHandle();
/* Wait selectively for devices that belong to this thread */
rc = sr_waitevtEx( hdls, hdlcnt, PollTimeout_ms, &evtHdl);
if (rc != SR_TMOUT)
{
/*
* Update
*/
rc = gc_GetMetaEventEx(&g_Metaevent, evtHdl);
if (rc != GC_SUCCESS)
{
/* process error return */
gc_ErrorInfo( &gc_error_info );
printf ("Error: gc_GetMetaEventEx() on linedev: 0x%lx,
GC ErrorValue: 0x%hx - %s, CCLibID: %i - %s, CC ErrorValue: 0x%lx - %s\n",
metaevent.evtdev, gc_error_info.gcValue, gc_error_info.gcMsg,
gc_error_info.ccLibId, gc_error_info.ccLibName,
gc_error_info.ccValue, gc_error_info.ccMsg);
return (gc_error_info.gcValue);
}
evttype = metaevent.evttype;
rc = vProcessCallEvents( );
switch (evttype)
{
case GCEV_TRACEDATA:
{
memcpy((tracedata, metaevent.extevtdatap, sizeof(GC_TRACEDATA) );
/* decode the trace data */
break;
}
.
.
.
}
}
System Software Diagnostics Guide — September 2006
59
Tracing Multiple ISDN Trunks Using Global Call
9.6
Setting the Trace Queue Size Using
gc_SetConfigData( )
The gc_SetConfigData( ) API is used for setting the size of the trace buffer in the host DM3 call
control library if overruns (overflow) occur. If the trace data queue in the host DM3 cclib
overflows, the data at the front of the queue will get overwritten and the cause value associated with
that data will be set to GCRV_QUEUE_OVERFLOW.
Notes: 1. gc_GetConfigData( ) can be used to retrieve the trace queue size.
2. Previously, the gc_GetConfigData( ) and gc_SetConfigData( ) APIs were not supported on
DM3 architecture boards.
To set the trace queue size, the gc_util_insert_parm_val( ) function must be used to populate the
GC_PARM_BLK with the following parameter values:
• setID = CCSET_TRACEDATA
• parmID = CCPARM_TRACEQ_SIZE
• data_size = sizeof(int)
• data = integer value
Once the GC_PARM_BLK has been populated with the desired values, the gc_SetConfigData( )
function can be issued to perform the configuration. The parameter values for the
gc_SetConfigData( ) function are as follows:
• target_type = GCTGT_CCLIB_NETIF
• target_id = the trunk line device handle
• target_datap = GC_PARM_BLKP parameter pointer, as constructed by the utility function
gc_util_insert_parm_val( )
• time_out = time interval (in seconds) during which the target object must be updated with the
data. If the interval is exceeded, the update request is ignored. This parameter is supported in
synchronous mode only, and it is ignored when set to 0.
• update_cond = GCUPDATE_IMMEDIATE
• request_idp = pointer to the location for storing the request ID
• mode = EV_ASYNC for asynchronous execution or EV_SYNC for synchronous execution
Sample application code
Note:
The following sample code was written for an application running on a system in which an Intel
NetStructure DMT160TEC board was used as the network interface, an Intel NetStructure
DMV2400A board was used as a play/record resource board, and the boards were connected via a
CT Bus.
GC_PARM_BLKP ParmBlkp = NULL;
long id;
gc_util_insert_parm_val(&ParmBlk, CCSET_TRACEDATA, CCPRM_TRACEQ, sizeof(int), 500);
Note:
60
The maximum value is 1000 and default is 32.
System Software Diagnostics Guide — September 2006
Tracing Multiple ISDN Trunks Using Global Call
gc_SetConfigData(GCTGT_CCLIB_NETIF, bdev, ParmBlkp, 0, GCUPDATE_IMMEDIATE, &id, EV_ASYNC);
gc_util_delete_parm_blk(ParmBlkp);
if (sr_waitevt(-1) >= 0)
{
METAEVENT meta;
gc_GetMetaEvent(&meta);
switch(sr_getevttype())
{
case GCEV_SETCONFIGDATA:
printf("Received event GCEV_SETCONFIGDATA(ReqID=%d) on device %s
\n",((GC_RTCM_EVTDATA *)(meta.evtdatap))->request_ID,
ATDV_NAMEP(sr_getevtdev()));
break;
case GCEV_SETCONFIGDATA_FAIL
printf("Received event GCEV_SETCONFIGDATAFAIL(ReqID=%d) on device
%s, Error=%s\n",((GC_RTCM_EVTDATA *)(meta.evtdatap))->request_ID,
ATDV_NAMEP(sr_getevtdev()),
((GC_RTCM_EVTDATA *)(meta.evtdatap))->additional_msg);
break;
default:
printf("Received event 0x%x on device %s\n", sr_getevttype(),
ATDV_NAMEP(sr_getevtdev()));
break;
}
}
System Software Diagnostics Guide — September 2006
61
Tracing Multiple ISDN Trunks Using Global Call
62
System Software Diagnostics Guide — September 2006
CallInfo Reference
10.
10
This chapter provides reference information about the CallInfo tool. The following topics are
included:
• Description. . . . . . . . . . . . . . . . . . . . . . . . . . . . . . . . . . . . . . . . . . . . . . . . . . . . . . . . . . . 63
• Guidelines . . . . . . . . . . . . . . . . . . . . . . . . . . . . . . . . . . . . . . . . . . . . . . . . . . . . . . . . . . . 63
• Options. . . . . . . . . . . . . . . . . . . . . . . . . . . . . . . . . . . . . . . . . . . . . . . . . . . . . . . . . . . . . . 64
10.1
Description
The CallInfo tool detects call information using the DM3 board’s Telephony Service Provider
(TSP) resource. The CallInfo tool confirms that the TSP component is working correctly by
monitoring select messages on a per call basis.
10.2
Guidelines
CallInfo is a QScript utility. For more information about QScript utilities, refer to Chapter 27,
“QScript Reference”.
To use CallInfo, specify the call-related messages you want to monitor as follows:
1. Launch the CallInfo tool from the command line.
2. Click the Action menu on the CallInfo display. Highlight Select Ids and select the group of
call-related events you want to trace. The following menu selections are available:
• CallInfoSet: TSP-related call messages
• IE Set: Information elements of ISDN-related messages (focuses on small pieces of
information)
• ISDNMsgSet: ISDN-related messages
3. A window of events specific to the event group that you selected will appear. Select the
messages you want to trace by clicking on them.
4. After you select messages, click the Action menu and choose DetectEvt. The tool will start
monitoring the messages you selected. As a new call comes in, it will write over the old call
information in the CallInfo display. A separate console window will open that tracks messages
coming in and shows the message sequence.
5. If you want to stop tracing events you selected and select other events to trace, click the Action
menu and select CancelEvt. Then follow steps 2 through 4 again.
6. To exit the CallInfo tool completely, select Action > Exit or close the window.
System Software Diagnostics Guide — September 2006
63
CallInfo Reference
10.3
Options
The CallInfo tool uses the following command line options:
-board <n>
Logical ID of board (required).Use the listboards utility (Linux) or the Configuration Manager
(DCM) (Windows) to obtain the board’s logical ID.
Note: The listboards utility is described in the Administration Guide for the release and the
Configuration Manager is described in the Configuration Guides for the (Windows)
release.
-line <n>
Line number that the tool will monitor (optional). The default value is 1.
-chan<n>
Channel number that the tool will monitor (optional). The default value is 1.
The following example runs the CallInfo tool on board 0, line 1, channel 1:
callinfo -board 0 -line 1 -chan 1
64
System Software Diagnostics Guide — September 2006
CAS Trace Reference
11.
11
This chapter provides reference information about the CAS Trace tool.The following topics are
included:
• Description. . . . . . . . . . . . . . . . . . . . . . . . . . . . . . . . . . . . . . . . . . . . . . . . . . . . . . . . . . . 65
• Guidelines . . . . . . . . . . . . . . . . . . . . . . . . . . . . . . . . . . . . . . . . . . . . . . . . . . . . . . . . . . . 65
• Options. . . . . . . . . . . . . . . . . . . . . . . . . . . . . . . . . . . . . . . . . . . . . . . . . . . . . . . . . . . . . . 65
11.1
Description
The CAS Trace tool enables you to track the bit level transitions on a robbed bit or CAS line. CAS
Trace prints messages on the screen in real time. The CAS Trace tool can be configured to output
the messages into a circular log file.
The CAS Trace tool is used for troubleshooting problems with an entire span. CAS Trace is used
for long-term debugging and logging for problems with timing, hung channels, and improper bit
states.
11.2
Guidelines
The CAS Trace tool consumes a portion of the CPU for each trunk that is logged and may generate
an exception if CTRL-C is used to exit the tool.
It may take several seconds to start the monitoring on all the trunks
The CAS instance is not valid until the line is in service, so you will have to run an application or
the Lineadmin and Phone tools to set the channel in-service before using this application. For
information about the Lineadmin tool, refer to the Administration Guide for the software release.
For information about the Phone tool, refer to Chapter 25, “Phone Reference”.
11.3
Options
The CAS Trace tool uses the following command line options:
-board <board list>
Logical ID of board (or boards) to trace (optional). The default is the lowest ID present in the
system. Use the listboards utility (Linux) or the Configuration Manager (DCM) (Windows) to
obtain the board’s logical ID.
Note: The listboards utility is described in the Administration Guide for the release and the
Configuration Manager is described in the Configuration Guides for the (Windows)
release.
System Software Diagnostics Guide — September 2006
65
CAS Trace Reference
-line <list of lines>
Line number that the tool will monitor (optional). The default value is 1.
-k <file size>
Size of each file to create in kilobytes (optional). If this option is not present the file size will
be infinite.
-# <number of files to create>
The number of files to trace to in a circular fashion. Each file will be the size specified with -k
(optional). The default is a single file.
-f <filename>
This will be the base filename. The board, line, and file numbers will be appended to the end of
this name (optional). The default is CasTrace.log.
-nodisplay
This flag will turn off the screen output to help reduce CPU overhead (optional). The default is
to have the screen display on. The display can also be toggled on and off by pressing d during
runtime.
-t1 / -e1
This flag will tell the system if you are using a T1 protocol or and E1 protocol (optional). The
default is T1. If you specify this incorrectly, you may not be able to initialize and monitor the
upper channels.
The following will run the CAS Trace tool on boards 0 and 1 for all four spans. Each line will trace
to two 1 MB files:
CAStrace -board 0 1 -line 1 2 3 4 -# 2 -k 1000
The output will look like the example below:
[
timestamp
] B## L## T## Rx=ABCD Tx=ABCD +delta(mS)
--------------------------------------------------------------[10/29 23:33:33.218] B0 L1 T1
Rx=1100 Tx=0000
[10/29 23:33:33.828] B0 L1 T2
Rx=0000 Tx=0000
[10/29 23:33:33.828] B0 L1 T1
Rx=1100 Tx=1100 +610
[10/29 23:33:34.531] B0 L1 T2
Rx=1100 Tx=0000 +703
[10/29 23:33:34.593] B0 L1 T2
Rx=1100 Tx=1100 +62
[10/29 23:33:34.609] B0 L1 T2
Rx=1100 Tx=0000 +16
[10/29 23:33:34.718] B0 L1 T3
Rx=1100 Tx=0000
[10/29 23:33:35.468] B0 L1 T1
Rx=0000 Tx=1100 +1640
[10/29 23:33:35.500] B0 L1 T3
Rx=1100 Tx=1100 +782
[10/29 23:33:35.562] B0 L1 T1
Rx=0000 Tx=0000 +94
[10/29 23:33:35.656] B0 L1 T4
Rx=1100 Tx=0000
[10/29 23:33:35.656] B0 L1 T1
Rx=0000 Tx=0000 +94
[10/29 23:33:36.625] B0 L1 T5
Rx=1100 Tx=0000
[10/29 23:33:36.843] B0 L1 T1
Rx=1100 Tx=0000 +1187
[10/29 23:33:36.906] B0 L1 T1
Rx=1100 Tx=1100 +63
[10/29 23:33:36.921] B0 L1 T1
Rx=1100 Tx=0000 +15
[10/29 23:33:37.203] B0 L1 T3
Rx=0000 Tx=1100 +1703
[10/29 23:33:37.328] B0 L1 T6
Rx=1100 Tx=0000
[10/29 23:33:37.328] B0 L1 T3
Rx=0000 Tx=0000 +125
[10/29 23:33:37.421] B0 L1 T3
Rx=0000 Tx=0000 +93
[10/29 23:33:37.843] B0 L1 T4
Rx=1100 Tx=1100 +2187
[10/29 23:33:37.875] B0 L1 T2
Rx=1100 Tx=1100 +3266
[10/29 23:33:37.875] B0 L1 T5
Rx=1100 Tx=1100 +1250
66
System Software Diagnostics Guide — September 2006
CAS Trace Reference
The output is separated into the following columns:
• Timestamp - the time at which the event is received down to msec
• B## - the board’s logical ID
• L## - the line number
• T## - the timeslot
• Rx=ABCD - the state of the Receive bits
• Tx=ABCD - the state of the Transmit bits
• Delta - the time between the last transition in msec (if this is blank, it is the initial bit state)
System Software Diagnostics Guide — September 2006
67
CAS Trace Reference
68
System Software Diagnostics Guide — September 2006
DebugAngel Reference
12.
12
This chapter provides reference information about the DebugAngel tool. The following topics are
included:
• Description. . . . . . . . . . . . . . . . . . . . . . . . . . . . . . . . . . . . . . . . . . . . . . . . . . . . . . . . . . . 69
• Guidelines . . . . . . . . . . . . . . . . . . . . . . . . . . . . . . . . . . . . . . . . . . . . . . . . . . . . . . . . . . . 69
• Command Line Options. . . . . . . . . . . . . . . . . . . . . . . . . . . . . . . . . . . . . . . . . . . . . . . . . 69
• Additional Configuration Options . . . . . . . . . . . . . . . . . . . . . . . . . . . . . . . . . . . . . . . . . 70
12.1
Description
The DebugAngel tool provides low-level firmware tracing to aid in low-level debugging. Running
as a Windows service or Linux Daemon, it polls the DM3 boards in the system and posts qPrintf( )
statements from the resources and DM3 kernel to a log file.
12.2
Guidelines
Once the service is running, no further action is needed. Any changes to your system (for example,
new boards) are automatically detected. On a Windows system, information is logged to the file
DebugAngel.log in the %INTEL_DIALOGIC_DIR%\log directory. On a Linux system, information
is logged to the file debugangel.log in the ${INTEL_DIALOGIC_DIR}/log directory.
12.3
Command Line Options
This section explains the command line options that can be used with the DebugAngel tool.
To install the service and start it running in automatic mode, enter the command:
DebugAngel -install
The DebugAngel tool uses the following options when it is invoked from the command line.
Notes: 1. Command line options are mutually exclusive.
2. On Linux systems, you must start DebugAngel from ${INTEL_DIALOGIC_DIR}/bin.
-instonly
Installs the service without starting it.
-start
Starts the service.
-stop
Stops the service.
System Software Diagnostics Guide — September 2006
69
DebugAngel Reference
-manual
Changes the service startup mode to manual.
-auto
Changes the service startup mode to automatic (default).
-remove
Removes the service (and stops it if it was started).
-status
Shows the service status.
12.4
Additional Configuration Options
Additional configuration options for DebugAngel are available under the Windows registry key
HKEY_LOCAL_MACHINE\SOFTWARE\Dialogic\DebugAngel.
Warning:
Incorrect manipulation of the Windows registry can render your system unusable, requiring that
you reinstall Windows. Only a system administrator qualified to modify the registry should change
the DebugAngel configuration.
The configuration options in the registry include:
DebugLevel -> 0
1 writes the log information to DebugView.
MaxFileSize -> 0
0 = no max. When the max size is reached, the file is truncated to 0.
LogFile -> default file name
AutoRename -> 1
1 (default) avoids erasing the file when the computer is restarted; the file is renamed
(name).bak. Other options are: 0 = don’t back up 2 = rename file to (name).(Day/Time_String)
3 = uses multiple files.
MaxFiles -> 1
Used by AutoRename 3 (default is 1 file).
70
System Software Diagnostics Guide — September 2006
Diagnostics Management
Console (DMC) Reference
13.
13
This chapter describes the Diagnostics Management Console (DMC) GUI. The following
information is included:
• Description. . . . . . . . . . . . . . . . . . . . . . . . . . . . . . . . . . . . . . . . . . . . . . . . . . . . . . . . . . . 71
• Guidelines . . . . . . . . . . . . . . . . . . . . . . . . . . . . . . . . . . . . . . . . . . . . . . . . . . . . . . . . . . . 72
• DMC Main Window . . . . . . . . . . . . . . . . . . . . . . . . . . . . . . . . . . . . . . . . . . . . . . . . . . . 72
• DMC Configuration Dialog . . . . . . . . . . . . . . . . . . . . . . . . . . . . . . . . . . . . . . . . . . . . . . 74
Procedures for using the DMC are provided in Chapter 3, “Using the Diagnostics Management
Console (DMC)”.
13.1
Description
The Diagnostics Management Console (DMC) provides a single portal from which you can launch
the diagnostic tools supplied with Intel® telecom software. The DMC also enables you to locate the
log files produced by these tools and view them with the appropriate viewer.
The DMC allows you to launch the diagnostic tools remotely through the standard remote control
methods provided with the operating system, such as SSH or Remote Desktop.
The DMC performs the following:
• Lists the available diagnostic tools for execution both locally and remotely
• Lists the diagnostic logs available both locally and remotely for viewing
• Launches the diagnostic tools, which execute within their own environment both locally and
within the constraints of the integrated remote management facilities of the operating system
or an integrated third party provider
• Launches viewers for displaying logged diagnostic data
• Maintains the association of diagnostic log files to appropriate viewers
• Presents error messages when it encounters errors during runtime
Details about using each diagnostic tool are provided in the other chapters of this document.
Procedures for using the DMC are provided in Chapter 3, “Using the Diagnostics Management
Console (DMC)”.
System Software Diagnostics Guide — September 2006
71
Diagnostics Management Console (DMC) Reference
13.2
Guidelines
When you launch the DMC, you will see a list of the available diagnostic tools and log files. The
DMC provides an easy means of accessing the tools and log files from one central location, but you
must know what you want to do with a given tool or log file and how to use it. Information about
diagnostic tasks and tools is provided in this Diagnostics Guide.
13.3
DMC Main Window
The main window of the Diagnostics Management Console (DMC) is the first window you see
after launching the DMC (see Figure 5).
This window consists of the following parts:
• Menu Bar
• Diagnostic Application Panels (local and remote)
• Log File Panel
Figure 5. DMC Main Window
72
System Software Diagnostics Guide — September 2006
Diagnostics Management Console (DMC) Reference
13.3.1
Menu Bar
The main window of the DMC has a menu bar along the top part of the window. This menu bar
allows you to access several drop-down menus. Most actions on these menus can also be performed
using shortcut keys. The menus, menu items, and shortcut keys are as follows:
File
• Open log file (CTRL+O) - Opens the log file that is selected (highlighted) in the log file
panel.
• Execute application (F5) - Launches the diagnostic tool that is selected (highlighted) in the
application panel. For more information about each tool, refer to the tool reference chapters in
this Diagnostics Guide.
• Exit (CTRL+X) - Closes the DMC.
Tools
• Configuration (F4) - Allows you to modify settings for the DMC. For more information, refer
to Section 13.4, “DMC Configuration Dialog”, on page 74.
Help
• Contents (F1) - Displays online help that describes the DMC and explains how to use the
DMC.
13.3.2
Diagnostic Application Panels
On the left side of the Diagnostics Management Console (DMC) main window are two panels: the
top panel lists local diagnostic applications and the bottom panel lists remote diagnostic
applications. Remote diagnostic applications will be listed only if the DMC has been configured to
launch diagnostic applications remotely (see Section 13.4, “DMC Configuration Dialog”, on page
74).
For instructions on launching diagnostic applications, refer to one of the following:
• Section 3.2, “Launching a Diagnostic Tool”, on page 23 (for local machine)
• Section 3.3, “Launching a Diagnostic Tool on a Remote Machine”, on page 24
Note:
13.3.3
The terms “diagnostic application” and “diagnostic tool” both refer to the diagnostic tools provided
with the Intel telecom software.
Log File Panel
The log file panel is on the right side of the Diagnostics Management Console (DMC) main
window. This panel allows you to select a log file to view.
System Software Diagnostics Guide — September 2006
73
Diagnostics Management Console (DMC) Reference
Viewing a log file
To view a log file, locate the file you want in the log file list, click on it to highlight it, and then
press Enter or select Open log file from the File menu or use the CTRL+O shortcut. You can also
double-click on the log file name to view it. The viewer that is associated with a given log file and
located on the local machine will be used to view the log file.
Listing of log files on the local machine
The log file panel of the DMC lists the diagnostic log files available for viewing based on the
directory path entered on the DMC Configuration Dialog.
Specifying a different location for log files
You can use the Browse button on the log file panel to locate log files. However, if you want to
change the default location in which the DMC will look for log files, you can specify it on the
DMC Configuration Dialog. You can access the DMC Configuration Dialog by selecting
Configuration from the Tools menu or pressing F4. A Browse button allows you to select a
directory for the Log File Directory field.
Note:
If the user-defined variable is empty or not valid, the DMC will use the environment variable set up
during installation of the Intel telecom software: INTEL_DIALOGIC_DIR/log.
Listing of log files over the network
The DMC can list log files from mapped drives over the network. You must set this up on the DMC
Configuration Dialog. You can access the DMC Configuration Dialog by selecting Configuration
from the Tools menu or pressing F4.
Display of error conditions
Whenever the DMC encounters an error while opening a log file for viewing, it will poll the
standard error stream of the operating system for the error message and display it to you.
13.4
DMC Configuration Dialog
The DMC Configuration Dialog (Figure 6) allows you to modify settings for the Diagnostics
Management Console (DMC). You must modify these settings if you want to use a diagnostic tool
on a remote machine, change the path to the log file directory, or preserve window size settings.
You can access the DMC Configuration Dialog by selecting Configuration from the Tools menu
or pressing F4.
74
System Software Diagnostics Guide — September 2006
Diagnostics Management Console (DMC) Reference
Figure 6. DMC Configuration Dialog
You can modify the following settings using the DMC Configuration Dialog:
• Log File Directory: This field shows the location where the DMC will search for log files. If
this field is empty or invalid, the DMC will use the environment variable
INTEL_DIALOGIC_LOG to specify the log file directory. This field is read-only by default.
A Browse button allows you to select a directory for this field.
• Window Size Settings: A checkbox setting allows you to choose whether you want the DMC
to remember its width and height settings since its last run. If you check this box, the next time
DMC loads, it will load the window size from its previous execution. If you do not check this
box, the DMC will load using the default value for width and height: 800 X 600 pixels.
• Remote Execution of CLI Tools: A checkbox setting allows you to use the DMC to execute
diagnostic tools remotely via Command Line Interface (CLI). If you check this box, you will
see (on the main screen) a list of all the diagnostic tools available to execute via CLI from a
remote machine. If you do not check this box, you will not see a list of diagnostic tools
available for remote use and you will not be able to use the diagnostic tools remotely.
• Remote Machine Name: If you want to use diagnostics tools on a remote machine, you must
enter the name of the remote machine here. The DMC will pass on this machine name to
remote methods such as SSH to connect to remote machines. If this field is not empty, the
DMC will try to use the machine name with remote tools. If the field is empty, when you
attempt remote execution the DMC will launch a dialog box in which you can provide the
machine name. In either case, if the machine name is invalid, the DMC will show an error and
discontinue execution of the remote tool.
• Remote Login UserName: You must enter the user name used for logging into the remote
machine.
• Remote Tool Path: You must specify the path of the diagnostic tool that you will use remotely
via a CLI. You can use the Browse Path button to specify the path.
System Software Diagnostics Guide — September 2006
75
Diagnostics Management Console (DMC) Reference
The DMC configuration settings are stored in a dmc.properties file even when the DMC is shut
down. When you start the DMC, it will reload the settings from this file. If this file is not found or
cannot be read for any reason, the DMC will use default values hard coded in the application. If
there is an error in saving the file for any reason (for example, unavailable disk space or I/O errors
of any kind), the DMC will notify you and abort saving the values.
76
System Software Diagnostics Guide — September 2006
DigitDetector Reference
14.
14
This chapter provides reference information about the DigitDetector tool.The following topics are
included:
• Description. . . . . . . . . . . . . . . . . . . . . . . . . . . . . . . . . . . . . . . . . . . . . . . . . . . . . . . . . . . 77
• Guidelines . . . . . . . . . . . . . . . . . . . . . . . . . . . . . . . . . . . . . . . . . . . . . . . . . . . . . . . . . . . 77
• Options. . . . . . . . . . . . . . . . . . . . . . . . . . . . . . . . . . . . . . . . . . . . . . . . . . . . . . . . . . . . . . 77
14.1
Description
The DigitDetector tool demonstrates the use of a DM3 board’s Tone Generator and Signal Detector
components. It provides the ability to detect digits at the local end of a channel connection.
14.2
Guidelines
DigitDetector is a QScript utility. For more information about QScript utilities, refer to Chapter 27,
“QScript Reference”.
To use the DigitDetector tool, you need a physical connection to the board. For example, two
network interface trunks can be looped or you might use a connection between end users. You can
then use the Phone tool at one end of the channel to generate dialed digits that can be detected by
the Digit Detector tool. For information about the Phone tool, refer to Chapter 25, “Phone
Reference”.
14.3
Options
The DigitDetector tool uses the following command line options:
-board <n>
Logical ID of board (required).Use the listboards utility (Linux) or the Configuration Manager
(DCM) (Windows) to obtain the board’s logical ID.
Note: The listboards utility is described in the Administration Guide for the release and the
Configuration Manager is described in the Configuration Guides for the (Windows)
release.
-line <n>
Line number that the tool will monitor for digits (optional). The default value is 1.
-chan<n>
Channel number that the tool will monitor for digits (optional). The default value is 1.
The following example runs the DigitDetector tool on board 0, line 1, channel 1:
System Software Diagnostics Guide — September 2006
77
DigitDetector Reference
digitdetector -board 0 -line 1 -chan 1
78
System Software Diagnostics Guide — September 2006
Dlgsnapshot Reference
15.
15
This chapter provides reference information about the Dlgsnapshot tool. The following topics are
included:
• Description. . . . . . . . . . . . . . . . . . . . . . . . . . . . . . . . . . . . . . . . . . . . . . . . . . . . . . . . . . . 79
• Guidelines . . . . . . . . . . . . . . . . . . . . . . . . . . . . . . . . . . . . . . . . . . . . . . . . . . . . . . . . . . . 79
• Options. . . . . . . . . . . . . . . . . . . . . . . . . . . . . . . . . . . . . . . . . . . . . . . . . . . . . . . . . . . . . . 80
15.1
Description
The Dlgsnapshot tool uses Intel® Dialogic® system software fault monitoring components to
generate a core dump file when one of the following faults is detected on a DM3 board:
• Control Processor (CP)
• Signal Processor (SP)
The autodump feature of the Dlgsnapshot tool is disabled by default. However, you can enable the
autodump feature if you want to use it. In the default state, no board or DSP will be automatically
reset as a result of a DSP failure.
If autodump is enabled, when a fault is detected, a core dump file is created in the log directory
under INTEL_DIALOGIC_DIR and the board that the fault occurred on is taken out of service
(stopped) without causing any other interruptions to the system. To reactivate the out-of-service
board, you must restart it.
You can also run the Dlgsnapshot tool on demand from the command line.
Note:
15.2
Dlgsnapshot is for use only on Intel® Dialogic® or Intel NetStructure® boards with a DM3
architecture. However, the SRAM dump is not supported on The Intel NetStructure® DMV-B,
DMN160TEC, and DMT160TEC boards.
Guidelines
Windows systems: When a core dump file is generated, you can send a .zip file containing the
contents of the %INTEL_DIALOGIC_DIR%\log directory along with the Windows event viewer
system log file (*.evt) to Intel’s telecom support resources for debugging purposes.
Linux systems: When a core dump file is generated, you can send a .tar file containing the
contents of the ${INTEL_DIALOGIC_DIR}/log directory to Intel’s telecom support resources for
debugging purposes.
System Software Diagnostics Guide — September 2006
79
Dlgsnapshot Reference
When boards are downloaded and you run Dlgsnapshot manually, a question is posed about
running diagnostic firmware. You must confirm that you want Dlgsnapshot to stop the running
board and download diagnostic firmware.
Each core dump file is named according to the type of fault detected and the date/time the fault
occurred. The naming convention of the core dump files is
faulttype_MM_DD_YY HH_NNxx_MS
where:
• faulttype denotes the type of fault (CPDump, SPDump, Counter [Windows only], or Driver
State)
• MM is a two-digit number indicating the month
• DD is a two-digit number indicating the day
• YY is a two-digit number indicating the year
• HH is a two-digit number indicating the hour
• NN is a two-digit number indicating the minute
• xx indicates whether the fault occurred din the AM or PM
• MS is a number indicating the milliseconds
Note:
If multiple DSPs on the same board generate a fault, the core dump file will only contain
information about the DSP that generated the initial fault.
Following are some examples of file names:
• CounterDump_11_03_2003 03_13PM_35
• StateDump_11_03_2003 03_13PM_35
All the dump files have a *.txt extension except the SRAM dump in Windows, which has a *.bin
extension.
15.3
Options
This section contains the following information:
• Enabling Autodump
• Running Dlgsnapshot on Demand
• Command Line Options
15.3.1
Enabling Autodump
If you want to enable autodump, open the dlgproductagent.cfg file located in the cfg directory and
uncomment out the following line:
DIAGNOSTIC_AGENT
= libdlgdm3diagagent
The default looks like this (the line you must change is in bold):
80
System Software Diagnostics Guide — September 2006
Dlgsnapshot Reference
[DM3]
;DETECTOR_AGENT
= libdlgdm3detectoragent
FAULTDETECTOR_AGENT = libdlgdm3faultdetectoragent
;INITIALIZER_AGENT
= libdlgdm3initializeragent
;CLOCKING_AGENT
= libdlgdm3clockagent
;DIAGNOSTIC_AGENT
= libdlgdm3diagagent
You must change it to the following (bold text shows the changed line):
[DM3]
;DETECTOR_AGENT
= libdlgdm3detectoragent
FAULTDETECTOR_AGENT = libdlgdm3faultdetectoragent
;INITIALIZER_AGENT
= libdlgdm3initializeragent
;CLOCKING_AGENT
= libdlgdm3clockagent
DIAGNOSTIC_AGENT
= libdlgdm3diagagent
When you make this change, Dlgsnapshot will run automatically when a fault is detected.
15.3.2
Running Dlgsnapshot on Demand
The Dlgsnapshot tool can also be run on demand from the command line. SeeSection 15.3.3,
“Command Line Options”, on page 81. Running Dlgsnapshot from the command line may also
stop the board, depending on the options selected.
If you try to run the Dlgsnapshot tool on a board version that doesn’t support it, you will get a
message that Dlgsnapshot is not supported and the command failed.
15.3.3
Command Line Options
The Dlgsnapshot tool uses the following command line options:
-f<number 1 to 6>
This option, which is mandatory, indicates which print buffer will be dumped. Values are as
follows:
1 – SRAM (not applicable to all releases)
2 – DRIVER_BOARD_STATE_DUMP
3 – DRIVER_BOARD_COUNTER_DUMP (Windows only)
4 – DOWNLOAD_OFFDIAG
5 – PROCESSOR_DUMP_ONLY (this value requires that you use the -r option)
6 – DUMP_ALL (this value requires that you use the -r option)
-a<AUID>
Dumps the print buffer of the processor specified with the -r option on the board with the
given Addressable Unit IDentifier (AUID).
-r<processor number>
The -r option is mandatory with -f option 5 or 6.
-l<logical ID>
Dumps the print buffer of the processor specified with the -r option on the board with the
given logical ID.
System Software Diagnostics Guide — September 2006
81
Dlgsnapshot Reference
-p<physical slot number>
Dumps the print buffer of the processor specified with the -r option on the board with the
given physical bus number.
-b<PCI bus number> -s<PCI slot number>
Dumps the print buffer of the processor with the -r option on the board with the given PCI bus
number and given PCI slot number.
-h
Displays the help screen.
-v
Displays the version number of Dlgsnapshot.
The following shows the usage of the command and its options:
dlgsnapshot [-a -r -f] [-l -r -f] [-p -r -f] [-b -s -r -f] [-h] [-v]
Example: To dump all for a board with AUID=50002 r1 (CP), you would use the following:
dlgsnapshot -a50002 -r1 -f6
Example: To dump all for a board with AUID=50002 r2 (SP2), you would use the following:
dlgsnapshot -a50002 -r2 -f5
82
System Software Diagnostics Guide — September 2006
16
DM3Insight Reference
16.
This chapter provides information about the DM3Insight tool.
DM3Insight is a tool used to capture message and stream traffic from the DM3 device driver.
DM3Insight can be used for the following:
• Debugging/understanding applications, driver, kernel by capturing traffic and analyzing the
trace output
• Viewing messages that are encountered only between the device driver and the DM3 board
• Eliminating orphan messages and streams
• Calculating the turnaround time for messages
• Viewing messages from the board that have incorrect source/destination address or transaction
Id and therefore never reach the application
• Viewing error messages from the board like Std_MsgError or QMsgUndelivered, which are
not handled (or reported) by simple applications
For complete information about configuring and using the DM3Insight tool, refer to the
DM3Insight online help file (DM3Insight.chm). The default directory for this file is
%INTEL_DIALOGIC_DIR%\bin1 for Windows* systems.
1.
To
find
out
what
the
INTEL_DIALOGIC_DIR
directory
is,
type
echo
%INTEL_DIALOGIC_DIR% on a command prompt and note the path displayed.
System Software Diagnostics Guide — September 2006
83
DM3Insight Reference
84
System Software Diagnostics Guide — September 2006
DM3post Reference
17.
17
This chapter provides reference information about the DM3post tool. The following topics are
included:
• Description. . . . . . . . . . . . . . . . . . . . . . . . . . . . . . . . . . . . . . . . . . . . . . . . . . . . . . . . . . . 85
• Guidelines . . . . . . . . . . . . . . . . . . . . . . . . . . . . . . . . . . . . . . . . . . . . . . . . . . . . . . . . . . . 85
• Options. . . . . . . . . . . . . . . . . . . . . . . . . . . . . . . . . . . . . . . . . . . . . . . . . . . . . . . . . . . . . . 86
A procedure for using this tool is provided in Section 4.2, “Checking an Individual Board”, on page
27.
17.1
Description
The DM3post tool, sometimes referred to as “POST-on-demand”, can perform diagnostics on a
stopped board at any time to detect and isolate possible hardware faults.
Note:
17.2
This tool can be run on Intel NetStructure® on DM3 architecture boards and Intel NetStructure®
IPT Series boards.
Guidelines
The board must be in a “stopped” state before the DM3post tool can be run. If you do not use the
reset option (-r), DM3post will not reset the board and will only retrieve the POST results for the
last reset that occurred. If you use DM3post with the reset option, DM3post will force a full reset of
the specified board, forcing the Control Processor (CP) POST diagnostics to run. DM3post will
then retrieve the POST results from the SRAM and provide a PASS/FAIL indication to you. The
board will remain in a stopped state, so you must restart the board.
DM3post also provides an option to run POST on a chassis level. By using the chassis option (-c),
DM3post will retrieve the results of the last run POST for all DM3 boards in the chassis. By using
the chassis option with the reset option, you can run POST on all DM3 boards in the system. When
using the chassis option, it is not necessary to provide the bus and slot numbers. Any option other
than the reset option will be ignored when using the chassis option. In addition to output on the
screen, more detailed output is logged to a log file, dm3post.log, by default.
Notes: 1. Signal Processors (SP) are not diagnosed by DM3post. However, SP health is verified as part of
the board’s download process. Therefore sufficient diagnostic coverage for hardware is obtained
when a board passes POST and is successfully downloaded.
2. On Windows systems, for For the slot number (-s option), provide the PCI slot number. This
information may be obtained from the Configuration Manager (DCM), which is described in the
Configuration Guides for the release. On Linux systems, for the slot number, provide the
physical slot number. This information may be obtained from the listboards utility, which is
described in the Administration Guide for the release.
System Software Diagnostics Guide — September 2006
85
DM3post Reference
17.3
Options
The following command line options are used with the DM3post tool:
-s<n>
slot number (required). On Windows systems, use Use the Configuration Manager (DCM) to
obtain the board’s slot number. On Linux systems, use the listboards utility, which is described
in the Administration Guide for the software release.
Note: The listboards utility is described in the Administration Guide for the release and the
Configuration Manager is described in the Configuration Guides for the (Windows)
release.
-b<n>
bus number (optional if there is only one bus or if the slot number is unique)
-l
logs event (optional). Output is logged to dm3post.log.
-q
suppresses output (optional). The tool operates in silent mode.
-r
resets board before retrieving diagnostics results (optional). If not set, results displayed will be
those generated at board startup.
-h
displays the tool’s help screen
-v
displays the program version
Example 1: Run DM3post on a board in slot 17, bus 0
The following example runs DM3post on a board in slot 17, bus 0:
dm3post -s17 -b0
You will get the following response:
You have chosen to read the initial POST diagnostic results from the board in slot 17, bus 0. No
board reset will occur.
Do you wish to continue (y/n)?
If you answer Y, the following will be printed to the screen:
Retrieving results...
The success/failure message will be printed to the screen when POST is complete. Here is an
example:
SUCCESS: POST passed for board in slot 17, bus 0. Diagnostic Codes: 0x03 0xfc
86
System Software Diagnostics Guide — September 2006
DM3post Reference
Example 2: Dm3 post run with the reset option on a board in slot 17,
bus 0
The following example runs DM3post with the reset option on a board in slot 17, bus 0:
dm3post -s17 -b0 -r
You will get the following response:
You have chosen to run diagnostics on the board in slot 17, bus 0.
Do you wish to continue (y/n)?
If you answer Y, the following will be printed to the screen:
dm3post processing...
The success/failure message will be printed to the screen when POST is complete. Here is an
example:
SUCCESS: POST passed for board in slot 17, bus 0. Diagnostic Codes: 0x03 0xfc
System Software Diagnostics Guide — September 2006
87
DM3post Reference
88
System Software Diagnostics Guide — September 2006
GCEV_TRACEDATA Reference
18.
18
This chapter describes the data layout in the GCEV_TRACEDATA event so that a parser can be
designed. This chapter also provides a sample parser and sample output. This information is
provided in the following sections:
• Description. . . . . . . . . . . . . . . . . . . . . . . . . . . . . . . . . . . . . . . . . . . . . . . . . . . . . . . . . . . 89
• Structure of Data - Tracing CAS Signaling . . . . . . . . . . . . . . . . . . . . . . . . . . . . . . . . . . 89
• Structure of Data - Tracing ISDN Trunks . . . . . . . . . . . . . . . . . . . . . . . . . . . . . . . . . . . 91
• Payload Formats . . . . . . . . . . . . . . . . . . . . . . . . . . . . . . . . . . . . . . . . . . . . . . . . . . . . . . 91
• Sample Parser . . . . . . . . . . . . . . . . . . . . . . . . . . . . . . . . . . . . . . . . . . . . . . . . . . . . . . . . 94
• Sample Parser Output . . . . . . . . . . . . . . . . . . . . . . . . . . . . . . . . . . . . . . . . . . . . . . . . . . 102
18.1
Description
Inbound and outbound R2MF tones and CAS bit transitions/states can be traced using Global Call
APIs and the GCEV_TRACEDATA event. The GCEV_TRACEDATA event is received on a board
device whenever the trace buffer maintained by the firmware is full. The size of the maximum data
received with this event will not exceed 1000 bytes.
For ISDN, the GCEV_TRACEDATA is generated for every ISDN frame received or transmitted.
The size of the maximum data received will not exceed the maximum allowable Layer 2 frame size
of 260 bytes.
This chapter describes the data layout in the GCEV_TRACEDATA so that a parser can be
designed. The actual data content refers to actions/state changes occurring on a particular
trunk/channel. The data comes from an Intel® telecom product’s firmware in response to either a
call being presented to an Intel telecom board or an application trying to initiate a call through the
Intel telecom board.
For information about performing the tracing, refer to Chapter 8, “Tracing CAS Signaling Using
Global Call” or Chapter 9, “Tracing Multiple ISDN Trunks Using Global Call”. This chapter
describes the trace data.
Note:
18.2
This tracing procedure is only relevant to systems using an Intel NetStructure DMT160TEC digital
telephony interface board.
Structure of Data - Tracing CAS Signaling
Table 1 shows the structure of the data, listing the fields and size of each field. A description of the
fields follows the table.
System Software Diagnostics Guide — September 2006
89
GCEV_TRACEDATA Reference
Table 1. Structure of Data - Tracing CAS Signaling
Field
Size of Field
Data Type
1
Timestamp
4
Length of Payload / Channel Number*
2
Payload
N
Data Type
1
Timestamp
4
Length of Payload / Channel Number
2
Payload
N
... ...
...
*The most significant 5 bits represent the channel number and the least
significant 11 bits represent the length of the payload.
Following are descriptions of the fields listed in Table 1:
Data Type
This field describes the type of data in the payload following it. At this time, the firmware
supports four data types:
• 02H is CAS data
• 04H is R2MF tone data
• 08H is SigDet ON data
• 10H is SigDet OFF data
More information on data types is provided in Section 18.4, “Payload Formats”, on page 91.
Timestamp
This field is a 4 byte field (unsigned 32 bit integer) representing the number of firmware timer
ticks since the board was started. Each tick is equivalent to 4 milliseconds. This field is
encoded in the Little Endian format1.
Length of payload/Channel number
This field is a 2 byte field (unsigned 16 bit integer) whose most significant 5 bits represent the
channel number and least significant 11 bits represent the length of the payload starting at the
next byte. This field is encoded in the Little Endian format1.
Payload
This field is a number of bytes (number specified by the “length of payload” field above)
representing the event that occurred in the firmware.
1. The least significant byte of the number is stored in the lowest memory address, and the most
significant byte of the number is stored in the highest memory address.
90
System Software Diagnostics Guide — September 2006
GCEV_TRACEDATA Reference
18.3
Structure of Data - Tracing ISDN Trunks
Table 2 shows the structure of the data, listing the fields and size of each field. A description of the
fields follows the table.
Table 2. Structure of GCEV_TRACEDATA Data for ISDN
Field
Size of Field
Send/Receive Flag
4
Timestamp
4
Payload
N
Following are descriptions of the fields listed in Table 1-3:
Send/Receive Flag
When this field has a value of 01, it indicates a frame sent by the firmware to the network.
When this field has a value of 02, it indicates a frame received by the firmware from the
network.
Timestamp
This field is a 4 byte field (unsigned 32 bit integer) representing the number of firmware timer
ticks since the board was started. Each tick is equivalent to 4 milliseconds. This field is
encoded in the Little Endian format (the least significant byte of the number is stored in the
lowest memory address, and the most significant byte of the number is stored in the highest
memory address).
Payload
This field is a number of bytes representing the event that occurred in the firmware.
18.4
Payload Formats
This section describes the payload formats for CAS and ISDN:
• CAS Payload Formats
• ISDN Payload Format
18.4.1
CAS Payload Formats
The firmware currently supports four data types. This section describes how to decode the payload
field for each data type:
• CAS Data (data type field = 02H)
• R2MF Data (data type field = 04H)
• SigDet ON Data (data type field = 08H)
• SigDet OFF Data (data type field = 10H)
System Software Diagnostics Guide — September 2006
91
GCEV_TRACEDATA Reference
CAS Data (data type field = 02H)
This data type represents an event indicating a raw transition detected by the firmware. The
structure of the payload is as follows:
struct CAS_Transition {
unsigned int32
unsigned int8
unsigned int8
unsigned int32
unsigned int32
};
Label;
PreTransitionCode;
PostTransitionCode;
Direction;
Timestamp;
Terms in the above payload structure are defined as follows:
Label
Label is significant to the firmware only. It can be ignored by the host application receiving the
GCEV_TRACEDATA event.
PreTransitionCode
The code prior to the transition.
PostTransitionCode
The code after the transition.
Direction
The direction in which the transition was detected (inbound=1, outbound=2).
Timestamp
The time that the transition was detected in milliseconds.
R2MF Data (data type field = 04H)
This data type represents a tone that is represented by the following structure:
struct R2MF_Tone
unsigned int8
unsigned int8
unsigned int8
};
{
Trunk;
Channel;
ToneID;
Terms in the above structure are defined as follows:
Trunk
The trunk number on which the tone was received.
Channel
The channel number on which the tone was received.
ToneID
The identifier for the tone.
92
System Software Diagnostics Guide — September 2006
GCEV_TRACEDATA Reference
SigDet ON Data (data type field = 08H)
This data type represents an MF or DTMF signal ON condition in the firmware Signal Detector,
and is represented by the following structure:
struct SigDet_ON
unsigned
unsigned
unsigned
unsigned
unsigned
unsigned
unsigned
unsigned
unsigned
};
{
int32
int32
int8
int8
int8
int16
int16
int32
int32
EventLabel;
SignalId;
SignalLabel[4];
LabelSize;
RepCount;
Freq1;
Freq2;
OnTime;
OffTime;
Terms in the above structure are defined as follows:
EventLabel
EventLabel is significant to the firmware only. It can be ignored by the host application
receiving the GCEV_TRACEDATA event.
SignalID
SignalID identifies the signal that triggered.
SignalLabel
An array of bytes that identifies the signal that triggered.
LabelSize
The number of valid unsigned int8's in SignalLabel.
RepCount
The number of times this signal was detected.
Freq1
The actual frequency in Hz of tone 1 detected.
Freq2
The actual frequency in Hz of tone 2 detected.
OnTime
The actual ON time in 10 msec units.
OffTime
The actual OFF time in 10 msec units.
SigDet OFF Data (data type field = 10H)
This data type represents an MF or DTMF signal OFF condition in the firmware Signal Detector,
and is represented by the following structure:
struct SigDet_OFF
unsigned int32
unsigned int32
unsigned int8
{
EventLabel;
SignalId;
SignalLabel[4];
System Software Diagnostics Guide — September 2006
93
GCEV_TRACEDATA Reference
unsigned int8
LabelSize;
};
Terms in the above structure are defined as follows:
EventLabel
EventLabel is significant to the firmware only. It can be ignored by the host application
receiving the GCEV_TRACEDATA event.
SignalID
SignalID identifies the signal that triggered.
SignalLabel
An array of bytes that identifies the signal that triggered.
LabelSize
The number of valid unsigned int8's in SignalLabel.
18.4.2
ISDN Payload Format
The payload contains the raw contents of the frame received or sent by the firmware to/from the
network; i.e., it contains a frame in ISDN Layer 2 format as described in the LAP-D specification
or ITU-T document Q.921 (found at http://www.itu.int/home/index.html). If this Layer 2 frame is
an INFORMATION frame, it may further encapsulate an ISDN Layer 3 frame, whose format is
described in ITU-T document Q.931 (also found at http://www.itu.int/home/index.html). An
example of a payload containing a Layer 2 frame encapsulating a Layer3 SETUP frame is shown
below.
Layer 2
|<------->|
02 01 00 00
03 80 90 a2
06 21 83 31
32 30 30 32
18.5
Encapsulated
Layer 3 SETUP
Frame
|<---------------->
08 02 6e f5 05 04
18 03 a9 83 81 6c
32 33 34 70 05 81
Sample Parser
The following is an example of how to parse the raw data content passed back as part of the tracing
of inbound and outbound R2MF tones and CAS bit transitions/states. Sample output of the parser is
also provided for reference (see Section 18.6, “Sample Parser Output”, on page 102). You can copy
this example or design your own parser.
Note:
This does not apply to ISDN trace formatting.
//
//
//
//
//
//
94
mdfParseCAS.c
Takes a CAS Trace file & parses it to text
Ideally allow selective output on a per timeslot basis
Relies on tracing application logging:
System Software Diagnostics Guide — September 2006
GCEV_TRACEDATA Reference
//
//
//
//
//
//
TraceData->seq_no
TraceData->data_size
TraceData->data_buf
(unsigned long)
(unsigned short)
(char[data_size])
Ideally allow selective output on a per timeslot basis
#include
#include
#include
#include
#include
<stdio.h>
<stdlib.h>
<ctype.h>
<conio.h>
<string.h>
#define
#define
#define
#define
CAS_DATA
R2MF_TONE
SIGDET_ON
SIGDET_OFF
FILE
FILE
*hInFile;
*hOutFile;
0x02
0x04
0x08
0x10
// Function Prototypes
void
mdfProcessCas(void);
void
mdfProcessR2mf(void);
void
mdfProcessToneOn(void);
void
mdfProcessToneOff(void);
void
mdfProcessTimestamp(void);
char*
mdfLsNibble2Bin(unsigned char Code);
char*
mdfMsNibble2Bin(unsigned char Code);
char*
mdfByte2Bin(unsigned char Code);
void
mdfReadError(char* szMsg);
void main(int argc, char *argv[])
{
unsigned long
iSeq;
unsigned long
iSeqCheck = 1;
unsigned short iSize;
unsigned char
iType;
fpos_t
iPos;
fpos_t
iPayloadEnd;
// Test Source File is Specified
if(argc < 2)
{
printf("Input File Not Specified\n");
printf("Usage: %s InputFile\n", argv[0]);
return;
}
// Open Source File
if((hInFile = fopen(argv[1], "rb")) == NULL)
{
printf("File Open Failed On %s\n", argv[1]);
return;
}
// add a .txt to the input filename
strcat(argv[1], ".parsed.txt");
// create output file
if((hOutFile = fopen(argv[1], "w")) == NULL)
{
printf("File Open Failed On %s\n", argv[1]);
System Software Diagnostics Guide — September 2006
95
GCEV_TRACEDATA Reference
return;
}
printf("Seq#
Bytes\n");
// get seq
while(fread(&iSeq, sizeof(unsigned long), 1, hInFile) == 1)
{
// get size of payload
if(fread(&iSize, sizeof(unsigned short), 1, hInFile) != 1)
{
mdfReadError("Payload Size");
}
printf("%3u
%4u\n", iSeq, iSize);
fprintf(hOutFile, "# Timestamp
Chan TxABCD RxABCD TxR2 RxR2
Sequence No.
%u #\n", iSeq);
fgetpos(hInFile, &iPos);
iPayloadEnd = iPos + iSize;
// process payload
while(iPos < iPayloadEnd)
{
// get data type label
if(fread(&iType, sizeof(unsigned char), 1, hInFile) != 1)
{
mdfReadError("Type Label");
}
// process timestamp
mdfProcessTimestamp();
// process data based on type
switch(iType)
{
case CAS_DATA:
mdfProcessCas();
break;
case R2MF_TONE:
mdfProcessR2mf();
break;
case SIGDET_ON:
mdfProcessToneOn();
break;
case SIGDET_OFF:
mdfProcessToneOff();
break;
default:
break;
}
fgetpos(hInFile, &iPos);
}
}
mdfReadError("Normal Exit");
}
void mdfProcessCas(void)
{
unsigned short LenChan;
unsigned long
Label;
unsigned char
PreCode;
unsigned char
PostCode;
unsigned long
Direction;
96
System Software Diagnostics Guide — September 2006
GCEV_TRACEDATA Reference
unsigned long
Timestamp;
// read all the 'parts' from the file
// [Tried using a structure but always read the wrong size??]
if(fread(&LenChan, sizeof(unsigned short), 1, hInFile) != 1)
{
mdfReadError("CAS LenChan");
}
if(fread(&Label, sizeof(unsigned long), 1, hInFile) != 1)
{
mdfReadError("CAS Label");
}
if(fread(&PreCode, sizeof(unsigned char), 1, hInFile) != 1)
{
mdfReadError("CAS PreCode");
}
if(fread(&PostCode, sizeof(unsigned char), 1, hInFile) != 1)
{
mdfReadError("CAS PostCode");
}
if(fread(&Direction, sizeof(unsigned long), 1, hInFile) != 1)
{
mdfReadError("CAS Direction");
}
if(fread(&Timestamp, sizeof(unsigned long), 1, hInFile) != 1)
{
mdfReadError("CAS Timestamp");
}
// Timeslot is in Most Significant 5 bits
fprintf(hOutFile, "%02d ", (LenChan & 0xF800) >> 11);
fprintf(hOutFile, "%s", ((Direction & 0x00020000) >> 17) ? " " : "
fprintf(hOutFile, "%s", mdfLsNibble2Bin(PostCode));
");
fprintf(hOutFile, "\n");
}
void mdfProcessR2mf(void)
{
unsigned short LenChan;
unsigned char
Trunk;
unsigned char
Channel;
unsigned char
ToneID;
if(fread(&LenChan, sizeof(unsigned short), 1, hInFile) != 1)
{
mdfReadError("R2MF LenChan");
}
if(fread(&Trunk, sizeof(unsigned char), 1, hInFile) != 1)
{
mdfReadError("R2MF Trunk");
}
if(fread(&Channel, sizeof(unsigned char), 1, hInFile) != 1)
{
mdfReadError("R2MF Channel");
}
System Software Diagnostics Guide — September 2006
97
GCEV_TRACEDATA Reference
if(fread(&ToneID, sizeof(unsigned char), 1, hInFile) != 1)
{
mdfReadError("R2MF ToneID");
}
// Timeslot is in Most Significant 5 bits
fprintf(hOutFile, "%02d ", (LenChan & 0xF800) >> 11);
fprintf(hOutFile, "%s", ((ToneID & 0x80) >> 7) ? "
" : "
");
fprintf(hOutFile, "%2d", ToneID & 0x7F);
//
//
",
//
//
//
fprintf(hOutFile, "%s%2d%s",
((ToneID & 0x80) >> 7) ? "
ToneID & 0x7F,
((ToneID & 0x80) >> 7) ? "
fprintf(hOutFile, "%s", mdfByte2Bin(ToneID));
" : "
" : "
");
fprintf(hOutFile, "\n");
}
void mdfProcessToneOn(void)
{
unsigned short LenChan;
unsigned long
EvtLabel;
unsigned long
SigId;
unsigned char
SigLabel[4];
unsigned char
LabelSize;
unsigned char
RepCount;
unsigned short Freq1;
unsigned short Freq2;
unsigned long
OnTime;
unsigned long
OffTime;
if(fread(&LenChan, sizeof(unsigned short), 1, hInFile) != 1)
{
mdfReadError("ToneOn LenChan");
}
if(fread(&EvtLabel, sizeof(unsigned long), 1, hInFile) != 1)
{
mdfReadError("ToneOn EvtLabel");
}
if(fread(&SigId, sizeof(unsigned long), 1, hInFile) != 1)
{
mdfReadError("ToneOn SigId");
}
if(fread(&SigLabel[4], sizeof(unsigned char[4]), 1, hInFile) != 1)
{
mdfReadError("ToneOn SigLabel");
}
if(fread(&LabelSize, sizeof(unsigned char), 1, hInFile) != 1)
{
mdfReadError("ToneOn LabelSize");
return;
}
if(fread(&RepCount, sizeof(unsigned char), 1, hInFile) != 1)
{
mdfReadError("ToneOn RepCount");
}
98
System Software Diagnostics Guide — September 2006
GCEV_TRACEDATA Reference
if(fread(&Freq1, sizeof(unsigned short), 1, hInFile) != 1)
{
mdfReadError("ToneOn Freq1");
}
if(fread(&Freq2, sizeof(unsigned short), 1, hInFile) != 1)
{
mdfReadError("ToneOn Freq2");
}
if(fread(&OnTime, sizeof(unsigned long), 1, hInFile) != 1)
{
mdfReadError("ToneOn OnTime");
}
if(fread(&OffTime, sizeof(unsigned long), 1, hInFile) != 1)
{
mdfReadError("ToneOn OffTime");
}
// Timeslot is in Most Significant 5 bits
fprintf(hOutFile, "%02d ", (LenChan & 0xF800) >> 11);
fprintf(hOutFile, "SIG_ON ");
//
fprintf(hOutFile,
fprintf(hOutFile,
//
fprintf(hOutFile,
//
fprintf(hOutFile,
//
fprintf(hOutFile,
//
fprintf(hOutFile,
fprintf(hOutFile,
SigLabel[4]);
fprintf(hOutFile,
fprintf(hOutFile,
fprintf(hOutFile,
fprintf(hOutFile,
fprintf(hOutFile,
fprintf(hOutFile,
" EvtLabel:0x%x", EvtLabel);
" SigId:0x%08x", SigId);
" SigLabel[1]:0x%02x", SigLabel[1]);
" SigLabel[2]:0x%02x", SigLabel[2]);
" SigLabel[3]:0x%02x", SigLabel[3]);
" SigLabel[4]:0x%02x", SigLabel[4]);
" SigLabel:0x%02x%02x%02x%02x", SigLabel[1], SigLabel[2], SigLabel[3],
"
"
"
"
"
"
LabelSize:%u", LabelSize);
RepCount:%u", RepCount);
Freq1:%uHz", Freq1);
Freq2:%uHz", Freq2);
OnTime:%umSec", OnTime * 10);
OffTime:%umSec", OffTime * 10);
fprintf(hOutFile, "\n");
}
void mdfProcessToneOff(void)
{
unsigned short LenChan;
unsigned long
EvtLabel;
unsigned long
SigId;
unsigned char
SigLabel[4];
unsigned char
LabelSize;
if(fread(&LenChan, sizeof(unsigned short), 1, hInFile) != 1)
{
mdfReadError("ToneOff LenChan");
}
if(fread(&EvtLabel, sizeof(unsigned long), 1, hInFile) != 1)
{
mdfReadError("ToneOff EvtLabel");
}
if(fread(&SigId, sizeof(unsigned long), 1, hInFile) != 1)
{
mdfReadError("ToneOff SigId");
}
if(fread(&SigLabel[4], sizeof(unsigned char[4]), 1, hInFile) != 1)
System Software Diagnostics Guide — September 2006
99
GCEV_TRACEDATA Reference
{
mdfReadError("ToneOff SigLabel");
}
if(fread(&LabelSize, sizeof(unsigned char), 1, hInFile) != 1)
{
mdfReadError("ToneOff LabelSize");
}
// Timeslot is in
fprintf(hOutFile,
fprintf(hOutFile,
//
fprintf(hOutFile,
fprintf(hOutFile,
//
fprintf(hOutFile,
//
fprintf(hOutFile,
//
fprintf(hOutFile,
//
fprintf(hOutFile,
fprintf(hOutFile,
SigLabel[4]);
fprintf(hOutFile,
fprintf(hOutFile,
}
Most Significant 5 bits
"%02d ", (LenChan & 0xF800) >> 11);
"SIG_OFF");
" EvtLabel:0x%x", EvtLabel);
" SigId:0x%08x", SigId);
" SigLabel[1]:0x%02x", SigLabel[1]);
" SigLabel[2]:0x%02x", SigLabel[2]);
" SigLabel[3]:0x%02x", SigLabel[3]);
" SigLabel[4]:0x%02x", SigLabel[4]);
" SigLabel:0x%02x%02x%02x%02x", SigLabel[1], SigLabel[2], SigLabel[3],
" LabelSize:%u", LabelSize);
"\n");
void mdfProcessTimestamp(void)
{
unsigned long
iTicks;
unsigned long
iTemp;
unsigned long
iHours;
unsigned long
iMins;
unsigned long
iSecs;
unsigned long
imSecs;
// get timestamp
if(fread(&iTicks, sizeof(unsigned long), 1, hInFile) != 1)
{
mdfReadError("ProcessTimestamp iTicks");
}
// convert ticks to mSecs
iTemp = 4 * iTicks;
// get the 'odd' mSecs
imSecs = iTemp % 1000;
// reduce to Secs
iTemp = iTemp / 1000;
// get the 'odd' Secs
iSecs = iTemp % 60;
// reduce to Mins
iTemp = iTemp / 60;
// get the 'odd' Mins
iMins = iTemp % 60;
// get the Hours
iHours = iTemp / 60;
fprintf(hOutFile, "%2d:%02d:%02d.%03d ",
iHours,
iMins,
iSecs,
imSecs);
}
100
System Software Diagnostics Guide — September 2006
GCEV_TRACEDATA Reference
char* mdfLsNibble2Bin(unsigned char Code)
{
static char sTemp[5];
sTemp[0]
sTemp[1]
sTemp[2]
sTemp[3]
sTemp[4]
=
=
=
=
=
((Code & 0x08) >> 3) ? '1' : '0';
((Code & 0x04) >> 2) ? '1' : '0';
((Code & 0x02) >> 1) ? '1' : '0';
(Code & 0x01) ? '1' : '0';
'\0';
return sTemp;
}
char* mdfMsNibble2Bin(unsigned char Code)
{
static char sTemp[5];
sTemp[0]
sTemp[1]
sTemp[2]
sTemp[3]
sTemp[4]
=
=
=
=
=
((Code & 0x80) >> 3) ? '1' : '0';
((Code & 0x40) >> 2) ? '1' : '0';
((Code & 0x20) >> 1) ? '1' : '0';
(Code & 0x10) ? '1' : '0';
'\0';
return sTemp;
}
char* mdfByte2Bin(unsigned char Code)
{
static char sTemp[10];
sTemp[0]
sTemp[1]
sTemp[2]
sTemp[3]
sTemp[4]
sTemp[5]
sTemp[6]
sTemp[7]
sTemp[8]
sTemp[9]
=
=
=
=
=
=
=
=
=
=
((Code & 0x80) >> 7) ? '1'
((Code & 0x40) >> 6) ? '1'
((Code & 0x20) >> 5) ? '1'
((Code & 0x10) >> 4) ? '1'
' ';
((Code & 0x08) >> 3) ? '1'
((Code & 0x04) >> 2) ? '1'
((Code & 0x02) >> 1) ? '1'
(Code & 0x01) ? '1' : '0';
'\0';
:
:
:
:
'0';
'0';
'0';
'0';
: '0';
: '0';
: '0';
return sTemp;
}
void mdfReadError(char* szMsg)
{
printf("\n%s - ", szMsg);
fprintf(hOutFile, "\n%s - ", szMsg);
if(feof(hInFile))
{
printf("EOF Reached\n");
fprintf(hOutFile, "EOF Reached\n");
}
else if(ferror(hInFile))
{
printf("Read Error\n");
fprintf(hOutFile, "Read Error\n");
}
fclose(hOutFile);
fclose(hInFile);
exit(0);
}
System Software Diagnostics Guide — September 2006
101
GCEV_TRACEDATA Reference
18.6
Sample Parser Output
Following is sample parser output from one complete CAS call (this does not apply to ISDN).
# Timestamp Chan TxABCD RxABCD TxR2 RxR2
0:09:14.124 01
1001
0:09:14.220 01
0001
0:09:14.400 01
1101
0:09:14.508 01
10
0:09:14.632 01
1
0:09:14.692 01
1
0:09:14.812 01
1
0:09:14.872 01
7
0:09:14.996 01
1
0:09:15.056 01
7
0:09:15.176 01
5
0:09:15.236 01
1
0:09:15.360 01
5
0:09:15.420 01
10
0:09:15.604 01
5
0:09:15.604 01
1
0:09:15.784 01
5
0:09:15.784 01
8
0:09:15.908 01
5
0:09:15.968 01
8
0:09:16.088 01
5
0:09:16.148 01
10
0:09:16.272 01
5
0:09:16.332 01
1
0:09:16.452 01
5
0:09:16.512 01
10
0:09:16.636 01
5
0:09:16.696 01
1
0:09:16.816 01
5
0:09:16.880 01
15
0:09:22.104 01
3
0:09:22.284 01
1
0:09:22.408 01
6
0:09:22.512 01
0101
0:09:27.724 01
1001
0:09:27.952 01
1101
0:09:28.192 01
1001
0:09:28.240 01
1001
102
Sequence No. 1 #
System Software Diagnostics Guide — September 2006
Getver Reference
19.
19
This chapter provides reference information about the getver tool.
• Description. . . . . . . . . . . . . . . . . . . . . . . . . . . . . . . . . . . . . . . . . . . . . . . . . . . . . . . . . . . 103
• Options. . . . . . . . . . . . . . . . . . . . . . . . . . . . . . . . . . . . . . . . . . . . . . . . . . . . . . . . . . . . . . 103
• Output . . . . . . . . . . . . . . . . . . . . . . . . . . . . . . . . . . . . . . . . . . . . . . . . . . . . . . . . . . . . . . 104
19.1
Description
The getver (Get Version) software application outputs version information for files that are part of
the Intel® Telecom software installation. You specify the file for which you want the version. For
example, the following command prints the version string of the ssp.mlm file to the screen:
getver ssp.mlm
Using getver, you can get version information for the following files provided that they follow
supported versioning formats:
• Intel NetStructure® DM3 architecture board firmware files: *.srec, *.mlm
• Intel NetStructure DM3 architecture board files: *.hot, *.psi
• Windows* Dynamic Load Library files: *.dll
• Linux* Dynamic Load Library files: *.so
• Other files part of the Intel Telecom software that follow supported versioning formats (the
OA&M executable binaries and libraries have a version that getver can display)
Getver is located in the bin directory:
• Windows: %INTEL_DIALOGIC_DIR%\bin
• Linux: ${INTEL_DIALOGIC_DIR}/bin
19.2
Options
This section provides the command line arguments for getver:
getver -? <filename> -s -CPU <argument value>
Note the following:
• If you are using switches or options, you must use the sequence given above.
• -? is a option argument that prints out usage information
• -s acts as a switch for processing srec files, to be used only if the srec file does not end with
the .srec extension.
System Software Diagnostics Guide — September 2006
103
Getver Reference
• -CPU is a case-sensitive option argument to be used for srec files only if getver
<filename> fails. Some possible values are PPC, ONYX, and C6X.
Note:
19.3
You must specify the path to the file if you do not execute getver from the directory in which the
file is located (in this case, the data directory).
Output
Getver will print the version string of the specified file to the screen unless it encounters an
unknown versioning format. In such a case, getver will print the following message to the screen:
Version format not recognized - file not processed
Here are some examples of output:
• Expected output for new “DLcid” versioning format:
Version: <The version number string following "DLcid">
• Expected Output for old “DLcid” versioning format
Embedded name: <embedded name>
Version: <version number> Build <build number>
• Expected output for Windows versioning format:
Version: <version number>
104
System Software Diagnostics Guide — September 2006
ISDN Trace Reference
20.
20
This chapter provides reference information about the ISDNtrace tool.The following topics are
included:
• Description. . . . . . . . . . . . . . . . . . . . . . . . . . . . . . . . . . . . . . . . . . . . . . . . . . . . . . . . . . . 105
• Guidelines . . . . . . . . . . . . . . . . . . . . . . . . . . . . . . . . . . . . . . . . . . . . . . . . . . . . . . . . . . . 105
• Options. . . . . . . . . . . . . . . . . . . . . . . . . . . . . . . . . . . . . . . . . . . . . . . . . . . . . . . . . . . . . . 105
20.1
Description
The ISDNtrace tool provides the ability to track Layer 3 (Q.931) messages on the ISDN D-channel.
ISDNtrace prints messages on the screen in real time. This trace information can also be captured
into a file.
20.2
Guidelines
The ISDNtrace tool consumes a portion of the CPU for each trunk that is logged and may generate
an exception if CTRL-C is used to exit the tool. An exception may also be generated if you use an
invalid parameter in the command.
20.3
Options
Options
The ISDNtrace tool uses the following command line options:
-b<n>
Logical ID of board (required).Use the listboards utility (Linux) or the Configuration Manager
(DCM) (Windows) to obtain the board’s logical ID.
Note: The listboards utility is described in the Administration Guide for the release and the
Configuration Manager is described in the Configuration Guides for the (Windows)
release.
-d<n>
The D-channel number (trunk number) on the specified board (required). The default value is
1.
-f<file>
Output file name (required to save output in a file).
Note:
A space is used after the -f option but not after -b or -d options.
System Software Diagnostics Guide — September 2006
105
ISDN Trace Reference
The following example runs the ISDNtrace tool on board 0, D-channel 1 and prints the output to a
trace.txt file:
isdntrace -b0 -d1 -f trace.txt
106
System Software Diagnostics Guide — September 2006
Intel Telecom Subsystem
Summary Tool Reference
21.
21
This chapter describes the Intel® Telecom Subsystem Summary Tool (its_sysinfo) and the
information it collects. This chapter contains the following information about its_sysinfo:
• Description. . . . . . . . . . . . . . . . . . . . . . . . . . . . . . . . . . . . . . . . . . . . . . . . . . . . . . . . . . . 107
• Command Line Interface . . . . . . . . . . . . . . . . . . . . . . . . . . . . . . . . . . . . . . . . . . . . . . . . 107
• Graphical User Interface (Windows only) . . . . . . . . . . . . . . . . . . . . . . . . . . . . . . . . . . . 108
• Information Collected by its_sysinfo. . . . . . . . . . . . . . . . . . . . . . . . . . . . . . . . . . . . . . . 108
• System Information Data Structuring . . . . . . . . . . . . . . . . . . . . . . . . . . . . . . . . . . . . . . 110
21.1
Description
The Intel Telecom Subsystem Summary Tool (its_sysinfo) provides a simple way to collect
information about systems built using Intel® telecom products. The its_sysinfo tool collects data
from the system on which you execute it and provides you with information about the system
environment: the operating system, computer architecture, Intel® Dialogic® System Release
software, and operational logs.
The its_sysinfo tool also enables you to collect baseline information about the system for quick
review of configuration issues when determining system configuration consistency. This
information is collected in a file, compressed, and archived as part of the complete system
information collection in an archive file named its_sysinfo.zip (or a name you specify). If the
installed system is configured in such a way that the baseline information is not available, the
its_sysinfo tool will indicate “No Information Available.”
In addition to the standard information captured by the its_sysinfo tool, you can manually add files
to the archive that is created by its_sysinfo.exe after you run the tool so you can preserve additional
information that might help with resolving issues.
Procedures for using this tool can be found in the following sections:
• Section 7.2, “Collecting System Data to Diagnose an Application Failure or Crash”, on page
44
• Section 7.3, “Creating a System Configuration Archive”, on page 44
21.2
Command Line Interface
On the command line, enter its_sysinfo filename where filename is the name you want to
give the zip file (it can be the complete path). The its_sysinfo tool will collect system information
System Software Diagnostics Guide — September 2006
107
Intel Telecom Subsystem Summary Tool Reference
and compress it into the zip file. If you do not specify any filename, then the information gets
compressed in a zip file with the default name its_sysinfo.zip.
21.3
Graphical User Interface (Windows only)
On a Windows system, you can use a GUI to run its_sysinfo as follows:
1. Click on its_sysinfo.exe in %INTEL_DIALOGIC_DIR%\bin.
2. Click the Generate button. A dialog box appears on which you must name the archive file into
which you want the information to be collected. The default filename is its_sysinfo.zip.
3. Click the Save button and its_sysinfo will start collecting information.
4. A pop-up window displaying “Data collection completed. Zip archive was created as <zip file
name>” will appear to indicate completion of its_sysinfo.exe execution. Click the OK button.
The archive file is in the location specified in the tool.
21.4
Information Collected by its_sysinfo
The following information is collected under its_sysinfo.htm, which is one of the files that is added
to the archive:
• General System Information
– Environment Variables – information about the operating system environment variables
– System Event Logs – See Table 3.
– Memory and Processor – information about the platform’s available and used memory
and CPU type and number as of the time you executed the its_sysinfo tool
– Operating System – information about the operating system’s version, service pack, and
language
– /proc/meminfo file – Linux only
• Information Specific to Intel Telecom Products
– Installed Devices – its_sysinfo collects information about devices detected in Intel
Telecom Subsystem configurations and startup.
– Configuration Settings for Installed Devices – its_sysinfo captures the stored values
used by the configuration tool for Intel Telecom Subsystem configurations and startup.
For more information about the configuration tool, refer to the configuration guide(s) for
the system release.
– Firmware Files and Versions – its_sysinfo collects information about the files listing all
firmware file names and version numbers.
– FCD Files – its_sysinfo collects information about the .fcd files used by the configuration
tool for Intel Telecom Subsystem configurations and startup. For more information about
FCD files, refer to the configuration guide(s) for the system release.
– PCD Files – its_sysinfo collected information for the .pcd file used by the configuration
tool for Intel Telecom Subsystem configurations and startup. For more information about
PCD files, refer to the configuration guide(s) for the system release.
– CONFIG Files – its_sysinfo collects information about the .config file used by the
configuration tool for Intel Telecom Subsystem configurations and startup. For more
108
System Software Diagnostics Guide — September 2006
Intel Telecom Subsystem Summary Tool Reference
information about CONFIG files, refer to the configuration guide(s) for the system
release.
– Global Call Configuration – its_sysinfo collects information about the Global Call PDK
subsystem configuration, which is contained in the pdk.cfg file. This file specifies the
Global Call protocol modules and the country dependent parameter settings downloaded
to each device. For more information about Global Call Configuration, refer to the Global
Call Country Dependent Parameters (CDP) Configuration Guide, which can be found on
this website: http://resource.intel.com/telecom/support/releases/protocols/index.htm.
– Build Information – its_sysinfo collects information about the contents of the
buildinfo.ini file used for the installed Intel Telecom Software Subsystem. The
buildinfo.ini file contains information about what is in the build of the software.
– Board Memory Dumps
– Intel Telecom Subsystem Event Viewer Data – its_sysinfo collects information about
the last events reported to the operating system and to the event logger from the Intel
Telecom Subsystem.
– File Versions
The its_sysinfo tool also checks for the log files listed in Table 3 and adds them to the archive.
Note:
It is possible to specify a name for some log files. However, its_sysinfo only collects files with
default names.
Table 3. Log Files Archived by its_sysinfo
Log
Files
OA& M
Files
Windows
Linux
$(SystemRoot)\System32\anm_debug.log
$(INTEL_DIALOGIC_DIR)/log/board*.log
$(SystemRoot)\System32\anm_trace.log
$(INTEL_DIALOGIC_DIR)/log/clusterpkg.log
%INTEL_DIALOGIC_DIR%\log\ClusterPkg.log
$(INTEL_DIALOGIC_DIR)/log/clusterpkg.log.*
%INTEL_DIALOGIC_DIR%\log\ClusterPkg.log.0
$(INTEL_DIALOGIC_DIR)/log/dlgsyslogger.log
Or $(SystemRoot)\System32\ClusterPkg.log*
$(INTEL_DIALOGIC_DIR)/log/genload.log
$(SystemRoot)\System32\confslot.log
$(INTEL_DIALOGIC_DIR)/log/iptconf.log
%INTEL_DIALOGIC_DIR%\log\ctbb*.log
$(INTEL_DIALOGIC_DIR)/log/oam.log
Or $(SystemRoot)\System32\ctbb*.log
dlgcInstall.log is in $(TEMP)
%INTEL_DIALOGIC_DIR%\log\dlgcsyslogger.log
%INTEL_DIALOGIC_DIR%\log\DM3AutoDump.log
$(SystemRoot)\System32\dm3bsp.log
$(SystemRoot)\System32\dm3fdspdll.log
$(SystemRoot)\System32\frustatus.log
%INTEL_DIALOGIC_DIR%\log\GenLoad.log
%INTEL_DIALOGIC_DIR%\log\merc.log
Or $(SystemRoot)\System32\merc.log
%INTEL_DIALOGIC_DIR%\log\ncm.ini
%INTEL_DIALOGIC_DIR%\log\oam.log
%INTEL_DIALOGIC_DIR%\log\Sctsassi.log
Demos
%INTEL_DIALOGIC_DIR%\log\rgademo.log
$(INTEL_DIALOGIC_DIR)/log/rgademo.log
%INTEL_DIALOGIC_DIR%\log\Board[#].log
$(INTEL_DIALOGIC_DIR)/log/Board[#].log
$(INTEL_DIALOGIC_DIR)/log/dlgrhdemo.log
System Software Diagnostics Guide — September 2006
109
Intel Telecom Subsystem Summary Tool Reference
Table 3. Log Files Archived by its_sysinfo (Continued)
Log
Files
RTF log
Files
Windows
Linux
<Logfile path>/rtflog*.txt
<Logfile path>/rtflog*.txt
<Logfile path> found in
$(INTEL_DIALOGIC_DIR)\cfg\RtfConfigwin.xml or
$(DLCFGPATH)\rtfconfig.xml
<Logfile path> specified in
$(INTEL_DIALOGIC_DIR)/cfg/RtfConfigLinux.xml
<Logfile path>/rtflog.txt
<Logfile path>/rtflog*.txt
<Logfile path> specified in
<Logfile path> specified in
$(DLCFGPATH)\rtfconfig.xml
$(DLGCFGPATH)/RtfConfigLinux.xml
CASTrac
e log
Files
$(INTEL_DIALOGIC_DIR)\log\CAStrace.log
$(INTEL_DIALOGIC_DIR)/log/CAStrace.log.*
Debug
Angel
Files
$(INTEL_DIALOGIC_DIR)\bin\DebugAngel.log
$(INTEL_DIALOGIC_DIR)/log/debugangel.*
Pstndiag
Trace log
Files
$(INTEL_DIALOGIC_DIR)\log\pstndiag.*
$(INTEL_DIALOGIC_DIR)/log/pstndiag.*
IP
Protocol
Files
$(SystemRoot)\System32\gc_h3r.log
$(HOME)/g*.log
Or $(INTEL_DIALOGIC_DIR)\bin\gc_h3r.log
$(HOME)/rtvsp1.log
$(SystemRoot)\System32\rtvsp1.log
Note: This is obsolete. IP protocols supports
RTF.
Or $(INTEL_DIALOGIC_DIR)\bin\rtvsp1.log
$(SystemRoot)\System32\sdplog.txt
Or $(INTEL_DIALOGIC_DIR)\bin\sdplog.txt
$(SystemRoot)\System32\siplog.txt
Or $(INTEL_DIALOGIC_DIR)\bin\siplog.txt
Note: This is obsolete. IP protocols supports RTF.
Dr.
Watson
Dump
and Log
Files
$(USERPROFILE)\Local Settings\Application
Data\Microsoft\Dr Watson\DrWtsn32.log
Its_sysin
fo logfile
files…
its_sysinfo.log
its_sysinfo.log
Notes: 1. Windows: INTEL_DIALOGIC_DIR=C:\Program Files\Dialogic and SystemRoot=C:\WINNT
2. Linux: INTEL_DIALOGIC_DIR=/usr/dialogic/ and HOME=/root
21.5
System Information Data Structuring
Data collected by its_sysinfo will be available as a single compressed file that contains the
following:
• A master data file in HTML format.
110
System Software Diagnostics Guide — September 2006
Intel Telecom Subsystem Summary Tool Reference
• 0 or more files as attachments. The HTML file will contain links and explanations of the
attachments.
• An application operation log file generated the during data collecting process.
• The operation log files and attachments will be put in the compressed zip file.
System Software Diagnostics Guide — September 2006
111
Intel Telecom Subsystem Summary Tool Reference
112
System Software Diagnostics Guide — September 2006
KernelVer Reference
22.
22
This chapter provides reference information about the kernelver tool. The following topics are
provided:
• Description. . . . . . . . . . . . . . . . . . . . . . . . . . . . . . . . . . . . . . . . . . . . . . . . . . . . . . . . . . . 113
• Options. . . . . . . . . . . . . . . . . . . . . . . . . . . . . . . . . . . . . . . . . . . . . . . . . . . . . . . . . . . . . . 113
22.1
Description
The KernelVer tool queries the board’s kernel running on a particular processor for its version
number. This tool can be used to verify whether or not a processor has crashed.
22.2
Options
The kernelver tool uses the following command line options:
-b<n>
Logical ID of board (required).Use the listboards utility (Linux) or the Configuration Manager
(DCM) (Windows) to obtain the board’s logical ID.
Note: The listboards utility is described in the Administration Guide for the release and the
Configuration Manager is described in the Configuration Guides for the (Windows)
release.
--d<level>
Do not modify. Leave this at the default value of 0.
-f<file>
Output file name (required to save output in a file).
-p<n>
Processor number (required). Lowest allowable value is 1.
-l<n>
Number of times the program will retrieve the version (optional). You can use this option to
repeatedly ping the board’s kernel to generate message traffic.
-h
Displays the help screen.
-v
Displays the version number.
The following example runs the KernelVer tool on board 1, processor 2:
kernelver -b1 -p2
System Software Diagnostics Guide — September 2006
113
KernelVer Reference
114
System Software Diagnostics Guide — September 2006
MercMon Reference
23.
23
This chapter provides reference information about the MercMon tool.The following topics are
included:
• Description. . . . . . . . . . . . . . . . . . . . . . . . . . . . . . . . . . . . . . . . . . . . . . . . . . . . . . . . . . . 115
• Guidelines . . . . . . . . . . . . . . . . . . . . . . . . . . . . . . . . . . . . . . . . . . . . . . . . . . . . . . . . . . . 115
• Options. . . . . . . . . . . . . . . . . . . . . . . . . . . . . . . . . . . . . . . . . . . . . . . . . . . . . . . . . . . . . . 119
23.1
Description
MercMon provides counter information about DM3 board device drivers (Class Driver and
Protocol Drivers). These drivers maintain various counters that can aid in monitoring system
activities and interpreting system behaviors.
23.2
Guidelines
The MercMon tool provides counter information about a DM3 board’s class driver and protocol
driver. The following sections list the types of counters for each driver:
• Class Driver Counters
• Protocol Driver Counters
23.2.1
Class Driver Counters
This section provides details about the class driver counters that are used by the MercMon tool. The
class driver counters are as follows:
Note:
All counters are on a per board basis except for FailMpathFind and FailStrmFind.
CompleteReads
returns the size (in bytes) of all the read requests completed by the protocol driver (i.e., the
actual size in KB of all the data read from the board)
CompleteSends
returns the size (in bytes) of all the messages sent to or received from the board
CompleteWrites
returns the size (in bytes) of all the write requests completed by the Protocol Driver (i.e., the
actual size in KB of all the data written to the board)
FailMpathFind
returns the number of times a request to get a message handle (Mpath) failed (global counter)
FailStrmFind
returns the number of times a request to get a stream handle failed (global counter)
System Software Diagnostics Guide — September 2006
115
MercMon Reference
NumCanTakes
returns the number of “can takes” received for that board
NumReads
returns the total number of read requests sent down to the protocol driver
NumSends
returns the total number of messages sent down to the protocol driver
NumWrites
returns the total number of write requests sent down to the protocol driver
NumWriteSplit
returns the number of write requests, which were split for that board
NumOpenedStreams
returns the number of open streams on that board at any given time
NumCloseStreamErr
returns the number of stream close requests failed on that particular board
NumOpenStreamErr
returns the number of stream open requests failed on that particular board
NumStreamClose
returns the number of stream close requests on that particular board
NumStreamOpen
returns the number of stream open requests on that particular board
SizeReads
returns the size (in bytes) of all the messages posted down to the protocol driver
SizeSends
returns the size (in bytes) of all the messages sent down to the protocol driver
SizeWrites
returns the size (in bytes) of all the write requests sent down to the protocol driver
TimeoutReads
returns the number of read requests that timed out
TimeoutSends
returns the number of messages that timed out while waiting to be sent to the board or awaiting
a reply from the board
TimeoutWrites
returns the number of write requests that timed out
23.2.2
Protocol Driver Counters
This section provides details about the protocol driver counters that are used by the MercMon tool.
The protocol driver counters are as follows:
MsgsInPerSramSession
returns the number of messages read from the SRAM in one session
116
System Software Diagnostics Guide — September 2006
MercMon Reference
MsgsOutPerSramSession
returns the number of messages written to the SRAM in one session
NoInDataDPCisr
returns the number of times when we received an interrupt but there was no data transfer
between the SRAM and the HOST
StrmsOutPerSramSession
returns the number of streams written to the SRAM in one session (i.e., number of data blocks
written)
StrmsInPerSramSession
returns the number of streams read from the SRAM in one session (i.e., the number of data
blocks read)
TotalAsyncMsgQDone
returns the number of requests completed in the AsyncMsgQ
TotalBadSramAddr
returns the number of times we tried reading a message/data (streams) from the SRAM but the
SRAM address was wrong
TotalBadSramAddrAlloc
returns the number of times the system tried to allocate a data block but the address was wrong
TotalBadSramAddrRelease
returns the number of times the system tried to release a data block but the address was wrong
TotalBadSramDataCount
returns the total number of times we got a data block of size greater than the
SRAM_DATA_BLOCK_SIZE
TotalBadSramOffset
returns the number of times we tried reading data (streams) from the SRAM but the offset
calculation was incorrect
TotalBadSramOffsetAlloc
returns the number of times we allocated data block but the offset was incorrect
TotalBigMessagesRcvd
returns the number of times we read a “BIG” message from the SRAM (i.e., message size
greater than 24 bytes)
TotalBigMessagesSent
returns the number of times we wrote a “BIG” message to the SRAM (i.e., message size
greater than 24 bytes)
TotalBogusInterrupts
Not Used
TotalDpcOverruns
returns the total number of DPC overruns (i.e., we were not expecting an interrupt but we got
one)
TotalDmaInterrupts
returns the total number of interrupts received from the board for performing DMA
System Software Diagnostics Guide — September 2006
117
MercMon Reference
TotalFatSramBlocks
returns the number of times the system received a “CHAINED” data block (i.e., the data
blocks are linked together)
TotalIrpsCancelled
returns the total number of cancelled requests in any queue
TotalMsgInQ
returns the number of requests in the Message In Queue, which are awaiting a reply from a
board
TotalMsgInQDone
returns the number of requests completed from the Message In Queue (i.e., requests completed
and sent to the application)
TotalMsgInSram
returns the total number of messages read from the SRAM
TotalMsgOutQDone
returns the number of requests completed from the Message Out Queue (these requests are
sent to the board and then moved to the Message In Queue, if expecting a reply, or completed
and sent to the application)
TotalMsgOutSram
returns the total number of messages written to the SRAM
TotalMsgOverruns
returns the total number of overruns for the orphan message queue (i.e., we had an orphan
message but there was no space in the Orphan Message Queue)
TotalMsgTimeouts
returns the total number of requests timed out while waiting to be written to the SRAM or
awaiting a reply from the SRAM (i.e. either in the Message In Q, Message Out Q or the Async
Message Q)
TotalOrphanMsgsv
returns the total number of Orphan Messages (i.e., messages which were read from the SRAM
but do not have any pending requests from the application)
TotalOrphanMsgVolume
returns the size (in bytes) of the messages present in the Orphan message queue at any given
time
TotalOrphanStrms
returns the total number of Orphan Streams in the Orphan Stream Table (i.e., data which was
read from the SRAM but did not have any pending Read Requests from the application)
TotalOrphanStrmMatches
returns the total number of streams matched in the Orphan Stream table
TotalOrphanStrmVolume
returns the size (in bytes) of the data present in the Orphan Stream table at any given time
TotalSramDataFull
returns a count of the number of times the HOST tried to write a stream (data) to the SRAM
but the SRAM was full
118
System Software Diagnostics Guide — September 2006
MercMon Reference
TotalSramGrantInterrupts
returns the number of “HOST SRAM PENDING” interrupts
TotalSramGrantLost
not used
TotalSramInterrupts
returns the total number of “NORMAL” interrupts received from the board (e.g., there is
something to read from the SRAM)
TotalSramMsgFull
returns a count of the number of times the HOST tried to write a message to the SRAM but the
SRAM was full
TotalStrmInQ
returns the number of read requests pending in the Stream In Queue
TotalStrmInQDone
returns the number of read requests completed from the Stream In Queue (i.e., read requests
completed and sent to the application)
TotalStrmInSram
returns the number of data packets read from the SRAM
TotalStrmOutQ
returns the number of writes performed by the user on that particular board. It is also
incremented whenever the application sends an End Of Stream command.
TotalStrmOutQDone
returns the number of Write requests completed from the Stream Out Queue (i.e., Write
requests completed and sent to the application)
TotalStrmOutSram
returns the number of data packets written to the SRAM
TotalStrmOverruns
returns the number of Overruns for the Orphan Stream Table (e.g., we had an Orphan Stream
but we had exceeded the maximum amount of memory allocated for the Orphan Stream Table
or we could not allocate memory.)
TotalStrmTimeouts
returns the total number of Read or Write Requests timed out (from the Stream In Queue or the
Stream Out Queue)
TotalUnknownInterrupts
returns the total number of unknown interrupts received from the board
23.3
Options
The MercMon tool uses the following command line options:
/f<file>
log file name (default is mercmon.log)
System Software Diagnostics Guide — September 2006
119
MercMon Reference
/t<n>
display timer. The time interval (in milliseconds) between each screen refresh (default is
1000).
/l<n>
logging interval. The time interval (in seconds) between each log file update (default is 600).
/w
enable/disable logging to a file (default is enabled)
/?
displays the help screen
The following example enables logging to the mercmon.log file every five minutes and refreshes
the screen every two seconds:
mercmon /t 2000 /l 300
120
System Software Diagnostics Guide — September 2006
PDK Trace Reference
24.
24
This chapter provides reference information about the PDK Trace tool. The following topics are
included:
• Description. . . . . . . . . . . . . . . . . . . . . . . . . . . . . . . . . . . . . . . . . . . . . . . . . . . . . . . . . . . 121
• Guidelines . . . . . . . . . . . . . . . . . . . . . . . . . . . . . . . . . . . . . . . . . . . . . . . . . . . . . . . . . . . 121
• Options. . . . . . . . . . . . . . . . . . . . . . . . . . . . . . . . . . . . . . . . . . . . . . . . . . . . . . . . . . . . . . 122
• Sample Scenarios. . . . . . . . . . . . . . . . . . . . . . . . . . . . . . . . . . . . . . . . . . . . . . . . . . . . . . 122
24.1
Description
The DM3 PDK Protocol Trace (PDK Trace) tool allows those who use a DM3 PDK protocol to log
specific information related to the operation of the protocol. The PDK Trace tool is useful for
protocol developers because it can trace the runtime states, input signals, output signals, and
decision branches of the SDL protocol. The PDK Trace tool allows you to specify which channels
on the board to begin tracing. This can be a single channel on one trunk, a single channel on
multiple trunks, a range of channels on one trunk, or a range of channels on multiple trunks.
PDK Tracing will work on any of the following products with a PDK protocol loaded: Intel
NetStructure® DM/V, DM/V-A, DM/V-B, DM/F, and DMT160TEC boards. PDK tracing is not
supported for Intel NetStructure® on DM3 architecture analog boards and Intel NetStructure®
DM/IP boards.
Note:
If you are using an Intel NetStructure DM/IP board and get the following error message, you can
ignore it (the error message appears in DebugAngel - see Chapter 12, “DebugAngel Reference”):
001:CP1:Cause-Tag
24.2
:
80013, Error File
:qkernerr.h.-Failed to find tracer component address
Guidelines
The PDK Trace tool requires the Global Call Protocols, so you must choose the Global Call
Protocols option when you install the Intel® Dialogic® System Release software. Refer to the
Installation Guide for details.
The PDK Trace tool’s executable name is pdktrace.exe for the Windows operating system and
pdktrace for the Linux operating system. The PDK Trace tool is a command line application that
will create a system process thread to interact with the DM3 system to capture trace data. This data
will be streamed to a file on the host system.
Upon completion of tracing, the data will be stored on the host system in a file specified when
tracing was started (default: pdktrace.log). The file is in an unreadable binary format and will need
to be converted to a readable format. For help with this, contact technical support
(http://resource.intel.com/telecom/support/contact.htm).
System Software Diagnostics Guide — September 2006
121
PDK Trace Reference
24.3
Options
The PDK Trace tool uses the following command line options:
-b#
This required option specifies the logical board ID of the board to trace.
Example: pdktrace -b0 where 0 is the logical board ID of the destination board.
-l[#] or -l[#-#]
Specify which trunk(s) the channels to be traced are located on. The default value is 1 (trunk
1).
Example 1: pdktrace -b0 -l[1] /* Single trunk */
Example 2: pdktrace -b0 -l[1-4] /* Range of trunks */
-c[#] or -c[#-#]
Specify which channel(s) on the specified trunks to trace. The default value is 1 (channel 1).
Example 1: pdktrace -b0 -l[1] -c[5] /* Single channel */
Example 2: pdktrace -b0 -l[1-4] -c[1-30] /* Range of channels */
-f[filename]
Specify the name of a file on the host system to write the trace data to. The default is
pdktrace.log.
-i
This option is required only when you first use the PDK Trace tool. This option is used to
initialize the DM3 Tracer Component in the firmware.
Note: This option should only be used the first time the utility is executed after the board is
downloaded
-v
Prints the version number of the utility.
-?, -h
Prints the help screen (command line options) for the utility.
Warning:
24.4
Due to memory constraints in the embedded DM3 system, the tool will limit the number of
channels that can be traced simultaneously to 60. Trying to trace more than 60 channels per board
can cause unpredictable results.
Sample Scenarios
The following are some sample scenarios in which the PDK Trace tool can be used and the
command line options used to specify each configuration. These sample scenarios assume that the
logical ID of the board being used is 0.
Scenario 1: For board 0, trace channel 1 on trunk 1
pdktrace -b0
pdktrace -b0 -l[1]
pdktrace -b0 -l[1] -c[1]
122
System Software Diagnostics Guide — September 2006
PDK Trace Reference
Scenario 2: For board 0, trace channels 10-20 on trunk 1
pdktrace -b0 -c[10-20]
pdktrace -b0 -l[1] -c[10-20]
Scenario 3: For board 0, trace channel 1 on trunks 1-4
pdktrace -b0 -l[1-4]
pdktrace -b0 -l[1-4] -c[1]
Scenario 4: For board 0, trace channels 1-24 on trunks 1-4
pdktrace -b0 -l[1-4] -c[1-24]
Note:
If any of the above scenarios were being executed on a board for the first time after it was
downloaded, the -i command line option should also be used as follows:
pdktrace -b0 -l[1-4] -c[1-24] -i
System Software Diagnostics Guide — September 2006
123
PDK Trace Reference
124
System Software Diagnostics Guide — September 2006
Phone Reference
25.
25
This chapter provides reference information about the Phone tool. The following topics are
included:
• Description. . . . . . . . . . . . . . . . . . . . . . . . . . . . . . . . . . . . . . . . . . . . . . . . . . . . . . . . . . . 125
• Guidelines . . . . . . . . . . . . . . . . . . . . . . . . . . . . . . . . . . . . . . . . . . . . . . . . . . . . . . . . . . . 125
• Options. . . . . . . . . . . . . . . . . . . . . . . . . . . . . . . . . . . . . . . . . . . . . . . . . . . . . . . . . . . . . . 125
25.1
Description
The Phone tool uses the TSC and ToneGen instances and requires a TSC component. The Phone
tool can control a single DM3 resource channel (make calls, wait for calls etc.), monitor channel
and call states, and send call control operations to a DM3 Global Call resource.
25.2
Guidelines
Phone is a QScript utility. For more information about QScript utilities, refer to Chapter 27,
“QScript Reference”.
When using Dynamic Routing configurations, the audio buttons in tools such as the Phone tool will
not work.
25.3
Options
The Phone tool uses the following command line options:
-b<n>
Logical ID of board (required).Use the listboards utility (Linux) or the Configuration Manager
(DCM) (Windows) to obtain the board’s logical ID.
Note: The listboards utility is described in the Administration Guide for the release and the
Configuration Manager is described in the Configuration Guides for the (Windows)
release.
-l<n>
Line number (optional). The default value is 1.
-chan<n>
Channel number (optional). The default value is 1.
The following example runs the Phone tool on board 1, line 1:
phone -b1 -l1
System Software Diagnostics Guide — September 2006
125
Phone Reference
126
System Software Diagnostics Guide — September 2006
PSTN Diagnostics Tool Reference
26.
26
This chapter provides the following reference information about the PSTN Diagnostics tool
(pstndiag):
• Description. . . . . . . . . . . . . . . . . . . . . . . . . . . . . . . . . . . . . . . . . . . . . . . . . . . . . . . . . . . 127
• Guidelines . . . . . . . . . . . . . . . . . . . . . . . . . . . . . . . . . . . . . . . . . . . . . . . . . . . . . . . . . . . 128
• Preparing to Run the PSTN Diagnostics Tool . . . . . . . . . . . . . . . . . . . . . . . . . . . . . . . . 128
• Running the PSTN Diagnostics Tool. . . . . . . . . . . . . . . . . . . . . . . . . . . . . . . . . . . . . . . 128
• Checking the pstndiag Log File. . . . . . . . . . . . . . . . . . . . . . . . . . . . . . . . . . . . . . . . . . . 135
• PSTN Diagnostics Menus . . . . . . . . . . . . . . . . . . . . . . . . . . . . . . . . . . . . . . . . . . . . . . . 136
• PSTN Diagnostics Command Line Options . . . . . . . . . . . . . . . . . . . . . . . . . . . . . . . . . 137
For information about how to use the pstndiag tool to perform diagnostic tasks, refer to these
chapters:
• Chapter 5, “Diagnosing First Call Issues”
• Chapter 6, “Diagnosing PSTN Protocol Issues”
26.1
Description
The PSTN Diagnostics tool (pstndiag) is a utility for diagnosing and troubleshooting public
switched telephone network (PSTN) connectivity problems on specific hardware products based on
DM3 architecture.
The pstndiag tool allows you to perform the following activities:
• Query the system for board information
• View all boards in the system that have been downloaded
• Monitor all components (boards, trunks, channels) in the system, and view trunk and channel
information, such as trunk status, alarm status, channel state, and call state
• Display the protocol family running on a channel (ISDN or CAS)
• Produce a consolidated log file for all components that are being actively monitored in the
system
• Display a previously saved log file
• Launch the ISDNtrace and CAStrace tools to perform further diagnostic tests
System Software Diagnostics Guide — September 2006
127
PSTN Diagnostics Tool Reference
26.2
Guidelines
The following restrictions apply to the pstndiag tool:
• The tool is not supported on boards based on Springware architecture.
• It is recommended that you view or monitor no more than 8 channels in your system at one
time. Viewing more than 8 channels at one time may negatively impact system performance.
• The pstndiag tool will only identify and list boards with PSTN front-end interfaces. Boards
that do not have PSTN front-end interfaces (for example, resource only) will not be presented
and cannot be monitored or manipulated by pstndiag.
Pstndiag is a QScript utility. For more information about QScript utilities, refer to Chapter 27,
“QScript Reference”.
26.3
Preparing to Run the PSTN Diagnostics Tool
Before running the pstndiag tool, ensure that you have performed the following tasks:
1. The Intel® Dialogic® system release software has been properly installed.
2. The Intel Dialogic system has been started for the boards in your system. The pstndiag tool
will detect boards that have already been downloaded.
26.4
Running the PSTN Diagnostics Tool
This section provides instructions for running the pstndiag tool and describes the user interface.
The following topics are covered:
• Starting the PSTN Diagnostics Tool
• The Main Window
• The View Bar
• Option Buttons and Command Buttons
• Keyboard Navigation
26.4.1
Starting the PSTN Diagnostics Tool
This section contains instructions for starting the pstndiag tool in Windows and in Linux.
To start the pstndiag tool in Windows, follow these instructions:
1. Open a command prompt window. The default location of the tool is
%INTEL_DIALOGIC_DIR%\qscript\tools\pstndiag\. However, you can run the tool from any
location.
2. At the command prompt, type:
pstndiag
128
System Software Diagnostics Guide — September 2006
PSTN Diagnostics Tool Reference
To start the pstndiag tool in Linux, type pstndiag from the command line of a cmd prompt. No
arguments are required because the path is set by the install of the Intel Dialogic System Release
software.
Notes: 1. You can specify options at the command line. For more information on these options, see
Section 26.7, “PSTN Diagnostics Command Line Options”, on page 137.
2. If a board is stopped after you have launched the pstndiag tool, you will need to exit from the
tool, restart the board, and relaunch the tool to use it again.
26.4.2
The Main Window
After you have launched the pstndiag tool, the main window displays a hierarchical tree of all
known components in your system. This view is called the system level view. The tree consists of
three levels: board, trunk, and channel. At the top level, the tree lists all boards that have been
downloaded in your system. For each board, all trunks (or spans) are listed. For each trunk, all
channels within a trunk are listed. Each of these components (board, trunk, channel) is called a
device. The tree can be collapsed or expanded by clicking on the + and - icons.
Figure 7 illustrates a system level view of a DM/V960A-4T1-PCI board.
Figure 7. PSTN Diagnostics Tool - System Level View
System Software Diagnostics Guide — September 2006
129
PSTN Diagnostics Tool Reference
The numbering convention, x.y.z, is used to identify a component in the tree, for example
“Channel 0.2.1”, where:
• x is an integer that represents the board logical ID, in this example 0
• y is an integer that represents the trunk on that board, in this example 2
• z is an integer that represents the channel number on that trunk, in this example 1
If only one number is used in the identifier, this number represents the board, such as Board 0 and
Board 1. If two numbers are used in the identifier, such as Trunk 0.2 and Trunk 1.5, the first
number represents the board and the second number represents the trunk.
26.4.3
The View Bar
The view bar contains two option buttons: one (1) represents the upper pane, and the other (2)
represents the lower pane. When you first launch the pstndiag tool, the system level view is
displayed in the upper pane; the lower pane is empty. The view bar shows these two option buttons:
“1 System” and “2 None”. Figure 8 illustrates a sample view bar.
Figure 8. PSTN Diagnostics Tool - View Bar
The label on the option button changes according to what is displayed in that pane. Once a
component has been opened, it is then available from both option buttons. To display a component
in the upper pane or lower pane, select it from the appropriate option button. To close a view, rightclick on the component in the option button and click close view. Alternatively, double-clicking on
a component in the system level view displays that component in the upper pane. Shift-doubleclicking displays the component in the lower pane.
A view can display a system, a board, a trunk, a channel, or a log file. For example, in a back-toback test scenario, you might want to display two channel level views at one time. Or you might
want to display a board level view and a log file view.
26.4.4
Option Buttons and Command Buttons
Option buttons are buttons that provide additional options. These buttons are identified by a short
horizontal bar, as seen in Figure 11 through Figure 18. Click on a button to view additional options,
and click on an option to select it. An action occurs, or a new set of parameters is displayed. The
use of option buttons allows related information to be grouped together and helps to reduce clutter
on the screen.
Command buttons are buttons that when pressed activate a command. There are two types of
command buttons: those that toggle between two actions (these are identified by two periods
following the button name) and those that issue a command directly. For example, the
130
System Software Diagnostics Guide — September 2006
PSTN Diagnostics Tool Reference
ResetLineDevice.. button in Figure 9 toggles between setting a channel in service and out of
service.
Figure 9. Toggle Command Buttons
Examples of command buttons that issue a command directly are the MakeCall, DialDigits, Drop,
and Release buttons in a channel level view shown in Figure 10. Click on a button to issue a
command.
Figure 10. Direct Command Buttons
Following is a list of the option buttons. There is a submenu of command buttons under each of the
option buttons.
Channel State Commands
The commands under this button are as follows:
SetChanState
Set a channel in service or out of service
ResetLineDevice
Drop all calls on the channel and return the call state to Idle
Figure 11. Channel State Command Buttons
Outbound Call Control Commands
The commands under this button are as follows:
MakeCall
Place an outgoing call
System Software Diagnostics Guide — September 2006
131
PSTN Diagnostics Tool Reference
Drop
Delete a call
DialDigits
Generate signals for selecting and establishing a connection
Release
Release the active call on the channel.
Figure 12. Outbound Call Control Command Buttons
Inbound Call Control Commands
The commands under this button are as follows:
AnswerCall
Answer the call
AcceptCall
Accept the call (this precedes the option of handing off the call to another client or party)
ProceedCall
Proceed the call (this sends the call proceeding message to the originating side, and waits for
Accept (to accept call) or Answer (to answer call) as a subsequent command from the host for
further progress of the call). This is available only for ISDN.
RejectCall
Reject the call
RedirectCall
Redirect the call elsewhere.
Figure 13. Inbound Call Command Buttons
Call Hold Commands
Note:
132
The following commands are advanced functions for technical support use only.
System Software Diagnostics Guide — September 2006
PSTN Diagnostics Tool Reference
The commands under this button are as follows:
HoldCall
Place a call on hold. A call that is on hold is disconnected from the external receive and
transmit data streams that are associated with the Telephony Service Channel (TSC) instance.
Once the call is on hold, the client is free to establish a new call, either by making an outbound
call, or by receiving an inbound call.
RetrieveCall
Retrieve a call that is on hold, and bring it to the active state. The completion of the Retrieve
Call operation is indicated via a Call State event that reports the call state transition to
Connected. Note that if there is a call active when the RetrieveCall command is issued, then
that call will be placed on hold, so the command can be used to alternate between two calls.
ReconnectCall
An alternative to the RetrieveCall command, ReconnectCall will retrieve a call that is on hold
and make it the active call. The difference is that if a call is active when the command is issued,
that call will be dropped rather than put on hold.
Figure 14. Call Hold Command Buttons
Call Transfer Commands
Note:
The following commands are advanced functions for technical support use only.
The commands under this button are as follows:
BlindTransfer (single-stage blind-transfer)
Place the target call on hold, make a consultation call to the destination address, and then hand
off the target call to the destination without determining the outcome of the consultation call.
The target call's call state will transition first to HoldPendXfer, and then to Idle.
InitTransfer (part of multi-stage transfer)
Place the target call on hold (HoldPendXfer) and initiate a consultation call to the destination
address.
CompleteTransfer (part of multi-stage transfer)
Transfer the call that was the target of the InitTransfer command to the destination address.
CancelTransfer (part of multi-stage transfer)
Cancel a supervised transfer by dropping the consultation call and reconnecting to the call that
was the target of the transfer operation.
System Software Diagnostics Guide — September 2006
133
PSTN Diagnostics Tool Reference
Figure 15. Call Transfer Command Buttons
SendISDN Command
Note:
The following command is an advanced function for technical support use only.
The command under this button is as follows:
SendISDN
Sends an arbitrary call-associated Q.931 ISDN Message.
Figure 16. SendISDN Command Button
Misc. Commands
Note:
The following commands are advanced functions for technical support use only.
The commands under this button are as follows:
Complete
This command is not currently used.
CancelComplete
This command is not currently used.
Park
This command is not currently used.
Pickup
This command is not currently used.
Figure 17. Misc. Commands Buttons
134
System Software Diagnostics Guide — September 2006
PSTN Diagnostics Tool Reference
External Applications
The Audio command is not functional.
Figure 18. External Application Command Button
26.4.5
Keyboard Navigation
You can use the following keyboard keys to navigate through the pstndiag tool:
Up Arrow/Down Arrow
Scrolls through devices in the tree.
Left Arrow/Right Arrow
Collapses or expands a level in the tree.
Return or Double-click
When a component is highlighted, creates a view for this component in the upper pane.
Shift-Return or Shift-Double-click
When a component is highlighted, creates a view for this component in the lower pane.
Right-click
When a button in the View bar is highlighted, displays the close view option.
26.5
Checking the pstndiag Log File
This section describes the log file generated by the pstndiag tool.
Logging starts automatically when you launch the pstndiag tool. Logging information is written to
the log file for any component (board, trunk, and channel) that is being monitored and opened in a
view. The log file is in binary format and must be viewed in the pstndiag tool.
Caution:
The diagnostics log file has no maximum size. After completing diagnostics tasks, you should exit
the pstndiag tool. Do not run the pstndiag tool indefinitely; otherwise, the resulting log file may
consume a large amount of disk space.
The default log file name is pstndiag.yyyymmdd.hhmmss.pdlog, where yyyy is the year, mm is the
month, dd is the day, hh is the hour, mm is the minute, and ss is the second when the file is created.
Each time the tool is run, a new log file is created. Running multiple copies of the tool will result in
multiple log files. The log file is written by default to the standard log directory:
• Windows - %INTEL_DIALOGIC_DIR%/log
• Linux - ${INTEL_DIALOGIC_DIR}/log
System Software Diagnostics Guide — September 2006
135
PSTN Diagnostics Tool Reference
The log file generated by the pstndiag tool captures all events associated with your use of this tool.
There are two types of events: application events (AppEvent) and message events (MsgEvent). The
application events are generated as actions occur in the pstndiag tool; for example, line out of
service. Message events are messages from the firmware in response to application events or
asynchronous events; for example, trunk active. If you run other applications such as demos, only
message events are generated. The log file also captures application errors (AppErrors).
A time stamp is provided for each event as it occurs. The event is associated with a board, trunk, or
channel. For example, AppEvent(0.2.1) is associated with board 0, trunk 2, and channel 1. The log
file also provides a graphical view of each event as it occurs over time.
To display the current log file, select View running log from the Log menu. To view a previously
saved log file, select Open log file from the File menu.
26.6
PSTN Diagnostics Menus
This section provides a reference to the menus available in the PSTN Diagnostics or pstndiag tool:
• File menu
• Log menu
• View menu
• Help menu
26.6.1
File menu
The File menu contains the following menu options:
Open log file
Opens a previously saved log file.
Exit
Exits the tool.
26.6.2
Log menu
The Log menu contains the following menu options:
View running log
Displays the current log file in a window.
Logging active
Enables logging. The default setting is logging enabled. To disable logging, you can use the
“-nolog” option at the command line. For information on command line options, see
Section 26.7, “PSTN Diagnostics Command Line Options”, on page 137.
136
System Software Diagnostics Guide — September 2006
PSTN Diagnostics Tool Reference
26.6.3
View menu
The View menu contains the following menu options:
Open system view
Opens a system level view.
Open new view
Opens a board, trunk, or channel level view.
26.6.4
Help menu
The Help menu contains the following menu options:
About
Displays the version number of the pstndiag tool as well as copyright information.
Command line
Displays information about command line options.
General information
Displays information about menus, menu options, and views.
26.7
PSTN Diagnostics Command Line Options
Command line options enable you to bypass the system level view and display a specific board,
trunk, or channel level view when you start the pstndiag tool.
The following command line options are available:
-b<b>
Starts with a specified board level view, where <b> represents the board logical ID.
Example: -b3 will display the board level view for Board 3 in your system.
-board <b>
Same as -b<b>.
-c<b>.<t>.<c>
Starts with a specified channel level view, where <b> represents the board logical ID, where
<t> represents the trunk (span) on the board, and where <c> represents the channel.
Example: -c3.1.24 will display the channel level view for channel 24 on trunk 1 of board 3.
-chan <b>.<t>.<c>
Same as -c<b>.<t>.<c>.
-t<b>.<t>
Starts with a specified trunk level view, where <b> represents the board logical ID and where
<t> represents the trunk on that board.
Example: -t3.1 will display the trunk view for trunk 1 of board 3.
-trunk <b>.<t>
Same as -t<b>.<t>.
System Software Diagnostics Guide — September 2006
137
PSTN Diagnostics Tool Reference
-help
Displays help information for the tool.
-logto <file>
Saves log information from open views to the specified file name.
-nolog
Does not automatically log events for open views.
-noscan
Does not perform an initial system scan to determine available resources. All views must be
opened manually in this mode. Using this option can reduce the time it takes for the tool to
start.
-openlog <file>
Starts by displaying the specified log file. The log file extension is .pdlog (this file must be
viewed in the pstndiag tool). When specifying a directory path, use forward slash.
Example: -openlog c:/temp/test.pdlog
138
System Software Diagnostics Guide — September 2006
QScript Reference
27.
27
This chapter provides information about QScript utilities, which are a subset of the diagnostic
utilities.
• Description. . . . . . . . . . . . . . . . . . . . . . . . . . . . . . . . . . . . . . . . . . . . . . . . . . . . . . . . . . . 139
• File Directories . . . . . . . . . . . . . . . . . . . . . . . . . . . . . . . . . . . . . . . . . . . . . . . . . . . . . . . 139
• QScript Environment Variables . . . . . . . . . . . . . . . . . . . . . . . . . . . . . . . . . . . . . . . . . . . 140
27.1
Description
The QScript utilities are a subset of the diagnostic utilities. QScript is an object-oriented scripting
tool developed for the Intel NetStructure® on DM3 architecture boards.
The following diagnostic utilities use QScript:
• CallInfo
• DigitDetector
• Phone
• PSTN Diagnostics or pstndiag (uses several QScript utilities)
The following administrative utilities, which are documented in the System Release Administration
Guide, use QScript:
• Line Administration Utility (lineadmin)
• Standard DM3 Configuration Utility (stdconfig)
• TSP Configuration Utility (tspconfig)
• TSP Monitor Utility (tspmon)
• TSP Tracer Utility (tsptrace)
27.2
File Directories
The directory for the Windows batch file used to invoke the QScript tools is:
%systemroot%\program files\dialogic\bin
The QScript tools developed by Intel are located in:
%systemroot%\program files\dialogic\qscript
Note:
Do not run a <toolname>.qs file directly. Batch files have been created which call the QScript
interpreter to run the <toolname>.qs file. To use a QScript utility, specify the utility name and
parameters on the command line.
System Software Diagnostics Guide — September 2006
139
QScript Reference
27.3
QScript Environment Variables
This section describes the QScript environment variables:
• INTEL_DIALOGIC_QSCRIPT Environment Variable
• Single Session Variable
INTEL_DIALOGIC_QSCRIPT Environment Variable
In a Windows environment, this variable is set during software installation.
Single Session Variable
Set the variable for a single session using the set command. To permanently set the environment
variable for all login sessions, update the variable in the System Properties Environment tab.
140
System Software Diagnostics Guide — September 2006
Runtime Trace Facility (RTF)
Reference
28.
28
This chapter provides an overview of the Runtime Trace Facility (RTF), including information
about editing the RTF configuration file (RtfConfigLinux.xml for Linux* and RtfConfigWin.xml for
Windows*) file to set tracing configuration options. Reference information about the RTF
command line options is also included. This chapter contains the following subsections:
• Description. . . . . . . . . . . . . . . . . . . . . . . . . . . . . . . . . . . . . . . . . . . . . . . . . . . . . . . . . . . 141
• Installing RTF . . . . . . . . . . . . . . . . . . . . . . . . . . . . . . . . . . . . . . . . . . . . . . . . . . . . . . . . 142
• RTF Configuration File . . . . . . . . . . . . . . . . . . . . . . . . . . . . . . . . . . . . . . . . . . . . . . . . . 142
• Restrictions and Limitations . . . . . . . . . . . . . . . . . . . . . . . . . . . . . . . . . . . . . . . . . . . . . 154
• rtftool Command . . . . . . . . . . . . . . . . . . . . . . . . . . . . . . . . . . . . . . . . . . . . . . . . . . . . . . 156
• Example RTF Configuration Files. . . . . . . . . . . . . . . . . . . . . . . . . . . . . . . . . . . . . . . . . 157
• Configuring Remote RTF Logging . . . . . . . . . . . . . . . . . . . . . . . . . . . . . . . . . . . . . . . . 160
A procedure for using the tool is provided in Chapter 7, “Debugging Software”.
28.1
Description
RTF provides a mechanism for tracing the execution path of the runtime libraries for the Intel®
Dialogic® system release software. All libraries that use RTF write their trace messages to a log
file. The resulting log file helps troubleshoot runtime issues for applications that are built with Intel
Dialogic system release software.
RTF obtains trace control settings and output formatting from an RTF configuration file
(RtfConfigLinux.xml for Linux and RtfConfigWin.xml for Windows). Each runtime library has
several levels of tracing that can be dynamically enabled/disabled by editing the RTF configuration
file while your application runs. This allows RTF to be configured to meet specific needs.
Major RTF components include:
• Client library (librtfmt.dll for Windows, librtf.so for Linux): Dynamic loaded library that
provides the software interface to make use of RTF functionality.
• Configuration file (RtfConfigWin.xml for Windows, RtfConfigLinux.xml for Linux): Editable
file that allows you to customize the tracing and output capabilities of RTF (for example,
which runtime libraries RTF will trace, the trace levels, location and size of backup log files.)
Note: You must have administrative rights to modify the RtfConfig*.xml files.
• Server application (RtfServer.exe for Windows, RtfServer for Linux): Service that
communicates to all RTF clients, receives trace data from clients, and dispatches data to disk.
System Software Diagnostics Guide — September 2006
141
Runtime Trace Facility (RTF) Reference
• Utility program (rtftool.exe for Windows, rtftool for Linux): Command line application that
allows you to execute RTF functionality from command line or shell scripts.
• Utility program (RtfTrace.exe): Command line application that allows you to execute RTF
functionality from command line or shell scripts. This is provided for backward compatibility
only. All of this utility’s functionality is covered in rtftool.exe.
28.2
Installing RTF
RTF files are installed as part of the Intel Dialogic system software installation. The RTF
configuration file’s default installation directory is determined by the INTEL_DIALOGIC_CFG
environment variable. Refer to the Intel Dialogic System Release Software Installation Guide for
information about Intel Dialogic system software environment variables. Because the RTF
configuration file’s trace attribute is set to 1, RTF tracing is enabled by default. Other than editing
the RTF configuration file to customize trace settings for your development environment, there are
no special configuration steps for starting RTF.
28.3
RTF Configuration File
To make full use of RTF, you will want to modify the RTF configuration file (RtfConfigLinux.xml
for Linux, RtfConfigWin.xml for Windows). This configuration file allows you to define which
trace messages will be included in the RTF output. This subsection provides some guidelines for
modifying the RTF configuration file and reference information about the file’s XML tags and
attributes.
Note:
You must have administrative rights to modify the RtfConfig*.xml files.
The RTF configuration file uses several terms that should be understood before attempting to edit
the file. The following definitions should be kept in mind as you edit the RTF configuration file:
module
a binary file, typically an executable or a shared object library file (.so). An RTF module
corresponds to a library or software module that has internal RTF APIs incorporated into its
source code.
client
an entity for identifying a device (e.g. “dxxxB1C1”), component (e.g. “WaveFileSource”) or a
function (e.g. “dx_play( )”) that is to be traced by RTF.
label
an attribute associated with a trace statement (e.g. “Error”, “Warning”, “Info”, “External API
entry”, “External API exit” etc.). A trace statement’s label is used by the trace data output for
categorization purposes.
trace entry
individual entries in the trace data output. The trace data output is typically sent to a file or
debug stream.
0
when a 0 appears next to a configuration item in the RTF configuration file, it indicates that the
configuration item is disabled.
142
System Software Diagnostics Guide — September 2006
Runtime Trace Facility (RTF) Reference
1
when a 1 appears next to a configuration item in the RTF configuration file, it indicates that the
configuration item is enabled.
The RTF configuration file’s top-level document tag is the RTFConfig tag. The following three tags
are child tags of the RTFConfig tag:
1. Logfile
2. Global
3. Module
Figure 19 shows the XML tag structure and tag attributes of the RTF configuration file:
Figure 19. RTF Configuration File Tag Structure
RTFConfig
trace
tracelocation
timestamp
logformat
Logfile
Module
Global
name
state
path
size
maxbackups
preserve_size
preserve_maxbackups
duplicate_to_debug_console
log_format
GLabel
GClient
MLabel
MClient
name
state
name
state
name
state
name
state
GClientLabel
MClientLabel
name
state
name
state
Convention Used:
Tag name
attribute 1
attribute 2
...
child Tag name
attribute 1
attribute 2
...
28.3.1
RTFConfig Tag
RTFConfig is the document tag. This tag is a mandatory component of the RTF configuration file;
it can be found at the top of the RTF configuration file. A sample RTFConfig tag entry is shown
below:
System Software Diagnostics Guide — September 2006
143
Runtime Trace Facility (RTF) Reference
<RTFConfig trace=“1” tracelocation=”TRACE_LOG” timestamp=”1”
logformat=”ALIGN”>
<!-- Logfile section goes here -->
<!-- Global section goes here -->
<!-- Module sections go here -->
</RTFConfig>
The RTFConfig tag includes the following attributes:
trace
This attribute is used to enable or disable the RTF tracing capabilities. Valid values are as follows:
0
RTF tracing is disabled.
1
RTF tracing is enabled. This is the default setting.
tracelocation
This attribute has no affect on the file and will be removed in a future release. By default, trace
output is sent to a log file.
timestamp
This attribute has no affect and will be removed in a future release. By default, each log file name
includes a time stamp.
logformat
This attribute defines the format of the log file. The following two values are supported:
ALIGN
Aligns the trace entry fields in the log file into comma separated columns. The top of each
column includes a header that provides a description of the column’s content. This is the
default setting.
UNALIGN
Separates the trace entry fields in the log files with commas. Column alignment is not done.
Notes: 1. If you set the logformat attribute to ALIGN, you can customize the widths of the various
columns. The following attributes in the RTF configuration file allow you to define the aligned
column widths:
– ModuleWidth number - Allows you to customize the number of characters that appear
in the Module column. The default setting is 10. There is no maximum setting.
– ClientWidth number - Allows you to customize the number of characters that appear in
the Client column. The default setting is 15. There is no maximum setting.
144
System Software Diagnostics Guide — September 2006
Runtime Trace Facility (RTF) Reference
– LabelWidth number - Allows you to customize the number of characters that appear in
the Label column. The default setting is 10.There is no maximum setting.
2. Using the ALIGN setting makes the log file easier to read but it does not make efficient use of
hard drive space. This inefficiency is exacerbated as the log file grows. The UNALIGN format is
separated by commas so it can be parsed by a spreadsheet or database program to make the file
easier to read.
28.3.2
Logfile Tag
The Logfile tag is the first child tag of the RTFConfig tag. The Logfile tag provides logistical
information about the log file(s) used to store trace output.
If you would like to customize the appearance and settings of the log file, edit the Logfile tag
within the RTF configuration file. The Logfile tag appears under the RTFConfig tag in the RTF
configuration file.
A sample Logfile tag entry from the RtfConfigLinux.xml file is shown below:
<Logfile path=”$(INTEL_DIALOGIC_DIR)/log” size=”300” maxbackups=”10”
preserve_size=”300” preserve_maxbackups=”10”
duplicate_to_debug_console=”0” log_format=”text”/>
A sample Logfile tag entry for the RtfConfigWin.xml file is shown below:
<Logfile path=”$(INTEL_DIALOGIC_DIR)\log” size=”300” maxbackups=”10”
preserve_size=”300” preserve_maxbackups=”10”
duplicate_to_debug_console=”0” log_format=”text”/>
The Logfile tag includes the following attributes:
path
Indicates a valid directory path for the log file. The default path for Linux is
$(INTEL_DIALOGIC_DIR)/log. The default path for Windows is $(INTEL_DIALOGIC_DIR)\log.
The INTEL_DIALOGIC_DIR environment variable is defined as part of the system release
software installation routine. Refer to the Intel Dialogic System Release Software Installation
Guide for more information about the INTEL_DIALOGIC_DIR environment variable.
size
Sets the maximum size, in Kilobytes (KB), of the log file when RTF is run with preservation mode
turned OFF. The default setting is 300. When the file reaches its maximum size, RTF “rolls over”
the log file, much like a circular buffer. The previous log file is saved as a timestamped text file.
RTF aligns the entries so that the oldest entry is always at the top of the log file and the newest
entry is always at the bottom of the log file.
System Software Diagnostics Guide — September 2006
145
Runtime Trace Facility (RTF) Reference
Notes: 1. Due to the internal buffers used by RTF, the actual size of the log file may be up to 1 MB larger
than the size attribute’s value. For example, if the size attribute is set to 1000 KB, the actual log
file may grow up to 2000 KB.
2. This attribute is only applicable when RTF preservation mode is turned OFF. When RTF
preservation mode is ON, the preserve_size attribute determines the size of the log file. Refer to
Section 28.5.3, “Running RTF in Preservation Mode”, on page 156 for information about
preservation mode.
maxbackups
Indicates the maximum number of backup log files the RTF creates when the RTF is run with
preservation mode turned OFF. If this attribute is set to 0, all trace information is written to one log
file. If this attribute is set to 1 or greater, all trace information is initially written to one log file.
When the size of this initial log file reaches the threshold defined in the Logfile tag’s size attribute,
the RTF trace data “rolls over” into a second log file. When the size threshold is reached in the
second log file, the RTF trace data “rolls over” into a third log file. This sequence occurs until the
number of backup log files created equals the maxbackups attribute setting. When the “roll over”
occurs, the previous log file is saved under the following timestamped name:
rtflog-<year><month><day>-<hour>h<minute>m.<second>s.txt
If the number of backup log files exceeds the number defined in maxbackups, the oldest backup file
will be deleted and a new one will be created, on a first in, first out basis. The default maxbackups
value is 10.
Notes: 1. This attribute is only applicable when RTF preservation mode is turned OFF. When RTF
preservation mode is ON, the preserve_maxbackup attribute determines the number of backup
log files. Refer to Section 28.5.3, “Running RTF in Preservation Mode”, on page 156 for
information about preservation mode.
2. There is no limit to the maximum backups imposed by the RTF itself. However, a higher limit
will increase the usage of disk space and impact performance since RTF needs to keep track of
all backup files and remove old ones as necessary.
preserve_size
Sets the maximum size, in Kilobytes (KB), of the log file when the RTF is run with preservation
mode turned ON. The default setting is 300. When the file reaches its maximum size, RTF “rolls
over” the log file, much like a circular buffer. The previous log file is saved as a timestamped text
file. RTF aligns the entries so that the oldest entry is always at the top of the log file and the newest
entry is always at the bottom of the log file.
Note:
146
This attribute is only applicable when RTF preservation mode is turned ON. When RTF
preservation mode is OFF, the size attribute determines the size of the log file. Refer to
Section 28.5.3, “Running RTF in Preservation Mode”, on page 156 for information about
preservation mode.
System Software Diagnostics Guide — September 2006
Runtime Trace Facility (RTF) Reference
preserve_maxbackups
Indicates the maximum number of backup log files the RTF creates when the RTF is run with
preservation mode turned ON. If this attribute is set to 0, all trace information is written to one log
file. If this attribute is set to 1 or greater, all trace information is initially written to one log file.
When the size of this initial log file reaches the threshold defined in the Logfile tag’s preserve_size
attribute, the RTF trace data “rolls over” into a second log file. When the size threshold is reached
in the second log file, the RTF trace data “rolls over” into a third log file. This sequence occurs
until the number of backup log files created equals the preserve_maxbackups attribute setting.
When the “roll over” occurs, the previous log file is saved under the following timestamped name:
rtflog-<year><month><day>-<hour>h<minute>m.<second>s_p.txt
Note:
The _p suffix appears in the log file name because preservation mode is turned ON.
The default preserve_maxbackups value is 10.
Note:
This attribute is only applicable when RTF preservation mode is turned ON. When RTF
preservation mode is OFF, the maxbackups attribute determines the number of backup log files.
Refer to Section 28.5.3, “Running RTF in Preservation Mode”, on page 156 for information about
preservation mode.
duplicate_to_debug_console
This attribute determines whether or not trace information is duplicated in the debug console
(Windows) or the standard error output (Linux). Possible settings are as follows:
1
The trace output information will be duplicated on the debug console for Windows systems or
the standard error output for Linux systems.
0
The trace output information will not be duplicated on the debug console for Windows systems
or the standard error output for Linux systems. This is the default setting.
log_format
This attribute determines the format of the output log file. By default, this is set to “text” (the trace
output log is written in readable, text file format). However, you can change the attribute to
“binary” to get binary output.
28.3.3
Global Tag
The Global tag is the second child tag of the RTFConfig tag. The Global tag is used to specify the
global configuration. Global configuration settings are valid for all modules included in the RTF
configuration file. However, the Global tag has the lowest priority in the RTF configuration file.
Therefore, the global configuration settings can be overridden by individual settings at the Module
tag level (see Section 28.3.7, “Module Tag”, on page 150).The Global tag cannot occur more than
one time in the RTF configuration file. The Global tag can either be empty:
System Software Diagnostics Guide — September 2006
147
Runtime Trace Facility (RTF) Reference
<Global>
<!-- This is an example of an empty Global tag -->
</Global>
or the Global tag can have GLabel and/or GClient child tags. There are no attributes associated
with the Global tag.
28.3.4
GLabel Tag
The GLabel tag is a child tag of the Global tag; it is used to configure global labels. If a label is
defined at the GLabel level then all module and client behavior will be governed by this
configuration (unless overridden for a given module at the MLabel level).
The following line may appear in the default RtfConfigLinux.xml file:
<GLabel name = “Error” state = “1”/>
This line indicates that tracing of all Error labels is turned on by default. To disable this default
behavior, you can delete this line or change the “Error” state attribute setting to 0.
The following lines appear in the default RtfConfigWin.xml file:
<GLabel name = “Error” state = “1”/>
<GLabel name = “Exception” state = “1”/>
These lines indicate that tracing of all Error labels and all Exception labels is turned on by default.
To disable this default behavior, you can delete these lines or change the “Error” state attribute and
“Exception” state attribute setting to 0.
The GLabel tag has the following two attributes:
name
Indicates the name of the global label to be configured. You must define the name of the global
label; there is no default value. Examples of possible labels include:
• “Error” (enabled at the Global level by default)
• “Debug”
• “Info”
• “Warning”
Note:
148
Refer to the default RTF configuration file’s MLabel name attributes. These default entries are for
the Intel Dialogic runtime libraries. Any of these runtime library label names can be included in a
GLabel tag.
System Software Diagnostics Guide — September 2006
Runtime Trace Facility (RTF) Reference
state
Specifies the state of the label. Valid values are as follows:
1
Label is enabled at the global level. All trace messages associated with this label will be sent to
the trace output. This is the default value.
0
Label is disabled at the global level. Trace messages associated with this label will not be sent
to the trace output.
28.3.5
GClient Tag
The GClient tag is a child tag of the Global tag; it is used to configure global clients (devices). If a
client is defined at the GClient level then all client behavior will be governed by this configuration
(unless overridden for a given client at the MClient level). The GClient tag can be empty or have
GClientLabel children tags. The GClient tag has the following two attributes:
name
Indicates the name of the client to be configured. You must define the name of the global client;
there is no default value. Examples of possible client names include:
• “dxxxB1C1” (voice device)
• “dxxxB2C2” (voice device)
• “ipmB2C2” (IP media device)
Note:
Refer to the Standard Runtime Library API for Windows Operating Systems Programming Guide
for more information about client names for Intel Dialogic libraries and devices.
state
Specifies the state of the client. Valid values are as follows:
1
Client is enabled at the global level. All trace messages associated with this client will be sent
to the trace output. This is the default value.
0
Client is disabled at the global level. Trace messages associated with this client will not be sent
to the trace output.
28.3.6
GClientLabel Tag
The GClientLabel tag is a child tag of the GClient tag; it is used to specify a label for a global
client. The GClientLabel tag has the following two attributes:
System Software Diagnostics Guide — September 2006
149
Runtime Trace Facility (RTF) Reference
name
Indicates the name of a client label to be configured. You must define the name of the client label;
there is no default value. Examples of possible client labels include:
• “Error”
• “Warning”
• “Entry”
Note:
Refer to the default RTF configuration file’s MLabel name attributes. These default entries are for
the Intel Dialogic runtime libraries. Any of these runtime library label names can be included in a
GClientLabel tag.
state
Specifies the state of the label. Valid values are as follows:
1
Client label is enabled at the global level. Trace messages associated with this label will be
sent to the trace output. This is the default value.
0
client label is disabled at the global level. Trace messages associated with this label will not be
sent to the trace output.
28.3.7
Module Tag
This tag is used to specify configuration for various modules. Module tags have a higher priority
than global tags so settings at the module level override settings at the global level. For example, if
the state of a label “Error” is set to “1” in the global section and “Error” is set to “0” for an
individual module, then the label “Error” will not be traced for that particular module. The module
section must exist in the configuration file, even if the section is empty. Possible child tags of the
Module tag are MClient and MLabel.
The RTF configuration file contains modules for the Intel Dialogic runtime libraries. The following
example shows that the module name for the Fax Library is “spwrfax”:
<!-- Fax Library
-->
- <Module name="spwrfax" state="1">
<MLabel name="DEBG" state="0" />
<MLabel name="INFO" state="0" />
<MLabel name="APPL" state="0" />
<MLabel name="WARN" state="0" />
<MLabel name="ERR1" state="1" />
<MLabel name="EXCE" state="0" />
</Module>
You can edit the state attributes of the modules to enable (set state = “1”) or disable (set state = “0”)
the tracing. Alternatively, you can delete one or more modules from the default RTF configuration
file if you are not interested in tracing certain runtime libraries.
Note:
150
The RTF configuration file contains some older sections that have been retained for backward
compatibility.
System Software Diagnostics Guide — September 2006
Runtime Trace Facility (RTF) Reference
The Module tag includes the following attributes:
name
Indicates the name of a module to be configured. Intel Dialogic runtime libraries have module
names in the default RTF configuration file. Example module names in the RTF configuration file
include:
• “gc”
• “libsrl”
• “spwrdevmgmt”
state
Specifies the state of the module. Valid values are as follows:
1
Module is enabled. Trace messages associated with this label will be sent to the trace output.
This is the default value.
0
Module is disabled. Trace messages associated with this label will not be sent to the trace
output.
28.3.8
MLabel Tag
The MLabel tag is a child tag of the Module tag. The MLabel tag is used to configure module
labels. If a label is defined at the global level and the same label is defined at the module level, the
module level configuration overrides the global configuration for the module. The MLabel tag has
the following two attributes:
name
Indicates the name of the label to be configured. The Intel Dialogic runtime libraries have module
label names in the default RTF configuration file. Example module label names in the RTF
configuration file include:
• “APPL”
• “DEBG”
• “WARN”
state
Specifies the state of the label. Valid values are as follows:
1
Label is enabled. Trace messages associated with this label will be sent to the trace output.
This is the default value.
System Software Diagnostics Guide — September 2006
151
Runtime Trace Facility (RTF) Reference
0
Label is disabled. Trace messages associated with this label will not be sent to the trace output.
Note:
28.3.9
When the state attribute is not included or not defined, the default value is 1. However, the Intel
Dialogic runtime library module labels that exist in the default RTF configuration file have their
state attribute initially set to 0.
MClient Tag
The MClient tag is a child tag of the Module tag; it is used to configure a specific client for the
module. The MClient tag can be empty or have MClientLabel children tags. The MClient tag has
the following two attributes:
name
Indicates the name of the client to be configured. The Intel Dialogic runtime libraries have predefined module client names in the default RTF configuration file. Example clients include:
• “dxxxB1C1” (voice device)
• “dxxxB2C2” (voice device)
• “ipmB2C2” (IP media device)
Note:
Refer to the Standard Runtime Library API for Windows Operating Systems Programming Guide
for more information about client names for Intel Dialogic libraries and devices.
state
Specifies the state of the client. Valid values are as follows:
1
Client is enabled. Trace messages associated with this client will be sent to the trace output.
This is the default value.
0
Client is disabled. Trace messages associated with this client will not be sent to the trace
output.
Note:
28.3.10
When the state attribute is not included or not defined, the default value is 1.
MClientLabel Tag
The MClientLabel tag is a child tag of the MClient tag; it is used to specify a label for a client. The
MClientLabel tag has the following two attributes
name
Indicates the name of a label to be configured. You must define the name of the label; there is no
default value. Example labels include:
• “APPL”
152
System Software Diagnostics Guide — September 2006
Runtime Trace Facility (RTF) Reference
• “DEBG”
• “WARN”
Note:
A complete list of labels for a given library can be found in the RTF configuration file.
state
Specifies the state of the label. Valid values are as follows:
1
Label is enabled. Trace messages associated with this label will be sent to the trace output.
This is the default value.
0
Label is disabled. Trace messages associated with this label will not be sent to the trace output.
28.3.11
Precedence Scheme for Module/Client Labels
This section summarizes the precedence scheme of settings in RTF module/client labels. Basically,
RTF has three types of handles for use in determining if a trace statement will be filtered. They are
modules, clients, and labels. A trace statement can use filtering of either of the following:
module+label
For trace statements that use module+label, the trace will only be stored in a file when both
module and label are enabled.
module+client+label.
For trace statements that use module+client+label, the trace will only be stored in a file when
module, client and label are all enabled.
When it is not provided in the configuration file, default enable/disable settings for the three types
of handles are:
• Module: disabled.
• Client: enabled.
• Label: disabled.
For handles set in the configuration file, the precedence order is:
• Module: No precedence order since it is only available at a module level. No global level.
• Client: Settings in the module section override settings in the global section.
• Label: For trace statements without client handles, settings in the module section override
settings in the global section. For trace statements with client handles, settings in the
module/client section override settings in the client/label section; settings in the client/label
section override settings in the module section; and settings in the module section override
settings in the global section.
Figure 19 shows the hierarchy of the possible handles and how they relate to one another.
System Software Diagnostics Guide — September 2006
153
Runtime Trace Facility (RTF) Reference
28.4
Restrictions and Limitations
Keep the following restrictions and limitations in mind when using RTF:
• If you run full RTF logging on high-density systems, you may experience I/O throughput
degradation. It is recommended that you do not run RTF with full logging on high-density
systems or any field-deployed systems. Instead, use just the default error-enabled logging.
• If you install the Intel Dialogic system release software on a FAT32 formatted hard drive, the
RTF tool will generate an Error after install attempting to launch error message. The error
message appears because FAT32 does not support file system access control. However, RTF
will continue to function.
• The Intel Dialogic system software installation routine creates a usr\dialogic\log directory.
When the system software is installed on a Mandriva* (formerly Mandrakesoft) Linux system,
the Mandriva security utility (msec), which automatically runs every hour, may reset the
access permissions to this ...\log directory. To avoid the resetting of permissions, you must
perform the following before running RTF:
1. Issue the echo $SECURE_LEVEL command. The Mandriva Linux system will return a
number that indicates the current system security setting.
2. Add the following line to the perm.n file (located in /usr/share/msec/perm.n), where n
indicates the security setting number returned in the previous step:
\var\log\dialogic\* current xxx
Where xxx indicates the desired access permission setting for the directory.
3. After you change the perm.n file, run
msec n
so that the change will take effect immediately.
• When RTF logging is enabled, logs are stored in the $(INTEL_DIALOGIC_DIR)\log directory.
You should take necessary precautions to ensure that the directory never fills.
• Occasionally, errors that appear in the RTF log can be ignored in certain circumstances. Check
the “Release Issues” chapter in the Release Update for the Intel telecom software you are
using (System Release or Host Media Processing [HMP]). Such errors will be listed and
explained in the “Release Issues” table.
28.4.1
Guidelines for Editing the RTF Configuration File
Keep the following rules in mind when editing the RTF configuration file:
1. Do not change the name of the file. The filename must remain at its default setting.
2. The RTF configuration file is broken down into four sections. The sequence of the sections
must always be as follows:
a. RTFconfig
b. Logfile configuration
c. Global configuration
d. Module configuration
3. RTF uses the following default log file names:
154
System Software Diagnostics Guide — September 2006
Runtime Trace Facility (RTF) Reference
• rtflog-<year><month><day>-<hour>h<minute>m.<second>s.txt when preservation
mode is OFF.
• rtflog-<year><month><day>-<hour>h<minute>m.<second>s_p.txt when preservation
mode is turned ON.
4. The Global configuration section can only appear one time in the RTF configuration file.
5. If a there is configuration information which conflicts in the global and module sections (for
example, the global section enables a trace label for a client, but the module section disables
this same label for the same client), then the module configuration overrides the global
configuration.
6. Configuration information which is repeated later in the file will take precedence. For
example, if there are two module configurations for spwrvoice, the configuration information
lower in the file will dictate tracing behavior for that module.
Note: This should not be done, but it is mentioned here so the behavior can be recognized if
this situation occurs by error.
7. RTF is case sensitive. Therefore, the trace labels “Error” and “error” are considered to be two
distinctly different trace labels.
8. Simultaneous tracing of multiple Intel Dialogic libraries may have an adverse effect on system
performance.
9. If you run full RTF logging on high-density systems, you may experience I/O throughput
degradation (specifically if you enable tracing on the MClient name MUTEX). It is
recommended that you do not run RTF with full logging on high-density systems or any fielddeployed systems. Contact customer support before enabling extensive logging. Instead, use
just the default error-enabled logging.
10. RTF affects running processes/applications only. If you enable RTF prior to starting your
application, the RTF will not provide trace information until your application has started.
11. If you wish to dynamically edit the RTF trace levels while your application runs, it is not
necessary to stop RTF. Instead, perform the following:
a. Open the RTF configuration file.
b. Customize the settings in the RTF configuration file.
c. Save and close the RTF configuration file.
d. Issue the rtftool reload command to reload RTF configuration file and restart the
RTF engine.
Note: Keep in mind that changes made to the RTF configuration file will not be reflected in
the RTF output until the tool has been reloaded.
12. At any time, you can issue the rtftool command to pause/restart RTF. RTF will not provide
trace output while it is paused. Refer to Section 28.5, “rtftool Command”, on page 156 for
more information.
13. Save the original RtfConfigWin.xml file or RtfConfigLinux.xml file, as it is advisable to return
to the original logging level when finished using the RTF logging mechanism.
System Software Diagnostics Guide — September 2006
155
Runtime Trace Facility (RTF) Reference
28.5
rtftool Command
This section explains the rtftool command, which is used to control RTF and modify the trace
output. The rtftool command is issued from the command line. The rtftool command can be
issued from any directory.
28.5.1
Pausing and Reloading RTF
RTF tracing is enabled by default. Use the rtftool command to pause, resume and reload the
RTF’s tracing capabilities. The rtftool command has the following pause and reload variations:
rtftool pause
Pauses RTF tracing. Trace output will not be written to the log file while RTF is paused.
rtftool resume
Resumes RTF tracing. Issue this command to resume tracing after RTF has been paused.
rtftool reload
Reloads an updated RTF configuration file (RtfConfigLinux.xml or RtfConfigWin.xml) and
restarts RTF, using the settings from the updated RTF configuration file.
Note: You do not need to pause RTF tracing before issuing the rtftool reload
command. RTF supports dynamic updates to the RTF configuration file. Simply edit
and save the file, then issue the rtftool reload command to begin tracing with the
updated RTF configuration file settings.
28.5.2
Clearing the RTF Trace Log File Contents
Use the rtftool command to clear all trace data from the RTF log file. The following command
line option clears the RTF log file contents:
rtftool clean [-f]
Clears the RTF log file contents. When the -f option is used, RTF will not ask the user for
confirmation before clearing the log file.
28.5.3
Running RTF in Preservation Mode
You can set RTF to run in preservation mode. Preservation mode allows you to determine whether
old trace data is overwritten or preserved in a separate file when the log file grows to its maximum
size. When preservation mode is turned ON, RTF will append a _p to the end of each RTF log file
name; RTF will not delete or overwrite these _p log files. Use the preserve_size and
preserve_maxbackup Logfile tag attributes to set the size and number of backup log files,
respectively. Use the following command line option to enable/disable preservation mode:
rtftool preservation {on | off}
Turns RTF preservation mode ON and OFF.
156
System Software Diagnostics Guide — September 2006
Runtime Trace Facility (RTF) Reference
28.6
Example RTF Configuration Files
This section provides a number of example RtfConfig*.xml files along with a brief explanation of
how the file settings affect the RTF trace output. Note that the same rules/examples covered in this
section apply to both the RtfConfigWin.xml and RftConfigLinux.xml file.
28.6.1
Example 1: Tracing disabled - RtfConfigWin.xml
<?xml version="1.0" standalone="no"?>
<RTFConfig trace="0" tracelocation=”TRACE_LOG” logformat=”ALIGN”
timestamp=”1”>
<Logfile path="$(INTEL_DIALOGIC_DIR)\log" size="1000" maxbackups=”2”
preserve_size=”300” preserve_max_backups=”10”
duplicate_to_debug_console=”0” log_format=”text”/>
<Global>
</Global>
<Module name="spwrvoice" state = "1">
MLabel name="ERR1" state = "1"/>
MLabel name="WARN" state = "0"/>
</Module>
</RTFConfig >
Explanation
The RTFConfig tag’s trace attribute is set to 0 so tracing is disabled. Trace output will not be
created. Set the trace attribute to 1 to activate tracing.
28.6.2
Example 2: Tracing enabled, logfile path and size specified,
preservation mode OFF, one module configured RTFConfigLinux.xml
<?xml version="1.0" standalone="no"?>
<RTFConfig trace="1" tracelocation=”TRACE_LOG” timestamp=”1”
logformat=”ALIGN”>
<Logfile path="$(INTEL_DIALOGIC_DIR)/log" size="1000" maxbackups=”2”
preserve_size=”300” preserve_max_backups=”10”
duplicate_to_debug_console=”0” log_format=”text”/>
System Software Diagnostics Guide — September 2006
157
Runtime Trace Facility (RTF) Reference
<Global>
</Global>
<Module name="spwrvoice" state = "1">
MLabel name="ERR1" state = "1"/>
MLabel name="WARN" state = "1"/>
</Module>
</RTFConfig >
Explanation
The RTFConfig tag’s trace attribute is set to 1 so tracing is enabled. The Global tag is empty, so
there is no global configuration. For this example, tracing is only configured at the module level.
The path for the log file is $(INTEL_DIALOGIC_DIR)/log. Preservation mode is OFF, so the size
and maxbackup attributes apply while the preserve_size and preserve_max_backups attributes are
ignored. The maximum logfile size is 1000KB. The system maintains a maximum of 2 backup log
files.
The only module configured for trace is spwrvoice. This means that all clients (devices) for this
module are configured to trace ERR1 and WARN labels.
28.6.3
Example 3: Tracing enabled, logfile path and size specified,
several modules configured, global configuration used RTFConfigWin.xml
<?xml version="1.0" standalone="no"?>
<RTFConfig trace="1" tracelocation=”TRACE_LOG” logformat=”ALIGN”>
<Logfile path="$(INTEL_DIALOGIC_DIR)\log" size="1000" maxbackups=”2”
preserve_size=”300” preserve_max_backups=”10”
duplicate_to_debug_console=”0” log_format=”text”/>
<Global>
<GLabel name="Entry" state = "1"/>
<GClient name="dxxxB1C2" >
<GClientLabel name="Exit" state =”1”/>
</GClient>
</Global>
<Module name="spwrvoice" state = "1">
MLabel name="ERR1" state = "1"/>
MLabel name="WARN" state = "0"/>
</Module>
158
System Software Diagnostics Guide — September 2006
Runtime Trace Facility (RTF) Reference
<Module name="spwrvoice">
<MLabel name="ERR1" state = "0"/>
<MLabel name="WARN" state = "1"/>
<MClient name="dxxxB1C2" >
<MClientLabel name="ERR1"/>
/MClient>
</Module>
<Module name="faxntf" state = "1">
<MLabel name="WARN" state = "1"/
</Module>
<Module name="dtintf">
<MClient name="dxxxB2C1">
<MClientLabel name="EXCE"/
</MClient>
</Module>
</RTFConfig >
Explanation
The trace attribute of the RTFConfig tag is set to 1 so tracing is enabled.
The logfile path is $(INTEL_DIALOGIC_DIR)\log. Preservation mode is ON, so the size and
maxbackup attributes are ignored while the preserve_size and preserve_max_backups attributes
apply. The maximum logfile size is 300KB. The system maintains a maximum of 10 backup log
files (filenames appended with a _p).
The Global section is present in the configuration file, so all modules will have this global
configuration. This configures “Entry” as a global label and “dxxxB1C2” is a global client for label
“Exit”.
In the module section, there are two configurations for spwrvoice so the later configuration will
take precedence. Since the state of spwrvoice is not specified, it takes default value “1”. Tracing is
enabled for the module spwrvoice but only for the “WARN” label.
The client “dxxxB1C2” is also configured to trace in the spwrvoice module with the label “ERR1”.
Therefore the client “dxxxB1C2” in spwrvoice is traced for the label “ERR1”, even though it is
disabled in the module section. While all other clients of spwrvoice are configured to be traced for
only label “WARN”, as “WARN” is the only label configured to be traced for the module.
The faxntf module is configured to trace “WARN” (from the module section) and “Entry” (from the
global section).
System Software Diagnostics Guide — September 2006
159
Runtime Trace Facility (RTF) Reference
The dtintf module is configured to trace “Entry” (from the global section). “dxxxB1C2” in dtintf is
configured to trace “Entry” (from the global section) and “Exit” (from the global client). The other
client “dxxxB2C1” is configured to trace “Entry” (from the global configuration) and “EXCE”
(from the module client section). All other clients of this module are configured to trace “Entry”
(from the global section) since these labels are configured for the module.
28.7
Configuring Remote RTF Logging
This section contains the following information:
• Introduction
• Configuring the Client System
• Configuring the Server System
• Cautions
• Disabling Remote Logging
28.7.1
Introduction
RTF servers can be configured to communicate with each other. This provides remote tracing
capability. A trace produced on one machine can be re-directed and stored on another machine on
the network. This section describes how to configure remote RTF logging.
The terminology used to describe remote RTF logging is as follows:
Client (remote) system
A system that contains System Release software and telephony boards and is running the enduser telephony application.
Server (management/help desk system)
A system that contains the System Release software and will be used to collect RTF logs from
one or more client systems.
28.7.2
Configuring the Client System
To configure the client system, edit the RTF configuration file (RtfConfigLinux.xml for Linux and
RtfConfigWin.xml for Windows) as follows:
1. Locate the line containing the tag Network mode= and set it's value to "client".
2. Locate the line containing the tag server_name= and set its value to either the fully-qualified
domain name or IP address of the server system.
3. Optionally, you may change the TCP port used by locating the line containing Client
port_number= and changing its value to the port number you wish to use. Note that you must
make a corresponding change on the server system (see Configuring the Server System).
4. If the System Release has not yet been started, run dlstart. Otherwise, cause the RTF
program to reload the updated configuration file by running rtftool reload.
Figure 20 shows a portion of a sample RTF configuration file edited to configure the client system.
160
System Software Diagnostics Guide — September 2006
Runtime Trace Facility (RTF) Reference
Figure 20. RTF Configuration File Edited to Configure the Client System
28.7.3
Configuring the Server System
To configure the server system, edit the RTF configuration file (RtfConfigLinux.xml for Linux and
RtfConfigWin.xml for Windows) as follows:
1. Locate the line containing the tag Network mode= and set its value to "server". The value
of server_name= must be 127.0.0.1.
2. Optionally, you may change the TCP port used by locating the line containing Server
port_number= and changing its value to the port number you wish to use. Note that you must
make a corresponding change on the client system(s) (see Configuring the Client System).
3. If the System Release has not yet been started, run dlstart. Otherwise, cause the RTF
program to reload the updated configuration file by running rtftool reload.
Figure 21 shows a portion of a sample RTF configuration file edited to configure the server system.
Figure 21. RTF Configuration File Edited to Configure the Server System
28.7.4
Cautions
Following are some cautions to keep in mind when configuring remote RTF logging:
1. If the value of the server_name field is a hostname, the name must be resolvable either via
DNS query or via /etc/hosts. Failure of hostname resolution will prevent remote logging
from occurring.
2. Depending on the level of RTF logging enabled, application or network performance may be
impacted. The impact may be more significant if VoIP technology is being used.
3. Having multiple client systems log to a central server is possible by setting the
max_connection= parameter in the server's RTF configuration file, but this capability should
be used with caution.
System Software Diagnostics Guide — September 2006
161
Runtime Trace Facility (RTF) Reference
28.7.5
Disabling Remote Logging
To disable remote logging, set the value of Network mode= to "off". The Intel® Dialogic®
system release software ships with remote logging disabled.
162
System Software Diagnostics Guide — September 2006
RTFManager Reference
29.
29
This chapter describes how to use the Runtime Trace Facility Manager GUI (RTFManager) to
configure the trace levels and output of the Runtime Trace Facility (RTF) utility. This chapter
contains the following information:
• Description. . . . . . . . . . . . . . . . . . . . . . . . . . . . . . . . . . . . . . . . . . . . . . . . . . . . . . . . . . . 163
• Guidelines . . . . . . . . . . . . . . . . . . . . . . . . . . . . . . . . . . . . . . . . . . . . . . . . . . . . . . . . . . . 164
• Starting RTFManager . . . . . . . . . . . . . . . . . . . . . . . . . . . . . . . . . . . . . . . . . . . . . . . . . . 164
• Main Window . . . . . . . . . . . . . . . . . . . . . . . . . . . . . . . . . . . . . . . . . . . . . . . . . . . . . . . . 164
• General Tab . . . . . . . . . . . . . . . . . . . . . . . . . . . . . . . . . . . . . . . . . . . . . . . . . . . . . . . . . . 166
• Filtering Tab. . . . . . . . . . . . . . . . . . . . . . . . . . . . . . . . . . . . . . . . . . . . . . . . . . . . . . . . . . 168
• Log File Filtering. . . . . . . . . . . . . . . . . . . . . . . . . . . . . . . . . . . . . . . . . . . . . . . . . . . . . . 170
• Advanced Tab . . . . . . . . . . . . . . . . . . . . . . . . . . . . . . . . . . . . . . . . . . . . . . . . . . . . . . . . 171
If you prefer to configure RTF manually or need a detailed explanation of what the RTF
configuration file contains, refer to Chapter 28, “Runtime Trace Facility (RTF) Reference”.
29.1
Description
RTF provides a mechanism for tracing the execution path of the runtime libraries for the Intel®
Dialogic® system release software. All libraries that use RTF write their trace messages to a log
file. The resulting log file helps troubleshoot runtime issues for applications that are built with Intel
Dialogic system release software.
Trace control settings and log file formatting are set via the Runtime Trace Facility Manager. Each
runtime library has several levels of tracing that can be dynamically enabled/disabled through the
Runtime Trace Facility Manager.
The Runtime Trace Facility Manager allows you to do the following:
• trace the host libraries on DM3, Springware, and Host Media Processing technology
• use a graphical user interface (Runtime Trace Facility Manager) to configure trace control
settings and the format of resulting log files
• use a command line utility (rtftool) to start/stop RTF tracing and incorporate RTF tracing
configuration changes dynamically
• trace multiple processes and format trace output into a central data store (log file)
• dynamically configure trace options at runtime without terminating running processes
• adjust the runtime configuration, allowing you to trace select modules (libraries), clients
(trunks or channels) and labels (trace categories or levels) to avoid collecting excess trace data
and degrading system performance
System Software Diagnostics Guide — September 2006
163
RTFManager Reference
• filter trace data, allowing you to customize the trace output so that only certain trace
statements are stored
• customize the format, readability, and location of the log files
• limit the size of the log files
• define the number of rolling backup log files to keep.
29.2
Guidelines
Guidelines applicable to RTFManager can also be found in Section 28.4, “Restrictions and
Limitations”, on page 154. Note that some items in this section are only relevant if you are
manually editing the RTF configuration file.
In addition, here are some guidelines specific to RTFManager:
• RTFManager will remember your previous settings when opening the configuration file.
• RTFManager can be used to reload a new trace configuration into RTF while applications are
running, thus allowing you to change tracing on the fly. RTF will reload the configuration
XML file after you change the configuration either on the General Tab or Filtering Tab and
click the OK button.
• RTFManager enables you to reset the configuration file to its default state (all product families
and all technologies tracing at the Error level) by using the Reset Default Settings button on
the Filtering Tab.
• Sometimes “custom” configuration files are used. RTFManager will detect whether or not the
configuration file is custom. Custom configuration files are used for specific troubleshooting
purposes and are not usually modified by most users. They can only be modified using the
Advanced tab. For more information, refer to Section 29.8, “Advanced Tab”, on page 171.
29.3
Starting RTFManager
On Windows systems, RTFManager can be started from the Start menu. RTFManager is in the
program group for the Intel telecom software (System Release or Host Media Processing).
RTFManager can also be started by just typing “RTFManager” from the console since it is in the
path of the operating system’s executable searching.
On Linux systems, RTFManager can be started by typing /usr/dialogic/RTFManager or
RTFManager if the executable is in the operating system’s executable searching path.
29.4
Main Window
After you have launched the Runtime Trace Facility Manager, the main window appears. The main
window allows you to view existing log files and set Runtime Trace Facility configuration options.
The main window toolbar contains the following menu items:
• File
164
System Software Diagnostics Guide — September 2006
RTFManager Reference
• Edit
• Tools
• Help
29.4.1
File
The File menu contains options for working with the log files. The File menu contains the
following options:
Open
Opens a previously saved log file.
Close
Closes the open log file.
Save
Saves the open log file.
Save As
Saves a copy of the log file under a different name or in a different location.
Exit
Closes the Runtime Trace Facility Manager.
29.4.2
Edit
The Edit menu contains options for manipulating and searching the text of an existing log file. The
Edit menu contains the following options:
Cut
Cuts the selected text.
Copy
Copies the selected text.
Paste
Pastes text to the selected location.
Delete
Deletes the selected text.
Find...
Launches the Find dialog box. The Find dialog box allows you to search the log file for
alphanumeric strings.
Find Next...
Finds the next instance of an alphanumeric string.
Replace...
Replaces the selected text with new text.
Go To...
Jumps to a given line number in the log file.
System Software Diagnostics Guide — September 2006
165
RTFManager Reference
Select All
Selects all text in the log file.
29.4.3
Tools
The Tools menu contains options for filtering the log file that is displayed in the Runtime Trace
Facility Manager main window and configuring the RTF trace capabilities. The Tools menu
contains the following options:
Filter...
Launches the Filters dialog box. The Filters dialog box allows you to selectively display
certain trace statements in the log file. Refer to Section 29.7, “Log File Filtering”, on page 170
for more information.
RTF Configuration...
Launches the Runtime Trace Facility Manager Configuration window. The Runtime Trace
Facility Manager Configuration window contains the following two tabs:
• General - The General tab is used to enable/disable RTF tracing and customize the format,
readability and location of the log files. Refer to Section 29.5, “General Tab”, on page 166
for more information.
• Filtering - The Filtering tab allows you to determine which libraries to trace and the trace
level (Debugging, Program Flow, Warnings, Errors) for each library. Refer to
Section 29.6, “Filtering Tab”, on page 168 for information about using the Filtering tab.
29.4.4
Help
The Help menu contains the following options:
Help Topics
Launches the Runtime Trace Facility Manager online help.
About
Displays the version number of the Runtime Trace Facility Manager.
29.5
General Tab
The General tab is used to enable/disable RTF tracing and customize the format, readability and
location of the log files.
Note:
166
It is possible to reload a new trace configuration into RTF while applications are running. Just
change the configuration on RTFManager’s General Tab and click the OK button. RTF will then
reload the configuration XML file.
System Software Diagnostics Guide — September 2006
RTFManager Reference
The general tab contains the following settings:
Enable Global Tracing?
This check box is used to enable or disable the RTF tracing capabilities. If the box is checked,
RTF tracing is enabled. If the box is not checked, RTF tracing is disabled.
Note: Enable/disable means RTFManager will modify the RTF configuration file to change
certain values to enable/disable a group of modules. RTFManager will reload the RTF
to let the change take effect.
Timestamp
This check box acts as a Boolean flag to determine whether or not time stamps are generated in
the log file. If the box is checked, time stamps will appear in the log files. If the box is not
checked, time stamps will not appear in the log files.
Log Format
This attribute defines the format of the log file. The following three values are supported:
• Text Aligned - Aligns the trace entry fields in the log file into comma separated columns.
The top of each column includes a header that provides a description of the column’s
content. This is the default setting.
• Text Unaligned - Separates the trace entry fields in the log files with commas only.
Column alignment is not done.
• Binary - Not supported by the current release.
Note: Using the Text Aligned setting makes the log file easier to read but it does not make
efficient use of hard drive space. This inefficiency is exacerbated as the log file grows.
The Text Unaligned format is separated by commas so it can be parsed by a
spreadsheet or database program to make the file easier to read.
Logfile Directory
This attribute defines the location of the log file. This attribute is read-only.
Logfile Prefix
This attribute defines the name of the log file. This attribute is read-only.
Logfile Size
Sets the maximum size, in Kilobytes (KB), of the log file. The default setting is 1000. The size
is the maximum size of a single log file. When the file reaches this size, the RTF behavior
depends on the setting of the attribute as follows:
• If Maximum Backups is set to 0, RTF “rolls over” the log file, much like a circular buffer.
RTF aligns the entries so that the oldest entry is always at the top of the log file and the
newest entry is always at the bottom of the log file.
• If Maximum Backups is set to 1 or greater, the log file will be closed and a new log file
will be created. This sequence continues until the Maximum Backups threshold is
reached.
Maximum Backups
This attribute is used to determine whether or not backup log files are created. Valid values are
as follows:
• 0 - Backup log files will not be created. All trace information will be written to one log
file. When the size of this log file reaches the threshold defined in the attribute, RTF “rolls
over” the log file, much like a circular buffer. RTF aligns the entries so that the oldest
entry is always at the top of the log file and the newest entry is always at the bottom of the
log file. This is the default setting.
System Software Diagnostics Guide — September 2006
167
RTFManager Reference
• 1 or greater - Backup log files will be created. All trace information is initially written to
one log file. When the size of this log file reaches the threshold defined in the Logfile Size
attribute, the initial log file is saved and the trace data is written to a second log file. This
sequence occurs until the threshold is reached.
Note: There is no limit to the maximum backups imposed by the RTF itself. However, a
higher limit will increase the usage of disk space and impact performance since RTF
needs to keep track of all backup files and remove old ones as necessary.
Module Width
Allows you to customize the number of characters that appear in the log file’s Module column.
This attribute is only applicable when the attribute is set to Text Aligned. The default setting is
10.
Client Width
Allows you to customize the number of characters that appear in the log file’s Client column.
This attribute is only applicable when the attribute is set to Text Aligned. The default setting is
10.
Label Width
Allows you to customize the number of characters that appear in the log file’s Label column.
This attribute is only applicable when the attribute is set to Text Aligned. The default setting is
10.
29.6
Filtering Tab
This section provides information about the Runtime Trace Facility Manager Configuration
window’s Filtering tab, which is shown in Figure 22. The Filtering tab allows you to trace select
Intel® Dialogic® System Release libraries and set the trace level for each library. This helps to
avoid collecting excess trace data and degrading system performance.
Note:
168
It is possible to reload a new trace configuration into RTF while applications are running. Just
change the configuration on RTFManager’s Filtering Tab and click the OK button. RTF will then
reload the configuration XML file.
System Software Diagnostics Guide — September 2006
RTFManager Reference
Figure 22. RTFManager Filtering Tab
The following procedure describes how to use the Runtime Trace Facility Manager Configuration
window’s Filtering tab:
1. The top row of check boxes represents several Intel® telecom product families (DM3,
Springware, Host Media Processing). To trace a library that runs on a given product family,
you must populate the check box for the product family. For example, if the application you’d
like to trace uses the voice library on Springware hardware, you must check the SPWR box.
Each technology has a slider that allows you to set the RTF’s trace level. This is the Intel
telecom product technology level. The technology sliders are defined as follows:
• OAM - traces the DM3 transport layer, and also includes such things as timeslot
configuration, CT Bus clocking agent, event services (fault detectors), and OAM IPC
• PSTN - traces call control libraries (Global Call, DTI, Standard Runtime)
• FAX - traces Fax libraries
• IPT - traces Internet Protocol libraries (IPML, DM3 transport layer, IP call control)
• Media - traces media libraries (Voice, CSP)
• Conf - traces conferencing libraries (CNF, DM3 transport layer, DCB, MSI, HDSI)
2. Trace levels appear on the left side of the window. Each trace level corresponds to turning on
certain labels according to the following:
System Software Diagnostics Guide — September 2006
169
RTFManager Reference
• Errors - Traces the following labels: ERR1, ERR2, EXCE, and EINF. This is the lowest
slider setting, so these tags are always traced.
• Warnings - Traces the WARN label in addition to the Error labels.
• Program Flow - Traces the INTF, INFO, and APPL labels in addition to the Warning and
Error labels.
• Debugging - Traces the DEBG label in addition to the Program Flow, Warning, and Error
labels. All trace labels are enabled at this level.
Note: Alternatively, you can click on any one of the label buttons to set all sliders to the
given level.
3. When you have finished setting the trace levels, click OK.
4. You can then start your application (if it not already running). Trace output will appear in a log
file. You can display the log file in the Runtime Trace Facility Manager main window using
the File -> Open menu item. Furthermore, you can use the Runtime Trace Facility Manager
main window to only display select trace output statements.
29.7
Log File Filtering
The Runtime Trace Facility Manager provides a log file filtering mechanism that allows you to
customize the log file so that only certain trace statements are displayed. Use the following
procedure to filter the log file:
1. In the Runtime Trace Facility Manager main window, select File -> Open to open an existing
RTF log file.
2. Select Tools -> Filter... The Filters dialog box appears. The Filters dialog box lists any filters
you currently have set up in the Runtime Trace Facility Manager.
3. In the Filters dialog box, click the New button. The New Filter window appears.
4. Select Module, Client or Label from the New Filter window’s drop-down menu, depending
on which element you’d like to view on the log file.
5. In the New Filter window’s text box, type the name of the Module, Client or Label you’d like
to view in the log file.
6. Click OK.
7. The newly created filter will be added to the list in the Filters window. Keep in mind that when
more than one filter is shown, they are AND’ed together. For example, if you have the
following filters setup:
• Module is equal to gc
• Label is equal to DEBG
8. Then the log file will only show the trace statements that contain the gc module and the DEBG
label.
9. The log file will refresh and display its contents according to the filters you have set up.
10. If you subsequently modify or delete filters, the original data is re-filtered based on the latest
set of filters. The original log file is left unchanged unless you choose to save it using the File
-> Save or File ->Save As menu items.
170
System Software Diagnostics Guide — September 2006
RTFManager Reference
29.8
Advanced Tab
The Advanced tab is not recommended for most users. Most users should only adjust settings using
the Filtering Tab and General Tab as described above. Those using the Advanced tab must obtain
specific directions on which settings to use. The Advanced tab should primarily be used by Intel
developers to modify a custom RTF configuration file. These custom configuration files are used
for specific troubleshooting purposes.
RTFManager will detect whether or not the RTF configuration file is custom or not. An RTF
configuration file is considered a custom configuration file if it has a label other than the standard
labels (ERR1, ERR2, EXCE, EINF, WARN, INTF, APPL, INFO, DEBG) and the state of the label
is turned to ON (state="1"). In other words, a custom file is defined as one that does not abide by
the rules set up through the checkboxes, technology sliders and level buttons on the Filtering Tab.
If RTFManager detects a custom configuration file, the only way to change the custom
configuration file using the RTFManager is to start RTFManager up in advanced mode. Otherwise,
the only thing you will be allowed to do is reset the configuration file back to its default and then
you will be allowed to use the Filtering Tab to change the file.
When a custom file is loaded, you are warned that a custom file is being loaded and you must
enable the “Advanced Wizard” to configure the tracing levels. The Advanced Wizard is enabled by
running RTFManager with the -expert command line argument (in this case, you cannot run
RTFManager from the regular start menu item but must run it manually from the command line).
A password is required to enter this advanced mode. When you enter advanced mode, the
RTFManager will start and provide a third tab named “Advanced.” In advanced mode, you are
presented with a tree structure of all modules and labels and you can enable or disable any of them.
The Advanced tab has six buttons for use in performing configuration tasks:
Thumbs Up
Enables a particular lib/module/client/label. If the item is already enabled, the Thumbs Up
button will be disabled and the Thumbs Down button will be enabled.
Thumbs Down
Disables a particular lib/module/client/label. If the item is already disabled, the Thumbs Down
button will be disabled and the Thumbs Up button will be enabled.
Scissors
Deletes an item.
M
Allows you to add a new Module.
C
Allows you to add a new Client.
L
Allows you to add a new Label.
When you have completed work on configuration, click the OK button at the bottom of the screen.
You can also click Cancel to exit the screen without making changes.
System Software Diagnostics Guide — September 2006
171
RTFManager Reference
172
System Software Diagnostics Guide — September 2006
Status Monitor Reference
30.
30
This chapter provides reference information about the Status Monitor tool. This chapter contains
the following information:
• Description. . . . . . . . . . . . . . . . . . . . . . . . . . . . . . . . . . . . . . . . . . . . . . . . . . . . . . . . . . . 173
• Guidelines . . . . . . . . . . . . . . . . . . . . . . . . . . . . . . . . . . . . . . . . . . . . . . . . . . . . . . . . . . . 173
• Options. . . . . . . . . . . . . . . . . . . . . . . . . . . . . . . . . . . . . . . . . . . . . . . . . . . . . . . . . . . . . . 173
30.1
Description
The Status Monitor tool enables you to track the state of the TSC as well as the state of the bits on
a robbed bit or CAS line. You can use Status Monitor for both troubleshooting and administration.
For troubleshooting, you can monitor the call state for problems such as hung channels. For
administration, you can watch call progress and channel usage.
30.2
Guidelines
Following are guidelines for using the Status Monitor tool:
• The Status Monitor tool consumes a portion of the CPU for each trunk that is logged and may
generate an exception if CTRL-C is used to exit the tool. It may take a long time to start the
monitoring: about 1 minute per board.
• The CAS instance is not valid until the line is in service, so you will have to run an application
or the Lineadmin and Phone tools to set the channel in-service before using the bit monitoring
feature. For information about the Lineadmin tool, refer to the Administration Guide for the
system release. For information about the Phone tool, refer to Chapter 25, “Phone Reference”.
• The Status Monitor tool is best viewed in resolutions greater than 1024 x 768.
• The Status Monitor tool is not intended for use with boards that are configured for ISDN.
30.3
Options
Status Monitor has the following option:
-board <board list>
Logical ID of the board(s) to trace (optional). The default is to monitor all DM3 boards in the
system. Use the Configuration Manager (DCM) utility to obtain the board’s logical ID.
The following will run the Status Monitor tool on boards 0 and 1:
StatusMon -board 0 1
Figure 23 provides an example of output from the Status Monitor tool.
System Software Diagnostics Guide — September 2006
173
Status Monitor Reference
Figure 23. Example of Status Monitor Output
The following numbered list corresponds to the labels in Figure 23.
1. You can toggle between monitored boards by clicking on the tab that represents the board ID.
2. This part of the display shows the current alarm state on the trunk (red, yellow, or green).
3. Use this button to invoke the Lineadmin tool to view and set additional alarms.
4. This part of the display allows you to monitor the call state for each line on the board.
5. Clicking on a line will cause the bit information to be displayed in this window. (All 1’s will be
displayed for ISDN lines.)
174
System Software Diagnostics Guide — September 2006
Glossary
ANI: Automatic Number Identification. A telephone service that provides the telephone number of an incoming
call. ANI is also known as Caller ID.
Automatic Number Identification: See ANI.
B channel: A bearer channel that carries the main data.
bit oriented : Communications protocols in which control information may be coded in a single bit.
CAS: Channel Associated Signaling. Signaling in which the signals necessary to switch a given circuit are
transmitted via the circuit itself or via a signaling channel permanently associated with it.
called ID: A telephone service that identifies for the receiver what telephone number was dialed by the caller.
This is also known as DNIS.
caller ID: A telephone service that provides the telephone number of an incoming call. Caller ID is also known as
ANI.
channel: A path of communication, either electrical or electromagnetic, between two or more points. Also called
a circuit, facility, line, link or path.
D channel: A channel that carries control and signaling information.
Dialed Number Identification Service: See DNIS.
DNIS: Dialed Number Identification Service. A telephone service that identifies for the receiver what telephone
number was dialed by the caller. This is also known as Called ID.
Integrated Services Digital Network: See ISDN.
ISDN: Integrated Services Digital Network. An integrated digital network in which the same time-division
switches and digital transmission paths are used to establish connections for different services. ISDN services
include telephone, data, electronic mail, and facsimile. The method used to accomplish a connection is often
specified: for example, switched connection, nonswitched connection, exchange connection, ISDN connection.
line loopback: A signal used to command the far-end receiver to loop back the received line signal.
loopback: A state of a transmission facility in which the received signal is returned towards the sender; a type of
diagnostic test in which the transmitted signal is returned to the sending device after passing through a data
communications link or network, which allows the returned signal to be compared with the transmitted signal for
troubleshooting purposes.
loop start: Seizing (starting) a line by bridging through a resistance the tip and ring (both wires) of a telephone
line. In residential installations, the loop start trunk is the most common.
System Software Diagnostics Guide — September 2006
175
metallic circuit: A circuit in which metallic conductors are used and in which the ground or earth forms no part.
metallic loopback: Metallic loopback loops the data back to the network at the physical port on the back card of
a service module, whereas local loopback loops the data back to the network through the framer in the service
module.
OSD: Operating System Distribution.
payload: In a set of data, such as a data field, block, or stream, being processed or transported, the part that
represents user information and user overhead information, and may include user-requested additional information,
such as network management and accounting information.
payload loopback: A signal used to command the far-end receiver to loop back the received payload.
POST: Power-On Self Test. A series of diagnostic tests used to verify that the DM3 architecture board
components are working properly.
PSTN: Public Switched Telephone Network.
Public Switched Telephone Network: PSTN. A domestic telecommunications network usually accessed by
telephones, key telephone systems, private branch exchange trunks, and data arrangements.
signaling : To set up and tear down calls, some form of signaling is required (simple examples are ringing and
dial tone).
trunk: In a communications network, a single transmission channel between two points that are switching centers
or nodes, or both.
wink start: A signal sent between two telecommunications devices as part of a “handshake” protocol.
176
System Software Diagnostics Guide — September 2006
Index
A
ALIGNED 144
APPL 170
application failure or crash 44
archiving system configuration 44
B
Binary 167
board, checking 27
board, processor or SRAM fault on 29
C
CallInfo tool 63
CAS bit transitions/states 47
CAS data 92
CAS signaling 89
CAS Trace tool 65
check network connection 31
checking an individual DM3 architecture board 27
checking the protocol configuration 35
class driver counters 115
client 142
Client Width 168
ClientWidth 144
collecting the system data 44
command line options
pstndiag tool 137
Conf 169
Configuration Dialog of DMC 74
Control Processor 27
control processor fault 29
creating a system configuration archive 44
D
DEBG 170
DebugAngel 28
DebugAngel tool 69
Debugging 170
detecting and isolating possible hardware faults 27
System Software Diagnostics Guide — September 2006
diagnostic tasks
checking log file 135
checking protocol configuration 35
Diagnostics Management Console 71
Diagnostics Management Console (DMC) 23
Digit Detector tool 77
dlgsnapshot 29
Dlgsnapshot tool 79
DM3 PDK Protocol Trace 121
DM3Insight.chm 83
DM3post 27
DMC 71
DMC Configuration Dialog 74
document tag 143
E
EINF 170
Enable Global Tracing 167
ERR1 170
ERR2 170
Errors 170
EXCE 170
F
FAX 169
Filtering tab - RTF configuration 168
firmware tracing 28
G
gc_GetConfigData( ) 52
GC_PARM_BLK 52
gc_ResultInfo( ) 50
gc_SetConfigData( ) 52
gc_StartTrace( ) 48, 55
gc_StopTrace( ) 48, 55
gc_util_insert_parm_val( ) 52
GCEV_TRACEDATA 47, 55, 89
GClient tag 149
GClientLabel 149
General tab (RTF configuration) 166
177
GLabel tag 148
Global Call 15, 56, 125
Global tag 147
I
INFO 170
Intel Telecom Subsystem Summary Tool 44
INTF 170
IPT 169
ISDN D-channel 105
ISDN D-channel trace 55
ISDN payload format 94
ISDN trunks 91
ISDN-related messages 63
ISDNtrace tool 105
its_sysinfo 44
Media 169
menu bar of DMC 73
mercmon
class driver counters 115
protocol driver counters 116
MLabel 150
MLabel tag 151
module 142
Module Width 168
ModuleWidth 144
N
network connection, checking 31
O
OAM 169
K
P
KernelVer tool 113
path 145
PDK Trace tool 121
Phone tool 15
phone tool 125
Program Flow 170
protocol configuration, checking 35
protocol driver counters 116
PSTN 169
pstndiag 35, 135
command line options 137
keyboard navigation 135
lower pane 130
upper pane 130
view bar 130
pstndiag tool 31, 35
L
label 142
Label Width 168
LabelWidth 145
local diagnostic applications 73
log file filtering (RTFManager) 170
log file panel of DMC 73
log files
pstndiag tool 135
Log Format 167
Logfile Directory 167
Logfile Prefix 167
Logfile Size 167
Logfile tag 145
logformat 144
M
main window of Diagnostics Management Console
(DMC) 72
main window of RTFManager 164
Maximum Backups 167
MClient 150
MClient tag 152
MClientLabel tag 152
178
R
R2MF data 92
R2MF tones 47
remote diagnostics applications 73
remote use of diagnostic tools 24
RTF Configuration - Filtering Tab 168
RTF Configuration - General Tab 166
RTF configuration file 142
RTF tool 41
RTFConfig tag 143
RtfConfigLinux.xml 141
System Software Diagnostics Guide — September 2006
RtfConfigWin.xml 141
RTFManager 163
runtime libraries 41
Runtime Trace Facility 41
Runtime Trace Facility Manager GUI 163
S
SigDet OFF Data 93
SigDet ON data 93
Signal Detector 77
signal processor fault 29
Signal Processors 85
size 145
state 149
Status Monitor tool 173
system configuration archive 44
T
Telephony Service Provider 63
Text Aligned 167
Text Unaligned 167
Timestamp 167
Tone Generator 77
trace 144
trace entry 142
tracelocation 144
Tracing disabled 157
TSC 15, 125
TSP 63
U
UNALIGNED 144
use a diagnostics tool on a remote machine 24
V
view a log file 24
W
WARN 170
Warnings 170
System Software Diagnostics Guide — September 2006
179