1
CSAT3 THREE DIMENSIONAL SONIC ANEMOMETER
INSTRUCTION MANUAL
REVISION: 3/98
COPYRIGHT (c) 1996-1998 CAMPBELL SCIENTIFIC, INC.
WARRANTY AND ASSISTANCE
The CSAT3 THREE DIMENSIONAL SONIC ANEMOMETER is warranted by CAMPBELL SCIENTIFIC,
INC. to be free from defects in materials and workmanship under normal use and service for twelve (12)
months from date of shipment unless specified otherwise. Batteries have no warranty. CAMPBELL
SCIENTIFIC, INC.'s obligation under this warranty is limited to repairing or replacing (at CAMPBELL
SCIENTIFIC, INC.'s option) defective products. The customer shall assume all costs of removing,
reinstalling, and shipping defective products to CAMPBELL SCIENTIFIC, INC. CAMPBELL SCIENTIFIC,
INC. will return such products by surface carrier prepaid. This warranty shall not apply to any CAMPBELL
SCIENTIFIC, INC. products which have been subjected to modification, misuse, neglect, accidents of
nature, or shipping damage. This warranty is in lieu of all other warranties, expressed or implied, including
warranties of merchantability or fitness for a particular purpose. CAMPBELL SCIENTIFIC, INC. is not
liable for special, indirect, incidental, or consequential damages.
Products may not be returned without prior authorization. To obtain a Returned Materials Authorization
(RMA), contact CAMPBELL SCIENTIFIC, INC., phone (435) 753-2342. After an applications engineer
determines the nature of the problem, an RMA number will be issued. Please write this number clearly on
the outside of the shipping container. CAMPBELL SCIENTIFIC's shipping address is:
CAMPBELL SCIENTIFIC, INC.
RMA#_____
815 West 1800 North
Logan, Utah 84321-1784
CAMPBELL SCIENTIFIC, INC. does not accept collect calls.
Non-warranty products returned for repair should be accompanied by a purchase order to cover the repair.
815 W. 1800 N.
Logan, UT 84321-1784
USA
Phone (435) 753-2342
FAX (435) 750-9540
www.campbellsci.com
Campbell Scientific Canada Corp.
11564 -149th Street
Edmonton, Alberta T5M 1W7
CANADA
Phone (403) 454-2505
FAX (403) 454-2655
Campbell Scientific Ltd.
Campbell Park
80 Hathern Road
Shepshed, Leics. LE12 9RP
ENGLAND
Phone (44)-50960-1141
FAX (44)-50960-1091
CSAT3 THREE DIMENSIONAL SONIC ANEMOMETER
INSTRUCTION MANUAL
TABLE OF CONTENTS
1.
PAGE
GENERAL .................................................................................................................................... 1
2.
SPECIFICATIONS ..................................................................................................................... 1
3.
INITIAL SETUP .......................................................................................................................... 2
3.1
3.2
4.
4.1
4.2
4.3
4.4
Factory Settings......................................................................................................................... 2
SDM Address ............................................................................................................................ 2
INSTALLATION.......................................................................................................................... 3
Orientation ................................................................................................................................. 3
Mounting.................................................................................................................................... 3
Leveling ..................................................................................................................................... 5
Fine Wire Thermocouple........................................................................................................... 5
5.
WIRING ......................................................................................................................................... 5
6.
CSAT3 OUTPUTS ..................................................................................................................... 6
6.1
6.2
6.3
SDM........................................................................................................................................... 6
RS-232 Output........................................................................................................................... 6
Analog Output............................................................................................................................ 6
7.
OPERATIONAL PRINCIPLES .............................................................................................. 7
8.
CSAT3 TRIGGER ...................................................................................................................... 7
8.1
9.
Sampling Modes........................................................................................................................ 8
DATA PIPELINE DELAY......................................................................................................... 9
10. DATALOGGER PROGRAMMING USING SDM............................................................ 10
10.1
10.2
10.3
10.4
SDM-CSAT3 (P107) ................................................................................................................ 10
Diagnostic Word ...................................................................................................................... 11
SDM-Group Trigger (P110) ..................................................................................................... 12
Example Datalogger Program ................................................................................................. 12
11. MAINTENANCE ....................................................................................................................... 13
12. CALIBRATION.......................................................................................................................... 14
I
TABLE OF CONTENTS
APPENDICES
A.
EXAMPLE FLUX PROGRAM .............................................................................................A-1
B.
SERIAL COMMUNICATIONS WITH THE CSAT3 .......................................................B-1
B.1
B.2
B.3
B.4
B.5
CSAT3 RS-232 Commands ...................................................................................................B-1
CSAT3 Binary Data Output Format ........................................................................................B-3
Words 0 Through 3.................................................................................................................B-3
Word 4 ....................................................................................................................................B-4
CSAT3 RS-232 Status Format ...............................................................................................B-5
C.
CSAT3 MEASUREMENT THEORY..................................................................................C-1
C.1
C.1.1
C.1.2
D.
D.1
D.2
Theory of Operation................................................................................................................C-1
Wind Speed .....................................................................................................................C-1
Temperature ....................................................................................................................C-1
SDM COMMUNICATIONS AND LONG SIGNAL CABLES ......................................D-1
Brief Description of SDM Clock Rates....................................................................................D-1
CR23X Example .....................................................................................................................D-1
FIGURES
4-1
4-2
8-1
9-1
B-1
B-2
CSAT3 Coordinate System and Mounting Hardware ................................................................ 4
CSAT3 Sonic Anemometer, KH20 Krypton Hygrometer
and FW05 Fine Wire Thermocouple................................................................................... 4
Typical Average CSAT3 Power Requirements at + 12 VDC ..................................................... 9
CSAT3 Pipeline Delay ............................................................................................................... 9
PC as the Trigger Source .......................................................................................................B-2
CSAT3 as the Trigger Source ................................................................................................B-3
TABLES
3-1
5-1
5-2
5-3
5-4
5-5
5-6
5-7
6-1
6-2
10-1
10-2
10-3
10-4
10-5
A-1
B-1
B-2
B-3
B-4
II
SDM Addressing Scheme ......................................................................................................... 3
CSAT3 Power............................................................................................................................ 5
CSAT3 SDM Output to a CR23X and CR10(X) Datalogger...................................................... 5
CSAT3 SDM Output to a 21X Datalogger ................................................................................. 5
CSAT3 SDM Output to a CR9000 Datalogger .......................................................................... 5
CSAT3 RS-232 Output Pin Out ................................................................................................. 5
CSAT3 Analog Output Wiring.................................................................................................... 6
FW05/FWTC-C-L35 Fine Wire Thermocouple ......................................................................... 6
CSAT3 Outputs ......................................................................................................................... 6
Calibration for Analog Outputs .................................................................................................. 7
SDM-CSAT3 (P107) Instruction Parameters........................................................................... 10
CR23X and 21X Execution Interval and CSAT3 Execution Parameter................................... 11
CR10(X) Execution Interval and CSAT3 Execution Parameter............................................... 11
Diagnostic Word ...................................................................................................................... 11
CSAT3 Diagnostic Flags ......................................................................................................... 12
CR23X Sensor Connections...................................................................................................A-2
RS-232 Command Codes ......................................................................................................B-1
RS-232 Output, Response to the U or W Command .............................................................B-3
Converting ux Wind from Word 0............................................................................................B-3
Converting uy Wind from Word 1............................................................................................B-3
TABLE OF CONTENTS
B-5
B-6
B-7
B-8
B-9
D-1
D-2
Converting uz Wind from Word 2............................................................................................B-4
Converting Speed of Sound from Word 3 ..............................................................................B-4
Decoding the Diagnostic Flags from Word 4..........................................................................B-4
Special Case - Not a Number................................................................................................. B-4
RS-232 Status, Response to the S or P Command ...............................................................B-5
Data from Example CR23X SDM Clock Rate Search Program .............................................D-1
SDM Clock Rate Report .........................................................................................................D-2
III
CSAT3 THREE DIMENSIONAL SONIC ANEMOMETER
1. GENERAL
The CSAT3 is a three dimensional sonic
anemometer. It measures wind speed and the
speed of sound on three nonorthogonal axes.
From these measurements, orthogonal wind
speed and sonic temperature is computed.
The CSAT3 can be used to measure average
horizontal wind speed and direction or the
turbulent fluctuations of horizontal and vertical
wind. From the turbulent wind fluctuations,
momentum flux is calculated. By finding the
covariance between the vertical wind speed
fluctuations, and temperature and humidity
fluctuations (measured by fast response
sensors) the sensible and latent heat flux can
also be measured.
The sonic transducers are sealed and will not
be damaged should they become wet. The
wind measurements, however, will not be valid
because the water droplets, on the face of the
transducer, will scatter the sonic signal. As
soon as all the transducer faces dry, the CSAT3
will lock on to the wind signal and begin making
measurements.
The CSAT3 can be measured using SDM
(Synchronous Device for Measurements)
communications and a CSI datalogger. The
CR23X and CR10X can be used to measure
the CSAT3 using SDM without any special
operating system. A 21X requires CSAT3
PROMs (P/N 10006). The CSAT PROMs
includes the SDM-CSAT3 (P107), SDM Group
Trigger (P110), and Set SDM Clock (P108)
instructions. Initiate Telecommunications (P97)
has been removed from the PROMs. The
CR10 requires library special PROMs with the
following instructions: SDM-CSAT3 (P107),
SDM Group Trigger (P110), Set SDM Clock
(P115), and Covariance/Correlation (P62).
The fine wire thermocouple used with the
CSAT3 is the FW05. It is a 0.0005” diameter
thermocouple mounted on a stainless steel
bayonet. A FWC-L35 is required with the
FW05. Four feet of the FWC-L35 is bundled up
inside the enclosure to minimize conduction of
heat into the terminal strips. The remaining 31
feet permits mounting the FW05 to the side of
the CSAT3 head. Finally, the thermocouple
cover (P/N 10080) is placed over the
connectors. This cover is used to mount the
connectors to the side of the CSAT3 head and
minimized temperature gradient across the
omega brand connectors.
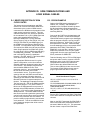
2. SPECIFICATIONS
MEASUREMENTS
The CSAT3 measures wind speed and the
speed of sound along the three nonorthogonal
sonic axes. The wind speeds are then
transformed into the orthogonal wind
components ux, uy, and uz and are referenced to
the anemometer head; the speed of sound, c,
or sonic virtual temperature, Ts, is the average
between the three nonorthogonal sonic axes.
The errors caused by wind blowing normal to
the sonic path is corrected on-line, before the
wind speed is transformed into orthogonal
coordinates. The CSAT3 can be configured to
make a single measurement per trigger or
multiple measurements that are centered
around the trigger (oversampled).
MEASUREMENT RATE: programmable from 1
to 60 Hz.
NOISE EQUIVALENT WIND: ux and uy is
-1
-1
-1
1 mm s ; uz is 0.5 mm s ; c is 1 mm s
(0.002°C). Values are the standard deviations
of instantaneous measurements made of a
constant signal. The noise is unaffected by the
sample rate.
WIND MEASUREMENT OFFSET: less than ±4
-1
cm s over -30° to 50°C operating range.
OUTPUT SIGNALS
The CSAT3 can output data to a data retrieval
system using any of the following
communications: SDM (Synchronous Device
for Measurement), RS-232, or analog output.
All the output signals have a two scan delay.
DIGITAL SDM: A CSI serial interface for
datalogger/sensor communication
Baud rate: 33.3 K (maximum)
Data type: 2-byte integer
1
CSAT3 THREE DIMENSIONAL SONIC ANEMOMETER
DIGITAL RS-232:
Baud rate: 9600
Data type: 2-byte integer
SDM AND RS-232 DIGITAL
RANGE AND RESOLUTION:
-1
Full scale wind: ±65.535 m s autoranging
between four ranges; least significant bit
-1
is 0.25 to 2 mm s .
-1
Speed of sound: 300 to 366 m s (-50° to
-1
+60°C); least significant bit is 1 mm s
(0.002°C).
ANALOG:
Number of outputs: 4
Voltage range: ±5 V
Resolution: 2.4 mV
ANALOG RANGE AND RESOLUTION:
Full scale wind: User selectable for ux and
-1
uy; ±32.768 m s (low range), least
-1
significant bit is 15 mm s or ±65.536 m
-1
s (high range), least significant bit is
-1
-1
30 mm s ; uz is ±8.192 m s , least
-1
significant bit is 4 mm s .
-1
Speed of sound: 300 to 366 m s (-50° to
-1
+60°C); least significant bit is 16 mm s
(0.026°C).
PHYSICAL DESCRIPTION
MEASUREMENT PATH LENGTH: 10.0 cm
vertical; 5.8 cm horizontal
TRANSDUCER PATH ANGLE FROM
HORIZONTAL: 60 degrees
TRANSDUCER: 0.64 cm (0.25 in) diameter
TRANSDUCER MOUNTING ARMS: 0.84 cm
(.33 in) diameter
WEIGHT:
Anemometer Head: 1.7 kg (3.7 lb)
Electronics Box: 2.8 kg (6.1 lb)
Shipping: 16.8 kg (37 lb)
OPERATING TEMPERATURE RANGE
-30° to +50°C
POWER REQUIREMENTS
VOLTAGE SUPPLY: 10 to 16 VDC
CURRENT:
200 mA @ 60 Hz measurement rate
100 mA @ 20 Hz measurement rate
3. INITIAL SETUP
3.1 FACTORY SETTINGS
•
•
•
•
•
Analog Outputs - Off
Execution Parameter - 10 Hz (see Section 8
and B.1)
Trigger Source - Internal Clock (see Section
8, 9, and B.1)
SDM Address - 3 (see Section 3.2, 6.1, and
10.1)
Unprompted Output - Off
The above settings can be changed with a PC,
running the Windows CSAT3 monitor software, and
the RS-232 cable.
3.2 SDM ADDRESS
Each CSAT3 on the SDM bus must have a
unique address. A hex thumb switch within the
electronics box is used to change the SDM
address. Remove the lid and orient the
electronics box with the connectors pointing
down. The hex thumb switch is now located in
the lower right hand side of the electronics box
(see Table 3-1 for SDM addresses).
SUPPORT ARMS: 1.59 cm (0.63 in) diameter
DIMENSIONS:
Anemometer Head:
47.3 cm (l) x 42.4 cm (h)
(18.6 in x 16.7 in)
Electronics Box: 26 cm x 16 cm x 9 cm
(10.2 in x 6.3 in x 3.5 in)
Carrying Case:
71.1 cm x 58.4 cm x 33 cm
(28 in x 23 in 13 in)
2
CAUTION: SDM address F (hex) is a
special address used during a Group
Trigger. Do not set the hex thumb switch to
SDM address F on the CSAT3’s CPU
board.
CSAT3 THREE DIMENSIONAL SONIC ANEMOMETER
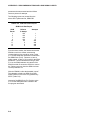
TABLE 3-1. SDM Addressing Scheme
Datalogger
Address
(base 4)
00
01
02
03
10
11
12
13
20
21
22
23
30
31
32
CSAT3 Thumb
Switch
(HEX)
0
1
2
3
4
5
6
7
8
9
A
B
C
D
E
Address
(base 10)
0
1
2
3
4
5
6
7
8
9
10
11
12
13
14
4. INSTALLATION
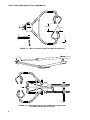
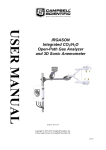
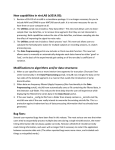
4.1 ORIENTATION
The three components of wind are defined by a
right handed orthogonal coordinate system.
The CSAT3 points into the negative x direction
(see Figure 4-1). If the anemometer is pointing
into the wind, it will report a positive ux.
In general, point the anemometer into the
prevailing wind to minimize the amount of data
that is contaminated by the anemometer’s arms
and other supporting structures.
4.2 MOUNTING
See Section 3 of the Tripod Weather Station
Installation manual for details and
recommendations on installing the tripod.
NOTE: Do not interchange electronics
boxes and transducer heads from different
CSAT3s. The electronics contain
calibration information that is specific to its
transducer head.
The sonic anemometer is mounted to the top of
the CM6/CM10 tripod (or any vertical 3/4”
diameter US bore pipe) with a 3/4” by 3/4” NuRail (P/N 1017), the Nu-Rail is included with the
CSAT3. The Nu-Rail will accommodate up to a
1” outside diameter pipe.
Attach the Nu-Rail to the vertical pipe and lightly
tighten the vertical set screws. Insert the
horizontal mounting arm into the Nu-Rail and
lightly tighten the horizontal set screws. Point
the horizontal arm into the prevailing wind.
Tighten all the Nu-Rail set screws. Mount the
anemometer head to the horizontal arm. Lightly
tighten the bolt underneath the anemometer
block (see Figure 4-1).
CAUTION: Do not carry the CSAT3 by the
arms or the strut between the arms. Always
hold the CSAT3 by the block, where the
upper and lower arms connect.
Attach the electronics box to the body of the
tripod. Use a 1/2” wrench to tighten the nuts.
Connect the cable from the anemometer head
to the connector on the electronics box labeled
Transducer Head.
CAUTION: Over-tightening bolts will
damage or deform the mounting hardware.
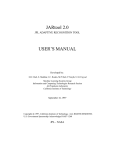
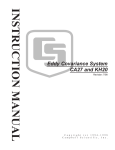
A krypton hygrometer can be mounted next to the
CSAT3 on the same vertical pipe (see Figure 4-2).
3
CSAT3 THREE DIMENSIONAL SONIC ANEMOMETER
Logan, Utah
CSAT3
3-D SONIC ANEMOMETER
10.00 cm
60
o
S/N: 102
MADE IN USA
Z
X
Y
FIGURE 4-1. CSAT3 Coordinate System and Mounting Hardware
10 to
m
15c
FIGURE 4-2. CSAT3 Sonic Anemometer, KH20 Krypton Hygrometer,
and FW05 Fine Wire Thermocouple.
4
CSAT3 THREE DIMENSIONAL SONIC ANEMOMETER
TABLE 5-1. CSAT3 Power
4.3 LEVELING
Over flat level terrain, adjust the anemometer
head so that the bubble within the level is in the
bullseye. Over sloping terrain, adjust the
anemometer head so that the horizontal surface
that the bubble level is mounted on, is parallel
to the terrain.
Firmly grasp the sonic anemometer block,
loosen the bolt underneath the block, and adjust
the head accordingly. Finally, tighten the bolt
with a 9/16” wrench.
4.4 FINE WIRE THERMOCOUPLE
A fine wire thermocouple (model FW05 and
FWC-L35) can be mounted to the side of the
anemometer block to measure the temperature
fluctuations. Attach the female connector from
the FWC-L35, with the short screw (#2-56
0.437”, P/N 3514) that was provided with the
thermocouple cover, to the side of the
anemometer. Insert the male connector of the
FW05 into the female connector of the FWCL35. Finally, attach the thermocouple cover to
the anemometer block, using the two larger
screws (#4-40 0.75”, P/N 61), so that both the
FW05 and FWC-L35 connectors are covered.
All three screws are UNC threads.
5. WIRING
There are four military style connectors on the
CSAT3 electronics box. They are labeled as
+12V SDM, RS-232, Transducer Head, and
Analog Output. Connect the cable from the
anemometer head to the electronics box
labeled Transducer Head. The anemometer
head cable is 2.13 m (7 ft) in length. Each of
the signal cables is 7.62 m (25 ft) in length.
Connect the appropriate signal cable to the
electronics box. See the Tables 5-1 through
5-7 for details on the wire color scheme.
NOTE: Before extending the SDM signal
cable, read Appendix D.
NOTE: Short haul modems may be used to
lengthen the RS-232 communications
cable. Short haul modems do not include
an RTS signal. The CSAT3's RS-232
drivers can be asserted by a software
setting in the CSAT3. This setting will
always power the RS-232 drivers,
independent of the RTS line. Spark gaps
(model 6536 and 6361) may be required to
protect against transients when using short
haul modems.
Battery
Terminal
Positive
Negative
Description
Color
12 VDC
Ground
Red
Black
TABLE 5-2. CSAT3 SDM Output to a
CR23X and CR10(X) Datalogger
Channel
C1
C2
C3
G
G
Description
SDM Data
SDM Clock
SDM Enable
Digital Gnd
shield
Color
Green
White
Brown
Black
Clear
TABLE 5-3. CSAT3 SDM Output to a
21X Datalogger
Channel
1H
C1
C2
C3
Description
Color
SDM Data
Green
10 K resistor to 1H
SDM Clock
White
SDM Enable
Brown
Digital Gnd
Black
shield
Clear
TABLE 5-4. CSAT3 SDM Output to a
CR9000 Datalogger
CR9000
9080 DB9
Pin
8
7
6
2
Datalogger
Description
Color
SDM Data
SDM Clock
SDM Enable
Digital Gnd
Green
White
Brown
Black/Clear
TABLE 5-5. CSAT3 RS-232 Output
Pin Out
CSAT3
DB9
Pin
2
3
5
7
8
→
←
←
→
PC
DB9
Pin
2
3
5
7
8
Description
Receive Data
Transmit Data
ground
Request to Send
Clear to Send
5
CSAT3 THREE DIMENSIONAL SONIC ANEMOMETER
TABLE 5-6. CSAT3 Analog Output Wiring
Description
ux sig high
ux sig low
uy sig high
uy sig low
uz sig high
uz sig low
c sig high
c sig low
shield
6.1.1 CR23X, 21X, CR10(X)
Color
Brown
Black
Red
Black
Green
Black
White
Black
Clear
TABLE 5-7. FW05/FWC-L35 Fine Wire
Thermocouple
Description
Signal High
Signal Low
6.1 SDM
SDM is a Campbell Scientific communication
protocol used between a Campbell Scientific
datalogger and a smart sensor. This protocol
uses control ports 1, 2, and 3 to communicate
with the CSAT3. With a 21X, single ended
analog input channel 1 (labeled 1H) and a 10 K
resistor is used in conjunction with control port
1. SDM protocol allows synchronized
measurement and rapid communication
between a datalogger and the CSAT3. The
datalogger instruction, SDM-CSAT3 (P107), is
used to communicate with the CSAT3 over the
SDM bus.
6.1.2 CR9000
Color
Purple
Red
SDM communications between the CR9000 and
CSAT3 is achieved via the 9 pin CSI serial I/O
port on the 9080 peripheral and memory card.
The CR9000 instruction CSAT3() is used to
communicate with the CR9000 over the SDM
bus.
6. CSAT3 OUTPUTS
The CSAT3 has three signal outputs: SDM,
RS-232, and analog. Campbell Scientific
recommends that the SDM output be used when
6.2 RS-232 OUTPUT
ever possible, followed by RS-232, and finally
The Windows CSAT3 monitor software can be
analog. Table 6-1 summarize the difference
used to graph the CSAT3 data in real time or
between the three output options. In general SDM
collect time series via the RS-232 serial port.
communications has the following advantages:
Appendix B contains detailed information on the
lowest CSAT3 current drain, best control and
CSAT3 RS-232 commands.
diagnostics, and highest data resolution.
TABLE 6-1. CSAT3 Outputs.
Typical
Current
Drain @ 10
Hz
External
Trigger
Source
Output
Dynamic
Range
Diagnostics
Available
6
SDM
RS-232
Analog
51
mA
89
mA
99
mA
yes
yes
no
19 bit
19 bit
12 bit
yes
yes
no
6.3 ANALOG OUTPUT
The anemometer can be programmed to output
four analog signals that correspond to ux, uy, uz,
and c. These signals range ±5000 mV. The
analog output is enabled using the Windows
CSAT3 monitor software using the PC’s and
CSAT3’s RS-232 serial port. The ux and uy
components of wind have two output ranges, low
-1
range (±32.768 m s ) and high range (±65.536
-1
m s ). These ranges are changed using the
Windows CSAT3 monitor software. Low range
is adequate to measure wind speeds ±32.768 m
-1
s . Table 6-2 gives the multipliers and offset for
-1
all the anemometer outputs in m s .
CSAT3 THREE DIMENSIONAL SONIC ANEMOMETER
TABLE 6-2. Calibration for Analog Outputs
ux
Slope
Low Range
-1 -1
(m s V )
6.5536
Slope
High Range
-1 -1
(m s V )
13.1072
Offset
-1
(m s )
0
uy
6.5536
13.1072
0
uz
1.6384
1.6384
0
c
6.5536
6.5536
340
When the analog outputs are used, the
anemometer uses its internal timer to trigger the
wind measurements. Thus, the wind
measurements can be skewed in time ±1/2 the
data acquisition system’s scan interval from
other analog measurements, e.g. temperature
or humidity. Recall that the CSAT3 analog
outputs also have a two measurement pipeline
delay.
7. OPERATIONAL PRINCIPLES
The CSAT3 measures wind speeds and the
speed of sound by determining the time of flight
of sound between pairs of transducers, as
described in Appendix C. However, unlike
many other commercial anemometers it does
not use simple threshold detection to determine
the ultrasonic times of flight. Instead, it uses
advanced, digital signal processing techniques
which, in comparison to other systems, results
in more accurate, lower noise measurements.
These techniques also allow the system to
quickly detect and indicate a degradation of
signal quality and system performance.
The CSAT3 signal processing techniques result
in slight differences in operation when
compared to simpler sonic anemometers.
These differences include a start-up delay
before the system is fully functional plus a
requirement for the correct triggering of the
sensor to ensure a constant flow of
synchronized data. The general principles of
operation are described in the following section.
After the CSAT3 transmits an ultrasonic signal
from one of its transducers, it then records the
received signal from the opposing transducer. To
optimize system performance, the CSAT3 only
looks for the received signal during a limited
window in time. The exact start and end time of
the window are determined not only by the spacing
between transducers but also by the current wind
speed and speed of sound conditions.
After power-up or loss of signal, the CSAT3
enters a mode where it tests the forward and
return paths for each of the pairs of ultrasonic
transducers. This is called the "acquire" mode
and takes about 10 seconds before normal
output is available from the anemometer. This
delay is caused in part because the
anemometer has no recent knowledge of the
responses of the transducer pairs, and in
particular no past history of the of wind speed
and speed of sound. During this acquire mode
it has to search across quite wide windows in
time to find the true arrival time of each
received signal.
Once it has acquired the signal it then uses an
tracking algorithm to adjust the start and end
times of its search window based both on the
Execution Parameter (see Section 8) and the
last measured ultrasonic time of flight. The
basis of this adjustment is that the dynamics of
air movement prevent the time of flight
changing by more than a certain amount in a
given time. The result of using this algorithm is
that the width of this window in time can be kept
to a minimum and measurements can be made
at a higher frequency for an overall lower
consumption of power when compared to using
wider fixed windows.
The main operational consequence of this
tracking algorithm is that the Execution
Parameter must be set to match the frequency
at which the anemometer is triggered, because
the Execution Parameter is used as an
important input to the tracking algorithm. The
setting of this parameter and matching it to the
trigger frequency are discussed in the following
section.
8. CSAT3 TRIGGER
The CSAT3 takes a measurement of wind
speed and the speed of sound when triggered
from one of three different sources. The trigger
sources are the internal CSAT3 timer, SDM
communications, or RS-232 communications.
In the case of the CSAT3 internal timer the
Execution Parameter exactly defines the trigger
rate. The Execution Parameter is set either via
an SDM or RS232 command, or using the
Windows based support software. Once set,
this value is stored in non-volatile memory and
is used thereafter. If the CSAT3 is set to use its
7
CSAT3 THREE DIMENSIONAL SONIC ANEMOMETER
internal trigger then it will take measurements at
this rate until it is changed.
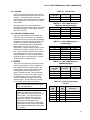
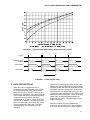
Note that the power consumption of the
anemometer is dependent on the Execution
Parameter and the trigger rate (see Figure 8-1).
Where an external trigger source is used it is
important to make sure the trigger rate is
greater than or equal to the Execution
Parameter. This is because, as discussed
above, the Execution Parameter is used to
define how much the wind speed could have
changed from the previous reading. If the
anemometer is triggered too slowly it is possible
that under gusty conditions the wind speed
could change to the extent that the CSAT3 sets
its search window to a point in time which
misses the ultrasonic pulse. This will cause it to
give erroneous readings.
Conversely if the trigger rate is much higher
than the Execution Parameter the CSAT3 will
consume more current than necessary and at
higher rates the CSAT3 will simply not be able
to take measurements at the speed required,
because it is analyzing wider time windows than
necessary and it will run out of time. The latter
will cause the CSAT3 to output 61503 as the
diagnostic word, indicating an overrun (see
Section 10.2 and B.4).
If the SDM or PC fails to provide a trigger to the
CSAT3, it will enter a lost trigger state after
three seconds. The data acquisition system will
then have to reissue the acquire signal
command (see Section 10.1 and B.1).
8.1 SAMPLING MODES
The CSAT3 can be configured to make
measurements in either a single-measurement
mode or a oversampled mode. In the singlemeasurement mode the CSAT3 makes one
measurement synchronously with the trigger
provided by the CSAT3 internal trigger, SDM
communications, or RS-232 communications.
In the oversampled mode, the CSAT3s internal
trigger, SDM communications, or RS-232
communication trigger several measurements.
The average of these measurements is output
at the trigger rate.
8
8.1.1 Single-Measurement Mode
In the single-measurement mode, the
anemometer makes one measurement per
trigger. With this approach, the anemometer’s
high frequency response is limited only by the
geometry of the anemometer head, thus
minimizing the possibility of under-estimating
high-frequency signal variations and
covariations. However, this approach also
aliases high-frequency information to lower
frequencies. This aliasing is apparent in spectra
from an upwards tail, when compared to the
-5/3 power relationship, at frequencies
approaching the Nyquist frequency (one-half the
sample rate). This aliasing does not
compromise the variances and covariances
(and therefore, fluxes) computed from aliased
data. The variance and covariance calculations
are not frequency dependent, they simply
measure a signal’s total variation and two
signal’s total covariation, respectively.
8.1.2 Oversample Mode
In the oversample mode, the CSAT3 makes
wind measurements at 60 Hz and then block
averages those measurements to 10 or 20 Hz
output. The output is synchronized to any one
of the three triggers. The oversampling modes
minimize aliasing by limiting the anemometer’s
high-frequency response. The 60 Hz data is
filtered with a sin x/x function.
The oversampled modes maintain
synchronization to the master trigger. In the sixtimes oversampled mode, the CSAT3
interpolates six minor triggers that are centered
on the 10 Hz master trigger. In the three-times
oversample mode, the CSAT3 interpolates
three minor triggers that are centered on the 20
Hz master trigger. For compatibility with the
existing single-sampled modes, the blockaveraged output data have a fixed delay of two
periods of the master trigger. However, as an
option for the oversampled modes,
experimenters can select block averaged output
data that have a fixed delay of a one master
trigger. Contact Campbell Scientific for details
on changing this parameter.
CSAT3 THREE DIMENSIONAL SONIC ANEMOMETER
FIGURE 8-1. Typical Average CSAT3 Power Requirements at +12 VDC
ti
t i+1
t i+2
t i+3
Trigger
Measure Times
Of Flight
Mi
Mi+1
M i+2
M i+3
Process Data
Pi - 1
Pi
Pi + 1
Pi + 2
Output Data
Si - 2
Si - 1
Si
Si + 1
Time
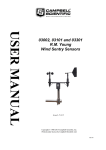
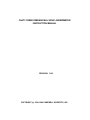
FIGURE 9-1. CSAT3 Pipeline Delay
9. DATA PIPELINE DELAY
When the CSAT3 is triggered to take a
measurement, it determines the times of flight
for all three transducer pairs. This process
takes between 12 to 18 mSec, depending on
the Execution Parameter. After determining the
times of flight, the CSAT3 corrects these times
of flight for transducer delays, and then
calculates the ux, uy, and uz components of the
wind speed. In addition, it corrects each of the
three sonic path speed of sound for the effects
of wind normal to the sonic path. The three
corrected speed of sound values are then
averaged.
All the CSAT3 output signals (SDM, RS-232, and
analog) have the two measurement pipeline delay.
The wind speeds and speed of sound that are sent
to the data acquisition system were measured by
the anemometer two triggers ago (see Figure 9-1).
To optimize system performance, the CSAT3 uses
parallel processing techniques. These techniques
cause a two measurement delay between the
trigger and data output. This delay applies at all
trigger frequencies.
When the covariance is found between the
turbulence data from the CSAT3 and temperature
from a fine wire thermocouple or a fast response
9
CSAT3 THREE DIMENSIONAL SONIC ANEMOMETER
hygrometer, the thermocouple and hygrometer
data must be shifted back in time two triggers.
This can be done on-line with a datalogger.
10. DATALOGGER PROGRAMMING
USING SDM
10.1 SDM-CSAT3 (P107) USED WITH CR23X,
21X, OR CR10(X)
SDM-CSAT3 (P107) is an Input/Output
instruction that controls and retrieves data from
the CSAT3 (see Table 10-1). This instruction is
available on the CR23X, 21X (with CSAT3
PROMs, P/N 10006), the CR10X, and the CR10
(with library special PROMs).
TABLE 10-1. SDM-CSAT3 (P107) Instruction
Parameters
PARAMETER
NUMBER
DATA
TYPE
DEFAULT
DESCRIPTION
01:
02:
03:
04:
2
2
2
4
Reps
SDM Address
Option
Ux Input Location
Reps: The number of CSAT3s on the SDM bus
that will be sequentially addressed with the
SDM-CSAT3 (P107) instruction.
SDM Address: The unique SDM Address of the
CSAT3 that the datalogger will communicate
with. The CSAT3 address is entered as a base
four number in parameter 2 (see Table 3-1).
The SDM Address is sequentially incremented if
the Reps option is greater than 1.
The wind data and the speed of sound (sonic
virtual temperature) is scaled by Instruction 107
-1
into m s or degrees Celsius.
CAUTION: SDM address 33 (base 4) is a
special address used during a Group
Trigger. Do not program the datalogger to
address SDM address 33.
Option 1, 2, 3, 5, 6, 10, 12, 15, 20, 30, and 60:
“Set Execution Parameter” tells the CSAT3
which measurement parameters to use and
what frequency to expect the measurement
trigger from the datalogger. The datalogger
Execution Interval and the appropriate CSAT3
Execution Parameter is summarized in Table
10-2 and 10-3.
10
Option 61 and 62: "Set Execution Parameter"
tells the CSAT3 to oversample (Section 8.1.2)
the wind measurements at a rate of 60 Hz and
expect a trigger at a rate of 10 Hz (option 61) or
20 Hz (option 62) from a CR23X or 21X
datalogger.
Option 51 and 52: "Set Execution Parameter"
tells the CSAT3 to oversample (Section 8.1.2)
the wind measurements at a rate of 48 Hz and
expect a trigger at a rate of 8 Hz (option 51) or
16 Hz (option 52) from a CR10(X) datalogger.
Option 0, 90: “Trigger and Get Wind & c Data”
sends a measurement trigger to the CSAT3
whose SDM address is specified in parameter 2.
The CSAT3 also sends data to the datalogger.
Option 91: “Trigger and Get Wind & Ts Data”
sends a measurement trigger to the CSAT3
whose SDM address is specified in parameter
2. The CSAT3 also sends wind speed and the
sonic virtual temperature (defined in Equation
(9) in Appendix C) via the SDM bus to the
datalogger.
Option 92: “Trigger and Get Wind & c-340
Data” sends a measurement trigger to the
CSAT3 whose SDM address is specified in
parameter 2. The CSAT3 also sends wind
-1
speed and the speed of sound minus 340 m s
via the SDM bus to the datalogger.
Option 97: “Get Wind and c-340 Data After a
Group Trigger”. The CSAT3, specified in
parameter 3, sends wind speed and the speed
-1
of sound minus 340 m s to the datalogger. A
new measurement is not triggered. The SDMCSAT3 (P107) Instruction must be preceded by
the Group Trigger (P110) Instruction to use this
option.
Option 98: “Get Wind and Ts Data After a
Group Trigger”. The CSAT3, specified in
parameter 3, sends the wind speed and sonic
virtual temperature (defined in Equation (9) in
Appendix C) to the datalogger. A new
measurement is not triggered. The SDMCSAT3 (P107) Instruction must be preceded by
the Group Trigger (P110) Instruction to use this
option.
Option 99: “Get Wind and c Data After a
Group Trigger”. The CSAT3, specified in
parameter 3, sends the wind speed and speed
of sound to the datalogger. A new
measurement is not triggered. The SDMCSAT3 (P107) Instruction must be preceded by
the Group Trigger (P110) Instruction.
CSAT3 THREE DIMENSIONAL SONIC ANEMOMETER
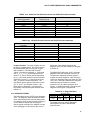
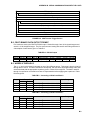
TABLE 10-2. CR23X and 21X Execution Interval and CSAT3 Execution Parameter
CR23X/21X Execution
Interval (seconds)
0.05
0.0625
0.075
0.0875 to 0.1
0.1125 to 0.1625
0.175 to 0.2
0.2125 to 0.325
0.3375 to 0.5
0.5125 to 1
CR23X/21X Execution
Frequency (Hz)
20
16
13.333
11.429 to 10
8.889 to 6.154
5.714 to 5
4.706 to 3.077
2.963 to 2
1.951 to 1
CSAT3 Execution Parameter
20
15
12
10
6
5
3
2
1
TABLE 10-3. CR10(X) Execution Interval and CSAT3 Execution Parameter
CR10(X) Execution Interval
(seconds)
0.0625
0.078125
0.09375
0.109375 to 0.15625
0.171875 to 0.1875
0.203125 to 0.328125
0.34375 to 0.5
0.515625 to 1
CR10(X) Execution Frequency (Hz)
CSAT3 Execution Parameter
16
12.8
10.667
9.143 to 6.4
5.818 to 5.333
4.923 to 3.047
2.909 to 2
1.939 to 1
15
12
10
6
5
3
2
1
Ux Input Location: The Input Location to store
the first of five data values. The CSAT3 returns
the following data after receiving the “Trigger
and Get Data” or “Get Data after a Group
Trigger” command in parameter 3. These data
are: ux, uy, uz, c or Ts, and a diagnostic word,
where ux, uy, and uz are the wind speeds along
the x, y, and z axes defined by the anemometer
head (see Figure 4-1), c is the speed of sound,
and Ts is the sonic virtual temperature. The
wind speed and the speed of sound are in units
-1
of m s , and Ts is in degrees Celsius. If the
Reps option in parameter 1 is greater than 1,
the number of sequential Input Locations used
is Reps ∗ 5.
filtered out of the statistics based on the
diagnostic word, see the example flux program
in Section A.
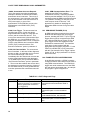
The SDM-CSAT3 instruction (P107), decodes
diagnostic word and represents it in base 10.
The bits in the diagnostic word are grouped
together into three categories. Bits 15 through
12 are four diagnostic flags (see Table 10-4 and
10-5), bits 11 through 6 represent the range the
measurements are reported in (used by
Instruction 107), and bits 5 through 0 are a
counter. A detailed description of decoding the
diagnostic word is given in Appendix B.
TABLE 10-4. Diagnostic Word
10.2 DIAGNOSTIC WORD
The fifth output from the CSAT3 is the diagnostic
word. The diagnostic word describes the status
of the anemometer and is useful in filtering data.
For example, when the anemometer is locking in
on the ultrasonic signals after receiving the
Acquire signals command, the -99999’s it sends
to the datalogger, for the science data, can be
b15 - b12
diagnostic
flags
Diagnostic Word
b11 b10 b09 b08 b07 b06
uy
uz
ux
range
range
range
b05 - b00
counter
The following are four specific Diagnostic
Words (Base 10) and the situation that
produces them.
11
CSAT3 THREE DIMENSIONAL SONIC ANEMOMETER
-99999, Anemometer does not Respond.
This is the special case when the datalogger
attempts to address an anemometer and the
anemometer does not answer. This occurs if
the anemometer is not connected to the SDM
bus, the anemometer is not connected to a 12
VDC power supply, or none of the
anemometers on the SDM bus are set to the
SDM address in the SDM-CSAT3 (P107)
instruction.
61440, Lost Trigger. The anemometer has
lost the trigger source, in this case all the
diagnostic bits are set high, the range bits are
set low, and the counter bits are low. This
occurs if the anemometer is disconnected from
the SDM bus; e.g. a loose SDM clock line. To
bring the anemometer back on-line, connect the
CSAT3 to the SDM bus and execute the SDMCSAT3 (P107) instruction with the “Set
Execution Parameter” option in parameter 3.
61503, No Data Available. The anemometer
has no new data. In this case all the diagnostic
bits are set high, the range bits are low, and all
the counter bits are high. This occurs
immediately after the anemometer receives the
acquire signal command from the datalogger,
i.e. an SDM-CSAT3 (P107) instruction with the
“Set Execution Parameter” option in parameter
3. The no new data condition also occurs when
the datalogger’s execution frequency (inverse of
the execution interval) is much greater than the
execution parameter the anemometer was told
to use.
61441, SDM Communications Error. The
datalogger and CSAT3 are unable to
communicate correctly. Extending the SDM
cable beyond the standard 7.62 m (25 ft.) and
not slowing down the SDM clock with Instruction
115 (CR23X or CR10(X)) or 108 (21X) is the
most common cause of this error. See
Appendix D for details on identifying the
appropriate SDM clock rate for a given cable
length.
10.3 SDM-GROUP TRIGGER (P110)
An SDM Input/Output Instruction that controls
SDM devices that support the group trigger
protocol, including the CSAT3. Up to 15 group
trigger devices can be connected to the SDM
bus. With the SDM Group Trigger (P110), all
group trigger devices are triggered to make
simultaneous measurements. The data from
each device is then retrieved with the
appropriate device specific instruction. For the
CSAT3, the SDM-CSAT3 (P107) Instruction
with the “Get data after Group Trigger” options
(Option 97, 98, or 99) in parameter 3 is used to
retrieve the data.
10.4 EXAMPLE DATALOGGER PROGRAM
In the following example, a CR23X is used to
configure and then collect data from the CSAT3
using SDM communications. The CR23X will
trigger each wind measurement over the SDM
bus and retrieve wind speed data. An example
flux program is given in Appendix A.
TABLE 10-5. CSAT3 Diagnostic Flags
Bit Set High
b15
12
b14
Description
Difference in the speed of sound
between the three non orthogonal
-1
axes is greater than 2.360 m s
(~ 4°C @ 25°C)
Poor signal lock
b13
Sonic signal amplitude too high
b12
Sonic signal amplitude too low
Comment
The anemometer path length may have
been altered or the anemometer head is
broken.
There may be an obstruction in the
anemometer path or on the transducer
face.
An obstruction, in the anemometer path or
on the transducer face, was removed.
There may be an obstruction in the
anemometer path or on the transducer
face.
CSAT3 THREE DIMENSIONAL SONIC ANEMOMETER
EXAMPLE 1. Measuring the CSAT3 Using
the SDM Output and a CR23X Datalogger
;{CR23X}
;
;Flag 1 - Set low to configure the CSAT3.
*Table 1 Program
01:
.1
Execution Interval (seconds)
;Get the data from the CSAT3.
;
01: SDM-CSAT3 (P107)
1:
1 Reps
2:
3 SDM Address
3:
91 Trigger and Get wind & Ts data
4:
1 Ux Input Location [ Ux_in ]
;Check the diagnostic word for lost trigger
;condition. Set Flag 1 low to reconfigure the
;CSAT3 if it is in a lost trigger state.
;
02: If (X<=>F) (P89)
1:
5 X Loc [ diag
]
2:
1 =
3: 61440 F
4:
21 Set Flag 1 Low
;Configure the CSAT3. This is done the first
;time through Table 1 or if the CSAT3 loses
;the trigger.
;
03: If Flag/Port (P91)
1:
21 Do if Flag 1 is Low
2:
30 Then Do
;Look for a diag that is not -99999,
;meaning that the CSAT3 is connected
;to the CR23X and the two devices are
;communicating correctly.
;
04: If (X<=>F) (P89)
1:
5 X Loc [ diag
]
2:
3 >=
3:
0 F
4:
30 Then Do
;Send the configuration command to the
;CSAT3 only if it is not acquiring the
;signal or making measurements, e.g.
;diag <> 61503.
;
05: If (X<=>F) (P89)
1:
5 X Loc [ diag
]
2:
2 <>
3: 61503 F
4:
30 Then Do
06: Do (P86)
1:
11
Set Flag 1 High
;Configure CSAT3 with 10 Hz parameters.
;
07: SDM-CSAT3 (P107)
1:
1 Reps
2:
3 SDM Address
3:
10 Set Execution Parameter
4:
1 Ux Input Location [ Ux_in
]
08: End (P95)
09: End (P95)
10: End (P95)
Input Locations
1 Ux_in
2 Uy_in
3 Uz_in
4 Ts_in
5 diag
11. MAINTENANCE
The CSAT3, like other ultrasonic anemometers,
is unable to measure wind when water droplets
are present on the face of the transducers. The
CSAT3 will be ready to measure wind as soon
as the water droplets evaporate or are removed
by the station operator. Remove the water
droplets by dabbing a cotton swab or tissue on
the face of the transducer. Execute the SDMCSAT3 instruction with the “Set Execution
Parameters” in option 3 to acquire the signal or
send the “An” command over the RS-232 link.
CAUTION: Lightly dab the face of the
transducers to remove water droplets.
Applying excessive force on the face of the
transducer may separate the matching layer
from the brass housing.
13
CSAT3 THREE DIMENSIONAL SONIC ANEMOMETER
There are no user serviceable components on
the CSAT3. The only time the electronics box
must be opened is to change the SDM address.
Should the CSAT3 need to be serviced, call
(435) 752-3268, to obtain an RMA number.
12. CALIBRATION
The CSAT3 is calibrated over the temperature
range of -30° to +50°C. The CSAT3 will not
operate outside that temperature range.
Contact Campbell Scientific if the CSAT3 will be
operated in an environment where temperature
is outside the range of -30° to +50°C. The wind
-1
offset over that temperature range is ±4 cm s .
The CSAT3 does not require any field
calibration.
14
APPENDIX A. EXAMPLE FLUX PROGRAM
A copy of the example CR23X program is available on the Campbell Scientific ftp site at
ftp://ftp.campbellsci.com/pub/outgoing/files/ec_csat3.exe. The file ec_csat3.exe is a self extracting DOS
file. At a DOS prompt type in ec_csat3.exe and press the <Enter> key.
The example flux program measures the CSAT3, a FW05 fine wire thermocouple, and a KH20 as well
as a net radiation soil heat flux and soil moisture. Connect the KH20 to differential channel 3 and the
FW05 to differential channel 4. The CR23X calculates the virtual sensible heat flux, sensible heat flux,
latent heat flux, the momentum flux, and friction velocity, all other cross products required to apply a post
processing coordinate rotation on the turbulent fluxes, and the average and variance of u x, uy, uz, Ts, FW,
and the average and standard deviation of Vh (krypton hygrometer). The fine wire thermocouple data
(FW) and the krypton hygrometer data are shifted to match the CSAT3 pipeline delay.
The CR23X will miss one sample every 30 minutes, because of the additional overhead of computing the
30 minute statistics and fluxes. Background meteorological measurements of temperature and humidity
are required to apply the oxygen correction to the latent heat flux measured by the KH20. The energy
balance measurements are made in Table 2 to examine energy balance closure.
Connect all the sensors to the CR23X and power to the CSAT3 and the KH20. Download the program to
the CR23X. Verify that all the sensors are reading correctly by checking the data in Input Locations 1
through 20. After the system is up and running, reenter the execution interval in Table 1 and compile the
program ( 0). This clears all the Intermediate and Input locations and starts the program from scratch.
A-1
APPENDIX A. EXAMPLE FLUX PROGRAM
TABLE A-1. CR23X Sensor Connections
Channel
1H
1L
Sensor
HMP45C (temperature)
HMP45C (temperature)
Color
Yellow
Purple
2H
2L
HMP45C (RH)
HMP45C (RH)
HMP45C
KH20
KH20
KH20
FW05
FW05
FW05
CS615
CS615
CS615
Q7.1
Q7.1
Q7.1
HFT3#1
HFT3#1
HFT3#1
HFT3#2
HFT3#2
HFT3#2
TCAV
TCAV
TCAV
CSAT3
CSAT3
CSAT3
HMP45C
CS615
CSAT3
CSAT3
HMP45C
CS615
HMP45C
Blue
Jumper to 1L
Clear
White
Black
Clear
Purple
Red
Clear
Green
Black
Clear
Red
Black
Clear
Black
White
Clear
Black
White
Clear
Purple
Red
Clear
Green
White
Brown
Orange
Orange
Red
Black/Clear
Red
Red
Black
3H
3L
4H
4L
6L
7H
7L
8H
8L
9H
9L
10H
10L
C1
C2
C3
C4
C5
+12 V
G
+12 V
+12 V
G
A-2
APPENDIX B. SERIAL COMMUNICATIONS WITH THE CSAT3
B.1 CSAT3 RS-232 COMMANDS
The CSAT3 powers up its RS-232 drivers when it detects that the RTS (request to send) line has been
asserted by the PC. All RS-232 communications begin with the PC asserting the RTS line. The CSAT3
responds by asserting the CTS (clear to send) line. The PC must keep the RTS line asserted as long as
it is communicating with the CSAT3.
RS-422 communications and short-haul modems do not include an RTS signal. The CSAT3s RS-232
drivers can be asserted by a software setting in the CSAT3. This setting will always power the RS-232
drivers, independent of the RTS line. Contact Campbell Scientific for details.
The unprompted output mode (Table B-1) complicates anemometer data processing software, because
the original output format contains no fixed pattern to delimit the CSAT3’s 10 byte output record. To
configure the CSAT3 to output 12-byte records, with the last two bytes being a fixed pattern of AA55 hex,
send an “rs n”, where n = 0 (default) means no synchronization code and n = 1 means send the
synchronization code, to the CSAT3. As is customary in the DOS environment, 55 hex is transmitted
first followed by AA hex. This configuration will be lost if the CSAT3 power is cycled. To save this
configuration into non-volatile memory contact Campbell Scientific.
The CSAT3 supports 9600 and 19200 baud RS-232 communications rate. The baud rate is changed by
sending a “br n”, where n = 0 (default) is 9600 baud and n = 1 is 19200 baud. This configuration will be
lost if the CSAT3 power is cycled. To save this configuration into nonvolatile memory contact Campbell
Scientific.
There are nine commands that may been sent to the CSAT3 over the RS-232 interface. These
commands are described below. Before continuing on, read the section that describes the CSAT3
Trigger (Section 8).
TABLE B-1. RS-232 Command Codes
Command
&
1
P
U
CSAT3 timer
or PC
CSAT3 timer
or PC
PC or
CSAT3 timer
1
S
W
1,3,4
A(1..e)
O
L
H
Trigger before
Command
PC or CSAT3
timer
PC or
CSAT3 timer
PC or
CSAT3 timer
SDM, PC, or
CSAT3 timer
SDM, PC, or
CSAT3 timer
SDM, PC, or
CSAT3 timer
Description
Unprompted data output mode. Send data and
make measurements at the rate specified by the
An command.
Send the RS-232 status (Table B-9) and trigger
the next measurement now.
Send the wind data and trigger the next
measurement now.
Send the RS-232 status (Table B-9). The next
measurement will be made in sync with the
CSAT3 timer.
Send the wind data. The next measurement will
be made in sync the CSAT3 timer.
Begin acquiring the signals in sync with this
command.
Turn the analog outputs off in sync with the next
trigger.
-1
Turn the analog outputs on with ±32 m s fullscale range in sync with the next trigger
-1
Turn the analog outputs on with ±64 m s fullscale range in sync with the next trigger
Trigger after
Command
CSAT3 timer
2
PC
2
PC
CSAT3 timer
CSAT3 timer
No change
No change
No change
No change
B-1
APPENDIX B. SERIAL COMMUNICATIONS WITH THE CSAT3
1 The CSAT3 will ignore this command if a datalogger (SDM) is triggering the anemometer.
2 After the PC takes over as the trigger source it must continue to trigger the CSAT3 at the rate
specified in the Execution Parameter (An). If the CSAT3 does not receive a trigger for three seconds
it will enter the Lost Trigger state. The acquire signal (An) command will have to be issued in order
for the anemometer to exit the Lost Trigger state.
3 Acquire signal commands.
An
A1
A2
A3
A4
A5
A6
A7
A8
Execution
Parameter
Not Used
1 Hz
Not Used
Not Used
2 Hz
3 Hz
5 Hz
6 Hz
An
A9
Aa
Ab
Ac
Ad
Ae
Ag
Ah
Execution
Parameter
10 Hz
12 Hz
15 Hz
20 Hz
30 Hz
60 Hz
60 Hz → 10 Hz
60 Hz → 20 Hz
4 The PC must send the second byte of this command (2..e) within two seconds of the first byte or the
anemometer will reset itself. It will then acquire the signal using the Execution Parameter in static
memory.
Generic flow charts are given in Figures B-1 and B-2 for collecting data using a PC and the RS-232 port.
In Figure B-1 the PC is the Trigger Source and the data acquisition system. In Figure B-2 the
anemometer is triggered by its internal timer and a PC is the data acquisition system. Use the logic in
Figure B-1 when the CSAT3 is measured along with other analog/digital signals.
set RTS line high
read CTS line
until CTS line is high
send the An command to acquire signals
set timer to zero
sent the U or P command
make other PC based analog/digital measurements
read wind data (U) or long status (P) from serial port
process data
wait until timer = 1/(Execution Parameter)
repeat until finished collecting data
set RTS line low
FIGURE B-1. PC as the Trigger Source.
B-2
APPENDIX B. SERIAL COMMUNICATIONS WITH THE CSAT3
set RTS line high
read CTS line
until CTS line is high
send the An command to acquire signals
send W or S command
check for data serial port
keep checking until there is data on the serial port
read wind data (W) or long status (S) from serial port
send W or S command
process data
repeat until finished collecting data
set RTS line low
FIGURE B-2. CSAT3 as the Trigger Source.
B.2 CSAT3 BINARY DATA OUTPUT FORMAT
Five words are sent by the CSAT3's RS232 output. Words 0 through 3 are 16 bit signed integers and
word 4 is 16 bit unsigned integer. The five words are sent starting with word 0 and ending with word 4.
A description of each word is given in Table B-2.
TABLE B-2. RS-232 Output
Word 0
b15 - b0
ux wind
Word 1
b15 - b0
uy wind
Word 2
b15 - b0
uz wind
Word 3
b15 - b0
c
b15 b14 b13 b12
diagnostic flags
b11 b10
ux range
Word 4
b09 b08
uy range
b07 b06
uz range
b05 - b00
counter
B.3 WORDS 0 THROUGH 3
The ux, uy, and uz wind speed is reported on one of four different ranges. This range is given by bits b11
through b06 in word 4. In order to decode the wind speed, first look at the wind speed range code, then
decode the data with the appropriate equations given in Tables B-3 through B-6. The data in words 0
through 3 must first be converted into a base 10 representation before applying the equations in Table
B-3 through B-6.
TABLE B-3. Converting ux Wind from Word 0
Range Word 4 Range Code
b11
b10
0
1
1
1
1
0
2
0
1
3
0
0
Conversion
ux wind (m s ) = word 0 ∗ 0.001 ∗ 0.25
-1
ux wind (m s ) = word 0 ∗ 0.001 ∗ 0.50
-1
ux wind (m s ) = word 0 ∗ 0.001 ∗ 1.00
-1
ux wind (m s ) = word 0 ∗ 0.001 ∗ 2.00
-1
Output Resolution
-1
(mm s )
0.25
0.50
1.00
2.00
TABLE B-4. Converting uy Wind from Word 1
Range Word 4 Range Code
b09
b08
0
1
1
1
1
0
2
0
1
3
0
0
Conversion
uy wind (m s ) = word 1 ∗ 0.001 ∗ 0.25
-1
uy wind (m s ) = word 1 ∗ 0.001 ∗ 0.50
-1
uy wind (m s ) = word 1 ∗ 0.001 ∗ 1.00
-1
uy wind (m s ) = word 1 ∗ 0.001 ∗ 2.00
-1
Output Resolution
-1
(mm s )
0.25
0.50
1.00
2.00
B-3
APPENDIX B. SERIAL COMMUNICATIONS WITH THE CSAT3
TABLE B-5. Converting uz Wind from Word 2
Range Word 4 Range Code
b07
b06
0
1
1
1
1
0
2
0
1
3
0
0
Conversion
uz wind (m s ) = word 2 ∗ 0.001 ∗ 0.25
-1
uz wind (m s ) = word 2 ∗ 0.001 ∗ 0.50
-1
uz wind (m s ) = word 2 ∗ 0.001 ∗ 1.00
-1
uz wind (m s ) = word 2 ∗ 0.001 ∗ 2.00
-1
Output Resolution
-1
(mm s )
0.25
0.50
1.00
2.00
The speed of sound reported by the CSAT3 is the average between the three sonic paths. The
relationship to find the speed of sound is given in Table B-6. Word 3 must be converted to a base 10
representation before applying the equation.
TABLE B-6. Converting Speed of Sound from Word 3
Conversion
speed of sound (m s ) = word 3 ∗ 0.001 + 340.0
-1
Output Resolution
-1
(mm s )
(°C @ 25°C)
1
0.0017
B.4 WORD 4
Word 4 contains diagnostic information and the reporting range of ux, uy, and uz wind speed. The
diagnostic flags, bits b15 through b12, describe the status of the anemometer. A flag is on if the bit is
set high. All the flags are on while the anemometer is acquiring signals or is in a lost trigger state.
TABLE B-7. Decoding the Diagnostic Flags from Word 4
Bit Set High
b15
b14
Description
Difference in the speed of sound
between the three non orthogonal
-1
axes is greater than 2.360 m s
(~ 4°C @ 25°C)
Poor signal lock
b13
Sonic signal amplitude too high
b12
Sonic signal amplitude too low
Comment
The anemometer path length may have
been altered or the anemometer head is
broken.
There may be an obstruction in the
anemometer path or on the transducer
face.
An obstruction, in the anemometer path or
on the transducer face, was removed.
There may be an obstruction in the
anemometer path or on the transducer
face.
Bits b11 through b06 are used in determining the range of the wind speed reported in words 0 through 2.
Bits b05 through b00 are a diagnostic counter. This counter increments once per measurement. The
minimum value is 0 and the maximum is 63. The counter wraps from 63 to 0 when the maximum value
is incremented by one.
TABLE B-8. Special Case – Not a Number
Not a Number
Conditions
Not Available
Lost Trigger
B-4
Word 0
hex
base 10
8000 -32768
8000 -32768
Word 1
hex
base 10
8000 -32768
8000 -32768
Word 2
hex
base 10
8000 -32768
8000 -32768
Word 3
hex
base 10
8000 -32768
8000 -32768
Word 4
hex
base 10
F03F
61503
F000
61440
APPENDIX B. SERIAL COMMUNICATIONS WITH THE CSAT3
B.5 CSAT3 RS-232 STATUS FORMAT
The CSAT3 returns a 10 ASCII byte status in response to an S or P command. This status provides
information on the CSAT3’s Trigger Source and the Execution Parameter. It also indicates if the analog
outputs are on/off, if the CSAT3 is reporting good data, and serial number of the CSAT3. This software
serial number matches those on the anemometer head and electronics box.
TABLE B-9. RS-232 Status, Response to the S or P command.
Byte
0
1
2
3
4
5-8
9
Description
Trigger Source
Execution Parameter
Analog Range
Data Status
Terminal Mode
CSAT3 Serial Number
P or U
0 = Off
0 = Good Data
D = Normal Mode
Value
1 = PC
see Table B-1
-1
1 = ±32 m s
1 = Acquiring Signals
T = CSI Mode
P = Prompted
U = Unprompted
0 = CSAT3 Timer
2 = SDM
2 = ±64 m s
2 = Lost Trigger
-1
B-5
APPENDIX C. CSAT3 MEASUREMENT THEORY
C.1.2 TEMPERATURE
C.1 THEORY OF OPERATION
C.1.1 WIND SPEED
Each axis of the CSAT3 pulses two ultrasonic
signals in opposite directions. The time of flight
of the first signal (out) is given by:
to =
d
c + ua
c=
(1)
and the time of flight of the second signal (back)
is given by:
tb =
d
The sonically determined speed of sound can
be found from the sum of the inverses of Eq. (1)
and (2).
(2)
1
d 1
+
2 t o t b
(5)
The speed of sound in moist air is a function of
temperature and humidity and is given by:
c = γP ρ = γRd Tv = γRd T(1 + 0.61q)
2
(6)
where to is the time of flight out along the
transducer axis, tb is the time of flight back, in
the opposite direction, ua is the windspeed
along the transducer axis, d is the distance
between the transducers, and c is the speed of
sound.
where γ is the ratio of specific heat of moist air
at constant pressure to that at constant volume,
P is pressure, ρ is air density, Rd is the gas
constant for dry air, Tv is virtual temperature, T
is the air temperature, and q is the specific
humidity defined as the ratio of the mass of
water vapor to the total mass of air (Kaimal and
Gaynor, 1991; Wallace and Hobbs, 1977).
The windspeed, ua, along any axis can be found
by inverting the above relationships, then
subtracting Eq. (2) from (1) and solving for ua.
Note that γ is a function of specific humidity. It
would be convenient if the effects of humidity
could be consolidated into one term.
ua =
c - ua
1
d 1
−
2 t o t b
(3)
Cp = qC pw + (1 − q)C pd
The windspeed is measured on all three nonorthogonal axis to give ua, ub, and uc, where the
subscripts a, b, and c refer to the nonorthogonal sonic axis.
The non-orthogonal windspeed components are
then transformed into orthogonal windspeed
components, ux, uy, and uz, with the following:
u
u
x
a
u y = A ub
uc
u z
The specific heats for moist air at constant
pressure and volume are given by:
(4)
where A is a 3 x 3 coordinate transformation
matrix, that is unique for each CSAT3 and is
stored in ROM memory.
= C pd (1 + 0.84 q)
(7a)
C v = qC vw + (1 − q)C vd
= C vd (1 + 0.93 q)
(7b)
where Cp and Cv are the specific heats of moist
air at constant volume and pressure, Cpw and
Cvw is the specific heat of water vapor, and Cpd
and Cvd is the specific heat of dry air,
respectively (Fleagle and Businger, 1980).
Substitute Eq. (7a) and (7b) into (6) and ignore
the higher order terms. This yields
2
c = γ dRdTs = γ dRd T(1+ 0.51q)
(8)
C-1
APPENDIX C. CSAT3 MEASUREMENT THEORY
where Ts is sonic virtual temperature and γd is
the ratio of specific heat of dry air at constant
pressure to that at constant volume (Fleagle
and Businger, 1980; Kaimal and Gaynor, 1991;
Kaimal and Businger, 1963; Schotanus et al.,
1983). With Eq. (8), the effect of humidity, on
the speed of sound, is included in the sonic
virtual temperature.
The sonic virtual temperature, in degrees
Celsius, is given by Eq. (9), where γd = 1.4 and
-1
-1
Rd = 287.04 JK kg .
Ts =
c
2
γ dRd
− 273.15
REFERENCES
Kaimal, J. C. and Businger, J. A.: 1963, “A
Continuous Wave Sonic AnemometerThermometer”, J. Applied Meteorol., 2, 156164.
Kaimal, J. C. and Gaynor, J. E.: 1991, “Another
Look at Sonic Thermometry”, BoundaryLayer Meteorol., 56, 401-410.
Fleagle, R. G. and Businger, J. A.: 1980, An
Introduction to Atmospheric Physics,
Academic Press, Inc., New York.
(9)
Schotanus, P., Nieuwstadt, F. T. M., and de
Bruin, H. A. R.: 1983, “Temperature
Measurement with a Sonic Anemometer
and its Application to Heat and Moisture
Fluxes”, Boundary-Layer Meteorol., 26, 8193.
Wallace, J. M. and Hobbs, P. V.: 1977,
Atmospheric Science an Introductory
Survey, Academic Press, Inc., New York.
C-2
APPENDIX D. SDM COMMUNICATIONS AND
LONG SIGNAL CABLES
D.1 BRIEF DESCRIPTION OF SDM
CLOCK RATES
The fastest rate that a datalogger and SDM
sensors can communicate via the SDM bus is
determined by the number of SDM sensors
connected to the SDM bus and properties of the
cable used to connect the sensors. This rate,
called the SDM clock rate, has been optimized
for the standard 7.62 m (25 ft.) SDM signal and
power cable supplied with the CSAT3.
Instruction SDM-CSAT3 (P107) and SDM
Group Trigger (P110) on the CR23X, 21X, and
CR10(X), and CSAT3() and SDMTrigger() on
the CR9000 use this optimum SDM clock rate
by default. For cases when longer lead lengths
are required, the SDM clock rate may be slowed
down using Instruction Set SDM Clock (P108
for a 21X and P115 for a CR23X and CR10(X))
or SDMSpeed() (CR9000). The SDM Clock
rate is changed by entering a parameter
between 1 and 255, where 1 is the fastest SDM
clock rate and 255 is the slowest.
The appropriate SDM clock rate for a given
system configuration, can be found with the
example datalogger programs listed at the end
of this section. The example programs start
with the default SDM clock rate, clock
parameter equal to 1, and systematically slow
the rate down until there are no SDM
communication errors. They then begin to
speed up the rate until SDM communications
fails. The processes of slowing down and
speeding up the SDM clock rate around the fail
threshold continues for approximately three
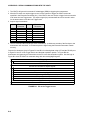
minutes. The datalogger outputs three arrays.
The first (array ID = 150) is the SDM parameter,
the second (array ID = 151) is the number of
failures at an SDM parameter as a percent of
attempts at that SDM parameter, and the third
(array ID = 152) is the number of attempts at an
SDM parameter. The fastest SDM clock rate,
that can be used with a particular system setup,
can be found from the failure array by selecting
the first clock parameter with zero failures. To
provide a safety margin select the next slowest
clock parameter. Test the new SDM clock rate
in the datalogger program that will be used in
the experiment.
D.2 CR23X EXAMPLE
Copies of the SDM search programs for the
CR23X, 21X, CR10(X), and CR9000 are
available on the Campbell Scientific ftp site at
ftp://ftp/campbellsci.com/pub/outgoig/files/
sdm_srch.exe. The file sdm_srch.exe is a self
extracting DOS file.
Connect all the CSAT3s to the datalogger with
the cable in question. Download the example
CR23X SDM search program to the datalogger,
after the program compiles, set Flag 3 high to
begin the experiment. When Flag 2 is set low
the experiment is complete. Collect the data
from the datalogger and run the example SPLIT
parameters files, SDM_TRAN.PAR and
SDM.PAR, to sort the data. Identify the correct
SDM clock parameter to use for your system
configuration from the report generated by the
SPLIT parameter file SDM.PAR.
Take the following case, a 575 foot SDM signal
and power cable is used to connect a CR23X
datalogger and a single CSAT3 anemometer.
Communication between the CR23X and
CSAT3 fails at the default SDM clock rate.
Thus, a slower SDM clock rate must be used.
The example CR3X SDM clock rate search
program generated the data in Table D1.
TABLE D-1. Data from Example CR23X SDM
Clock Rate Search Program
150,1,2,3,4,5,6,7,8,9,10,11,12,13,14,15,16, ...
,253,254,255
151,100,99999,99999,100,99999,99999,100,99
999,100,96,0,0,0,99999,99999,99999, ...
,99999,99999,99999
152,1,0,0,1,0,0,1,0,17,450,449,449,432,0,0,0,
... ,0,0,0
Run the SPLIT parameter file SDM_TRAN.PAR
on the above data set to transpose the data into
columns.
Now run the SPLIT parameter file SDM.PAR, to
filter out the SDM clock parameters that were
not tested, 99999 in array 151. This parameter
file also creates a report of the SDM clock
D-1
APPENDIX D. SDM COMMUNICATIONS AND LONG SIGNAL CABLES
parameters that were tested and their failure
rate as a percent of attempts.
The following report was created from the
above SPLIT parameter file, SDM.PAR.
TABLE D-2. SDM Clock Rate Report
SDM Clock Rate Report
SDM
Param
Failures
% Attmpt
Attempts
1
4
7
9
10
11
12
13
100
100
100
100
96
0
0
0
1
1
1
17
450
449
449
432
From the above results, the fastest rate that the
SDM bus could run, without encountering
communication errors, would be using a value
of 11 for the SDM clock parameter in Instruction
Set SDM Clock (P115). However, to have a
safety margin, a value of 12 is used for the SDM
parameter. The test showed that using a value
of 12 or the SDM parameter in Instruction Set
SDM Clock did not cause the CR23X to overrun
the Tables each scan, thus the SDM clock rate
is left at parameter 12.
With the CR9000, collect the datatable “report”.
This datatable contains an SDM Clock Rate
Report similar in form to the one generated by
SPLIT (Table D-2).
Instruction Set SDM Clock (P115) with a value
of 12 for the SDM parameter is added to the
flux program and tested.
D-2