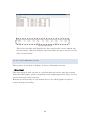
1
Sports Driving Analysis Tool
DigSpice Instruction Manual
Ver. 1.1.1
March 2011
Dig Spice Co., Ltd.
Table of Contents
1. Introduction ..................................................................................... 5
1.1 Exterior Parts ............................................................................. 6
1.2 Power ON/OFF and Modes ........................................................... 6
1.3 Navi Mode and Log Mode ............................................................ 6
1.4 LED Display ............................................................................... 7
2. What to Check Before Use ................................................................ 7
2.1 Check product contents ............................................................... 7
2.2 Preparations before use ............................................................... 8
2.3 Other .......................................................................................... 9
3. Driving Analysis Software Installation ............................................ 10
3.1 USB driver installation .............................................................. 10
3.2 Driving analysis software installation ........................................ 10
3.3 Folder structure after installation .............................................. 10
4. GPS logger mounting instructions (Important!) ............................... 10
5. Data Log ......................................................................................... 13
5.1 Important points before measuring(Hints on collecting accurate
data) ............................................................................................... 13
5.2 Begin data logging ..................................................................... 13
6. Driving Analysis Software ............................................................... 14
6.1 Screen display explanation ......................................................... 14
6.2 Default setting ........................................................................... 14
1
6.2.1 Log time setting ...................................................................... 15
6.2.2 Confirm setup details, available log memory space ................... 16
6.2.3 Erase the saved log ................................................................. 16
6.3 Read driving data from the GPS logger ....................................... 18
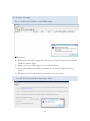
6.3.1 Launch the driving analysis s oftware from the desktop ............ 18
6.3.2 Connect GPS logger and PC ..................................................... 18
6.3.3
After connection is complete, with the cable connected, pl ease
change to Navi Mode. (Refer to section 1.2) ...................................... 19
6.3.4 Error message ......................................................................... 23
6.3.4.1 Connection failure with GPS logger ...................................... 23
6.3.4.2 Not recognized as Dig Spice GPS .......................................... 23
6.4 log data shift. ............................................................................ 24
6.4.1 LOG data shift ........................................................................ 24
6.4.2Setting the Control Line ........................................................... 25
6.5 Load Log Data ........................................................................... 28
6.6 Load Lap Data ........................................................................... 28
6.7 Reopen Log Data ........................................................................ 28
6.8Choose to show graph/Cancel 【 Graph】 ..................................... 29
6.9 Save lap data ............................................................................. 29
6.10 Save the lap data list as CSV file ............................................. 29
6.11 Save split data ......................................................................... 30
6.12Save Lap Data as CSV ............................................................... 30
2
7. Detailed Analysis 【 Graph】 .......................................................... 31
7.1 Description of displays (Switch) ................................................. 32
7.1.1 Tabs ........................................................................................ 32
7.2 Sector setting when passing the same po int more than once ........ 34
7.3 Adjustment function of set sectors .............................................. 35
7.4 Display/hide course layout tool on animation window ................. 36
7.4.1 Adjust course layout ................................................................ 36
7.4.2 Load course layout file ............................................................ 36
7.4.3 Load/Save course layout file .................................................... 36
7.4.4 Create course layout ................................................................ 37
7.5 Window ...................................................................................... 39
7.5.1 Speed window ......................................................................... 40
7.5.2 Full course window.................................................................. 41
7.5.2.1 G force/Radius of turn .......................................................... 42
7.5.2.2 How to read the graph .......................................................... 47
7.5.3 Save a specified sector out of the displayed driving data .......... 50
7.5.4 Animation window ................................................................... 51
7.5.4.1 Animation ............................................................................ 51
7.6 Function to save graph, driving trajectory as an image. .............. 52
8.SETUP ............................................................................................. 53
8.1 Setting Sector Gate Length ........................................................ 53
3
8.2 Setting minimum lap distance/ minimum lap time ....................... 54
8.3Setting Speed/Distance indication ............................................... 54
9. Reset GPS module ........................................................................... 55
10. FAQ .............................................................................................. 56
11. Hardware Specifications ................................................................ 58
4
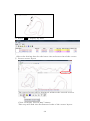
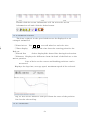
1. Introduction
Thank you very much for purchasing a DigSpice product.
We are certain that this Dig Spice product will be a useful tool in your
motorsports life. Please be sure to read this instruction manual carefully
to ensure proper use of the product.
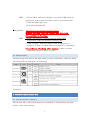
Note and Warning
① The GPS logger has to be used between –10℃ to 60℃ , otherwise the battery
charging capability will be decrease.
②
Please leave the GPS logger away from heat and NEVER leave the GPS
Logger in the car or place wherever possibly temperature goes up higher than
/60℃ High temperature causes overheat of the battery inside of GPS Logger,
and this overheats may leads explode or catching the fire on the Logger.
It is
possible to make big damage on the car or may cause the serious injury on you.
③ Please recycle the +Lithium-Ion battery when its lifetime is finished.
Battery
is mounted inside of the GPS Logger.
④
Please keep GPS Logger in Dry/Cool places when you are not in use.
⑤
For the safety, keep the GPS logger and all accessories away from children.
⑥
The manufacturer assumes no responsibility for DigSpice and Retail Seller
have no responsibility for any trouble or damage due to battery shortage,
modification, or any other irregular uses.
⑦ Use only the supplied and approved accessories. Unauthorized
accessories, modifications or attachments could damage the GPS logger, and
may violate the law of governing radio devices.
⑧ Use a dry, clean soft cloth to clean the unit. Do not use harsh cleaning
solvents, chemicals, or strong detergents.
⑨ Do not attempt to open the GPS logger yourself. We will not warrant if it is
opened for any reasons.
⑩ In order to work the devise properly, we recommend to use the
computer with higher specifications than below.
・ OS
Windows
・ Hardware
XP, VISTA, 7
CPU
Celeron®
・ Memory 2 GB
5
2 GHz
Analysis may be done with lower than above specification, but Driving
Animation may not function smoothly. If the animation does not
function smoothly, please try with less number of the c ars.
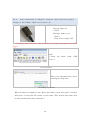
1.1 Exterior Parts
1. DC jack (mini USB type)
2. Button (Power On/ Power Off)
3. Battery status LED (Red / Green)
4. GPS status LED (Orange)
5. Log status LED / POI LED (Green)
1.2 Power ON/OFF and Modes
Operation Mode
Press for 3 sec
Press for 1 sec
Press for 3 sec
Press for 1 sec
Power OFF
Navi Mode
Log Mode
1.3 Navi Mode and Log Mode
■ Navi Mode This mode is not for logging driving data.
It is used for reading the logged driving data and for
default setting, and to receive correction information 30
minutes prior to measurement.
6
LED
□ Power (Red and green Light is on while USB cable is
connected, and tuned off if the cable is not connected).
□ GPS (Orange light on)
□ Log (Green light off)
■ Log Mode
This mode is for logging driving data.
※ Make sure the Log LED (Green) and GPS LED
(Orange)light is flashing.
LED
□ Power (Red/Green, Green light on with USB
connection, light off without connection)
□ GPS (Orange, Flashing when GPS recognition is
complete, Light on when GPS recognition is underway)
□ Log (Green, Flashing while logging, Light on when
remaining memory space is zero)
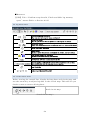
1.4 LED Display
The GPS Logger has three LED light: Battery Status, GPS Status, and LOG Status.
The status table of LED shows as following:
(Caution)
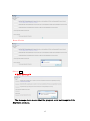
2. What to Check Before Use
2.1 Check product contents
Check that all of the below items are included in the product package
before using this system.
7
If the product is damaged or accessory is missing when you open the
package please contact the store where you purchased the product.
① GPS logger
② Mini USB/USB cable
③ Car charger (Adapter for vehicle)
④ Strap
⑤ Mounting stay,BOX
⑥ Dig Spice CD-ROM (Instruction manual, software, driver)
⑦ Driver & Utility CD-ROM (Not normally used)
⑧ Simplified Installation Manual
※ Product contents may change without prior notice.
※ Do not use the car charger (Adapter for vehicle 12-24V) for any
device other than Dig Spice.
2.2 Preparations before use
Battery charge
Please use USB cable to charge the battery before you use.
may be uncharged or very low voltage.
The battery
It may be done from either
personal computers or cigar lighter connecter on the car.
Charge will take approximately 90 minutes.
When using the product for the first time, be sure to fully charge the
battery.
You will be able to use approximately 10 hour s with full charge.
LED status
charging
Green LED ON
charge is complete
Green LED Blinking
(Caution)
① Use the accessory cable to charge directly from a USB connector, and
do not use a USB hub without a power supply.
8
This icon indicates battery status.
■
LED (Red) flash
Indicates that remaining
・・・・
battery is very low.
Battery needs to be charged.
■
LED (Green) light on・ ・ ・ ・
Indicates that battery is
being charged.
■
LED (Green) flash・・・・・
Indicates that battery charge is complete.
2.3 Other
① The GPS logger may not be able to receive GPS signals when used
inside of house.
② When the GPS logger is not in use, make sure to turn the power OFF to
ensure the life of LED and other components.
③ Some vehicles have special coating on the windows, which may affect
GPS reception.
④ Driving in an area with high risers may affect on GPS reception.
⑤ Using the system with poor signal condition, such as inside tunnels,
may affect on GPS reception.
⑥ some courses in mountain areas have poor satellite reception due to
trees and other objects.
⑦ The GPS generally shows maximum performance when used in open
sky areas.
⑧ Weather conditions affect on GPS reception. The signal is poor when it
is raining or snowing.
⑨ If the battery level of the GPS logger becomes very low, it may affect
on GPS reception.
⑩ When starting up the GPS logger for the first time, it will take one to
three minutes to receive signals to display the location. This is called
cold start. If the GPS logger does not receive signals and display
location after 20 minutes, We recommend trying again at open-air
area.
⑪ Please confirm the setup contents before use.
9
⑫ If a communication error or time out occurs or if the USB cable is
pulled out when the GPS Logger is reading the log, make sure the go
through the setup again.
⑬ When the memory is full, you cannot setup properly.
( “Fine Mode,” “Standard Mode” and “Long Time” may not Switch)
Erase the log data and try the setup again.
3. Driving Analysis Software Installation
3.1 USB driver installation
Please refer to the enclosed Installation Manual.
3.2 Driving analysis software installation
Please refer to the enclosed Installation Manual.
3.3 Folder structure after installation
C:\User\Document\DigSpice\DigSpice.exe
Driving analysis
program
C:\ User\Document\DigSpice\Circuit
Circuit display data
C:\ User\Document\DigSpice\ControlLine
Control line data
C:\ User\Document\DigSpice\Data
Driving analysis
completed data
C:\ User\Document\DigSpice\Help
Help data
C:\ User\Document\DigSpice\Raw
Log data
C:\ User\Document\DigSpice\Sector
Sector data
Downloads from the website can be conveniently stored in relative
folders.
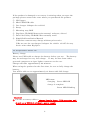
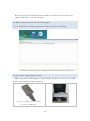
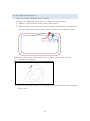
4. GPS LOGGER MOUNTING INSTRUCTIONS (IMPORTANT!)
Mounting stay and black plastic case are included with the product for
mounting the device on the car.
※ When mounting the device, make sure the DigSpice logo on the
logger is facing the satellite.
10
※ GPS signals can attenuate significantly due to metals, human body,
and water.
Be sure to mount it where the satellite is always visible.
■ Black Plastic Case
Use the case for mounting on car exteriors, motorcycles and karts.
Reinforce it with adhesive tape if there’s risk of it flying off.
※ GPS signals barely attenuate with adhesive tape.
The case is not waterproof. Please take measures such as covering
the joint sections with vinyl tape for use in rainy conditions.
※ Car: Signal reception inside the car may worsen due to metals
such as the roof or pillar, and glass coating.
Receiving sensitivity is better when the device is mounted on the
exterior compared to the interior. Mounting it on the middle of
the roof or trunk is recommended.
※ Bike: Mounting on the rear cowl, etc. is recommended. If
mounted on top of the tank, signal reception may worsen if the
rider covers the device with the bo dy.
※ Kart: Mounting on the front cowl, etc. is recommended.
【 Motorcycle, Racing car, etc.】
Mount the device where there is no obstacle in the skyward direction
and GPS signals can be directly received, using the mounting stay so
11
that it does not fall off due to vibration. Mount the device using
strong double-sided adhesive tape on the case bottom.
■ Mounting stay
If the device cannot be mounted on the car exterior, mounting it on the
middle of the dashboard, etc. is recommended.
When mounting the device inside the car, place it where the sky is
visible and GPS signals can be directly received. Use the mounting stay
to anchor the device not falling off due to vibration.
(Caution)
① Strong vibrations on vehicles such as motorcycles, form ula cars, or
racing cars that affect the GPS logger may cause a malfunction. Be
sure to take vibration isolation measures using items such as rubber.
②
The GPS logger is not made waterproof. Be sure to take waterproof
measures if there is the possibility of the device getting wet.
12
5. Data Log
5.1 Important points before measuring( Hints on collecting accurate data)
Dig Spice uses the GPS to locate your car’s position, and it needs to
receive correct signal from the satellite to accurately measure its
position. It may take about 30 minutes to receive all of the correct data.
Therefore, you must need to turn on the GPS Logger and wait about 30
minutes before start driving in order to be ready the unit.
Beginning the drive immediately after starting to receive data may
result in errors in position information. If you start driving right after
start receiving the data, the device does not work properly due to the
positioning error.
In addition, please note that turning the power on inside a roofed area
and starting the drive before capturing satellite signals, or starting the
log without having captured satellite signals may cause an error as
well.
You do not need to wait 30 minutes if you take the data 2 n d or more
times at the SAME course, but you need to wait at least 5 minutes to
capture the satellite signal.
5.2 Begin data logging
The GPS logger should be in Log Mode for the sports drive.
(Caution)
Turn the power OFF after the drive.
If you do not turn off the power right after the sports driving, GPS
Logger will keep logging the data, so the unit will miss -read the signal
and will not identify the actual sports driving. (Refer to Section 6.3.3)
13
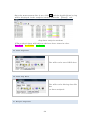
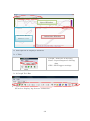
6. DRIVING ANALYSIS SOFTWARE
■ Tab selection
■ Tool bar
■ツールバー
Analysis window
6.1 Screen display explanation
□ Tab
□ Tool bar
Graph Analysis of Log data
Data
Save/Load of Log data
GPS
GPS logger settings
For conducting various analyses
□ Analysis window For displaying data analysis results, animation,
etc.
6.2 Default setting
Default setting of the GPS logger is done with【 GPS】 .
14
The setting should be done in Navi Mode by connecting the GPS logger
with the PC using the USB cable in the package.
6.2.1 Log time setting
■ Setup
Fine Mode
The log updating cycle is every 0.1 seconds. Log for
approximately two hours can be stored.
Drives GPS logger is pre-set to be able to use up to 2
hours continuously.
Please use the races that finish
less than 2 hours.
When you use with Detailed Mode, the data will be
large.
In order to display animation, the high spec
PC is required.
Standard Mode The log is updating every 0.2 seconds. Log for
approximately four hours can be stored.
Use this mode for circuit drives, trial competitions
or hill climbs that finish within four hours o f
continuous log time. (Dig Spice recommended mode)
Long-time Mode The log updating cycle is every 0.5 seconds. Data can be
stored approximately 10 hours.
You are able to log the data more than 4 hours
continuously, so you are able to use at the race suc h as
Endurance race with this mode.
15
Once the mode setting is completed, the GPS logger setting status will
appear on the “Confirm setup details, Check available log memory
space” section.
When the log data memory is full, the log will stop and data cannot be
obtained. In order to continue the log, delete the saved log as per
Section 6.2.3.
6.2.2 Confirm setup details, available log memory space
This confirms the GPS Set Up Mode and the availability of memory
status.
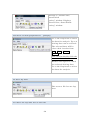
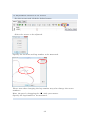
6.2.3 Erase the saved log
The following shows how to erase the saved log data in the GPS Logger.
(Caution) Data cannot be recovered once it is erased. Be sure to save the
data in the PC before erase.
Click Yes to begin erasing log data. The mouse will change to ○ and
take about 30 seconds to erase data.
16
Erase Finish
Select OK
≪ Error Message≫
The message above means that the program could not recognize it is
Dig Spice products.
17
Please specify the identification number on the error message and
contact Dig Spice via the website.
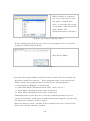
6.3 Read driving data from the GPS logger
6.3.1 Launch the driving analysis software from the desktop
<Initial screen after launching the driving analysis software>
6.3.2 Connect GPS logger and PC
Make sure that GPS Logger contains Driving Data and Power is OFF
before connecting to the computer.
Connect to USB port on PC using
Accessory USB cable
18
6.3.3
After connection is complete, with the cable connected, please
change to Navi Mode. (Refer to section 1.2)
LED
□ Power
(Green light on)
□ GPS
(Orange light on or
flash )
□ Log (Green light off)
(Caution) Some PCs may take around 15 seconds to recognize the GPS
logger.
Click
《 Load
log
Data
from
GPS
device》
< Load start>
This will automatically start
loading the Log data.
<Loading log data>
When loading is complete, the “Save log under a new file name” window
will open, so save the file under a new name. (The initial file name will
be the downloaded date and time.)
19
When loading is complete,
the “Save log under a new
file name” window will
open, so save the file under
a new name. (The initial file
name will be the
downloaded date and time.)
< Display for saving GPS log name>
If the readings possibly do not succeed, the program will re-start the
reading with Slow Speed Mode.
Slow Speed Mode
< Slow Speed Mode>
(Caution) Slow Speed Mode will be back to normal after restarting the
Dig Spice Analysis Program.
If the program miss-reads frequently,
please adjust the program that is locate in the following place:
c: Programfiles¥ DigSpice¥ usbqual.txt
“0”: Standard Mode (Communication time 1 min. 20 sec.)
“1”: Slow Mode (Communication time 6 m inutes)
“2”: Slow Mode (Communication time 4 minutes)
Communication errors may be caused by resident software such as
antivirus software. If the miss-reading frequently happens, please stop
the antivirus software and try again.
Once the data is saved, all data will be displayed on the “Control line,
Start line / Finish setting” window.
20
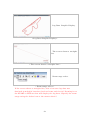
Log Data Graphic Display
<Log Data Graphic Display>
The screen shows a straight
line,
< The screen shows a straight line>
Zoom range select
< Zoom range select>
If the screen shows a straight line, this is because log data was
obtained in multiple locations (such as home and circuit). Zooming in on
the START or END section will display the log data. (Specify the zoom
range using the below icon or the mouse wheel.)
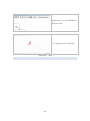
21
Zooming in on the START or
END section
It is displayed by zooming
< Zooming
22
data>
6.3.4 Error message
6.3.4.1 Connection failure with GPS logger
■ Measures
① Make sure the GPS logger and the PC are firmly connected with the
USB accessory cable.
② Make sure the GPS logger is set to Navi Mode.
③ Turn the GPS power OFF, and then set it to Navi Mode and try
again.
④ Restart the driving analysis software and try again.
6.3.4.2 Not recognized as Dig Spice GPS
23
■ Measures
【 GPS】 Tab> “Confirm setup details, Check available log memory
space” status (Refer to Section 6.2.2)
6.4 log data shift.
Cancel zoom/Specify zoom range
(Can zoom in or out using the mouse scroll wheel)
Control line setting
(Use the grid extension lines to adjust it at a right angle to the course)
Start/Finish setting
(Used when start/finish positions are different, such as in rallies and hill climbs)
Delete control line, start/finish
Marker setting
(Used as a marker when latitude and longitude are available, such as in rallies)
Load and save control line, start/finish
(Available for download from Dig Spice website)
Set start time at 00 sec. to correspond to rally SS.
The stop position is indicated with a circle ● for competitions such as rallies,
trials and hill climbs with the same stop and start position.
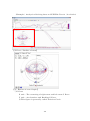
Load Circuit Map
Adjiust Trace (Right/Left/Down/Up)
6.4.1 LOG data shift
Before setting the control line, display driving data and circuit map and
use the arrow key to adjust log data to the circuit map. This will let you
obtain a more accurate driving data.
Load circuit map.
< Load circuit map>
24
Log data and circuit map Graphic
display.
< Display driving data and circuit map and make adjustments >
Log data and circuit map expand
display
< Log data and circuit map expand display >
Adjust log data to the circuit map
< Log data adjust>
6.4.2Setting the Control Line
Circuit:Specify the control line with the Control Line Setting
□ If you have an official or personally c reated control line
Load Control line, Start/Finish
<Load Control line, Start/Finish>
25
Choose the control line data of the
run circuit and push "OK".
< Choose the control line>
Control line is drawn
(Black Line)
< Control line is drawn >
Click “OK”
■ When a control line is not prepared .
Please set a control line by manual operation.
Choose the control line
< Control line setting>
At the control line position,
click the right mouse button
and adjust the center of the
+ mark to the control line
position to set the line.
26
< The manual setting control line>
Click “OK”
□ Rally, trial, hill climb:
Specify the positions with Start setting and Finish setting .
Check the Display
Stop Position box
and a circle ○ as
shown in the
diagram below will
appear, which will
make it easier to
indentify
Start/Finish
positions.
<Show stop position>
Start Gate SET
Finish GATE SET
< Start/Finish GATE SET>
Click “OK”
27
Once the measurement line is set, click OK and the detailed data by lap
will be displayed in the analysis window under the 【 Data】 tab.
<Lap data analysis window>
※ The analysis data will indicate the best three times in color.
Best Pink
2 nd Yellow
3 r d Green
6.5 Load Log Data
This will read a saved GPS data
6.6 Load Lap Data
This will read a driving data file
that
has been analyzed.
6.7 Reopen Log Data
28
Returns to “Control line,
Start/Finish
setting” window. Displays
“Control line, Start/Finish
setting” window.
6.8Choose to show graph/Cancel 【 Graph】
Go to the Graph tab to select
the data for analysis. Up to 4
driving data can be selected.
The selected data will be
color coded in order from
Red → Blue → Green →
Yellow.
You can also double click the
data to select the data.
Double click again to cancel
the selected driving data.
Go to the Graph tab to select
the data for analysis.
6.9 Save lap data
This saves a file for one lap
data.
6.10 Save the lap data list as CSV file
29
This saves the lap data list
as a CSV file
<Display>
<OUTPUT
FILE>
6.11 Save split data
This saves one split data as
a driving data file.
6.12Save Lap Data as CSV
30
This saves one Lap data as
driving data as CSV file.
Select Lap data.
<Display>
<OUTPUT
7. Detailed Analysis 【 Graph】
31
FILE>
Speed Window
Full Course Window
Animation Window
G/Radius of turn
7.1 Description of displays (Switch)
7.1.1 Tabs
Graph : Analysis of driving
Data : Input/output of driving
data
GPS : GPS logger settings
7.1.2 Graph Tool Bar
※ Used to display log data as animation.
32
Clear graph
Reset playback time
Playback/stop (Space bar)
Step next frame("F"Key)/Setp previous frame("B"Key)
Playback speed
Set sector Gate/Clear sector Gate
Load sector Gate/Save sector Gate/Edit sector Gate
Export to google Earth
Show/Hide Compare Time
Show/Hide Altitude
Adjust X-axis(Dist) on Sector
※ Please use Google Earth when the PC is connected to the Internet.
※ Use the Space key to Play/Stop, F key for frame advance, and B key
for frame rewind.
33
7.2 Sector setting when passing the same point more than once
Used mainly for slalom competitions (such as gymkhana, dirt trial).
If the sector setting includes a s ame point that is passed more than once,
this function can measure the passing for the second time and after.
Move the standard car to the position for the second lap (or after) and set
the sector.
Measure the 2 n d passing
34
7.3 Adjustment function of set sectors
Set the sectors and click the below button.
Select the sector to be adjusted.
Specify the location and lap number to be measured.
Please note that changing the lap number may also change the sector
numbers.
Move the gate by dragging the ■ with your mouse.
Specify the lap number to be measured.
35
7.4 Display/hide course layout tool on animation window
Clear circuit map
Genarate circuit map
Load / Save circuit map
Adjust circuit map
Show/Hide circuit map tool
7.4.1 Adjust course layout
Minor adjustments can be made to
the course layout using the arrow
switch.
7.4.2 Load course layout file
Display saved course layout data
on animation window.
7.4.3 Load/Save course layout file
Display saved course layout data
on animation window.
Save course layout data after
making minor adjustments.
36
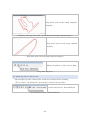
7.4.4 Create course layout
You can create original course layout.
Follow the following steps when creating a course layout.
① Make a circuit of the inner rim of the course.
② Move to the outer rim of the course with a straight line and make a
circuit of the outer rim of the co urse. (Refer to the image below)
2nd lap
1st lap
※ The first lap can be either the inner or outer side of the circuit.
③
Actual data sample
⑤ Set the start/finish gate by avoiding the section where the straight
lines cross.
37
⑥ Select OK to display lap data.
Select the driving data for the inner rim and outer rim of the course.
⑦ Create course layout
The course layout will be displayed without the crossed section.
Click “Generate Circuit map” button.
This step will link the disconnected ends of the cours e layout.
38
⑧ Save course layout
Save the created course layout with a name.
⑨ Completed course layout
When you open a saved course layout, the disconnected ends of the
course layout will be linked as shown below.
7.5 Window
The window sizes can be scaled to any size by dragging the borderlines
of the graph with your mouse.
39
7.5.1 Speed window
【 Zoom in】
The analysis data selected in 【 Data】 is displayed as a graph.
X-axis (Horizontal): Driving distance/Driving time (Can be switched)
Y-axis (Vertical): Speed
The black line indicates the red & blue compare time.
Black line shows the time differences between Red Line (car A) and
Blue Line (car B).
It is shown based on Red Line
When the black line moves up vertically, it shows Red Line ( Car A)
made a better lap time than Blue Line (Car B).
On the other hand,
when the black line moves down, it shows Blue Line made a better
lap time.
Time Difference Graph can be different by the distance of driving.
In order to correct this difference, setting the sectors where the
driving line is different.
The data will be corrected at this point.
When you wish to measure the time difference at specific ZONE,
such as just one corner, set the sector before and after the ZONE.
40
If you set in the Middle of the ZONE, you will get more specific
result.
▼ Speed Graph Base Point
This Triangle shows the agreement of driving line and speed graph
of all cars at this point.
The red line (car A) data is always agreed because it is basis.
The
other car can be disagreed the driving line and speed graph in some
points because of the difference of driving distance. Set the sector
and click the ▼ icon.
▼ point will be the base point of the speed
graph and you will be able to compare more exactly the time
differences from this point.
The gray line indicates the altitud e.
Double click on the graph to display the position line, and the speed at
that point will be displayed as a bar graph at the far right.
Use the +
-
or scroll wheel to scale the graph size centered
around the position line.
7.5.2 Full course window
The analysis data selected in 【 Data】 is displayed as a graphic.
○ sections indicate areas arbitrarily set as sectors.
□ sections indicate the total sector times.
※ Details of the total sector times can also be viewed in 【 Data】
tab.
41
<Sector details>
The sector details will display the best lap for the sector among the
selected laps, and then display the total time for these sectors as the
“best virtual time.”
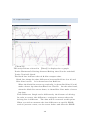
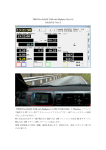
7.5.2.1 G force/Radius of turn
This section is on how to display G force and Radius of turn.
( Attention)
The data used in this section is calculated based on the speed recorded
with the GPS logger, plane coordinates and sampling period. They are not
values detected using sensors.
Erroneous values may be calculated due to the GPS signal reception
status during recording.
42
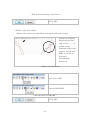
【 Friction circle】
This figure shows Acceleration G on the
Braking G
vertical axis and Cornering G on the
horizontal axis.
Left
turn G
Right
turn G
Acceleration G
■ Acceleration
Acceleration
■ Braking
Acceleration→ Braking
■ Cornering
Turn Apex
【 Graph】
43
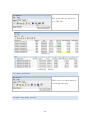
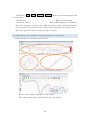
( Example) Analysis of driving data on SUZUKA Circuit( 2 vehicles)
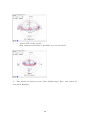
【 G Force/ Radius of turn】
【 G/ Radius of turn Graph】
□ G Force
X axis: The cornering of right turn and left turn G Force.
Y axis: Acceleration and Braking G Force.
※ This figure is generally called Friction Circle.
44
The light Red○ and Blue○ show the G dispersion of all data for the 2
vehicles being analyzed.
The dark large Red○ and Blue○ show…
The G Force at the standard vehicle position (Red vehicle) if the
horizontal axis on the speed graph is “Distance, or
the G Force at respective time points and vehicle positions if the
horizontal axis on the speed graph is “Time.”
□ Radius of turn
Red and Blueᗌ indicate radius of turn (m) at the red vertical line
point inside the speed window.
The radius of turn can vary even on the same corner depending on the
racing line.
They show the radius of turn at the standard car position
(Red vehicle) if the horizontal axis on the speed graph is
“Distance” or
Radius of turn at respective time points and vehicle positions if the
horizontal axis on the speed graph is “Time.”
□ Numerical display of G Force and Radius of turn
The G Force and radius of turn values of the mouse cursor position
are displayed.
Indication explanation
X=0.00
(Cornering of right turn and left turn G Force.)
Y=1.49
(Acceleration and Braking G Force.)
R=149m,489feet
(Radius of turn)
□ Zoom IN , Zoom OUT, Information
+ : Zoom IN of the graph(The enlarged reduction is possible
by a scroll wheel)
45
- : + : Zoom OUT of the graph
(The enlarged reduction is possible by a scroll wheel )
○
i : This shows the points to note when displaying G Force and radius of
turn with DigSpice.
46
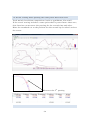
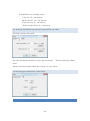
7.5.2.2 How to read the graph
A larger G Force distribution indicates that the tire performance is being
fully used in the driving. (However, acceleration will depend on engine
performance. Also, it is not likely to hit the tire limit’s G Force during
acceleration.)
The limit G Force will vary depending on the tire you use.
The following data show driving data for 2 vehicles.
A vehicle: G Force distribution is on
B vehicle: G Force
distribution is dispersed
the circumference.
47
Display for both vehicles (A vehicle= Red, B vehicle= Blue)
The Red vehicle data is dispers ed outside the Blue vehicle for b raking and
cornering, which shows the Red is using the tires well in b raking and
cornering. However in accelerating, the G Force for Blue is dispersed
below the Red, which indicates the Blue vehicle is superior in
accelerating performance.
G Force calculation formula is as follows.
Cornering G= (Speed [m/sec]) 2 / (Radius of turn [m])/ (Acceleration of
gravity 9.80665[m/sec2])
Acceleration G= (Speed difference [m/sec])/ (Time difference [sec])/
(Acceleration of gravity 9.80665[m/s ec2])
Even if the speed is the same,
If radius of turn is small, cornering G becomes larger.
If radius of turn is larger, cornering G becomes smaller.
Even if radius of turn is the same,
If speed is faster, cornering G becomes larger.
If speed is slower, cornering G becomes smaller.
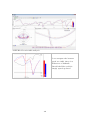
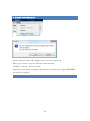
□ The above is explained below using the example of Suzuka Circuit130R.
48
SUZUKA Circuit130R analysis
If we compare the bottom
speed at 130R, there is a
difference of 23km/h.
Should the Blue vehicle
simply speed up here?
49
This is a comparison of
Cornering G.
Both vehicles exceeded 1.1G,
which are values close to the
tire limit.
Therefore, it tells that the
Blue vehicle cannot speed up
any more than this.
Next, let us compare radius of turn.
Blue= 150m
Red= 205m
The figures show a big difference.
In other words, the Blue vehicle is following a racing line with a small
radius of turn, and therefore must decelerate in the cornering to a slower
speed than the Red vehicle.
The Blue vehicle can review its racing line at the 130R and increase the
radius of turn, which will enable cornering at a faster speed than before.
7.5.3 Save a specified sector out of the displayed driving data
50
Double click the sector information cell. Or select the sector
information cell and click the below button.
7.5.4 Animation window
The data replayed in the speed window can be displayed as an
enlarged animation.
□ Zoom in/out
□ Time display
Use +
-
or scroll wheel to scale the size.
Displays the time from the starting point for the
Red car.
□ Dotted line
Select display/hide dotted line during deceleration.
□ Distance Displays the difference from the head of the Red car to the
mouse position.
Line of drive on the course and braking positions can be
measured.
Displays the lap time, average speed, maximum speed of the selected
lap, as well as the distance and speed from the start of the position
line for the selected lap.
7.5.4.1 Animation
51
Solid line( Red - Blue - Green - Yellow )
・When at constant speed and
accelerating
Dotted line ・ ・ ・ ・ ・ ・ ・ ・ ・ ・ ・ ・ ・ ・ ・ When decelerating
Solid line (Gray) ・・・・・・・・・・・・ When GPS signals are unstable
The color changes to gray when GPS signals are not received normally
due to tunnels or other factors. Please note that the data before and
after the gray line will include margin of error.
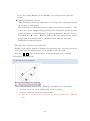
7.6 Function to save graph, driving trajectory as an image.
Right click on a section shown below.
Select save format and specify file name.
The same image file will look like the one below.
52
8.SETUP
8.1 Setting Sector Gate Length
Set the gate length when sectors are setup. (Default 15m)
Specify the gate (line) by setting how many meters the gate will extend on
both sides of the standard car position.
If the setting is “15.0,” a 30-meter gate will be set with the standard car
at the center.
Set this length
53
※ Guideline for setting value
Circuit: 15~ 20 meters
Mini circuit: 10~ 15 meters
Cart circuit: 8~ 10 meters
Trial competition: 8~ 10 meters
8.2 Setting minimum lap distance/minimum lap time
(Default 300m.8 Second)
Set the minimum distance of the lap and time.
(Initial Setting: 300m
8sec)
Please use this mode when the course is very short.
8.3Setting Speed/Distance indication
54
9. RESET GPS MODULE
Please operate when the Logger does not work properly.
When you need to operate the Rest GPS module,
【 GPS】 > Setup
Set the mode.
Operate revise data reception (30 min of the data that logged BEFORE
the data reception)
55
10. FAQ
9.1 Analysis Software
Q: How much disk space do you need to install the software i n a
PC?
A: 200MB is needed. Be sure to use a PC with enough disk space.
Q: Is the analysis software operable with a GPS logger other
than that of Dig Spice?
A: No, it is only operable with the Dig Spice GPS logger.
Q: Is the software operable with non-Windows computers?
A: Unfortunately, at this point, the software is not operable with
non-Windows computers.
Q: What are the required PC specifications?
A: Analysis may be done with specifications that is less
performance than specified at the PC sp ec requirement
before, but animation driving may not function smoothly. In
this case, try operating the system with less number of cars.
Q: Can the analysis software be installed in more than one
computer?
A: Yes, it can be installed in a multiple number of computers.
9.2 GPS logger
Q: The acquired data is incorrect. What should I do?
A: Check the GPS setup details. Redo the setup if necessary.
(Refer to section 6.2)
Q: Log data cannot be obtained at all. What should I do?
A: Make sure the GPS logger mode is set to Log Mode. (Refer to
section 1.2 Power ON/OFF and Modes)
Q: The device is mounted on a cart (motorcycle), but some parts
of the data are missing. How can I solve this problem?
56
A: The vibration may be directly affecting the GPS logger. Use
rubber or other material to prevent GPS Logger from the
vibration.
Q: What is the maximum duration of log time?
A: The system specification described is approximately 4 hours
with Standard Mode and 10 hours with Long Time Mode, but
it can log the data more than this time upon the condition.
Even the data can be logged more than 10 hours,) the battery
only lasts about 10 hours.
Q: The GPS logger will not change modes by pushing the switch.
What should I do?
A: Wait until the battery drives out, then recharge the battery
and check the operation.
Q: Can the data be improved in areas with poor GPS reception,
such as in tunnels and mountain roads?
A: Set the AGPS function as per Section 8 Gap View, which will
shorten the time required to acquire the GP S signals, but
data may not necessarily be improved.
Q: From where can I download data on course charts?
A: Course charts, control lines, driving data can be downloaded
from the Dig Spice website. (To be uploaded as they become
available)
Q1: I’m using the software with Windows VISTA, and the
File/Help flicks. What should I do?
57
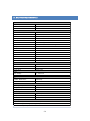
11. Hardware Specifications
General
Frequency
L1,1575.42MHZ
C/A Code
1.023MHZ
Datum
WGS84
Performance Characteristics
Position Accuracy
Without aid: 3.0m 2D-RMS
<3m CEP(50%) without SA(horizontal)
DGPS (WAAS,EGNOS,MSAS):2.5m
Velocity Accuracy
Without aid: 0.1m/s
DGPS (WAAS,EGNOS,MSAS):0.05m/s
Acceleration
Without aid:<4g
DGPS (WAAS,EGNOS,MSAS):<4g
Timing Accuracy
50 ns RMS
Reacquisition
Time <1s
Hot start
1.5s
Warm start
34s
Cold start
35s
AGPS
<15s
Sensitivity
Tracking:-165dBm Max, Acquisition:-148dBm Max.
Update
10Hz,5Hz,1Hz
Dynamic
Altitude
Maximum 18,000m
Velocity
Maximum 515m/s
Acceleration
Maximum 4g
Power
Input Voltage
Vin : 5.0V±5%
Battery
Built-in chargeable + Lithium-Ion battery
I/O
Available Baud Rates
115200 bps
Protocols
NMEA 0183 v3.01
Environment
Operating Temperature
-10 ~ 60C
Storage Temperature
-20 ~ 60C
Charging
0 ~ 45C
USB Bridge
Standard
Fully compliant with USB2.0
Full speed
12Mbps
Dimension
44 x 26 x 15 mm
Data Log
Log GPS data by time interval/ distance/ speed limit
User can configure settings by using utility
*.Citation of chipset spec. is from MTK
58
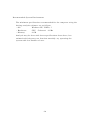
Recommended System Environment
The minimum specifications recommended for the computer using the
driving analysis software are as follows.
・ OS
Windows XP, VISTA, 7
・ Hardware
CPU
・ Memory
2 GB
Celeron®
2 GHz
Analysis may be done with lower specifications than above, but
animation driving may not function smoothly. try operating the
system with less number of cars.
59