1
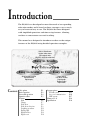
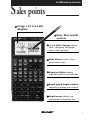
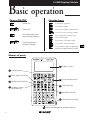
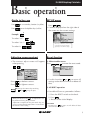
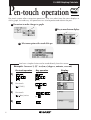
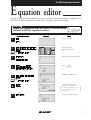
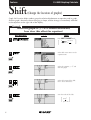
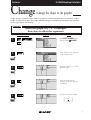
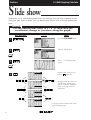
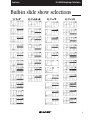
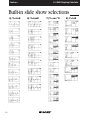
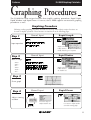
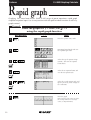
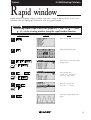
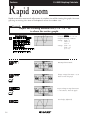
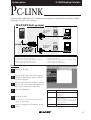
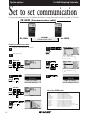
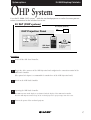
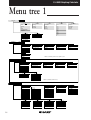
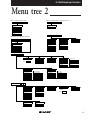
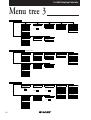
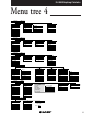
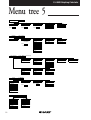
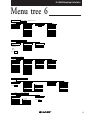
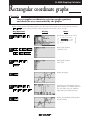
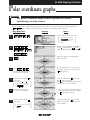
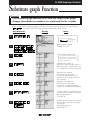
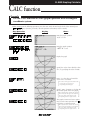
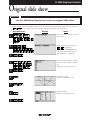
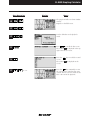
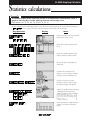
Graphing Calculator
EL-9600
TEACHERS’ GUIDE
Introduction
The EL-9600 was developed to meet the needs of an expanding
education market and is based on three concepts: easy to teach,
easy to learn and easy to use. The EL-9600 has been designed
with simplified operations and time-saving features, allowing
teachers to concentrate on actual teaching.
This manual was designed to introduce teachers to the unique
features of the EL-9600 using detailed operation examples.
Built-in slide shows
Original slide shows
Educational tools
(OHP/PC-link/Data collection)
Easy to Teach
Contents
Easy to Learn
Easy to Use
Shift/Change function
Equation editor
Split display
Large display
Pen-touch screen
Rapid graph
Rapid window
Rapid zoom
Sales points
Basic operation
Pen-touch operation
Equation editor
Features
Shift
Change
Slide show
Slide show selections
Graphing procedure
Rapid graph
Rapid window
Rapid zoom
P1
P2
P4
P5
P6
P7
P8
P9
P 11
P 12
P 13
P 14
System options
PC-link system
Set to set communication
OHP system
Menu tree 1~6
Specification
P 15
P 16
P 17
P 18
P 24
EL-9600 Graphing Calculator
S ales points
1
Large 132 x 64-dot
display
2
Easy Pen-touch
screen
3 Graph Shift/Change shows
how "changing" the graph
affects the equation
4 Slide Shows reduce class
preparation time
5 Equation Editor shows
equations just as in textbooks
6 Rapid graph/Rapid window
simplify graphing procedures
7 Rapid zoom allows easy
adjustment of window size
1
EL-9600 Graphing Calculator
Basic operation
Power ON/OFF
○
○
○
○
○
○
○
Power on
Function keys
Use to enter equations
Use to draw graphs
○
○
○
Power off
Use to view table of function value
Use to set size of viewing window
○
○
○
○
○
○
Erase equations and
remove error displays
QUIT
CL
○
○
○
Cancel of previous
function (Escape)
Use to adjust the viewing range
Use to trace graphs
Use to enter calculation mode
Use to enter slide show mode
Use to operate Rapid Graph/Rapid
Window and Rapid Zoom functions
Names of parts
5 Display screen
1 Graphing keys
2 Power supply ON/OFF key
3 Alphabet specification key
4 Secondary function
6 Cursor movement keys
7 Clear/Quit key
specification key
8 Variable enter key
9 Calculation execute key
10 Communication port for peripheral devices
2
A
sin
EL-9600 Graphing Calculator
Basic operation
Guide to key use
Press
Press
to use secondary functions (in yellow).
to use the alphabet keys (in blue).
SET UP menu
Press
.
• Contents displayed on the right side of
the screen are the current settings.
A
Example: sin
To select “sin”:
To select A:
]
To select “sin-1”:
There may be differences in the results
of calculations and graph plotting
depending on the SET UP settings.
]
Adjusting screen contrast
Reset function
• The contrast adjust screen will appear
when pressing
1) When trouble occurs
Press
to enter the reset mode.
OPTION
OPTION .
Press
to darken contrast.
Press
to lighten contrast.
Pen
Touch
(Change the contrast by touching
or
using the pen)
• With pen-touch mark Pen
Touch , all operations can
be performed using the pen touch.
• Operation examples for the pen-touch key are
given assuming that the operation is started from
the default value setting.
• Use this function (
or
) to return all
settings to the default value or to delete all
data.
2) All RESET operation
• If trouble still occurs, proceed as follows:
1. Press the RESET switch on the back.
2. Press
.
• Returns to the initial display.
CAUTION
Do not press
in step 2. It will delete all data
stored in the calculator.
3
EL-9600 Graphing Calculator
Pen-touch operation
Pen
Touch
Pen-touch screen offers convenient operations. Use it to select from the menu displays or
shift a graph, fast and easy. All operations can also be performed without the pen.
1 Convenient to make changes to graphs
3 Easy to move between displays
○ ○
○ ○
○ ○
○ ○
2 Select menu options with a touch of the pen
See how a simple choice can be made directly from the screen.
Example: Convert “3.55” to d,m,s (degree, minute, second)
Pen touch operation
Key operation
1)
2)
Pen-touch
[
3)
4
(or
)
(or
)
Pen-touch
[
4)
CONV]
dms] twice
Display
EL-9600 Graphing Calculator
E quation editor
The equation editor allows equations to be viewed just as they are written in textbooks. This
increases student comprehension and allows mistakes to be found quickly.
Example
Input the equation and see how it can be easily
viewed with the equation editor.
Display
Key Operation
Notes
Clear the display.
1
Select CALC and
(Integral function)
2
Pen
Touch
(or
)
Enter the range of the integral.
3
Enter
4
Complete equation input.
5
6
7
(or
)
]
Pen
Touch
Calculate the expression.
The mark in the upper right corner
will blink for approximately 10 seconds,
indicating that the expression is
being calculated.
]
Review the input equation.
5
Features
Shift
EL-9600 Graphing Calculator
(Change the location of graphs)
Graph shift function helps students grasp the relationship between an equation and its graph.
Shift the graph’s location without changing its shape, and the change is immediately reflected
in the equation on the right side of the display.
Example
When the graph of y = x2 is shifted downward,
how does this affect the equation?
1
2
Display
Notes
Enter SHIFT/CHANGE mode.
]
Key Operation
If
SHIFT is not already
highlighted press
.
]
Select shift. Cursor moves to the
equation menu.
Pen
Touch
3
Select the equation: y = x2 and
draw the graph.
Pen
Touch
4
Select the location of the shift:
move cursor down twice.
Pen
Touch
Pen
Touch
6
View the result of the shift.
]
5
y = x2
y = x 2-2
]
Features
EL-9600 Graphing Calculator
Change
(Change the shape of the graphs)
Graph change function helps students grasp the relationship between an equation and its
graph. Change the shape of the graph, and the change is immediately reflected in the equation
on the right side of the display.
Example
When the graph of y = x2 is changed,
how does it affect the equation?
Key Operation
Display
Notes
1
Enter SHIFT/CHANGE mode
and specified ( CHANGE ).
2
Select change. Cursor will move
to the equation menu.
Pen
Touch
3
Select the equation: y = x2 and
draw the graph.
Pen
Touch
4
Select the location of the
change: increase the value of ycoordinates.
Pen
Touch
Pen
Touch
View the result of the change.
]
5
y = x2
y = 2x 2
]
7
Features
EL-9600 Graphing Calculator
S lide show
Slide show assists with teacher preparation. By selecting from the built-in options or creating your own series of slides, you can demonstrate lessons with minimum preparation
time.
Example
Use the built-in slide show of y = x2 to show how the
coordinates change as you move along the graph.
Key Operation
1
2
Display
Notes
Specified SLIDE SHOW mode.
Select the built-in menu.
Pen
Touch
3
Select y = x2 and the first slide
appears.
Pen
Touch
4
Begin the slide show by pressing the
cursor key.
Moving between the values you
can follow the changes in the
graph’s coordinates, making the
nature of the graph easier to
understand.
* View the selection of built-in slide shows
on the following pages.
8
Features
EL-9600 Graphing Calculator
Built-in slide show selections
1) Y=X2
2) Y=AX+B
3) Y= X
4) Y=1/X
9
Features
EL-9600 Graphing Calculator
Built-in slide show selections
5) Y=sinX
10
6) Y=tanX
7) Y=cos-1X
8) Y=lnX
Features
EL-9600 Graphing Calculator
Graphing Procedures
The EL-9600 has three unique functions that simplify graphing procedures: Rapid Graph,
Rapid Window and Rapid Zoom. Of course, the EL-9600 supports conventional graphing
procedures as well.
Graphing Procedure
Following outlines graphing procedures and indicates the steps where Sharp's unique functions can
be used to simplify operations. These functions are introduced on the following pages.
Step 1
Manual Input
Rapid Graph
Input equation
Simply select from
built-in menu to
modify desired type of equation.
Step 2
Manual Input
Rapid Window
Set X, Y range
Xmin =
Xmax =
Xscl =
Ymin =
Ymax =
Yscl =
Simply select from
built-in menu to
set window size.
Step 3
Draw graph
Press Graph button to draw graph.
Step 4
Adjust viewing
window
Manual Input
Amending
range size
Go back to Step 2 to
readjust window size.
Rapid Zoom
Use arrows to adjust window
size while viewing graph.
11
EL-9600 Graphing Calculator
Features
R apid graph
Graphing has never been easier. With its full range of preset equations, rapid graph
simplifies equation input. Use in conjunction with the rapid window function or with any
graph created.
Example
Draw the graph for y = 2sin (-2x+ ) + 2
using the rapid graph function.
Key Operation
1
Display
Notes
Enter the equation entry mode.
2
Enter Rapid Graph mode and view
the equation-type menu.
3
Select the type of equation: Trigonometric, and view the equation
format menu.
Pen
Touch
4
Select the sin equation format and
view the sin equation style.
Pen
Touch
5
Select the second equation style and
input. If necessary, make changes to
the coefficients.
Pen
Touch
6
12
Draw the graph.
(Note: Previous range values may affect
the viewing window. To reset range
values, use Rapid Window.)
EL-9600 Graphing Calculator
Features
R apid window
Rapid window simplifies setting window size with a range of preset values. Use in conjunction with the rapid graph function or with any graph created.
Example
After using Rapid Graph to draw the graph of y = 2sin (-2x+ ) + 2 (refer
p. 12), set the viewing window using the rapid window function.
Key Operation
Enter Rapid Window mode.
2
Select the No. 3 style and view the
X-range menu.
3
4
Pen
Touch
(or
)
(Five times)
(or
)
7
Select X-range No. 4:
(-1 < X < 10 scl=1), and
view the Y-range menu.
Move the cursor to No. 5:
(-0.5 < Y < 5 scl=0.5)
5
Pen
Touch
Notes
Enter viewing window setup mode.
1
Pen
Touch
Display
(or
)
Select the Y-range and draw the
graph.
13
Features
EL-9600 Graphing Calculator
R apid zoom
Rapid zoom offers one-touch adjustment of window size while viewing the graph. No more
guessing or wasting class time to find optimal values for window size.
Example
Adjust the viewing window for y = x3 + x2 - 2x
to show the entire graph.
Key Operation
1
Display
Notes
Create the graph y = x3 + x2 - 2x
using the following conditions:
X-range: xmin = -3
xmax = 3
xscl = 1
Y-range: ymin = -1.5
ymax = 1.5
yscl = 0.5
2
Enter Rapid Zoom mode.
3
Change Y-range from Ymax = 1.5 to
Ymax=2. Draw the graph.
Pen
Touch
4
Repeat: Change Y-range from Ymax
= 2 to Ymax=2.5. Draw the graph
Pen
Touch
5
14
View display (adjusted).
System options
EL-9600 Graphing Calculator
PC-LINK
Connect the EL-9600 with a PC or Macintosh computer to expand the possibilities of data
exchange using PC Link software.
CE-LK1(PC-link system)
PC-Link
Software
PC conversion
connector for
IBM-PC
R
IBM PC
or Compatibles
PC-Link
Software
CE-450L
PC conversion
connector for
Macintosh
Macintosh
R
What is PC LINK?
• Creates and edits EL-9600 programs on a PC.
• Receives and saves programs and various data from EL-9600.
• Makes a backup of all the contents of EL-9600.
• Sends programs and various data to EL-9600.
• Loads image data of EL-9600.
• Converts programs and various data files into a Text File. Converts
program text files into a Program File.
• Prints out programs and various data files.
Procedure
1
Turn off the EL-9600.
2
Connect the EL-9600 to the PC by using the
CE-450L, PC-Link adaptor and PC connector
(see above diagram).
3
Make sure that the RS-232C (serial port) is connected
to the PC. Use of the connector is determined by the
shape of the PC serial port (see below chart).
4
Open PC Link-Software.
Shape of PC serial port
25 pin (male)
5
Switch on EL-9600.
Connect the other side (25-pin side) of PC LINK
adaptor to the serial
port for the PC.
* It is essential to use the same port for both the PC
9 pin (male)
Connect the other side (25-pin side) of PC LINK
adaptor to the 25-pin
terminal of a converting adaptor. Also connect the
other side (9-pin side) of the converting adaptor to
the serial port for the PC.
Operate according to the instructions on the
screen.
8 pin (female)
For Macintosh
and the PC Link-Software.
6
Connecting procedure
15
System options
EL-9600 Graphing Calculator
Set to set communication
Transfer data between two EL-9600 calculators using the communication cable (CE-450L).
CE-450L (Communication cable)
EL-9600
CE-450L
Communication cable
EL-9600
Communication Procedure
3
Pen
Touch
Turn power on.
Select SEND/ALL.
Receiver
)
Specified LINK.
4
( or
mark desired data to be
*sent.
]
)
Execute Sending function.
Sender
List of the SEND menu
Pen
Touch
( or
( or
)
Specified LINK.
)
Pen
Touch
Select LINK/SEND.
16
Select ‘LI’, ‘YI’
9
Select LINK/RECEIVE.
6
]
Pen
Touch
( or
5
List of sendable data will
appear on screen.
8
Pen
Touch
Pen
Touch
7
]
2
Plug the cable into both calculators.
]
1
A SELECT ....................... Sends files individually as described below.
01 ALL ............................ Selects and displays all files.
02 List ............................. Selects and displays all list files.
03 Matrix ........................ Selects and displays all matrix files.
04 Graph Eqn .................. Selects and displays all graph eqations.
05 Solver Eqn ................. Selects and displays all solver equations.
06 Program ..................... Selects and displays all program files.
07 G_Data ....................... Selects and displays all graph data files.
08 L_Data ....................... Selects and displays all list data files.
09 Picture ....................... Selects and displays all picture data files.
10 Slide .......................... Selects and displays all self-made slide show.
11 A~Z, Ø ........................ Selects and displays all fixed memory of A to Z, and Ø
B BACKUP ...................... Menu to send all data of files. Use this
feature to send the entire content.
System options
EL-9600 Graphing Calculator
OHP System
Use the EL-9600 OHP system with the overhead projector to make classroom presentations convenient for the whole class to see.
EL 96T (OHP system)
AC adaptor (optional)
OHP Projection Panel
CE-450L
OHP Panel
Controller
The CE-450L is included
for separate use
(see page 16)
Procedure
1
Switch off the OHP Panel Controller.
2
Plug in the cable connector of the OHP Projection Panel straight into the connection terminal of the
OHP Panel Controller.
(The optional AC adaptor is recommended for extended use of the OHP Projection Panel.)
3
Switch on the OHP Panel Controller.
4
Operating the OHP Panel Controller.
The OHP Projection Panel display is synchronized with the display of the OHP Panel Controller.
Place the OHP Projection Panel on top of the overhead projector to project images onto the screen.
5
Turn on the power of the overhead projector.
17
EL-9600 Graphing Calculator
Menu tree 1
SET UP
( 2nd F
SET UP
)
A
B DRG
Rad
FloatPt
9
Rect
Decimal (Real)
Equation
1 Deg
2 Rad
3 Grad
F AMSWER
1 Decimal (Real)
2 Mixed (Real)
3 Improp (Real)
4 x+yi (complex)
5r
(complex)
FORMAT
( 2nd F
C FSE
1 FloatPt
2 Fix
3 Sci
4 Eng
G EDITOR
1 Equation
2 One Line
D TAB
11
22
33
44
55
66
77
88
99
00
E COORD
1 Rect
2 Param
3 Polar
4 Seq
)
FORMAT
A
B CURSOR
RectCursor
OFF
OFF
Connect
Sequen
1 RectCoord
2 PolarCoord
D Y1
C EXPRES
1 ON
2 OFF
1 ON
2 OFF
E STYLE1
1 Connect
2 Dot
F STYLE 2
1 Sequen
2 Simul
( 2nd F
FORMAT
FORMAT
*When coordinate system is Rect, palm or polar
)
A
B CURSOR
RectCursor
ON
ON
Connect
Sequen
Web
F PLOT2
1 Sequen
2 Simul
MATH
(
MATH
1 RectCoord
2 PolarCoord
1 ON
2 OFF
1 ON
2 OFF
E PLOT1
1 Connect
2 Dot
G TYPE
1 Web
2 Time
3 uv
4 uw
5 vw
*When coordinate system is Seq.
)
A CALC
01 log2
x
02 2
03 fmin(
04 fmax(
05 d/dx(
06 ∫
07 dx
08 ∑(
09 sec
10 csc
B NUM
11 cot
12 sec-1
13 csc-1
14 cot-1
15 sinh
16 cosh
17 tanh
18 sinh-1
19 cosh-1
20 tanh-1
E ANGLE
1
2'
3"
4r
5g
18
D Y1
C EXPRES
F INEQ
1
2
3>
4≥
5<
6≤
1 abs(
2 round(
3 ipart
4 fpart
5 int
6 min(
7 max(
8 lcm(
9 gcd(
G LOGIC
1 and
2 or
3 not
4 xor
5 xnor
C PROB
1 random
2 nPr
3 nCr
4l
H COMPLX
1 conj(
2 real(
3 image(
4 abs(
5 arg(
D CONV
1 deg
2 dms
3 xy r(
4 xy
(
5r
x(
6r
y(
EL-9600 Graphing Calculator
Menu tree 2
When coordinate system is Rect
CALC
( 2nd F
CALC
When coordinate system is Polar,Param or Seq
)
CALC
CALC
( 2nd F
CALC
)
( 2nd F
LIST
)
CALC
1 Value
2 Intsct
3 Minimum
4 Maximum
5 X_Incpt
6 Y_Incpt
7 Inflec
1 Value
LIST
MATH menu on the NBASE calculation
A OPE
N-MATH
( 2nd F
TOOL MATH
)
1 sortA(
2 sortD(
3 dim(
4 fill(
5 seq(
6 cumul
7 df_list
8 augument(
9 list mat(
0 mat list(
A LOGIC
1 and
2 or
3 not
4 neg
5 xor
6 xnor
STAT
C L_DATA
1 stoLD
2 RclLD
( STAT )
A EDIT
edit list
Press
ENTER
B OPE
1 sortA(
2 sortD(
3 SetList
4 ClrList
E TEST
01 2 test
02 Ftest2samp
03 Ttest1samp
04 Ttest2samp
05 TtestLinreg
06 Tint1samp
07 Tint2samp
08 Ztest1samp
09 Ztest2samp
DRAW
B MATH
1 min(
2 max(
3 mean(
4 median(
5 sum(
6 prod(
7 stdDv(
8 varian(
( 2nd F
DRAW
C CALC
1 1_Stats
2 2_Stats
3 ANOVA(
D LINE
01 Med_Med
02 Rg_ax+b
03 Rg_a+bx
04 Rg_x2
05 Rg_x3
06 Rg_x4
07 Rg_In
08 Rg_log
09 Rg_abx
10 Rg_aebx
11 Rg_x-1
12 Rg_axb
13 x'
14 y'
F DISTRI
10 Ztest1prop
11 Ztest2prop
12 Zint1samp
13 Zint2samp
14 Zint1prop
15 Zint2prop
16 InputList
17 Input Stats
01 pdfnorm(
02 cdfnorm(
03 InvNorm(
04 pdfT(
05 pdf 2(
06 cdf 2 (
07 pdfF(
08 cdfF(
09 pdfbin(
10 cdfbin(
11 pdfpoi(
12 cdfpoi(
13 pdfgeo(
)
A DRAW
1 ClrDraw
2 Line(
3 H_Line
4 V_Line
5 T_Line(
6 Draw
7 Shade(
8 DrawInv
9 Circle(
0 Text(
F PICT
1 StoPict
2 RclPict
B POINT
1 PntON(
2 PntOFF(
3 PntCHG(
4 PxlON(
5 PxlOFF(
6 PxlCHG(
7 PxlTST(
C ON/OFF
1 DrawON
2 DrawOFF
D LINE
select
line type
Press
E G_DATA
1 StoGD
2 RclGD
ENTER
G SHADE
1 SET
2 INITIAL
19
EL-9600 Graphing Calculator
Menu tree 3
ZOOM
( ZOOM )
A ZOOM
1 Auto
2 Box
3 In
4 Out
5 Default
6 Square
7 Dec
8 Int
9 Stat
B FACTOR
Set factor
of zoom
PROGM-COM
(
2nd F PRGM
A PRGM
F FORM
1 RectCursor
2 PolarCursor
3 ExprON
4 ExprOFF
5 Y' ON
6 Y' OFF
7 Connect
8 Dot
9 Sequen
0 Simul
(
VARS
H RCL
1 RclWin
2 PreWin
B BRNCH
1 Label
2 Goto
3 If
4 Gosub
5 Return
G S_PLOT
1 Plt1(
2 Plt2(
3 Plt3(
C SCRN
1 ClrT
2 ClrG
3 DispT
4 DispG
D I/O
1 Get
2 Send
E COORD
1 Rect
2 Param
3 Polar
4 Web
5 Time
6 uv
7 uw
8 vw
H COPY
1 StoLine
2 RclLine
)
A EQVARS
Graph equation
B WINDOW
C STOWIN
Value of
window
Value of
stored window
Press ENTER
Press ENTER
Press ENTER
F PICTUR
1 Pict1
2 Pict2
3 Pict3
4 Pict4
5 Pict5
6 Pict6
7 Pict7
8 Pict8
9 Pict9
0 Pict0
20
E TRIG
1 sin x
2 cos x
3 tan x
4 sin-1 x
5 cos-1 x
6 tan-1 x
on Program screen)
1 Print
2"
3 Input
4 Wait
5 Rem
6 End
VARS
G STO
1 StoWin
D EXP
1 10x
2 ex
3 log x
4 In x
Press ENTER
F HYP
1 sinh x
2 cosh x
3 tanh x
4 sinh-1 x
5 cosh-1 x
6 tanh-1 x
C POWER
1 X2
2 X-1
3 X
G TABLE
1 TBLStrt
2 TBLStep
3 TBLList
H STAT
Statistics
Press ENTER
L_DATA
1 L_Data 1
2 L_Data 2
3 L_Data 3
4 L_Data 4
5 L_Data 5
6 L_Data 6
7 L_Data 7
8 L_Data 8
9 L_Data 9
0 L_Data 0
E G_DATA
1 G_Data 1
2 G_Data 2
3 G_Data 3
4 G_Data 4
5 G_Data 5
6 G_Data 6
7 G_Data 7
8 G_Data 8
9 G_Data 9
0 G_Data 0
EL-9600 Graphing Calculator
Menu tree 4
EQ VAR
( VARS
A
)
A XY
B XYT
1 Y1
2 Y2
3 Y3
4 Y4
5 Y5
6 Y6
7 Y7
8 Y8
9 Y9
0 Y0
WIN VAR
( VARS
B
BT
1 Tmin
2 Tmax
3 Tstep
( VARS
C
B STOT
1 Zm_Tmin
2 Zm_Tmax
3 Zm_Tstp
( VARS
H
MATRIX
D SEQ
1 nMin
2 nMax
3 u(nMin)
4 v(nMin)
5 w(nMin)
6 PlotStart
7 PlotStep
D STOSEQ
1 Zm_nMin
2 Zm_nMax
3 Zm_u(nMin)
4 Zm_v(nMin)
5 Zm_w(nMin)
6 Zm_PltStart
7 Zm_PltStep
1 RegEqn
2a
3b
4c
5d
6e
7r
8 r2
9 R2
0 resid
C POINTS
1 x1
2 x2
3 x3
4 y1
5 y2
6 y3
7 Q1
8 Med
9 Q3
D TEST
01 p
02 z
03 t
04 2
05 F
06 df
07 p
08 p1
09 p2
10 s
11 n1
12 n2
13 x1
14 x2
15 sx1
16 sx2
17 sxp
18 lower
19 upper
( MATRIX )
A NAME
B EDIT
1 mat A
2 mat B
3 mat C
4 mat D
5 mat E
6 mat F
7 mat G
8 mat H
9 mat I
0 mat J
( 2nd F
PRGM
A EXEC
01
02
03
04
05
06
C STO
1 Zm_ min
2 Zm_ max
3 Zm_ step
B REGEQN
09 ∑y
10 y
11 sy
12 y
13 ymin
14 ymax
15 ∑y
16 ∑y2
1 mat A
2 mat B
3 mat C
4 mat D
5 mat E
6 mat F
7 mat G
8 mat H
9 mat I
0 mat J
PRGM
min
max
step
)
A XY
01 n
02 x
03 sx
04 x
05 xmin
06 xmax
07 ∑x
08 ∑x2
C
1
2
3
)
A STOXY
1 Zm_Xmin
2 Zm_Xmax
3 Zm_Xscl
4 Zm_Ymin
5 Zm_Ymax
6 Zm_Yscl
STAT VAR
1 R1
2 R2
3 R3
4 R4
5 R5
6 R6
)
A XY
1 Xmin
2 Xmax
3 Xscl
4 Ymin
5 Ymax
6 Yscl
7 X_Fact
8 Y_Fact
ZOOM VAR
CR
07 X4T
08 Y4T
09 X5T
10 Y5T
11 X6T
12 Y6T
01 X1T
02 Y1T
03 X2T
04 Y2T
05 X3T
06 Y3T
D MATH
07 row_swap(
08 row_plus(
09 row_mult(
10 row_m.p.(
11 mat list
12 list mat
1 det
2 trans
3 rowEF
4 rrowEF
E[]
1[
2]
)
B EDIT
01
02
03
04
05
06
C OPE
01 dim(
02 fill(
03 cumul
04 augment(
05 identity
06 rnd_mat(
C NEW
Cleate
new program
Press ENTER
21
EL-9600 Graphing Calculator
Menu tree 5
STAT PLOT
( 2nd F
STATPLOT )
A PLOT1
B PLOT2
Stat plot2
Stat plot3
Press ENTER
Press ENTER
Press ENTER
OPTION
( 2nd F
OPTION
A CTRST
B MEMCHK
Press ENTER
to detail
STAT GRAPH
(
(
SHIFT/CHANGE
F MBOX
1 MBox •
2 MBox+
3 MBox
G S.D.
1 Scattr •
2 Scattr+
3 Scattr
H XYLINE
1 xyLine •
2 xyLine+
3 xyLine
SLIDESHOW
2
X
X
1/X
ex
lnX
sinX
tanX
X
)
C NEW
Press ENTER
Press ENTER
(
C N.P.
1 Norm • X
2 Norm+_X
3 Norm _X
4 Norm • _Y
5 Norm+_Y
6 Norm _Y
2nd F SHIFT/CHANGE
A SHIFT
1Y
2Y
3Y
4Y
5Y
6Y
7Y
8Y
B B.L.
0 screen
X
AX+B
X
1/X
sinX
tanX
cos-1X
lnX
D LINK
1 SEND
2 RECEIVE
1 Broken •
2 Broken+
3 Broken
B ORG
2
C DEL
1 List
2 Matrix
3 Graph Eqn
4 Solver Eqn
5 Program
6 Picture
7 G-Data
8 L-Data
9 Slide
0 Entry
1 Hist
A B-IN
1Y
2Y
3Y
4Y
5Y
6Y
7Y
8Y
E ON/OFF
1 PlotON
2 PlotOFF
E RESET
1 default set
2 All memory
2nd F STATPLOT on PLOT1-3screen )
A HIST
SLIDE
D LIMIT
1 SET
2 LimON
3 LimOFF
)
Remain
12345bytes
22
C PLOT3
Stat plot1
)
B CHANGE
1Y
2Y
3Y
4Y
5Y
6Y
2
X
X
X
ex
sinX
tanX
D EDIT
1 MOVE
2 DEL
3 RENAME
D N.D.
1 NormDis
E BOX
1 Box
EL-9600 Graphing Calculator
Menu tree 6
SOLVER
(
SOLVER on SOLVER screen
2nd F
A METHOD
B EQTN
(
2nd F
TOOL
A NBASE
C SAVE
Press ENTER
1
2
3
4
5
6
7
8
9
0
1 Equation
2 Newton
3 Graphic
TOOL
)
)
B SYSTEM
22
33
44
55
66
Select number
Calculate
Hexadecimal
Decimal
Octal
Binary
C RENAME
1
2
3
4
5
6
7
8
9
0
C POLY
22
33
Select degree
Press ENTER
Y=
(
Y=
)
RECT MODE
PAR MODE
Y1=
Y2=
Y3=
Y4=
Y5=
Y6=
Y7=
Y8=
Y9=
Y0=
X1T=
Y1T=
X2T=
Y2T=
X3T=
Y3T=
X4T=
Y4T=
X5T=
Y5T=
X6T=
Y6T=
FINANCE
(
2nd F
A SOLVER
Press ENTER
(
2nd F
OPTION
A SELECT
01 All
02 List
03 Matrix
04 Graph eqn
05 Solver eqn
06 Program
SEQ MODE
u(n)=
u(nMin)=
v(n)=
v(nMin)=
w(n)=
w(nMin)=
)
B CALC
01 slv_pmt
02 slv_1%
03 slv_PV
04 slv_N
05 slv_FV
06 Npv(
07 lrr(
TVM Solver
LINK
FINANCE
POL MODE
R1=
R2=
R3=
R4=
R5=
R6=
D
C PERIOD
08 Bal(
09 ∑Pm(
10 ∑Int(
11 Apr(
12 Eff
13 days(
1 PmtEnd
2 PmtBegin
D VARS
1N
2 1%
3 PV
4 PMT
5 FV
6 P/Y
7 C/Y
1)
B BACKUP
back up
07 G_Data
08 L_Data
09 Picture
10 Slide
11 A Z,
Press ENTER
23
Specifications
EL-9600 Graphing Calculator
Specifications
(without hardcase)
Dimensions W x D x H (mm)
183 x 86 x 19.5
Power
AAA x 4
Backup Battery
CR2032 x 1
Display
Size (dot)
132 x 64
Line x Characters
8 x 22
Character Size (dot)
5x7
Digits (mantissa + exponent)
10 + 2
Total Memory Size
32 KB
Constant Memory
27 + last answer memory
Memory
Accessory Protective hard case
Standard
Features
Graphing
Function graphing
Up to 10
Parametric graphing
Up to 6
Polar graphing
Up to 6
Sequence graphing
Up to 3
Split screen
Graph-table/graph-equation
Graph style
Zoom, Trace
Table of function values
Statistics
Regression models
12
Scatter Plots and Histograms
Box-and-Whisker Diagrams
Inferential statistics
Probability Distributions
Other
Matrix
Up to 10 (Maximum size : 99 x 99)
List
Up to 6 (Maximum length : 999)
Programming
Trigonometry functions (including sec, csc, cot)
Solver
Complex numbers
Financial calculation
Fraction/Decimal conversions
Last entry recall (up to 160 steps)
Last answer recall
Features
unique to
Sharp
Pen-touch screen, Equation editor, Shift/Change,
Slide show (Built-in/Original), Rapid graph, Rapid window,
Rapid zoom, List grouping, calculation, Simultaneous equation
Peripheral CE-450L
Unit-to-unit communications cable
CE-LK1
PC-Link (Print screen/Data storage)
EL-96T
OHP system (includes controller)
* Design and specifications are subject to change without notice.
* Some products may not be available in some countries.
24
EL-9600 Graphing Calculator
Rectangular coordinate graphs
Example
Use rectangular coordinate to enter two graph equations
and shade the area surrounded by the graphs
Before carrying out the following operation, press the reset switch located on the back of the unit and press
keys (caution: previously entered equations and memory will be erased).
1
Display
Notes
Specify Rect mode on the screen.
]
Key Operation
As shown, Rect corresponds to
. The example
shows the initial settings of the
EL-9600.
2
Enter graph equation
“7sinX+X” at Y1.
3
Enter graph equation
“X+1” at Y2.
4
5
6
]
Display the graph.
Specify the area surrounded by the two
graph equations to be shaded. (Y2<Y<Y1
on screen shows area to be shaded as
larger than Y2 and smaller than Y1).
Return to the graph display and the specified
area will be shaded.
EL-9600 Graphing Calculator
Polar coordinate graphs
Example
Use polar coordinate mode to draw a picture of a flower
and enlarge it on the screen.
Before carrying out the following operation, press the reset switch located on the back of the unit and press
keys (caution: previously entered equations and memory will be erased).
Display
Key Operation
Notes
Specify Polar mode on the screen.
1
As shown, Polar corresponds to
. The example
shows when only coordinate is
changed.
]
]
2
Enter the graph equations “5sin2 and
“6cos2 ” respectively at
and
.
(This completes the graph equation).
3
Display the graph. An eight-petaled
flower is drawn.
4
Use the attached pen to touch the top
left corner of the area to be enlarged.
(
will appear).
Press
and use the attached pen to
touch the screen directly.
Touch the inside of the
once more.
]
5
The operations in 4 and 5 above
can also be carried out using keys.
Press
, move cursor
and press
.
]
Touch the inside of the
once more
and cursor will appear.
(The cursor corresponds to the top left
corner of the area to be enlarged).
6
Use the attached pen to
touch the screen directly.
Use the attached pen to touch the bottom
right corner of the area to be enlarged.
(
will appear as before).
7
Touch the inside of the
once more.
Touch the inside of the
once more
and the screen will be enlarged up to the
cursor positions.
This operation can also be carried out
using
key.
]
]
EL-9600 Graphing Calculator
Substitute graph Function
Example
Use substitute graph function to see how the shape of the graph
changes when different numbers are substituted for the variable.
Before carrying out the following operation, press the reset switch located on the back of the unit and press
keys (caution: previously entered equations and memory will be erased).
2
3
4
5
6
7
8
Notes
Specify Rect mode on the screen.
As shown, Rect corresponds to
. The example shows
the initial settings of the EL-9600.
]
Enter the graph equation
“AX3+BX2+C” at Y1.
Specify substitute graph mode.
]
1
Display
]
Key Operation
As shown, the left of the screen shows the
graph coordinate and the right of the screen
shows that input of the variable used in the
equation is being awaited.
]
Substitute 1 for variable A.
(On left of screen the graph “Y=1X3” is
displayed. B and C are presumed to be
“0” as numbers have not been entered.)
Substitute1 for variable B.
(On left of screen the graph
“Y=1X3+1X2” is displayed. C is presumed to be “0” as numbers have not
been entered).
Substitute -5 for variable C.
(On left of screen the graph
“Y=1X3+1X2-5” is displayed. Thus all
variables are substituted with numbers.)
Alter the numbers for variable B from 1
to 3 and view the changes in the graph.
(The graph equation is
Y=1X3+3X2-5).
Similarly, alter the numbers for variable
A from 1 to 0.5 and view the changes
in the graph.
(The graph equation is
Y=0.5X3+3X2-5).
EL-9600 Graphing Calculator
CALC function
Example
Use the CALC function to solve graph equations with rectangular
coordinate system.
Before carrying out the following operation, press the reset switch located on the back of the unit and press
keys (caution: previously entered equations and memory will be erased).
Key Operation
Display
Notes
1
Enter the graph equation
“0.5X2-5” at Y1.
2
Enter the graph equation
“4 X+7-10 ” at Y2.
3
Display the graph.
4
Specify the value of X to find the value
of Y, by specifying the value of CALC.
5
Enter “3” as the value of X and the
value of Y is calculated.
]
Specify “Intsct” function to calculate the
intersection point of the two graphs.
]
After completion of the calculation, the values of
the X,Y intersection will appear at the bottom of
the screen, and the cursor will appear at the
corresponding point on the graph, as before.
]
The graph is intersected at two points.
Carry out the same operation as in
to find the second intersection.
]
7
]
6
The values X and Y appear at the bottom of the
screen and the cursor appears at the
corresponding point on the graph.
After completion of the calculation, the values of
the X,Y intersection will appear at the bottom of
the screen, and the cursor will appear at the
corresponding point on the graph, as before.
]
EL-9600 Graphing Calculator
Original slide show
Example
Use the slideshow function to create an original slide show.
Before carrying out the following operation, press the reset switch located on the back of the unit and press
keys (caution: previously entered equations and memory will be erased).
Key Operation
1
2
3
4
Display
Notes
Enter slide show creation mode and
input a title.
Create the first screen and press
to register it.
The message “STORESCREEN 01”
will appear momentarily to show
that registration is completed.
Enter the graph equations “0.5X2-5”
and “-X+2” respectively at Y1 and
Y2.
Registers as the second screen.
5
6
Displays the graph.
Registers as the third screen.
7
8
9
Shows the table.
Registers as the fourth screen.
EL-9600 Graphing Calculator
Key Operation
Example
Display
The graph and table are shown simultaneously.
Registers as the fifth screen.
10
11
Notes
Before carrying out the following operation, press the reset switch located on the back of the unit and press
keys (caution: previously entered equations and memory will be erased).
Key Operation
Display
Notes
12
Sets the slideshow to the playback
mode.
13
Press
to recall the first screen.
is displayed in the top
The symbol
right corner of the screen.
Press the
screen.
The symbol
screen.
14
15
•••
key to recall the second
is displayed on the
Press the
key continually to view
the screens in the order that they were
created. The last screen is shown at left.
This is the end of the playback.
EL-9600 Graphing Calculator
Statistics calculations
Example
10 students achieved the following results in a mathematics examination. Draw a
graph to classify these results into top, bottom and average score.
Exam results: 68, 73, 92, 86, 78, 95, 69, 75, 82, 81
Before carrying out the following operation, press the reset switch located on the back of the unit and press
keys (caution: previously entered equations and memory will be erased).
Key Operation
Display
Notes
1
Specify two figures after the decimal
point on the set up screen.
2
Enter all the exam results into the
list L1.
3
Select the variable quantity of the
statistics from the statistics mode.
4
Specify the list L1 containing the
exam data.
5
Calculates the quantity of the
statistics such as average, standard
deviation, total and bottom score.
6
Set the screen for the various
specified values in order to draw
the statistical graph with PLOT1.
7
Input of the specified values for drawing
a histogram from the list L1 of the
statistical quantity has been completed.
]
8
on/off: set whether to graph or not
DATA: select variable 1(X) or variable 2 (XY).
List X: set the list of the corresponding graph.
Freq: set frequency
GRAPH: set graph format
]
Draw the graph by setting the most
suitable screen for the statistical
graph.
EL-9600 Graphing Calculator
Distributed by:
SHARP CORPORATION OSAKA, JAPAN
FAX: 06-628-1653
FD0072N@ SHARP CORP.(SEP ‘97 PROD.) H0.5E Printed in Hong Kong