1
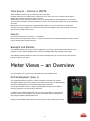
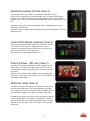
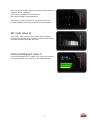
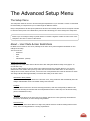
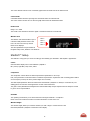
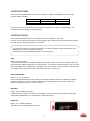
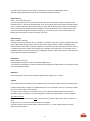
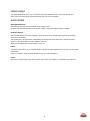
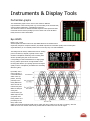
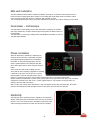
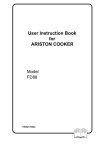
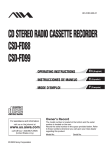
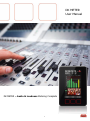
DK METER User Manual DK METER – Audio & Loudness Metering Complete 1 INTRODUCTION ............................................................................................................................................... 4 BEFORE YOU BEGIN… ............................................................................................................................................... 4 ABOUT THIS MANUAL ............................................................................................................................................... 4 OTHER IMPORTANT NOTES ....................................................................................................................................... 5 QUICK GUIDE ................................................................................................................................................... 6 IF YOU JUST WANT TO GET GOING ............................................................................................................................... 6 BASIC OPERATION ........................................................................................................................................... 7 MOUNTING YOUR DK METER .................................................................................................................................... 7 POWER SUPPLY....................................................................................................................................................... 7 NAVIGATION .......................................................................................................................................................... 7 SLIDING WINDOWS AND VIEWS ................................................................................................................................. 8 MENU NAVIGATION ................................................................................................................................................ 8 THE PRESET AND QUICK SETUP ........................................................................................................................ 9 STEP 1- PRESET LIST ................................................................................................................................................ 9 STEP 2 - INPUT AND CHANNEL ORDER ....................................................................................................................... 10 STEP 3 - SCALE AND LOUDNESS SETUP....................................................................................................................... 10 STEP 4 - METER TEXT READ OUT ............................................................................................................................. 11 TIME SOURCE – INTERNAL OR SMPTE ...................................................................................................................... 12 HOW TO … .......................................................................................................................................................... 12 BACKLIGHT AND STANDBY ....................................................................................................................................... 12 METER VIEWS – AN OVERVIEW ..................................................................................................................... 12 PORTRAIT BARGRAPH (VIEW 1) ............................................................................................................................... 12 GRAPHICAL LOUDNESS PORTRAIT (VIEW 2) ................................................................................................................ 13 HORIZONTAL GRAPHICAL LOUDNESS (VIEW 3) ............................................................................................................ 13 PICTURE PREVIEW - SDI ONLY (VIEW 4) .................................................................................................................... 13 MSD VIEW MODE (VIEW 5) ................................................................................................................................... 13 FFT MODE (VIEW 6) .............................................................................................................................................. 14 HORIZONTAL BARGRAPH (VIEW 7) ........................................................................................................................... 14 METER SETUP & AUDIO ROUTING ................................................................................................................. 15 AUTOMATED METER SETUP .................................................................................................................................... 15 CLOCK SETUP AND HIERARCHY ................................................................................................................................. 15 AUDIO ROUTING SETUP.......................................................................................................................................... 15 THE ADVANCED SETUP MENU........................................................................................................................ 18 THE SETUP MENU ................................................................................................................................................. 18 ABOUT – USER MODE & USER RESTRICTIONS ............................................................................................................ 18 PRESET – FOLDER .................................................................................................................................................. 19 MATRIX OUTPUT ASSIGN – SELECTING YOUR METER SOURCE........................................................................................ 19 METER SETUP ...................................................................................................................................................... 19 STARFISH™ SETUP ................................................................................................................................................ 20 LOUDNESS PRESET ................................................................................................................................................. 21 LOUDNESS SETUP .................................................................................................................................................. 21 LOUDNESS OPTION ................................................................................................................................................ 23 LABELS ASSIGN ..................................................................................................................................................... 24 AUDIO GLOBAL ..................................................................................................................................................... 24 INSTRUMENTS & DISPLAY TOOLS .................................................................................................................. 25 PORTRAIT BAR-GRAPHS .......................................................................................................................................... 25 EYE WIDTH .......................................................................................................................................................... 25 AES LOCK INDICATION ........................................................................................................................................... 26 GONIOMETER – VECTORSCOPE ................................................................................................................................ 26 2 PHASE CORRELATION.............................................................................................................................................. 26 STARFISH®........................................................................................................................................................... 26 JELLYFISH™.......................................................................................................................................................... 27 LOUDNESS BAR-GRAPH(S)....................................................................................................................................... 27 METER TEXT READ-OUTS ....................................................................................................................................... 28 RECLAIM FACTOR .................................................................................................................................................. 28 GRAPHICAL LOUDNESS ........................................................................................................................................... 28 FFT SPECTRUM ANALYZER ...................................................................................................................................... 28 MOVING COIL EMULATION ..................................................................................................................................... 29 DK LOGGING PC APPLICATION ................................................................................................................................ 29 HOW TO….. .................................................................................................................................................... 30 HOW TO ENABLE FFT SPECTRUM ANALYZER................................................................................................................ 30 HOW TO SET ANALOGUE INPUT SENSITIVITY ................................................................................................................ 30 HOW TO SWITCH TO MOVING COIL EMULATION ......................................................................................................... 30 HOW TO CHANGE THE BAR-GRAPH WIDTH.................................................................................................................. 30 HOW TO CUSTOMIZE WINDOW TEXT READ OUT .......................................................................................................... 30 HOW TO SOFTWARE UPDATE ................................................................................................................................... 30 HOW TO CLONE THE SETTINGS FROM ONE UNIT TO ANOTHER ......................................................................................... 31 HOW TO VIEW TWO STEREO PAIRS WHILE WATCHING LOUDNESS BASED ON PAIR #1........................................................... 31 LOUDNESS & TERMINOLOGY ......................................................................................................................... 33 ABOUT LOUDNESS ................................................................................................................................................. 33 TERMINOLOGY ...................................................................................................................................................... 33 OTHER RELEVANT INFO .................................................................................................................................. 35 DK METER ONLINE APPLICATION (PC SOFTWARE) ...................................................................................................... 35 SIGNAL CONNECTIONS ............................................................................................................................................ 35 SPECIFICATIONS .................................................................................................................................................... 37 3 INTRODUCTION Before you begin… Thank you for purchasing one of the DK Meter family members. With the DK Meter you are well equipped to meet the growing challenges within Audio and Loudness metering. The DK Meter complies with all major Broadcast loudness standards and delivers outstanding metering precision and clear read-outs, not merely on Loudness, but across the full range of audio metering tools. The DK Meter toolset makes it application-fit for any audio and loudness setup in broadcast, film & post production as well as live transmission and recording. With the clear DK Meter readout and compliance in your line of sight, you are always safe and sound. The DK Meter Family The DK Meter range has three family members, all including the complete DK Technologies audio metering suite of tools. The difference between models is primarily in the number of display channels and I/O formats available. Here is a quick overview of the family members: About this manual This manual will provide you with a quick overview of the DK Meter operation, tools and options, as well as an in-depth look at the more advanced parameters and facilities of DK Meter. Happy reading! Please note: DK-Technologies reserve the rights to change the content of this manual at any time. The latest revision of this manual can be downloaded from: www.DK-Technologies.com 4 Other Important Notes Disclaimer No part of this document may be reproduced or transmitted in any form or by any means, electronic or mechanical, including photocopying and scanning, for any purpose, without the prior written consent of DKTechnologies A/S. The company aims to ensure that all details in this document are correct at the time of publication, but reserves the right to alter specifications and equipment without notice. The latest version will be available upon request. This publication is for international usage. Despite considerable effort to produce up to date information, no literature published by the company nor any other material that may be provided should be regarded as an infallible guide to the specifications available nor does it constitute an offer for sale of any particular product. StarFish and JellyFish are registered trademarks of DK-Technologies A/S. Dolby®E is a registered trade mark of Dolby Laboratories, Inc. The ownership of any trademarks referenced is acknowledged. © 2012 DK-Technologies A/S. E&OE. All Rights Reserved. Purpose Any fitness for purpose legislation or other determination that may be applied in the area where this equipment is installed must take due cognizance that it is designed for use in professional broadcast, audio and video systems by appropriately trained personnel. The equipment is not intended for use in a domestic environment and regulations designed for such situations are not applicable. After sales modifications Any modifications to the equipment not specifically authorised and approved by DK-Technologies A/S may invalidate the equipment warranty. This includes changes to cabling and variations to the recommended installation as detailed in the documentation issued by DK-Technologies A/S. Modifications can invalidate EMC and safety features designed into this equipment and the manufacturer cannot be liable for any legal proceedings or problems that may arise relating to such modifications. No sales agent or other person involved in the supply chain is permitted to authorise variations from the content of this documentation. Important Safety Instructions Read these instructions. Study carefully and understand all safety and operating instructions before you install and operate the unit! Keep these instructions. Keep all safety and operating instructions for future reference! Heed all warnings on the unit and in the safety and operating instructions before you install and operate the unit! Follow all instructions to ensure against injury to yourself and damage to the unit or other objects connected to the unit. To prevent possible electrical shock, death, fire, injuries and malfunctions, use this product only as specified. Only use attachments and accessories specified by the manufacturer. The units of the DK Meter range are designed for indoor use only 5 Quick guide If you just want to get going If you just want to get going with your new DK Meter right away, here are a few simple steps to get it up and running. 1. Connect the included power supply or power your meter directly from your computer USB port. 2. Powering up your meter, you will see the on-board quick setup guide – if you want to disregard that, slide across the three touch buttons from left-to-right (you can always return to the guide later). 3. Connect the DK Meter AES 1,2 & 3 to the appropriate audio output and play audio. 4. Sliding further to the left, you will see a number of different views of DK Meter. Below is a quick overview of the different metering tools: For more information on the individual tools, please refer to the ‘display tools and options’ section of this manual. 6 Basic Operation Mounting your DK Meter The DK Meter is supplied with an adjustable mounting bracket. The top piece is mounted onto the DK Meter with the two included screws, while the desktop piece is mounted with four screws. Additional fixing options and mounts are available from DK-Technolgies.com or from RAM on http://www.rammount.com . The included model number is: RAP-B-138U Note: When fixing the mounting plate to the rear of the meter, use only the screws supplied – damage may be caused by using longer screws, or different mounting back plate. Power Supply The DK Meter comes with a plug-top power supply with a USB outlet. If being used in conjunction with a computer or USB hub, any conventional USB-A outlet with the standard USB 5 volt supply may be used instead of the included power supply unit. This elegant feature not only makes the DK Meter easier to bring along, but also conveniently allows the DK Meter to power up with the relevant computer of your setup. Navigation The general navigation on the DK Meter is achieved through the three capacitive touch sensitive buttons below the screen. Each touch button corresponds to the on-screen button and dynamically changes name as relevant. In addition, swiping across the three buttons from left-to-right or vice versa, allows you to change the overall meter view or selected menu. 7 Sliding Windows and Views The sliding function described above allows you to easily move from one meter setup to another, as well as entering the background Quick setup, preset and Setup menus. You will find both the Quick Setup and Advanced Setup menu on either ends of the views in Portrait and Horizontal mode respectively. Adv. Setup Horizontal View7 Horizontal Bargraph Quick Setup Horizontal View6 FFT Portrait Views Horizontal Views View5 MSD View View4 Picture Preview (SDI only) View3 PPM + Loudness History Quick Setup Portrai t View2 PPM + Loudness History Advanced Setup Portrait View1 PPM + Loudness DK Meter holds up to 7 different metering views, of which most allows further customization by you. Sliding from right to left will move from Portrait layouts into the horizontal view section. Go ahead and find the view that suites you. See more details about the individual meter views in the Meter View Section of this manual. Menu Navigation When inside a menu (Quick setup or Advanced setup), the three touch buttons become your navigation. The left most button moves the cursor up, the center button moves the cursor down and the right most button becomes a ‘select’ function. At any point is it possible to ‘slide’ across the buttons to exit the current menu. In several of the menus, a folder structure has been designed to hold the many parameters and functions of the DK Meter. To open or close a folder, move the cursor on top of the folder and press ‘select’. You are now exposed to the folders inside, including potential sub-folders. Tip: Selecting an empty line and hitting ‘Select’ will close the current folder. 8 The Preset and Quick Setup When powering up your meter for the first time, the ‘Preset and Quick Setup’ menu will be shown as the first display. The Preset and Quick Setup menu, allows for a simplified and fast way of setting up you DK Meter. More advanced settings and functions are edited in the ‘Setup’ menu reached by sliding from right to left. Note: The power-up showing of the Quick Start Guide may be disabled by unchecking the ‘Show this panel on power up’ parameter (the change is stored upon exiting to the meter viewings). The Quick Start Guide will give you a few basic tips on operation and setting up your meter. Here are the four simple steps to follow to set your meter up in a few minutes: Step 1 Preset– Select the preset you want to work with Step 2 Input Selection – Select your preferred input and choose your desired Loudness bar-graph Step 3 Scale and Loudness Setup – Select your Scale and Loudness setup of choice Step 4 Meter Text Read Out – Define what four parameters you want to see on the Meter Text Read Out. Step 1- Preset List The DK Meter holds a list of presets that allows you a fast starting point, as well as showcasing some of the different tools included in the Meter. Any of the presets can be edited to become a custom user preset. Selecting a preset is as easy as moving the cursor to the desired preset on the list and hitting the ‘Select’ button. DK Meter always has a preset selected and changes are instantly stored upon exiting to the Meter view, be it; meter setup, background parameters and display appearance. Dynamic preset naming When advancing in the Quick Setup, the selected preset name will dynamically reflect your choices. The dynamic preset name includes the following information: Input Source – channel count and Order – Loudness Setup – Scale 9 Dynamic Preset Example Digital Input 5.1 Surround LCR channel order Integrated Loudness Bar-graph R128 Loudness Setup LEQM Meter scale The naming of a preset may be customized in the ‘Advanced Setup Menu’ under the Audio Global/Preset Folder (see more in the ‘Setup Menu’ section). Step 2 - Input and Channel Order The Input and Channel Order section allows you to easily select both your preferred input source and the order of the incoming channels. The list of input and channel order only displays inputs and channel setups allowed by the current meters specific hardware and software configuration. More advanced input and channel routings may be accessed in the Advanced Setup Menu. The following inputs may appear depending on your specific Meters ability and interfaces: Analogue Digital De-embed All interfaces may be selected as 2.0, while only Digital and De-Embedded allows for 5.1 setups. 5.1 setups allow for two different channel orders: LRC – corresponding to the EBU channel order: Left, Right, Center, LFE, Ls, Rs LCR – corresponding to the SMTPE channel order: Left, Center, Right, Ls, Rs, LFE Choosing ‘User Def’ will make the meter fall back on the settings of the more advanced ‘Setup’ menu, allowing you to tailor input source and channel order in more advanced ways than those offered in the Quick Setup. Step 3 - Scale and Loudness Setup This menu allows you to define exactly what scale and specs your bar graphs should perform to. Select the desired scale by moving the cursor in place and hit ‘Select’. The scale list includes: IEC 268 I BBC – IEC 268 II IIB – IEC 268 II DIN NBC – Ultra VU DMU1 – DMU1630 40C – Dorrough PPM4 – Loud 10 SMPTE VU LEQM – RMS LEQ DMU2 – DMU1630 EBU – IEC 268-18 FBTV – DIN ITU – RMS LEQ 40A – Dorrough Web Peak Any scale will be applied to the chosen Meter view. 10 Graphical Bar-graph Width The graphical width of the bar-graphs may be altered. If set to ‘Auto’, the Meter will dynamically adapt the width. Selecting ‘Normal’ will allow you to manually define the width in the ‘Setup’ Menu. Please see the ‘Setup Menu’ section for further details on the ‘Normal’ or manual width definition. Loudness Setup The Loudness setup parameter allows you to select between a number standardized or recommended Loudness settings including: R128 BCAP HRTV-23FS ATSC A/85 TV2 DK ARIB LEQM ABC-TV LA AGCOM 219 If you select ‘User’ the loudness setup may be completely customized to exactly your specifications in the ‘Setup Menu’. Please see the ‘Setup Menu’ section for further details on the ‘Normal’ or manual width definition. NOTE: The Loudness Capture mode may be set to automatic or manual. The Default setting is ‘Auto’ and initiates the Loudness measurement when incoming audio passes the above a -70dBFS threshold. Please refer to Advanced Setup Menu/Loudness Setup/Capture for more information Loudness Bar Type Allows you to define if you want to see a Loudness bar next to your other Bar graphs and if so, what Loudness parameter will be indicated: Momntry – ‘Momentary Loudness’ Shorttrm– ‘Short-term Loudness’ Integrt – ‘Integrated Loudness’ None – Meaning no Loudness Bar graph displayed. Momentary+Shorttrm – Dual Loudness bars of both ‘Momentary’ and ‘Short-term’ Loudness Step 4 - Meter Text Read Out The Meter Text Read Out allows you to customize what parameter each of the four Text read outs in the top the DK Meter screen displays. Each of the four parameters has its own folder with the parameters that are possible to display as a Text Read out. Line 1 Line 2 Line 3 Line 4 11 Time Source – Internal or SMPTE When tracking loudness levels, it is essential to have a time base. DK Meter includes its own arbitrary time, starting from 00 for every time a new Loudness measurement is initiated and continued until Stop or Reset is pressed. Additionally, DK Meter features the ability to read, view and log against an external SMPTE or LTC timecode. The Time Source Parameter determines whether you want to use the internal DK Meter time or external SMPTE time code. SMPTE time code must be input into the Right Analogue channel in order for DK Meter to read the time. The time code may be display as one of the four Text Read outs available in any of the DK Meter views and is also viewed in the MSD View (View 5). How to … The Quick Setup features a few ’How to...’ descriptions. Please refer to the complementary ‘How to…’ section of this manual for a detailed description and tips on how to perform specific tasks using the DK Meter. Backlight and Standby The backlight parameter allows you to set the brightness of your meter. Hit the ‘Select’ button and use arrow up/down to set the desired backlight level. De-select the backlight parameter by hitting ‘Select’ again. The Standby parameter enables the meter to be put into standby mode. Hit any of the three touch sensitive buttons to wake up your meter. Meter Views – an Overview This section gives you a quick overview of the different views available in the Portrait Bargraph (View 1) The Portrait bargraph view features a number simultaneous viewings and readouts. The default functions of this view includes 4 text readouts at the top, level bargraphs and the option of adding phase and vectorscope at the bottom of the view. The Loudness indication may be a single or dual bargraph, allowing for two different loudness parameters to be viewed at the same time. In addition to the traditional bargraphs, this view also has the ability to show level and loudness as moving coil emulations. The moving coil emulation may be changed here: Adv. Setup/Preset/Meter Setup/Display mode Finally, the SDI capable models, allows for Picture Preview of the incoming video stream. 12 Graphical Loudness Portrait (View 2) The graphical loudness view, allows for several different simultaneous views. On top of the four standard text readouts and phase meter, it features level bargraphs adhering to the defined scale, while the dual Loudness bars are referring to the defined loudness scale. In essence, this means that two independent scales are viewed at the same time. Furthermore, the Loudness level is plottet against time as a graphical track on screen, allowing for a historical view. Loudness may also be logged via the PC application against either internal time or external SMPTE time code. Horizontal Graphical Loudness (View 3) The horizontal graphical loudness view features a similar set of option as the portrait version of this view. Additionally, four more text readouts may be defined on the top right section of the screen. The specific parameters view may be changed here: Adv. Setup/Preset/Loudness Option/Window Text Picture Preview - SDI only (View 4) The Picture Preview feature is available on the SDI capable only. This feature allows you to tap into the 3G SDI video stream and comes in very handy when wanting to verify that you are monitoring the correct SDI stream. The Picture Preview feature is also available in the Portrait Bargraph mode (View1). In the View 1, the Picture Preview may be toggled on/off by hitting the ‘Picture’ button. MSD View mode (View 5) The MSD View, builds on the heritage of the famous DK-Technologies MSD meter range and features a Vectorscope alongside a bargraph section allowing for both level and loudness views. In addition, the four text readouts are displayed on the upper right section of the screen. In addition to the regular meters and read-outs, the MSD View features a Time code display below the StarFish®, which allows you to follow either the internal timecode used during Loudness tracking or external SMPTE time code. The choice of time source may be set in the Quick Setup menu. 13 As an extra option, the MSD View may be changed to display moving coil emulations instead of bargraphs. The moving coil emulation may be changed here: Adv. Setup/Preset/Meter Setup/Display mode The ‘Moving Coil Dual’ mode allows you the ultrawide Moving Coil instrument displaying left and right channel in the same instrument FFT mode (View 6) The FFT view, simply features a 1024 band FFT spectrum analyzer. Please check out the Instrument & Display tools section of this manual for further information specifically on this tool. Horizontal Bargraph (View 7) The Horizontal bargraph view, in addition to the regular Text readouts, vectorscope and phase meter, features a horizontal bargraph view. 14 Meter Setup & Audio Routing Automated Meter Setup As you are probably aware by now, the DK Meter is quite a complex piece of equipment. In order to simplify setup, the DK Meter has an integrated auto setup function that ensures that bar-graphs, loudness, vectorscope and other instruments has pre-wired inputs. For example; the bar-graphs will automatically position Left and Right channel as the first two bar-graphs and then route them onto the phase correlation meter. Essentially this means that outside the initial input to the bar-graphs, the routing in between the different instruments inside the DK Meter is fixed and cannot be altered. Clock Setup and Hierarchy DK Meter always attempts to lock to the relevant input source, but also has an internal lock hierarchy initially looking for a valid clock on SDI, AES and finally internal clock. This means that if you are using SDI inputs, DK Meter will look for clock on the respective inputs, similarly with AES inputs (clock will be derived from AES1). If no valid lock is found, DK Meter will fall back on its internal 48kHz clock. Hierarchy – DK Meter attempts to lock onto clocks in the following order: 1. SDI 2. AES1 3. Internal Audio Routing Setup The audio routing of the DK Meter is highly flexible and allows for a high degree of customization. All of the following is automatically handled by the Quick Setup, allowing you to focus on what is important - the Audio. However, if you need to customize routing or labeling of input channels or something else, here is what you need to know (fig xx): Source Selection (Advanced Setup; Matrix Output Assign, Meter) The basic routing and connection between inputs and instruments is handled in the Matrix Output Assign folder in the Advanced Setup menu. Sources are selected from an instrument or Role point of view e.g. selecting the first role (fig xx: 17:L), you are enabled to select the appropriate source on the left hand side of the menu (L DIG). Hitting the ‘Select’ button twice will bring up the Source list that you can choose from. Source List The Source list will display every available source of your meter including a number of internal sources with special functions that we will get back to. 15 This means that if your meter has de-embedded SDI channels, you will see these, just like digital and analogue sources will show if enable on your meter. Internal Sources As mentioned, the Meter includes a number of internal sources that has specific functions like ‘Off’, Sum, Difference, Loudness etc. These come handy for setting up special functionality like a Loudness Bar-graph, or adding MS viewing to the Moving Coil emulation. Here is a list of the internal sources function: Internal Source Off Off TonL TonR Mix Diff Loud Function Off Off For internal use For internal use Used for Sum (M) signal in MS viewings, or as Left ch. when in Downmix mode Used for Diff (S) signal in MS viewings, or as Right ch. when in Downmix mode For Loudness Bar Source Labels – (Input) (Advanced Setup; Labels Assign, Input) The Meter includes a list of default names/labels for all the available sources. However, these may be changed completely to your liking. This comes in handy when you want to label your sources with more relevant names e.g. L OB Van or TV1 or what-ever is relevant for you. The Source Labels menu allows you to do exactly that. In the Advanced Setup menu, select the Labels Assign folder, go to Input and select the source you want to re-label. Now choose the label you prefer from the Global Label Master. Channel Role Label (Output) (Advanced Setup; Labels Assign, Output) Similar to the ‘Source Labeling’ the channel Role may be re-labeled as well. This is the label that is indicated on display above the relevant Bar-graph. In the Advanced Setup menu, select the Labels Assign folder, go to Output and select the role you want to re-label. Now choose the label you prefer from the Global Label Master. Please note that the Automated Meter Setup function relies on certain roles to avails be labeled correct e.g. Left, Right, Center, LFE, Ls, Rs are all used to setup the StarFish™ correctly. Global Label Master (Advanced Setup; Audio Global, Labels, Signal) The Global Label Master is a default list of all the labels available for Source and Channel Role labeling. Each of the Master labels may be altered to your liking, meaning that you can completely customize the labeling of both incoming sources and roles. 16 Audio Routing parameters included in preset All of the above outlined Audio routing and re-label functions are stored instantly in the current preset, with the Global Label Master as the only exception. This means that your routing and labeling may be completely altered by the flick of a preset change, while the Global Label Master stays fixed independent of preset changes. 17 The Advanced Setup Menu The Setup Menu The Setup Menu holds the access to all of the background parameters of your DK Meter. In order to understand the functionality, it is important for you to read through the different sections. Many of the parameters will alter preset parameters and hence are instantly stored. Therefor it might be relevant to select the desire preset to be edited before proceed with customizing your meter setting in the Setup Menu. NOTE: If you are looking to change a specific feature or function it might be relevant to look at some of the examples in the ’How to’ section of this manual. About – User Mode & User Restrictions DK Meter has four levels of user access, allowing for the meter to be protected against unintended use and changes to the setup. The four levels are: - Restricted - Basic - Full - Administrator (default) Changing the User mode Changing the user mode takes effect at the first store after exiting the Advanced Setup menu (approx. 10 seconds after exit). In order to enable change of the User mode in the restricted modes, the DK Meter allows for a 10 second Administrator mode window after power up, before the current User mode takes effect. In other words; to change the user mode; reboot the meter, scroll to the User mode parameter and select the desired User mode. The change will take effect approximately 10 seconds after exiting to the meter views. Administrator Mode (default) The Administrator mode gives full access to all meter views, setup parameters and automatically stores all changes. Administrator mode is the default setting of the DK Meter. Full Mode Full Mode allows full access to all views and setup parameters, while the storing facility is disabled. This means that rebooting the DK Meter will return all parameters back to where they were at the last storing (done in Administrator mode). Basic Mode The Basic mode allows for all meter views to be utilized, while access to the Quick setup and Advanced setup menu are blocked, as well as storing being disabled. Restricted Mode Restricted mode, locks the DK Meter in a single view position and does not allow scrolling between meter views, access to setup parameters or storing of parameters. 18 Preset – Folder The Preset folder contains detailed parameters for setting both audio routing, meter displays and Loudness settings. The follow paragraphs explain each sub menu and its functionality. Matrix Output Assign – Selecting your Meter Source The Matrix Output Assign/Meter folder lets you choose what source is routed to your Bar-graph display. Please refer to the Meter Setup and Audio Routing section for further information. Meter Setup The Meter Setup folder holds a number of parameters that allows you to customize the behavior and appearance of your Meter. Scale This menu allows you to define exactly what scale and specs your bar graphs should perform to. Select the desired scale by moving the cursor in place and hit ‘Select’. The scale list includes: IEC 268 I DIN NBC – Ultra VU DMU1 – DMU1630 40C – Dorrough BBC – IEC 268 II SMPTE VU LEQM – RMS LEQ DMU2 – DMU1630 EBU – IEC 268-18 IIB – IEC 268 II FBTV – DIN ITU – RMS LEQ 40A – Dorrough Web Peak Display mode Allows you to select whether the Bar-graph width is auto scaled or if you want to manually (‘Normal’) define the individual Bar-graph appearances. Additionally, switch from Bar-graph to ‘Moving Coil’ or ‘Moving Coil Dual’ mode. Please refer to the ‘Moving Coil Emulation’ section in the Instruments chapter for more info. Bar-graph Width – Manual The Bar-graph Width allows you to alter the width of each bar-graph being displayed. In order for the Bar-graph Width to work, please ensure that you have selected ‘Normal’ under the Display Mode folder. Colour Normal Each scale includes a defined ‘Peak’ level where the scale turns red. The ‘Peak’ threshold may be altered under the ‘Loudness Setup’ by Peak Red the parameter named ‘Peak level’. In addition to the Peak area, the DK Meter allows you to define colour of the ‘Normal’ area. Colour Normal Green Colour Under Blue 19 The ‘Colour Normal’ sets the color of each bar-graph below the ‘Peak level’ in the ‘Normal’ area. Colour Under A threshold defines when the input signal is considered ‘under’ the ‘Normal’ level. The ‘Colour Under’ sets the color of each bar-graph when below the defined threshold. Under Level Range: 0 to -25dB The ‘Under Level’ determines when the signal is considered ‘Under’ the normal level. Window Text The Window Text Read Out allows you to customize what parameter each of the four Text read outs in the top the DK Meter screen displays. Line 1 Line 2 Line 3 Line 4 The same parameters may be edited via the Quick Setup menu; Windows Text Read out. StarFish™ Setup The StarFish™ setup gives you access to setting up and defining your StartFish™ and JellyFish™ appearance. Colour Select the basic display colour of the StarFish™/JellyFish™. Blue, Green, Light Blue, Red, Violet, Yellow. Compressor The compressor section allows for different performance parameters to be set up. Fast / Slow parameters controls the Phase correlation responds time. In particular when reviewing phase relation of low frequency content, the ‘slow’ position might come in handy. The Gain On/Off parameter allows the Goniometer and StarFish™/JellyFish™ to always in a relevant size, but adding gain to increase the visual appearance of each of the instruments. The gain is evenly distributed meaning that the channel relationship is kept complete and can always be trusted to give a correct representation. OP-Mode The operating mode allows you to choose between running the StarFish™ or JellyFish™. Please refer to the instrument section for further information on each of the two. Window Height The window height, allows you to define whether you want a large or a small version of the Gionometer/StarFish™/JellyFish™ instrument on the display. 20 Loudness Preset The Loudness setup parameter allows you to select between a number of standardized or recommended Loudness settings including: R128 BCAP HRTV-23FS ATSC A/85 TV2 DK ARIB LEQM ABC-TV LA AGCOM 219 If you select ‘User’ the loudness setup may be completely customized to exactly your specifications in the Loudness Setup Folder (please see next paragraph). Loudness Setup The Loudness Setup folder allows you to customize the loudness settings of your meter. You may use one of the Loudness presets as a starting point, but in order for the customized loudness setting to be saved, the ‘User’ loudness preset has to be selected. Tip: Select the Loudness Preset that comes closest to your desired loudness setting, then select the ‘User’ Loudness Preset in order to customize the details. Your changes will now automatically be saved to the current preset. Filter Range: K-FILTER or LEQM. Two different scales have been adopted for displaying the loudness value. One of these is defined by the ITU in their document ITU BS1771 and that uses “Loudness Units” - LU. These have values ranging from -18 to +9 with the typical aiming point for signals being a specification close to the 0 point. The other commonly used scale has only negative values going down from a 0 LUFS mark at the very top of the scale. Short-term Window Range: 0, 3, 10 or 30 seconds. The currently displayed loudness value is based on the averaged loudness values over a defined time window. Setting the window to 0 provides a display of values that are as instantaneous as the system permits. The window can be adjusted to be 0, 3, 10 or 30 seconds. Reference Range: -9 and -24 dBFS (1 dB steps). A range of Reference levels can be chosen for the purpose of loudness measurement as part of the loudness measurement standard which your organization (or client) has adopted. Peak Level Range: -1 to -10 dBFS (1 dB steps). The Peak level is a user defined reference point. 21 The peak level is dependent on the setting of ‘Peak Mode’; True Peak or Digital (Sample Peak). When the signal passes above the peak level, the Peak level readout will turn Red. Gate Level (-a) Range: -8 to -20 dB (1 dB steps). It is often the high level parts of a program which are often of most interest for assessing compliance with broadcast criteria. To prevent an extended length of low level program content reducing the averaged loudness value to a degree that affects the measured value, the meter has an optional gating function. Once the signal drops below the gate threshold, the meter will continue to hold, display and use for averaging purposes, the previous value that was above the threshold. Setting it to -20 causes the gate to remain open and the unit displays the actual loudness for the vast majority of the time. Gate Level (-b) Range: Floating or Absolute. The gate level can be an absolute value or a floating one. Absolute values offer a degree of simplicity but at the risk of a high setting causing gating of quieter sections which might sometime comprise a significant part of material such as a feature film soundtrack. Adopting a low absolute value can cause background noise that is at a relatively high level (for example a documentary by a waterfall) not to be gated out, even though it is not a significant contributor to the perceived loudness. Making the gate level relative may then offer results that more closely reflect perceived program loudness. Peak Mode Range: Digital or True Peak. Selecting Digital will base the reading on individual sample values. True Peak uses oversampling to create the maximum intersample peak possible taken from the maximum value of the interpolated waveshape. Reference This is the frequency chosen for the calibration alignment and is either 400 or 1000 Hz. Capture The Loudness capture functionality may be changed between two different modes; Start-Pause and Auto-Start. Loudness measurement or Capture is essentially always done over a timespan - hence, it is necessary to define when the Loudness capture starts and stops. As explained in the Loudness & Terminology section, several different Loudness measures are relevant i.e. Momentary Loudness, Short-term Loudness, Integrated Loudness and Loudness Range – all time dependent. The Start-Pause Mode Is in effect a manual mode that allows you to decide when the Loudness capture starts, pauses, restarts or is reset. In all meter views, a ‘Reset’ and ‘Start/Pause’ button are supplied. The button expresses the Loudness capture state the meter is in, e.g. ‘Start’ indicates that the Loudness Captured has been started. 22 Loudness Capture is dependent on the incoming signal being higher than -70dBFS. When starting the Loudness Capture, the button name will switch from ‘Pause’ to ‘Start’ given that the incoming signal is above -70dBFS. In case the signal is not above -70dBFS, this will be indicated by the ‘Start’ button being black. During the Loudness capture, you may now toggle the capture between ‘Start’ and ‘Pause’. The overall resulting loudness readings will express the summarized capture of all audio above -70dBFS from the last Reset. Hitting ‘Reset’ will re-initiate the Loudness Capture and measures. Overall, the Start-Pause mode allows you to manually start and stop the capture during breaks or audio that you do not wish to consider in the overall loudness readings. Note: As per the BS1770 standards, audio below -70dBFS is not included in the overall loudness capture. This is to avoid that breaks or silence in the audio undermines the loudness readings. Auto-Start Mode The Auto-Start mode, has controls and options similar to those of the Start-Pause Mode, with the addition of an automatic start/reset facility triggered by the audio level. More specifically, if the audio is higher than -70dBFS, the Loudness Capture is automatically started, as well as being automatically stopped and Reset when the audio drops below -70dBFS again for more than 2 seconds. This mode is particularly handy when working with smaller bits of audio, and frees you from having to manually reset the loudness capture every time you want a new reading. Loudness Option The Loudness option section allows you define what loudness parameter you wish displayed as the Loudness bar-graph. Note: Enabling a Loudness Bar-graph requires audio to be routed to the relevant bar graph position. This may be done through the Quick Setup Menu; Input and Channel Order folder or the Advanced Menu; Matrix Output Assign folder. The Loudness parameters available for display are the following: Momntry – ‘Momentary Loudness’ Shorttrm– ‘Short-term Loudness’ Integrt – ‘Integrated Loudness’ None – Meaning no Loudness Bar graph displayed Window Text The Window Text Read Out allows you to customize what parameter each of the four additional Text read outs appearing on the Horizontal Graphical Loudness view (view 3). 23 Labels Assign The Labels Assign folder allows you to customize naming and labeling of both sources and channel roles. Please refer to the Meter Setup and Audio Routing section for more information. Audio Global Analogue References The analogue reference sets the sensitivity of the analogue input. In essence the sensitivity decides how many dBU it takes to fully reach maximum input or 0dBFS. Downmix settings The Downmix settings are used for allowing a stereo down-mix to be created and viewed from an incoming surround set of channels. The ‘Output gain’ is the attenuation compensating for potential clips when joining the 6 channels together. ‘Center to L/R’ sets the that the Center channel is mixed by. ‘Mode’ decides whether the Downmix facility is on or off. Labels The Labels section allows you to customize names of presets as well as signals, also to referred to as the Global Label Master. Please see the Meter Setup and Audio Routing section for further information. Colour The Colour parameter defines the colour scheme of the meter, most notably on the Window Text Read outs. 24 Instruments & Display Tools Portrait Bar-graphs The standard bar-graphs can be used to view numerous different representations of the incoming audio e.g. level according to the selected scale, various loudness parameters, sum/difference and more. The maximum number of channels viewable depends on the specific DK Meter model and software feature package you have. Please refer to the DK Meter family section for further information. Eye Width Range: 10% - 100% All SDI capable DK Meters feature the Eye Width Parameter as default feature. Inspired by cell phone reception indication, Eye Width expresses the immediate quality of the incoming SDI signal and allows you to constantly monitor this to avoid any drop outs and instabilities. The background for the Eye width feature has its starting point in the data eye diagram, typically used to depict deviation in amplitude and timing of the incoming data stream. By folding the parts of the waveform corresponding to each individual bit into a single graph, the eye pattern represents an average statistic of the incoming data and the eye opening expresses the signal quality in terms of amplitude (level difference and timing difference (jitter). Eye Width, as the name suggests, is concerned with the width of the eye pattern, focusing primarily on the timing differences which can also be measured as jitter. While not being an actual jitter measurement, Eye Width expresses the eye pattern max. timing window as a percentage of the ideal, where 100% width is the theoretical optimal signal with no quality loss (90% is likely to be the max. in real life), and 10% width the worst case scenario where most products will be unable to the lock onto the signal. 25 AES Lock Indication The AES enabled DK Meters feature an AES lock indicator, allowing you to instantly confirm that the meter is locked onto the incoming signal. When clocking to an incoming AES signal, AES1 needs to be fed the master clock. Given that a valid clock and lock is achieved, AES1 will light up green. The corresponding AES inputs will be green when valid data is received in sync with the incoming clock on AES1. Goniometer – Vectorscope The Goniometer is automatically chosen when StarFish® or JellyFish® are enabled and only 2 channels are routed to the Bar-graph section (please the Matrix section for further details). The Goniometer or Vectorscope, displays phase and amplitude information on the Left and Right input channels. Phase correlation When the Goniometer, StarFish® or JellyFish® are selected, the left most part of the display is a phase bar-graph with purple graticule lines. This displays information on the main left/right inputs, with the factory supplied default for this being the first AES input. Other signals can be chosen using the internal matrix. Audio meters are rarely used to display pure sine waves and the term “in-phase” is applied here meaning a signal where the mono sum is equal to or greater than the higher of the left and right signals. “Out of phase” is a signal where the mono sum would be less than the higher of the left and right signals. Signals which are predominantly “in phase” have a green marker in the upper half of the range. Fully correlated signals such as double mono read on the +1 mark. Signals which are “out of phase” are shown with a red marker in the lower half of the range. With no input, with only the left or right driven or with correlated mono but with a 90 phase shift, the marker position is the halfway point with the upper section of the marker green and the lower part red. StarFish® The StarFish® is the development in the JellyFish® surround audio display, developed by DK-Technologies many years ago. It provides a picture of a 5.1 surround audio field. The display has the front center channel arranged towards the top with other directions as marked. 26 The image here shows the StarFish® display with equal audio on all legs. Typical sound fields have energy in a variety of directions and more complex shapes are created which give an indication of the directions having significant amplitudes. Unlike the earlier JellyFish® display which with the same signal would have shown a circle, the StarFish® takes into account the summation occurs when there is coherent (in-phase) content between legs such as left and centre. Polarity inverted (out of phase) signals can cause the shape to be pulled inwards towards the centre point, reflecting the perceived cancellation that occurs. A yellow coloured trace indicates that there is a high degree of coherent signal content. When the signals are largely un-correlated, the trace becomes blue. When the predominant content is polarity inverted, a red section of trace shows highlights that might have produce a phasing problem. The randomness of typical surround signals means an occasional glimpse of red should not be a cause for concern, though red showing for extended periods should be investigated as it can be a sign of a signal that will not fold-down well into stereo and mono. JellyFish™ DK Technologies’ trademark ‘JellyFish®’ display was first launched on audio only meters. It was later developed to provide the alternative ‘StarFish® display and both included in the DK Meter. Both modes provide a picture of the surround audio field in 5.1, 6.1 or 7.1 channel modes. The display has the front centre channel arranged towards the top with other directions are marked. The image here shows the StarFish® mode with equal audio on all legs. In JellyFish® mode, the same signals would produce a circular display. Typical sound fields have energy in a variety of directions and more complex shapes are created which give an indication of the directions having significant amplitudes. Surround display size The default setting places an audio compressor in the drive to the surround display. This provides a relatively consistent display size from which phase indications can easily be read, which is the primary purpose of the surround display, amplitude being read from the bar-graphs. Loudness Bar-graph(s) The Loudness Bar-graph enables your loudness readings to be monitored side-by-side with the regular amplitude bar-graphs. The specific loudness parameter displayed on the Loudness Bar-graph may be set in the Quick setup menu; Input and Channel order, or in the Advanced Menu; Meter Setup/Loudness Option. In addition to the loudness reading, Start/Reset buttons for initiating and resetting the overall Loudness Capture are supplied as well. These are described in detail in the Loudness Setup - Capture section. 27 Meter Text Read-Outs The four Meter Text read-outs allow for completely customized view of four parameters in addition the regular audio tools. The custom setup of each of the four read-outs may be set in the Quick Setup menu; Window Text Read-out or the Advanced Menu; Meter Setup; Windows Text Reclaim Factor The Reclaim factor indicates how much you can increase your signal while still staying within your loudness target. The Reclaim Factor is essentially the difference between the absolute gated loudness and the dynamic gated loudness. By making sure that your material is always above the dynamic gate threshold, the reclaim factor ensures optimal loudness within the given standards. Graphical Loudness Loudness values can be shown graphically against time using the Graph LEQ function. The Graphical Loudness display allows for up to 3 minutes of loudness to be mapped against time. The Graphical Loudness view is reached by sliding once to the left of the basic Bar graph display (view 2 Portrait, View 3 Horizontal). After hiding the Analyzer panel, the left panel part of the screen shows the individual audio level bar-graphs for the elements that make up the surround (or stereo) signal. The bar-graph in the right panel shows the instantaneous loudness value. The Loudness Capture functions are described in detail in the Capture section. The ‘Integtr’/’Shorttrm’ button allows for toggling between the two different Loudness measures. In addition to the graphical loudness, the Peak and Peak hold functions are also made available in the Graphical Loudness display. The Peak button, enables/disables the flying peak of the bar graphs across all meter views. Similarly, the Hold button enables/disables the peak hold function across all meter views. FFT Spectrum Analyzer The FFT Spectrum analyser allows you an instant view of the spectral content of your source signal for detailed analysis and weighting of the different frequency areas. Slide all the way to the left on your meter views to reach the FFT. 28 The FFT (Fast Fourier Transform) analyzer function performs a 1024 band audio spectrum analysis function. The FFT features a x10 Zoom function, allowing a more precise view of the audio spectrum. Furthermore, the FFT allows for pointing to a specific frequency pin for detailed readings, by using the ‘Cursor’ button. Hit the ‘Cursor’ button and use the ‘Move’ buttons to point to the desired frequency pin. Once the relevant frequency pin has been selected, the ‘SetRel’ function (Set Relative Level) allows you to align the overall FFT level using the current pin as the reference point. Moving Coil Emulation The DK Meter features Moving Coil emulation in two different modes replacing the standard Bar-graph indication. The Moving Coil emulation is enabled in the Advanced Setup menu; Meter Setup/Display mode. The Moving Coil mode allows for up to four moving coils simultaneously. The StarFish/JellyFish®, Goniometer and Phase correlation may still be displayed in addition to Moving Coils. The Dual mode allows a single moving coil arc to display two signals by using a dual Needle Concept. The specific signals displayed depend on the signals routed in the Matrix Output Assign folder e.g. Left/Right or M/S. Please refer to the Matrix Output Assign section for more information. DK Logging PC Application The PC based Logging application is free of charge for every DK Meter. It allows for detailed logging of loudness, peak and peak channel information allowing metering hindsight for documentation, visualization and evaluation of DK Meter data. The application includes a logging session database for easy access and overview of logged sessions. Furthermore, the Application allows data export to multiple fileformats for additional advanced datahandling. DK METER – Audio & Loudness Metering Complete 2 29 How to….. How to enable FFT spectrum analyzer All DK Meters feature the FFT Spectrum Analyzer. The FFT is reached by simply ‘sliding’ your finger from left to right until you reach meter view 6. How to set Analogue input sensitivity All DK Meters have analogue inputs sensitivity adjustment. To set the sensitivity level of the analogue input, go to Advanced Setup/Audio Global/Analogue References. How to switch to Moving Coil Emulation The Moving Coil Emulation is available for every DK Meter. The Moving Coil emulation is enabled in the Advanced Setup menu; Meter Setup/Display mode. The Moving Coil mode allows for up to four moving coils simultaneously. The StarFish® /JellyFish®, Goniometer and Phase correlation may still be displayed in addition to Moving Coils. Please refer to the Instrument; Moving Coil Emulation for more information. How to change the Bar-graph width The graphical width of each bar-graph may be altered in the Advanced Setup; Meter Setup/Bar-graph width folder. How to customize Window Text Read out Line 1 Line 2 Line 3 Line 4 The Window Text Read out may be customized in the Quick Setup menu; Window Text Read Out folder. More detailed options are available in the Advanced Setup; Meter Setup Window Text folder. How to Software update DK-Technologies constantly develop new software features, facilities and adjustments to adhere to all relevant scale and Loudness recommendations. It is therefore recommendable that you, once in a while, check for new updates for your Meter on: www.DK-Technologies.com Every DK Meter can easily be software updated via the inherent USB connector. 30 Please follow these instructions to software update: - Go to www.DK-Technologies.com - Go to the DK Meter product page - Locate the dkmeteronline.exe tool and download - Connect the DK Meter to your computer - Launch the dkmeteronline application - The dkmeteronline application will automatically check for latest software for your meter specifically. - Follow on-screen instructions to load the latest software. Please see more information in the DK Meter Online Application section of this manual. How to Clone the settings from one unit to another DK Meter units may be 1:1 cloned for easy standardization of multiple meters. A cloning essentially involves copying every setting, preset, software and firmware from one meter to another. Therefore it is advisable to ensure that the latest software is loaded in the ‘Master’ meter at the very minimum. Please follow these instructions to clone a DK Meter: - Go to www.DK-Technologies.com - Go to the DK Meter product page - Locate the dkmeteronline.exe tool and download - Connect the master (to be cloned) DK Meter to your computer - Launch the dkmeteronline application - Hit the ‘Advanced’ button and select ‘Clone Instrument (save to file)’ - Specify location - Disconnect the master DK Meter and connect the target Meter to become the clone - Hit the ‘Advanced’ button again and select ‘Clone Instrument (load from file)’ – Select location - Your target Meter is now an exact clone of your Master Meter. Note: Only meters identical on hardware and software options may be cloned How to view two Stereo pairs while watching Loudness based on pair #1 The DK Meter allows you to view several stereo pairs at the same time even, defining what Loudness measures to only be based on specific channels. The Loudness number is generally based on the channels preceding the Loudness bargraphs i.e. if 5.1 bargraphs are lined up looking from left to right, followed by the Loudness bargraph – Loudness will be calculated across these channels (less the subwoofer channel). In this case however, we can to create a setup that allows you to view two independent stereo pairs while measuring Loudness only on the first stereo pair: The fastest way to set this up is to first make the basic selections of input and loudness setup in the quick setup menu: - Input / Channel Order – - Select the relevant input e.g. 2.0 digital - Select the relevant Loudness Bar type e.g. Momentry+shorttrm Now slide to the Advanced Setup and go to Preset/Matrix Output Assign/Meter - Scroll to position 5, hit ‘select’ twice and select the relevant input from the list 31 - Repeat the process for position 6. - Scroll to Preset/Labels assign/Output/Meter - Scroll to position 5, hit ‘Select’ and use ‘Arrow Up’ to find ‘L’ - Repeat process for position 6 to select ‘R’ channel. You should now see one stereo pair called L and R, then two Loudness bars Momentary and Shortterm and finally another Stereo set label with the input number that you selected (if you want them labeled differently on the actual bargraph, go to Preset/Labels Assign/Input/…and select the appropriate input channel to rename). 32 Loudness & Terminology About Loudness Loudness measurements differ from conventional signal amplitude measurements in that they are also influenced by the frequency content of the signal and the duration of transient components. The way these various elements are handled to give a value for display has been defined by the International Telecommunications Union in their standard ITU BS1770 which is the only loudness standard to have achieve any degree of international acceptance. The DK Meter allows a number of parameters to be adjusted to suit whatever options your organisation and perhaps regulatory body has decided to mandate. Two organisations leading the way in the standardisation of loudness measurements are the Advanced Television Systems Committee (ATSC) in the USA and the European Broadcasting Union (EBU) in Europe. The background information to the measurement norms is contained in the ATSC document “Techniques for establishing and maintaining audio loudness for digital television”, document A/85:2011. The EBU document R128 is supplemented by EBU Tech 3341, 3342, 3343 and 3344 between them they define a number of terms and set out the reasons behind many of the objectives of loudness measurements. Terminology The Loudness world includes a number of terms and abbreviations worth noting: Loudness Range (LRA) Loudness range is a statistic calculation of the material’s dynamic range based on the short term (sliding) loudness (3 secs). Loudness Range is abbreviated ‘LRA’. Momentary Loudness (M) Momentary loudness is the sum of the RLB weighted audio channels and integrated over 400ms. Momentary loudness is used to calculate short term and integrated loudness Momentary Loudness is abbreviated ‘M’. Short Term Loudness (S) Short term loudness is a 3 seconds integration of the momentary loudness. (10 and 30 seconds are also used in some standards/regions). Short Term Loudness is abbreviated ‘S’ Absolute Gated Integrated Loudness The absolute integrated loudness is a long term measurement (an integration over the entire material) based on the momentary loudness. It uses an absolute gate at -70LUFS/LKFS (M) which means that if the momentary loudness is getting under -70LUFS/LKFS then the measurement holds until the momentary loudness goes above. The absolute loudness is not used directly by the user, but is used to calculate the dynamic 33 gate. The dynamic gate is, according to ITU-R BS.1770-2, -10 LU below the absolute gated loudness. Dynamic Gated Integrated Loudness (I) The dynamic gated loudness is a long term measurement (an integration over the entire material) based on the momentary loudness. It uses a dynamic gate at -10 LU under (dB relative to) the absolute gated loudness which means that the measurement is on hold if the momentary loudness gets under the dynamic gate. It is always the last value of the dynamic gate which is used on the material. This means that it is necessary to include or exclude any material from the “past” if the dynamic gate is changing. This means that the dynamic gate is always -10 LU under (dB relative to) the end result of the dynamic gated loudness. The dynamic gate level may vary with local requirements. Dynamic Gated Integrated Loudness is abbreviated ‘I’ True Peak (TP) True peak measurements, not only looks at the actual samples, but also inter-sample peaks. This means that True Peak metering will indicate peaks that would potentially cause distortion when converter in e.g. digital-analogue converters, sample rate converters and data compression codecs. True peak is therefore a highly relevant tool when performing normalization of source material. DK-Tech approach LUFS, LKFS and LU The three LU, LUFS and LKFS are essentially addressing the same issue, which sometimes cause some confusion. LKFS is the K-weighted loudness scale and one unit on this scale is equal to one dB. LUFS is identical to LKFS. ITU-R BS.1770-2 and ATSC are using the terms LKFS, while EBU R128 are using LUFS – both are expressing the identical scale. 0 LUFS/LKFS is equal to 0 dBFs @ 1KHz according to ITU-R BS.1770-2 and EBU R128 (some recommendations may use 400Hz). LU stands for Loudness Unit, and is a scale relative to the chosen Reference level. 0 LU is equal to the reference level. The reference level will vary between the different Recommendations e.g. EBU R128 has 0 LU = -23 LUFS. One LU is equal to one dB 34 Other Relevant Info DK Meter Online Application (PC Software) The DK Meter Online Application may be used for updating software, installing software licensing as well as cloning your meter settings to another DK Meter. The DK Meter Online Application can be found on www.dktechnologies.com Connect your DK Meter to your computer (PC). Install DK Meter Online on your computer. You may experience the Windows security warning, in which case you simply hit ‘Run’. Once installed the DK Meter Online app. Will identify your meter and check for the newest available software for your meter. By hitting the Advanced button, you gain access to the Cloning (saving and loading from file) facility, as well as the ability to install a software license key that you may have acquired for your DK Meter. Signal connections Included Signal Cable The supplied cable harness has three BNC connectors. These allow three AES-3id digital audio signals to be connected to the 75 ohm inputs. Because each AES input is a dual channel path, up to six digital mono signals can be brought into the meter. These can be either 16 or 24 bits in depth and the intended sample rate is 48K. An internal matrix allows the required signals to be routed to the measurement and display system. SPDIF signals can also be connected and are accepted. The meter also has two balanced analogue inputs and if required, the matching cable may be acquired from DKTechnologies. D-Sub Connector Pin-out The 15 pin connector is shown from the wiring side of the cable mounted male connector. 35 Pins 5 and 13 are used for factory diagnostics only and it is essential they are left unwired.DK-Technologies A/S Page DK Meter Type Signal Pin Signal Type Pin AES 1 Signal 3 USB Data + 2 AES 2 Signal 4 USB Screen Shell AES 3 Signal 12 Analogoue L Hot 6 AES Ground 11 Analogue L Cold 14 USB 0V 1 Analogoue R Hot 8 USB +5V 9 Analogue R Cold 15 USB Data - 10 Analogue Ground 7 USB The USB connector is as seen looking into the end of the cable mounted connector that can connect to a computer. DK3 and DK4 meters The 15 pin D connector is still used for any available audio format inputs, power and data connections. The SDI video format signal input is on an internally terminated 75 ohm BNC connector. The other BNC provides a buffered loop through of the incoming signal which may be in SMPTE format 424M, 259M or 292M - SD or HD SDI signals at data rates up to 2.97 Gbit/sec (3G). 36 Specifications DK1 DK2 DK5 Meter Connector 15-pole D-Sub 15-pole D-Sub 15-pole D-Sub Analogue input 2 XLR input 2 XLR input 2 XLR input AES input 3 BNC (AES3-4-2009) 3 BNC (AES3-4-2009) 3 BNC (AES3-4-2009) SDI In - - BNC 3G/HD/SD SDI SDI Out - - Bit Resolution 24 bit 24 bit BNC 3G/HD/SD SDI (active loop through) 24 bit Group Delay 1.75msec 1.75msec 1.75msec Nominal input imp. 75 ohm 75 ohm 75 ohm S-rate int. /ext. 48kHz 48kHz 48kHz Input type Balanced (electronic) Balanced (electronic) Balanced (electronic) Dynamic range >103dB >103dB >103dB Crosstalk <96dB <96dB <96dB SNR typical 93dB relative to -1dBFS typical 93dB relative to -1dBFS typical 93dB relative to -1dBFS Nominal input Imp. >20kOhm >20kOhm >20kOhm Maximum input level 24dBu 24dBu 24dBu Freq. resp. 20Hz-20kHz +/-0.3dB +/-0.3dB +/-0.3dB Compliant with... ITU BS1770-3, EBU R128, A/85, ARIB ITU BS1770-3, EBU R128, A/85, ARIB ITU BS1770-3, EBU R128, A/85, ARIB Reference Level digital -12dBFS & -24dBFS -12dBFS & -24dBFS -12dBFS & -24dBFS Dynamic gate level -2LU dB to -20LU/Off -2LU dB to -20LU/Off -2LU dB to -20LU/Off Short term int. window 0 to 30 seconds 0 to 30 seconds 0 to 30 seconds Num. Loudness LRA LRA LRA True Peak Flying peak & Num. Flying peak & Num. Flying peak & Num. Peak thrs. / hold time -2dBFS / >0.5sec -2dBFS / >0.5sec -2dBFS / >0.5sec Consumption 350mA 350mA 350mA Power Supply Plugtop, 100-240V, 5VDC, 500mA May be powered from Computer or USB hub Plugtop, 100-240V, 5VDC, 500mA May be powered from Computer or USB hub Plugtop, 100-240V, 5VDC, 500mA May be powered from Computer or USB hub Audio Connectors Video Connectors Analogue Input Loudness Power 37