1
Technical Documentation Hand-held Analyzer Types 2250 and 2270 With Sound Level Meter Software BZ-7222, Frequency Analysis Software BZ-7223, Logging Software BZ-7224, Enhanced Logging Software BZ-7225, Signal Recording Option BZ-7226, Reverberation Time Software BZ-7227, 2-channel Option BZ-7229 Tone Assessment Option BZ-7231 and Low Frequency Option BZ-7234 HEADQUARTERS: Brüel & Kjær Sound & Vibration Measurement A/S · DK-2850 Nærum · Denmark Telephone: +45 7741 2000 · Fax: +45 4580 1405 · www.bksv.com · [email protected] Local representatives and service organisations worldwide ËBE-1713---|Î User Manual English BE 1713 – 30 Hand-held Analyzer Types 2250 and 2270 with Sound Level Meter Software BZ-7222, Frequency Analysis Software BZ-7223, Logging Software BZ-7224, Enhanced Logging Software BZ-7225, Signal Recording Option BZ-7226, Reverberation Time Software BZ-7227, 2-channel Option BZ-7229, Tone Assessment Option BZ-7231 and Low Frequency Option BZ-7234 User Manual Valid for all hardware versions and from software version 4.4 BE 171330 2015 Safety Considerations This apparatus has been designed and tested in accordance with EN/IEC 61010 – 1 and ANSI/UL 61010 – 1 Safety Requirements for Electrical Equipment for Measurement, Control and Laboratory Use. This manual contains information and warnings which must be followed to ensure safe operation and to retain the apparatus in safe condition. Special note should be made of the following: Safety Symbols The apparatus will be marked with this symbol when it is important that you refer to the associated warning statements given in the manual. Protective Earth Terminal Hazardous Voltage Explosion Hazard The equipment is not designed to be used in potentially explosive environments. It should not be operated in the presence of flammable liquids or gases. Warnings • • • Switch off all power to equipment before connecting or disconnecting their digital interface. Failure to do so could damage the equipment. Whenever it is likely that the correct function or operating safety of the apparatus has been impaired, it must be made inoperative and be secured against unintended operation. Any adjustment, maintenance and repair of the open apparatus under voltage must be avoided as far as possible and, if unavoidable, must be carried out only by trained service personnel. • Do not dispose of electronic equipment or batteries as unsorted municipal waste • It is your responsibility to contribute to a clean and healthy environment by using the appropriate local return and collection systems • Hazardous substances in electronic equipment or batteries may have detrimental effects on the environment and human health • The symbol shown to the left indicates that separate collection systems must be used for any discarded equipment or batteries marked with that symbol • Waste electrical and electronic equipment or batteries may be returned to your local Brüel & Kjær representative or to Brüel & Kjær Headquarters for disposal Trademarks Microsoft, Windows, Internet Explorer, Hotmail and Excel are registered trademarks of Microsoft Corp. · PCL is a registered trademark of the Hewlett-Packard Company · Google Maps and Chrome are trademarks of Google Inc. · Mozilla and Firefox are registered trademarks of the Mozilla Foundation · Apple, Safari and iPhone are registered trademarks of Apple Inc. · Intel is a registered trademark and Core a trademark of Intel Corp. · Go Wi-Fi! is a registered trademark of Socket Mobile, Inc. · Airlink and Sierra Wireless are registered trademarks of Sierra Wireless · JavaScript is a registered trademark of Sun Microsystems Inc. Copyright 2004 – 2015, Brüel & K jær Sound & Vibration Measurement A/S All rights reserved. No part of this publication may be reproduced or distributed in any form, or by any means, without prior written consent from Brüel & Kjær Sound & Vibration Measurement A/S, Nærum, Denmark Table of Contents CHAPTER 1 Introduction......................................................................................................... 1 1.1 1.2 Welcome .............................................................................................................. How to Use this Manual ....................................................................................... Conventions Used in this Manual ........................................................................ Beginners............................................................................................................. Experienced Users of Acoustic Measurement Equipment................................... 1 1 1 2 2 CHAPTER 2 Assembling your Analyzer ............................................................................... 3 2.1 2.2 2.3 2.4 2.5 Determining Your Hardware Version ................................................................... 3 What is Different with G4 Hardware? .................................................................. 3 Analyzer Components.......................................................................................... 4 Analyzer Inputs/Outputs....................................................................................... 7 Description of Inputs and Outputs........................................................................ 9 Hardware Setup ................................................................................................. 13 Assembling the Analyzer ................................................................................... 14 Charging the Battery for the First Time.............................................................. 14 Making Good Measurements............................................................................. 14 Alternative Measurement Method (Extended Microphone)................................ 16 Measuring for Convenience ............................................................................... 17 Measuring Using Accelerometers ...................................................................... 17 CHAPTER 3 Making your First Measurement ..................................................................... 19 3.1 3.2 3.3 3.4 3.5 3.6 Introduction ........................................................................................................ Point and Shoot ................................................................................................. Congratulations!................................................................................................. Making a Measurement ..................................................................................... What is a Project Template?.............................................................................. Switching On...................................................................................................... Set the Sound Level Meter Project Template .................................................... Save your Measurement.................................................................................... Viewing the Saved Measurement ...................................................................... Document your Measurement............................................................................ Switching Off...................................................................................................... 19 19 20 20 20 21 21 25 26 26 30 CHAPTER 4 Getting to Know Your Analyzer....................................................................... 31 4.1 4.2 4.3 4.4 What is a Sound Level Meter?........................................................................... What is the Hand-held Analyzer? ...................................................................... Sound Level Meter Software Module BZ-7222 .................................................. Frequency Analysis Software Module BZ-7223................................................. Logging Software Module BZ-7224 ................................................................... Enhanced Logging Software Module BZ-7225 .................................................. Signal Recording Option BZ-7226 ..................................................................... Reverberation Time Software BZ-7227 ............................................................. 2-channel Option BZ-7229 (Type 2270 only)..................................................... Tone Assessment Option BZ-7231.................................................................... Low Frequency Option BZ-7234 ........................................................................ Built-in Help........................................................................................................ What is Measurement Partner Suite BZ-5503? ................................................. Basic Principles when using the Analyzer ......................................................... Navigation Principles – ‘Star’ Navigation Concept............................................. The Display Screen............................................................................................ Use of Pushbuttons for Controlling Measurements ........................................... On-screen Feedback and Traffic Light............................................................... Use of Stylus and Navigation Pushbuttons........................................................ How to Change Parameter Values .................................................................... How to Personalise your Setup.......................................................................... How to Manage the Project Templates.............................................................. Locking the Pushbuttons and Display................................................................ 31 32 32 33 34 34 34 34 34 35 35 35 36 36 36 40 42 43 44 44 46 47 49 CHAPTER 5 Calibration......................................................................................................... 51 5.1 5.2 5.3 5.4 5.5 5.6 5.7 5.8 5.9 5.10 Introduction ........................................................................................................ Acoustic Calibration ........................................................................................... Sound Level Calibration..................................................................................... Standard Calibration .......................................................................................... Calibration Settings............................................................................................ Vibration Calibration........................................................................................... Electrical Calibration .......................................................................................... Manual Calibration ............................................................................................. Calibration History.............................................................................................. Transducer Database ........................................................................................ Calibration Reminder ......................................................................................... Charge Injection Calibration............................................................................... Theory of CIC..................................................................................................... Performing a Manual CIC with your Type 2250/2270 ........................................ 51 51 51 52 53 54 54 54 54 55 57 58 58 59 CHAPTER 6 Data Management............................................................................................. 61 6.1 6.2 6.3 Organising Measurements................................................................................. Description of Jobs and Projects ....................................................................... Navigating in Jobs.............................................................................................. Selecting Default Measurement Job/Path.......................................................... Recalling Measurements ................................................................................... Viewing Data and Re-using Setups from Projects ............................................. Viewing or Listening to Annotations and Metadata............................................ 61 61 62 63 64 64 64 CHAPTER 7 Connection to PC or Smart Phone.................................................................. 67 7.1 7.2 7.3 7.4 Introduction ........................................................................................................ Transferring Measurement Data to Your PC ..................................................... Connect to Your PC ........................................................................................... Post-processing and Reporting.......................................................................... Internet Browser for Online Display and Control of the Analyzer....................... 67 68 69 69 69 CHAPTER 8 Advanced Use of the Analyzer – Tips and Tricks.......................................... 73 8.1 8.2 8.3 8.4 8.5 8.6 8.7 Setting your Preferences on the Analyzer ......................................................... Display Settings ................................................................................................. Power Settings................................................................................................... Regional Settings............................................................................................... Storage Settings ................................................................................................ Headphone Settings .......................................................................................... Multi-user Facility ............................................................................................... Printer Settings .................................................................................................. Modem/DynDNS Settings .................................................................................. Connection to the Network using a LAN Modem ............................................... Connection to Network using GPRS/EDGE/HSPA Modem............................... DynDNS ............................................................................................................. Network Settings................................................................................................ Connecting to the Analyzer................................................................................ Parameters in Network Settings ........................................................................ Notifications ....................................................................................................... Alarm Settings.................................................................................................... Text/SMS Notifications....................................................................................... E-mail Notifications ............................................................................................ Web Server ........................................................................................................ Password Protection .......................................................................................... Connecting to Weather Stations and GPS Receivers........................................ Weather Stations ............................................................................................... GPS Receivers .................................................................................................. Preparing your Measurements........................................................................... Metadata ............................................................................................................ Timers and Automatic Measurements ............................................................... 73 74 75 76 77 78 79 79 80 80 81 82 83 84 84 86 86 88 89 90 90 90 90 91 92 92 94 CHAPTER 9 Updating and Upgrading Applications,Maintenance, Calibration and Troubleshooting........................................................................................ 97 9.1 9.2 9.3 9.4 9.5 9.6 How to Install New Applications......................................................................... 97 How to Update/Upgrade Applications and Install New Languages.................... 97 Update/Upgrade using BZ-5503 ........................................................................ 98 Update through the Internet ............................................................................... 98 Downgrade to an Earlier Version ..................................................................... 100 How to Move a License.................................................................................... 100 Troubleshooting ............................................................................................... 100 Measurements ................................................................................................. 100 SD/CF Cards and USB Sticks.......................................................................... 101 Battery Pack and Recalibration of Battery Charge Indicator............................ 102 Touch Screen................................................................................................... 103 Reset Options .................................................................................................. 103 Care, Cleaning and Storage ............................................................................ 106 Handling the Analyzer...................................................................................... 106 Cleaning the Analyzer...................................................................................... 106 Storing the Analyzer......................................................................................... 106 Services at Brüel & Kjær for Types 2250 and 2270......................................... 107 Accredited Calibration...................................................................................... 107 Initial Calibration .............................................................................................. 107 Regular Recalibration ...................................................................................... 107 Filter Calibration............................................................................................... 107 Service and Repair .......................................................................................... 107 Hardware Maintenance and Repair ................................................................. 107 Rental............................................................................................................... 108 Training ............................................................................................................ 108 CHAPTER 10 1/1- or 1/3-octave Frequency Analysis (Optional Module).......................... 109 10.1 10.2 10.3 10.4 Setting up the Analyzer.................................................................................... Controlling the Measurement........................................................................... Displaying the Results ..................................................................................... Smileys ............................................................................................................ Saving Results ................................................................................................. 109 110 111 115 115 CHAPTER 11 Logging (Optional Module)............................................................................ 117 11.1 11.2 Setting up the Analyzer.................................................................................... Controlling the Measurement........................................................................... Annotating a Project......................................................................................... Recording the Signal........................................................................................ 118 121 121 122 11.3 11.4 Displaying the Results ..................................................................................... The Profile View............................................................................................... Marking Sound Categories .............................................................................. Editing Markers on Profiles .............................................................................. Annotate Sound Categories............................................................................. Editing Annotations on Profiles ........................................................................ Saving and Recalling Results .......................................................................... 122 122 125 127 128 128 129 CHAPTER 12 Enhanced Logging (Optional Module).......................................................... 131 12.1 12.2 12.3 Setting up the Analyzer.................................................................................... Controlling the Measurement........................................................................... Annotating a Project......................................................................................... Recording the Signal........................................................................................ Displaying the Results ..................................................................................... The Profile View............................................................................................... Displaying Noise Indicators.............................................................................. Saving and Recalling Results .......................................................................... 132 133 134 134 134 135 135 136 CHAPTER 13 Signal Recording Option ............................................................................... 137 13.1 13.2 Sound Level Meter and Frequency Analysis Software .................................... Setting up the Analyzer.................................................................................... Controlling the Recording ................................................................................ Playing the Recording...................................................................................... Logging and Enhanced Logging Software ....................................................... Setting up the Analyzer.................................................................................... Controlling the Recording ................................................................................ Control Recording using the Stylus.................................................................. Playing the Recording...................................................................................... Signal Recordings on the PC........................................................................... 137 138 139 140 140 140 141 142 143 145 CHAPTER 14 Reverberation Time Software (Optional Module) ........................................ 147 14.1 14.2 Introduction ...................................................................................................... Definition .......................................................................................................... How Do We Measure Reverberation Time? .................................................... Setting up the Analyzer.................................................................................... Interrupted Noise Method ................................................................................ Impulsive Method............................................................................................. Signal Recording.............................................................................................. Controlling the Measurement........................................................................... Serial Measurements ....................................................................................... Annotating Projects and Positions ................................................................... 147 147 148 151 152 152 152 153 153 154 14.3 14.4 14.5 14.6 Displaying the Results ..................................................................................... Overview .......................................................................................................... Spectrum.......................................................................................................... Decay............................................................................................................... Measurements with Graphical Position Management...................................... Quality Indicators ............................................................................................. Saving and Recalling Results .......................................................................... 155 155 157 159 161 165 166 CHAPTER 15 Tone Assessment Option BZ-7231 – 1/3-octave Method............................ 167 15.1 15.2 15.3 15.4 15.5 15.6 15.7 15.8 15.9 General ............................................................................................................ Tone Assessment According to ISO 1996-2, Annex D .................................... ISO 1996-2, Annex D – Tone Assessment Calculations ................................. Tone Assessment According to Italian Law ..................................................... Setting up the Analyzer.................................................................................... Selecting the Tone Assessment Option........................................................... Setting up a Measurement Manually ............................................................... Setting up the Measurement using the Default Setup ..................................... Signal Recording.............................................................................................. Measuring ........................................................................................................ Result Display .................................................................................................. Logging Software BZ-7224 Template .............................................................. Enhanced Logging Software BZ-7225 Template ............................................. Status Codes (Smileys) ................................................................................... Recalling Saved Measurements ...................................................................... 167 168 168 170 171 171 172 173 174 175 175 176 177 177 178 CHAPTER 16 2-channel Option BZ-7229 ............................................................................. 179 16.1 16.2 16.3 16.4 16.5 16.6 16.7 General ............................................................................................................ Connecting Transducers.................................................................................. Range Setting .................................................................................................. Underrange/Overload ...................................................................................... Setting Up 2-channel Sound Level Meter ........................................................ Controlling the Measurement........................................................................... Displaying the Results ..................................................................................... Saving Results ................................................................................................. Setting Up 2-channel Frequency Analyzer ...................................................... Controlling the Measurement........................................................................... Displaying the Results ..................................................................................... Saving Results ................................................................................................. Setting Up 2-channel Logging and Enhanced Logging.................................... Controlling the Measurement........................................................................... Displaying the Results ..................................................................................... Saving Results ................................................................................................ Setting Up 2-channel Signal Recording ........................................................... 179 180 180 181 181 182 182 183 183 184 184 185 186 187 187 187 187 CHAPTER 17 Low Frequency Option BZ-7234.................................................................... 189 17.1 17.2 17.3 17.4 17.5 Sound Measurements and G-weighting........................................................... Setting up the Analyzer for G-weighting .......................................................... Controlling the Measurement........................................................................... Displaying the Results ..................................................................................... Building Vibration Measurements .................................................................... Setting up the Analyzer for Building Vibration Measurements......................... Controlling the Measurement........................................................................... Displaying the Results ..................................................................................... Setting Up the Frequency Analyzer Module for Very Low Frequencies .......... Controlling the Measurement........................................................................... Displaying the Results ..................................................................................... Saving Results ................................................................................................. 189 190 192 192 193 194 195 195 195 196 196 197 CHAPTER 18 Specifications ................................................................................................. 199 APPENDIX A Setup Parameters ........................................................................................... 221 A.1 A.2 A.3 A.4 A.5 A.6 A.7 A.8 A.9 A.10 A.11 A.12 A.13 A.14 A.15 A.16 A.17 A.18 A.19 Input ................................................................................................................. Frequency Settings .......................................................................................... Statistics........................................................................................................... Measurement Control – for BZ-7222 to BZ-7225............................................. Measurement Control – for Reverberation Time Software BZ-7227................ Logged Broadband (100 ms) ........................................................................... Logged Broadband .......................................................................................... Logged Spectrum............................................................................................. Markers ............................................................................................................ Level Trigger .................................................................................................... Triggers............................................................................................................ Units................................................................................................................. Signal Recording.............................................................................................. Output Socket Signal ....................................................................................... Lden Periods ..................................................................................................... Occupational Health......................................................................................... Generator......................................................................................................... Post-processing ............................................................................................... Tone Assessment ............................................................................................ 222 224 226 227 229 231 231 233 234 235 237 240 241 245 246 246 248 249 251 APPENDIX B Measurement Parameters.............................................................................. 253 B.1 B.2 Total Measurement (Microphone Input)........................................................... For Sound Level Meter Software BZ-7222, Frequency Analysis Software BZ-7223, Logging Software BZ-7224 and Enhanced Logging Software BZ-7225 ........................................................................................................... Periodic Reports (Microphone Input) ............................................................... For Enhanced Logging Software BZ-7225....................................................... 254 254 257 257 B.3 B.4 B.5 B.6 B.7 Logged Measurement (Microphone Input)....................................................... For Logging Software BZ-7224 and Enhanced Logging Software BZ-7225.... Logged (100 ms) Measurement (Microphone Input)........................................ For Logging Software BZ-7224 and Enhanced Logging Software BZ-7225 ............................................................................................ Instantaneous Measured Parameters (available at any time; Microphone Input) ........................................................ Processed Parameters for Display Only (Microphone Input)........................... Total Measurement (Accelerometer and Direct Input) ..................................... For Sound Level Meter Software BZ-7222, Frequency Analysis Software BZ-7223, Logging Software BZ-7224 and Enhanced Logging Software BZ-7225 ............................................................................................ Periodic Reports (Accelerometer or Direct input) ............................................ Logged Measurement (Accelerometer or Direct input) .................................... Logged (100 ms) Measurement (Accelerometer or Direct input)..................... Instantaneous Measured Parameters (Available at Any Time; Accelerometer or Direct input) ......................................................................... Relationship Between Setup and Measurement Parameters .......................... Reverberation Time Measurement .................................................................. For Reverberation Time Software BZ-7227 ..................................................... 260 260 262 262 263 264 264 264 266 267 268 268 269 272 272 APPENDIX C Analyzer Parameters ...................................................................................... 273 C.1 C.2 C.3 C.4 Current Transducer.......................................................................................... Transducer Database ...................................................................................... Transducer Setup ............................................................................................ Calibration History............................................................................................ Calibration Setup ............................................................................................. Type 2250/2270 Microphones ......................................................................... 273 274 274 276 277 278 APPENDIX D Preferences ..................................................................................................... 281 D.1 D.2 D.3 D.4 D.5 D.6 D.7 D.8 D.9 D.10 D.11 D.12 D.13 Display Settings ............................................................................................... Power Settings................................................................................................. Regional Settings............................................................................................. Storage Settings .............................................................................................. Headphone Settings ........................................................................................ Users................................................................................................................ Printer Settings ................................................................................................ Modem/DynDNS Settings ................................................................................ Network Settings.............................................................................................. Notification Settings ......................................................................................... Remote Access Settings.................................................................................. Image Settings (Type 2270 only) ..................................................................... NMT Server Settings (Hardware Version 4 only)............................................. 281 282 283 284 284 286 286 287 288 290 293 294 294 APPENDIX E Glossary .......................................................................................................... 295 INDEX ................................................................................................................. 307 1 Chapter 1 Introduction 1.1 Welcome This manual describes Type 2250 Hand-held Analyzer and Type 2270 Hand-held Analyzer platforms, including: • Sound Level Meter Software BZ-7222 • Frequency Analysis Software BZ-7223 • Logging Software BZ-7224 • Enhanced Logging Software BZ-7225 • Signal Recording Option BZ-7226 • Reverberation Time Software BZ-7227 • 2-channel Option BZ-7229 • Tone Assessment Option BZ-7231 • Low Frequency Option BZ-7234 The manual explains how to perform a basic sound measurement, which parameters you can measure and how the hand-held analyzer should be operated. In addition, some practical hints and guidelines are provided, including all relevant technical specifications. Finally, a glossary is added to help with specific terminology found in this manual. This manual is intended for all hardware versions (from 1 to 4). All hardware versions support the latest application software covered in this manual. 1.2 How to Use this Manual 1.2.1 Conventions Used in this Manual “Analyzer” refers to Type 2250 or Type 2270 if the description is valid for both types. Instructions and descriptions that refer to the analyzer pushbuttons are shown with the pushbutton icons as seen on the analyzer. See Chapter 2 for a list of pushbutton icons and their functions. Hand-held Analyzer Types 2250 and 2270 – User Manual 2 Icons, Buttons and Tabs Used on the Screen Indicated by bold type face (for example, tap the Main Menu icon). Parameter Text Appearing on the Screen Parameters, instructions and descriptions appearing on the screen are indicated by italics (for example, Measurement Mode). Path Denotations Indicated by capitals (for example, SETUP\BZ7222\). Menu/Screen Navigation Indicated by italics (for example, Setup > Frequency Settings > BB Peak). 1.2.2 Beginners Before you read the rest of this manual, read Brüel & Kjær’s primer on Measuring Sound. This will give you a basic idea of acoustic measurements. It can be found on the www.bksv.com website, by typing ‘Primer’ in the search window. The website also contains lots of other information you might find useful. Further information is available in the online help installed on the analyzer. 1.2.3 Experienced Users of Acoustic Measurement Equipment The manual is designed so that you don’t have to read all of it to be able to use the analyzer. It is built around the most frequently used operations, these are as follows: • Assembling your Analyzer (see Chapter 2) • Making your First Measurement (see Chapter 3) • Calibration (see Chapter 5) • Getting to Know Your Analyzer (see Chapter 4) • Data Management (see Chapter 6) • Connection to PC or Smart Phone (see Chapter 7) • Advanced Use of the Analyzer – Tips and Tricks (see Chapter 8) • Updating and Upgrading Applications, Maintenance and Troubleshooting (see Chapter 9) However, it is recommended that you read the entire manual for appropriate procedures on how to use the analyzer to obtain accurate sound level measurement results. 3 Chapter 2 Assembling your Analyzer This chapter describes how to assemble and set up your analyzer. It provides a brief description and an associated diagram showing the analyzer components and the various input and output connections. This enables you to start getting familiar with the analyzer, while assembling your system. This is followed by an overview of the hardware components, showing all the main configurations of the analyzer and its accessories. Finally, instructions are provided that explain how to assemble standard and optional hardware components used in your system. Once you have followed the assembly instructions, your hand-held analyzer will be ready to make measurements. 2.1 Determining Your Hardware Version Over the years, the analyzer hardware has had a few updates. The most significant update happened in 2012 with the introduction of hardware version 4 (also known as G4). To check if your analyzer uses G4 hardware, click in the Shortcut Bar at the bottom of the display screen, and select About. The About screen will list the hardware and software versions currently installed. 2.1.1 What is Different with G4 Hardware? The differences in the G4 hardware compared to previous versions include: • A brighter screen which is easier to view in direct sunlight • The CF card slot is removed and replaced by a second SD card slot to take advantage of the SD format’s dominance in the storage and Wi-Fi markets • The USB connector changed from USB 1.1 Mini B to USB 2.0 Micro AB. Besides the faster connection speeds of USB 2.0, the Micro USB connector is more common • A second standard USB Type A socket was added for easier connection to USB peripherals like modems, printers, GPS receivers, and USB to RS–232 adaptors • A 100 Mbps LAN connector is available for both Types 2250 and 2270 Hand-held Analyzer Types 2250 and 2270 – User Manual 4 2.2 Analyzer Components An overview of the main analyzer components is provided in Fig.2.1 and the text below. Fig.2.1 Analyzer components 1 2 17 22 3 4 15 16 5 6 8 10 7 9 19 11 20 12 13 24 14 18 21 23 CHAPTER 2 Assembling your Analyzer 5 1) Measurement Microphone: A Brüel & Kjær Prepolarized Free-field ½ Microphone is used. A robust and reliable microphone with a wide frequency range. 2) Preamplifier: Used to convert the high-impedance output of the microphone to low impedance, suitable for driving long extension cables. The arrow points to the preamplifier’s built-in windscreen sensor 3) (Manual Event Pushbutton): This allows you to manually indicate events during a measurement. Using BZ-7222 and BZ-7223 software you can control signal recording (this requires a license for the BZ-7226 option), and using BZ-7224 Logging Software or BZ-7225 Enhanced Logging Software you can insert an Event Marker and control recordings (the latter requires a license for the BZ-7226 option). In Type 2270 this button can also be used to capture images. 4) (Commentary Pushbutton): This allows you to add recorded audio messages to your measurement files. 5) , , , (Navigation Pushbuttons): These move the active screen component (Field Selector) and navigate the user interface. 6) (Back-erase Pushbutton): This allows you to erase the last 5 seconds of measurement data or to insert an Exclude Marker (BZ-7224 Logging Software or BZ-7225 Enhanced Logging Software only). 7) (Accept Pushbutton): This allows you to accept any changes you make to the analyzer’s setup. 8) (Reset Measurement Pushbutton): This allows you clear the current measurement from the screen. 9) (Start/Pause/Continue Pushbutton): Press this to start, pause or continue with a measurement. 10) (Status Indicator): The red, yellow or green lights, (or LEDs), referred to as the ‘Traffic Light’ either side of the Start/Pause pushbutton, indicate important states of the analyzer during operation, that is, measurement stopped, paused or running. See Chapter 4 for further details. 11) (Save Pushbutton): This allows you to save measurement results. 12) Display Screen: A high-contrast, colour, touch-sensitive screen. 13) (Main Menu Icon): This calls up the Main Menu, which allows you to navigate immediately to all the main functions of the analyzer, such as Setup, Explorer (or Databrowser), Preferences, and the Calibration procedure. 14) (Power-on Pushbutton): Turns the analyzer on and off. If held in for 1 second, the analyzer goes into standby mode; if held in for more than 4 seconds, it turns the analyzer off. 15) Stylus: Stored in a holder on the side of the analyzer, for use on the touch-sensitive screen. You can choose to use the stylus or the hardkeys, depending on your preference and the measurement situation. (Also see section 4.4.5.) 6 Hand-held Analyzer Types 2250 and 2270 – User Manual 16) Secondary Microphone: This is used to add recorded comments to measurements and is positioned on the underside of the analyzer. 17) Top Socket: This is the main microphone input socket for the analyzer. The measurement microphone and preamplifier (items 1 and 2 respectively) are normally connected directly to this socket. For more details see section 2.3. 18) Tripod Mounting Thread: Use this to mount the analyzer onto the tripod and/or tripod extension. 19) Wrist Strap/Tripod Mounting Thread: Use this to attach the wrist strap to the analyzer for added security, or use it to mount the analyzer onto the tripod and/or tripod extension using Tripod Adaptor UA-1673. 20) Internal Battery Pack: Rechargeable, high-capacity Li-Ion battery pack to power the analyzer. 21) Hinged Cover FB-0679/FB-0699: A removable plastic cover is provided, which is hinged at the top to provide protection for the connector panel underneath. To remove, open the cover and pull the hinge out of the slot at the top of the connector panel. The cover includes a rubber insert printed with an overview of the main connectors and reset button for easy recognition. Indents are provided on the inside of the cover (behind the insert) that allow you to drill holes in the plastic cover, giving access to the main connectors underneath, so you can use the cover while power or other cables are connected. 22) Camera (Type 2270 only): This feature is used to add images to measurements. Protected and positioned on the underside at 45 degrees, this is designed to allow simultaneous image capture and noise measurement without the need to reposition the analyzer for each task. 23) High Speed USB and LAN Interfaces: – Hardware versions 1 – 3: Available in Type 2270 only – Hardware version 4 (G4): Available in both Types 2250 and 2270 This is used to provide fast and seamless transfer of data, recordings and photographs back to the office. Both high-speed interfaces, USB or LAN, can be used when the analyzer is located in close proximity to the PC. However, if the analyzer is remote from the host PC, the LAN interface has the further advantage of data download from anywhere within the same LAN network. Both interfaces are not just used for data download, but also for remote monitoring and remote control. 24) G4 Mark: Indicates that the hardware is version 4. Without this mark, your hardware is an earlier version CHAPTER 2 Assembling your Analyzer 2.3 7 Analyzer Inputs/Outputs Hardware Versions 1 – 3: Fig.2.2 Connector panel of Type 2270 with hardware versions 1 – 3 8 1 2 3 12 4 9 11 5 10 6 7 1) Mini USB Interface Socket: Use the supplied Mini USB Cable AO-1476 to connect. 2) Earphone Socket: Use the supplied Earphones HT-0015 to connect 3) Output Socket: A triaxial LEMO connector – use the supplied LEMO to BNC cable AO-0440-D-015 to connect 4) Trigger and Tacho Input Socket: A triaxial LEMO connector – use the supplied LEMO to BNC cable AO-0440-D-015 to connect. For tacho probe connection, other cables may be used – see section 2.3.1 for more information 5) Input Socket (or for Type 2270 only, Input Ch.2 Socket): A triaxial LEMO connector –depending on the transducer used, a number of cables are available for connection. See section 2.3.1 for more information 6) External Power Socket: Use Mains Power Supply ZG-0426 to connect and charge batteries 7) Battery Charge Indicator: An LED that indicates when the battery pack is being charged from external power. See section 2.3.1 for more information on the LED colour codes Hand-held Analyzer Types 2250 and 2270 – User Manual 8 8) Reset Button: Press to reset the analyzer if you have problems 9) Compact Flash Card Slot: Insert a CF memory card to save data or connect a modem (either a compact flash modem or using an CF to Serial converter) 10) Secure Digital Card Slot: Insert a SD or SDHC memory card to save data 11) (Type 2270 only) Input Ch.1 Socket: A triaxial LEMO connector – depending on the transducer used, a number of cables are available for connection. See section 2.3.1 for more information 12) (Type 2270 only) LAN Socket: Connect a LAN cable to synchronise measurement and setup data with a host PC over a Local Area Network Hardware Version 4: Fig.2.3 Connector panel of Type 2270 for G4 hardware 8 1 2 3 10 12 4 11 5 9 6 7 1) Micro USB Interface Socket: Use the supplied Micro USB Cable AO-1494 to connect 2) Earphone Socket: Use the supplied Earphones HT-0015 to connect 3) Output Socket: A triaxial LEMO connector – use the supplied LEMO to BNC cable AO-0440-D-015 to connect 4) Trigger and Tacho Input Socket: A triaxial LEMO connector – use the supplied LEMO to BNC cable AO-0440-D-015 to connect. For tacho probe connection, other cables may be used – see section 2.3.1 for more information CHAPTER 2 Assembling your Analyzer 9 5) Input Socket (or for Type 2270 only: Input Ch.2 Socket): A triaxial LEMO connector –depending on the transducer used, a number of cables are available for connection. See section 2.3.1 for more information 6) External Power Socket: Use Mains Power Supply ZG-0426 to connect and charge batteries 7) Battery Charge Indicator: An LED that indicates when the battery pack is being charged from external power. See section 2.3.1 for more information on the LED colour codes 8) Reset Button: Press to reset the analyzer if you have problems 9) Secure Digital Card Slots Insert a SD or SDHC memory card to save data 10) LAN Socket: Connect a LAN cable to synchronise measurement and setup data with a host PC over a Local Area Network 11) USB A Socket: Connect to printers or other external USB devices 12) (Type 2270 only) Input Ch.1 Socket: A triaxial LEMO connector – depending on the transducer used, a number of cables are available for connection. See section 2.3.1 for more information 2.3.1 Description of Inputs and Outputs Top Socket See item 17 in Fig. 2.1. This 10-pin LEMO connector is the main microphone input for the analyzer. Microphone Type 4189 (including Preamplifier ZC-0032) is normally connected directly to this connector. If required, however, one of two microphone extension cables (AO-0697-D-030, 3 m, or AO0697-D-100, 10 m), can be fitted between the input stage and the main microphone input socket, to extend the distance to the desired length. For Type 2270, the microphone is connected to input Channel 1. In addition, you can use the Dual 10-pole Adaptor JP-1041 for accessing both input Channel 1 and input Channel 2. USB Interface See item 1 in Fig. 2.2 (hardware versions 1 – 3) or Fig. 2.3 (hardware version 4). The USB Interface provides high-speed direct communication with your PC’s USB port to synchronize measurement and setup data. – Hardware versions 1 – 3: Use the supplied Mini USB Cable AO-1476 – Hardware version 4 (G4): Use the supplied Micro USB Cable AO-1494 10 Hand-held Analyzer Types 2250 and 2270 – User Manual Connect to a Printer via USB For hardware versions 1 – 3, use the supplied Adaptor AO-0657 to connect to a printer that supports PCL language via the USB socket. For hardware version 4 (G4), use the standard USB Type A socket (see item 13 in Fig.2.3) on the analyzer to connect to printers or other external USB devices. See section 8.1.7 for more information printer setup. Earphone Socket See item 2 in Fig. 2.2 (hardware versions 1 – 3) or Fig.2.3 (hardware version 4). The 3.5 mm minijack earphone socket enables the analyzer to be connected to a set of headphones/earphones, for reviewing recorded comments or for monitoring the measured sound. Use the supplied earphones, HT-0015. Output See item 3 in Fig. 2.2 (hardware versions 1 – 3) or Fig.2.3 (hardware version 4). This triaxial LEMO connector is used to output the conditioned input signal, for monitoring purposes, or to output the generator signal. Use cable AO-0440-D-015 (LEMO to BNC). Trigger and Tacho Input See item 4 in Fig. 2.2 (hardware versions 1 – 3) or Fig.2.3 (hardware version 4). This triaxial LEMO connector is used for the external trigger input, or start/stop signals to the analyzer, or for monitoring an external voltage. Using BZ-7222, BZ-7223, BZ-7224 or BZ7225 software you can control signal recording (this requires a license for the BZ-7226 option). If you want to start and stop the recording using an external device, connect it to this input. See details in Appendix A. Using FFT Analysis Software BZ-7230, this triaxial LEMO connector can also be used for speed measurements with Tacho Probe MM-0360 or other external tachometer signal. To connect a tacho probe, use one of the following cables: • AO-0440-D-015: LEMO to BNC plug, 1.5 m • AO-0727-D-010: LEMO to BNC jack, 1.0 m • AO-0726-D-030: LEMO to SMB, 3.0 m (recommended with MM-0360) CHAPTER 2 Assembling your Analyzer 11 Input 1 or Rear Socket Channel 1 (Type 2270 only) See item 11 in Fig. 2.2 (hardware versions 1 – 3) or Fig.2.3 (hardware version 4). This triaxial LEMO connector is used for AC or CCLD inputs to Channel 1. It can be used when analysing electrical signals, from (for example) transducers or signal recordings. Use one of the following cables: • AO-0440-D-015: LEMO to BNC plug, 1.5 m • AO-0727-D-010: LEMO to BNC jack, 1.0 m • AO-0701-D-030: Accelerometer cable, LEMO to M3, 3.0 m • AO-0702-D-030: Accelerometer cable, LEMO to 10–32 UNF, 3.0 m • AO-0722-D-050: Accelerometer cable, LEMO to MIL-C-5015, 5.0 m Input (Input Ch.2 or Rear Socket Channel 2 for Type 2270) See item 5 in Fig. 2.2 (hardware versions 1 – 3) or Fig. 2.3 (hardware version 4). This triaxial LEMO connector is used for AC or CCLD inputs to Type 2250 or to Channel 2 of Type 2270. It can be used when analysing electrical signals, from (for example) transducers or signal recordings. Use one of the cables listed under Input 1. External Power See item 6 in Fig. 2.2 (hardware versions 1 – 3) or Fig. 2.3 (hardware version 4). The analyzer is powered by an internal rechargeable battery pack. An indication of available charge is shown by the battery icon at the bottom of the screen. If the charge remaining is low or empty, the batteries can be recharged by connecting Mains Power Supply ZG-0426 to the ‘Ext. Power’ socket. When the power supply lead is connected, the icon will be displayed in place of the battery icon. CAUTION: Use specified battery charger only. Charging below 0 °C (32 °F) is not recommended. Note: If you charge the battery pack below 0 °C, the lifetime of the batteries will be reduced. Do not charge battery pack in temperatures above 60 °C. Do not disassemble or expose battery pack to fire or water. Battery Charge Indicator See item 7 in Fig. 2.2 (hardware versions 1 – 3) or Fig. 2.3 (hardware version 4). A battery charge light (LED) indicates when the battery pack is being charged from external power: • With hardware versions 1 – 3: The LED is a steady green light when external power is applied (and the battery is charging), and a flashing green light when charging has finished • With hardware version 4 (G4): The LED is red when external power is applied (and the battery is charging); green when the battery is completely charged; and blue to indicate that the unit is in stand-by and battery powered 12 Hand-held Analyzer Types 2250 and 2270 – User Manual Reset Button See item 8 in Fig. 2.2 (hardware versions 1 – 3) or Fig.2.3 (hardware version 4). Located above the USB connector, it is used to reset the analyzer if you have problems with the analyzer and cannot get it to operate. To reset, press the button with the point of the stylus – see chapter 9 for troubleshooting. Slot for Compact Flash (CF) Cards (Hardware version 1 – 3 only) See item 9 in Fig. 2.2. This slot accepts CF sized cards and can be used for memory or, for example, a modem. Slot for Secure Digital (SD) Cards See item 10 in Fig. 2.2 (hardware versions 1 – 3) or item 9 and 10 in Fig.2.3 (hardware version 4). The SD slots accept SD and SDHC (Secure Digital High Capacity) memory cards, and are typically used to save measurement data. Capacities upto 32 gigabytes are acceptable. Note: Hardware versions 1 – 3 have only one SD Card slot. LAN Socket See item 12 in Fig. 2.2 (hardware versions 1 – 3) or Fig. 2.3 (hardware version 4). All G4 hardware has one LAN socket with 100 Mbit connection. With hardware versions 1 – 3, only Type 2270 is equipped with a 10 Mbit LAN connection. The LAN Socket provides high-speed direct communication with a Local Area Network. It is used to synchronise measurement and setup data with a host PC. The yellow LED on the right is on when there is a link. The green LED on the left blinks when there is activity on the LAN connection. CHAPTER 2 Assembling your Analyzer 2.4 Hardware Setup Fig.2.4 Type 2250/2270 – Hardware Overview UA-1404 Outdoor Microphone Kit UA -1650 90 mm Windscreen with AutoDetect 4231 Sound Calibrator 4189/4190 Microphone ZC -0032 Microphone Preamplifier AO -0697-D-100 Microphone Ext. Cable, 10 m JP-1041 Dual 10-pole Adaptor AO -0697-D-030 Microphone Ext. Cable, 3 m UA -1317 Microphone Holder UL -1009 Industrial Grade SD Memory Card for Hand-held Analyzer UA -0801 Small Tripod (or UA -0587) 2250/2270 Hand-held Analyzer BZ -5298 Environmental Software CD incl. Utility software QB -0061 Rechargeable Battery Pack UA -1651 Tripod Extension for Hand-held Analyzer ZG -0444 Battery Charger for QB-0061 Interface cables (see list) AO -0646 Sound Cable, 1.5 m UA -0587 Tripod (or UA -0801) KE -0441 Protective Cover UA -1654 5 extra Styli UA -1673 Adaptor for Standard Tripod Mount DH -0696 Wrist Strap KE -0440 Travel Bag for 2250/2270 and Accessories FB -0699 Hinged Cover for Hand-held Analyzer Interface Cables: AO-1449-D-010 LAN Cross-over Cable, 1 m AO-1450 LAN Cable, 1.5 m ZG -0426 Mains Power Supply AO -0440-D-015 Input Cable, AO-0440-D-015 1.5 m AO -0440-D-015 Output Cable, Trigger Input Cable, 1.5 m 1.5 m HT-0015 Earphones AO -1476 USB Cable, 1.8 m for hardware v. 1 – 3 A O -1494 USB Cable, 1.8 m for hardware v. 4 040031/8 13 Hand-held Analyzer Types 2250 and 2270 – User Manual 14 2.5 Assembling the Analyzer 2.5.1 Charging the Battery for the First Time Battery Pack QB-0061 comes charged to approximately half capacity on initial delivery. Before assembling your analyzer for the first time, it is recommended that you fully charge the battery pack, by connecting Mains Power Supply ZG-0426 to the external power socket. It should take approximately 8 – 10 hours. On hardware versions 1 – 3, the battery charge indicator shows a steady green light when external power is applied (and the battery is charging), and a flashing green light when charging has finished. On G4 hardware, the light is red when the battery is charging and green when charging is finished. You can leave the analyzer with external power on, even when the battery is fully charged.. Refer to section 9.4.3 for more information on the analyzer’s battery. 2.5.2 Making Good Measurements The fact that you are using your Type 2250 or Type 2270, which fully complies with the IEC 61672–1 standard, ensures you always make good measurements. The analyzer should be set up using the following recommended assembly instructions. This is to minimise the influence of acoustical reflections during measurements. All the components described below are shown in Fig.2.1 and Fig.2.4. Another set of instructions are provided in section 2.5.3, for situations where you need to position the microphone at a distance from the analyzer, while still complying with the standard. Placing the Measurement Microphone The measurement microphone must be placed away from shielding, reflecting, or absorbing objects. In a diffuse sound field, absorbing objects will reduce the measured sound levels. In a free sound field, reflecting objects can change the measured sound levels. Typically, the sound level 0.5 m from a plane reflecting wall is 3 dB higher than if there was no wall. The operator of the system may be personally shielding, absorbing, and reflecting, and can be an additional noise source. Measure downwind in dry conditions with a windspeed less than 5 m/s. The optimum position for the microphone is best found by trying different positions and observing the resulting sound levels. CHAPTER 2 Assembling your Analyzer 15 Mounting the Measurement Microphone Before mounting the measurement microphone, note the following precautions: • When screwing the microphone on, do it gently to avoid damaging threads • Keep dust and foreign matter off the microphone diaphragm. Do not touch the diaphragm with anything – it is very delicate Note: Once the measurement microphone and preamplifier have been assembled and connected to your analyzer, they should normally be left connected to the analyzer. To Connect: 1) Gently screw the microphone onto Preamplifier ZC-0032, see items 1 and 2 in Fig.2.1. 2) Insert the male plug of the preamplifier into the top socket of the analyzer (see item 17 in Fig.2.1) and push gently until it snaps into position. To Disconnect: 3) To disconnect the preamplifier and microphone from the analyzer, grip the locking collar firmly and slide back to remove the preamplifier and microphone combination. Mounting the Windscreen For short outdoor noise measurements (or indoor measurements exposed to air movement) mount Windscreen UA-1650 onto the microphone and preamplifier combination, making sure it ‘snaps’ into place over the windscreen sensor. The sensor is built into the preamplifier, see item 2 in Fig.2.1. Icons in the status field on the screen indicate whether the windscreen is detected or not. For longer-term outdoor measurements, see Mounting the Outdoor Microphone Kit below. Mounting the Analyzer onto the Tripod Extension Stem and Tripod Mount the analyzer onto the Tripod Extension Stem UA-1651 and Small Tripod UA-0801, as follows: 1) Screw Tripod Extension Stem UA-1651 onto the threaded stud of the ball-joint on Small Tripod UA-0801. Secure the ball-joint roughly in a vertical position (that is, in-line with the tripod) until ready to follow the instruction in step 4. 2) Screw the Extension Stem UA-1651 into the analyzer, using the threaded socket at the lower back of the analyzer (see item 18 in Fig.2.1). 3) Set Small Tripod UA-0801 (including the analyzer) in the required position, and adjust it to the required height. Ensure that one of the three legs is pointing roughly in the same direction as your analyzer needs to point. (We will refer to this leg as the front leg.) 4) Position the extension stem at an angle of 45 to the horizontal and vertically in-line with the front leg of the tripod – this is to ensure the whole setup is stable. Note: The procedure is the same if Tripod UA-0587 is used instead of Small Tripod UA-0801. Once you have carried out these instructions, you are ready to start measuring, see Chapter 3. Hand-held Analyzer Types 2250 and 2270 – User Manual 16 2.5.3 Alternative Measurement Method (Extended Microphone) The measurement microphone can be placed a distance from the analyzer by connecting an extension cable and fitting the microphone to a microphone holder or to Outdoor Microphone Kit UA-1404. The analyzer should be set up using the following assembly instructions. This is to ensure that the accessories have limited acoustical influence on the analyzer during measurement. All the components described below are shown in Fig.2.1 and Fig.2.4. Mounting the Outdoor Microphone Kit For long-term outdoor measurements, Outdoor Microphone Kit UA-1404 will be required as an alternative to the windscreen. If this is the case, mount the kit onto the microphone and preamplifier combination according to assembly and mounting instructions in the User Manual for the Outdoor Microphone Kit, BE 1077. Connecting a Microphone Extension Cable The optional extension cables that are recommended for use with Type 2250/2270 are: • AO-0697-D-030 – 3 m long • AO-0697-D-100 – 10 m long Note: Connecting a recommended microphone extension cable has no acoustical effect on the hand-held analyzer’s measurement and has no effect on the analyzer’s calibration. However, although it is not essential to re-calibrate, it is good measurement practice to calibrate the whole measurement chain (including microphone extension cable) before starting a measurement. Decide which cable you require and assemble as follows: 1) Gently screw the microphone onto Preamplifier ZC-0032, see items 1 and 2 in Fig.2.1. 2) Insert the preamplifier into the female plug of the extension cable and push gently until it snaps into position. 3) Insert the male plug of the extension cable into the top socket of the hand-held analyzer (see item 17 in Fig.2.1) and push gently until it snaps into position. Connecting Two Microphones (Type 2270 only) To connect two microphones to a Type 2270, use the Dual 10-pole Adaptor JP-1041, two extension cables (AO-0697-D-030 3 m long or AO-0697-D-100 10 m long) and two Preamplifiers and two Microphones. 1) Gently screw the Microphones onto Preamplifiers ZC-0032, see items 1 and 2 in Analyzer Components (Fig.2.1). 2) Insert the preamplifiers into the female plugs of the extension cables and push gently until into position. 3) Insert the male plugs of the extension cables into the female plugs of the dual 10-pole adaptor and push gently until they snap into position. Note: Channel 1 is tagged CH 1 and Channel 2 is tagged CH 2 on the dual 10-pole adaptor. CHAPTER 2 Assembling your Analyzer 17 4) Insert the male plug of the dual 10-pole adaptor into the top socket of Type 2270 (see item 17 in Fig.2.1) and push gently until it snaps into position. Mounting the Measurement Microphone on the Microphone Holder and Tripod Mount the microphone and preamplifier combination onto Microphone Holder UA-1317 and Small Tripod UA-0801, as follows: 1) Set Small Tripod UA-0801 in the required position, and adjust to the required height. 2) Screw Microphone Holder UA-1317 onto the threaded stud on the tripod ball-joint, and position the holder as required. 3) Push the microphone and preamplifier combination carefully into the microphone holder, so that it grips onto the body of the microphone and preamplifier. Ensure that the microphone cable sits properly in the plastic guide. Once you have carried out these instructions, you are ready to start measuring, see Chapter 3. 2.5.4 Measuring for Convenience Measurements that need to be done at short notice, with no particular accuracy can be carried out by simply holding the analyzer or using any combination of hardware components and accessories shown in Fig.2.4. 2.5.5 Measuring Using Accelerometers For vibration measurements you need an accelerometer as the measurement transducer. The accelerometer is connected to the rear socket of the analyzer. Please refer to Chapter 3 of FFT Analysis Software User Manual BE 1778 for detailed information about selecting the right accelerometer and how to mount it correctly. 18 Hand-held Analyzer Types 2250 and 2270 – User Manual 19 Chapter 3 Making your First Measurement 3.1 Introduction This chapter describes how to make a basic measurement and how to save and document the results. It assumes you have just received your analyzer and are turning it on for the first time. If the analyzer has been used before, and the previous user has initiated the multi-user facility, then the screens that are displayed may not follow the sequence described below. If this is the case, please refer to section 8.1.6. Note: A stylus is stored in a holder on the side of the analyzer, see item 15 in Fig.2.1. This can be used on the touch-sensitive screen to select icons and functions during the procedures that follow. Alternatively, you can use the various pushbuttons, see items 3 to 11 in Fig.2.1. The following procedures assume that the measurement microphone and preamplifier have been mounted as described in Chapter 2 and the analyzer has a fully charged battery, see section 2.5.1. 3.2 Point and Shoot Using the following basic procedure you will be able to start using your hand-held analyzer immediately to make measurements and start the familiarisation process: 1) Switch on by pressing and make sure the Sound Level Meter project template is selected (see section 3.3.3 for instructions). 2) Check that the data path at the top of the screen displays the correct job/project, (that is, where you want to save the new data). See section 6.1.1. 3) Set Measurement Mode to Manual and change any setup parameters by tapping the Main Menu icon and selecting Setup from the drop-down that appears. 4) Press the Start/Pause pushbutton , then monitor the status indicator (traffic light). 5) Use the Start/Pause the measurement. , Back-erase , Continue 6) When measurement has finished, press the Save and Reset pushbuttons to control pushbutton to save your data. Hand-held Analyzer Types 2250 and 2270 – User Manual 20 7) Add any spoken comments to the measurements by pressing the Commentary pushbutton, and add any written comments by tapping the Main Menu icon and selecting Add Note to Current Measurement from the drop-down that appears. 8) To view and organise your data, tap the Main Menu icon and select Explorer. Note: You are not required to set any measurement ranges, the analyzer has a dynamic range of more than 120 dB, from 140 dB down to the noise floor of the microphone, (if the microphone has nominal sensitivity). 3.2.1 Congratulations! You should now be familiar with the basic principles of the analyzer. If you need more help, the following section goes into the measurement process in more detail. If not, please refer to Chapter 1. 3.3 Making a Measurement 3.3.1 What is a Project Template? A project template contains all the common display settings and measurement setups required to perform a noise measurement. The template does not contain any measurement data – these data are saved as individual projects, stored in job folders, see section 6.1.1. The project templates covered by this manual, are: • Sound Level Meter (included in BZ-7222 software) • Frequency Analysis (included in BZ-7223 software) • Logging (included in BZ-7224 software) • Enhanced Logging (included in BZ-7225 software) • Reverberation Time (included in BZ-7227 software) Note 1: Signal Recording Option BZ-7226 does not contain a specific template – signal recording options are available in all templates. Note 2: Tone Assessment Option BZ-7231 does not contain a specific template – tone assessment options are available in all templates included in BZ-7223/24/25/30. Note 3: Low Frequency Option BZ-7234 works with all the templates included in BZ-7222/23/24/25 Note 4: 2-channel Option BZ-7229 (for Type 2270) enables 2-channel operation for all 2-channel templates included in BZ-7222/23/24/25/28 and for Signal Recording Option BZ-7226 and Low Frequency Option BZ-7234. If you make any changes to the settings in a project template, an ‘*’ will appear next to the template name to indicate that the new settings have not been saved. Tap the template name at the top of the display to open the Template Explorer (or select it from the Main Menu ) and tap the Save icon to save the settings in the current template. CHAPTER 3 Making your First Measurement 3.3.2 21 Switching On Switch the analyzer on by pressing . The start-up time depends on the state the analyzer was in when last switched off and it may take up to 2 minutes from a cold start, or up to 10 seconds if the analyzer is already in Standby mode, (that is, from a warm start). Note: A cold start is a re-boot of the analyzer from ROM. This normally occurs after the analyzer has been turned off for some time, either by the user or following an automatic powerdown. A warm start takes the analyzer quickly from Standby mode to fully operational without having to re-boot. (The battery needs to be charged for this to happen, see section 2.5.1.) 3.3.3 Set the Sound Level Meter Project Template After initialization, the screen shown in Fig.3.1 appears: Fig.3.1 Initial sound level meter screen 1) Check that the SOUND LEVEL METER project template is displayed at the top of the screen (Fig.3.1. If not, use the stylus to tap the bar at the top of the screen to reveal the Template Explorer and select Sound Level Meter from the list (Fig.3.2). Select Open. 22 Hand-held Analyzer Types 2250 and 2270 – User Manual Fig.3.2 Changing the project template 2) Tap Measurement Mode in the View Area and set to Manual (Fig.3.3). Note: The bar graph showing the sound pressure level LAF is now live, but parameters such as LAeq are not. This is because LAF is an instantaneous value, always available for display, whereas LAeq is a measured value that needs to be averaged over a period of time. Therefore, it cannot be displayed before you have started a measurement using the Start/Pause pushbutton . Fig.3.3 Setting the measurement mode 3) Press the Start/Pause pushbutton to start the measurement. Note: Start briefly appears on the screen as feedback when you press the Start/Pause pushbutton. Notice the Running icon on the screen and monitor the red, yellow, green status indicators around the Start/Pause pushbutton while you are measuring. CHAPTER 3 Making your First Measurement 23 The indications should be as follows: • Yellow status indicator flashing every 5 s before starting the measurement • Steady green status indicator after pressing the Start/Pause pushbutton the measurement (if everything is OK) • Short green flash every second means the measurement is waiting for the trigger • Yellow status indicator flashing every 5 s when you have stopped, saved the measurement and are ready to do another measurement • Yellow status indicator flashing slowly (0.5 s on, 0.5 s off) when paused • Red status indicator flashing rapidly if you encounter an overload condition during the measurement and during 4) Use the Start/Pause , Continue , Back-erase and Reset pushbuttons to control the measurement. The status field at the top of the screen will give short textual feedback on the pushbutton operation. A visual indication of measurement status is also displayed on the status line, by way of the Stopped icon , the Running icon and the Paused icon (Fig.3.4). Fig.3.4 Measurement feedback in the Status Field 5) Toggle between different display parameters, as required, by tapping on each parameter field (for example LAF90.0 in Fig.3.4) with the stylus and selecting other parameters from the drop-down lists that appear. Note: The tabs at the bottom of the screen allow you to choose different ways of displaying the measurement results: • The Broadband view shows an instantaneous LAF readout, with associated bar graph and four measurement parameters, followed by two measurement setup parameters. (The first parameter is displayed in a larger font size for better readability (Fig.3.4)) • The XL View increases the size of the first parameter readout to a four-digit, full-screen display (including decimal point) 24 Hand-held Analyzer Types 2250 and 2270 – User Manual 6) Set Measurement Mode to Automatic and choose a preset time for your measurement. Then repeat steps 3 and 4. The measurement will automatically pause after the preset time. This allows you to either save your measurement or continue measuring, as required. 7) Tap the Main Menu icon and select Setup from the list of options (Fig.3.5). Fig.3.5 Main Menu options Change the broadband weighting parameters by tapping on the ‘plus’ icon next to Frequency Settings, then on the weighting parameter field on the right side of the screen. A weighting drop-down menu will appear (Fig.3.6). Change the parameters as required. Fig.3.6 Changing the broadband frequency settings 8) Return to the bar graph screen of the Sound Level Meter template by tapping are ready to make a new measurement. and you CHAPTER 3 Making your First Measurement 3.4 25 Save your Measurement When you have completed your measurement, you need to save it. By default the analyzer creates a job folder called JOB 01. Job folders represent the upper level of the data (or file) management system, with individual measurements or sets of data, represented by projects appearing under the relevant job. By default the analyzer also creates a project called PROJECT 001 under JOB 01. (Subsequent measurements will be labelled PROJECT 002, PROJECT 003, etc., under JOB 01. This will happen each time you have saved a measurement*.) Check that the data path at the top of the screen displays \JOB 01\PROJECT 001* and save your measurement by pressing the Save pushbutton . For more details refer to section 6.1. Note: An asterisk will appear alongside the project at the top of the Status Field as soon as you start your measurement (Fig.3.7). This signifies that the measurement has not been saved. It will disappear once you have saved the measurement. Fig.3.7 Saving your measurement *. If you are using Reverberation Time Software BZ-7227, please note that there are more measurements stored in Reverberation Time projects than Sound Level Meter, Frequency Analyzer or Logging projects, which all contain one measurement within each project. See Chapter 14 for more information on BZ-7727. Hand-held Analyzer Types 2250 and 2270 – User Manual 26 3.4.1 Viewing the Saved Measurement To view the saved measurement, tap the project name or the Main Menu icon and select Explorer from the list of options. Tap the name of your measurement (PROJECT 001 in this case) and select Open from the drop-down that appears (Fig.3.8). Alternatively, you simply tap the measurement icon to the left of the name to open and view. Fig.3.8 Viewing your measurement in Explorer 3.5 Document your Measurement One method for documenting your measurement is adding metadata to your project. Tap (upper right corner of the screen (Fig.3.7)) to open the Annotations screen with metadata on the Metadata tab and annotations on the Annotations tab (Fig.3.9). Note: If the icon is not visible, you have no metadata or annotations at all. Move the field selector into the line using the arrow keys and move it right until the icon is revealed. Fig.3.9 The Metadata tab of the Annotations screen CHAPTER 3 Making your First Measurement 27 Metadata are text or numbers, which are easily set and changed using the keyboard or selected from a user-defined picklist. The metadata are stored together with the measurement on the project. Refer to section 8.7 for a more comprehensive description of using metadata. Tap the icon to close the Annotations screen. Another method for documenting your measurement is by attaching a short spoken comment to the project you are working on. This is done before, during* or after saving the measurement by pressing and holding down the Commentary pushbutton, while talking to the analyzer. (The microphone situated on the underside of the analyzer will pick up your comments.) Recording stops when you release the pushbutton. Note: Tap the Annotations icon to see a list of all annotations in the project and tap the Loudspeaker icon in the annotation to hear the comment using the earphones plugged into the earphone socket. A third method is to make a short written comment and attach it to the project you are working on. This is done before, during or after saving the measurement by tapping the Main Menu icon and then tapping on Add Note to Current Measurement in the list of options. A blank Notes screen will appear, where you can make written comments about the measurement, using the standard full character keyboard that appears at the bottom of the Notes screen. See the example in Fig.3.10. Tap the Annotations icon to see a list of all annotations in the project and tap the Text icon in the annotation to view the comment. Fig.3.10 Example of a written annotation that is attached to a measurement A fourth method is to attach a note with the GPS position. Similar to adding notes, adding a GPS note can also be done before, during or after saving the measurement by tapping the Main Menu icon then tapping Add GPS Note to Cur. Measurement in the list of options. *. For Logging Software BZ-7224 and Enhanced Logging Software BZ-7225, annotations can be added directly to the measurement profile during the measurement, see section 11.2. 28 Hand-held Analyzer Types 2250 and 2270 – User Manual If a GPS receiver is connected (via USB) when you press the Save pushbutton, then the GPS note is automatically created with the position. Remove the GPS receiver after usage to save power. Fig.3.11 Example of a GPS note If you do not have a GPS receiver, but know the position (for example, from your smartphone), you can manually key in the position in the GPS note. A GPS note starts with “Position:”, and includes the latitude and longitude. For manual entries, please enter the latitude and longitude in one of the following formats: Degrees: DD.ddddddY DD.ddddddX Example: 55.816730N 12.532855E Degrees Minutes: DD MM.mmmmY DD MM.mmmmX Example: 55 49.0038N 12 31.9713E Degrees Minutes Seconds: DD MM SS.sssY DD MM SS.sssX Example: 55 49 0.288N 12 31 58.278E where X = E or W and Y = N or S. If you use degrees only, then you can use +/– instead of N/S and E/W (example: 43.08011N,79.071007W = 43.08011,–79.071007). You can use “,” instead of “space” between latitude and longitude The GPS note can be used by Measurement Partner Suite BZ-5503 to locate the measurement on Google Maps™. A fifth method is to attach an image (Type 2270 only). Similar to adding notes or comments, adding an image can also be done before, during or after saving the measurement by a tap Main Menu icon and then a tap Add Image to Current Measurement in the list of options. The Viewfinder display will then appear showing what is coming through the camera lens. The CHAPTER 3 Making your First Measurement 29 camera has fixed focus and automatically adjusts the light sensitivity; you just have to position the analyzer so that the object you want to capture is visible in the viewfinder and then press the Manual Event pushbutton or tap the icon to capture the image – see Fig.3.12. Fig.3.12 Viewfinder When captured, the image is presented as a still picture and you can save the captured image by pressing the Save pushbutton (or by closing the Images view), or you can reject the image by pressing the Back-erase pushbutton. Fig.3.13 Viewfinder Note: When finished, tap the icon to return to the Measurement screen. Tap the Annotations icon to see a list of all annotations in the project and tap the Camera icon in the annotation to view the image. Hand-held Analyzer Types 2250 and 2270 – User Manual 30 To get more familiar with this process, try the following: 1) Make a new measurement (see section 3.2, if unsure). 2) Tap the Annotations icon and define or select metadata. 3) Make a short written comment and attach it to the new measurement (as previously described). 4) Make a short spoken comment (as previously described). 5) Make an image (as previously described – for Type 2270 only). 6) Tap the Annotations icon and check that you have three annotations – select one of them to see/hear the annotation. 3.6 Switching Off Switch the analyzer off by pressing . If held in for 1 second, the analyzer goes into Standby mode; if held in for more than 4 seconds, it switches the analyzer off. The analyzer will automatically switch off when it has been in Standby mode without external power for more than 30 hours. 31 Chapter 4 Getting to Know Your Analyzer 4.1 What is a Sound Level Meter? A Sound Level Meter (SLM) is an instrument that is designed to measure sound levels in a standardised way. An SLM comprises a microphone, a preamplifier, a main processor and a readout unit. The microphone converts the sound signal into an equivalent electric signal. The electric signal that the microphone creates is at a very low level, so it is made stronger with the help of a preamplifier before it is processed by the main processor. Processing includes applying frequency and time weightings to the signal as specified by international standards, such as IEC 61672–1, to which the analyzer conforms. Frequency weighting adjusts how the SLM responds to different sound frequencies. This is necessary because the human ear’s sensitivity to sound varies according to the sound’s frequency. The most commonly used frequency weighting is A-weighting, which adjusts a signal in a way that best resembles the human ear’s response at medium-range levels. A-weighting is required for nearly all environmental and workplace noise measurements, and is specified in international and national standards and guidelines. All of the analyzer’s measurement parameters apply A- or B-weighting and a choice of C- or Z-weighting, except for the measurement of peak levels where a single weighting (typically ‘C’) is applied. In this case, C-weighting is used to take into account the energy present at low frequencies even when they are not particularly annoying. Time weighting specifies how the SLM reacts to changes in sound pressure. It is an exponential averaging of the fluctuating signal, providing an easy-to-read value. The analyzer applies Fast, Slow and Impulse (or ‘F’, ‘S’ and ‘I’) time weightings, which are the required weightings according to the vast majority of international and national standards and guidelines. The signal is processed through the weighting filters, and the resulting sound pressure level is displayed in decibels (dB) referenced to 20 µPa on the analyzer’s screen. The sound pressure level values are updated at least once per second. Assessing a fluctuating noise level means getting a value for a level that is, in simple terms, the average level. The ‘equivalent continuous sound level’, Leq, is known around the world as the essential averaged parameter. Leq is the level that, had it been a steady level during the measurement period, would represent the amount of energy present in the measured, Hand-held Analyzer Types 2250 and 2270 – User Manual 32 fluctuating sound pressure level. It is a measure of the averaged energy in a varying sound level. It is not a direct measure of annoyance, though extensive research has shown that Leq correlates well with annoyance. Leq is measured directly with any SLM. If an A-weighting filter is used, it is expressed as LAeq: the measurement of the equivalent continuous sound level using the A-weighted filter network. A full range of measurement parameters is given in Appendix B. 4.2 What is the Hand-held Analyzer? The hand-held analyzer is a versatile hardware platform suitable for covering a wide range of different applications. Together with Sound Level Meter Software BZ-7222, it is a Class 1 modular precision integrating-averaging sound level analyzer with an easy to use interface for quick and simple measurement setups. 4.2.1 Sound Level Meter Software Module BZ-7222 Sound Level Meter Software BZ-7222 allows you to measure a comprehensive set of parameters used for rating noise in terms of its impact on the environmental and working environments and on occupational noise evaluation. The more commonly used parameters for sound measurements, which cover a large range of applications, are either instantaneous measured parameters (available at any time) or timed measured parameters (measured within a controlled time interval): Timed Measured Parameters • Equivalent Continuous Sound Levels (Leq – example: LAeq) • Moving (or sliding) Equivalent Continuous Sound Levels (example: LAeq,T,mov and LAeq,T,mov,max) • Peak Sound Levels (Lpeak – example: LCpeak) • Time for Peak Sound Level (example: TCpeak) • Maximum Time-weighted Sound Levels (Lmax – example: LAFmax) • Minimum Time-weighted Sound Levels (Lmin – example: LAFmin) • Percentile Levels (LN – example: LAF90.0) • Sound Exposure Level (example: LAE) • Sound Exposure (example: E) • Daily Noise Exposure Levels (example: Lep,d or LEX,8h) • Noise Dose (example: based on ISO standards: Dose, based on US standards: DoseS5) • Number of Peaks (example: #CPeaks(>140 dB)) • Time Weighted Average (example: TWA) • Level Average with Exchange Rates 4, 5 or 6 (example: LavS5) • Weather data (requires a weather station connected) • GPS data (requires a GPS device connected) CHAPTER 4 Getting to Know Your Analyzer 33 Instantaneous Measured Parameters • Instantaneous Time-weighted Sound Levels (Lp – example: LAF) • Sound Pressure Levels (max levels once per second – example: LAF(SPL) • Instantaneous Peak Sound Levels (example: LCpeak,1s) • Instantaneous Weather data (requires a weather station connected) • Instantaneous GPS data (requires a GPS device connected) If you measure the acceleration signal from an Accelerometer, then the most common used parameters are: Timed Measured Parameters • Average (example: Linear) • Peak (example: Peak) • Time for Peak (example: Tpeak) • Maximum Time-weighted parameters (example: Fast max) • Minimum Time-weighted parameters (example: Slow min) • GPS data (requires a GPS device connected) Instantaneous Measured Parameters • Instantaneous Time-weighted parameters (example: Fast Inst) • Instantaneous GPS data (requires a GPS device connected) The acceleration parameters can be displayed in either Engineering units (m/s2) or in dB. Note: See Appendix B for a comprehensive list of all parameters. Sound Level Meter Software BZ-7222 incorporates a simple user interface that is easy to learn and uses intuitive data storage and recall. Comprehensive security features mean no loss of data, even on accidental power-off. Smart features are built-in for field use, for example, allowing you to personalise your measurements. Sound Level Meter Software BZ-7222 also provides connectivity between your PC and other sound analysis software. This highly versatile hand-held analyzer platform includes a range of optional software modules, that are enabled through easily activated software license keys. The combination of software modules and innovative hardware makes the analyzer a dedicated solution for performing all your high-precision measurement tasks. The following optional software module is covered in this manual: 4.2.2 Frequency Analysis Software Module BZ-7223 This software module allows real-time frequency measurements in 1/1- and 1/3-octave bands, making it a simple matter to, for example, select suitable hearing protection, qualify noise from heat and ventilation systems and assess tonality. Hand-held Analyzer Types 2250 and 2270 – User Manual 34 4.2.3 Logging Software Module BZ-7224 This software module allows logging of broadband and spectral data* to obtain a time history for later analysis, for example, for use in environmental noise as well as workplace noise assessment. It allows free selection of up to 10 parameters to log at periods from 1 s to 24 h. Results are logged directly to the SD memory card (or CF card if using hardware versions 1 – 3). 4.2.4 Enhanced Logging Software Module BZ-7225 This software module is optimised for long-term monitoring. It has the functionality of the Logging and Frequency Analysis software, and in addition it can measure continuously, save data in manageable portions (every 24 hours), make periodic reports (that is, every hour) and measure Ldn and Lden, etc. 4.2.5 Signal Recording Option BZ-7226 This option allows recording of the input signal (typically sound) in either 16-bit or 24-bit resolution during measurement. The signal recording can be controlled manually or by using an external trigger signal. The recording can also be triggered when a measured parameter exceeds a preset level (BZ-7224 and BZ-7225 only). The recorded signal can be played back and listened to using the supplied Earphones HT-0015. The signal is recorded directly to the SD memory card (or CF card if using hardware versions 1 – 3). 4.2.6 Reverberation Time Software BZ-7227 This software module allows measurement of reverberation time using Impulsive excitation and backwards integration of the impulse, or using Interrupted Noise from the built-in noise generator. Measurements can be made in a number of positions in the room and the average reverberation time for the room is calculated. 4.2.7 2-channel Option BZ-7229 (Type 2270 only) This option allows a number of software modules to measure two channels simultaneously: *. • Sound Level Meter BZ-7222, Frequency Analysis BZ-7223, Logging BZ-7224, Enhanced Logging BZ-7225 and Building Acoustics Software BZ-7228 modules • Signal Recording Option BZ-7226 will be able to record in both channels of a two channel measurement Requires Frequency Analysis Software BZ-7223 CHAPTER 4 Getting to Know Your Analyzer 4.2.8 35 Tone Assessment Option BZ-7231 This option allows the assessment of tones on site, according to selected methods. The option described in this manual is based on the 1/3-octave method. (Please refer to User Manual BE 1778 for detailed information about tone assessment based on FFT spectra.) When used with BZ-7223 Frequency Analysis, BZ-7224 Logging and BZ-7225 Enhanced logging, it allows you to assess tones in a measured 1/3-octave spectrum according to ISO 1996:2007, Annex D, or, assess tones in a measured 1/3-octave spectrum according to Italian Law, “Ministero dell’ambiente, Decreto 16 marzo 1998”. 4.2.9 Low Frequency Option BZ-7234 This option enables: • Measurements down to 0.4 Hz using Brüel & Kjær low-frequency microphones and adds G-weighting parameters in accordance with ISO 7196:1995 • Measurements of building vibration parameters using Brüel & Kjær low-level accelerometers in accordance with ISO 2631–2:2003, ISO 8041:2005, DIN 45669–1:2010–09 and DIN 4150-2:1999–06 • 1/3-octave frequency analysis down to 0.8 Hz (1/1-octave down to 1 Hz) This option can be used together with Sound Level Meter BZ-7222, Frequency Analyzer BZ-7223, Logging BZ-7224 and Enhanced Logging BZ-7225 software modules and the 2-channel Option BZ-7229. 4.2.10 Built-in Help If you need more detailed information at any time during operation, tap the Help icon on the analyzer’s screen. The resulting screen will explain that particular item in much more detail. You can scroll up and down the explanatory text using either the and pushbuttons, or the scroll bar on the screen. Return to the normal display screen by tapping . If you need to view any of the previous 10 screens you have visited in the help system, tap the icon at the top of the display. Software and Hardware Versions Once in the help system, you can access the list of installed software versions and licenses, together with information about the hardware. This information is always available and is accessed by selecting About from the top of the display. Hand-held Analyzer Types 2250 and 2270 – User Manual 36 4.3 What is Measurement Partner Suite BZ-5503? Measurement Partner Suite BZ-5503 comes standard with your hand-held analyzer and provides data archive, preview and export capabilities as well as software maintenance and remote online display. In addition to the included standard configuration, valuable data analysis and post-processing functionality is available in an expanding suite of optional application modules. The software enables you to do the following: • Setup or control the analyzer from a PC • Retrieve data from the analyzer • Manage and archive data from the analyzer • View data in archives • Update the software in the analyzer • Install licenses for use of software modules in the analyzer • Remotely view online displays • Post-process data (optional) • Export to other post-processing and documentation tools like Evaluator™ Type 7820 or Microsoft® Excel® or Word Measurement Partner Suite BZ-5503 is supplied on the Environmental Software DVD (BZ-5298), which is included with your analyzer. 4.4 Basic Principles when using the Analyzer 4.4.1 Navigation Principles – ‘Star’ Navigation Concept The main principle is that all the main menus are accessible via a single tap of the stylus. The Main Menu icon forms the centre of the ‘star’ navigation concept (Fig.4.1). CHAPTER 4 Getting to Know Your Analyzer Fig.4.1 37 The ‘Star’ navigation concept Shortcut This configuration gives you immediate access to screens you need most, that is, those you will need to perform, save and document your measurements. The Main Menu allows you to navigate to the following screens:: • • • • • Explorer Setup Preferences Transducers Calibration • • • • Add Note to Current Measurement Add Image to Current Measurement (Type 2270 only) Template Explorer Timer Setup 38 Hand-held Analyzer Types 2250 and 2270 – User Manual In addition, Main Menu • Lock Keys and Screen • Log Off also allows you to perform the following actions: Explorer The Explorer screen is accessed from the Main Menu or by tapping the project name and gives you access to the analyzer’s Data/Project Manager. This allows you to view the overall project structure, including job folders and projects, and to view all the individual measurements. When you have finished, tap to return to the Measurement screen. You can tap any measurement file to open the saved measurement and if there are any voice text or image annotations attached, these can be viewed by tapping the Paperclip icon visible next to all measurement files with attachments. When you have finished reading, listening or viewing the attachments, tap to return to the Explorer screen. Setup The Setup screen is accessed from the Main Menu and gives you access to the various setup parameters, such as frequency weightings, control of the measurement, bandwidth, statistics and the type of input currently connected. You can change these as required, see section 4.4.6. The Full tab at the bottom of the screen allows you to view the complete list of setup parameters, while the Quick tab allows you to access the more frequently used parameters defined by yourself. When you have finished viewing or updating the parameters, tap to return to the Measurement screen. Changes made to the setup will only be applied temporarily, that is, until you select another project template or open another project to re-use the setup from that project. However, if you want the setup changes to be saved in the current template, select the Template Explorer option from the Main Menu and tap the Save icon . Note: If you make changes to the setup that you do not want to keep (and you have not yet saved the template), you can undo them by selecting the template again from the Project Template Bar at the top of the screen. Preferences The Preferences screen is accessed from the Main Menu and gives you access to the analyzer’s preferences (if Multi User is disabled) or your own preferences (if Multi User is enabled). These include things such as regional settings, appearance of the screen, power management, user profiles and language. You can change these as required, see section 4.4.6. For more information refer to section 8.1. When you have finished viewing or updating the parameters, press to return to the Measurement screen. Transducers The Transducers screen is accessed from the Main Menu, you can view/set which transducer is connected to the analyzer and add new ones if required. Details can be changed for existing CHAPTER 4 Getting to Know Your Analyzer 39 transducers or entered for new ones, see section 4.4.6. When you have finished viewing or updating the details, tap to return to the Measurement screen. When a transducer is selected, you can tap the Calibration History link at the bottom of the transducer details and open the Calibration History screen (Fig.4.1). This screen includes the calibration history for the transducer (that is, microphone) that is currently selected. When you have finished viewing or updating the details, tap to return to the Transducers screen. Calibration The Calibration screen is accessed from the Main Menu, and gives you access to the analyzer’s calibration procedure. To calibrate the analyzer, follow the instructions in the Status Field. For more information refer to section 5.2. When you have finished calibrating or viewing the details, tap to return to the Measurement screen. The Calibration tab at the bottom of the Calibration screen allows you to perform and monitor the calibration, while the Details tab allows you to view the details of the calibration and the calibrator that are being used to calibrate the analyzer. While you are viewing the Details tab, you can tap the Calibration History link at the bottom of the calibration details and open the Calibration History screen (Fig.4.1). This screen includes the calibration history for the currently selected transducer, tap to return to the Calibration screen. Add Note to Current Measurement The Notes screen is accessed from the Main Menu by selecting Add Note to Current Measurement. This screen allows you to create a text annotation that you can attach to your measurement. Text is inserted using a character keyboard, similar to the one covered in section 4.4.6. When you have finished, tap to return to the Measurement screen. Add Image to Current Measurement (Type 2270 only) The Images screen with a viewfinder is accessed from the Main Menu by selecting Add Image to Current Measurement. This screen allows you to capture an image that you can attach to your measurement – see Chapter 3. When you have finished, tap to return to the Measurement screen. Template Explorer Template Explorer is accessed from the Main Menu and gives you access to managing your project templates. When you have finished, tap to return to the Measurement screen. Timer Setup Timer Setup is accessed from the Main Menu and enables you to control the analyzer via one or more of the analyzer’s timers. The purpose of a timer is to initiate measurements in the absence of an operator. When you have finished, tap to return to the Measurement screen. Hand-held Analyzer Types 2250 and 2270 – User Manual 40 4.4.2 The Display Screen During normal operation, you will use the Display screen to view your measurements and carry out a variety of functions, which are described in the following sections. CAUTION: The touch-sensitive screen is susceptible to damage from sharp objects, such as pencils, fingernails, etc. We, therefore, recommend you use the stylus provided to activate items on screen. See also section 4.4.5. A typical screen is shown in Fig.4.2. Fig.4.2 Project template Typical screen when making a measurement Status Field View Area View tabs Shortcut Bar with icons The main areas, starting at the top of the screen, are: • Project Template Bar • Status Field • View Area (with view tabs) • Shortcut Bar Project Template Bar This bar displays the name of the project template, which contains all the screen settings and measurement setup for the current project. Tap the text to open the Template Explorer screen containing all the available templates. If you make any changes to the setup in a template an ‘*’ will appear next to the template name to indicate that the new settings have not been saved. Tap the Save icon in the Template Explorer to save the settings in the current template. Status Field The area just below the Project Template Bar is called the Status Field. Depending on the template, this field displays status information using up to three lines of text, as follows: CHAPTER 4 41 Getting to Know Your Analyzer First Line: • Path and name of the current project (see section 6.1.1). Tap it to open the Explorer. To change the path, navigate to the desired job (path) and tap the icon to save this path as the default measurement path. As in the project template, an ‘*’ will appear next to the project name to indicate that the project has not been saved. Press the Save pushbutton if you want to save the measurement or changed settings. • Smiley (if applicable) • The PC icon • The Commentary icon indicates when a spoken commentary is being recorded, together with an indication of the available recording time • The Recording icon • A Paperclip icon indicates that a spoken or written comment is attached to the project. Tap the icon to view, or listen to, the comment indicates connection to a PC indicates when the measurement signal is being recorded Second Line: • Measurement state represented as icons: Stopped • Elapsed time of the measurement , Running and the Paused icon • Feedback on the action of pressing the following pushbuttons: Reset Start/Pause and Save • Indication that the measurement microphone is uncalibrated. In this case the word Uncal. appears in the Status Field • When a microphone has been selected as input, then four icons are used to represent whether, or not, the windscreen is fitted and whether you are measuring in a free-field or diffuse field. For example, no windscreen fitted, measuring in a free-field – ; no windscreen fitted, measuring in a diffuse field – ; windscreen fitted, measuring in a freefield – ; windscreen fitted, measuring in a diffuse field – . The Accelerometer icon is displayed if an accelerometer is selected as input, and the Input Socket icon is displayed if Direct input is selected. For Type 2270, two icons are displayed – one for Ch. 1 and one for Ch. 2. If only one channel is used, then no icon is displayed for the unused channel • Immediate textual feedback on overload/underrange situation and latched overload indicated with an Overload icon , Back-erase , Third Line: • Used for Logging and Enhanced Logging, see section 11.3.1, or used for Reverberation Time, see section 14.3.1 View Area The View Area contains the screens required for a particular measurement, such as bar graphs, result readouts and various frequently used setup parameters (for example, Meas. mode). The template defines the content of this area. More than one screen can be used for displaying the information. Select the screen using the view tabs at the bottom of the View Area. Changes made to the screens will only be applied temporarily, that is, until you select another project template or open another project to re-use the screen from that project. However, if you Hand-held Analyzer Types 2250 and 2270 – User Manual 42 want the screen changes to be saved in the current template, tap the Project Template Bar at the top of the screen to open the Template Explorer and tap the Save icon . Note: If you make changes to the screen that you do not want to keep (and you have not yet saved the template), you can undo them by selecting the template again from the Project Template Bar at the top of the screen. Shortcut Bar The Shortcut Bar, at the bottom of the screen, displays a number of fixed icons that are always accessible. These include: • Main Menu icon , giving access to the Main Menu. This allows you to navigate to a specific function, see description earlier under Navigation Principles • Backlight icon • Help icon , a quick way to get context-sensitive help from any screen by tapping on the icon at the bottom. Closing the help window will return you to the previous screen • Battery/Power Status icon , shows the condition of the battery. All green shows a fully charged battery, while red means power levels are low. Tap the icon to get more details of the battery condition. (When the power supply lead is connected, the icon will be displayed in place of the Battery/power Status icon .) , allows you to select a backlight level The clock in the lower right corner displays the current time. Tap the readout to get details of the time and date, or to set the clock. 4.4.3 Use of Pushbuttons for Controlling Measurements The design of the analyzer is such that the layout of the pushbuttons has been optimised for single-handed operation. Reset Measurement Pushbutton Use the Reset pushbutton to reset a measurement, that is, to reset all detectors, averagers, maximum and minimum hold, etc. If the measurement is paused (the Paused icon is displayed in the Status Field), then the measurement reverts to a ‘stopped’ state after a reset, is displayed with a zeroed readout). If the measurement is running, then (the Stopped icon the measurement will be automatically re-started after the reset. Start/Pause Pushbutton Use the Start/Pause pushbutton for controlling the measurement. The function of this key depends on the current measurement state (Table 4.1). Table 4.1 Start/Pause pushbutton functions Current Measurement State Function of Start/Pause Pushbutton Next Measurement State Stopped Start the measurement Running Running Pause the measurement Paused Paused Continue the measurement Running CHAPTER 4 Getting to Know Your Analyzer 43 Save Pushbutton Use the Save pushbutton to save the measurement data together with the current project template (including all the screen settings and setup information) and the calibration documentation. Pressing Save will affect the pause and running states. In both cases the measurement state will displayed). be ‘stopped’ shortly after pressing the pushbutton (Stopped icon Back-erase Pushbutton For BZ-7222 and BZ-7223 Software: Use the Back-erase pushbutton to erase the last 5 seconds completely from the measurement. (This includes, of course, overload indications you would like to erase.) If used when the current measurement is running, then the measurement will be paused. The Status Field displays Pause, Back erase briefly, and then displays the shortened elapsed time along with the Paused icon . For BZ-7224 and BZ-7225 Software: Pressing the Back-erase pushbutton will start drawing an Exclude Marker on the display, see section 11.3.2. Pressing it again will stop drawing the marker on the display (toggle function). 4.4.4 On-screen Feedback and Traffic Light Feedback is given on screen in the Status Field (Fig.4.2), and the Traffic Light indicates important states of the analyzer (Table 4.2). Table 4.2 Traffic Light Indications State During power-on or loading template Stopped. Ready to measure Light Scheme Nothing Short yellow flash every 5 s Awaiting trigger, searching for calibration signal Short green flash every second Running measurement, everything OK Steady green light Paused. Measurement not saved Slow yellow flash on 1/2 s, off 1/2 s Overload Fast red flash Hand-held Analyzer Types 2250 and 2270 – User Manual 44 4.4.5 Use of Stylus and Navigation Pushbuttons The stylus and navigation pushbuttons are used for setting up the analyzer, navigating through the screens and managing the results. A number of items that appear on the screen (parameter values or icons) can be selected, updated and activated. For instance, a new parameter value can be selected from a drop-down list. The selection and activation of items on the screen can be done in two ways: • Tapping once on the item on the screen will select and activate it, or • Moving the field selector around using the navigation keys until the item you want is highlighted, then pressing the Accept pushbutton to activate it You can choose to use the stylus or the pushbuttons, depending on your preference and the measurement situation. For instance, if the amount of noise generated by the analyzer needs to be kept to an absolute minimum, consider using the pushbuttons rather than the stylus – this is because tapping of the stylus on the touch-sensitive screen may create extra noise. However, if speed is of major importance, the stylus can navigate through the setup and measurement screens quicker. Throughout the manual we have described how to perform the measurement procedures using the stylus only, but you may also use the alternative method (using the Navigation and Accept pushbuttons) if you prefer. 4.4.6 How to Change Parameter Values Most parameter values are changed by selecting a new value from a drop-down list, which appears when the parameter field is selected. See the example in Fig.4.3. Fig.4.3 Changing parameter values CHAPTER 4 Getting to Know Your Analyzer 45 Stylus Usage Tap the value you want in the drop-down, or tap outside the list to cancel the selection. Pushbutton Usage Use the Navigation pushbuttons (Up Arrow , or Down Arrow ) to select the value you want and press the Accept pushbutton to activate it. Use the Left Arrow to cancel the selection. Number Keyboard When activating a number, a number keyboard appears (Fig.4.4). Fig.4.4 Number keyboard Tap the digits or use Up Arrow /Down Arrow to increment/decrement the number. Use Left Arrow /Right Arrow to select other digits if necessary. Press the Accept pushbutton or tap on the number keyboard to enter the number for the parameter. Tap on the number keyboard, or outside the number keyboard to cancel the change of value. Character Keyboard When activating a text value, a standard full character keyboard appears on the screen (Fig.4.5). Hand-held Analyzer Types 2250 and 2270 – User Manual 46 Fig.4.5 Character keyboard The character keyboard has all the functionality of a normal keyboard, enter text as required by to accept the changes, or tap outside the tapping the individual keys with the stylus. Tap keyboard to cancel. 4.4.7 How to Personalise your Setup Setup contains all the settings for the measurement and some settings for post-processing. Select Setup from the Main Menu , and the Setup screen appears (Fig.4.6). Fig.4.6 The Setup screen – Edit Mode The Full tab at the bottom of the screen allows you to view the complete list of setup parameters, while the Quick tab allows you to access the more frequently used parameters defined by on top of the screen to enter Edit Mode. yourself. Press the Edit icon CHAPTER 4 Getting to Know Your Analyzer 47 This mode allows you to copy parameters from the Full view to the Quick view simply by tapping on the parameters in the Full view – and to remove parameters from the Quick view by tapping on the parameters in the Quick view. When you have finished, tap the Edit icon again to exit Edit Mode. Setup settings can be protected from accidental changes by tapping the Padlock icon top of the screen. This will also protect the template from being deleted or renamed. on the When locking the template you get the option of password protecting the lock. If you choose this, then you enter a password (see Fig.4.7). Fig.4.7 Password protecting a template The password must consist of minimum two characters and/or digits. Note: The password is case-sensitive. To unlock the setup settings and template, tap the padlock icon again. If the lock is password protected, you must enter the password. Note: It is important to remember the password; the template cannot be unlocked without the password. The only way of overwriting a locked template is to re-install the software using BZ-5503. The default templates will be overwritten by a standard installation. New or renamed templates can be deleted from BZ-5503. 4.4.8 How to Manage the Project Templates The project templates containing all the display and measurement settings required to perform a measurement are selected in the Project Template Bar at the top of the Display screen (Fig.4.2). 48 Hand-held Analyzer Types 2250 and 2270 – User Manual You can save changes to the project template, create new templates, rename templates or delete templates from the Template Explorer screen. Select Template Explorer by tapping on the Project Template Bar at the top of the screen or from the Main Menu , and the screen shown in Fig.4.8 will appear. Fig.4.8 Template Explorer The topmost line in the Status Field (“Sound Level Meter” in Fig.4.8) contains the name of the current template. If you make any changes to the settings in the current template, an ‘*’ will appear next to the template name to indicate that the new settings have not been saved. The next line contains icons for saving the settings. Tap the Save icon the current template. to save the settings in Tap the Save As icon to save the settings in a new template. Use the keyboard that pops up to define the name of the template. The rest of the screen is used for listing the defined templates with an icon, a template name and possibly an Annotations icon (paperclip): 1) Tap a template icon to open and use the template. 2) Tap a template name to get a drop-down list with the options: • Open (open and use the selected template) • Clone (create a copy of the selected template) • Delete (delete the selected template) • Rename (rename the selected template) • Add Note (or commentary) to the template • View Annotations on the template 3) Tap the Annotations (Paperclip) Paperclip icon to the project. to get the list of annotations attached CHAPTER 4 Getting to Know Your Analyzer 49 The Full tab at the bottom of the screen allows you to view the complete list of project templates, while the Quick tab allows you to access the more frequently used project templates. Press the Edit icon on top of the screen to enter Edit Mode. This mode allows you to copy project templates from the Full view to the Quick view simply by tapping on a project template in the Full view – and to remove project templates from the Quick view by tapping on a project template in the Quick view. When you have finished, tap the Edit icon again to exit Edit Mode. Note 1: Annotations on templates are for describing the template and will not be copied to the project, when starting or saving a measurement. Note 2: If you delete all templates of a certain type (for example, the Frequency Analyzer) and you want a template of this type again, then you either have to open a project made with this template and save the template, or you have to use Measurement Partner Suite BZ-5503 to transfer a template of this type to the analyzer. 4.4.9 Locking the Pushbuttons and Display The pushbuttons and display can be locked to prevent inadvertent operation: • To Lock: Select the Lock Keys and Screen option from the Main Menu • To Unlock: Press the Left Arrow pushbutton pushbutton , then the Accept pushbutton , followed by the Right Arrow If you attempt to press a pushbutton, or tap the screen, while the analyzer is locked, an information window pops up with instructions on how to unlock it. 50 Hand-held Analyzer Types 2250 and 2270 – User Manual 51 Chapter 5 Calibration 5.1 Introduction Calibration is an adjustment of your analyzer to measure and display correct values. The sensitivity of the transducer as well as the response of the electronic circuitry can vary slightly over time, or could be affected by environmental conditions such as temperature and humidity. While you are unlikely to ever experience a large drift or change in sensitivity with the analyzer, it is nevertheless good practice to perform regular calibrations, normally before and after each set of measurements. Often calibration is required by measurement standards, such as IEC 61672–1. If you want your analyzer to remind you when the next Accredited/Traceable calibration is due, you can set it up on the Reminder tab of the Calibration screen. See section 5.9. You can check the complete measurement chain during long-term measurement using Charge Injection Calibration. See section 5.10. 5.2 Acoustic Calibration Acoustic calibration is the preferred calibration method when measuring with microphones, particularly when standards and regulations require calibration before a measurement. The method involves applying an acoustic signal of known magnitude and frequency to the microphone, which calibrates all the analyzer’s components (microphone, preamplifier and electrical circuitry). 5.3 Sound Level Calibration To perform acoustic calibration use Sound Calibrator Type 4231. It provides a stable sound pressure at 1 kHz and has minimal susceptibility to environmental factors. The procedure itself is relatively simple, and on the analyzer the procedure is referred to as the Standard Calibration procedure. The procedure for performing an acoustic calibration and instructions on how to fit the calibrator are given in the following section. Hand-held Analyzer Types 2250 and 2270 – User Manual 52 5.3.1 Standard Calibration 1) Stand away from loud sound sources that may interfere with the calibrator’s signal. 2) Switch on the analyzer: push 3) Tap the Main Menu icon . then Calibration to open the Calibration screen (Fig.5.1). Fig.5.1 Calibration screen This screen contains a bar graph showing the actual sound pressure level and three placeholders for displaying information about the last calibration. 4) Following the first part of the instruction in the Status Field, fit Sound Calibrator Type 4231 carefully onto the microphone of the analyzer. (To avoid handling vibrations that disturb the calibration, rest the assembly in a roughly horizontal position on a table or other flat surface.) Ensure that the calibrator fits snugly on the microphone. 5) Switch on the calibrator. Wait a few seconds the level to stabilise. 6) Tap the button on the screen to start the calibration. Note: Detecting level... appears on the screen as feedback. 7) While the analyzer is searching for the calibration signal and the signal level is stabilising, the ‘traffic light’ indicates a short green flash every second. When the level is stable, the traffic light indicates a steady green and the signal is measured and used for calibration. Once the calibration has been completed successfully, the traffic light indicates a short yellow flash every 5 seconds. The Sensitivity is automatically calculated and displayed in a pop-up together with the deviation from the last calibration. Press Yes to accept and use the new sensitivity and save it in the calibration history. Press No to disregard the new calibration and continue with the old calibration. If the calibration deviates more than 1.5 dB from the initial calibration (microphones only), then the calibration is stopped without changing the calibration of the analyzer. The traffic CHAPTER 5 Calibration 53 light will indicate a fast flashing red and an error description will appear in the Status Field. Hint: If the microphone is separated from the analyzer using a microphone extension cable then place the analyzer so it can be seen from the location of the microphone. Start the calibration process (select the Calibration screen and tap the button on the screen), then go to the microphone and fit the Calibrator onto the microphone, switch on the Calibrator and monitor the traffic light on the the analyzer, as discussed previously. 8) Once you have completed the calibration, tap the It will automatically switch off after a few seconds. 5.3.2 button and remove the calibrator. Calibration Settings Select the Details tab on the Calibration screen to view the calibration details (Fig.5.2). Fig.5.2 Calibration details screen This screen displays the following information: • Details of the last calibration: date, sensitivity, deviation from last calibration and deviation from initial calibration • The connected transducer: type and serial number Note: You select a new transducer by tapping on the Main Menu icon Setup, followed by Input) and selecting • Max. Input Level: The maximum sinusoidal input level to be measured without overload indication • A Calibration History link, which is provided to enable you to view a history of transducer and calibration settings, see below The calibration settings can be adjusted as follows: • Calibrator: Select between Type 4231 and a custom calibrator • Calibration Level: Enter the specific level of your custom calibrator. If you are using, Type 4231, calibrator level is automatically detected, (shown as Auto detect) Hand-held Analyzer Types 2250 and 2270 – User Manual 54 Note: The Auto detect setting enables the automatic detection of the calibration level. For free-field microphone types (like Types 4189 and 4190) the calibration level from Sound Calibrator Type 4231 is either 93.85 dB or 113.85 dB. For diffuse- or pressure-field types, the calibration level is either 94 dB or 114 dB. The calibration process automatically determines the correct level • 5.4 Calibrator Serial Number: Type in the serial number for your calibrator. The calibrator will be documented in the calibration history Vibration Calibration To calibrate an accelerometer use Calibration Exciter Type 4294. It provides a stable acceleration of 10 m/s2 at 159 Hz. The procedure for mounting the accelerometer to the exciter is described in the Type 4294 user manual. Otherwise the calibration procedure is very similar to the Standard Calibration procedure for sound calibration described above. However, if the calibration deviates more than ± 5.5 dB from the nominal sensitivity, the calibration is stopped without changing the calibration of the analyzer. In this case, check whether the correct accelerometer has been selected from the transducer database and whether it has the correct nominal sensitivity. Note: If you use Low Level Accelerometer Type 8344, you need Calibration Exciter Type 4294-002. 5.5 Electrical Calibration To calibrate the Direct input use a stable sinusoidal voltage at a frequency between 150 Hz and 10 kHz. The procedure is very similar to the Standard Calibration procedure for sound calibration described above; however, without the transducer mounting procedure. 5.6 Manual Calibration If no calibrator is available (or a known amplification is introduced, that is, by analyzing a tape recorded signal) then you can type the sensitivity directly into the Sensitivity field. The analyzer will be regarded as un-calibrated and the text ‘Uncal.’ will appear in the Status Field. 5.7 Calibration History To view calibration history, tap Calibration History > on the Calibration Details screen (Fig.5.2). The analyzer saves the last 20 calibrations, plus initial calibration, which can be viewed on the Calibration History screen (Fig.5.3). Tap to return to the calibration details screen; tap again to return to the Measurement screen. CHAPTER 5 Calibration 55 Fig.5.3 Calibration History screen 5.8 Transducer Database The specifications for Microphone Types 4189 and 4190 (and Preamplifier ZC-0032), which come fitted in the top socket of the analyzer, are described in a transducer database. 1) Tap the Main Menu icon (Fig.5.4) then Transducers to open the Transducer Database screen Fig.5.4 Transducer Database screen 2) Tap the transducer name/number, or select the Plus icon the details in the database (Fig.5.5). next to name/number, to view 56 Hand-held Analyzer Types 2250 and 2270 – User Manual Fig.5.5 Details in the Transducer Database All the details for the currently selected microphone can be found in the database. You can add other transducers by tapping on the Add New Transducer icon , selecting Microphone, Accelerometer or Direct input from the drop-down, and filling in the details of your particular transducer parameters. See section C.2.1. This is done by selecting the item from the dropdown list that appears on some parameter fields, or by entering the data via the keyboard that appears on other parameter fields. When adding a new microphone, Type 4189 is the default entry. Change Microphone Type to fit your microphone. For known microphone types, a number of parameters are automatically set. Note 1: If the transducer is a microphone and the microphone type is known to the analyzer (as in the example in Fig.5.5, where Type 4189 details are known), then the parameters Nominal Sensitivity, Polarization Voltage, Free-field, Capacitance and CCLD are set automatically. See details in Appendix C. The analyzer can then make sound field correction and windscreen correction as specified in the setup. To confirm which type of correction is being applied, an icon is displayed in the measurement Status Field, as described on section 4.4.2. If the microphone is unknown to the analyzer, no corrections can be made and no icon appears in the Status Field. The parameters mentioned above have to be set manually (that is, typed in). We recommend that you insert the value for Nominal Sensitivity directly from the calibration chart. Nominal sensitivity is used in the automatic level detection calculations, when calibrating using Sound Calibrator Type 4231, to determine whether the level is 94 or 114 dB. Note 2: If the transducer is an accelerometer and the accelerometer type is known to the analyzer, then the parameters Nominal Sensitivity, CCLD and Weight are set automatically. In the top line of the Status Field you can select which transducer is currently connected to the analyzer. This can also be done via the Setup screen by selecting Input, then selecting the transducer in the Transducer field. In the first line of the Status Field you can select whether the transducer is connected to the Top Socket or the Rear Socket of the analyzer. This can also be done via the Setup screen by selecting Input, then selecting the socket in the Input: field. For Type 2270 only: In the second line you also have a Channel Selector. CHAPTER 5 Calibration 57 To change which input the transducer uses to connect to the analyzer, tap the Main Menu icon and select Setup from the list, next tap the Input value field and finally, choose the required input from the drop-down list: Top Socket or Rear Socket (Rear Socket refers to the Input socket on the connector panel of the analyzer). At the bottom of the parameter list you can select the calibration history for the currently selected transducer by tapping on the Calibration History link. See section 5.7 and Fig.5.2. You can delete a transducer by tapping on the Delete Transducer icon transducer to delete from the drop-down that appears. and selecting the Note: Only transducers that are not connected can be deleted. The calibration history will also be deleted. When you have finished, tap 5.9 to return to the Measurement screen. Calibration Reminder The Calibration Reminder tab (Fig.5.6), allows you to keep track of when you need to run your next Accredited/Traceable calibration, and shows you the date of your last calibration. Fig.5.6 Calibration Reminder tab The automatic calibration reminder facility will pop-up a reminder approximately two months before your next calibration and keep on reminding you every week until you do one of the following actions: • Send your analyzer for Accredited/Traceable Calibration and update the Last Calibration date • Check the ‘Do not ask/remind again’ checkbox in the reminder pop-up • Disable the automatic calibration reminder An example of a reminder pop-up is shown in Fig.5.7: Hand-held Analyzer Types 2250 and 2270 – User Manual 58 Fig.5.7 Reminder pop-up You can set the Calibration Interval parameter to either 12 months or 24 months depending on your local requirements. You can disable the facility by selecting the Automatic Calibration Reminder parameter to Off. 5.10 Charge Injection Calibration 5.10.1 Theory of CIC If an external sound source is not available, for example during short or long term monitoring, you can check the calibration of the analyzer using the Charge Injection Calibration (CIC) facility. This is done automatically during a logging measurement (see section 11.2 and section 12.2). Unlike an internal calibration, the Brüel & Kjær patented CIC technique enables a complete measurement chain to be verified, including the microphone, preamplifier, cabling and analyzer. Each verification measurement is compared to an initial reference measurement. As the name implies, the CIC method injects an internally generated charge into the microphone and preamplifier input circuit, and the ratio between the measured signal and the injected signal is measured (CIC Ratio; Fig.5.8). This method is based on the detection of changes in impedance at the input terminal. It was developed for monitoring of microphone channels and requires a preamplifier with a small, extremely stable built-in capacitor, which enables the application of an electrical signal to a preamplifier (and microphone) input terminal. A stable CIC Ratio means a ‘healthy’ system and assures stable operation of the microphone, cable, preamplifier and remaining measurement system. CHAPTER 5 Calibration Fig.5.8 59 Charge Injection Calibration. Low-leakage resistance capacitor Cc is set in parallel with the microphone and fed with voltage ei. The ratio eo /ei is constant when g, Cc , Cm and Ci are constant. Changes to preamplifier gain (g), cable parameters, microphone capacitance (Cm ), etc., will change eo /ei and, hence, indicate probable changes in calibration Microphone Preamplifier Cable Generator ( eo Cc ei = g C + C + C m i c Cm ) Cc eo g Ci R1 ei 970294/1 5.10.2 Performing a Manual CIC with your Type 2250/2270 CIC is only available for microphones connected to the Top Socket of the Analyzer and with Logging Software BZ-7224 and Enhanced Logging Software BZ-7225. Tap the Main Menu icon and select Calibration from the list. Click the CIC tab to view the various CIC parameters that are available. The available parameters will include the results of the latest manual CIC, together with the reference (Fig.5.9). The Status Field at the top of the screen informs you how to perform the CIC. Press the Start CIC button to start the CIC. After approximately 10 sec you will see the result. Normally, the CIC Reference Ratio is set the very first time a CIC is performed, however, you should update the CIC Reference Ratio if you change the microphone preamplifier. You do this by checking the Use as new Reference checkbox. The CIC Reference Ratio and CIC Ref. Date parameters display the results of the very first manual CIC, and this will be used as the ‘reference’ for all subsequent CIC Ratio measurements. Note: Each microphone in the transducer database has a CIC Reference Ratio. If the CIC Ratio parameter deviates by more than 0.5 dB from the CIC Reference Ratio, there may be a problem, and it should be investigated, see page 60. Hand-held Analyzer Types 2250 and 2270 – User Manual 60 Fig.5.9 CIC tab The result of the Charge Injection Calibration consists of four parameters: • CIC Ratio • CIC Ratio Date • Deviation from Reference • CIC Result The CIC Result can be either ‘Passed’, ‘Background noise too high’ or ‘CIC Ratio deviates from Ref.’ 61 Chapter 6 Data Management 6.1 Organising Measurements 6.1.1 Description of Jobs and Projects When saving a set of measurement results, they are organised together with setup information, calibration information, annotations and signal recordings in a project. A project contains the following: • Measurement results: – Broadband values (for example, LAeq, LAFmax, LAFmin, etc.) – Frequency spectra (if Frequency Analysis Software BZ-7223 is enabled on your analyzer and you have selected a Frequency Analyzer template) • Weather and GPS data • Measurement Setup • Display Setup (parameters you have selected) • Information on the microphone • Calibration • Annotations – Commentary (attached to measurements as required) • Annotations – Text, notes or GPS notes (attached to measurements as required) • Annotations – Image (attached to measurements as required) – Type 2270 only • Signal Recordings (attached to measurements as required) The project name is automatically created by combining the Project Name Prefix with a number (starting from 001),that is, PROJECT 001 for the first project, PROJECT 002 for the next, etc. If preferred, the Project Name Prefix can be changed from the default name of ‘Project’. To do this, tap the Main Menu icon , then Preferences followed by Storage Settings to reveal the Project Name Prefix. Tap the current name to reveal a keyboard for you to type in the required name. Hand-held Analyzer Types 2250 and 2270 – User Manual 62 Projects are saved in folders which are called ‘jobs’ on your analyzer. These are similar to folders in the Microsoft® Windows® filing system. Jobs can be created: 6.1.2 • in the internal memory • on a Secure Digital (SD) card • on a USB memory stick (hardware version 4 only) • on a Compact Flash (CF) card (hardware versions 1 – 3 only) Navigating in Jobs On the analyzer, a results browser called Explorer is used to navigate through the jobs and projects. To view all jobs and projects, tap the Main Menu icon and select Explorer from the list of options – or simply tap the project name on the Measurement screen. A screen similar to Fig.6.1 will appear. Fig.6.1 The Explorer screen The example from Explorer in Fig.6.1 displays a list of jobs and then some projects that have not been stored under a job name. The topmost line in the status area (INTERNAL DISK\ in the example in Fig.6.1) shows the location in the memory. The next line in the status area contains four icons for navigation. CHAPTER 6 Data Management 63 Tap the icon to go up one level in the job levels. The top level is the Memory level, where physical memory devices can be selected. You can select: • • With Hardware Versions 1 – 3: – Internal Disk – SD-Card (if a card is inserted in the SD slot) – CF-Card (if a card is inserted in the CF slot) With Hardware Version 4: – Internal Disk – SD-Card B (if a card is inserted in the bottom SD slot) – SD-Card T (if a card is inserted in the top SD slot) – USB-Mem (if a memory stick is inserted in the USB Standard A socket) If Multi User is enabled (see section 8.1.6), then each user can access data on any of the devices. However, a user cannot see or access jobs for other users. To go down one level (that is, exit the Memory level), you tap the job name (INTERNAL DISK\ in this case) and select Open from the drop-down list – or you simply tap the Memory icon next to INTERNAL DISK\. Tap the icon to create a new job folder. The first job folder name will be ‘JOB 01’, subsequent job folders will be labelled ‘JOB 02’, ‘JOB 03’, etc. You can rename the job folder name by tapping on the name and selecting Rename from the drop-down list. Use the keyboard to key in a new name – accept by tapping on the Enter key . To go down one level (open a job), you tap the job name in the list and select Open from the drop-down list – or you simply tap the Job icon to the left of the job name. You can move a job/project (and its content) to another job by tapping the job name/project name and selecting Cut from the drop-down list. Then navigate to the job you want as the new holder of the moved job/project and tap the Paste icon , or navigate to the level above and tap the job name and select Paste from the drop-down list. In order to copy a job/project, do as described above, but use Copy instead of Cut from the drop-down list. Select Delete from the drop-down list in order to delete the job/project and all of its contents. You can select more than one job/project for Copy, Cut or Delete by tapping and holding the stylus on a job/project name and then dragging the stylus up or down to select other jobs/projects. 6.2 Selecting Default Measurement Job/Path Tap the icon to select the current job as the default measurement job, where all projects will be saved when you press the Save pushbutton. The job name, followed by the current project name, will appear in the topmost line in the status area to confirm which job you have selected. Hand-held Analyzer Types 2250 and 2270 – User Manual 64 6.3 Recalling Measurements You can recall your measurement results to display the measured results, re-use setups from previously saved projects or view logged data as a profile. Use the Open command in Explorer – this will recall the project template (display settings and measurement setup used on the saved results) along with the results. This will, however, stop and reset the current measurement 6.3.1 Viewing Data and Re-using Setups from Projects Use Explorer to locate the project with the setup you want to re-use, then tap the project name and select Open from the drop-down that appears. This will stop and reset the current measurement and load the project including all setups and data. You are now using the same screens as the ones you were using just before you saved the data. Use the screens to browse the results. Pressing Start/Pause will start a new measurement using the setups from the project. You can save the setup information in a template by tapping the Template Bar at the top of the screen, see section 4.4.8. 6.3.2 Viewing or Listening to Annotations and Metadata Use Explorer to locate the project with the annotations you want to view/hear, then tap the project name and select Annotations from the drop-down that appears (or simply tap the Annotations icon ) and select the Annotations tab. This will show all annotations attached to the project (Fig.6.2.) Fig.6.2 Example of an annotation attached to a project CHAPTER 6 Data Management 65 The icon represents a verbal annotation, or commentary. Tap the annotation name and select Play from the drop-down that appears (or tap the icon) to play the commentary using the headphone output. Note: You can also rename or delete annotations, or copy or move annotations to other projects or jobs. The Text icon represents written annotations, or notes. Tap the annotation name and select Open from the drop-down that appears (or tap the icon) to open the Notes editor. View the comments and, if required, edit the comments using the simulated keyboard that appears at the bottom of the screen. Tap the icon to accept the changes and return to the previous screen. The Image icon represents image annotations. Tap the annotation name and select Open from the drop-down that appears (or tap the icon) to open the Image viewer. Tap the icon to return to the previous screen. Select the Metadata tab to see all metadata attached to the project (Fig.6.3). You can change the metadata just by tapping on them and entering new values. You can also edit the settings for the metadata and reuse specific metadata on new projects by tapping on the Edit icon for the specific metadata (further information in section 8.7). Fig.6.3 Example of metadata Inserting Annotations Using Explorer In addition to inserting commentary, text or image annotations on your current measurement, see section 3.5, you can insert commentary, text or image annotations on projects or jobs using Explorer. Tap a job or project name and select Add note, Add Comment or Add Image (Type 2270 only) from the drop-down that appears. 66 Hand-held Analyzer Types 2250 and 2270 – User Manual 67 Chapter 7 Connection to PC or Smart Phone 7.1 Introduction You can connect to your analyzer from a PC or smart phone in a number of different ways using a wide range of different connection types: • Use Measurement Partner Suite BZ-5503 for full control of the analyzer – see section 7.2 • Use an Internet browser for online display and control of the analyzer – see section 7.4 Two different methods are available for connecting to the analyzer: • USB: BZ-5503 connects to the analyzer through a USB cable • Network: The analyzer is connected to a network (local or Internet) via a modem, LAN cable or a wireless LAN adaptor. BZ-5503 or an Internet browser will then be able to connect to the analyzer through TCP/IP using the analyzer’s (global) IP address In addition to connecting to the analyzer, the analyzer itself can notify you by SMS or email, based on various conditions. For more information, see section 8.4. Table 7.1 gives you an overview of the different connection possibilities including links to relevant chapters with more details. Hand-held Analyzer Types 2250 and 2270 – User Manual 68 Table 7.1 Connection overview Connect from Connection Type Available Notifications Settings in Preferences BZ-5503 USB Modem = Disabled see section 8.2 – BZ-5503, Internet Browser or Smart Phone with Internet Browser Network or GPRS/EDGE/HSPA Modem Modem = GPRS/EDGE/HSPA Dialup Settings in Dialup Networking Network Settings Possibly settings in DynDNS see sections 8.2 and 8.3 Email see section 8.4 BZ-5503, Internet Browser or Smart Phone with Internet Browser Network Ethernet cable Modem = Disabled Possibly settings in DynDNS Network Settings see sections 8.2 and 8.3 Email see section 8.4 BZ-5503, Internet Browser or Smart Phone with Internet Browser Network CF WLAN (hardware versions 1 – 3 only) SD WLAN (G4 only) Modem = Disabled Possibly settings in DynDNS Network Settings Settings in Wireless Network see sections 8.2 and 8.3 Email see section 8.4 BZ-5503, Internet Browser or Smart Phone with Internet Browser Network DSL Modem/Router Modem = Disabled Possibly settings in DynDNS Network Settings see sections 8.2 and 8.3 Email see section 8.4 Note: The online help for BZ-5503 contains additional information on how to connect an analyzer using the different connection types. 7.2 Transferring Measurement Data to Your PC Measurement Partner Suite BZ-5503 is used for communication between your PC and the analyzer. You can use this software to: • Transfer measurement data and templates from the analyzer to your PC, and vice versa • View data • Organise data on the analyzer • Create users on the analyzer • Upgrade software on the analyzer • Install software licenses on the analyzer Using this software, measurements on the analyzer can be controlled from your PC and displayed online, using the same user interface on the PC as on the analyzer. Data transferred to the PC are organised in Archives. You can view the measurement data in the Archives. CHAPTER 7 Connection to PC or Smart Phone 7.2.1 69 Connect to Your PC Connect the analyzer to your PC using one of the following: • Hardware versions 1 – 3: – • The supplied Mini USB Cable AO-1476 – A modem connection – A LAN connection using a LAN cable (Type 2270 only) – A LAN connection via CF card adaptor Hardware version 4 (G4): – The supplied Micro USB Cable AO-1494 – A modem connection – A LAN connection The connection can be protected by requiring a login with user name and password – see settings in section D.11. See Chapter 8 for descriptions on how to set up your preferences, including PC connections. 7.3 Post-processing and Reporting Use the optional modules of the Measurement Partner Suite for data analysis and post-processing. For example, data in the archives can be post-processed directly in the Logging Post-processing Tools BZ-5503-A module or Spectrum Post-processing Tools BZ-5503-B module. Furthermore, data can be exported to to various post-processing tools like Evaluator™ Type 7820 for assessing environmental noise; Protector™ Type 7825 for assessing workplace noise; Qualifier™ Light Type 7831 for documenting reverberation time measurements; or Microsoft® Excel®. Signal recordings can be imported to Brüel & Kjær’s PULSE™ Multi-analyzer platform for further analysis. For more information on Measurement Partner Suite BZ-5503 and the PULSE multi-analyzer platform, see our website at www.bksv.com or contact your local Brüel & Kjær representative. For further information on post-processing and reporting capabilities, please refer to the online help included with the relevant PC software. This software is supplied on the Environmental Software DVD (BZ-5298) included with your analyzer. 7.4 Internet Browser for Online Display and Control of the Analyzer When the analyzer is connected to a network (see Fig.7.1) you can connect to the analyzer from a PC or smart phone using an Internet browser supporting JavaScript®. Analyzer Settings You access preferences by tapping on the Main Menu icon and selecting Preferences from the list of options (the screen shown in Fig.8.1 will appear). Hand-held Analyzer Types 2250 and 2270 – User Manual 70 Tap Remote Access Settings, or select the Plus icon next to Remote Access Settings and set the Web Server parameters to Enabled. Define sets of Usernames and Passwords: • one set for guest use (view only) • one set for administrator use of the analyzer (view and full control) See section 8.5 and section D.11 for more details. Connect to Analyzer When you enter the IP address or Hostname of the analyzer (see sections 8.2. and 8.3) in the address or location bar of the Internet browser, the following screen appears: Fig.7.1 2250 home page Click the Help link to get more detailed help on using the web page. Click the Service link for updating the software or for rebooting the analyzer. Click the View Instrument button to enter the web page for viewing the analyzer only. You might be prompted for the Guest Username and Guest Password defined for the web server (see section 8.5). Click the View and Control Instrument button to enter the web page for full access to the analyzer. You will be prompted for the Username and Password defined for the web server. CHAPTER 7 Connection to PC or Smart Phone 71 Fig.7.2 Prompt for username and password The View Instrument Web Page Fig.7.3 shows the View Instrument web page, where you have an online display of your analyzer. You can use the online display for monitoring the measurement only, you cannot change the display, or setup parameters, or start and stop measurements, etc. Fig.7.3 Online display for monitoring only The analyzer can be viewed by several people at the same time, however, the response time will increase with the number of connected browsers. Hand-held Analyzer Types 2250 and 2270 – User Manual 72 The View and Control Instrument Web Page Fig.7.4 shows the View and Control Instrument web page, where you have an online display and keyboard for full control of the analyzer. The online display can be used for monitoring the measurement. The keyboard on the screen has the same functions as the analyzer’s keyboard. Click on the display with the cursor to control the analyzer as you do when tapping on the analyzer display. Fig.7.4 Online display and keyboard for full control of the analyzer 73 Chapter 8 Advanced Use of the Analyzer – Tips and Tricks 8.1 Setting your Preferences on the Analyzer You can specify a number of parameters controlling display settings, power settings, regional settings, storage settings and users. These parameters are grouped together under Preferences. You access preferences by tapping on the Main Menu icon from the list of options. The screen shown in Fig.8.1 will appear. Fig.8.1 The Preferences screen and selecting Preferences Hand-held Analyzer Types 2250 and 2270 – User Manual 74 8.1.1 Display Settings Tap Display Settings, or next to Display Settings, to expand the list of available display settings (Fig.8.2). These parameters allow you to select a suitable display colour scheme. This may vary, depending on the lighting conditions at the time of the measurement. Fig.8.2 Display Settings screen The colour schemes are: • Indoor scheme – for everyday use • Alhambra and Arcade schemes – alternative colour schemes for everyday use • Outdoor scheme – for very bright conditions, where you need as much contrast as possible • Night scheme – for measuring under very dark conditions, where is needed night vision For each colour scheme, you can select the optimum choice of brightness for the traffic light (for example, High for Outdoor in bright light conditions and Low for Night in dark conditions) and whether to have backlight on the keyboard. In very bright lighting conditions you will not be able to see the backlight, set it to Off to save some power. A link is also provided in Display Settings to adjust the touch-sensitive screen. Tap Adjust Touch Screen > to display a full screen with guidance on how to tap a cross five times at different places on the screen. At the end of the adjustment procedure you can save the values or cancel the adjustment. To change the number of decimal places on your dB results readout between 1 and 2 decimal places, or to change the number of digits on your engineering units readout between 3 to 4 digits, tap Resolution of Readings and set to Normal or Extended, as required. This setting is for display only and has no effect on the measurement precision or resolution. Tap Display Settings, or , to collapse the list. CHAPTER 8 Advanced Use of the Analyzer – Tips and Tricks 8.1.2 75 Power Settings The analyzer has an advanced power management function that takes care of supplying the different circuits with adequate power and switches off circuits that are not in use. These power management functions can be changed via the Power Settings screen (Fig.8.3). Tap Power Settings, or next to Power Settings, to expand the list of power settings: • Backlight Dim • Standby • Turn off Backlight (only with hardware versions 1 – 3) • Ext. Power (only with hardware version 4 (G4)) Fig.8.3 Power Settings screen Left: For hardware versions 1 – 3 Right: For hardware version 4 The backlight will be switched on as soon as you operate the analyzer, either by using the keyboard or stylus on the touch-sensitive screen. The backlight brightness will be one of the six levels set by tapping at the bottom of the screen. Select Minimum for minimum brightness and (power consumption), and Maximum for maximum brightness and (power consumption). Once you have chosen the level, select Close to save the settings. When the analyzer has been left unused for the time specified in the Backlight Dim parameter, the backlight level will change to the dim level (Minimum): • For hardware versions 1 – 3, this state will hold for the time specified in the Turn off Backlight parameter (if still left unused). If the analyzer has been left unused for the time specified in the Backlight Dim parameter plus the Turn off Backlight time period, then the backlight will be switched off completely (Fig.8.4). Use the keyboard or tap the screen to switch the backlight on again • For hardware version 4, the backlight will never be switched off completely because the Minimum dim level already has the lowest power consumption Hand-held Analyzer Types 2250 and 2270 – User Manual 76 Fig.8.4 Power Settings overview ‘Standby’ Parameter ‘Backlight Dim’ Parameter ‘Turn off Backlight’ Parameter (hardware v. 1 – 3) Backlight off Time 040284/2 If the analyzer is left unused, not measuring and not communicating over the USB interface, it will go to Standby after the time specified in the Standby parameter. If in Standby mode, you must press to switch the analyzer on again. The analyzer will automatically switch off when it has been in Standby mode without external power for more than 30 hours. Note 1: If the analyzer is powered externally, the Standby After parameters are ignored and the analyzer will never go to Standby. However, if the analyzer is left unused for more than Standby After time, the Standby After setting will overrule the Backlight settings and the backlight will be switched off or dimmed. Note 2: Please use the Display Settings in conjunction with the Power Settings to save power during measurements and extend the battery operating time. Hardware version 4 (G4) has an Ext. Power setting, which determines whether the analyzer automatically switches on and charges the battery when external power is applied or the battery is just charged. It is recommended to select the Switch On and Charge setting for unattended measurements, to ensure measurement will restart in case of power failure. Hardware versions 1 – 3 have a similar function. There is a small, manual switch at the back of the analyzer, under the battery pack. To access the switch, remove the battery. When you have made your choices, tap Power Settings, or 8.1.3 , to collapse the list. Regional Settings Tap Regional Settings, or settings (Fig.8.5). next to Regional Settings, to expand the list of available regional CHAPTER 8 Advanced Use of the Analyzer – Tips and Tricks 77 Fig.8.5 Regional Settings screen Select your preferred settings for Decimal Point and Date Separator and select your preferred Date Format (date and time) from the six different formats provided in the drop-down. Then select your Time Zone from the list. A number of different languages are available for your analyzer. Select your preferred Language – if it is not in the list, then it might be available for installation using BZ-5503 (Harware version 1 – 3 only). Built-in help is provided in the more commonly used languages – if your particular language is not covered, English will be chosen automatically. Select a Keyboard matching the one you prefer when using your PC. Select the unit system for Wind Speed Unit, Temperature Unit, Dimension Unit and Vibration Unit, as required: • Use the SI setting for measurement units in accordance with the SI standard, for example, measuring Wind Speed in m/s • Use the US/UK setting for imperial measurement units, for example, measuring Wind Speed in mph When you have made your choices, tap Regional Settings, or 8.1.4 , to collapse the list. Storage Settings Each time you save the results of a measurement, the analyzer suggests a project name and number for the project. The Project Name Prefix can be generated automatically (from the start date of the project as Year, Month, Date in the format YYMMDD, for example, 051112 as 2005, NOVEMBER 12th) or you can specify a Project Name Prefix (max. eight characters), using the standard, full character keyboard that pops up when you tap the current name set as the Project Name Prefix (Fig.8.6). (The field where you type in the Project Name Prefix will appear at the top or bottom of the pop-up keyboard, depending on how many settings you have expanded in the list.) The project suffix number will be generated automatically. Hand-held Analyzer Types 2250 and 2270 – User Manual 78 Fig.8.6 Storage Settings screen 8.1.5 Headphone Settings The Headphone Settings allow you to control the output to the headphone socket on the connector panel. Commentary annotations on measurements can always be heard on the headphones, regardless of the options chosen in Headphone Settings. In addition to the commentary annotations, you can listen to the measured signal for monitoring purposes. Select between A/B-weighted, C-weighted or Z-weighted. (A/B-weighting is determined by setting the parameter in Setup > Frequency Settings > Broadband (excl. peak)). The measured signal covers approximately 120 dB (from approximately 20 dB to 140 dB with a Type 4189 or Type 4190 microphone of nominal sensitivity). The output of the headphone socket covers approximately 75 dB. Use the Gain settings for the measured signal to adjust the output level to suit the listening conditions. If the signal has a very high dynamic range (or the levels are unknown), you can set Automatic Gain Control to On – this will convert the 120 dB input range to 40 dB output range enabling you to hear signals of any level clearly. Individual Gain settings are provided for the commentary annotations and the measured signal. Tap the gain parameter and use the keypad to enter a new setting. Use ‘@’ to assign the new value for immediate response at the output – or use the up/down navigation keys to increment/decrement the value. Note 1: A 0 dB gain on the measurement signal means you get a 1 V output for a 1 V input (when the measured signal Automatic Gain Control is set to Off). Note 2: While playing back an annotation, you can use the up/down navigation keys to increase/decrease the gain of the annotation. Note 3: If you do not want to listen to the input signal, then set the Listen to Signal parameter to No, to economise on power. CHAPTER 8 Advanced Use of the Analyzer – Tips and Tricks 8.1.6 79 Multi-user Facility The analyzer can handle more than one user. Each user can have their own set of preferences, templates and jobs and projects – completely invisible to other users. This can also be very useful in organising large measurement jobs or cases – you can separate the cases completely from each other by handling each case as a separate user. The transducers, the calibration setup and the calibration histories of the transducers are common to all users, as shown in the overview provided in Fig.8.7. Fig.8.7 Overview of Multi-user Facility Instrument Transducer User 1 Calibration Setup Calibration History User N Preferences Template Display Param. Setup Project Template Meas. Data Annotations Preferences Template Display Param. Setup Project Template Meas. Data Annotations 040105 Tap Users, or the plus icon , then select Yes in the Multi User Enabled drop-down to distinguish between different users. The analyzer, when delivered, has one default user called ‘2250’ (for Type 2250) or ‘2270’ (for Type 2270). You require Measurement Partner Suite BZ-5503 (included with the analyzer) to set up new users on the analyzer (see section 7.1). 8.1.7 Printer Settings You can make screen dumps on a printer connected to the analyzer using a standard USB cable, or on hardware versions 1 – 3, the supplied Adaptor AO-0657. Use the Printer Settings to select your preferred printer. Hand-held Analyzer Types 2250 and 2270 – User Manual 80 When a printer has been selected under the Printer Used parameter, then the Print Screen command in the Main Menu list appears. Use this command to print a screen dump of any screen on the analyzer. The printer must either be a mobile thermal printer (from AM Tech or Seiko) or accept the PCL® printer language: • MPS: Mobile Pro Spectrum – a mobile thermal printer from AM Tech (www.amteq.co.kr) • PCL: printers accepting PCL printer language • PCL Inkjet: suitable for Inkjet printers and supports colour printing • PCL Laser: suitable for laser printers • Seiko DPU: DPU-S245 or DPU-S445 – mobile thermal printers from Seiko Instruments (www.seikoinstruments.com) PCL is the Printer Control Language developed by Hewlett-Packard (see www.hp.com). For PCL printers, you can use the Top and Left Margin parameters to position the print on the paper, and use Width and Height parameters to set the size of the print. 8.2 Modem/DynDNS Settings You can use the analyzer for monitoring in remote places and control it using Measurement Partner Suite BZ-5503 via a telephone connection – wired or wireless – using suitable modems or via network connections. See the overview of possibilities in Table 7.1. When you connect via a modem, or via a network connection, you will see the contents of the analyzer in the Instrument Task as if you had made the connection via USB. You then have the same possibilities for transferring data to the Archives and organising data on the analyzer, as if you were connected via the USB connector. The analyzer is connected directly to the Internet through a modem. BZ-5503 or an Internet browser will then be able to connect to the analyzer through TCP/IP using the analyzer’s (global) IP address. The setup of the modem connected to the analyzer is described in section 8.2.2 – please refer to the BZ-5503 online help for details on how to make a connection. 8.2.1 Connection to the Network using a LAN Modem Using a 3G modem with LAN interface is a simple and very reliable and powerful way of remotely connecting to the analyzer. Set up the modem according to its user manual (usually requires connection to a PC) before you connect the modem to your analyzer. When ready, connect the modem to the analyzer using a LAN cable. For hardware versions 1 – 3, you will also need the 10/100 Ethernet CF Card UL-1016. (See “Ordering Information” on page 216.) The Modem parameter should be set to Off. The Airlink Raven XE, Intelligent 3G Ethernet Gateway from Sierra Wireless (www.sierrawireless.com) has been tested. Note: The SIM card account should include a data subscription and be usable without a pin code. CHAPTER 8 Advanced Use of the Analyzer – Tips and Tricks 8.2.2 81 Connection to Network using GPRS/EDGE/HSPA Modem Note 1: Turn off the analyzer when connecting the analyzer to a modem. Note 2: The SIM card account should include a data subscription and should be usable without a pincode. To use the modem you need to set up the parameters in Dialup Networking (listed below) and set the Modem parameter to GPRS/EDGE/HSPA Dialup. Parameters in Dialup Networking: • APN (Access Point Name) is an identifier required by the network operator. Examples are Internet, public and www.vodaphone.de • Username, Password and possibly Domain should be set as required by the network operator When the Modem parameter is set to GPRS/EDGE/HSPA Dialup, then a connection is made using the settings in Dialup Networking. The Status parameter reflects the current status of the network connection – for example, ‘Connected’ or ‘Disconnected’. If the connection fails, then the analyzer will try to reconnect – until it succeeds, or the Modem parameter is set to Disabled. If the connection succeeds, then the analyzer will automatically get an IP address, which is readable (but not accessible) in Network Settings – for more details see section 8.3. The IP address is the address on the WAN (Wide Area Network) or Internet. Use this address in BZ-5503 or an Internet browser to connect to the analyzer. Note: In some cases you might be able to get a static IP address from the network operator, which means that the analyzer will always have the same IP address when connected to the network. However, typically the IP address will be renewed each time the analyzer connects to the network. In order to deal with this, in BZ-5503 or via an Internet browser you need to use DynDNS – see section 8.2.3. Modems with USB Interface The Airlink Fastrack Xtend GPRS, EDGE and HSPA modem from Sierra Wireless (www.sierrawireless.com) has been tested Modems with an USB interface can be connected to the USB Type A socket on hardware version 4. Modems with RS– 232 Serial Interfaces The following modems have been tested: • FASTRACK Supreme 10 and 20 GSM/GPRS/EDGE Modem from Wavecom • Airlink Fastrack Xtend GPRS, EDGE and HSPA from Sierra Wireless (www.sierrawireless.com) Hand-held Analyzer Types 2250 and 2270 – User Manual 82 For hardware version 4, modems with an RS– 232 serial interface can be connected using a USB to serial converter inserted in the USB Type A socket of the analyzer. The following USB to serial converters have been tested: • USB to RS–232 Converter UL-0250 (See “Ordering Information” on page 216.) • ES-U-1001-R10, ES-U-1001-B10 and ES-U-1001-A from EasySync (www.easysync-ltd.com) • USB to RS232 Standard, USB to RS232 Professional and USB to RS232 Mini STD from U.S. Converters (www.usconverters.com) For hardware versions 1 – 3, use a compact flash-to-serial converter inserted in the compact flash slot of the analyzer. Serial I/O CF Card – Ruggedized from Socket (www.socketmobile.com) has been tested. Compact Flash Modems (for Hardware Versions 1 – 3) Compact GPRS from Pretec (www.pretec.com) has been tested. Compact flash modems can be inserted directly in the compact flash socket of the analyzer. 8.2.3 DynDNS If the analyzer is connected to the Internet through a GPRS/EDGE/HSPA modem or a local network with access to the Internet through a DSL modem/router and you want to connect to the analyzer from a place outside the local network, then you need to know: • Global IP address of the analyzer, or • Global IP address of the DSL modem/router (and ensure that correct port forwarding in has been set the router – details in the online help for BZ-5503) In some cases, the global IP address is static and will never change, so you connect to the analyzer using BZ-5503 or an Internet browser using this IP address. Normally when you browse to addresses using an Internet browser you do not use the IP address itself, but a hostname for it (for example, you would use the hostname www.google.com instead of ‘74.125.77.99’). This requires a DNS (Domain Name System) provider, which is a kind of Internet phone book that translates hostnames to IP addresses for you. However, for a GPRS/EDGE/HSPA or even a DSL router, often the global IP address is renewed at each new connection or at certain time intervals (for example, every two weeks). In this case you will have to change the IP address in BZ-5503 or the Internet browser accordingly. To avoid this, a service like DDNS (Dynamic Domain Name System) can be used. DDNS is a network service that provides the capability for a modem/router/computer system to notify a domain name system provider to change, in real time (ad-hoc), the active DNS configuration of its configured hostnames and IP addresses. This will ensure that the hostname you use will always be updated to reflect the correct IP address. The analyzer supports DDNS provided by the worldwide DDNS service provider ‘DynDNS.com’. CHAPTER 8 Advanced Use of the Analyzer – Tips and Tricks 83 The analyzer can then be configured to notify DynDNS.com each time the global IP address is set or changed. When BZ-5503 or an Internet browser connects to the analyzer, it then uses a hostname defined by DynDNS.com. From DynDNS.com it then gets the updated IP address. You need to make an account at DynDNS.com, specifying a user name and a password for the account and a hostname (for example, 'MyBK2250.dyndns.org') identifying your analyzer. In the analyzer you need to specify the Hostname, Username and Password and set Active to Yes in Preferences, under Modem/DynDNS settings. Each time the analyzer detects a change in the IP address it notifies DynDNS.com. Note: To avoid too much traffic at DynDNS.com, the analyzer ensures that this service does not allow updates of settings more frequently than every 10 minutes. So you may experience up to a 10 minute wait for DynDNS settings to update. 8.3 Network Settings The analyzer can be connected to a LAN (Local Area Network) through an Ethernet interface or to WLAN (Wireless Local Area Network) using equipment conforming to the IEEE 802.11a/b/g standard. This connection can be used to synchronise measurement and setup data with a host PC using BZ-5503. The analyzer supports TCP/IP (Transmission Control Protocol/Internet Protocol) on the LAN and WLAN. This requires the analyzer to have a unique address on the network. This address is called an IP address and consists of four sets of 3-digit numbers, for example, 010.116.121.016. The IP address can be obtained in different ways: • Automatically • Using DHCP A DHCP (Dynamic Host Configuration Protocol) Server on the network assigns automatically an IP address to the analyzer when connected to the network. This is the most common way of setting up IP addresses • Using Link-local If no address is automatically assigned by the DHCP Server, then after a few seconds the analyzer will use an address from the Link-local address range 169.254.x.x This will most likely be the case when connecting the analyzer directly to a PC using an Ethernet crossover cable • Manually You setup the IP address manually This will typically be the case in a private network without a DHCP Server Hand-held Analyzer Types 2250 and 2270 – User Manual 84 8.3.1 Connecting to the Analyzer Wired LAN Connection • Use a “straight-through” (standard) Ethernet cable with RJ45 connectors at both ends to connect the analyzer to the network (via a hub, switch or router) • Use a “crossover” Ethernet cable with RJ45 connectors at both ends to connect the analyzer directly to a PC Hardware version 4 has an Auto-MDIX facility, allowing you to use either a straight-through or crossover cable to connect to a network or PC. With hardware versions 1 – 3, only Type 2270 has a built-in LAN socket on the connector panel (see section 2.3). WLAN Connection Types 2250 and 2270 provide a wireless LAN option using a WLAN card. Types 2250 and 2270 with hardware version 4 accept the following SD WLAN card: • P322 802.11abg SD WLAN from Socket Mobile (www.socketmobile.com) – Brüel & Kjær order number UL-1025 Types 2250 and 2270 with hardware versions 1 – 3 accept the following compact flash LAN and WLAN cards: 8.3.2 • 10/100 Ethernet Ruggedized CF Card from Socket Mobile (www.socketmobile.com) – Brüel & Kjær order number UL-1016 • Go Wi-Fi!® P500 CF WLAN, rev. B and rev. C from Socket Mobile – Brüel & Kjær order number UL-1019 Parameters in Network Settings Location Use the Location parameter to specify a text up to 20-character long, identifying the analyzer or location of the analyzer. The Location will be displayed on the PC as well as the serial number of the analyzer when browsing for analyzers in BZ-5503 and when connected using the online display Note: The Location parameter is useful for both USB and LAN connections Network Connection • Hardware versions 1 – 3: Type 2250: – None: (default) – CF Socket: Select this to use an Ethernet CF Card in the Compact Flash socket CHAPTER 8 Advanced Use of the Analyzer – Tips and Tricks 85 Type 2270: • – LAN Socket: (default) Select this to connect via a LAN cable. This is disabled if an Ethernet CF card is inserted in the Compact Flash socket – CF Socket: Select this to use an Ethernet CF Card in the Compact Flash socket Hardware version 4 (G4): For all analyzer types, the default is LAN Socket Set IP Address Automatically: This will obtain an IP address from a DHCP server – if no server available, then a Link-local address will be set Manually: You have to set the IP Address, Subnet Mask, Default Gateway, Preferred DNS and Alternate DNS (see below) IP Address The IP address of the analyzer Selectable if Set IP Address = Manually Subnet Mask The Subnet Mask combined with the IP Address identifies the network segment the analyzer is on Selectable if Set IP Address = Manually Default Gateway Address to a gateway for routing to another network Selectable if Set IP Address = Manually Preferred DNS The IP address of the primary DNS server Alternate DNS The IP address of the secondary DNS server MAC Address The MAC address of the network adaptor (LAN or WLAN) in use. MAC (Media Access Control) address is a unique identifier assigned to the network adaptor. This field is for information only Status The status of the network connection, either Operational or Non-operational: • Operational: the network adaptor can be used for a connection • Non-operational: the network adaptor cannot be used Hand-held Analyzer Types 2250 and 2270 – User Manual 86 Parameters for Wireless LAN Only Name Name (SSID) of the network you want to connect to. Update the name either by: • entering a name directly, or • tapping on Available Networks and selecting a name from the list Available Networks Tap the line to get a list of available networks. Tap a name in the list to connect to this network. The name is inserted in the Name line above this line. Each network name is preceded with Signal Strength information, ranging from Excellent (displayed as ‘• • • • •’) down to No Signal (displayed as no dots at all) Security Select the Security as required by the network: Open, Shared, WPA PSK or WPA2 PSK. Open and Shared are for WEP (Wired Equivalent Privacy) Infrastructure mode. WPA PSK is for WPA (Wi-Fi Protected Access) with Pre-shared Key (also called Personal mode). WPA2 is an enhanced version of WPA Encryption Select the Encryption as required by the network: None, WEP Enabled, AES Enabled or TKIP Enabled. None is for Open security. WEP Enabled is for Open and Shared security. AES and TKIP Enabled are for WPA PSK and WPA2 PSK security Encryption Key Insert the Encryption Key required by the network. The key will be displayed until you press Enter, then it will be replaced by ‘ *** ’ 8.4 Notifications The analyzer can send you a daily status or notify you if noise level exceeds a set threshold level, if disk space is getting low or external power has disappeared, etc. This is done via SMS (text message) or e-mail, as described in this section. The SMS/e-mail notification contains a short status report for the analyzer. This facility is especially useful if the analyzer is left for unattended monitoring. 8.4.1 Alarm Settings If one or more of the following alarms occur, then a notification will be issued as either an SMS or an e-mail, depending on your equipment and settings. If the notification fails (for example, the connection has been lost), then the analyzer will retry to send the notification once more after five minutes. CHAPTER 8 Advanced Use of the Analyzer – Tips and Tricks Table 8.1 Alarm Settings Alarm Type Condition Comment Power On When analyzer is switched Indicates start from a timer, or a power failure, or on or reboots unexpected behaviour Measurement State When a measurement starts or stops Indicates measurement finished – or unexpected behaviour CIC When Charge Injection Calibration fails Indicates possible measurement problem Internal Battery When Internal Battery is entering a specified state: High, Low or Critical. Indicates internal battery getting low. Internal Battery will be in one of the states: Full, High, Low, Critical, Charging or Unknown. You can set alarm to High, Low or Critical in Preferences > Notification Settings > Alarm Settings > Internal Battery. Note: The internal battery will typically be in one of the states Full or Charging if externally powered. Entering one of the set states might then indicate a power failure Trigger Input Voltage When voltage at Trigger Input drops to or below a specified level Indicates no external power, or external battery getting low. Set Setup > Input > Trigger Type to Voltage for Monitoring. Set the voltage limit in Preferences > Notification Settings > Alarm Settings > Trigger Input Voltage. Connect the external battery or external power to this input (in addition to the External Power Socket) to get an alarm if the voltage drops to or below the specified level Disk Space When remaining disk space drops to or below a specified percentage of the total disk space Indicates disk space getting low – needs to be swapped with an empty disk. Set the percentage in Preferences > Notification Settings > Alarm Settings > Disk Space Level Trigger When level trigger conditions are fulfilled Indicates sound level exceeds trigger level specified in Logging or Enh. Logging template Report Level When LAeq of the latest Report Period exceeds Report Threshold Level Indicates that the sound level LAeq for the latest Report Period exceeds Report Threshold Level. Note 1: If you specify a very low Report Threshold Level you will receive a notification at the end of each Report Period Note 2: Only available when running the Enhanced Logging template Note 3: For 2-channel Enh. Logging the Report Threshold Level is used for Ch.1 and Report Threshold Level 2 is used for Ch.2. 87 Hand-held Analyzer Types 2250 and 2270 – User Manual 88 Table 8.2 Content of Notification Information Type Content Reason for notification ‘Test’, ‘Alarm’ or ‘Status’ followed by a short description Time of notification Date and Time Instrument ID Serial No. and Location Status of current Disk Free memory / Total memory Status of Internal Battery Full, High, Low, Critical, Charging or Unknown Trigger Input Voltage (if available) The voltage Measurement Status (if available) Running, Paused or Stopped No. of Signal Recordings (if available) The number of signal recordings made since start of measurement Latest CIC Result (if available) Passed, Background noise too high, Ratio outside tolerances, Ratio deviates from Ref., Undefined Ref., or Undefined. For 2-channel measurements: One CIC result per channel Current value of LAF (if available) The value. For 2-channel measurements: One CIC result per channel Report Threshold Level The value Report Level LAeq The value Note: Some of the information listed above may not be available, depending on the conditions when the notification was sent, for example, no measurement values will be available immediately after a power on. 8.4.2 Text/SMS Notifications Notifications via SMS (text message) can be used if you have connected a GSM/GPRS/EDGE/HSPA modem to the analyzer (see section 8.2.2) and set Modem to Disabled (a text message cannot be sent if the modem is set to GPRS/EDGE/HSPA Dialup). In addition to sending notifications initiated by alarms, you can send an ‘Info’ text to the analyzer and ask for an SMS notification, after which you will get a notification within 30 seconds. You need to setup a Phone Number in Preferences > Notifications > SMS and set Active to Yes for the SMS. You can also add a Name for the number for easier identification. You can setup two individual SMS phone numbers for sending the SMS notification to two recipients. Set Notification to SMS and a notification will be sent by SMS to the active phone numbers, when any of the alarm conditions are met, or if the analyzer receives an ‘Info’ SMS. CHAPTER 8 Advanced Use of the Analyzer – Tips and Tricks You can test the system by tapping on the Main Menu icon cation via SMS”. 89 and selecting “Send Notifi- Note 1: Two to three text messages will be used to send the complete notification – depending on the content and language settings. Note 2: Text messages cannot be sent or received while the analyzer is connected to BZ-5503 or displayed online. 8.4.3 E-mail Notifications E-mail notifications can be used if the analyzer is connected to a network with access to a mail server. This can typically be done if the analyzer is connected through LAN or by a GPRS/EDGE/HSPA modem (see section 8.2.2 and section 8.3). Go to Preferences > Notifications > E-mail and setup details for the e-mail account under the To parameter. The details consist of the SMTP server name, the SMTP Port used, whether SSL/TLS is required or not, the Account, the Username and Password for the account – please consult section D.10 (Appendix D) and your e-mail provider for more details. Set Notification to E-mail and a notification will be sent by e-mail when any of the alarm conditions are met. You can test the system by tapping on the Main Menu icon cation via E-mail. and selecting Send Notifi- Example of e-mail: Subject: E-mail from 2479719 Abbey Road Test: Manual e-mail Test: Manual e-mail 29-04-2009 12:51:16 Instrument 2479719 Abbey Road SD-Card 383 MB / 483 MB Internal Battery Charging Trigger Input Voltage 13.5V Measurement Status Running No. of Signal Recordings 13 CIC Result Passed LAF 45.8dB Hand-held Analyzer Types 2250 and 2270 – User Manual 90 8.5 Web Server To connect to the analyzer using an Internet browser, the following conditions must be fulfilled: • The analyzer must be connected to a network as described in section 8.2.2, section 8.2.3 and section 8.3 • The Internet browser must support JavaScript® The web page of the analyzer has been tested on the following Internet browsers: • Microsoft® Internet Explorer®, from version 7 • Mozilla® Firefox®, from version 3 • Google Chrome™, from version 2 • Apple® Safari®, from version 4 You may also be able to connect to the analyzer using Internet browsers on smart phones such as an iPhone®. 8.5.1 Password Protection Connection to the analyzer is password protected. There are two levels of protection: • Guest – for viewing only • Administrator – for viewing and controlling the analyzer Username and Password Under Preferences you set the Username and Password individually for the Guest and for Administrator accounts. You need to specify Username and Password for the Administrator, however, you can specify whether a guest requires a login or not. 8.6 Connecting to Weather Stations and GPS Receivers 8.6.1 Weather Stations The analyzer can be connected to the following weather stations: • Weather Station MM-0316 – for measurement of wind speed and wind direction • Weather Station MM-0256 – for measurement of wind speed, wind direction, ambient temperature, ambient pressure, relative humidity and liquid precipitation Please refer to the user manual for Noise Monitoring Terminal Type 3639-A, B and C (BE 1818) for details on how to mount and connect the weather station using Utility Unit ZH-0698. When you have connected the Weather Station, you can verify the connection by displaying the instantaneous updated parameters Wind Dir. and Wind Speed from the Weather group. CHAPTER 8 Advanced Use of the Analyzer – Tips and Tricks 91 Data from the weather station is automatically obtained during the measurement and saved on data – see measurement parameters in Appendix B. The measured data can be displayed as parameters from the Weather group. Fig.8.8 Data from weather station obtained during a measurement and saved on data 8.6.2 GPS Receivers The analyzer can be connected to the following GPS receivers: • GPS Receiver ZZ-0249 – for measurement of latitude, longitude, altitude and position error Please refer to the user manual for Noise Monitoring Terminal Type 3639-A, B and C (BE 1818) for details on how to mount and connect the GPS receiver using Utility Unit ZH-0689. • ND-100S GPS USB Dongle from Globalsat (www.globalsat.com.tw) – for measurement of latitude, longitude and altitude • BU-353 Cable GPS with USB Interface from Globalsat – for measurement of latitude, longitude and altitude The GPS receivers with USB interface can be connected directly to the USB port on analyzers with hardware version 4. On hardware versions 1 – 3, the GPS receivers can be connected using USB Adaptor AO-0657. The first time you connect the GPS receiver to the analyzer (or if it has been several days since you last connected them), be sure to be in an open area with a clear view to the sky (such as a park or empty field). Wait for GPS initialization to complete. This may take a few minutes depending on factors such as the distance from the previous coordinates, GPS signal strength and surrounding terrain (tall trees and buildings can block the satellite signals). Once the Latitude and Longitude (from the Special parameter group) display data, a fix has been initialized (the LED on the GlobalSat GPS will also start to flash). Hand-held Analyzer Types 2250 and 2270 – User Manual 92 In some cases initialization can take up to several minutes depending on the conditions mentioned above before complete GPS data are displayed on the screen. The GPS may get a faster fix if connected through a small USB cable (delivered together with the GPS). If a GPS receiver is connected when data are saved in a project, a GPS note is automatically created as an annotation with the GPS information. See more details on GPS notes in section 3.5. 8.7 Preparing your Measurements You can prepare your measurements in advance by making job folders, setting up the correct measurement parameters in the templates, defining settings for metadata and by making checklists (see example in Fig. 8.8) either as memos containing addresses and phone numbers of relevant people, or notes that have been partly filled-in beforehand, where you just have to fill in the final information on location. The notes can be attached to jobs as annotations, and can be copied onto projects, when necessary. Fig.8.9 Example notes screen When you have finished typing in your note, tap the icon to accept the changes and save it as a text annotation. See section 3.5 for more details on annotations. 8.7.1 Metadata For easy and convenient use of metadata, it is an advantage to define the settings for the metadata entered and displayed on the Annotations screen (see section 3.5) in advance. CHAPTER 8 Advanced Use of the Analyzer – Tips and Tricks 93 Define settings for each of the 30 metadata. Tap the Edit icon in front of the metadata you want to edit (Fig.8.10) to define: • Metadata: – Enabled (visible and editable on the Annotations screen) or – Disabled (invisible on the Enabled (visible and editable on the Annotations screen) • Name: Insert a name preceding the metadata value when displayed on the Annotations screen • Type: Select a type suitable for your metadata. Select between: – • – Pick List: The metadata are selected from a list of up to 30 user-defined texts – Number: The metadata number is entered using the numeric keyboard – Index: The metadata number is automatically incremented after creating the project – Not defined: The metadata are removed from the project. This will be the initial state of metadata for old projects without metadata. Entry No. (for type = Pick List): – • Text: The metadata is the text you enter or edit using the alphanumeric keyboard The entry number for the text to be defined in the pick list. Select the required number and enter text in the Entry Text field Entry Text: – For Type = Text: The text – For Type = Pick List: The text for the selected Entry No. • Current No.: For Type = Number: The number • Current Index: For Type = Index: The index • Step (for Type = Index ): – The Current Index is incremented with Step after creation of a project – The index wraps around when exceeding Upper Limit or getting below Lower Limit Note: Step can be negative • Upper Limit: For Type = Index: The upper limit of the index • Lower Limit: For Type = Index: The lower limit of the index At the top of the screen you can set a checkmark to use the settings for this metadata on new projects when closing the display. The checkmark is disabled for changes to the definition of the metadata currently in use because this will always be used for new projects, however, when you are editing or looking at metadata from a previously saved project you can decide whether to use the settings on new projects too or keep the changes to the project only. Hand-held Analyzer Types 2250 and 2270 – User Manual 94 Fig.8.10 Edit metadata 8.7.2 Timers and Automatic Measurements Automatic control of the analyzer is available via one or more of the analyzer’s timers (up to ten). The purpose of a timer is to initiate measurements in the absence of an operator. Basically, a timer will: • Switch on the analyzer at a preset time • Load a preselected template • Start a measurement as specified in the template • Stop the measurement after a preset time defined by the Timer Setup • Save the measurement • Switch the analyzer off • Repeat the above a preset number of times at preset intervals For a timer to work, the analyzer must be in the ‘switched off’ state. A timer will never interrupt the analyzer if it is already in use manually. If a switch-on time is set during the time the analyzer is in use, the timer opportunity is lost. You can control the analyzer during a timer-initiated measurement as long as this does not affect the measurements. If you try to change any parameters affecting the measurement you will be warned of this. If you persist, the analyzer will revert to manual control and timer control cannot be resumed. The Timer Setup lists the timers that have been defined previously on the analyzer (that is, added by you or previous users). CHAPTER 8 Advanced Use of the Analyzer – Tips and Tricks 95 Fig.8.11 Example Timer Setup In the topmost line you can add other timers by tapping on the Add New Timer icon . You can delete a timer from the list by tapping on the Delete Timer icon . Only timers created by the current user can be deleted. To delete a timer defined by another user, you have to logon as the other user and then delete the timer. For each timer you can specify: • State: Enable or disable the timer • Name: Name the timer • Template: Select the template you want to use for the measurement. Note: Reverberation Time templates are not available for timer control • Start Time: Set the start time – at least 3 minutes ahead of current time • Preset Time: Set the preset time for the measurement – regardless of the settings in the template used by the timer • Stop Time: The time when the measurement stops – for information only • No. of Starts: Set to the total number of times you want to start the measurement • Start Every: The time interval between the start of each successive measurement. This interval must be greater than Preset Time + 3 minutes • User: The user who specified the timer. Cannot be changed Note: When using timers for automatic measurements, ensure the meter is connected to a stable power supply. It is advised to set the Ext. Power switch to Charge battery only – see section 8.1.2. 96 Hand-held Analyzer Types 2250 and 2270 – User Manual 97 Chapter 9 Updating and Upgrading Applications, Maintenance, Calibration and Troubleshooting 9.1 How to Install New Applications Sound Level Meter Software BZ-7222, Frequency Analysis Software BZ-7223, Logging Software BZ-7224, Enhanced Logging Software BZ-7225, Signal Recording Option BZ-7226, Reverberation Time Software BZ-7227, Building Acoustics Software BZ-7228, FFT Software BZ-7230, Tone Assessment Option BZ-7231, Noise Monitoring Software BZ-7232 and Low Frequency Option BZ-7234 are pre-installed on Types 2250 and 2270. In addition, 2-channel Option BZ-7229 (and the 2-channel modules for Sound Level Meter, Frequency Analysis, Logging, Enhanced Logging and Building Acoustics software) and Sound Intensity Software BZ-7233 are pre-installed on Type 2270. However, a valid license is required to run the software. If you have purchased the analyzer together with the software application(s), then the relevant license(s) will come pre-installed on the analyzer. If you purchase a separate software application for your analyzer, then you have to install the license onto the analyzer. This is done using Measurement Partner Suite BZ-5503, please consult the on-line help included with the BZ-5503 software for instructions on how to install a license. Tap 9.2 , on the analyzer’s screen, then About to get a list of installed software and licenses. How to Update/Upgrade Applications and Install New Languages Brüel & Kjær recommends that you always use the most current software available. New versions of the analyzer software are available for download via the Brüel & Kjær website (www.bksv.com), which you may want to install on your analyzer. To do this, use Measurement Partner Suite BZ-5503, or connect the analyzer directly to the Internet to download. Some software versions will be free updates, and some will be upgrades requiring that a new license is purchased. Hand-held Analyzer Types 2250 and 2270 – User Manual 98 9.2.1 Update/Upgrade using BZ-5503 BZ-5503 can be used for updating or upgrading new software applications on your analyzer. It can even downgrade to specific software versions if required by type approval authorities. Using BZ-5503, you can also install licenses for the specific applications; and, if you have hardware version 1 – 3, install your preferred language (with G4 hardware, all languages are pre-installed in the analyzer). Installation requires a USB connection between BZ-5503 and the analyzer. The BZ-5503 software will clearly indicate if the new software version is an update (free of charge) or an upgrade (license fee). Please consult the on-line help included with the BZ-5503 software for instructions on how to install upgrades/updates of the software, together with your preferred language. Tap 9.2.2 , on the analyzer’s screen, then About to get a list of installed software and licenses. Update through the Internet The analyzer can update software by itself, if it is connected to the Internet – see section 7.1. This method is particularly useful if the analyzer is used for long-term monitoring, and you do not want to go to the measurement site for servicing (that is, you want to disturb the measurement as little as possible). Note: The method is used for updating the software with the latest version available from the Brüel & Kjær website. The languages already installed will be updated at the same time. If you have hardware versions 1 – 3, you cannot install new languages or licenses – to do this, you must use BZ-5503. The update procedure is as follows: 1) Tap , on the analyzer’s screen, then About to get a list of installed software and licenses. Scroll down to the bottom of the screen and tap the Check for updates on the web…> link, the Software Update screen appears – see Fig.9.1and Fig.9.2. Note: This can be done remotely if you connect to the online display using either BZ-5503 or an Internet browser. 2) Click on the Check for Updates button to check for the latest updates. This will connect to the Brüel & Kjær update server. If a new software version is available, the build version will be displayed and you can decline or start the update (you will be warned, if the new version requires a new license). If the versions that are available are not later than those already installed you will be told so and the update will be terminated. 3) If you choose to update the analyzer, the software will start downloading to the SD or CF card (hardware versions 1 – 3) already inserted in the analyzer. You need at least 200 MB of free space on the memory card. Depending on the speed and quality of the Internet connection, this can take from a few minutes to several hours. If the connection is lost, then the download will automatically continue when connection is established again. Note: The analyzer can continue measuring during the download period. CHAPTER 9 Updating and Upgrading Applications, Maintenance, Calibration and Troubleshooting 99 4) When download is complete, the measurement is paused and normal use of the analyzer is prevented. Connections to the analyzer are terminated and the upgrade of the analyzer will start. This will take 10-15 minutes and the analyzer will reboot when finished. Any unsaved logging data will be saved and the analyzer is ready to use again. 5) Connect to the analyzer again and verify the new software version by tapping analyzer's screen, then About. , on the To continue the measurement, press the Start pushbutton. Note: If you have set up your analyzer for e-mail notifications (see section 8.4), then you will get an e-mail in step 4) when the analyzer is paused, and you will get a new e-mail in step 5), when the analyzer has rebooted and is ready for connection again. Fig.9.1 About screen – showing the ‘Check for updates on the Web link’ Fig.9.2 Software update screen – showing the ‘Check for updates button’ Hand-held Analyzer Types 2250 and 2270 – User Manual 100 9.2.3 Downgrade to an Earlier Version It is possible to downgrade to an earlier version of the software: 1) Change the “latest” part of the server address (see Fig.9.2) to the requested software package, for example, “SW22” 2) Press Check for updates. 3) Follow the procedure described in section 9.2.1 or section 9.2.2. Note: Only software packages equal to or above SW24 can downgrade to another package. Software packages down to SW21 are available for update through Internet. 9.3 How to Move a License If you have more than one analyzer, you may want to share application software between the analyzers. You can do this by moving the license from one analyzer to another by using Measurement Partner Suite BZ-5503, together with the License Mover VP-0647. If you lend out your analyzer, you may want to temporarily ‘un-install’ applications not needed. This can be achieved by moving the license of the application to License Mover VP-0647. When needed again, you move the license back to your analyzer. Please consult the on-line help included with the BZ-5503 software for instructions on how to move a license. 9.4 Troubleshooting 9.4.1 Measurements If your measurement seems to be wrong, then: • Check the cabling, if any • Check that the microphone, including preamplifier, is correctly mounted in the top socket (or correctly connected to the extension cable) • Check that the Input parameter is set to Top Socket/Rear Socket in agreement with how you are going to use the input. This is found by tapping the Main Menu icon , then Setup, followed by Input • Check that the transducer you have mounted on your analyzer is selected as the Transducer parameter, this is also found on the Setup screen • Check whether the parameters for the selected transducer (Transducer) are set correctly, especially the Microphone Type and Polarization Voltage parameters. These are found by tapping the Main Menu icon , then Transducers • Check that the Sound Field and Windscreen Correction parameters have been set correctly These are found by tapping the Main Menu icon , then Setup, followed by Input • Check if the calibration is OK (make a new calibration using an external calibrator) CHAPTER 9 Updating and Upgrading Applications, Maintenance, Calibration and Troubleshooting 9.4.2 101 SD/CF Cards and USB Sticks The Logging, Enhanced Logging and Signal Recording software requires that measurements are saved on memory cards – SD or (with hardware versions 1 – 3) CF. A USB memory stick can be used from hardware version 4. Device Format and Speed In order to ensure reliable operation with the memory device, the format of the file system and the speed of the device are tested. Upon insertion, the analyzer verifies the format of the memory device’s file system. If the file system is not optimal for usage with the analyzer, then you are prompted to format it. You will be guided through the process. When the format of the file system has been accepted, then the speed of the device is tested. The test writes data to the device and measures the writing speed. The test takes less than a minute. If the speed test is successful, then you can proceed using the device, otherwise you should use another memory device or try reformatting the device (if not done already). Problems with Storing or Recalling Data If you experience problems in storing or recalling data on the memory device, you can check and repair the integrity of the file system on the device or even re-format it, by doing the following: 1) Insert the memory device in the correct slot of the connector panel of the analyzer. 2) You will be notified that a memory device has been inserted – select Yes to change the default measurement path toit. 3) Tap the Main Menu icon and then Explorer. 4) Tap the icon to go up folder levels until you have reached the topmost level with a list of the available memory devices. 5) Tap the name of the device (not the icon) to get a list of available commands. 6) Select Check and Repair to start the procedure. If any errors are found in the file system, they are fixed. When finished, you will be informed whether the memory device was OK or that errors have been fixed. Note: The checking procedure can take several minutes, depending on the size of the device. Formatting a memory device: 7) Select Format to start the formatting procedure. WARNING: All data on the device will be erased during the formatting process. WARNING:Do not remove the device or switch off the analyzer during the procedure – this might damage the file system and data and make the device unusable. Note 1: The formatting procedure can take several minutes – depending on the size of the device. Note 2: The read/write performance of SD and CF memory cards and USB sticks varies a lot. The performance depends on the manufacturer of the memory device, the type of device, the Hand-held Analyzer Types 2250 and 2270 – User Manual 102 size of the device, how much it has been used, how fragmented the memory is, and even the day of production of the device. Two ‘identical’ memory devices can have a different performance because the manufacturer has changed the internal technology without notice. In general, as a rule of thumb, you should select devices aimed for the industrial or professional photographer market. The cards delivered by Brüel & Kjær have all been tested for their read/write performance in the analyzer and can be used for the applications available in the analyzer. If you need more (or other) types of memory devices, please consult your local Brüel & Kjær representative. Remember to regularly re-format the device (especially before a long unattended measurement) – this will ensure the best performance of the device. 8) Select Test Speed, if you want to check the device’s file speed. 9.4.3 Battery Pack and Recalibration of Battery Charge Indicator The software keeps the capacity of the battery pack updated. Over time the total capacity of the battery pack decreases. If you find that the ‘Time Remaining’ estimate (tap the Battery icon to get this information) does not match the real time remaining (for example, the analyzer switches off automatically because of lack of power while the Time Remaining estimate indicates at least ½ hour), then you should manually re-calibrate the capacity of the battery pack. This is done using the following method: • • Drain all the power from the battery: – Switch the analyzer on – Disconnect external power – Disconnect the analyzer from the PC – On the Preferences screen, under Power Settings, set Standby After to Never – You may want to set Backlight On to Always (in the same menu) and select the maximum level of display backlight in order to drain the battery faster (use the Backlight icon at the bottom of the screen) – Leave the analyzer until the battery voltage becomes so low that the analyzer switches itself off Charge the battery fully (at least 10 hours): – Connect the Mains Power Supply ZG-0426 to the analyzer – Switch the analyzer on (and leave it on) and remember to reset the Standby After and Backlight On to your preferred settings – Tap the Battery icon and a pop-up appears, giving details of the battery condition. This will indicate ‘Calibrating Battery’ initially. Let the battery charge until the battery charge indicator just below the power socket starts flashing green (hardware versions 1–3) or changes from red to green (hardware version 4) and the ‘Calibrating Battery’ indication disappears from the pop-up window CHAPTER 9 Updating and Upgrading Applications, Maintenance, Calibration and Troubleshooting 9.4.4 103 Touch Screen If tapping with the stylus on the screen seems to be getting more inaccurate, you can adjust the touch sensitive screen, as follows: • 9.4.5 In the Preferences screen, under Display Settings activate the link Adjust Touch Screen. This displays a full screen with guidance on how to tap a cross five times at different places on the screen. The adjustment procedure ends with saving the values or canceling the adjustment Reset Options Reset Button WARNING: Unsaved data or setups will be lost when you reset the analyzer. If your analyzer stops responding to pushbutton presses, or stylus taps, reset and reboot the analyzer by pressing the Reset button (located on the connector panel – see section 2.2) with the point of the stylus. If you still experience problems, try resetting your analyzer as described below. Analyzer Reset 1) Reset the analyzer to a default/factory installed state: – For hardware versions 1 – 3, you will reset the analyzer to a default state, where the user is set to 2250 (for Type 2250) and 2270 (for Type 2270) and the project template is set to Sound Level Meter. The existing Sound Level Meter project template will be overwritten, as will the preferences for user 2250 or 2270. To reset the analyzer to the default state: a) Press and hold the Power-on pushbutton for at least five seconds (powers off). b) Press and hold down the Commentary and Save pushbuttons while switching on the analyzer. The display in Fig.9.3 will be shown. Fig.9.3 Maintenance Mode –initial screen for hardware versions 1 – 3 104 Hand-held Analyzer Types 2250 and 2270 – User Manual Within a few seconds the display in Fig.9.4 will be shown. Fig.9.4 Update 2250 software screen for hardware versions 1 – 3 c) Cancel the update by pressing any other pushbutton than the Accept pushbutton . Fig.9.5 Reset to default settings screen for hardware versions 1 – 3 d) Press the Accept pushbutton – to reset to default settings. With hardware version 4 (G4), the analyzer contains two sets of the firmware/software package and settings. The one originally delivered with the analyzer and one installed afterwards. To restore the factory firmware/software package and settings: a) Press and hold the Power-on pushbutton for at least five seconds (powers off). b) Press and hold down the Commentary and Save pushbuttons while switching on the analyzer. The display in Fig.9.6 will be shown. CHAPTER 9 Updating and Upgrading Applications, Maintenance, Calibration and Troubleshooting 105 Fig.9.6 Restore factory firmware and settings on hardware version 4 c) Press the Accept pushbutton to restore factory firmware and settings. If the analyzer now functions normally, you should install the software package of your preference as described in section 9.2. Brüel & Kjær recommends that you always use the latest available. 2) (for all hardware versions) If the analyzer now functions normally, define your preferred settings in the Preferences screen, adjust the touch screen again and make necessary changes to Setup (all accessed via the Main Menu ). If you experience problems selecting another template or you login as another user, then note which step causes the problem. You might need to delete/reconfigure the templates or users. To delete/reconfigure templates or users, use Measurement Partner Suite BZ-5503 with the analyzer connected to the PC via Micro USB Cable AO-1494 (G4 hardware) or Mini USB Cable AO-1476, or a modem/LAN connection. Please consult the on-line help included with the BZ-5503 software for instructions on how to configure the analyzer. Re-installing Software (Hardware Versions 1 –3) If the analyzer still does not work normally after performing the ‘Analyzer Reset’ procedure, then the software might need to be re-installed. This can be done in two ways: 1) If the connection to Measurement Partner Suite BZ-5503 works with the analyzer connected to the PC using a USB cable, then the software can be re-installed and re-configured through the USB cable. Please consult the on-line help included with the BZ-5503 software for instructions on how to re-install software on the analyzer. 2) If the USB connection to the PC does not work, then you need a Compact Flash card (size at least 64 Mbytes) and a Compact Flash card reader for the PC. You can then use Measurement Partner Suite BZ-5503 to update the Compact Flash card with the necessary files. Please consult the on-line help included with the BZ-5503 software for instructions on how to update a Compact Flash card with installation files for the analyzer. Power off the analyzer and insert the compact flash card in the CF slot on the analyzer. Then press and hold down the Commentary and Save pushbuttons while switching on the Hand-held Analyzer Types 2250 and 2270 – User Manual 106 analyzer. The Maintenance Mode initial screen will be displayed, and then within a few seconds the screen shown in Fig.9.4 will appear. Press the Accept pushbutton to update the software. This will take approximately 5 minutes. WARNING: Do not remove the CF-card while updating the analyzer software! When the analyzer software has been updated, you will get the option of resetting to the default settings. If the problem still persists, then you should contact your local Brüel & Kjær representative. 9.5 Care, Cleaning and Storage The analyzer is a delicate precision instrument. When handling, storing or cleaning your analyzer, please take the following precautions. 9.5.1 9.5.2 Handling the Analyzer • Do not try to remove the microphone grid as you can easily damage the microphone in this way • Do not attempt to open the analyzer. There are no user-serviceable parts inside. If you think your analyzer requires service, please contact your Brüel & Kjær representative • Do not allow the analyzer to get wet • Protect the analyzer from impact. Do not drop it. Transport it in the supplied carrying pouch Cleaning the Analyzer If the analyzer casing becomes dirty, then wipe it with a lightly dampened cloth. Do not use abrasive cleansers or solvents. Do not allow moisture to enter the microphone, connectors or casing. 9.5.3 Storing the Analyzer • Keep the analyzer in a dry place, preferably within its carrying pouch • For long-term storage, remove the battery pack • Do not exceed storage temperature limits of –25 to +70°C (–13 to +158°F) CHAPTER 9 Updating and Upgrading Applications, Maintenance, Calibration and Troubleshooting 9.6 Services at Brüel & Kjær for Types 2250 and 2270 9.6.1 Accredited Calibration 107 For Types 2250 and 2270, you can order accredited calibration and choose between DANAK, A2LA, UKAS, Eichamt (Austria), RvA, ENAC, NATA and Inmetro. For Spain, Primitiva is available. The calibration will be performed in an ISO 17025 certified laboratory. 9.6.2 Initial Calibration To start the measurement history from day one – if this is required, for example, for measurement use in public, for customer audit or quality procedures – we recommend you order accredited calibration together with the new analyzer. 9.6.3 Regular Recalibration To fulfil requirements for public measurements and to minimise the cost of errors due to faulty or inaccurate measurements, we can arrange for calibration every year in an ISO 17025 certified laboratory at Brüel & Kjær. With annual data, you will have an unbroken history to use as reference, either for internal requirements, for audit required by authorities or at the request of your customers. And not least, you can follow the history of sensitivity for your analyzers over time. 9.6.4 9.6.5 Filter Calibration • You can order calibration of filters. Please specify at the time of ordering • Calibration of filter response for octave and 1/3-octave filters according to IEC 61260 Service and Repair The hand-held analyzer is designed and constructed to provide many years of reliable operation. However, if a fault occurs that impairs the analyzer’s correct function, then remove the battery pack and disconnect any external power supply to prevent risk of further damage. For more information about preventing faults or damage to your analyzer, see section 9.5. 9.6.6 Hardware Maintenance and Repair You can minimise the risk of unexpected costs by purchasing the hardware maintenance with a five years warranty. Minor repairs, such as those resulting from damage caused by unauthorised use of the analyzer, can be performed at the same time as the analyzer is being calibrated at Brüel & Kjær. This will save you time. If any other errors are detected by the technician during calibration, repair will be performed before returning the analyzer to you. Repair is available at a fixed price, which includes a Conformance Test Certificate upon the return of your analyzer (no measurement data included). Hand-held Analyzer Types 2250 and 2270 – User Manual 108 9.6.7 Rental To ensure optimal uptime, you can rent a substitute hand-held analyzer* while yours is being calibrated. To arrange rental, please contact your local Brüel & Kjær representative. 9.6.8 Training Basic knowledge on sound and vibration measurement, analyzer training and application training are a few examples of what local training or consultancy hoursa can do for you. To find out more about training and consultancy hours, please contact your local Brüel & Kjær representative. * Providing this service is available from your local Brüel & Kjær office 109 Chapter 10 1/1- or 1/3-octave Frequency Analysis (Optional Module) Frequency Analysis Software BZ-7223 enables you to make 1/1-octave or 1/3-octave measurements and broadband sound level measurements simultaneously. Check the About screen to see whether you have the license to run the Frequency Analyzer. (To access the About screen, tap the Help icon then tap About.) See Chapter 9 for instructions on installing the license for the Frequency Analyzer. 10.1 Setting up the Analyzer The Frequency Analyzer measures the following spectrum parameters together with full spectral statistics during timed measurements: • LXeq • LXFmax • LXSmax • LXFmin • LXSmin where X is the frequency weighting A, B, C or Z. These spectra and the spectral statistics are saved in the project together with the measured sound level meter (broadband) parameters. The spectral statistics can be viewed as LXYN percentile spectra, where Y is the time weighting F or S and N can be one of 7 defined percentiles. In addition, the instantaneous spectra LXF and LXS are always available. 1) Select the Frequency Analyzer project template. (See section 3.3.1 for more details on templates.) The project template is displayed at the top of the screen, if it does not display Frequency Analyzer, tap the Project Template Bar at the top of the screen and select Frequency Analyzer from the drop-down that appears. Hand-held Analyzer Types 2250 and 2270 – User Manual 110 2) Tap the Main Menu icon and select Setup from the list of options. Set the Broadband and Spectrum parameter to A, B, C or Z, as required. (A/B-weighting is determined by setting the parameter in Setup > Frequency Settings > Broadband (excl. peak). Set the Bandwidth parameter to 1/1-octave or 1/3-octave before making the measurement. To exit the screen, tap the icon. Fig.10.1 Setting the frequency weighting and bandwidth parameters Under the Signal Recording parameters, select the settings for recording the signal while making the measurement. See Chapter 13 for more information. Under the Tone Assessment parameters, select the settings for Tone Assessment. See Chapter 15 for more information. 10.2 Controlling the Measurement The measurement is controlled in the same way you would control a normal Sound Level Meter measurement, using Start/Pause , Continue , Back-erase and Reset pushbuttons, see Chapter 3 for more details. The measurement can control a generator connected to the Output socket on the connector panel (see Fig.2.2 or Fig.2.3). Enable the generator by setting the Source parameter to Generator in Setup > Output Socket Signal, then set up the generator settings in Setup > Generator. The generator will be controlled using Escape Time and Build-up Time, as described in Fig.14.3. CHAPTER 10 1/1- or 1/3-octave Frequency Analysis (Optional Module) 10.3 111 Displaying the Results The Frequency Analyzer measurement screen includes three tabs at the bottom: Spectrum, Broadband and XL View (Extra Large). The tabs allow you to choose different ways of displaying the measurement results. All but the Spectrum tab have been covered in Chapter 3. However, a quick recap is provided below. The Broadband view shows an instantaneous LAF readout, with associated bar graph and four measurement parameters, followed by two measurement setup parameters. (The first measurement parameter is displayed in a larger font size for better readability.) The XL View increases the size of the first parameter readout to a 4 digit, full-screen display (including decimal point). The Spectrum view, (which only appears as a tab if Frequency Analysis Software BZ-7223 is enabled), shows two different spectra parameters being measured simultaneously. In the example in Fig.10.2, LZFmax and LZF are being viewed at the same time. Note: The Reference Spectrum belongs to which parameter. and Main Spectrum icons indicate which spectrum 1) Select which spectra to view by tapping the parameter fields in the two lines above the spectrum display. These lines also include readouts of the spectrum values highlighted by the spectrum cursor. Tap the spectrum at the frequency of interest – or just tap anywhere in the spectrum area and then move the cursor to the position of interest using the Left and Right arrow pushbuttons. To the right of the spectrum, two broadband bars (of the same parameters) are also displayed. Fig.10.2 Displaying the results –spectrum screen 112 Hand-held Analyzer Types 2250 and 2270 – User Manual 2) Adjust the X-axis (the horizontal frequency axis below the graphical display) by tapping on the scale and accessing the drop-down menu (Fig.10.3): • use Set Lower Display Limit to set the lower frequency limit of the X-axis • use Set Higher Display Limit to set the upper frequency limit of the X-axis • use Reset Display Range to display all measured frequency bands Note 1: These settings only affect the frequency range of the display of measured data, not the frequency range of the measurement itself. Note 2: The Display range automatically resets if you change the filter Bandwidth setup parameter or change the Low Frequency setup parameter. Fig.10.3 Adjusting the X-axis 3) Scale the Y-axis (left-hand vertical scale of the graphical display) by tapping on the scale and accessing the drop-down menu (Fig.10.4). Note: You can also select the spectrum cursor and press the Accept pushbutton. CHAPTER 10 1/1- or 1/3-octave Frequency Analysis (Optional Module) 113 Fig.10.4 Scaling the Y-axis on the Spectrum display 4) Select Auto Zoom to adjust the range of the Y-axis for best fit of the measured spectrum. 5) Select Zoom In/Zoom Out to adjust the zoom. 6) Select Scale Up/Scale Down to adjust the full scale value on the Y-axis – or select Auto Scale to select the best scaling for viewing the spectra – without adjusting the zoom. 7) Spectrum Table shows the displayed part of the spectrum in tabular form – as in Fig.10.5. at the top of the screen to select between three different Press the Table Format icon viewing formats: • Two Parameters: for displaying values from both spectra • One Parameter: for displaying values from the main spectrum only (available for Reverberation Time Software only) • One Parameter (wrap): for displaying values from the main spectrum only, but with the columns wrapped on the display to allow as many values as possible on the screen Fig.10.5 Spectrum table 114 Hand-held Analyzer Types 2250 and 2270 – User Manual 8) To exit the Spectrum Table, tap the icon. 9) Auto Zoom and Auto Scale automatically close the drop-down menu, otherwise, select Close, tap outside the drop-down list or use the Left arrow pushbutton to close the menu. Hint: A quick way of auto zooming is to tap anywhere in the spectrum and then press the Accept pushbutton twice. Note: Save the template, if you want to use the display settings for other measurements. Some parameters are calculated based on the spectra: • SIL, PSIL, SIL3 and LXeq(f1–f2) are calculated during the measurement and saved together with the other measurement data • The Noise Parameters NC, NR, RC, NCB, Loudness and Loudness Level are for display only and calculated based on measured LXeq spectra. This means that whenever you have a LXeq spectrum you can also calculate and display these parameters • NC, NR, RC and NCB are defined for 1/1-octave LZeq spectra, however, NC, NR, RC and NCB are calculated for any frequency weighting and any octave bandwidth. A-, B- and C-weighted spectra are converted to Z-weighted spectra and 1/3-octave spectra are converted to 1/1-octave spectra before the calculation • Loudness and Loudness Level are calculated for 1/3-octave spectra with any frequency weighting. A, B and C weighted spectra are converted to Z-weighted spectra before the calculation If 1/1-octave LZeq spectra have been measured, then you can display a Noise Curve together with the LZeq spectrum, see example in Fig.10.6. Fig.10.6 Displaying a Noise Curve together with the LZeq spectrum For RC and NCB you also have the possibility of displaying the limit curves for Rumble and Hiss, and for Rattle and Vibration together with the 1/1-octave LZeq spectrum. CHAPTER 10 1/1- or 1/3-octave Frequency Analysis (Optional Module) 10.3.1 115 Smileys A smiley will be shown to the right of the project name if there are any issues with calculating noise parameters, or displaying noise curves (see the overview in Table 10.1). Table 10.1 Overview of Smileys Smiley 10.4 Explanation Description No Loudness for 1/1-octaves Select 1/3-octave No Leq parameter logged Select a Leq spectrum for logging Sound Field Mismatch for Loudness Set the Loudness parameter in Input in accordance with the Sound Field Correction Frequency bands outside Noise Curves Levels are lower or higher than any noise curve band Noise Curves require use of Mic. Select a microphone Display Noise Curve with LZeq Noise parameters are calculated but Noise Curves can only be displayed together with LZeq Noise Curve for 1/1-octaves only Noise parameters are calculated but Noise Curves can only be displayed for 1/1-octaves Saving Results Measurements are saved and can be viewed later, in the same way as described for the Sound Level Meter project in Chapter 3. 116 Hand-held Analyzer Types 2250 and 2270 – User Manual 117 Chapter 11 Logging (Optional Module) Logging Software BZ-7224 enables you to measure and save data periodically on SD or CF cards. You can also save to a USB memory stick with hardware version 4. The module is optimised for attended use, which means that while measuring you can annotate any sound online, as well as ‘mark’ up to five different sound categories online. The main benefit is that data is documented on-site and is therefore ready for post-processing and reporting back at the office using Measurement Partner Suite BZ-5503 or other postprocessing software such as Evaluator Type 7820, Protector Type 7825 or Microsoft® Excel®. In addition to measuring broadband parameters (see Chapter 3) and spectra* (see Chapter 10), the Logging module allows you to simultaneously log the following parameters: • Broadband parameters (including broadband statistics) • Spectra* (including spectral statistics) • Broadband parameters every 100 ms • Record the measured signal† An overview showing the options available during a typical logging task has been provided in Table 11.1. Table 11.1 Overview of options available during a typical logging task Selection Logged Logged (100 ms) Total *. †. Period Broadband Parameters Broadband Statistics Spectral Parameters Spectral Statistics 1 s – 24 h 1 to 10 or All (45) None or Full 0–3 or All (5) None or Full 100 ms None, LAeq, LAF and/or LAS None available None available None available Elapsed Time All (58) Full All (5) Full Requires Frequency Analysis Software BZ-7223 Requires Signal Recording Option BZ-7226 Hand-held Analyzer Types 2250 and 2270 – User Manual 118 Check the About screen to see whether you have a license to run the Logging option. (To access the About screen, tap the Help icon then tap About.) See Chapter 9 for instructions on installing the license for the Logging option. 11.1 Setting up the Analyzer 1) Select the Logging project template. (See section 3.3.1 for more details on templates.) The project template is displayed on the black banner at the top of the screen. If this banner does not display Logging, tap the banner and select Logging from the drop-down that appears. Note: The Logging project template assumes you have a license for the Frequency Analysis Software. If not, then select the LOGGING SLM project template instead. 2) Depending on your memory device: • Insert an SD memory card in a SD card slot at the bottom of the analyzer • If you have hardware versions 1 – 3, you can insert a CF memory card in the CF card slot at the bottom of the analyzer • With hardware version 4, you can use a USB Type A stick at the bottom of the analyzer You will be notified that a memory card has been inserted – select Yes to change the default measurement path to the memory card. Note: You cannot log data on the internal disk. 3) Tap the Main Menu icon and select Explorer from the list of options. Create a job folder for the measurements and set the default measurement job/path as described in Chapter 6. 4) Tap the Main Menu icon and select Setup from the list of options. The Setup screen will appear (Fig.11.1). Set the Input, Frequency Settings and Statistics parameters as required for the Sound Level Meter and Frequency Analyzer measurements, see Chapter 3 and Chapter 10, respectively. These settings are common to both the logging and the total measurement. CHAPTER 11 Logging (Optional Module) 119 Fig.11.1 The Setup screen 5) Under the Measurement Control parameters, set the Measurement Time and Logging Period as required. Set Synchronize with clock to Yes if you want the logging to synchronise with whole minutes or hours. For example, if Logging Period is set to 1 minute and you start the measurement at 8:12:33, then the first logging interval will be from 8:12:33 to 8:12:59 (27 seconds), the second will be from 8:13:00 to 8:13:59 (60 seconds), etc. Set Synchronize with clock to No if you want every logging interval to be the specified Logging Period exactly. Set Charge Injection Calibration to On if you want to validate the complete measurement chain by performing CIC at the start and end of the logging measurement, refer to section 5.10. 6) Under the Logged Broadband parameters, choose which broadband parameters you want to log in accordance with the Measurement Control parameters. You can choose to log Full Statistics per Logging Period or not. You can also choose to log all the measured Broadband Parameters or a Selected number of parameters. If you choose Selected then you can specify up to 10 parameters. 7) The Logged Broadband (100 ms) parameter allows you to log LAeq, with an elapsed time of 100 ms and a logging period of 100 ms, LAF and/or LAS, with a logging period of 100 ms, irrespective of the other logging parameters. 8) The Logged Spectrum* parameter allows you to choose which spectra to log. You can specify to log All, None or up to 3 Selected spectra. You can also choose to log Full Spectral Statistics per Logging Period or not. *. Requires Frequency Analysis Software BZ-7223 120 Hand-held Analyzer Types 2250 and 2270 – User Manual 9) Under Markers you can specify the names of the five available markers. The markers are predefined as follows: • Marker 1: ‘Exclude’ – can be controlled by pressing the Back-erase pushbutton • Marker 2: ‘Manual’ – can be controlled by pressing the Manual Event pushbutton • Marker 3: ‘Level’ – can be controlled by the Level Trigger detection • Marker 4: ‘Marker 4’ • Marker 5: ‘Marker 5’ • Marker 6: ‘Sound’ – is set when recording signal (typically sound) – requires Signal Recording Software BZ-7226 All markers can be controlled by the stylus in the Profile display. You can set a Pre-marker Time between 0 and 5 seconds. This will start markers 1, 2 or 3 the set number of pre-marker seconds before the point where the Back-erase pushbutton, the Manual Event pushbutton, or the Level Trigger, respectively, are pressed. See section 11.3.2. 10) Under the Level Trigger parameters, choose the settings for triggering the number 3 marker ‘Level’, for starting a signal recording and for sending an SMS or e-mail – see section 8.4 and Chapter 12: • Set Level Trigger Control to On to enable the level trigger facility or Off to disable the facility • Set Trigger Parameter to the parameter you want to monitor, for example, LAeq – see Appendix A for the total list of parameters • Set Start Slope to Rising if you want to start when the Trigger Parameter exceeds Start Level (and stop when it goes below Stop Level) or to Falling if you want to start when the Trigger Parameter goes below Start Level (and stop when it exceeds Stop Level) • Set Start Duration for the number of seconds the Trigger Parameter must fulfil the trigger condition before the trigger point is acknowledged • Set Stop Duration for the number of seconds the Trigger Parameter doesn’t fulfil the trigger condition anymore to acknowledge the end point of the trigger (see the relationship between the trigger parameters in Fig.11.2) CHAPTER 11 Logging (Optional Module) 121 Fig.11.2 Relationship between trigger parameters LAeq 100 dB 90 dB Trigger Parameter = LAeq Start Slope = Rising 80 dB 70 dB Start Duration Stop Duration 60 dB 50 dB Start Level = 50 dB 2s Stop Level = 40 dB 40 dB 3s Trigger Point 30 dB Trigger Point 20 dB 10 dB 0 Pre-recording (BZ 7226 only) Time in secs. Post-recording (BZ 7226 only) 050208/1 11) Under the Signal Recording parameters, choose the settings for recording the signal while making a logging – see Chapter 12. 12) Under Input specify Trigger Input if you want to start the signal recording using an external trigger signal. See details in Appendix A. To exit the screen, tap the 11.2 icon. Controlling the Measurement The measurement is controlled in the same way you would control a normal Sound Level Meter measurement, using Start/Pause , Continue , Back-erase and Reset pushbuttons, see Chapter 3 for more details. If you have set the Charge Injection Calibration parameter to On, then CIC is performed at the start of the measurement and at the end of the measurement. An Exclude marker is set on the logging profile at the point where CIC is being performed. The update of the Total parameters is stopped while CIC is being performed. You can see the results of the CIC under Total parameters, CIC Result 1 and CIC Result 2. 11.2.1 Annotating a Project While using the logging software you can annotate measurements using the normal method of adding annotations to a project, before or after a measurement, or while the measurement is paused. The annotations can then be viewed by tapping on the Annotations icon or tapping the Main Menu and selecting Explorer from the list of options. section 3.5. Hand-held Analyzer Types 2250 and 2270 – User Manual 122 However, if you choose to annotate the profile during the measurement, the Annotations icon will appear below the profile, not as a paperclip icon in the Status Field or attached to a project in Explorer, as described previously. In this case, you view the annotation using the method described in section 11.3.1. 11.2.2 Recording the Signal You can record the input signal during the measurement* by pressing the Manual Event pushbutton (Manual Event marker), the Back-erase pushbutton (Exclude Marker) or when the level of a specific parameter exceeds a certain level – or you can record the signal through the whole measurement – depending on the Signal Recording setting on the Setup screen – details in Chapter 12. 11.3 Displaying the Results The Logging Measurement screen (or Profile view) includes three tabs at the bottom: Profile, Spectrum and Broadband view (the Logging SLM includes the tabs: Profile, Broadband and XL View). The tabs allow you to choose different ways of displaying the measurement results. All but the Profile tab have been covered previously in Chapters 3 and 10, however a quick recap is provided below. The Broadband view shows an instantaneous LAF readout, with associated bar graph and a number of measurement parameters. (The first measurement parameter is displayed in a larger font size for better readability.) The XL View increases the size of the first parameter readout to a 4-digit, full-screen display (including decimal point). The Spectrum view shows two different spectra parameters being measured simultaneously. 11.3.1 The Profile View The Profile view displays a profile of a logged broadband parameter (dB versus time). This is very convenient when marking sound categories on-line or annotating the measurement (Fig.11.3). *. Requires License for Signal Recording Software BZ-7226 CHAPTER 11 Logging (Optional Module) 123 Fig.11.3 Profile View (showing extended Status Field) Status Field The Status Field has been extended to include an extra line of information below the two existing lines of information covered previously in the Sound Level Meter and Frequency Analyzer (see Fig.11.3). This extra line of information allows you to: • Select whether the results of the Total measurement from the Logged measurement, or from the Logged(100 ms) measurement are displayed. Select Total to display the measurement parameters of the Total measurement in all the views – the Broadband and Spectrum views will then display parameters or spectra similar to the Sound Level Meter or Frequency Analyzer. (The Profile view will be empty, because the Total measurement contains only a single set of parameters). Select Logged to display the measurement parameters from the logging intervals. The cursor in the profile selects which logging interval is displayed in all the views. Select Logged(100 ms) to display the LAeq, LAF or LAS in the profile from the 100 ms logging intervals. This setting does not display spectra or parameters in other views • View the start time of the measurement (for Total) or the start time of the current logging interval (for Logged or Logged(100 ms) if measuring and the profile is not frozen) or the start time of the logging interval pointed out by the cursor. Tap the Start Time in any of the views to select data from another logging interval • View whether the display of the profile during the measurement is frozen or not. When the icon is “animated” the display is being updated with new logged data during the measurement. You can freeze the display update by tapping on the icon. This also freezes the icon. Tap the icon again to unfreeze the display • Step forwards or backwards through the logging intervals on all displays, using the and icons. (The icons are also connected to the profile cursor, so that any corresponding movement backwards or forwards through the intervals in one display will be reproduced in the other) 124 Hand-held Analyzer Types 2250 and 2270 – User Manual Some interaction with the display will automatically freeze and unfreeze the display (only while measuring): • Tap the stylus on the profile. This will set the profile cursor and freeze the display update of the profile. You can move the cursor to any point in the profile by using the left and right arrow pushbuttons. The profile will be scrolled automatically, if necessary. Unfreeze by tapping on the icon • Tap and hold the stylus on the profile display and drag it to the left or right. This will freeze the display and show two cursors. Next, remove the stylus from the display and a drop-down menu appears with the possibility of setting or editing a marker or annotation (see below). Select the required function from the drop-down menu. When the function has been carried out, the profile unfreezes automatically and progresses as it did before you tapped on the screen The logged data are displayed as two profiles. The Profile Overview with the entire profile and the Profile with 100 logging samples. The Profile Overview An overview of the entire profile is displayed across the screen on the topmost part of the graph area. The overview is based on LXeq,1s (X = A or B depending on the Broadband (excl. Peak) Frequency Settings parameter). The Y-axis is auto-zoomed. When you have logged for more than 4 minutes, then each pixel on the X-axis will cover more than 1 s. The overview will then display from the minimum LXeq,1s to the maximum LXeq,1s within the interval covered by the pixels on the X-axis. Tap in the Profile Overview to select the part of the entire profile to display in the Profile below. The Profile The Profile displays a hundred samples of the logged data. Select which parameter to view by tapping the parameter field in the line above the profile. Markers are displayed between the profile and the profile parameter. Marker 1 (Exclude) is the topmost positioned marker. The name of the marker is displayed if the marker overlaps the cursor position. If a signal has been recorded, then a Sound Marker (Marker 6) is displayed above the profile – the marker covers exactly the time of the signal recording. You can browse through markers using the buttons in the profile. The whole, or any part of the signal recording can be played back, once or repetitively – see Chapter 12 for details. To the right of the profile, the broadband parameter LAF is displayed and updated regardless of the measurement status and the display freeze status. Annotations are displayed below the profile as icons. To select an annotation, tap and hold the stylus at one side of the icon, just above it, then drag the stylus to the opposite side of the icon (so it looks like the example in Fig.11.4) and remove the stylus from the display. CHAPTER 11 Logging (Optional Module) 125 Fig.11.4 Selecting annotations A drop-down menu appears, select the required function: • Open note or Play commentary • Delete annotation • Move annotation (to the position on the display where the stylus was removed from the display) Scale the Y-axis (left-hand vertical scale of the graphical display) by tapping on the scale and accessing the drop-down menu (as in the Spectrum display): 11.3.2 • Select Auto Zoom to adjust the range of the Y-axis for best fit of the measured spectrum • Select Zoom In/Zoom Out to adjust the zoom • Select Scale Up/Scale Down to adjust the full scale value on the Y-axis - or select Auto Scale to select the best scaling for viewing the spectra – without adjusting the zoom • Auto Zoom and Auto Scale automatically close the drop-down menu, otherwise, select Close, tap outside the drop-down list or use the Left Arrow pushbutton to close the menu Marking Sound Categories Use this facility to categorise the sound while you are measuring, or while you are observing the different kinds of sound on the display. This will make it much easier to do the post-processing and reporting back in the office. You can mark up to five sound categories on-line. The markers are displayed as horizontal lines above the sound profile (Fig.11.3). There are two main types of marker: • An Exclude Marker – this allows you to mark a sound you want to exclude from your measurement later during post-processing or reporting. (It does not remove any data from your measurement) • An Event Marker – this allows you to mark a particular sound of interest during your measurement 126 Hand-held Analyzer Types 2250 and 2270 – User Manual On the analyzer, Marker 1 is used as an Exclude Marker, while Markers 2 to 5 are used as Event Markers. All four event markers can be user-defined. You can define a marker by tapping on the Main Menu icon and selecting Setup, followed by Markers. Marker 2 is set to a Manual Event marker by default – it can be controlled by the Manual Event pushbutton and the stylus. Marker 3 is set to a Level Event marker by default – it can be controlled by the level trigger facility and the stylus. Marker 6 is used as a Sound Marker and shows the size of the signal recording. The analyzer allows you to view the markers at a later date by recalling the data and viewing the desired profile. (This can also be done if you have transferred the data to BZ-5503). If required, Measurement Partner Suite BZ-5503, Evaluator Type 7820 and Protector Type 7825 can use the markers in their calculations. Marker number 1 (the Exclude Marker) will always be used as an Exclude Marker, while markers 2 to 5 will be used as defined in Type 7820 Evaluator/Type 7825 Protector software. The marker names, however, will be transferred from the analyzer. Marker 6 will be used as sound marker. Marking During the Measurement The measurement parameter is displayed as a progressing profile. Use of Pushbuttons Press the Back-erase pushbutton to start an Exclude Marker (marker number 1). The marker is displayed above the profile. Press the button once more to stop the Exclude Marker. Press the Manual Event pushbutton to start a Manual Event Marker (marker number 2). The marker is displayed above the profile. Press the button once more to stop the Manual Event Marker. Use of Stylus Tap and hold the stylus on the profile display at the position where you want the marker to start. This will freeze the display and show a cursor at the position of the stylus. Then drag the stylus left or right to the position where you want the marker to end. This will display a second cursor. Next, remove the stylus from the display and a drop-down menu appears showing the five markers you have specified in the setup. Select the marker you require. The marker is displayed above the profile, the cursors disappear and the profile unfreezes and progresses as it did before you tapped on the screen. Note: If you select Sound Marker, then the sound for this part will be recorded – see Chapter 12 for details. Marking Measurement While it is Paused The measurement parameter is displayed as a profile while the measurement is paused. You can use the Stylus to Mark the Sound Categories Tap and hold the stylus in the profile display at the position where you want the marker to start. This will display a cursor at the position of the stylus. Then drag the stylus left or right to the CHAPTER 11 Logging (Optional Module) 127 position where you want the marker to end. This will display a second cursor. Next, remove the stylus from the display and a drop-down menu appears showing the five markers you have specified in the setup. Select the marker you require. The marker is displayed above the profile and the cursors disappear. 11.3.3 Editing Markers on Profiles To widen a marker: 1) Tap and hold the stylus on the profile display at a position within the marker range. 2) Drag the stylus left or right to the position where you want the marker to end. 3) Remove the stylus from the display and a drop-down menu appears. 4) Select the marker you want to widen from the drop-down menu. To narrow a marker: 1) Tap and hold the stylus on the profile display at the position inside the marker range where you want it to stop. 2) Drag the stylus left or right to a position outside the marker range. 3) Remove the stylus from the display and a drop-down menu appears. 4) Select Delete for the marker you want to narrow from the drop-down menu. The part where the marker overlaps the gap between the two cursors will be deleted. To delete a marker: 1) Tap and hold the stylus in the profile display at a position to the left of the marker you want to delete. 2) Drag the stylus to a position to the right of the marker. 3) Remove the stylus from the display and a drop-down menu appears. 4) Select Delete for the marker you want to delete from the drop-down menu. Note: Sound markers cannot be edited. Marking the whole sound marker (or part of it) and selecting Delete will delete the whole sound marker and signal recording. Hand-held Analyzer Types 2250 and 2270 – User Manual 128 11.3.4 Annotate Sound Categories You can annotate the measurement online with a spoken comment or a written note or (with Type 2270 only) an image. The annotation is displayed as an icon below the sound profile. Annotating During the Measurement The measurement parameter is displayed as a progressing profile. Use of Pushbuttons Press and hold down the Commentary pushbutton and talk to the analyzer to make your comment. Release the button when finished. This will insert a comment annotation in the profile at the time when the button was pressed. Use of Stylus Tap and hold the stylus in the profile display at the position where you want the annotation to start. This will freeze the display and display a cursor at the position of the stylus. Then drag the stylus a little to the left or right and raise it again. A drop-down menu appears and below the five markers you can select Add Comment or Add Note or Add Image to add a spoken comment or write a note or capture an image. When finished, the Comment or Note or Image is inserted in the profile, the cursors disappear and the profile unfreezes and progresses as before tapping on the screen. Annotating While the Measurement is Paused The measurement parameter is displayed as a profile while the measurement is paused. Use of Stylus to Annotate the Sound Tap and hold the stylus in the profile display at the position where you want the marker to start. This will display a cursor at the position of the stylus. Next, drag the stylus a little to the left or right and remove the stylus from the display. A drop-down menu appears and below the five markers you can select Add Comment, Add Note or Add Image (Type 2270 only) to add a spoken comment, write a note or capture an image. When finished the Comment, Note or Image is inserted in the profile and the cursors disappear. Use of Pushbuttons Using the Commentary pushbutton during a pause means that the comment annotation will be added to the project instead of the profile. (The annotations can be viewed by tapping on the paperclip icon or tapping the Main Menu and selecting Explorer from the list of options. See section 3.5.) 11.3.5 Editing Annotations on Profiles To move an annotation: 1) Tap and hold the stylus on the profile display at a position on one side of the Annotations icon. 2) Drag the stylus through the Annotations icon to the position where you want the annotation moved to. CHAPTER 11 Logging (Optional Module) 129 3) Remove the stylus from the display and a drop-down menu appears. 4) Select Move Comment (or Move Note, or Move Image) from the drop-down menu. To delete an annotation: 1) Tap and hold the stylus on the profile display at a position to the left of the Annotations icon you want to delete. 2) Drag the stylus to a position to the right of the annotation. 3) Remove the stylus from the display and a drop-down menu appears. 4) Select Delete for the annotation you want to delete from the drop-down menu. 11.4 Saving and Recalling Results Measurements are saved and can be viewed later, in the same way as described for the Sound Level Meter project in Chapter 3 and Chapter 6. 130 Hand-held Analyzer Types 2250 and 2270 – User Manual 131 Chapter 12 Enhanced Logging (Optional Module) Enhanced Logging Software BZ-7225 enables you to measure and save data periodically on memory cards. You can also save to a USB memory stick with hardware version 4. The module is optimised for unattended use, which means that the module will measure and save data in an efficient way, without the requirement for an operator to be present. In addition to measuring broadband parameters (see Chapter 3) and spectra* (see Chapter 10), it simultaneously logs the following parameters (see Chapter 11): • Broadband parameters (including broadband statistics) • Broadband parameters every 100 ms • Spectraa (including spectral statistics) • Record the measured signal† Finally, the Enhanced Logging module can also log with a different period (periodic reports –for example, every hour) for reporting: • Broadband parameters (including broadband statistics) • Spectra* (including spectral statistics) The Enhanced Logging module can measure continuously, limited only by data memory and power supply. An overview showing the options available during a typical enhanced logging task has been provided in Table 12.1. *. †. Requires Frequency Analysis Software BZ-7223 Requires Signal Recording Option BZ-7226 Hand-held Analyzer Types 2250 and 2270 – User Manual 132 Table 12.1 Overview of options available during a typical enhanced logging task Period Broadband Parameters Broadband Statistics Spectral Parameters Spectral Statistics 1 s – 24 h 1 to 10 or All (45) None or Full 0–3 or All (5) None or Full Logged (100 ms) 100 ms None, LAeq, LAF and/or LAS None available None available None available Periodic Reports 1 m – 24 h All (53) Full All (5) None or Full Elapsed Time All (67) Full All (5) Full Selection Logged Total Check the About screen to see whether you have a license to run Enhanced Logging. (To access the About screen, tap the Help icon then tap About.) See Chapter 9 for instructions on installing the license for the Enhanced Logging option. 12.1 Setting up the Analyzer 1) Select the Enhanced Logging project template. (section 3.3.1 for more details on templates.) The project template is displayed on the black banner at the top of the screen. If this banner does not display Enhanced Logging, tap the banner and select Enhanced Logging from the drop-down that appears. 2) Depending on your memory device: • Insert an SD memory card in a SD card slot at the bottom of the analyzer • If you have hardware versions 1 – 3, you can insert a CF memory card in the CF card slot at the bottom of the analyzer • With hardware version 4, you can use a USB Type A stick at the bottom of the analyzer You will be notified that a memory card has been inserted – select Yes to change the default measurement path to the memory card. Note: You cannot log data on the internal disk. 3) Tap the Main Menu icon and select Explorer from the list of options. Create a job folder for the measurements and set the default measurement job/path as described in Chapter 6. 4) Tap the Main Menu icon and select Setup from the list of options. Set up the measurement as described for Logging in Chapter 11, steps 4 to 12. 5) Under the Measurement Control parameters: • Set the Save Project Data at, Continuous Logging and Report Period as required • Select whether or not you want to save the Full Spectral Statistics for Reports CHAPTER 12 Enhanced Logging (Optional Module) 133 Note: All other measured broadband and spectral parameters are logged automatically per report period. Then you can select: • Number of CICs • Desired time periods for calibration 6) Under the Logged Spectrum parameters, you can choose to log Full Spectral Statistics per Logging Period or not. Note: Logging the full spectral statistics at a short logging period (for example, every second) takes up a lot of space on the memory card. 7) Under Triggers, you can specify a Signal Recording Timer for periodically starting a signal recording (for example, five minutes per hour) and you can specify up to four independent Level Triggers to be active at four different times during the day. Each level trigger works as specified in section 11.1. In addition, you can specify a Hold Off period – this means that during this period, new triggers are inhibited. You also have the ability to trigger LXeq(f1–f2). Note: You can trigger on a specific frequency band by setting f1 = f2. 8) Under Lden Periods parameters you can set up the day, evening and night periods and the penalties in accordance with your local legislation. To exit the screen, tap the 12.2 icon. Controlling the Measurement The measurement is controlled in the same way you would control a normal Sound Level Meter measurement, using Start/Pause , Continue , Back-erase and Reset pushbuttons, see Chapter 3 for more details. However, during the measurement, data are automatically saved in projects, one per day. The projects are automatically saved at the time specified in the Save Project Data at parameter in Setup > Measurement Control. The next project is (automatically) started immediately after the first one, without any data loss. Note: When Preset Logging Time has elapsed, or you pause the measurement, then the project will not be saved automatically. This has to be done manually. In the case of power failure, or other failures, the software is rebooted automatically. This means that the measurement data collected up until the time of the reboot is saved in a project and a new measurement is started. The new measurement is started in a new project. The projects are named as specified in Preferences > Storage Settings. Example: If you select Auto-naming of Projects, and start the measurement on the 13th of November, then your projects for measuring 48 hours (assuming you have started in the middle of the day, and have set Save Project Data at parameter to 00:00:00) will be: 051113 001 (containing data from the middle of the day November 13th until midnight) Hand-held Analyzer Types 2250 and 2270 – User Manual 134 051114 001 (containing data for a whole day – November 14th) 051115 001 (containing data from midnight to the middle of the day on November 15th) If you did not select Auto-naming of Projects then you would have the following projects (assuming the Project Name Prefix parameter was set to Project and no projects had been saved before in the directory): Project 001 Project 002 Project 003 If you have set the Charge Injection Calibration parameter to On, then a CIC calibration is performed at specified times of the day. An Exclude marker is set on the logging profile at the point where the CIC is being performed. The update of the Total parameters and the Periodic Reports is stopped while the CIC is being performed. You can see the results of the CIC calibration under Total parameters, CIC Result 1 to 4. The CIC result can be either ‘Passed’, ‘Background noise too high’ or ‘CIC Ratio deviates from Ref.’ (The ‘Ref.’ mentioned here is the reference created by the very first manual CIC, and is the one used as the reference to all subsequent CIC ratio measurements, see section 5.10.) Note: If a level trigger is active when the CIC is due to start, then the CIC will not be done. 12.2.1 Annotating a Project Measurements can be annotated in the same way as you annotate Logging measurements. See section 11.2.1. 12.2.2 Recording the Signal Signal recordings can be done in the same way as described under Logging measurements. See section 11.2.2. 12.3 Displaying the Results The Enhanced Logging Measurement screen includes three tabs at the bottom: Profile, Spectrum and Broadband view – as the Logging Measurement screen does. You view data in the same way as in the Logging module. You mark and annotate sound categories and edit markers and annotations in the same way as in the Logging module – please see Chapter 11. The Result Selector (first item in the third line of the Status Field) determines whether results from the Total, Logged, Logged (100 ms) or Report measurement are displayed. If you need to display data from another day of the measurement, then use Explorer to select and open the project from that day. CHAPTER 12 Enhanced Logging (Optional Module) 12.3.1 135 The Profile View The Profile view displays a profile of a logged broadband parameter (dB versus time). See Fig.12.1. Fig.12.1 Profile view in Enhanced Logging 12.3.2 Displaying Noise Indicators The Lden and Ldn parameters are displayed in the Broadband view when selecting Total in the Result Selector. Then select the Noise Indicators from the Leq parameter group. See Fig.12.2. Fig.12.2 Noise Indicators Hand-held Analyzer Types 2250 and 2270 – User Manual 136 12.3.3 Saving and Recalling Results Measurements are saved and can be viewed later, in the same way as described for the Sound Level Meter Project in Chapter 3 and Chapter 6. 137 Chapter 13 Signal Recording Option Signal Recording Option BZ-7226 allows you to record the input signal (typically sound) in either 16-bit or 24-bit resolution during measurement (24-bit for BZ-7222/23/24/25/30/33 only). The signal recording can be controlled manually or by using an external trigger signal. The recording can also be triggered when a measured parameter exceeds a preset level (BZ-7224 and BZ-7225 only). The recorded sound can be played back and listened to using the supplied Earphones HT-0015. Sound is recorded directly to a memory card. With hardware version 4, sound can also be recorded to a USB memory stick. The main benefit is that data is documented on-site and is therefore ready for post-processing and reporting back at the office using Measurement Partner Suite BZ-5503 or other postprocessing software such as Evaluator Type 7820, Protector Type 7825 or Microsoft® Excel®. Check the About screen to see whether you have a license to run the Signal Recording option. (To access the About screen, tap the Help icon then tap About.) See Chapter 9 for instructions on installing the license for the Signal Recording option. 13.1 Sound Level Meter and Frequency Analysis Software You can use the Signal Recording facility together with the Sound Level Meter Software and the Frequency Analysis Software. You can record the sound for the whole measurement period or you can record sound for controlled parts of the measurement. The recordings are attached to the project as annotations, named “Soundrec N”, where N is the number of the recording for the project. (section 3.5 and section 6.3.2 for a description of how to use annotations.) Note 1: Signal recordings can only be done during measurements. Note 2: Signal recordings can only be done on projects saved on memory cards (or with hardware version 4, from a USB memory stick). Hand-held Analyzer Types 2250 and 2270 – User Manual 138 13.1.1 Setting up the Analyzer 1) Select a Sound Level Meter project template or a Frequency Analyzer project template. (see section 3.3.1 for more details on templates.) 2) Depending on your memory device: • Insert an SD memory card in a SD card slot at the bottom of the analyzer • If you have hardware versions 1 – 3, you can insert a CF memory card in the CF card slot at the bottom of the analyzer • With hardware version 4, you can use a USB Type A stick at the bottom of the analyzer Note: You cannot record the signal on the internal disk. 3) Tap the Main Menu icon and select Explorer from the list of options. Navigate to the memory card, create a job folder for the measurements and set the default measurement job/path as described in Chapter 6. 4) Tap the Main Menu icon and select Setup from the list of options. Set all the parameters as required for the Sound Level Meter or Frequency Analyzer measurement, see Chapter 3 and Chapter 10, respectively. 5) Under Signal Recording you can specify the Recording Control parameters as follows: • Automatic, if you want to start the recording when you start the measurement and stop when you pause the measurement, and to limit the recording to Maximum Duration, if Duration Limit is set to On • Manual Event, if you want to start and stop the recording using the Manual Event pushbutton during the measurement and to limit the duration of the recording, if Duration Limit is set to On. In this case the recording will be at least Minimum Duration long, but no longer than the Maximum Duration. Use Pre-recording Time and Post-recording Time to specify how much extra you want to be recorded before and after the event • External Event, if you want to start and stop the recording using an external trigger signal, connected to the Trigger Input. See details in Appendix A • Image Event (Type 2270 only), if you want to make a short recording together with capturing an image. The recording will be "Pre-recording Time + Post-recording Time + 1" second long. See details in Appendix A • Off, if you do not want to record the signal 6) Set Recording Quality to High, Medium, Fair or Low in accordance with your needs. Note: High quality requires more disk space than low quality – details in Appendix A. 7) Set Recorded Signal to either Input A/B-weighted, Input C-weighted or Input Z-weighted (A/B-weighting is determined by setting the parameter in Setup > Frequency Settings > Broadband (excl. Peak)). Input C-weighted is suitable for recordings used afterwards to identify the sound source – it contains all the audible content of the signal, but reduces the low-frequency noise from wind, etc. CHAPTER 13 Signal Recording Option 139 8) Set Automatic Gain Control to On – if you just want to listen to the signal afterwards. The full 120 dB dynamic range (from max. input level and down) will be converted to 40 dB and the signal is stored as a 16-bit WAV file. Set Automatic Gain Control to Off – if you need to record calibrated signals or need to analyze the wav-file afterwards on a PC. Select Resolution = 24 bit (recommended) to cover the full 120 dB dynamic range (from max. input level and down) or select Resolution = 16 bit and specify the Peak Recording Level. 9) Under Input you specify Trigger Input if you want to start the signal recording using an external trigger signal. See details in Appendix A. To exit the screen, tap the 13.1.2 icon. Controlling the Recording The measurement is controlled in the same way you would control a normal Sound Level Meter measurement, using Start/Pause, Continue, Reset and Save pushbuttons, see Chapter 3 for more details. When the measurement signal is being recorded, the Recording icon is displayed in the Status Field. The recording is attached to the project as an annotation. The annotations icon is then displayed to indicate that the project has been annotated. When Recording Control is set to Automatic, the recording will start when the measurement is started and last for the Maximum Duration or the Elapsed Time, whichever is smallest. If you continue a paused measurement, then a new recording is started. When Recording Control is set to Manual Event, the recording will start the first time you press the Manual Event pushbutton during the measurement, and stop the second time you press it; if you press it a second time before the Minimum Duration has elapsed, then the recording will continue until Minimum Duration has elapsed; if you press it a second time after Maximum Duration has elapsed, then the recording has already been stopped when Maximum Duration elapsed and the pushbutton will initiate a new recording instead. When Recording Control is set to External Event, and Trigger Input is set to Voltage Level, then recording is started when the voltage level is ‘high’ and stopped when voltage level is ‘low’ (details in Appendix A). Duration Limit has no effect on this setting. When Recording Control is set to Image Event (Type 2270 only), then you will record 1s plus the Pre- and Post-recording Time. If Pre-recording Time has been set, then the recording will start this time before you hit the Manual Event pushbutton. This is possible because the recording is done continuously in an internal buffer, ready to be saved as a wave file. The Pre-recording Time is limited by this buffer size and the Recording Quality – details in Appendix A. Note: Very long signal recordings will be split into wave files containing maximum 10 minutes, that is, a 35-minute signal recording will consist of 4 wave files, three with 10 minutes of sound and one with 5 minutes of sound. Hand-held Analyzer Types 2250 and 2270 – User Manual 140 13.1.3 Playing the Recording Signal recordings are attached to the measurement project as annotations. The annotations icon is displayed in the Status Field to indicate this. Tap the paperclip to open the list of annotations. Tap the annotation to play it back – details in Chapter 3 and Chapter 6. 13.2 Logging and Enhanced Logging Software You can use the Signal Recording facility together with the Logging and Enhanced Logging Software. You can record the sound for the whole measurement period or you can record sound for controlled parts of the measurement. The recordings are attached to the profile as sound markers. The signal recordings can be controlled by the Manual Event pushbutton, the Backerase pushbutton, an external trigger signal, or by the level of the measured signal. You can also control the signal recording using the stylus to mark the interesting part on the profile. Note 1: Signal recordings can only be done during measurements. Note 2: Signal recordings can only be done on projects saved on memory cards (or with hardware version 4, from a USB memory stick). 13.2.1 Setting up the Analyzer 1) Select a Logging, Logging SLM or Enhanced Logging Project Template. (see section 3.3.1 for more details on templates.) 2) Depending on your memory device: • Insert an SD memory card in a SD card slot at the bottom of the analyzer • If you have hardware versions 1 – 3, you can insert a CF memory card in the CF card slot at the bottom of the analyzer • With hardware version 4, you can use a USB Type A stick at the bottom of the analyzer Note: You cannot record the signal on the internal disk. 3) Tap the Main Menu icon and select Explorer from the list of options. Navigate to the memory card, create a job folder for the measurements and set the default measurement job/path as described in Chapter 6. 4) Tap the Main Menu icon and select Setup from the list of options. Set all the parameters as required for the Logging or Enhanced Logging measurement, see Chapter 11 or Chapter 12, respectively. 5) Under Signal Recording you can specify the Recording Control parameters as follows: • Automatic, if you want to start the recording when you start the measurement and stop when you pause the measurement, and to limit the recording to Maximum Duration, if Duration Limit is set to On • Manual Event, if you want to start and stop the recording using the Manual Event pushbutton during the measurement CHAPTER 13 Signal Recording Option • Exclude Event, if you want to start and stop the recording using the Back-erase pushbutton during the measurement • External Event, if you want to start and stop the recording using an external trigger signal, connected to the Trigger Input • Level Event, if you want to start and stop the recording based on the level trigger settings during the measurement • All Events, if you want to start and stop the recording based on any of the events 141 Note: When Recording Control set to any of the events, you can limit the duration of the recording, if Duration Limit is set to On. In this case the recording will be at least Minimum Duration long, but no longer than the Maximum Duration. Use Prerecording Time and Post-recording Time to specify how much extra you want to be recorded before and after the event • Image Event (Type 2270 only), if you want to make a short recording together with capturing an image. The recording will be "Pre-recording Time + Post-recording Time + 1" seconds long. See details in Appendix A • Off, if you do not want to record the signal 6) Set Recording Quality to High, Medium, Fair or Low in accordance with your needs. Note: High quality requires more disk space than low quality – details in Appendix A. 7) Set Recorded Signal to either Input A/B-weighted, Input C-weighted or Input Z-weighted (A/B-weighting is determined by setting the parameter in Setup > Frequency Settings > Broadband (excl. Peak)). Input C-weighted is suitable for recordings used afterwards to identify the sound source – it contains all the audible content of the signal, but reduces the low-frequency noise from wind, etc. 8) Set Automatic Gain Control to On – if you just want to listen to the signal afterwards. The full 120 dB dynamic range (from max. input level and down) will be converted to 40 dB and the signal is stored as a 16-bit wav-file. Set Automatic Gain Control to Off – if you need to record calibrated signals or need to analyze the wav-file afterwards on a PC. Select Resolution = 24 bit (recommended) to cover the full 120 dB dynamic range (from max. input level and down) or select Resolution = 16 bit and specify the Peak Recording Level. Under Input you specify Trigger Input if you want to start the recording using an external trigger signal. See details in Appendix A. To exit the screen, tap the 13.2.2 icon. Controlling the Recording The measurement is controlled in the same way you would control a normal logging measurement, using Start/Pause, Continue, Reset and Save pushbuttons, see Chapter 11 for more details. When the measurement signal is being recorded, then the Recording icon is displayed in the Status Field. The recording is attached to the profile as a Marker 6 (Sound). Hand-held Analyzer Types 2250 and 2270 – User Manual 142 If you set Recording Control to Automatic, the recording will start when the measurement is started and last for Maximum Duration or Elapsed Time, whichever is smallest. If you continue a paused measurement, then a new recording is started. If you set Recording Control to Manual Event, the recording will start the first time you press the Manual Event pushbutton during the measurement (this starts a Manual Event marker and a Sound marker), and stop the second time you press it; if you press it a second time before Minimum Duration has elapsed, then the recording will continue until Minimum Duration has elapsed; if you press it a second time after Maximum Duration has elapsed, then the recording has already stopped when Maximum Duration elapsed, and the pressing the button will have no effect on the signal recording (the Manual Event marker, however, is stopped). If you set Recording Control to Exclude Event, the recording will start the first time you press the Back-Erase pushbutton during the measurement (this starts an Exclude Event marker and a Sound marker), and stop the second time you press it – the behaviour will be similar to control by the Manual Event pushbutton. When Recording Control is set to External Event, and Trigger Input is set to Voltage Level, then recording is started when the voltage level is ‘high’ and stopped when voltage level is ‘low’ (details in Appendix A). Duration Limit has no effect on this setting. If you set Recording Control to Level Event, the recording will start, controlled by the level trigger – see Chapter 11 for details. When Recording Control is set to Image Event (Type 2270 only), then you will record 1s plus the Pre- and Post-recording Time If you set Recording Control to All Events, the recording will start when any of the events above become active, and stop when all events are inactive again. If Pre-recording Time has been set, then the recording will start this time before the Event appears. This is possible because the recording is done continuously in an internal buffer, ready to be saved as a wave file. The Pre-recording Time is limited by this buffer size and the Recording Quality – details in Appendix A. Note: Very long signal recordings will be split into wave files containing maximum 10 minutes, that is, a 35-minute signal recording will consist of 4 wave files, three with 10 minutes of sound and one with 5 minutes of sound. 13.2.3 Control Recording using the Stylus If Recording Control is set to any of the events, or to All Events, the recording can also be controlled using the stylus directly on the profile, in the same way as you mark sound categories – details in Chapter 11. CHAPTER 13 Signal Recording Option 143 Fig.13.1 Example Logging display (showing internal buffer marker) The small triangle above the profile indicates the amount of sound you have in the internal buffer – ready for storage in a wave-file. You will have sound from this triangle to the righthand side of the profile. The triangle is updated every second. To make a signal recording using the stylus, you tap and hold the stylus on the profile display and drag it to the position where the signal recording should end, then you remove the stylus and get a drop-down menu with the possibility of setting one of the six markers. If you select Sound, then a sound marker is made and the sound for the marked interval is stored in a wave file. Only the portion of the sound available in the internal buffer (to the right of the small triangle) will be stored and the sound marker will only indicate this part. Note: When selecting an interval for storing (or setting a marker), the profile display freezes, but the signal recording is still updated in the internal buffer. The part of the buffer available on the screen will decrease and you will see the small triangle move to the right. Be sure not to wait too long in selecting the Sound marker from the drop-down menu – otherwise the signal recording will disappear from the internal buffer. 13.2.4 Playing the Recording You playback the sound simply by selecting part of the marker – as described in section 11.3.3 – and choose Play Sound from the resulting drop-down menu. The following drop-down menu will then appear (Fig.13.2). 144 Hand-held Analyzer Types 2250 and 2270 – User Manual Fig.13.2 Playing the recording – the drop-down menu Select one of the four ways of playing a sound: Selection will play the part you have selected; Repeat Selection will play the selected part until you press Cancel on the pop-up menu; To End will play the sound from the position you selected the sound marker to the end; and finally All will play the entire signal recording, regardless of your selection point. Fig.13.3 Playing the recording – output level pop-up When you have selected the method of play-back, a pop-up appears explaining how to adjust the output level in the headphone and how to stop the play-back. Tap the Minimize button to reduce this to a small blue bar at the top of the screen – allowing you to watch the profile underneath – you will notice that the profile cursor is updated every second to the position of the sound that is currently being played. CHAPTER 13 Signal Recording Option 145 Fig.13.4 Playing the recording – minimizing the pop-up The small blue button bar at the top can be maximized again by tapping the close it and stop playing back by tapping the icon. 13.2.5 icon, or you can Signal Recordings on the PC When projects including signal recording have been transferred into an Archive on a PC using BZ-5503, then the recordings can be played back directly from BZ-5503. Signal Recordings can be input to the Brüel & Kjær PULSE Multi-Analyzer platform for further analysis – please contact your local Brüel & Kjær representative for further information. Note: When recording signals for further analysis in PULSE, be sure to record the Z-weighted signal and select Automatic Gain Control to Off under the Signal Recording parameters and select the Recording Quality to match your needs for frequency content – see details on sampling frequency in Appendix A. When Automatic Gain Control is set to Off, then the calibration information is stored in the wave files – allowing PULSE to analyse the signal recordings, taking the calibration into account. Note: Other sound players than BZ-5503 might not be able to amplify “24-bit per sample” wavfiles enough to hear weak sounds. If this is needed, then use 16-bits per sample. 146 Hand-held Analyzer Types 2250 and 2270 – User Manual 147 Chapter 14 Reverberation Time Software (Optional Module) 14.1 Introduction Reverberation Time Software BZ-7227 enables you to measure reverberation time in 1/1-octave or 1/3-octave. Check the About screen to see whether you have a license to run Reverberation Time Software. (To access the About screen, tap the Help icon then tap About.) See Chapter 9 for instructions on installing a license for Reverberation Time Software. 14.1.1 Definition Reverberation Time (RT) is the most important parameter describing the acoustic quality of a room or space. It is important for sound levels, speech intelligibility and the perception of music. In addition, it is used to correct for the effects of RT on building acoustics and sound power measurements. RT is the decay time for sound in a room after the excitation stops. It is the time for a 60 dB drop in level, but the decay is usually evaluated over a 10, 20 or 30 dB drop, using the measurements within these ranges to make a regression line, which is then extrapolated to the 60 dB range (Fig.14.1). RT may be labelled EDT, T20 and T30 respectively for those three evaluation ranges. EDT is used in room acoustics only, while T20 and T30 may be used for Building Acoustics, Sound Power and Absorption Coefficient measurements as well. RT is measured in 1/1- or 1/3-octave frequency bands, some of which may be averaged to provide a single-number result for the most significant bands. RT may range from 0.1 seconds (or less) in anechoic chambers, to 10 or more seconds in large public spaces. Hand-held Analyzer Types 2250 and 2270 – User Manual 148 Fig.14.1 Definition of Reverberation Time (RT). Evaluation range of 30 dB for calculation of T30 indicated dB Regression Line 0 dB Excitation Level –5 dB Evaluation Range –35 dB Background Noise Level –60dB Time Reverberation Time 060210 RT varies between positions in a room, so it is usually measured at several positions. The spatial average (Room average) for all positions gives an overall assessment, and the position results may be used to indicate the acoustic quality as a function of location. The Room average can either be made as an average of the RT spectra, or calculated for the averaged decays (ensemble average), that is: the decays for each frequency band are averaged over all positions and the RT spectrum is then calculated for the averaged decays. 14.1.2 How Do We Measure Reverberation Time? RT can be measured using either Interrupted Noise, with the built-in noise generator, or by using Impulsive Excitation (Schroeder Method), such as from a pistol or balloon burst. Interrupted Noise Method When using a power amplifier and loudspeaker sound source (Fig.14.2), the analyzer will turn its noise generator on and off, then measure and display the RT spectrum and decays. CHAPTER 14 Reverberation Time Software (Optional Module) 149 Fig.14.2 Typical RT measurement setup using a loudspeaker source DIRAC MP3 Player White -20 -10 0 dB Pink Protect Power Amplifier Type 2734 230/115 V AC / 650 W Power On O Balanced In -6 Generator I Loudspeaker -5 Level -4 -9 -12 In Fuse -3 Remote Out -18 -2 -24 -1 -30 0 dB 4292-L 2734 ZE-0948 2250 110009 Fig.14.3 Typical RT measurement cycle for the interrupted noise method dB Sound Level Start Time Escape Time Build-up Time About 1s Decay time Decay measurement Generator On 060208 Fig.14.3 shows a typical RT measurement cycle automatically performed by the analyzer, where the different steps are described as follows: 1) After ‘Start’, there is a chosen ‘Escape Time’ which allows for vacating the measurement site. 2) The noise generator is then switched on and waits for the chosen ‘Build-up’ time to allow for a steady state to be reached. 3) The decay measurement starts. The level for the first second, or so, (labelled ‘About 1s’ on Fig.14.3) is used to identify the excitation sound level as the 0 dB reference level. 4) The noise generator is switched off and the ‘Decay time’ starts. 5) The decay measurement ends when only the background noise level is measured (automatically detected by the analyzer). 150 Hand-held Analyzer Types 2250 and 2270 – User Manual 6) Steps 2 to 5 are automatically repeated a chosen number of times and the measured decays are averaged together to reduce the uncertainty of the measurement. 7) The reverberation time spectra EDT, T20 and T30 are calculated and displayed on the screen. The measurement can be in octaves or 1/3-octaves in parallel over a selectable frequency range, allowing you to focus sound power on the relevant range. In each frequency band, the decay is sampled 200 times each second, for reverberation times as long as 20 seconds. You can enhance the signal-to-noise ratio by limiting the frequency range of the noise to cover just a single frequency band, while keeping the output power constant. First, you make a parallel measurement, then, if the signal-to-noise ratio is too low in a few bands (typically at low frequencies) you select these bands for serial measurements. You can redo the measurements including only these bands and merge the results with the parallel measurement. Impulsive Excitation Method With Impulsive Excitation, all you need to carry is Type 2250-F/2270-F, a tripod and a balloon (or other impulsive source, such as a starting pistol). After you start the analyzer and pop the balloon, the analyzer will start measuring, analyse the decay and display the RT spectrum and decay. The single input range means that trial measurements are not necessary when using the impulsive excitation method. Fig.14.4 Typical RT measurement cycle for the impulsive excitation method dB Sound Level Trigger Level Start Impulse Excitation Time Await Level to exceed Trigger Level Decay Time 1s Impulse measurement 060209 Fig.14.4 shows a typical RT measurement cycle performed by the analyzer, where the different steps are described as follows: 1) After ‘Start’, the analyzer waits for the level to exceed the ‘Trigger Level’ (indicated on the analyzer in three places by the “traffic light” giving a short green flash every second). 2) The impulse excitation is made, for example, a pistol is fired or a balloon is burst. CAUTION: The use of hearing protection is highly recommended. 3) The impulse measurement is started 1 s before the level exceeds the ‘Trigger Level’. CHAPTER 14 Reverberation Time Software (Optional Module) 151 4) The impulse measurement stops after the analyzer detects the background noise level again (automatically measured by the analyzer). 5) The analyzer performs backward integration of the impulse measurement. 6) The reverberation time spectra EDT, T20 and T30 are calculated and displayed on the screen. The measurement can be in octaves or 1/3-octaves in parallel over a selectable frequency range. In each frequency band, the decay is sampled 200 times each second. The impulse response is backward integrated (according to the Schroeder method). In theory, the resulting decay will be equivalent to the average of a large number of decays made with the interrupted noise method. Therefore, the decays will be smooth using just one single shot. 14.2 Setting up the Analyzer 1) Select the Reverberation Time project template. (see section 3.3.1 for more details on templates.) The project template is displayed at the top of the screen, if it does not display Reverberation Time, tap the black bar at the top of the screen and select Reverberation Time from the drop-down menu that appears. 2) Tap the Main Menu icon and select Setup from the list of options. Set the Bandwidth and Bottom and Top Frequency of the measurement as required. 3) Set Map Based Measurement = No in the Measurement Control setup – the reverberation decays will then be numbered from Pos. 1 to N. See how to measure with position management in section 14.2.1. 4) Set Automatic Save = No, if you want to inspect the reverberation time and decays before manually saving the measurement – otherwise select Yes to automatically save the decays after each measurement. 5) Set Measurement Mode to: – Parallel, for measuring all bands in a spectrum simultaneously – Serial, for measuring selected bands only (to be saved and merged with a previously measured Parallel spectrum) – Combined, for measuring Parallel and then Serial in an automated sequence When doing the Serial measurement, the bandwidth of the generator will match the selected band, thus increasing the output power for the band and increasing the signal to noise ratio for the band. 6) The analyzer automatically detects the decay time and stops the measurement at the end of the decay – however, under special conditions (for example, when measuring with high background noise) the decay time cannot be detected and the measurement will run up to 20 s. To minimise the measurement time and memory requirement for the measurement, you can limit the measurement by setting the Max Decay Time. 3 s is adequate for most ordinary rooms, but should be increased for larger halls or reverberation rooms. 7) Set Excitation to Impulse if you want to measure using the impulse method (go to step 15) – otherwise select Interrupted Noise. Hand-held Analyzer Types 2250 and 2270 – User Manual 152 14.2.1 Interrupted Noise Method 8) Set the number of decays you want to measure per position – the analyzer automatically controls the generator, measurement of the decays and averaging the decays. 9) Set the Generator as required – set Generator Type = External if you want to control an external generator (details in Appendix A) – otherwise leave it at Internal to use the internal generator. 10) Select Noise Type for the internal generator. Pink noise is typically used. 11) Adjust the level of the internal generator output to match the input of the power amplifier used by setting Level [re. 1 V]. Note: You can manually turn the generator on and off by tapping on the Loudspeaker icon in the Status Field. 12) Set the Escape Time allowing you to leave the room before the generator is turned on during the measurement – see Fig.14.3. 13) Set Build-up Time to allow the excitation noise to reach a steady level before the measurement starts. 1 s is adequate in most ordinary rooms, but should be increased for larger halls or reverberation rooms. 14) Select the Sound Source used, to optimise the frequency response of the internal generator output for either a flat power response or optimum power difference between adjacent 1/1- or 1/3-octave bands – thereby eliminating the need for an equalizer to smooth the response in most cases. Select a type matching your sound source – select Unknown if you are using a non Brüel & Kjær sound source, or do not want to make a correction to the frequency response. Go to step 16. 14.2.2 Impulsive Method 15) Set Trigger Level low enough to be sure the impulse will be triggered, but high enough to avoid triggering on the background noise. A level between 80 and 100 dB is normally adequate. 16) If you have selected Automatic Save = Yes, then Trigger Repeat can be set to Yes to automatically start a new measurement when a measurement has been saved. This allows you to go to another position and make a new impulse, without the need for controlling the analyzer between the measurements. Observe how the “traffic light” indicates the status of the measurement (see Table 4.2 and Fig.14.4) making it easy for you to change position and generate the impulse synchronised with the measurement procedure. Press the Start/Pause pushbutton to stop the measurement when the last measurement has been saved. 14.2.3 Signal Recording 17) Set Recording Control = Automatic if you want to record the signal during the measurement. The recordings can be played back afterwards for identifying the cause of measurements differing from each other – or (if Excitation = Impulse) for further analysis of the measured CHAPTER 14 Reverberation Time Software (Optional Module) 153 impulse response by post-processing software like DIRAC Room Acoustics Software Type 7841. The recordings will contain the signal from when you press the Start pushbutton until the measurement stops. The recording will be attached to the measurement as an annotation. Note: Signal Recording requires a license for Signal Recording Option BZ-7226. To exit the Setup screen, tap the 14.2.4 icon. Controlling the Measurement The measurement is controlled in the same way you would control a normal Sound Level Meter measurement, using Start/Pause, Continue, Reset and Save pushbuttons, see Chapter 3 for more details. Note the following exceptions: 14.2.5 • Pressing Start initiates a measurement cycle slightly more complex than a standard SLM measurement – see Fig.14.3 and Fig.14.4 for details. The results are the same, however, a set of measurement data – in this case the reverberation decays at one position • Creating a new reverberation time project: The measured data is stored at a position – and you can have several positions in one project. Therefore, starting a complete new project cannot be done by pressing Reset and then Start (as when measuring using the SLM template), because this will measure the decays at a single position within the Project – a new project is initiated by selecting a new project template (or the same again). This will create a new project Serial Measurements If you have made a measurement using the Interrupted Noise method and at some frequencies you have not been able to get a sufficient signal to noise ratio. This problem may show up at frequencies where the background noise has been too high. The frequencies will then be marked with red smileys (see Table 14.1). To solve this, you either have to lower the background noise (which might not be possible) or increase the power of the loudspeaker in the source room. If your loudspeaker already produces as much noise as possible, you can limit the frequency range of the noise to cover just a single frequency band while keeping the output power constant, thus increasing the noise level in the smaller frequency range. For a 1/3-octave band, this will increase the noise level at the band by up to 10 dB. To select the frequency bands to be measured (using noise limited to cover these bands only): 1) Select Measurement Control from the Setup screen. 2) Set the Measurement Mode to Serial. 3) On the Spectrum display, select the bands you want to measure using the cursor and tap on the x-axis to select the band for serial measurement (Fig.14.5). Hand-held Analyzer Types 2250 and 2270 – User Manual 154 Fig.14.5 Selecting the bands for serial measurements Left: Selecting the band for serial measurement Right: The arrow is pointing to the “s” symbol, which indicates the selected frequency band Note: A small s appears above the selected frequency bands (Fig.14.5). 4) When you have selected the frequency bands you want to re-measure, press the Start/Pause pushbutton. The analyzer will then start at the lowest selected frequency band, generate noise at this band, make the measurement and automatically step to the next selected band. This will continue until all selected bands have been measured. 5) Press the Save pushbutton to save and merge the bands with the measurement you have already done (be sure to select the right position before saving). Combine Parallel and Serial Measurements in an Automated Sequence You can speed up the measurement process if you start by investigating whether you need to use serial measurements at certain frequency bands, or not. If you need to measure some bands serially, then you can select Measurement Control from the Setup screen, and set the Measurement Mode to Combined. Then select the bands you want to measure serially (see above). Press the Start/Pause pushbutton to make a normal parallel measurement and then do the serial measurements – all in an automated sequence. 14.2.6 Annotating Projects and Positions While using the Reverberation Time Software you can annotate the Reverberation Time project using the normal method of adding annotations to a project. The annotations can then be viewed by tapping on the Annotations icon or tapping the Main Menu icon and selecting Explorer from the list of options. See section 3.5. However, your project can contain a lot of measurements, one per position, so you can annotate any position in the project. Signal recordings are automatically attached as annotations to the positions. Annotations at positions are managed in the Overview display – described in the next section. CHAPTER 14 Reverberation Time Software (Optional Module) 14.3 155 Displaying the Results The Reverberation Time Measurement screen includes three tabs at the bottom: Overview, Spectrum and Decay. The tabs allow you to choose different ways of displaying the measurement results: 14.3.1 • Overview: Shows the measurement positions in a table – one position per row. Use this to get an overview of your measurements, to include/exclude positions from the spatial average of all positions in the room, and to manage annotations/signal recordings at the positions • Spectrum: Shows the reverberation spectra graphically, or as a table, for one position, or for the room average. Alternatively, it can show the instantaneous sound pressure level while measuring • Decay: Shows the reverberation decay at a single frequency, for one position, or for the room average Overview The Overview tab shows the measurement positions in a table – one position per row. Fig.14.6 Overview tab Status Field The Status Field consists of three lines (see Fig.14.6) – the first two lines of information are common to the status lines in the Sound Level Meter and Frequency Analyzer (see Chapter 4). Note: The first line of the Status Field might also contain a smiley, indicating the quality of the room (the spatial average of all positions). See the description of smileys in the following paragraph and section 14.5. 156 Hand-held Analyzer Types 2250 and 2270 – User Manual The third line of information allows you to: • Select the measured position. The selected position is the one highlighted in the table. The selected position will be the one displayed when selecting the Spectrum or Decay view • Step forwards or backwards through the positions on all displays, using the icons • Get information on the quality of the measurement through a quality indicator (smiley) displayed as an icon: and : means results should be used with caution : means results may be suspect or missing No icon means the analyzer found no measurement quality issues Tap the smiley to get more detailed information about the quality indication. (See the description of smileys in section 14.5.) Table The header row of the table contains (from left to right): • The RT selector (EDT, T20 or T30), which determines which RT to display in the table rows below. It is also linked to the main Spectrum selector and main Decay selector • The Frequency selector (which includes decrement and increment buttons), determines the frequency of the readouts in the table rows below. The frequency selector is linked to the Spectrum cursor and the frequency of the selected Decay • Readout of the RT value for the current measurement, before it is saved to a position Each row of the table contains (from left to right): • A checkmark controlling whether the position is included or excluded from the Room Average. Tap it to include (check) or exclude (uncheck) the position. All positions are by default included in the Room Average • The position. Tap it to get a drop-down with two options, Select and View Annotations. Use Select to select the position and View Annotations to view the list of annotations for the position. You can add annotations on the position from this view – as described in Chapter 6 • Possible annotation indicated by • The readout of the RT parameter at the frequency determined by the RT selector and Frequency selector in the table header row. There might be a smiley to the right of the readout warning about the quality of the readout. Tap the smiley to get more detailed information about the warning . Tap it to view the list of annotations for the position CHAPTER 14 Reverberation Time Software (Optional Module) 14.3.2 157 Spectrum The Spectrum tab shows the reverberation time spectrum from a position, or the room average reverberation time, or both. The sound level is displayed during measurements. Fig.14.7 Spectrum tab Status Field The Status Field on the Spectrum tab is the same as on the Overview tab. Spectrum Graph The Spectrum graph is the same as in the Frequency Analysis software: Two 1/1-octave, or 1/3octave spectra, superimposed with cursor readouts. The displayed frequency range is automatically adjusted for the measured frequency range. Small smileys are set below each frequency band with a potential problem. The smileys are also available at the cursor readouts. Tap the smiley at the cursor readout to get detailed information about the warning. The Spectrum Parameter selectors above the graph selects which spectra to display. You can choose to display: T20@Pos, T30@Pos, EDT@Pos, T20, T30 or EDT. If you only want one graph you can set the other to Off. In addition to choosing which parameter to display, you can choose to Display Sound Level – this will display the Z-weighted spectrum LZF together with the A- and C-weighted broadband levels – see Fig.14.8. When displaying LZF you can tap the LZF selector and select Display Reverberation Time to display the reverberation time spectra. When starting a measurement the graph will automatically display the sound level spectrum, when finished it will display the reverberation time spectrum. 158 Hand-held Analyzer Types 2250 and 2270 – User Manual Fig.14.8 Spectrum view when measuring The Main Spectrum graph on the display (the one with bars) is selected using the parameter selector on the second line of the two shown above the graph (LZF in Fig.14.8). The smileys below the spectra (if there are any) belong to the Main Spectrum. The parameter selector for the Main Spectrum is linked to the selector on the Overview tab and the parameter selector for the main decay on the Decay tab. The reference spectrum on the display (the one displayed as small lines above the bars in Fig.14.7) is selected using the parameter selector on the first line of the two shown above the graph (T30 in Fig.14.7). The parameter selector for the reference spectrum is linked to the parameter selector for the reference decay curve in the Decay view. The cursor is linked to the Frequency selectors on the Overview and Decay tabs. Tap the Y-axis to select: • Auto Zoom to adjust the range of the Y-axis for best fit of the measured spectrum • Zoom In/Zoom Out to adjust the zoom • Spectrum Table to display the spectrum in a table, see an example in Fig.14.9 CHAPTER 14 Reverberation Time Software (Optional Module) 159 Fig.14.9 Spectrum table Auxiliary Parameters Below the graphics are two lines containing parameters for displaying the wide band reverberation times for the current position, or the room average. You are also able to display the LCF and LAF broadband values. 14.3.3 Decay The Decay tab shows the reverberation time decay from a position or the room average – or both (Fig.14.10). Status Field The Status Field on the Decay tab is the same as on the Overview and Spectrum tabs. Decay Graph The Decay graph shows the decay of one frequency band for the selected position and/or the decay of the same frequency band for the room average (requires Ensemble Averaging). The Decay Parameter selectors above the graph select which decay to display: T20@Pos, T30@Pos or EDT@Pos. Each of these selections show the decay for the measurement at the selected position together with the readout of T20@Pos, T30@Pos and EDT@Pos resp. T20, T30 and EDT show the decay for the Room Average together with the readout of T20, T30 and EDT resp. If you only want one graph you can set the other selector to Off. 160 Hand-held Analyzer Types 2250 and 2270 – User Manual Fig.14.10 Decay view The main decay on the display (displayed as a continuous line) is selected using the parameter selector in the second line of the two shown above the display (T30@Pos in Fig.14.10). The parameter selector for the main decay is linked to the selector on the Overview tab and the parameter selector for the main spectrum on the Spectrum tab. The reference decay on the display (displayed as a dashed line) is selected using the parameter selector in the first line of the two shown above the display (T20@Pos in Fig.14.10). The parameter selector for the reference decay is linked to the parameter selector for the reference spectrum on the Spectrum tab. The Frequency selector (with decrement and increment buttons as well), determines the frequency of the decay curves. The Frequency selector is linked to the spectrum cursor and the Frequency selector on the Overview tab. In the upper right corner of the View Area, the value of a single quality indicator is displayed: • C: xx%. The Curvature indicator – if above 10%, then the quality indicator ‘%’, meaning ‘Decay is bent’, is set For more details of the quality indicators, see section 14.5. Tap the Y-axis to select: • Auto Zoom to adjust the range of the Y-axis for best fit of the measured spectrum • Zoom In/Zoom Out to adjust the zoom • Auto Scale to select the best scaling for viewing the spectra – without adjusting the zoom • Scale Up/Scale Down to adjust the full scale value on the Y-axis • Show/Hide Regression Line to show/hide the regression line and the evaluation range for the main decay, together with the two quality indicators C and CHAPTER 14 Reverberation Time Software (Optional Module) 14.4 161 Measurements with Graphical Position Management The analyzer can keep track of the source and receiver positions in a graphical way together with the measurements. To do this, make the following settings on the Setup screen: 1) Set Map Based Measurement = Yes in the Measurement Control setup – the reverberation decays will then be placed graphically on the ‘map’ shown on the Overview tab, and numbered as source-receiver relations (for example, S1R2 means the decay measurement with noise from Source 1 and measured at Receiver position 2). 2) Set Meas. All Pos. for Each Source = Yes for measuring all combinations of source and receiver positions. Set to No, if you want to measure at a specific number of receiver positions per source. 3) Set No. of Positions per Source to the number of receiver positions you want to measure per source. 4) Set Increment to Sources First, Receivers First or Manual. Typically Sources First is best for Impulsive excitation (you can then walk between the source positions and generate the impulses while the analyzer is placed on a tripod at one receiver position); Receivers First is best for Interrupted Noise excitation (you can move the analyzer between the receiver positions, while the sound source remains in the same place). The Overview tab will then look like Fig.14.11: Fig.14.11 Overview tab showing one source and one receiver position Note the Add Source and Add Receiver icons on the headline for the map. Tap add new sources, and tap to add new receivers on the map. to 162 Hand-held Analyzer Types 2250 and 2270 – User Manual Fig.14.12 Overview tab showing two sources and three receiver positions You can move the sources or receivers on the map by tapping on the source/receiver (see Fig.14.13), select Move from the drop-down menu that appears, then tap at the position where you want the source/receiver (see Fig.14.14). Fig.14.13 Tap a source to get a drop-down with options CHAPTER 14 Reverberation Time Software (Optional Module) 163 Fig.14.14 Sources and receivers moved to places on the map in accordance with their physical position in a room The dark-green fields on the map indicate the selected Source-Receiver relation. The next measurement will be saved at this position. Results from the measurements at the receiver positions are displayed in the boxes at the receiver positions – determined by the parameter and frequency selector in the headline of the map. Fig.14.15 Example display showing a measurement in progress The example in Fig.14.15 shows the state when four measurements have been made and saved and the position at S1R3 is selected, ready for the next measurement. Note the small smileys at some of the receiver positions – you can tap them and get more detailed information. You can attach text or commentaries at source or receiver positions by selecting View Annotations (Fig.14.13) and add new annotations as described in Chapter 6. Note the two small paperclips at S1 and R2 – they indicate annotations at these positions. 164 Hand-held Analyzer Types 2250 and 2270 – User Manual Tap Map just above the Add Source and Add Receiver icons, and select Table to display the measurements in a table (see Fig.14.16). The table contains the same information as the table described in the previous section when measuring without position management (Fig.14.6). Fig.14.16 Map-based measurements displayed in a table Note: You can move the data from one position to another: Tap a position you want to move and select Cut from the drop-down, then tap the position where you want to paste it and select Paste. This can be done on the map as well as in the table. If you want to measure at a specific number of receiver positions per source, then the map for one receiver position per source, for example, will look like Fig.14.17. Fig.14.17 Map-based measurement showing one receiver per source Note: There is only an Add Source icon automatically when adding a source. because the specified number of receivers is added CHAPTER 14 Reverberation Time Software (Optional Module) 165 The Spectrum and Decay views function in the same way as when measuring without position managing. The only difference is the indication of the position in the Status Field – this is now a Source-Receiver selector instead of a Position Number selector. 14.5 Quality Indicators There are quality indicators for each frequency band in each reverberation time spectrum for each reverberation time spectrum. These include letters, symbols or smileys, see Table 14.1 for an overview. One of the quality indicators are recommended in ISO 3382-2 Annex B, as a measure of how good the slope of the decay can be approximated to a straight line: • C: xx%. The Curvature indicator – if above 10%, then the quality indicator ‘%’, meaning ‘Decay is bent’, is set Table 14.1 Overview of Quality Indicators and Smileys Quality Indicator Smiley Explanation Description No decay end found The end of the decay cannot be determined because it doesn’t end in the background noise Background noise too high Background noise is above the upper evaluation point No decay start found No decay start found Background noise too high Background noise is above the lower evaluation point Max. Decay Time too short The lower evaluation point is beyond the decay time No decay found The slope of the decay is positive, that is, the reverberation time is negative P Reverberation time too short Less than 2 points in Evaluation Range O Excitation sound level too high Overload Reverberation time too short BT below 16 (B = filter bandwidth and T = reverberation time of detector) – required by ISO 3382 T20 used (T30 unavailable) T20 used (T30 unavailable) High background noise Background noise too close to level at lower evaluation point Short reverberation time Less than 4 points in Evaluation Range Decay is bent The difference between T20 and T30 is greater than 10%. (Recommended quality indicator from ISO 3382-2 Annex B) Decay is non-linear Correlation coefficient in linear regression is too low N y t Y T Z F R n p % k Hand-held Analyzer Types 2250 and 2270 – User Manual 166 The quality indicators (first column) are shown in the spectrum table only. The smileys are shown on: • all readouts of reverberation time results • on the Position selector as the ‘sum’ of all quality indicators from each frequency band • on the Room (project) as the ‘sum’ of all quality indicators from each frequency band in the Room reverberation time spectrum The explanation is shown if you tap a smiley (except on the small smileys below the frequency bands in the spectrum – select the frequency band with the cursor and tap the smiley in the cursor readout). 14.6 Saving and Recalling Results Measurements are saved at position numbers (for example, Pos. 1) or Source-Receiver relations (for example, S1R1) within the project. This means there are more measurements stored in the Reverberation Time projects than the Sound Level Meter, Frequency Analyzer or Logging projects, which all contain only one measurement within each project. The saved project can be opened using Open in Explorer, then you can view all the measured data, and even continue measuring at new positions. 167 Chapter 15 Tone Assessment Option BZ-7231 – 1/3-octave Method 15.1 General Tone Assessment Option BZ-7231 includes tone assessment according to selected methods. The software module includes an ‘FFT based’ as well as a ‘1/3-octave based’ method. It allows assessment of tones on-site. The result of the tone assessment is the adjustment to be added to the LAeq as described in the relevant standards for calculating rating level. BZ-7231, when used with Frequency Analysis Software BZ-7223, Logging Software BZ-7224, and Enhanced Logging Software BZ-7225, allows you to: • Assess tones in a measured 1/3-octave spectrum according to ISO 1996:2007, Annex D • Assess tones in a measured 1/3-octave spectrum according to Italian Law, “Ministero dell’ambiente, Decreto 16 marzo 1998”, hereafter referred to as “Italian Law” BZ-7231, when used with FFT Analysis Software BZ-7230, allows you to: • Assess tones in a measured FFT spectrum according to ISO 1996:2007, Annex C • Use the “Generate tone at cursor” feature to generate a pure tone on the headphone output of the Hand-held Analyzer, for comparison to the actual noise This section will focus on tone assessment based on the 1/3-octave method. Please refer to User Manual BE 1778: “FFT Analysis Software BZ-7230 and Tone Assessment Option BZ-7231, for use with Hand-held Analyzers Types 2270 and 2250” for detailed information about tone assessment based on FFT spectra. Tone Assessment Option BZ-7231 brings results to the user on-site as well as preparing for post-processing and reporting back at the office. Documentation can be completed using Measurement Partner Suite BZ-5503, or the measured data can be exported for post-processing by Evaluator Type 7820 or other post-processing software such as Microsoft® Excel®. Check the About screen to see whether you have a license to run the Tone Assessment option. (To access the About screen, tap the Help icon then tap About.) Hand-held Analyzer Types 2250 and 2270 – User Manual 168 If you have purchased Type 2250/2270 together with the software application(s), then the relevant license(s) comes pre-installed on the analyzer. If you purchased a separate software application for your Type 2250/2270, then you have to install the license on the analyzer. This is done using BZ-5503, please consult the on-line help included with the BZ-5503 software for instructions on how to install a license. 15.2 Tone Assessment According to ISO 1996-2, Annex D When assessing noise, it is generally recognised that noise containing audible pure tones is more annoying than noise with the same A-weighted broadband level that does not contain audible tones. When assessing noise that contains tones or narrow bands of noise, an adjustment shall be added to the A-weighted time averaged level, LAeq. The first evaluation of audible tones in noise is most often carried out by the human ear. But for comparative analysis results, and documentation, an objective analysis may be needed. Tone Assessment can be performed using the ISO 1996-2:2007 standard “Determination of environmental noise levels”, Annex D: “Objective method for assessing the audibility of tones in noise – Simplified method”. This method uses 1/3-octave measurements. The selection of method depends on local legislation which may refer to ISO 1996-2 or a local method. Find more information about rating level and assessment of environmental noise in ISO 1996-2 and in Brüel & Kjær’s Environmental Booklet. 15.2.1 ISO 1996-2, Annex D – Tone Assessment Calculations The ISO method searches a measured, time averaged (Leq) spectrum, for level differences between adjacent 1/3-octave bands. If the level difference between a 1/3-octave band and the band either side of it are higher than a certain limit, an adjustment for audible tones may be added to the LAeq level when calculating the rating level, Lr. In ISO 1996-2, Annex D, the spectrum is divided into three frequency ranges: Low, Middle and High. In each frequency range a specific limit for the level differences leading to an adjustment is defined (Fig.15.1). CHAPTER 15 Tone Assessment Option BZ-7231 – 1/3-octave Method 169 Fig.15.1 Definition of frequency ranges and level differences dB 16 Low 14 12 Level differences can be defined in Low, Middle and High frequency range: 10 Proposed level difference limits 8 for adjacent bands [dB] 6 Middle High 4 2 0 25 Hz 125 160 400 500 10 kHz 1/3 - octave bands [Hz] 080160 The proposed frequency ranges and level differences between adjacent bands are: • Low frequency range: includes the 1/3-octave bands from 25 Hz to 125 Hz with a level difference for a detected tone greater than 15 dB • Middle frequency range: includes the 1/3-octave bands from 160 Hz to 400 Hz with a level difference for a detected tone greater than 8 dB • High frequency range: includes the 1/3-octave bands from 500 Hz to 10 kHz with a level difference for a detected tone greater than 5 dB With BZ-7231 software, frequency ranges and the limit for the level differences in low, middle and high range can be set by the user. Tone assessment is carried out for all the measured frequency bands (including those below 25 Hz and above 10 kHz). The level difference limit is extrapolated from the low and high range to cover the complete measurement range. If tones are detected outside the range from 25 Hz to 10 kHz the quality indicator (yellow smiley) indicates “Tone out of ISO range detected”. ISO 1996-2, Annex D does not specify the size of the adjustment. In the default setting of the BZ-7231, Brüel & Kjær has chosen to set the value to 5 dB. Calculating the Level Difference Between One Band and the Adjacent Bands BZ-7231 software calculates the level difference between a 1/3-octave band and two adjacent 1/3-octave bands with lower levels. The difference is calculated between the band in the middle and the highest of the adjacent bands. Hand-held Analyzer Types 2250 and 2270 – User Manual 170 15.3 Tone Assessment According to Italian Law Tone Assessment in Italy is performed on normal 1/3-octave spectra but with an option to use narrow bands (such as FFT), in case of doubt. The method described in the Italian “Decreto 16 marzo 1998” states that the 1/3-octave LZFmin spectrum is used for evaluation of tones in noise. The analysis must be performed in the frequency range from 20 Hz to 20 kHz and a tone is present if the level of a band is more than 5 dB higher than the levels in the adjacent bands. The adjustment Kt, which should be added to the measured LAeq, will only be applied if the band with the tone touches or exceeds a loudness level contour touched by another frequency value of the spectrum. (Examples of loudness level contours from Evaluator Type 7820 are shown in Fig.15.2.) The size of the adjustment Kt is defined as 3 dB. Fig.15.2 Example display from Evaluator Type 7820 showing an LLFmin spectrum and loudness level contours An equal loudness curve is a frequency response curve. Equal loudness curves are the experimental results of presenting pure tones and levels at different frequencies to young people with no hearing impairment. Along a contour line the young, average, normal listener will judge tones presented with different combinations of frequency and dB to be equally loud. Equal loudness level curves are defined by ISO 226 “Acoustics – Normal equal-loudness-level contours”. The Italian “Decreto 16 marzo 1998” refers to ISO 226 (1987), but the ISO 226 standard has been thoroughly revised in the latest version from 2003. Your analyzer, with BZ-7231 software installed, uses by default the free-field curves from the 1987 version. But the diffuse-field contours from the ISO 226 (1987), as well as the free-field curves from ISO 226(2003) have been implemented and may be selected. CHAPTER 15 Tone Assessment Option BZ-7231 – 1/3-octave Method 15.4 Setting up the Analyzer 15.4.1 Selecting the Tone Assessment Option 171 Tap the Main Menu icon and select Setup from the list of options. Under the Tone Assessment parameters (on the full list of options) tap the Tone Assessment option and set it to On (Fig.15.3). Fig.15.3 Setting Tone Assessment option on From the Setup screen, select either the ISO 1996:2-2007 or the Italian Law DM 16-03-1998 method: Fig.15.4 Setting the Tone Assessment method Hand-held Analyzer Types 2250 and 2270 – User Manual 172 If you select the tone assessment method according to the ISO 1996-2, Annex D standard, you can accept the default setup according to that standard. You can then change the various tone parameters according to your needs (apart from the ISO 226 parameter which is greyed-out) and proceed directly to the measurement. If you select the tone assessment method according to Italian Law (that is, you select DM 16-03-1998), then you have accepted the default setup for that standard, and the only parameter you can change is the ISO 226 parameter. Select one of the diffuse- or free-field contour options available from the parameter drop-down (which appears when you tap the parameter). For more details and for information on how to set up individual tone assessment parameters, see the following section. 15.4.2 Setting up a Measurement Manually ISO 1996–2, Annex D When tone assessment according to ISO 1996-2, Annex D is selected, you can set the division between the Low and Middle frequency range, the division between the Middle and High frequency range, and also the limits for the level differences between adjacent bands – see Fig.15.5. (You can also refer to Fig.15.1 for a definition of the frequency ranges and level differences.) Fig.15.5 Left: Setting the ‘Low Freq. Last Band’ parameter Right: Setting the ‘Level Difference Low’ parameter You set the division between the Low/Middle frequency range by selecting the required value for the Last (or highest) Band in the Low frequency range (from 12.5 Hz to 315 Hz), and set the division between the Middle/High frequency range by selecting the required value for the Last (or highest) Band in the Middle frequency range (from 160 Hz to 20 kHz). The ISO method does not state which frequency weighting should be used, so in the default setup, A-weighing is selected. However, this is not described in the ISO method, so no warnings will be generated if you select other frequency weightings. CHAPTER 15 Tone Assessment Option BZ-7231 – 1/3-octave Method 173 Italian Law When tone assessment according to Italian Law is selected, the analyzed spectrum must be the Z-weighted minimum level measured in each 1/3-octave band, LZFmin. The LZFmin parameter is automatically selected on the measurement page when you select DM 16-03-1998. The test for loudness contours is set by default to the 1987 Free-field option of the ISO 226 contour parameters. You can also select the 1987 Diffuse-field and 2003 Free-field options from the ISO 226 contour parameters, if required. See Fig.15.6. Fig.15.6 Setting the loudness contour options 15.4.3 Setting up the Measurement using the Default Setup Select the Tone parameter above the spectrum and start the measurement by pressing the Start/Pause pushbutton . If the selected setup parameters do not comply with the selected tone assessment method, the following pop-up window will be displayed: Fig.15.7 Pop-up window for tone measurement setup check Hand-held Analyzer Types 2250 and 2270 – User Manual 174 The pop-up window can be de-activated for the rest of the measurement session. To activate it again, you will have to reload the template or restart your analyzer. This automatic check is deactivated when the Tone Assessment parameter is set to Off in the Setup screen. To reset all the relevant parameters to the default setup, tap the OK button. (The default setup includes preset parameters that comply with the selected standard. These are described in Table 15.1.) To measure with the settings you set up manually, tap the Cancel button. Table 15.1 Default parameters used by the automatic measurement setup check Setup Parameter Default Value Selected standard: ISO 1996-2, Annex D Adjustment 3 dB Last band in low frequency range 125 Hz Last band in middle frequency range 400 Hz Level difference low 15 dB Level difference middle 8 dB Level difference high 5 dB Selected standard: Italian Law (DM 16-03-1998) ISO 226 1987 Free-field Note 1: Even if you have set the Tone Assessment parameter to On (Setup screen), the calculation is not carried out until the Tone parameter is selected above the spectrum. Note 2: You may find the Template Explorer (accessed from the Main Menu save your own measurement setup. 15.4.4 ) useful to Signal Recording If a valid license for the Signal Recording Option BZ-7226 is present, it is possible to record the sound while measuring. (Refer to Chapter 13 for information about the Signal Recording Option.) Note: When analyzer recordings are to be used for re-analysis on a PC, be sure to select Automatic Gain Control parameter to Off, under the Signal Recording parameters, and select the Recording Quality parameter to High. CHAPTER 15 Tone Assessment Option BZ-7231 – 1/3-octave Method 15.5 Measuring 15.5.1 Result Display 175 Tone assessment is not performed until the Tone parameter is selected above the spectrum. (This is done by tapping one of the parameter fields in the two lines above the Spectrum display and choosing Tone from the drop-down menu.) Once selected, tone assessment is carried out on the selected spectrum. The results are updated during the measurement. Fig.15.8 Selecting the Tone parameter above the spectrum display On the Results display, a blue marker is set at the top of each detected band with a tone. Differences to the left and right of the frequency band selected by the main cursor are shown (on the left and right) in the tone parameter panel above the spectrum (Fig.15.9). The main cursor is moved using either the hard keys or the stylus. Fig.15.9 The differences to the left and right of the selected frequency band are shown in the tone parameter panel – in this example, there is a 11.4 dB difference to the left and a 3.9 dB difference to the right Hand-held Analyzer Types 2250 and 2270 – User Manual 176 The information shown in the value panel can be changed by tapping in the field. From the tone parameters, the adjustment and the selected tone standard can be selected. See Fig.15.10. Results from the tone assessment can also be found by tapping on the Broadband tab and browsing the Broadband view in a similar way. Fig.15.10 Changing the information shown in the value panel 15.6 Logging Software BZ-7224 Template The results from the tone assessment can be found in the Spectrum view of the Logging template. Tone assessment is performed for each logging period, as well as for the total measurement time (Fig.15.11). Fig.15.11 Viewing results on the logging template Please find more information about setting up a Logging measurement in Chapter 11. CHAPTER 15 Tone Assessment Option BZ-7231 – 1/3-octave Method 15.7 177 Enhanced Logging Software BZ-7225 Template The tone parameter can be shown, for both the logging and the report periods, in the Spectrum view of the Enhanced Logging template (Fig.15.12). Fig.15.12 Viewing results on the enhanced logging template Please find more information about setting up the Enhanced Logging in Chapter 12. 15.8 Status Codes (Smileys) When Tone is selected on the tone parameter panel, the list of status codes is updated. Tap a smiley to get an explanation of the status code, and for a tip on how to remedy or improve the settings on the analyzer, see an example in Fig. 15.13. Fig.15.13 Example of a status code explanation Hand-held Analyzer Types 2250 and 2270 – User Manual 178 If you have selected 1/1-octave, an Accelerometer as transducer, or a Direct input, tone assessment will be performed, but a smiley will be displayed. When you tap the smiley it will advise you to use a Microphone. For an overview of all the remedies associated to the various smileys, please refer to Table 15.2 Table 15.2 Overview of smileys and associated remedies Smiley Colour Explanation Remedy – Tip for Solution Red No tone assessment on 1/1 octaves There is no method for assessing tones when the spectrum is analysed in 1/1-octave bands, select 1/3-octave instead Red Analysis on ‘Accelerometer’ The analysis is carried out on an accelerometer input, select a microphone Red Spectrum must be LZFmin When Italian Law is selected the analysed spectrum must be LZFmin Red No tone assessment on inst. parameters It is not possible to make tone assessments on instantaneous parameters (‘Fast’ or ‘Slow’) Yellow Analysis on ‘Direct’ The analysis is carried out on a ‘Direct’ input, select a microphone Yellow Setup different from ISO standard The ISO is selected and the measurement setup deviates from the proposals in the ISO standard Yellow Min or Max spectrum When the ISO standard is selected the analyzed spectrum should be Leq Yellow Tone freq outside proposed ISO range In the ISO standard the defined frequency range for tone assessment is from 25 Hz to 10 kHz. A tone is detected outside this frequency range Yellow Tone freq out of proposed DM range In the standard according to Italian Law the tone assessment must be performed in the range from 20 Hz to 20 kHz. A tone is detected outside this frequency range Note: The ISO method does not specify the weighting filter to be used. The A-weighting filter is selected by default, but all selectable broadband filters may be applied without warnings. 15.9 Recalling Saved Measurements Saved measurements using the Frequency Analyzer, Logging and Enhanced Logging templates can be opened and the Tone Assessment can be applied. Please refer to section 3.4 and section 6.3 for information on how to save and recall measurements, respectively. 179 Chapter 16 2-channel Option BZ-7229 16.1 General 2-channel Option BZ-7229 enables 2-channel measurements with Hand-held Analyzer Type 2270. This option adds an extra channel of measurement data. The two channels can have inputs from the same type of transducer (e.g., two microphones) or different transducers (e.g., one microphone and one accelerometer) 2-channel Option works with the following applications: • Sound Level Meter BZ-7222 • Frequency Analysis BZ-7223 • Logging BZ-7224 • Enhanced Logging BZ-7225 • Building Acoustics Software BZ-7228 And with the options: • Signal Recording Option BZ-7226 • Low Frequency Option BZ-7234 Note 1: 2-channel Enhanced Logging is not available for hardware versions 1 – 3. Please refer to Building Acoustics Software BZ-7228 User Manual BE-1799 for a description of the Dual-channel Building Acoustics Software Note 2: To check whether you have the license to run the relevant this software tap shortcut bar and select About. on the Note 3: If you have purchased your analyzer together with the software application(s), then the relevant license(s) comes pre-installed on the analyzer. Note 4: If you purchased a separate software application for your analyzer, you have to install the license on the analyzer. This is done using BZ-5503, please consult the online help included with the BZ-5503 software for instructions on how to install a license. Hand-held Analyzer Types 2250 and 2270 – User Manual 180 16.2 Connecting Transducers Please refer to section 2.5 for connecting two transducers to the instrument and to Chapter 5 for creating the transducers in the transducer database and for calibrating. Tap Main Menu and select Setup > Input you will see two columns for the individual settings of the two channels. See Fig.16.1 for how to setup the two transducers. In Setup you may also set up individual transducer correction filters like the windscreen correction. Fig.16.1 Set up the transducers To choose labels other than Ch.1 and Ch.2 (e.g., In for Ch.1 and Out for Ch.2), tap the Label parameter and enter the new label. 16.3 Range Setting Note: Pressing before a measurement institutes Auto Range, which automatically selects High Range or Low Range, as appropriate. Type 2270 hardware can be utilised in two ways: 1) As a single-channel, single-range sound level meter and frequency analyzer like Type 2250: – Only one channel can be measured at a time – The input is selectable between the two physical channels in the user interface – The full level measuring range is covered in a single range without a level range control CHAPTER 16 2-channel Option BZ-7229 181 2) As a dual-channel, multi-range sound level meter and frequency analyzer – Both channels can be measured simultaneously – The full level measuring range is covered in two ranges with a level range control. Theses ranges are called: a) High Range for the least sensitive range with 0 dB gain, which allows the highest possible input b) Low Range for the most sensitive range with 30 dB gain To set the range settings for 2-channel measurements, tap Main Menu Setup > Input > Range and select the appropriate range (Fig.16.2). and select Fig.16.2 Range setting 16.3.1 Underrange/Overload In case of an Underrange indication in line 2 of the status panel (High Range only), change to Low Range. In case of Overload indication (typically Low Range), change to High Range. (Or use Autorange, which takes a few seconds.) The latched overload is indicated per channel using icons: For Ch.1 , for Ch.2: and for both channels: . 16.4 Setting Up 2-channel Sound Level Meter 1) Select the 2-Ch. Sound Level Meter project template. The project template is displayed at the top of the screen, if it does not display the correct template tap the Project Template Bar at the top of the screen and select the correct template from the drop-down menu. (See section 3.3.1 for more details on templates.) 2) Tap the Main Menu icon . Hand-held Analyzer Types 2250 and 2270 – User Manual 182 3) Select (Fig.16.3) – Setup > Frequency Settings to set Broadband frequency weighting parameters, as required – Setup > Statistics to set statistics parameters, as required 4) Tap to exit Setup. Fig.16.3 Setting the frequency and statistics parameters 16.4.1 Controlling the Measurement The measurement is controlled in the same way you would control a normal Sound Level Meter measurement, using Start/Pause , Continue , Back-erase and Reset pushbuttons, see Chapter 3 for more details. The two channels are controlled and measured simultaneously, thus some of the housekeeping parameters are common for the two channels, e.g., Start Time and Elapsed Time. 16.4.2 Displaying the Results The results are displayed as bar graphs and measurement parameters can be displayed in the Broadband or XL View (Extra Large) by selecting the appropriate tab (Fig.16.4). CHAPTER 16 2-channel Option BZ-7229 183 Fig.16.4 Displaying the results 16.4.3 Saving Results Measurements are saved and can be opened later in the same way as described for the Sound Level Meter project in Chapter 3. 16.5 Setting Up 2-channel Frequency Analyzer 1) Select the 2-Ch. Frequency Analyzer project template. The project template is displayed at the top of the screen, if it does not display the correct template tap the Project Template Bar at the top of the screen and select the correct template from the drop-down menu. (See section 3.3.1 for more details on templates.) 2) Tap the Main Menu icon . 3) Select (Fig.16.5) – Setup > Frequency Settings to set Broadband frequency weighting parameters, as required – Setup > Statistics to set statistics parameters, as required The settings for Spectrum Weighting and base for Spectrum Statistics are available in this template. 4) Tap to exit Setup. Hand-held Analyzer Types 2250 and 2270 – User Manual 184 Fig.16.5 Setting the frequency and statistics parameters 16.5.1 Controlling the Measurement The measurement is controlled in the same way you would control a normal Sound Level Meter measurement, using Start/Pause , Continue , Back-erase and Reset pushbuttons, see Chapter 3 for more details. The two channels are controlled and measured simultaneously, thus some of the housekeeping parameters are common for the two channels, e.g., Start Time and Elapsed Time. 16.5.2 Displaying the Results The results are displayed as bar graphs and measurement parameters on the Measurement screen in three views: Spectrum, Broadband or XL View (Extra Large), by selecting the appropriate tab (Fig.16.6). Fig.16.6 Displaying the results (Spectrum, Broadband and XL) CHAPTER 16 2-channel Option BZ-7229 185 When the same type of transducers are used by both channels (e.g., two microphones or two accelerometers) or if you only display data from one channel, then the spectrum display is the standard spectrum display (Fig.16.7). Fig.16.7 Single-channel spectrum When the transducers at the two channels are of different types (e.g., a microphone and an accelerometer), the scaling of the two spectra can be set individually for easy comparison. Ch.1 will use the standard Y-axis at the left of the spectrum and Ch.2 will have its own Y-axis to the right of the spectrum (instead of the broadband values). Tapping on the Ch.2 Y-axis reveals the same possibilities for zooming and scaling the spectrum as for Ch.1. See examples in Fig.16.8. Fig.16.8 Displaying the results with different scaling for each channel 16.5.3 Saving Results Measurements are saved and can be opened later in the same way as described for the Sound Level Meter project in Chapter 3. Hand-held Analyzer Types 2250 and 2270 – User Manual 186 16.6 Setting Up 2-channel Logging and Enhanced Logging 1) Select: – The 2-Ch. Logging SLM project template for logging broadband data only from the two inputs – The 2-Ch. Logging project template for logging both spectra and broadband data from the two inputs – The 2-Ch. Enh. Logging project template for logging both spectra and broadband data from the two inputs, making reports and periodically saving the data on the memory card. Note: 2-Ch. Enh. Logging is not available for hardware versions 1–3. The project template is displayed at the top of the screen, if it does not display the correct template tap the Project Template Bar at the top of the screen and select the correct template from the drop-down menu. (See section 3.3.1 for more details on templates.) 2) Tap the Main Menu icon . 3) Select – Setup > Frequency Settings to set Broadband frequency weighting parameters, as required – Setup > Statistics to set statistics parameters, as required 4) Set the parameters you want to log every 100 ms in Logged Broadband (100 ms). You can specify up to 4 parameters from the two channels. 5) Set the broadband parameters you want to log in Logging Broadband. You can either log all parameters from both channels or select up to 10 parameters from the two channels. The fewer parameters you select the less space will be needed for saving on the memory card. 6) Set the spectrum parameters you want to log in Logged Spectrum. You can either log all spectrum parameters from both channels or select up to four spectrum parameters from the two channels. 7) Set the Level Trigger parameter(s) as required. You can level trigger on a parameter from either Ch.1 or Ch.2. 8) Tap to exit Setup. Note: You should select the transducers before selecting the parameters to log and selecting the level trigger parameter(s). Changing the transducer afterwards might correct the selected parameter; e.g., if you have selected to log Ch.1 LAeq and change the transducer at channel 1 from a microphone to an accelerometer, then the Ch.1 LAeq will not be available anymore and the parameter will be set to Off. CHAPTER 16 2-channel Option BZ-7229 16.6.1 187 Controlling the Measurement The measurement is controlled in the same way you would control a single-channel Logging or Enh. Logging measurement. See Chapter 11 and Chapter 12 for more details. The two channels are controlled and measured simultaneously, thus some of the housekeeping parameters are common for the two channels, e.g., Start Time and Elapsed Time. 16.6.2 Displaying the Results The results are displayed as bar graphs and measurement parameters on the Measurement screen in three views: Profile, Spectrum or Broadband, by selecting the appropriate tab. See Chapter 11 for more details on Logging displays and Chapter 12 for more details on controlling Enhanced Logging displays. 16.6.3 Saving Results Measurements are saved and can be opened later in the same way as described for Logging in Chapter 11 and Enhanced Logging in Chapter 12. 16.7 Setting Up 2-channel Signal Recording Signal Recording in the 2-Ch. templates is set up in the same way as in the single channel templates (Chapter 13), with the following additions and changes: 1) The Recording Channel parameter can be set to Ch.1, Ch.2 or Both. Choose Both to record both channels simultaneously. 2) The Recorded Signal parameter is set to Input Z-weighted and cannot be changed. The Recorded Signal parameter is not displayed in the setup. 3) If Automatic Gain Control set to Off, the Peak Recording Level is automatically set to highest possible setting, e.g., 145 dB for Range Setting = High Range and 115 dB for Range Setting = Low Range when using Type 4189 microphones. The Peak recording Level parameter is not displayed in the setup. 2-channel recordings are played back in the headphones as a stereo signal. Use Measurement Partner Suite BZ-5503 to play back the 2-channel recordings either as a stereo signal or as two mono signals, one for Ch.1 and one for Ch.2. 188 Hand-held Analyzer Types 2250 and 2270 – User Manual 189 Chapter 17 Low Frequency Option BZ-7234 Low Frequency Option BZ-7234 enables • G-weighting parameters in accordance with the standards ISO 7196:1995 and ANSI S1.42–2001 (R2011) using Brüel & Kjær Low Frequency microphones • Measurements of Building Vibration parameters using Brüel and Kjær Low Level accelerometer in accordance with the standards ISO 8041:2005 and DIN 45669-1:2010–09 • 1/3-octave frequency analysis down to 0.8 Hz (1/1-octave down to 1 Hz) This option can be used together with the following modules: • Sound Level Meter Software BZ-7222 • Frequency Analyzer Software BZ-7223 • Logging Software BZ-7224 • Enhanced Logging Software BZ-7225 Note 1: Check the About screen to see whether you have a license to run the Low Frequency Option. (To access the About screen, tap the Help icon then tap About.) Note 2: If you have purchased your analyzer together with the software application(s), then the relevant license(s) comes pre-installed on the analyzer. Note 3: If you purchased a separate software application for your analyzer, then you have to install the license on the analyzer. This is done using BZ-5503, please consult the online help included with the BZ-5503 software for instructions on how to install a license. 17.1 Sound Measurements and G-weighting This section describes how to measure G-weighting parameters. See the G-weighted frequency response in Fig.17.1. Hand-held Analyzer Types 2250 and 2270 – User Manual 190 Fig.17.1 G-weighted frequency response 20.00 10.00 0.00 Gain [dB] –10.00 –20.00 –30.00 –40.00 –50.00 –60.00 –70.00 –80.00 0.1000 1.0000 10.0000 Frequency [Hz] 100.0000 10000.0000 130809 Low Frequency Option BZ-7234, together with BZ-7222, BZ-7223, BZ-7224 or BZ-7225 and a low-frequency microphone, Type 4193 or Type 4964 (possibly with Low Frequency Adaptor UC-0211, refer to Table C.5, Note for Type 4193 and Type 4964) measures the following timed broadband parameters in addition to the standard measured parameters: • LGeq – G-weighted equivalent continuous noise level • LG10max – maximum time-weighted sound level measured with G-weighting and 10 s exponential time constant • LG10min – minimum time-weighted sound level measured with G-weighting and 10 s exponential time constant • LGpeak – maximum peak sound level with G-weighting • TGpeak – time when the G-weighted peak sound level occurred The following instantaneous values are also available: 17.2 • LG10 – instantaneous time-weighted sound level with G-weighting and 10 s exponential time constant • LGpeak,1s – maximum peak sound level with G-weighting during the latest second Setting up the Analyzer for G-weighting 1) Mount your low-frequency microphone and low-frequency adaptor (if used) on the preamplifier and connect it to the top socket (see section 2.5.2). If it is your first time to use the microphone, it needs to be created in the transducer database (see section 5.8) and calibrated (see section 5.3). CHAPTER 17 Low Frequency Option BZ-7234 191 2) Select the Sound Level Meter, Frequency Analyzer, Logging, Logging SLM, Enh. Logging or Enh. Logging SLM project template. The project template is displayed at the top of the screen, if it does not display the correct template tap the Project Template Bar at the top of the screen and select the correct template from the drop-down menu. (See section 3.3.1 for more details on templates.) 3) Tap the Main Menu icon and select Setup. 4) Select Input > Transducer and select appropriate microphone. 5) Select Frequency Settings > Low Frequency Option and select On. This will enable extra options for the Low Frequency parameter (Frequency Analyzer module only) and for the frequency weighting parameters (Fig.17.2). Fig.17.2 Example of additional parameters with the Low Frequency Option parameter set to On 6) Set Low Frequency to Extended. 7) Set: – Broadband (excl. Peak) to A,G (simultaneous measurement with the two frequency weightings A and G) – Broadband Peak to G if you need to measure the G-weighted peak 8) (Frequency Analyzer module only) Set Spectrum Weighting parameter to A, C, Z or G, as required. 9) Tap to exit Setup. Hand-held Analyzer Types 2250 and 2270 – User Manual 192 17.2.1 Controlling the Measurement The measurement is controlled in the same way you would control a normal Sound Level Meter measurement, using Start/Pause , Continue , Back-erase and Reset pushbuttons, see Chapter 3 for more details. Note 1: The low-frequency settings require much longer settling times of filters and detectors for correct results. The instrument automatically takes care of this and waits (after you press Start ) for the needed settling time for the individual detectors. Note 2: You cannot start a measurement with G-weighting without using one of the lowfrequency microphones. 17.2.2 Displaying the Results Tap on the broadband result readouts to select parameters from the Low Frequency or the Lpeak group to select the G-weighted results (Fig.17.3). Fig.17.3 Selection of Low Frequency broadbandreadout results Note: If you use the Frequency Analyzer module, you will also have the parameter LXeq(f1-f2), X=A/B/C/Z/G and F1= bottom freq. and F2=top freq. of the frequency bands in the spectrum. By using G-weighting of the spectrum you would, for example, be able to readout the parameter LGeq(5 Hz-20 Hz) in cases where that needs to be reported. CHAPTER 17 Low Frequency Option BZ-7234 17.3 193 Building Vibration Measurements This section describes how to measure Building Vibration parameters. Building Vibration parameters are measured using Wm or Wmb filters ( Fig.17.4 Wm filters 10.00 0.00 –10.00 Gain [dB] –20.00 –30.00 –40.00 –50.00 –60.00 –70.00 –80.00 0.0100 0.1000 1.0000 10.0000 Frequency [Hz] W mb-Weighting 100.0000 1000.0000 10000.0000 W m-Weighting 130806 Low Frequency Option BZ-7234, together with BZ-7222, BZ-7223, BZ-7224 or BZ-7225 and Accelerometer Type 8344 for low-level measurements, measures the following timed broadband parameters in addition to the standard measured parameters: • aW – time-averaged weighted* acceleration value • PeakW – maximum peak of the weighted* acceleration value • aWCrest – crest factor, given by PeakW/aW • MTVV – maximum of the aW,1s values • KBFmax – maximum of the KBF values • KBFTm – average of the values of KBFmaxi , where each KBFmaxi has been measured during 30 s The following instantaneous values are also available: • aW,1s – maximum time-weighted acceleration value during the latest second with weighting1) and 1 s exponential time constant • KBF – instantaneous time-averaged acceleration level with Wm weighting and with 125 ms exponential time constant Note: Wm weighting of the acceleration signal corresponds to using HKB weighting on the velocity signal, as defined in DIN 45669–1 *. Weightings can be either Wm (whole-body vibration in buildings, all directions) as defined in ISO 8041:2005 or Wmb, which is only the band-limiting part of the Wm filter. This is set by the Broadband (Excl. Peak) parameter. Hand-held Analyzer Types 2250 and 2270 – User Manual 194 17.4 Setting up the Analyzer for Building Vibration Measurements 1) Connect the accelerometer to the rear socket. Brüel & Kjær recommends Accelerometer Type 8344 for low-level building vibration measurements. If it is your first time to use the microphone, it needs to be created in the transducer database (see section 5.8) and calibrated (see section 5.3). 2) Select the Sound Level Meter, Frequency Analyzer, Logging, Logging SLM, Enh. Logging or Enh. Logging SLM project template. The project template is displayed at the top of the screen, if it does not display the correct template tap the Project Template Bar at the top of the screen and select the correct template from the drop-down menu. (See section 3.3.1 for more details on templates.) 3) Tap the Main Menu icon and select Setup. 4) Select Input > Transducer and select appropriate accelerometer. 5) Select Frequency Settings > Low Frequency Option and select On. This will enable extra options for the Low Frequency parameter (Frequency Analyzer module only) and for the frequency weighting parameters (Fig.17.5). Fig.17.5 Example of additional parameters with the Low Frequency Option parameter set to On 6) Set Low Frequency to Extended. 7) Set Broadband (excl. Peak) to Linear,Wm (simultaneous measurement with the two frequency weightings Linear and Wm). 8) Set Broadband Peak to Wm. 9) Set Spectrum Weighting parameter to Linear or Wm, as required. CHAPTER 17 Low Frequency Option BZ-7234 195 10) Select Units > Engineering Unit and select No (in dB) or Yes (in m/s2). Note: If you want readouts in g instead of m/s2, set the Vibration Unit to US/UK in Preferences > Regional Settings. 11) Tap 17.4.1 to exit Setup. Controlling the Measurement The measurement is controlled in the same way you would control a normal Sound Level Meter measurement, using Start/Pause , Continue , Back-erase and Reset pushbuttons, see Chapter 3 for more details. 17.4.2 Displaying the Results Tap on the broadband result readouts to select parameters from the Low Frequency group to select the building vibration results (Fig.17.6). Fig.17.6 Selection of Low Frequency building vibration results 17.5 Setting Up the Frequency Analyzer Module for Very Low Frequencies 1) For: – Sound measurements: Mount your low-frequency microphone and low-frequency adaptor on the preamplifier and connect it to the top socket (see section 2.5.2). If it is your first time to use the microphone, it needs to be created in the transducer database (see section 5.8) and calibrated (see section 5.3) – Vibration measurements: Connect the accelerometer to the rear socket. Brüel & Kjær recommends Accelerometer Type 8344 for low-level building vibration measurements. If it is your first time to use the microphone, it needs to be created in the transducer database (see section 5.8) and calibrated (see section 5.3) Hand-held Analyzer Types 2250 and 2270 – User Manual 196 2) Select the 2-Ch. Frequency Analyzer, Logging or Enh. Logging project template. The project template is displayed at the top of the screen, if it does not display the correct template tap the Project Template Bar at the top of the screen and select the correct template from the drop-down menu. (See section 3.3.1 for more details on templates.) 3) Tap the Main Menu icon and select Setup. 4) Select Input > Transducer and select appropriate microphone or accelerometer. 5) Select Frequency Settings > Low Frequency Option and select On. This will enable extra options for the Low Frequency parameter (Frequency Analyzer module only) and for the frequency weighting parameters (Fig.17.2). 6) Set Low Frequency to Very Low. Note: Setting the Low Frequency parameter to Very Low for sound measurements requires use of the low-frequency microphones, possibly together with Low Frequency Adaptor UC-0211. These combinations ensure that the measurements fulfil the 1/1-octave and 1/3-octave filter standards; however, please consult section Table C.5 to see how the combinations influence the dynamic range of your measurement. 7) Set Broadband (excl. Peak), Broadband Peak and Spectrum Weighting parameters, as required. 8) Tap 17.5.1 to exit Setup. Controlling the Measurement The measurement is controlled in the same way you would control a normal Sound Level Meter measurement, using Start/Pause , Continue , Back-erase and Reset pushbuttons, see Chapter 3 for more details. Note: The low-frequency settings require much longer settling times of filters and detectors for correct results. The instrument automatically takes care of this and waits (after you press Start ) for the needed settling time for the individual detectors. 17.5.2 Displaying the Results The display frequency axis resolution may be adjusted by tapping the axis and selecting suitable display frequency limits (Fig.17.7). CHAPTER 17 Low Frequency Option BZ-7234 197 Fig.17.7 Spectrum view with Low Frequency set to Very Low 17.5.3 Saving Results Measurements are saved and can be opened later in the same way as described for the Sound Level Meter project in Chapter 3. 198 Hand-held Analyzer Types 2250 and 2270 – User Manual 199 Chapter 18 Specifications This chapter comprises the specifications that are needed for evaluation of analyzer performance characteristics and proper use of the analyzer. Some of the applicable sound level meter standards require additional technical documentation, in particular for pattern evaluation (type approval) purposes, but have no bearing on normal use. The additional technical documentation is given in a separate Brüel & Kjær instruction manual (BE 1712). 200 Hand-held Analyzer Types 2250 and 2270 – User Manual Specifications – Hand-held Analyzer Type 2250/2270 Platform Specifications apply to Type 2250/2270 fitted with Microphone Type 4189 and Microphone Preamplifier ZC-0032 Colour Schemes: Five different – optimised for different usage scenarios (day, night, etc.) Backlight: Adjustable level and on-time Microphone USER INTERFACE Measurement Control: Using pushbuttons on keyboard Setup and Display of Results: Using stylus on touch screen or pushbuttons on keyboard Lock: Keyboard and touch screen can be locked and unlocked SUPPLIED MICROPHONE Type 4189: Prepolarized Free-field ½ Microphone or Type 4190: Free-field ½ Microphone Nominal Open-circuit Sensitivity: 50 mV/Pa (corresponding to 26 dB re 1 V/Pa) ± 1.5 dB Capacitance: 14 pF (at 250 Hz) MICROPHONE PREAMPLIFIER ZC-0032 Nominal Preamplifier Attenuation: 0.25 dB Connector: 10-pin LEMO Extension Cables: Up to 100 m in length between the microphone preamplifier and Type 2250/2270, without degradation of the specifications Accessory Detection: Windscreen UA-1650 can be automatically detected when fitted over ZC-0032 MICROPHONE POLARIZATION VOLTAGE Selectable between 0 V and 200 V SELF-GENERATED NOISE LEVEL Typical values at 23°C for nominal microphone opencircuit sensitivity: Weighting Microphone Electrical Total “A” 14.6 dB 12.4 dB 16.6 dB “B” 13.4 dB 11.5 dB 15.6 dB “C” 13.5 dB 12.9 dB 16.2 dB “Z” 5 Hz–20 kHz 15.3 dB 18.3 dB 20.1 dB “Z” 3 Hz–20 kHz 15.3 dB 25.5 dB 25.9 dB Interface KEYBOARD Pushbuttons: 11 keys with backlight, optimised for measurement control and screen navigation ON-OFF BUTTON Function: Press 1 s to turn on; press 1 s to enter standby; press for more than 5 s to switch off STATUS INDICATORS LEDs: Red, amber and green DISPLAY Type: Transflective back-lit colour touch screen 240 320 dot matrix USB INTERFACE Hardware Versions 1 to 3: USB 1.1 OTG Mini B socket Hardware Version 4: USB 2.0 OTG Micro AB and USB 2.0 Standard A sockets MODEM INTERFACE Connection to Internet through GPRS/EDGE/HSPA modem connected through: • the Compact Flash slot (hardware versions 1 – 3) • the USB Standard A Socket (hardware version 4) Supports DynDNS for automatic update of IP address of host name PRINTER INTERFACE PCL printers, Mobile Pro Spectrum thermal printer or Seiko DPU S245/S445 thermal printers can be connected to USB socket MICROPHONE FOR COMMENTARY Microphone, which utilises Automatic Gain Control (AGC), is incorporated in underside of analyzer. Used to create voice annotations for attaching to measurements CAMERA (TYPE 2270 ONLY) Camera with fixed focus and automatic exposure is incorporated in underside of analyzer. Used to create image annotations for attaching to measurements Image Size: • Hardware versions 1 – 3: 640 x 480 pixels • Hardware version 4: 2048 x 1536 pixels Viewfinder Size: 212 x 160 pixels Format: jpg with exif information Inputs/Outputs COMPACT FLASH SOCKET (Hardware Version 1 to 3 only) Connection of CF memory card, CF modem, CF to serial interface, CF Ethernet interface or CF WLAN interface CHAPTER 18 Specifications SECURE DIGITAL SOCKET • 1 × SD socket for hardware versions 1 – 3 • 2 × SD sockets for hardware version 4 Connect SD and SDHC memory cards LAN INTERFACE SOCKET Hardware Versions 1 to 3 (Type 2270 only): • Connector: RJ45 MDI • Speed: 10 Mbps • Protocol: TCP/IP Hardware Version 4 (Types 2250 and 2270): • Connector: RJ45 Auto-MDIX • Speed: 100 Mbps • Protocol: TCP/IP INPUT SOCKET (2 - TYPE 2270 ONLY) Connector: Triaxial LEMO Input Impedance: 1 M Direct Input: Max. input voltage: ± 14.14 Vpeak CCLD Input: Max. input voltage: ± 7.07 Vpeak CCLD Current/voltage: 4 mA/25 V TRIGGER SOCKET Connector: Triaxial LEMO Max. Input Voltage: ± 20 Vpeak Input Impedance: > 47 k Precision: ± 0.1 V OUTPUT SOCKET Connector: Triaxial LEMO Max. Peak Output Level: ± 4.46 V Output Impedance: 50 HEADPHONE SOCKET Connector: 3.5 mm Minijack stereo socket Max. Peak Output Level: ± 1.4 V Output Impedance: 32 in each channel Power EXTERNAL DC POWER SUPPLY REQUIREMENTS Used to charge the battery pack in the analyzer Voltage: 8 – 24 V DC, ripple voltage < 20 mV Current Requirement: min. 1.5 A Power Consumption: < 2.5 W, without battery charging, < 10 W when charging Cable Connector: LEMO Type FFA.00, positive at centre pin 201 Voltage: 3.7 V Capacity: 5200 mAh nominal Typical Operating Time: • Single-channel: >11 h (screen backlight dimmed); >8.5 h (full screen backlight) • Dual-channel: >7.5 h (full screen backlight) Use of external interfaces (LAN, USB, WLAN) will decrease battery operating time. Connecting a weather station or a GPS receiver can decrease battery operating with up to 20% Battery Cycle Life: > 500 complete charge/discharge cycles Battery Aging: Approximately 20% loss in capacity per year Battery Indicator: Remaining battery capacity and expected working time may be read out in % and in time Battery Fuel Gauge: The battery is equipped with a built-in fuel gauge, which continuously measures and stores the actual battery capacity in the battery unit Charge Time: In analyzer, typically 10 hours from empty at ambient temperatures below 30C. To protect the battery, charging will be terminated completely at ambient temperatures above 40C. At 30 to 40C charging time will be prolonged. With External Charger ZG-0444 (optional accessory), typically 5 hours Note: It is not recommended to charge the battery at temperatures below 0C (32F) or over 50C (122F). Doing this will reduce battery lifetime CLOCK Back-up battery powered clock. Drift < 0.45 s per 24 hr period Storage INTERNAL FLASH-RAM (NON-VOLATILE) For user setups and measurement data: • Hardware versions 1 – 3: 20 MB • Hardware version 4:512 MB EXTERNAL SECURE DIGITAL MEMORY CARD SD and SDHC Card: For store/recall of measurement data EXTERNAL COMPACT FLASH MEMORY CARD (Hardware Versions 1 – 3 Only) CF Card: For store/recall of measurement data EXTERNAL AC MAIN SUPPLY ADAPTOR Part No.: ZG-0426 Supply Voltage: 100 – 120/200 – 240 VAC; 47 – 63 Hz Connector: 2-pin IEC 320 USB MEMORY STICK (Hardware version 4 only) For store/recall of measurement data BATTERY PACK Part No.: QB-0061 Rechargeable Li-Ion battery WARM-UP TIME From Power Off: < 2 min From Standby: < 10 s for prepolarized microphones Environmental Hand-held Analyzer Types 2250 and 2270 – User Manual 202 WEIGHT AND DIMENSIONS 650 g (23 oz.) including rechargeable battery 300 93 50 mm (11.8 3.7 1.9) including preamplifier and microphone User Interface USERS Multi-user concept with login. Users can have their own settings with jobs and projects totally independent of other users PREFERENCES Date, Time and Number formats can be specified per user LANGUAGE User Interface in Catalan, Chinese (People’s Republic of China), Chinese (Taiwan), Croatian, Czech, Danish, English, Flemish, French, German, Hungarian, Japanese, Italian, Korean, Polish, Portuguese, Romanian, Russian, Serbian, Slovenian, Spanish, Swedish, Turkish and Ukrainian HELP Concise context-sensitive help in Chinese (People’s Republic of China), English, French, German, Italian, Japanese, Korean, Polish, Portuguese, Romanian, Serbian, Slovenian and Spanish UPDATE OF SOFTWARE Update to any version using BZ-5503 through USB or update via Internet REMOTE ACCESS Connect to the analyzer using Measurement Partner Suite BZ-5503, using the 2250/2270 SDK (Software Development kit) or using an Internet browser supporting JavaScript. The connection is password protected Two levels of protection: • Guest level: for viewing only • Administrator level: for viewing and full control of the analyzer Software Specifications – Sound Level Meter Software BZ-7222 Conforms with the following National and International Standards: • IEC 61672–1 (2013) Class 1 • IEC 60651 (1979) plus Amendment 1 (1993–02) and Amendment 2 (2000–10), Type 1 • IEC 60804 (2000–10), Type 1 • DIN 45657 (1997– 07) • ANSI S1.4 –1983 plus ANSI S1.4A–1985 Amendment, Type 1 • ANSI S1.43–1997, Type 1 Note: The International IEC Standards are adopted as European standards by CENELEC. When this happens, the letters IEC are replaced with EN and the number is retained. Type 2250/2270 also conforms to these EN Standards Input CHANNELS (Type 2270 only) All measurements are made from either Ch.1 or Ch.2 TRANSDUCERS Transducers are described in a transducer database with information on Serial Number, Nominal Sensitivity, Polarization Voltage, Free-field Type, CCLD required, Capacitance and additional information. The analogue hardware is set up automatically in accordance with the selected transducer CORRECTION FILTERS For Microphone Types 4189, 4190, 4191, 4193, 4193 + UC-0211, 4950, 4952, 4952+EH-2152, 4955-A, 4964, 4964 + UC-0211 and 4184-A, BZ-7222 is able to correct the frequency response to compensate for sound field and accessories: Sound Field: Free field or diffuse field (for Types 4952 and 4184-A only: 0 (Top) reference direction and 90° (Side) reference direction) Accessories: • Types 4189, 4190, 4964 and 4964 + UC-0211 only: None, Windscreen UA-1650 or Outdoor Microphone Kit UA-1404 • Types 4191, 4193, 4193 + UC-0211 and 4955-A only: None or Windscreen UA-1650 • Type 4950 only: None or Windscreen UA-0237 For Accelerometer Types 4397-A, 4513, 4513-001, 4513-002, 4514, 4514-001, 4514-002, 4533-B, 4533-B-001, 4533-B-002, 4534-B, 4534-B-001, 4534-B-002, 8324, 8341, 8344, 8347-C + 2647-D the lower frequency limit will be optimized to match the specifications for the accelerometer CHAPTER 18 Specifications Analysis DETECTORS Parallel detectors on every measurement: A- or B-weighted (switchable): Broadband detector channel with three exponential time weightings (Fast, Slow, Impulse), one linearly averaging detector and one peak detector C- or Z-weighted (switchable): As for A- or Bweighted Overload Detector: Monitors the overload outputs of all the frequency weighted channels MEASUREMENTS FOR SOUND INPUT X = frequency weightings A or B Y = frequency weightings C or Z V = frequency weightings A, B, C or Z U = time weightings F or S Q = exchange rate 4, 5 or 6 dB N = number between 0.1 and 99.9 For Storage Full statistics For Display and Storage: Start Time Stop Time Overload % Elapsed Time LXeq LYeq LXE LYE LCeq–LAeqk LXSmax LXFmax LXImax LYSmax LYFmax LYImax LXSmin LXFmin LXImin LYSmin LYFmin LYImin LXIeq LYIeq LAIeq–LAeq LAFTeq LAFTeq–LAeq Time Remaining Lep,d Lep,dv E Dose Proj. Dose Lvpeak #VPeaks #VPeaks #VPeaks (>NNNdB) (>137dB) (>135dB) TVpeak LavUQ TWA TWAv DoseUQ Proj. DoseUQ LAeq,T2,mov,max LCeq,T1,mov,max LAeq,T1,mov,max LCeq,T2,mov,max Leq,T1,mov,max Leq,T2,mov,max Weather Data (requires connection to a weather station): Wind Dir. avg. Wind Dir. min. Wind Dir. max. Wind Speed avg. Wind Speed min. Wind Speed max. Amb. Temp. Amb. Humidity Amb. Pressure Amb. Rain Gauge Only for Display as Numbers or Quasi-analog Bars: LXS LXF LXI LYS LYF LYI LXS(SPL) LXF(SPL) LXI(SPL) LYS(SPL) LYF(SPL) LYI(SPL) LXN1 or LXUN1 LXN2 or LXUN2 LXN3 or LXUN3 LXN4 or LXUN4 LXN5 or LXUN5 LXN6 or LXUN6 LXN7 or LXUN7 LVpeak,1s Trig. Input Voltage Std.Dev. LAeq,T1,mov LAeq,T2,mov LCeq,T1,mov LCeq,T2,mov Leq,T1,mov Leq,T2,mov Instantaneous Weather Data: Wind Dir. Wind Speed Instantaneous GPS Data: Latitude Longitude MEASUREMENTS FOR VIBRATION AND DIRECT INPUT For Display and Storage: Start Time Stop Time Overload % Elapsed Time Time Remaining Linear Fast max Slow max Fast min Slow min Peak TPeak Only for Display as Numbers or Quasi-analog Bars: Fast Inst Slow Inst Trig. Input Voltage Instantaneous GPS Data: Latitude Longitude MEASURING RANGES When using Microphone Type 4189: Dynamic Range: From typical noise floor to max. level for a 1 kHz pure tone signal, A-weighted: 16.6 to 140 dB Primary Indicator Range: In accordance with IEC 60651: A-weighted: 23.5 dB to 122.3 dB Linearity Range: In accordance with IEC 60804: A-weighted: 21.4 dB to 140.8 dB Linear Operating Range: In accordance with IEC 61672: • A-weighted: 1 kHz: 24.8 dB to 139.7 dB • C-weighted: 25.5 dB to 139.7 dB • Z-weighted: 30.6 dB to 139.7 dB Peak C Range: In accordance with IEC 61672: 1 kHz: 42.3 dB to 142.7 dB 203 204 Hand-held Analyzer Types 2250 and 2270 – User Manual SAMPLING FOR STATISTICS The Statistics can be based on either LXF, LXS or LXeq: • Statistics LXFN1-7 or LXSN1-7 are based on sampling LXF or LXS, resp., every 10 ms into 0.2 dB wide classes over 130 dB • Statistics LXN1-7 are based on sampling LXeq every second into 0.2 dB wide classes over 130 dB Full distribution saved with measurement The Std.Dev. (Standard Deviation) parameter is calculated from the statistics NOTIFICATIONS Sends an SMS or e-mail daily at a specified time or if an alarm condition is fulfilled Alarm Conditions: • Disk Space below set value • Trig. Input Voltage below set value • Internal Battery enters set state • Change in Measurement State • Reboot of analyzer Signal Monitoring Measurement Display and Control MEASUREMENT DISPLAYS SLM: Measurement data displayed as numbers of various sizes and one quasi-analog bar Measured sound data are displayed as dB values, vibration data as dB values or in physical units (SI units (m/s2) or US/UK units (g)), direct data as voltage in dB or V, housekeeping data as numbers in relevant format. Instantaneous measurement LXF or Fast Inst is displayed as a quasi-analog bar MEASUREMENT CONTROL Manual: Manually controlled single measurement Automatic: Pre-set measurement time from 1 s to 24 hr in 1 s steps Manual Controls: Reset, Start, Pause, Back-erase, Continue and Store the measurement manually Auto-start: A total of 10 timers allow set up of measurement start times up to a month in advance. Each timer can be repeated. Measurements are automatically stored when completed BACK-ERASE The last 5 s of data can be erased without resetting the measurement Measurement Status ON SCREEN Information such as overload and running/paused are displayed on screen as icons TRAFFIC LIGHTS Red, yellow and green LEDs show measurement status and instantaneous overload as follows: • Yellow LED flash every 5 s = stopped, ready to measure • Green LED flashing slowly = awaiting calibration signal • Green LED on constantly = measuring • Yellow LED flashing slowly = paused, measurement not stored • Red LED flashing quickly = intermittent overload, calibration failed The input signal can be monitored using an earphone/headphones connected to the headphone socket, or it can be fed to the output socket OUTPUT SIGNAL Input Conditioned: A-, B-, C- or Z-weighted Gain Adjustment: –60 dB to 60 dB LXF output (every ms) as a DC voltage between 0 V and 4 V DC output for calibration purposes: 0 dB ~ 0 V and 200 dB ~ 4 V HEADPHONE SIGNAL Input signal can be monitored using this socket with headphones/earphones Gain Adjustment: –60 dB to 60 dB Annotations VOICE ANNOTATIONS Voice annotations can be attached to measurements so that verbal comments can be stored together with the measurement Playback: Playback of voice annotations can be listened to using an earphone/headphones connected to the headphone socket Gain Adjustment: –60 dB to +60 dB TEXT ANNOTATIONS Text annotations can be attached to measurements so that written comments can be stored with the measurement GPS ANNOTATIONS A text annotation with GPS information can be attached (Latitude, Longitude, Altitude and position error). Requires connection to a GPS receiver IMAGE ANNOTATIONS (TYPE 2270 ONLY) Image annotations can be attached to measurements. Images can be viewed on the screen. Calibration Initial calibration is stored for comparison with later calibrations CHAPTER 18 Specifications ACOUSTIC Using Sound Calibrator Type 4231 or custom calibrator. The calibration process automatically detects the calibration level when Sound Calibrator Type 4231 is used ELECTRICAL Uses internally generated electrical signal combined with a typed-in value of microphone sensitivity CALIBRATION HISTORY Up to 20 of the last calibrations made are listed and can be viewed on the analyzer Data Management METADATA Up to 30 metadata annotations can be set per project (text from keyboard or text from pick list, number from keyboard or auto generated number) PROJECT TEMPLATE Defines the display and measurement setups. Setups can be locked and password protected PROJECT Measurement data stored with the project template JOB Projects are organised in jobs Explorer facilities for easy management of data (copy, cut, paste, delete, rename, open project, create job, set default project name) Software Specifications – Frequency Analysis Software BZ-7223 The specifications for BZ-7223 include the specifications for Sound Level Meter Software BZ-7222. BZ7223 adds: Spectra for Display and Storage LXeq LXSmax LXSmin LXFmin Standards Spectra for Display Only LXS LXF LXYN2 LXYN3 LXYN5 LXYN6 Conforms with the following National and International Standards: • IEC 61260 (1995–07) plus Amendment 1 (2001–09), 1/1-octave Bands and 1/3-octave Bands, Class 0 • ANSI S1.11–1986, 1/1-octave Bands and 1/3-octave Bands, Order 3, Type 0–C • ANSI S1.11– 2004, 1/1-octave Bands and 1/3octave Bands, Class 0 Input CHANNELS (TYPE 2270 ONLY) All measurements are made from either Ch.1 or Ch.2 Frequency Analysis CENTRE FREQUENCIES 1/1-oct. Band Centre Frequencies: 8 Hz to 16 kHz 1/3-oct. Band Centre Frequencies: 6.3 Hz to 20 kHz MEASUREMENTS FOR SOUND INPUT X = frequency weightings A, B, C or Z, Y = time weightings F or S Data for Storage Full Spectral Statistics LXFmax LXYN1 LXYN4 LXYN7 Single Values SIL PSIL SIL3 LXeq(f1-f2)* NR NR Decisive Band RC RC Classification NCB NCB Classification NC NC Decisive Band Loudness Loudness Level *. where f1 and f2 are frequency bands in the spectrum. MEASUREMENTS FOR VIBRATION AND DIRECT INPUT Spectra for Display and Storage Linear Fast max Slow max Fast min Slow min Spectra for Display Only Fast Inst Slow Inst Single Values Linear (f1 – f2)a MEASURING RANGES When using Microphone Type 4189: Dynamic Range: From typical noise floor to max. level for a pure tone signal at 1 kHz 1/3-octave: 1.1 to 140 dB 205 206 Hand-held Analyzer Types 2250 and 2270 – User Manual Linear Operating Range: In accordance with IEC 61260, 1/3-octave: 20.5 to 140 dB SAMPLING FOR OCTAVE OR 1/3-OCTAVE STATISTICS X = frequency weightings A or B The Statistics can be based on either LXF or LXS: • Statistics LXFN1-7 or LXSN1-7 are based on sampling LXF or LXS, respectively, every T ms into 1 dB wide classes over 150 dB; T = 100 for frequency range set to 12.5 – 20 kHz T = 200 for frequency range set to 6.3 – 20 kHz Full distribution can be saved with measurement Displays MEASUREMENT DISPLAYS Spectrum: One or two spectra superimposed + A/B and C/Z broadband bars Table: One or two spectra in tabular form Y-axis: Range: 5, 10, 20, 40, 60, 80, 100, 120, 140 or 160 dB. Auto zoom or auto scale available. Sound data are displayed as dB values, vibration data as dB values or in physical units (SI units (m/s2) or US/UK units (g)), direct data as voltage in dB or V. Cursor: Readout of selected band Generator INTERNAL GENERATOR Built-in pseudo-random noise generator Spectrum: Selectable between Pink and White Crest Factor: Pink Noise: 4.4 (13 dB) White Noise: 3.6 (11 dB) Bandwidth: Selectable: • Lower Limit: 50 Hz (1/3-oct.) or 63 Hz (oct.) • Upper Limit: 10 kHz (1/3-oct.) or 8 kHz (oct.) Output Level: Independent of bandwidth • Max.: 1 Vrms (0 dB) • Gain Adjustment: –60 to 0 dB When bandwidth is changed, the level for all bands is automatically adjusted to comply with the set output level Correction Filters: For sound sources Type 4292, Type 4295 and Type 4296: Flat or Optimum Repetition Period: 175 s Output Connector: Output socket EXTERNAL GENERATOR Selectable as alternative to Internal Generator (for microphone input only) To control external noise generator, set: • Levels: 0 V (Generator off), 4.5 V (Generator on) • Rise-time and Fall-time: 10 s The noise generator is turned on and off automatically during the measurement Escape Time: 0 to 60 s Build-up Time: 1 to 10 s The generator can be turned on and off manually for checking equipment and sound levels Software Specifications – Logging Software BZ-7224 The specifications for BZ-7224 include the specifications for Sound Level Meter Software BZ-7222. BZ7224 adds: Logging MEASUREMENTS Logging: Measurement data logged at pre-set periods into files on: • SD Card: All hardware versions • CF Card: Hardware versions 1 – 3 • USB Memory Stick: Hardware version 4 Logging Period: From 1 s to 24 hr with 1 s resolution Fast Logging: LAF, LAS and LAeq (sound input) or Fast Inst, Slow Inst and Linear (vibration and Direct input) can be logged every 100 ms, irrespective of logging period Broadband Data Stored at each Logging Interval: All, or up to 10 selectable broadband sound data incl. Trig. Input Voltage, Weather data, and LAeq,T,mov (for vibration and direct input: up to 5 parameters) Broadband Statistics Stored at each Logging Interval: Full distribution, or none (sound input only) Spectrum Data Stored at each Logging Interval: All, or up to three selectable spectra (license for BZ-7223 required) Spectral Statistics Stored at each Logging Interval: Full distribution, or none (sound input only, license for BZ-7223 required) Logging Time: From 1 s to 31 days with 1 s resolution Measurement Total: For the logging time, in parallel with logging: All broadband data, statistics and spectra (license for BZ-7223 required) MARKERS One data exclusion marker and four user-definable markers for on-line marking of sound categories heard during the measurement Events can be set manually CHAPTER 18 Specifications TRIGGERS Markers can be set and signal recordings can be started (license for BZ-7226 required) when a broadband level is above or below a specified level ANNOTATIONS On-line annotations with spoken comments, written notes or images (Type 2270 only) Calibration CHARGE INJECTION CALIBRATION (CIC) Injects an internally generated electrical signal in parallel with the microphone diaphragm. A manual CIC can be performed whenever there is no measurement in progress An automatic CIC can be performed at the start and end of a logging measurement Measurement Displays Profile: Graphical display of selectable measurement data versus time. Fast display of next or previous marker, profile overview of entire measurement Y-axis: Range: 5, 10, 20, 40, 60, 80, 100, 120, 140 or 160 dB. Auto zoom or auto scale available. Sound data are displayed as dB values, vibration data as dB values or in physical units (SI units (m/s2) or US/UK units (g)), direct data as voltage in dB or V. X-axis: Scroll facilities Cursor: Readout of measurement data at selected time Notifications Alarm Conditions (in addition to those specified for BZ-7222): • CIC failed • Trigger Level exceeded Software Specifications – Enhanced Logging Software BZ-7225 The specifications for BZ-7225 include the specifications for Logging Software BZ-7224. BZ-7225 adds: Logging For Display and Storage Ldn, Lden, Lday, Levening and Lnight Selectable Day, Evening and Night periods and penalties (sound input only) Periodic Reports: Measurement data logged at a preset report period into files on: • SD Card: All hardware versions • CF Card: Hardware versions 1 – 3 • USB Memory Stick: Hardware version 4 Report Period: From 1 min to 24 hr with 1 min resolution Broadband Data and Statistics Stored at each Reporting Interval: All including Weather data Spectrum Data Stored at each Reporting Interval: All (license for BZ-7223 required) Spectral Statistics Stored at each Reporting Interval: Full distribution, or none (sound input only, license for BZ-7223 required) Logging Time: From 1 s to 31 days with 1 s resolution or Continuous Data are saved in separate projects for every 24 hr of logging – at a user-defined time of day Automatic reboot and resume of operation in case of power failure TRIGGERS Signal Recording Timer For periodically starting a signal recording (license for BZ-7226 required) Level Triggers Markers can be set and signal recordings can be started (license for BZ-7226 required) when a broadband or frequency band level is above or below a specified level. Hold off time between triggers can be set. You can specify up to four independent Level Triggers to be active at four different times during the day Calibration CHARGE INJECTION CALIBRATION (CIC) Injects an internally generated electrical signal in parallel with the microphone diaphragm. A manual CIC can be performed whenever there is no measurement in progress An automatic CIC can be performed at the start and end of a logging measurement. The CIC can be set to occur up to 4 times in each 24 hour period CIC Duration: 10 s Notifications Alarm Conditions (in addition to those specified for BZ-7224): LAeq for the latest Report Period exceeds a set threshold 207 Hand-held Analyzer Types 2250 and 2270 – User Manual 208 Software Specifications – Signal Recording Option BZ-7226 Signal Recording Option BZ-7226 is enabled with a separate license. It works with all the software for Type 2250/2270: Sound Level Meter, Frequency Analysis, Logging Software, Enhanced Logging Software and Reverberation Time Software For data storage, Signal Recording requires: • SD Card: All hardware versions • CF Card: Hardware versions 1 – 3 • USB Memory Stick: Hardware version 4 RECORDING FORMAT The recording format is either 24- or 16-bit wave files (extension .WAV) attached to the data in the project, easily played-back afterwards on a PC using BZ-5503, Type 7820 or 7825. Calibration information is stored in the .WAV file, allowing BZ-5503 and PULSE to analyse the recordings RECORDED SIGNAL A-, B-, C- or Z-weighted signal from the measurement transducer Manual Control of Recording: Recording can be manually started and stopped during a measurement using a pushbutton or an external signal Automatic Control of Recording: Start of recording when measurement is started. Minimum and Maximum recording time can be preset AUTOMATIC GAIN CONTROL The average level of the signal is kept within a 40 dB range, or the gain can be fixed Functions with BZ-7222 and BZ-7223 Functions with BZ-7224 and BZ-7225 SAMPLING RATE AND PRE-RECORDING The signal is buffered for the pre-recording of the signal. This allows the beginning of events to be recorded even if they are only detected later. Maximum Maximum Sampling Pre-recording (s) Pre-recording (s) Memory Memory Rate (KB/s) (KB/s) 16-bit 24-bit (kHz) 16-bit 24-bit HW 1 – 3 HW G4 HW 1 – 3 HW G4 8 110 470 70 310 16 24 16 50 230 30 150 32 48 24 30 150 16 96 48 72 48 10 70 3 43 96 144 PLAYBACK Playback of signal recordings can be listened to using the earphone/headphones connected to the headphone socket Manual Control of Recording (using Manual Event or Back-erase pushbutton, or an external signal): Recording during all of the event, or for preset minimum and maximum duration. A Sound marker is set while recording. Selectable pre- and post-recording time Manual Control of Recording (using touch screen): Recording for the selected time period (subject to the limitations of the pre-recording buffer). A Sound marker is set for the selected time period Automatic Control of Recording: An event can be triggered when a broadband level is above or below a specified level. Recording during all of the event or for preset minimum and maximum duration. Selectable pre- and post-recording time Functions with BZ-7227 Automatic Control of Recording: Start of recording when measurement is started 16-bit recording format only Software Specifications – Reverberation Time Software BZ-7227 Standards Conforms with the relevant parts of the following: • IEC 61672 –1 (2013) Class 1 • IEC 60651 (1979) plus Amendment 1 (1993–02) and Amendment 2 (2000–10), Type 1 • ANSI S1.4–1983 plus ANSI S1.4A–1985 Amendment, Type 1 • IEC 61260 (1995–07) plus Amendment 1 (2001–09), 1/1-octave Bands and 1/3-octave Bands, Class 0 • ANSI S1.11–1986, 1/1-octave Bands and 1/3-octave Bands, Order 3, Type 0–C • ANSI S1.11– 2004, 1/1-octave Bands and 1/3octave Bands, Class 0 • ISO 140 • ISO 3382 • ISO 354 CHAPTER 18 Specifications CORRECTION FILTERS For Microphone Types 4189, 4190, 4191, 4193, 4950, 4952, 4952+EH-2152, 4955-A, 4964 and 4184-A, BZ7227 is able to correct the frequency response to compensate for sound field and accessories Broadband Measurements DETECTORS A- and C-weighted broadband detectors with F exponential time weighting Overload Detector: Monitors the overload outputs of all the frequency weighted channels MEASUREMENTS LAF and LCF for Display as Numbers or Quasianalogue Bars MEASURING RANGES When using Microphone Type 4189: Dynamic Range: From typical noise floor to max. level for a 1 kHz pure tone signal, A-weighted: 16.6 to 140 dB Primary Indicator Range: In accordance with IEC 60651, A-weighted: 23.5 dB to 122.3 dB Linear Operating Range: In accordance with IEC 61672: • A-weighted: 23.5 dB to 122.3 dB • C-weighted: 25.5 dB to 139.7 dB • Z-weighted: 30.6 dB to 139.7 dB Frequency Analysis CENTRE FREQUENCIES 1/1-oct. Band Centre Frequencies: 63 Hz to 8 kHz 1/3-oct. Band Centre Frequencies: 50 Hz to 10 kHz MEASUREMENTS LZF spectrum for display only LZeq spectra sampled at 5 ms intervals MEASURING RANGES When using Microphone Type 4189: Dynamic Range: From typical noise floor to max. level for a pure tone signal at 1 kHz 1/3-octave: 1.1 to 140 dB Linear Operating Range: In accordance with IEC 61260, 1/3-octave: 20.5 dB to 140 dB Internal Generator Built-in pseudo-random noise generator Spectrum: Selectable Pink or White Crest Factor: • Pink noise: 4.4 (13 dB) • White noise: 3.6 (11 dB) Bandwidth: Follows measurement frequency range • Lower Limit: 50 Hz (1/3-oct.) or 63 Hz (oct.) • Upper Limit: 10 kHz (1/3-oct.) or 8 kHz (oct.) Output Level: Independent of bandwidth • Max.: 1 Vrms (0 dB) • Gain Adjustment: –60 to 0 dB When bandwidth is changed, the level for all bands is automatically adjusted to comply with the set output level Correction Filters for Sound Sources Type 4292, Type 4295 and Type 4296: Flat or Optimum Turn-on Time and Turn-off Time: Equivalent to RT = 70 ms Repetition Period: 175 s Output Connector: Output Socket Control: See Measurement Control External Generator Selectable as alternative to internal generator For controlling external noise generator Levels: 0 V (Generator off), 4.5 V (Generator on) Rise-time and Fall-time: 10 s Control: See Measurement Control Reverberation Time EDT, T20 and T30 in octave or 1/3-octave bands Decays: Measured and stored using averaging time of 5 ms Evaluation Range: 0 to –10 dB for EDT, –5 to –25 dB for T20 and –5 to –35 dB for T30 Measurement Time: Automatic selection of measurement time for the decays based on the actual reverberation time of the room Maximum Measurement Time: from 2 to 30 s Averaging: EDT, T20 and T30 measurements can be averaged (arithmetic averaging or ensemble averaging) EDT, T20 and T30 Calculation: From slope in evaluation range Slope Estimation: Least squares approximation Quality Indicators: Quality Indicators with status information like Overload, Curvature in %, etc.; extensive list of status information. Quality indicators are available on reverberation time spectra for each frequency band, and as overall quality indicators for each measurement position and for the total project (room) Reverberation Time Range: Max. 50 s, min. 0.1 – 0.7 s, depending on bandwidth and centre frequency Wide Band Reverberation Time: The arithmetic average of the Reverberation Time within a selectable 209 210 Hand-held Analyzer Types 2250 and 2270 – User Manual Measurement Display and Control OVERVIEW MAP Map of Source and Receiver positions with reverberation time readout for a selectable frequency band on each measurement position together with quality indicator Organisation of Source and Receiver Positions: measure at all receiver positions for each source or measure in a number of positions (1 to 10) for each source Source and Receiver positions can be added, moved or deleted OVERVIEW TABLE Table of measurement positions with reverberation time readout for selectable frequency band on each position together with quality indicator Positions can be included/excluded from Room average SOUND LEVEL SPECTRUM LZF spectrum plus A and C broadband bars Y-axis: Range: 5, 10, 20, 40, 60, 80, 100, 120, 140 or 160 dB. Auto zoom or auto scale available Cursor: Readout of selected band Quality indicator for each frequency band REVERBERATION TIME SPECTRUM One or two spectra can be displayed Y-axis: Range: 0.5, 1, 2, 5, 10 or 20 s. Auto zoom available Cursor: Readout of selected band Quality Indicator for each frequency band REVERBERATION TIME SPECTRUM TABLE One or two spectra can be displayed in tabular form DECAY Decay curve for a position or the room average available for each frequency band Display of evaluation range and regression line Readout of Curvature in % Y-axis: Range: 5, 10, 20, 40, 60, 80, 100, 120, 140 or 160 dB. Auto zoom or auto scale available MEASUREMENT CONTROL Measurement Sequence: Supports measuring: • at all receiver positions before using another source • at a receiver position for all sources before measuring at a new position • at subsequent receiver positions without source information, or • at manually selected source and receiver positions During measurement, the instantaneous sound level spectrum is displayed. After measurement, the reverberation time is displayed Interrupted Noise Excitation: Measurements are started manually and can be automatically stored on completion of measurement The noise generator is turned on and off automatically Escape Time: 0 to 60 s Build-up Time: 1 to 10 s Number of Decays per Measurement: 1 to 100, ensemble averaged into one decay The generator can be turned on and off manually for checking equipment and sound levels Serial Measurements: Selected frequency bands can be measured serially, that is, one by one in an automatic sequence. This can be done automatically in combination with the parallel measurement Impulse Excitation: Manual start of first measurement. When level (say from starter pistol) exceeds the user-selected trigger level, the decay is recorded and backwards integration performed (Schroeder method). The trigger can then be armed automatically for measuring at the next position Signal Recording: (requires license for Signal Recording Option BZ-7226) Recording of the Zweighted measured signal can be done at each position. For data storage, Signal Recording requires: • SD Card: All hardware versions • CF Card: Hardware versions 1 – 3 • USB Memory Stick: Hardware version 4 Measurement Status ON SCREEN Information such as overload, awaiting trigger and running/paused are displayed on screen as icons TRAFFIC LIGHT Red, yellow and green LEDs show measurement status and instantaneous overload as follows: • Yellow LED flashing every 5 s = stopped, ready to measure • Green LED flashing slowly = awaiting trigger or calibration signal • Green LED on constantly = measuring • Yellow LED flashing slowly = paused, measurement not stored • Red LED flashing quickly = intermittent overload, calibration failed Calibration Initial calibration is stored for comparison with later calibrations ACOUSTIC Using Sound Calibrator Type 4231 or custom calibrator. The calibration process automatically detects the calibration level when Sound Calibrator Type 4231 is used CHAPTER 18 211 Specifications ELECTRICAL Uses internally generated electrical signal combined with a typed-in value of microphone sensitivity CALIBRATION HISTORY Up to 20 of the last calibrations made are listed and can be viewed on the analyzer Signal Monitoring Input signal A-, C- or Z-weighted can be monitored using an earphone/headphones connected to the headphone socket Headphone Signal: Input signal can be monitored using this socket with headphones/earphones Gain Adjustment: –60 dB to 60 dB Annotations VOICE ANNOTATIONS Voice annotations can be attached to the Reverberation Time Project, to Sources, to Receivers and to measurements at each Position Playback: Playback of voice annotations or signal recordings can be listened to using earphone/headphones connected to the headphone socket Gain Adjustment: –60 dB to +60 dB TEXT & IMAGE ANNOTATIONS Text and image (Type 2270 only) annotations can be attached to the Reverberation Time Project, to Sources, to Receivers and to measurements at each Position GPS ANNOTATIONS A text annotation with GPS information can be attached to the project (Latitude, Longitude, Altitude and position error). Requires connection to a GPS receiver Data Management Project Template: Defines the display and measurement setups Project: Measurement data for all positions defined in a room are stored with the Project Template Job: Projects are organised in Jobs Explorer facilities for easy management of data (copy, cut, paste, delete, rename, open project, create job, set default project name) For specifications and details on documenting results in Qualifier Type 7830 and Qualifier Light Type 7831, please refer to Product Data BP 1691 Software Specifications – 2-channel Option BZ-7229 2-channel Option BZ-7229 is enabled with a separate license. It adds 2-channel functionality to Sound Level Meter, Frequency Analysis, Logging, Enhanced Logging and Building Acoustics Software and to Signal recording option on Type 2270. Note: 2-channel Enhanced Logging is not available for hardware versions 1-3. Please refer to Product Data BP 2190 for Dualchannel Building Acoustics Software specifications In general the 2-channel Option adds an extra channel of measurement data. The two channels can have input from same type of transducers (e.g., two microphones) or two different transducers (e.g., one microphone and one accelerometer) SELF-GENERATED NOISE LEVEL Typical values at 23°C for nominal microphone opencircuit sensitivity: High Range: Weighting Microphone Electrical Total “A” 14.6 dB 28.3 dB 28.5 dB “B” 13.4 dB 26.9 dB 27.1 dB “C” 13.5 dB 27.0 dB 27.2 dB “Z” 5 Hz–20 kHz 15.3 dB 31.2 dB 31.3 dB “Z” 3 Hz–20 kHz 15.3 dB 32.1 dB 32.2 dB Low Range: Weighting Microphone Electrical “A” 14.6 dB Total 12.4 dB 16.6 dB “B” 13.4 dB 11.5 dB 15.6 dB “C” 13.5 dB 12.9 dB 16.2 dB “Z” 5 Hz–20 kHz 15.3 dB 18.3 dB 20.1 dB “Z” 3 Hz–20 kHz 15.3 dB 25.5 dB 25.9 dB 212 Hand-held Analyzer Types 2250 and 2270 – User Manual MEASURING RANGES The full level measuring range is covered in two range settings: High Range for the least sensitive range and Low Range for the most sensitive range When using Microphone Type 4189: Broadband Analysis Dynamic Range: From typical noise floor to max. level for a 1 kHz pure tone signal, A-weighted: • High Range: 28.5 to 140 dB • Low Range: 16.6 to 110 dB Primary Indicator Range: In accordance with IEC 60651, A-weighted: • High Range: 41.7 dB to 122.3 dB • Low Range: 23.5 dB to 92.3 dB Linearity Range: In accordance with IEC 60804, A-weighted: • High Range: 39.6 to 140.8 dB • Low Range: 21.4 to 110.8 dB Linear Operating Range: In accordance with IEC 61672: • A-weighted: 1 kHz – High Range: 43.0 dB to 139.7 dB – Low Range: 24.8 dB to 109.7 dB • C-weighted: 1 kHz – High Range: 41.7 dB to 139.7 dB – Low Range: 25.5 dB to 109.7 dB • Z-weighted: 1 kHz – High Range: 45.9 dB to 139.7 dB – Low Range: 30.6 dB to 109.7 dB Peak C Range: In accordance with IEC 61672, 1 kHz: • High Range: 58.5 dB to 142.7 dB • Low Range: 42.3 dB to 112.7 dB Frequency Analysis Dynamic Range: From typical noise floor to max. level for a pure tone signal at 1 kHz 1/3-octave: • High Range: 18.5 to 140 dB • Low Range: 1.3 to 110 dB Linear Operating Range: In accordance with IEC 61260: • High Range: 39.3 to 140 dB • Low Range: 20.6 to 110 dB Measurements with BZ-7222 and BZ-7223 Two channels, each with all the data from the single channel measurement, except for common housekeeping parameters like Start Time, Elapsed Time etc. and weather and GPS data. Underrange Detector: Monitors the underrange of all the frequency-weighted detectors when set to High Range. Underrange is set if level is below lower limit of Linear Operating Range. Detectors available for both Ch. 1 and Ch. 2 AUTORANGE Manual and automatic range controls are provided Spectrum Display (for BZ-7223) Spectra from both channels can be superimposed. Data from different transducer types are displayed with individual Y-axis Spectra for Display (Microphone Input): • Ch.1 - Ch.2 LXeq • Ch.2 - Ch.1 LXeq X = A,B,C,Z Spectra for Display (Accelerometer or Direct Input): • Ch.1 - Ch.2 Linear • Ch.2 - Ch.1 Linear Single Values for Display (Microphone Input): • Ch.1-Ch.2 LXeq • Ch.2-Ch.1 LXeq • Ch.1-Ch.2 LYeq • Ch.2-Ch.1 LYeq X = A, B. Y = C, Z Single Values for Display (accelerometer or direct input): • Ch.1 - Ch.2 Linear • Ch.2 - Ch.1 Linear Measurements with BZ-7224 and BZ-7225 Fast Logging: Up to a total of four of the 100 ms parameters from the two channels can be logged. Broadband Data Stored at Each Logging Interval: All, or up to 10 selectable broadband values from the two channels. Spectrum Data Stored at each Logging Interval: All, or up to four selectable spectra from the two channels (license for BZ-7223 required) 2-channel Signal Recording (license for BZ-7226 required): 2-channel Signal Recording is available in Sound Level Meter, Frequency Analysis, Logging and Enhanced Logging Software The signals from the two channels can be recorded into a “stereo” wave file of either 2 × 24-bit or 2 × 16-bit Note: 2 × 24-bit at 48 kHz is not available for hardware versions 1–3 CHAPTER 18 Specifications SAMPLING RATE AND PRE-RECORDING FOR 2-CHANNEL RECORDING Maximum Maximum Sampling Pre-recording (s) Pre-recording (s) Memory Memory Rate (KB/s) (KB/s) 16-bit 24-bit (kHz) 16-bit 24-bit HW 1 – 3 HW G4 HW 1 – 3 HW G4 8 50 230 30 150 32 16 20 110 10 70 64 48 96 24 10 70 3 43 96 144 48 0 30 NA 16 192 288 Software Specifications – Tone Assessment Option BZ-7231 LICENSE Tone Assessment Option BZ-7231 is enabled with a separate license and can be used with the FFT template (BZ-7230) or with 1/3-octave and logging template (BZ-7223, BZ-7224 and BZ-7225) FFT Based Tone Assessment (with BZ-7230 Only) STANDARD Tone assessment is based on the measured FFT spectrum in accordance with ‘ISO 1996:2007 Acoustics – Description, assessment and measurement of environmental noise – part 2: Determination of environmental noise levels. Annex C (informative) Objective method for assessing the audibility of tones in noise – Reference method’ SPECTRA ASSESSED Any displayed sound FFT spectrum (FFT, Ref or MAX) may be assessed Assessment is made as post-processing, that is, when measurement is paused or stopped SETUP ACCORDING TO STANDARD Setups in violation of the standard are indicated as such on the display, you may then accept to apply the default setup Tone assessment will be made if possible, in spite of standard violations Tone Seek Criterion: 0.1 to 4.0 dB in 0.1 dB steps TONE AT CURSOR A sinusoidal tone is available at the Headphone output, to help confirm identified tones Frequency: the frequency is selected by the Main cursor Gain: –70 dB to +10 dB Options: The generated tone can be mixed with the input signal TONE ASSESSMENT CURSOR All tones found are indicated in the display. The Tone cursor is initially placed at the most prominent tone, and can then be stepped through the tones found. You can also use the Main cursor to step through the tones RESULTS Results are displayed in the Tone panel and in the Value panel They are not saved with the measurement All Tones: Frequency, Tone level Lpti, Masking noise level Lpn, Audibility Lta, Critical Band CB, Tone vs. Noise Level difference Lts, Audibility criterion Lts,krit Most Prominent Tone: Tone Level Lpt, Adjustment Kt QUALITY INDICATORS On the display, a quality indicator (smiley) will indicate that a hint is available for tone assessment quality. Click on the indicator to see the hint 1/3-octave Based Tone Assessment (with BZ-7223/24/25 Only) Tone assessment is based on the measured 1/3octave spectrum in accordance with either the international ‘ISO 1996:2007 Acoustics – Description, assessment and measurement of environmental noise – part 2: Determination of environmental noise levels. Annex D (informative) Objective method for assessing the audibility of tones in noise – Simplified method’ or the Italian law ‘DM 16-03-1998: Ministero dell'ambiente, Decreto 16 marzo 1998’ SPECTRA ASSESSED The displayed 1/3-octave spectrum (Leq, Lmax or Lmin) may be assessed. Assessment is made as postprocessing, that is, when measurement is paused or stopped 213 214 Hand-held Analyzer Types 2250 and 2270 – User Manual SETUP ACCORDING TO STANDARD Setups in violation of the standard are indicated as such on the display. You can then accept to apply the default setup. Tone assessment will be made if possible, in spite of standard violations. For tone assessment according to ISO 1996-2, Annex D, you can set the division between the Low and Middle frequency range, the division between the Middle and High frequency range, and the limits for the level differences between adjacent bands. For tone assessment according to DM 16-03-1998, the tones are tested against loudness contours. Select between ISO 226: 1987 Free-field, 1987 Diffuse-field and 2003 Free-field RESULTS Tones are indicated above the spectrum when Tone is selected as spectrum parameter. The resulting adjustment can be viewed on the Value panel. It is not saved with the measurement QUALITY INDICATORS On the display, a quality indicator (smiley) will indicate that a hint is available for tone assessment quality. Click on the indicator to see the hint Software Specifications – Low Frequency Option BZ-7234 Low Frequency Option BZ-7234 is enabled with a separate license. It adds G-weighting and Building Vibration parameters to Sound Level Meter, Frequency Analysis, Logging and Enhanced Logging Software and adds low frequency 1/1- and 1/3-octave analysis to Frequency Analysis, Logging and Enhanced Logging Software. G-weighting Specifications for G-weighing apply to Type 2250/2270 fitted with one of the microphone Types 4193 or 4964 (both with or without the Low Frequency Adaptor UC-0211) and Microphone Preamplifier ZC-0032 Standards Conforms with the following National and International Standards: • ISO 7196:1995 • ANSI S1.42–2001 (R2011) Analysis DETECTORS G-weighted (replacing C/Z-weighted) broadband detectors with one 10 s exponential time weighting, one linearly averaging detector and one peak detector. MEASUREMENTS Y = time weightings F or S Spectra for Display and Storage (BZ-7223 required) LGeq LGSmax LGFmax LGSmin LGFmin Spectra for Display Only (BZ-7223 required) LGS LGF LGYN1 LGYN2 LGYN3 LGYN4 LGYN5 LGYN6 LGYN7 Single Values for Display and Storage LGeq LG10max LG10min LGpeak TGpeak Single Values for Display Only LG10 LGpeak,1s MEASURING RANGES G-weighted Linear Operating Range at G-filter reference frequency 10 Hz, Single Range Single Range:. Microphone Low (dB) High (dB) 4193 41.0 161.0 4194 + UC-0211 44.1 151.4 4964 29.6 149.0 4964 + UC-0211 32.6 139.3 Microphone Low (dB) High (dB) 4193 41.6 161.0 4194 + UC-0211 51.8 151.4 4964 30.3 149.0 4964 + UC-0211 41.7 139.3 Microphone Low (dB) High (dB) High Range: Low Range: 4193 41.0 131.0 4194 + UC-0211 44.1 147.4 4964 29.6 119.0 4964 + UC-0211 32.6 137.3 CHAPTER 18 Specifications Building Vibration Specifications for Building Vibration parameters apply to Type 2250/2270 fitted with an accelerometer. Standards Conforms with the following International Standards: • ISO 8041:2005 • DIN 45669-1:2010–09 Analysis DETECTORS Wm-weighted or Wmb-weighted detectors run in parallel with the Linear weighted broadband detectors. Wmb is the band-limiting part of the Wm weighting. MEASUREMENTS Spectra for Display and Storage (BZ-7223 required) aW Fast max Slow max Fast min Slow min Spectra for Display Only (BZ-7223 required) Fast Inst Slow Inst Single Values for Display and Storage aW aWCrest MTVV KBFmax KBFTm Peak TPeak Single Values for Display Only aW,1s KBF Low Frequency 1/1- and 1/3-octave Analysis Frequency Analysis Sound Measurements CENTRE FREQUENCIES 1/1-oct. Band Centre Frequencies: 1 Hz to 16 kHz 1/3-oct. Band Centre Frequencies: 0.8 Hz to 20 kHz Low frequency sound measurements require use of a low frequency microphone. This can be the Type 4193 or Type 4964, both together with Low Frequency Adaptor UC-0211 Standards Conforms with the following National and International Standards: • IEC 61260 (1995–07) plus Amendment 1 (2001–09), 1/1-octave Bands and 1/3-octave Bands, Class 0 • ANSI S1.11–1986, 1/1-octave Bands and 1/3-octave Bands, Order 3, Type 0–C • ANSI S1.11–2004, 1/1-octave Bands and 1/3-octave Bands, Class 0 Vibration Measurements Brüel & Kjær recommends Low-level Accelerometer Type 8344 for low frequency vibration measurements Software Specifications – Measurement Partner Suite BZ-5503 BZ-5503 is included with Types 2250, 2270 and 2250 Light (referred to as Type 2250/70 here) for easy synchronisation of setups and data between the PC and hand-held analyzer. BZ-5503 is supplied on ENV DVD BZ-5298 PC REQUIREMENTS Operating System: Windows® 7 or XP (both in 32-bit or 64-bit versions) Recommended PC: • Intel® Core™ 2 Duo • Microsoft®.NET 4.0 • 2 GB of memory • Sound card • DVD drive • At least one available USB port ON-LINE DISPLAY OF TYPE 2250/2270 DATA Measurements on Type 2250/2270 can be controlled from the PC and displayed on-line with the PC, using the same user interface on the PC as on Type 2250/2270 Display: 1024 × 768 (1280 × 800 recommended) 215 216 Hand-held Analyzer Types 2250 and 2270 – User Manual DATA MANAGEMENT Explorer: Facilities for easy management of analyzers, Users, Jobs, Projects and Project Templates (copy, cut, paste, delete, rename, create) Data Viewer: View measurement data (content of projects) Synchronisation: Project Templates and Projects for a specific user can be synchronised between PC and Type 2250/2270 USERS Users of Type 2250/2270 can be created or deleted EXPORT FACILITIES Excel: Projects (or user-specified parts) can be exported to Microsoft® Excel® (Excel 2003 – 2010 supported) Brüel & Kjær Software: Projects can be exported to Predictor-LimA Type 7810, Acoustic Determinator Type 7816, Evaluator Type 7820, Protector Type 7825 or Qualifier (Light) Type 7830 (7831) POST-PROCESSING Measurement Partner Suite is a suite of modules, including post-processing tools for data acquired with Type 2250/2270. The following post-processing modules are available: • Logging Module BZ-5503-A • Spectrum Module BZ-5503-B • WAV File Analysis Module BZ-5503-C These two modules help to assess logging data and measured spectra, such as calculating contribution from markers on a logging profile or correcting spectra for background noise TYPE 2250/2270 SOFTWARE UPGRADES AND LICENSES The software controls Type 2250/2270 software upgrades and licensing of the Type 2250/2270 applications INTERFACE TO TYPE 2250/2270 USB, LAN or Internet connection USB Connection: • Hardware versions 1 – 3: USB ver. 1.1 • Hardware version 4: USB ver. 2.0 LICENSE MOVER To move a license from one analyzer to another use BZ-5503, together with the License Mover VP-0647. See the analyzer’s user manual for details LANGUAGE User Interface in Chinese (People’s Republic of China), Chinese (Taiwan), Croatian, Czech, Danish, English, Flemish, French, German, Hungarian, Japanese, Italian, Korean, Polish, Portuguese, Romanian, Russian, Serbian, Slovenian, Spanish, Swedish, Turkish and Ukrainian HELP Concise context-sensitive help in English Ordering Information Type 2250-A Type 2250-B Type 2250-C Type 2250-D Hand-held Analyzer with Sound Level Meter Software BZ-7222 Hand-held Analyzer with Sound Level Meter BZ-7222 and Frequency Analysis Software BZ-7223 Hand-held Analyzer with Sound Level Meter Software BZ-7222 and Logging Software BZ-7224 Hand-held Analyzer with Sound Level Meter Software BZ-7222, Frequency Analysis Software BZ-7223 and Logging Software BZ-7224 Type 2250-E Type 2270-A Type 2270-B Type 2270-C Hand-held Analyzer with Sound Level Meter Software BZ-7222, Frequency Analysis Software BZ-7223, Enhanced Logging Software BZ-7225 and Signal Recording Software BZ-7226 Hand-held Analyzer with Sound Level Meter Software BZ-7222 Hand-held Analyzer with Sound Level Meter BZ-7222 and Frequency Analysis Software BZ-7223 Hand-held Analyzer with Sound Level Meter Software BZ-7222 and Logging Software BZ-7224 CHAPTER 18 Specifications Hand-held Analyzer with Sound Level Meter Software BZ-7222, Frequency Analysis Software BZ-7223 and Logging Software BZ-7224 Type 2270-E Hand-held Analyzer with Sound Level Meter Software BZ-7222, Frequency Analysis Software BZ-7223, Enhanced Logging Software BZ-7225 and Signal Recording Software BZ-7226 Included with Hand-held Analyzer Type 2250/2270: • Microphone: – Type 4189: 1/2Prepolarized Free-field Microphone or – Type 4190: 1/2Free-field Microphone • ZC-0032: Microphone Preamplifier • AO-1494: USB Standard A to USB Micro B Interface Cable for hardware version 4, 1.8 m (6 ft) • AO-1476: USB Standard A to USB Mini B Interface Cable for hardware versions 1 – 3, 1.8 m (6 ft) • BZ-5298: Environmental Software, including Measurement Partner Suite BZ-5503 • UA-1650: 90 mm dia. Windscreen with AutoDetect • UA-1651: Tripod Extension for Hand-held Analyzer • UA-1673: Adaptor for Standard Tripod Mount • DH-0696: Wrist Strap • KE-0440: Travel Bag • KE-0441: Protective Cover • FB-0679: Hinged Cover (Type 2250 only) • FB-0699: Hinged Cover (Type 2270 only) • HT-0015: Earphones • UA-1654: 5 Extra Styli • QB-0061: Battery Pack • ZG-0426: Mains Power Supply Type 2270-D Software and Accessories Available Separately SOFTWARE MODULES BZ-7223 Frequency Analysis Software BZ-7224 Logging Software (including memory card) BZ-7225 Enhanced Logging Software (including memory card) BZ-7225-UPG Upgrade from Logging Software BZ-7224 to Enhanced Logging Software BZ-7225 (does not include memory card) BZ-7226 Signal Recording Option BZ-7227 Reverberation Time Software BZ-7229 2-channel Option (Type 2270 only) BZ-7228 Building Acoustics Software BZ-7230 BZ-7231 BZ-7233 BZ-7234 FFT Software Tone Assessment Option Sound Intensity Software (Type 2270 only) Low Frequency Option ANALYZER COMPONENTS ZG-0444 Charger for QB-0061 Battery Pack CALIBRATION Type 4231 Type 4226 Type 4228 Type 4294 Type 4194-002 MEASURING Type 3535-A Type 4964 Type 8344 AO-0440-D-015 AO-0646 AO-0697-D-030 AO-0697-D-100 AO-0701-D-030 AO-0702-D-030 AO-0722-D-050 AO-0726-D-030 AO-0727-D-010 AO-0727-D-015 JP-1041 UA-0587 UA-0801 UA-1317 UA-1404 UA-1672 UC-0211 UL-1009 UL-1013 UL-1017 Sound Calibrator (fits in KE-0440) Multifunction Acoustic Calibrator Pistonphone Calibration Exciter Calibration Exciter for Type 8344 All-weather Case (see Product Data BP 2251) Low Frequency Microphone Low Level Accelerometer Signal Cable, LEMO to BNC Male, 1.5 m (5 ft) Sound Cable, LEMO to Minijack, 1.5 m (5 ft) Microphone Extension Cable, 10-pin LEMO, 3 m (10 ft) Microphone Extension Cable, 10-pin LEMO, 10 m (33 ft) Accelerometer Cable, LEMO to M3, 3 m (10 ft) Accelerometer Cable, LEMO to 10 – 32 UNF, 3 m (10 ft) Accelerometer cable, LEMO to MIL-C-5015, 5 m (16 ft) Signal Cable, LEMO to SMB (for Tacho Probe MM-0360), 3 m (10 ft) Signal Cable, LEMO to BNC Female, 1 m (3.3 ft) Signal cable, LEMO to BNC Female, 1.5 m (5 ft) Dual 10-pole Adaptor Tripod Small Tripod Microphone Holder Outdoor Microphone Kit AutoDetect Insert for UA-1650 Low Frequency Adaptor SD Memory Card for Hand-held Analyzers CF Memory Card for Hand-held Analyzers, for hardware versions 1–3 SDHC Memory Card for Hand-held Analyzers 217 218 Hand-held Analyzer Types 2250 and 2270 – User Manual MEASURING WITH REVERBERATION TIME SOFTWARE BZ-7227 Type 2734-A Power Amplifier* Type 2734-B Power Amplifier with built-in UL-0256 Wireless Audio System* UL-0256 Wireless Audio System* Type 4292-L OmniPower Sound Source* KE-0449 Flight Case for Type 4292-L* KE-0364 Tripod Carrying Case for Type 4292-L Type 4224 Sound Source* Type 4295 Omnidirectional Sound Source* KE-0392 Carrying Case for Type 4295* AO-0523-D-100 Cable from Type 2250/2270 to Power Amplifier, 10 m (33 ft.) AO-0524-D-100 Cable from Type 2250/2270 to Type 4224, 10 m (33 ft.) AQ-0673 Cable from Power Amplifier to sound source, 10 m (33 ft.) UA-1476 Wireless Remote Control* POST-PROCESSING Type 7831 Qualifier Light Type 7830 Qualifier INTERFACING BZ-5503-A Logging Module (see Product Data BP 2430) BZ-5503-B Spectrum Module (see Product Data BP 2430) BZ-5503-C WAV File Analysis Module (see Product Data BP 2430) Type 7820 Evaluator – data viewing and calculation software Type 7825 Protector – software for calculation of Personal Noise Exposure UL-1016 10/100 Ethernet CF Card for hardware versions 1 – 3 *. For sound source systems and components, please see Product Data BP 1689 or BP 0066. UL-1019 UL-0250 UL-1025 CF WLAN Card for Hand-held Analyzers for hardware versions 1–3 USB to RS–232 Converter for hardware version 4 SD WLAN Card for Hand-held Analyzers for hardware version 4 Service Products MAINTENANCE 2250-UPG Upgrade of software applications to latest version 2250-EW1 Extended Warranty, one year extension 2250-MW1 5-year Warranty, including yearly Accredited Calibration (annual payment) 2250-MW5 5-year Warranty, including yearly Accredited Calibration 2270-UPG Upgrade of software applications to latest version 2270-EW1 Extended Warranty, one year extension 2270-MW1 5-year Warranty, including yearly Accredited Calibration (annual payment) 2270-MW5 5-year Warranty, including yearly Accredited Calibration ACCREDITED CALIBRATION 2250 CAI Accredited Initial Calibration of Type 2250 2250 CAF Accredited Calibration of Type 2250 2250 CTF Traceable Calibration of Type 2250 2250 TCF Conformance Test of Type 2250, with certificate 2270 CAI Accredited Initial Calibration of Type 2270 2270 CAF Accredited Calibration of Type 2270 2270 CTF Traceable Calibration of Type 2270 2270 TCF Conformance Test of Type 2270, with certificate CHAPTER 18 Specifications Compliance with Standards The CE marking is the manufacturer's declaration that the product meets the requirements of the applicable EU directives RCM mark indicates compliance with applicable ACMA technical standards – that is, for telecommunications, radio communications, EMC and EME China RoHS mark indicates compliance with administrative measures on the control of pollution caused by electronic information products according to the Ministry of Information Industries of the People’s Republic of China WEEE mark indicates compliance with the EU WEEE Directive Safety EN/IEC 61010– 1, ANSI/UL 61010–1 and CSA C22.2 No.1010.1: Safety requirements for electrical equipment for measurement, control and laboratory use EMC Emission EN/IEC 61000–6–3: Generic emission standard for residential, commercial and light industrial environments EN/IEC 61326: Electrical equipment for measurement, control and laboratory use – EMC requirements CISPR 22: Radio disturbance characteristics of information technology equipment. Class B Limits IEC 61672–1, IEC 61260, IEC 60651 and IEC 60804: Instrumentation standards Note: The above is only guaranteed using accessories listed in this Product Data EMC Immunity EN/IEC 61000–6–2: Generic standard – Immunity for industrial environments EN/IEC 61326: Electrical equipment for measurement, control and laboratory use – EMC requirements IEC 61672–1, IEC 61260, IEC 60651 and IEC 60804: Instrumentation standards Note: The above is only guaranteed using accessories listed in this Product Data Temperature IEC 60068-2-1 & IEC 60068-2-2: Environmental Testing. Cold and Dry Heat. Operating Temperature: -10 to +50°C (14 to 122°F) Storage Temperature: -25 to +70°C (-13 to 158°F) Humidity IEC 60068-2-78: Damp Heat: 93% RH (non-condensing at +40°C (104°F)). Recovery time 2 ~ 4 hours Mechanical Non-operating: IEC 60068-2-6: Vibration: 0.3 mm, 20 m/s2, 10 - 500 Hz IEC 60068-2-27: Bump: 1000 bumps at 400 m/s2 IEC 60068-2-27: Shock: 1000 m/s2, 6 directions Enclosure IEC 60529 (1989): Protection provided by enclosures: IP20 219 220 Hand-held Analyzer Types 2250 and 2270 – User Manual 221 Appendix A Setup Parameters This appendix describes all the setup parameters included in a template. For 2-channel setup, some parameters are doubled – one for Ch.1 and one for Ch.2 (2270 only) Hand-held Analyzer Types 2250 and 2270 – User Manual 222 A.1 Input Table A.1 Input parameters Parameter Input Channel Values Ch. 1 Ch. 2 * Loudness Free-field Diffuse-field Auto Trigger Input† None MATRON Handswitch Comment Determines whether Input Ch. 1 or Input Ch. 2 is used for the measurement. (Available in Type 2270 1-channel templates only) Determines whether Loudness and Loudness Level are calculated based on Free-field or Diffuse-field conditions. Set to Auto to follow the setting of Sound Field Correction. For an unknown microphone type, you can set Loudness to the condition matching your request. Available for microphone input only. This parameter should be set to match the equipment connected to the Trigger Input socket on the connector panel of the analyzer. Set it to None, if not used. Voltage Level Voltage for Monitoring Set Trigger Input to MATRON Handswitch if the analyzer is being used in the MATRON system. This setting should also be used if you want to use the Handswitch ZH-0680 for manually triggering signal recordings. Note: This can only be used together with analyzers with serial numbers above 2479652 Set Trigger Input to Voltage Level if you want to control signal recording by a voltage level generated by external equipment. The Voltage Level should generate at least 2 V for On and less than 1 V for Off. The duration of the steady level should be at least 1 s, so it can be recognised by the analyzer Set Trigger Input to Voltage for Monitoring if you want to monitor the voltage at this input. This setting can be used together with Notifications – see section 8.4. This setting cannot be combined with MATRON Handswitch or Voltage Level Label Up to four characters Labels for the channels: Leftmost is for Channel 1 (default set to "Ch.1") Rightmost for Channel 2 (default set to "Ch.2"). (Available in 2270 2-channel templates only) APPENDIX A Setup Parameters Table A.1 (Cont.) Input parameters Parameter Input Values Top Socket Rear Socket Sound Field Correction Free-field Diffuse-field Windscreen Auto Detect On Off Windscreen Correction None UA-1650 UA-1404 Range Setting Low Range High Range *. Requires Frequency Analysis Software BZ-7223 †. Not available in Reverberation Time Software BZ-7227 Comment Determines whether the input is taken from the Top socket or the Rear socket ('Input' on connector panel). Connect your transducer to this socket Note: Sound Field and Windscreen corrections can be added to both the Top Socket and the Rear Socket (Input parameters). However, be careful that you do not add a 'double' correction – for instance, if you have recorded the signal from the Output socket on a tape recorder, and later want to reanalyse the recording via the Rear socket. In this case you should set Microphone Type to Unknown on the Transducer menu for the used transducer, when using Rear Socket Input Select a correction matching the sound field of your measurements, that is, you can make correct measurements in a diffuse-field using a Type 4189 or 4190 free-field microphone, by selecting Diffusefield correction. Even Free-field correction of a freefield microphone will enhance the overall frequency response of the system. Generally, ISO requires free-field conditions and ANSI requires diffuse-field conditions. Check your local standards for the setting you require. No correction is made for unknown transducers. Available for Microphone input only. Automatic detection of Windscreen UA-1650 when mounted on Microphone Preamplifier ZC-0032. The preamplifier should be connected to the top socket, if necessary using a microphone extension cable. This parameter is available for microphone types using ZC-0032 only If Windscreen Auto Detect is set to Off, you can manually select a windscreen correction suitable for the windscreen in use. Correction is automatically made for the windscreen on Types 4952 and 4184A. No correction is made for unknown transducers. Available for Microphone input only. Select Low Range or High Range for input channels. Note: Press the Manual Event button to Autorange the setting. High Range will select a range with 0 dB gain, which allows the highest possible input. Low Range will select a range with 30 dB gain. (available in Type 2270 2-channel templates only) 223 Hand-held Analyzer Types 2250 and 2270 – User Manual 224 A.2 Frequency Settings Table A.2 Frequency Setting parameters* Parameter Low Frequency Option Values Off On * Low Frequency Normal Extended Very Low Comment Set to ON to enable the Low Frequency setting, Very Low, and the G and Wm frequency weightings. Requires Low Frequency Option BZ-7234. Use this parameter to extend the low frequency of the broadband measurements and the frequency analysis. However, be aware that the measurements will be more sensitive to very low frequency noise such as wind noise. Low Frequency = Normal: Frequency analysis*: 1/1-octave: 16 Hz – 16 kHz 1/3-octave: 12.5 Hz – 20 kHz Low Frequency = Extended: Frequency analysis†: 1/1-octave: 8 Hz – 16 kHz 1/3-octave: 6.3 Hz – 20 kHz Low Frequency = Very Low: Frequency analysis*: 1/1-octave: 1 Hz – 16 kHz 1/3-octave: 0.8 Hz – 20 kHz (Requires Low Frequency Option BZ-7234) For microphone input this setting is only possible for microphone Types 4193 and 4964 including Low Frequency Adaptor UC-0211. Broadband (excl. Peak) Microphone: A,Z A,C B,Z B,C A,G Accelerometer: Linear Linear, Wm Linear, Wmb Direct: Linear All broadband parameters (except Lpeak) are measured simultaneously with two different frequency weightings – select the weightings here The settings G, Wm and Wmb are available for Low Frequency = Extended or Very Low Requires Low Frequency Option BZ-7234 APPENDIX A Setup Parameters (Cont.) Frequency Setting parameters* Table A.2 Parameter Values Microphone: X C Z G Broadband Peak Accelerometer: Linear Linear, Wm Linear, Wmb Comment One broadband peak parameter Lpeak is measured, select the frequency weighting here. Note: X = frequency weighting A or B. ‘A’ requires that the Broadband (excl. Peak) parameter is set to AC or AZ. ‘B’ requires that the Broadband (excl. Peak) parameter is set to BC or BZ The settings G, Wm and Wmb are available for Low Frequency = Extended or Very Low Requires Low Frequency Option BZ-7234 Direct: Linear Spectrum† Microphone: X C Z G Accelerometer: Linear Linear, Wm Linear, Wmb The frequency analysis (1/1-octave or 1/3-octave) will be frequency weighted in accordance with this parameter Note: X = frequency weighting A or B. ‘A’ requires that the Broadband (excl. Peak) parameter is set to AC or AZ. ‘B’ requires that the Broadband (excl. Peak) parameter is set to BC or BZ The settings G, Wm and Wmb are available for Low Frequency = Extended or Very Low Requires Low Frequency Option BZ-7234 Direct: Linear Bandwidth‡ 1/1-octave Bandwidth of frequency analysis 1/3-octave Bottom F. for Special Leq**,†† Top Freq. for Special Leq†,‡‡ 0.8 Hz to Top Frequency 1/1-octave: 1 Hz – 16 kHz 1/3-octave: 0.8 Hz – 20 kHz Note: The lower limit of the parameter depends on Low Frequency Bottom Frequency to 20 kHz 1/1-octave: 1 Hz – 16 kHz 1/3-octave: 0.8 Hz – 20 kHz *. Not available in Reverberation Time Software BZ 7227. †. Requires Frequency Analysis Software BZ-7223. ‡. Requires Frequency Analysis Software BZ-7223 or Reverberation Time Software BZ-7227. **. For BZ-7223, BZ-7224 and BZ-7225 only. ††. Bottom F. for Special Leq is f1 in the parameter LXeq(f1-f2) ‡‡. Top F. for Special Leq is f2 in the parameter LXeq(f1-f2) 225 Hand-held Analyzer Types 2250 and 2270 – User Manual 226 A.3 Statistics Statistics parameters (available for microphone input only)* Table A.3 Parameter Broadband Statistics based on Values LXeq LXF LXS Spectral Statistics based on† LXF LXS Comment The broadband statistics are based on sampling the broadband parameter LXF or LXS each 10 ms or LXeq each second. Note: X = frequency weighting A or B. ‘A’ requires that the Broadband (excl. Peak) parameter is set to AC or AZ. ‘B’ requires that the Broadband (excl. Peak) parameter is set to BC or BZ The statistics are based on sampling the instantaneous spectrum every 100 ms (200 ms for Low Frequency set to On). The time weighting for the spectrum is either F or S. The frequency weighting X is determined by the Frequency Weighting, Spectrum parameter Percentile N1 0.1 to 99.9 User-defined percentile level where the value of LXN1 is exceeded for N1% of the elapsed time Percentile N2 0.1 to 99.9 User-defined percentile level where the value of LXN2 is exceeded for N2% of the elapsed time Percentile N3 0.1 to 99.9 User-defined percentile level where the value of LXN3 is exceeded for N3% of the elapsed time Percentile N4 0.1 to 99.9 User-defined percentile level where the value of LXN4 is exceeded for N4% of the elapsed time Percentile N5 0.1 to 99.9 User-defined percentile level where the value of LXN5 is exceeded for N5% of the elapsed time Percentile N6 0.1 to 99.9 User-defined percentile level where the value of LXN6 is exceeded for N6% of the elapsed time Percentile N7 0.1 to 99.9 User-defined percentile level where the value of LXN7 is exceeded for N7% of the elapsed time *. Not available for Reverberation Time Software BZ-7227. †. Requires Frequency Analysis Software BZ-7223. The Percentile levels N1 to N7 are common to broadband and spectral statistics, and can be changed after the measurement has been done. APPENDIX A Setup Parameters A.4 Measurement Control – for BZ-7222 to BZ-7225 Table A.4 Measurement Control parameters – for BZ-7222 to BZ-7225 Parameter Values Measurement Mode * Manual Automatic Comment Determines whether the measurement is under Manual control (fully controlled by the Reset and Start/Pause pushbuttons), or Automatic control (start of measurement controlled by the Reset and Start/Pause pushbuttons, end of measurement automatically controlled by the analyzer when preset time has elapsed) Preset Time * 00:00:01 to 24:00:00 Fixes the duration of a measurement from start to automatic stop (in hours, minutes and seconds). Any pauses made during the measurement via the Start/Pause pushbutton are not counted in the preset time Save Project Data at † 00:00:00 to 23:59:59 Determines the time for automatic save of the project and start of a new project Continuous Logging † On Determines whether the logging will run continuously, or for a time set by Preset Logging Time Off ‡ 0.00:00:01 to 31.00:00:00 Fixes the duration of a measurement from start to automatic stop (in days, hours, minutes and seconds) Logging Period ‡ 00:00:01 to 24:00:00 Sets the period of the logging (in hours, minutes and seconds) Report Period † 00:01:00 to 24:00:00 Sets the period of the reports (in hours and minutes) Full Spectral Stat. for Reports † Yes Determines whether the full spectral statistics are logged in the report or not. Available for microphone input only. Preset Logging Time No Synchronize with Clock ‡ Yes No Select Yes to synchronise the logging and reporting intervals with whole minutes or hours, for example, if Logging Period is set to 00:01:00 (1 minute) and Report Period is set to 01:00:00 and you start the measurement at 8:12:33, then the first logging interval will be from 8:12:33 to 8:12:59 (27 seconds), the second will be from 8:13:00 to 8:13:59 (60 seconds), etc., and the first Report interval will be from 8:12:33 to 8:59:59 (48 min and 27 seconds), the second will be from 9:00:00 to 9:59:59 (1 hour), etc. Select No if you want every logging and reporting interval to be exactly the specified Logging Period 227 228 Hand-held Analyzer Types 2250 and 2270 – User Manual Table A.4 (Cont.) Measurement Control parameters – for BZ-7222 to BZ-7225 Parameter Values Comment T for LXeq,T,mov 00:01:00 to 01:00:00 Sets the averaging time T (in minutes) of the moving LAeq and moving LCeq. When the averaging time T has elapsed the LAeq,T,mov and LCeq,T,mov parameters will contain the LAeq and LCeq of the latest T minutes – updated every second. in addition, you also have Leq,T,mov = LCeq,T,mov – LAeq,T,mov. The LXeq,T,mov is not stored with the total data, but can be logged (BZ-7224 and BZ-7225). The LAeq,T,mov,max, LCeq,T,mov,max and the difference between the C- and A-weighted values for the complete measurement period are stored. Note: There are two sets of these parameters, allowing two simultaneous moving averages: e.g., one with 15 min averaging time and one with 1 hour averaging time. Charge Injection Calibration ‡ On Set to On for making a CIC at the start and end of Logging. An Exclude marker is set on the profile and Total parameters are not updated during the CIC. Available for microphone input only. Off Daily CIC † None Once Twice Three times Determines whether a Charge Injection Calibration is performed one to four times a day or not at all. An Exclude marker is set on the profile and Periodic Reports and Total parameters are not updated during the calibration. The results are saved together with the Total parameters. Available for microphone input only. Four times † 00:00:00 to 23:59:59 Set time of day for first CIC check Note: The Check times must be separated from each other by at least one minute. They should also differ by at least one minute from the time set in the Save Project Data at parameter. Available for microphone input only. Second Check † 00:00:00 to 23:59:59 Set time of day for second CIC check. Available for microphone input only. Third Check † 00:00:00 to 23:59:59 Set time of day for third CIC check. Available for microphone input only. Fourth Check † 00:00:00 to 23:59:59 Set time of day for fourth CIC check. Available for microphone input only. First Check *. For Sound Level Meter (BZ-7222) and Frequency Analyzer (BZ-7223) templates only. †. For Enhanced Logging (BZ-7225) templates only. ‡. For Logging (BZ-7224) and Enhanced Logging (BZ-7225) templates only. APPENDIX A Setup Parameters A.5 Measurement Control – for Reverberation Time Software BZ-7227 Table A.5 Measurement Control parameters – for Reverberation Time Software BZ-7227 Parameter Map Based Measurement Values No Yes Meas. All Pos. for Each Source No Comment If Map Based Measurement = Yes you can define the source positions and receiver positions graphically on a map – otherwise the measurements are just numbered from position number one (Pos. 1) onwards Parameter only available if Map Based Measurement = Yes. Yes Set to Yes for measuring all positions for each source position. Set to No for measuring a specific number of receiver positions per source position No. of Positions per Source 1 to 10 Parameter only available if Meas. All Pos. for Each Source = No Set number of receiver positions you want to measure per source Increment Sources First Parameter only available if Map Based Measurement = Yes. Allows you to select the quickest method of measurement, when positioning your analyzer in relation to source and receiver positions. (Typically, Sources First is best for Impulsive Excitation and Receivers First is best for Interrupted Noise excitation) Receivers First Manual Automatic Save No Set to Yes to automatically save the decay after each measurement Yes Max. Decay Time 1 to 30 s Sets the maximum duration of the decay measurement. If the decay finishes in a shorter time, decay measurement stops automatically Note: If you set Max. Decay Time above 20 s, then the measurement will not stop before this time has elapsed 229 230 Hand-held Analyzer Types 2250 and 2270 – User Manual Table A.5 (Cont.) Measurement Control parameters – for Reverberation Time Software BZ-7227 Parameter Excitation Values Impulsive Interrupted Noise Comment Select Impulsive to excite the room with an impulse. The analyzer triggers on the impulse, measures the impulse as a sequence of spectra with 5 ms intervals, and finally backwardly integrates the measurements to decay curves. Select Interrupted Noise to excite the room with noise, interrupt the noise and measure the decays – all controlled by the analyzer Number of Decays 1 to 99 Parameter only available if Excitation = Interrupted Noise. Specify the number of decays to be measured automatically and averaged together per position Trigger Level 0 to 200 dB Parameter only available if Excitation = Impulsive. Specify the trigger level for the sound level in any frequency band – the measurement starts as soon as this level is exceeded. The measurement has a pre-trigger of 1 s Trigger Repeat Off Set to On to start a new measurement automatically, after saving the previous measurement (and after fulfilling the trigger conditions). Parameter only available if Excitation = Impulsive and Automatic Save = Yes On Measurement Mode Parallel Serial Combined Parallel measures all bands in the spectrum simultaneously, Serial measures selected bands, and Combined first measures Parallel and then Serial in an automated sequence APPENDIX A Setup Parameters A.6 Logged Broadband (100 ms) Table A.6 Logged Broadband (100 ms) parameters* Parameter Single channel: Parameter 1 to Parameter 3 2-channel templates (2270 only): Parameter 1 to Parameter 4 Values Microphone: LAeq, LAF, LAS, Off Comment The selected parameter(s) will be logged every 100 ms. LAeq or Linear will have an averaging time of 100 ms. Accelerometer or Direct: Linear, Fast Inst, Slow Inst, Off *. For Logging (BZ-7224) and Enhanced Logging (BZ-7225) templates only. A.7 Logged Broadband Table A.7 Logged Broadband parameters* Parameter Full Statistics Values Yes No Broadband Parameters All Selected Comment Determines whether the full broadband statistics are logged or not Available for microphone input only Determines whether All broadband parameters are logged or a Selected part is logged (up to 10 parameters for microphone input, otherwise up to 5 parameters) 231 232 Hand-held Analyzer Types 2250 and 2270 – User Manual Table A.7 (Cont.) Logged Broadband parameters* Parameter Parameter 1 to Parameter 10 Values Microphone: LXeq LYeq LCeq–LAeq LAeq,T1,mov LAeq,T2,mov LCeq,T1,mov LCeq,T2,mov Leq,T1,mov Leq,T2,mov LGeq LG10max LG10min LXE LYE LVpeak LXFmax LXSmax LXImax LYFmax LYSmax LYImax LXFmin LXSmin LXImin LYFmin LYSmin LYImin LXIeq LYIeq LAIeq–LAeq LAFTeq LAFTeq–LAeq LavUQ SIL PSIL SIL3 LWeq(f1-f2) Overload Trig. Input Voltage Wind Dir. avg. Wind Dir. min. Wind Dir. max. Wind Speed avg. Wind Speed min. Wind Speed max. (Values continue on next page) Comment This parameter can be set if Broadband Parameters = Selected X = frequency weightings A or B (controlled by Setup > Frequency Settings > BB (ex. peak) parameter) Y = frequency weightings C or Z (controlled by Setup > Frequency Settings > BB (ex. peak) parameter) V = frequency weightings A, B, C or Z (controlled by Setup > Frequency Settings > BB Peak parameter) U = time weightings F or S (controlled by Setup > Occupational Health > Time Weighting for Lav parameter) Q = exchange rate 4, 5 or 6 dB (controlled by Setup > Occupational Health > Exchange Rate for Lav parameter) W = frequency weightings A, B, C or Z (controlled by Setup > Frequency Settings > Spectrum parameter) f1 = Bottom frequency band (controlled by Setup > Frequency Settings > Bottom F. for Special Leq parameter) f2 = Top frequency band (controlled by Setup > Frequency Settings > Top Freq. for Special Leq parameter) Note: The parameter values shown are for single-channel templates. For 2-channel templates (Type 2270 only) most of the values are available for both Ch.1 and Ch.2 APPENDIX A Setup Parameters Table A.7 (Cont.) Logged Broadband parameters* Parameter (Cont.) Parameter 1 to Parameter 10 Values Comment Amb. Temperature Amb. Humidity Amb. Pressure Amb. Rain Gauge Accelerometer: Linear Peak Fast max Slow max Fast min Slow min Linear(f1-f2) Overload Trig. Input Voltage aW/LW aWCrest MTVV KBFmax KBFTm PeakW Linear: Peak Fast max Slow max Fast min Slow min Linear(f1-f2) Overload Trig. Input Voltage *. For Logging (BZ-7224) and Enhanced Logging (BZ-7225) templates only. A.8 Logged Spectrum Table A.8 Logged Spectrum parameters* Parameter Full Spectral Statistics Values Yes Comment Determines whether the full spectral statistics are logged or not No Spectrum Parameters All Selected None Determines whether All spectrum parameters are logged, a Selected part of the parameters are logged (up to 3 parameters) or None are logged 233 Hand-held Analyzer Types 2250 and 2270 – User Manual 234 Table A.8 (Cont.) Logged Spectrum parameters* Parameter Values Microphone: LXeq LXFmax LXSmax LXFmin LXSmin Off Spectrum 1 to Spectrum 3 Accelerometer: Linear / aW Fast max Slow max Fast min Slow min Off Comment These parameters can be set if Spectrum Parameters = Selected X = frequency weightings A, B, C, Z or G (controlled by Setup > Frequency Settings > Spectrum parameter) Note: The parameter values shown are for single-channel templates. For 2-channel templates (Type 2270 only) the values are available for both Ch.1 and Ch.2 Direct: Linear Fast max Slow max Fast min Slow min Off *. For Logging (BZ-7224) and Enhanced Logging (BZ-7225) templates only, requires Frequency Analysis Software BZ-7223. A.9 Markers Table A.9 Markers* Parameter Values Comment Marker 1 Text string Default set to ‘Exclude’. This marker can be set using the stylus in the profile or the Backerase pushbutton during a measurement Marker 2 Text string Default set to ‘Manual’. This marker can be set using the stylus in the profile or the Manual Event pushbutton during a measurement Marker 3 Text string Default set to ‘Level’. This marker can be set using the stylus in the profile, or if the conditions for the Level Trigger are met during a measurement Marker 4 and Marker 5 Text string These markers can be set using the stylus in the profile display APPENDIX A Setup Parameters Table A.9 (Cont.) Markers* Parameter Values Comment Marker 6 Text string Default set to ‘Sound’. This marker is set if a signal recording is made during a measurement Pre-marker Time 0 to 5 s Specifies number of seconds marker 1, marker 2 or marker 3 will be set ahead of the point where the Back-erase or the Manual Event pushbuttons are pressed or the level trigger conditions are fulfilled *. For Logging (BZ-7224) and Enhanced Logging (BZ-7225) templates only. A.10 Level Trigger Table A.10 Level Trigger parameters* Parameter Level Trigger Control Values On Off Start Slope Rising Falling Comment Set to On for setting Marker 3 (Level) when the Trigger Parameter fulfils the Level Trigger conditions (see below). The conditions are checked every second. Signal Recording† can also be controlled by these settings, see Setup > Signal Recording > Recording Control parameter Set to Rising to start when level goes above Start Level (and then stop when level goes below Stop Level). Set to Falling to start when level goes below Start Level (and stop when level goes above Stop Level) Start Level –100 to 200 dB Start trigger conditions are fulfilled, when level crosses Start Level (in accordance with Start Slope) for at least Start Duration seconds – set Start Level here Start Duration 0 to 420 s Start trigger conditions are fulfilled, when level crosses Start Level (in accordance with Start Slope) for at least Start Duration seconds – set Start Duration here. The Start Duration will be limited by the internal recording buffer size and the Recording Quality and Resolution (Table A.18). 235 236 Hand-held Analyzer Types 2250 and 2270 – User Manual Table A.10 (Cont.) Level Trigger parameters* Parameter Values Comment Stop Level –100 to 200 dB Stop trigger conditions are fulfilled, when level crosses Stop Level (in accordance with Start Slope) for at least Stop Duration seconds – set Stop Level here Stop Duration 0 to 420 s Stop trigger conditions are fulfilled, when level crosses Stop Level (in accordance with Start Slope) for at least Stop Duration seconds – set Stop Duration here Trigger Parameter Microphone: LXeq LYeq LAeq,T1,mov LAeq,T2,mov LCeq,T1,mov LCeq,T2,mov LGeq LG10max LG10min LVpeak LXFmax LXSmax LXImax LYFmax LYSmax LYImax LXFmin LXSmin LXImin LYFmin LYSmin LYImin LXF(SPL) LXS(SPL) LXI(SPL) LYF(SPL) LYS(SPL) LYI(SPL) Select which parameter to monitor for the level trigger. The parameter is based on 1 second measurements and checked every second regardless of the logging period and logged parameters (Values continue on next page) X = frequency weightings A or B (controlled by Setup > Frequency Settings > BB (ex. peak) parameter). Y = frequency weightings C or Z (controlled by Setup > Frequency Settings > BB (ex. peak) parameter). V = frequency weightings A, B, C or Z (controlled by Setup > Frequency Settings > BB Peak parameter) Note: The parameter values shown are for single-channel templates. For 2-channel templates (Type 2270 only) the values are available for both Ch.1 and Ch.2 APPENDIX A Setup Parameters Table A.10 (Cont.) Level Trigger parameters* Parameter (Cont.) Trigger Parameter Values Comment Accelerometer: Linear Peak Fast max Slow max Fast min Slow min aW/LW KBFmax PeakW Direct: Linear Peak Fast max Slow max Fast min Slow min *. For Logging (BZ-7224) templates only. †. Requires license for Signal Recording BZ-7226. A.11 Triggers Table A.11 Trigger parameters* Parameter Values Comment Signal Recording Timer Timer On Off Set to On to periodically generate a Timer Event. Note: Set Signal Recording, Recording Control to Timer Event or All Events Timer Period 00:01:00 to 48:00:00 The signal recording is triggered with Timer Period intervals Synchronize with Clock Yes Select Yes to synch. the start of signal recordings with whole minutes or hours. No Select No if you want the first signal recording Timer Period after start Duration 00:00:01 to 24:00:00 Specifies the duration of the timer for the signal recording. Note: The total time of the signal recording will be Pre-recording Time + Duration + Postrecording Time 237 Hand-held Analyzer Types 2250 and 2270 – User Manual 238 Table A.11 (Cont.) Trigger parameters* Parameter Level Trigger 1 Trigger Values Comment †‡ On Off Set to On for setting Marker 3 (Level) when the Trigger Parameter fulfils the Level Trigger conditions (see below). The conditions are checked every second. Signal Recordingsc can also be controlled by these settings, see Setup > Signal Recording > Recording Control Start Time 00:00:00 to 23:59:59 Start Time defines when the level trigger is enabled. Triggering is limited to the enabled time Stop Time 00:00:00 to 23:59:59 Stop Time defines when the level trigger is disabled. Triggering is limited to the enabled time Hold Off 00:00:00 to 01:00:00 Hold Off specifies a time after a level trigger, where level triggering is disabled. Can be useful in reducing the number of triggers Start Slope Rising Set to Rising to start when level goes above Start Level (and then stop when level goes below Stop Level). Falling Set to Falling to start when level goes below Start Level (and stop when level goes above Stop Level) Start Level –100 to 200 dB Start trigger conditions are fulfilled when level crosses Start Level (in accordance with Start Slope) for at least Start Duration seconds – set Start Level here Start Duration 0 to 420 s Start trigger conditions are fulfilled when level crosses Start Level (in accordance with Start Slope) for at least Start Duration seconds – set Start Duration here. The Start Duration will be limited by the internal recording buffer size and the Recording Quality and Resolution (Table A.18) Stop Level –100 to 200 dB Stop trigger conditions are fulfilled when level crosses Stop Level (in accordance with Start Slope) for at least Stop Duration seconds – set Stop Level here APPENDIX A Setup Parameters Table A.11 (Cont.) Trigger parameters* Parameter Values Comment Stop Duration 0 to 420 s Stop trigger conditions are fulfilled when level crosses Stop Level (in accordance with Start Slope) for at least Stop Duration seconds – set Stop Duration here. The Stop Duration will be limited by the internal recording buffer size and the Recording Quality and Resolution (Table A.18) Trigger Parameter Microphone: LXeq LYeq LAeq,T1,mov LAeq,T2,mov LCeq,T1,mov LCeq,T2,mov LGeq LG10max LG10min LVpeak LXFmax LXSmax LXImax LYFmax LYSmax LYImax LXFmin LXSmin LXImin LYFmin LYSmin LYImin LXF(SPL) LXS(SPL) LXI(SPL) LYF(SPL) LYS(SPL) LYI(SPL LWeq(f1-f2) Select which parameter to monitor for the level trigger. The parameter is based on 1 second measurements and checked every second regardless of the logging period and logged parameters (Values continue on next page) X = frequency weightings A or B (controlled by Setup > Frequency Settings > BB (ex. peak) parameter) Y = frequency weightings C or Z (controlled by Setup > Frequency Settings > BB (ex. peak) parameter) V = frequency weightings A, B, C or Z (controlled by Setup > Frequency Settings > BB Peak parameter) W = frequency weightings A, B, C or Z (controlled bySetup > Frequency Settings > Spectrum parameter) (Comments continue on next page) 239 240 Hand-held Analyzer Types 2250 and 2270 – User Manual Table A.11 (Cont.) Trigger parameters* Parameter (Cont.) Trigger Parameter Values Accelerometer: Linear Peak Fast max Slow max Fast min Slow min Linear(F1-F2) aW / LW KBFmax PeakW Comment f1 = Lower freq. range (controlled by Setup > Frequency Settings > Bottom F. for Special Leq parameter) f2 = Upper freq. range (controlled by Setup > Frequency Settings > Top Freq. for Special Leq parameter) Note: The parameter values shown are for single-channel templates. For 2-channel templates (Type 2270 only) the values are available for both Ch.1 and Ch.2 Direct: Linear Peak Fast max Slow max Fast min Slow min Linear(F1-F2) Level Trigger 2: Exactly the same parameters as Level Trigger 1 Level Trigger 3: Exactly the same parameters as Level Trigger 1 Level Trigger 4: Exactly the same parameters as Level Trigger 1 *. For Enhanced Logging (BZ-7225) templates only. †. Up to four individual trigger settings can be set for non-overlapping time periods of the day. ‡. Requires license for Signal Recording BZ-7226. A.12 Units Table A.12 Unit parameters (available for Accelerometer or Direct input only) Parameter Engineering Unit Values Comment No Select No to display values in dB Yes Select Yes to display values in m/s2 (Accelerometer input) or V (Direct input) Note: Use Preferences > Regional Settings to select whether the Vibration unit should be m/s2 (SI) or g (US/UK) APPENDIX A Setup Parameters A.13 Signal Recording Table A.13 Signal Recording parameters* Parameter Recording Control Values Off Comment Determines how recording of the measured signal is controlled Automatic Manual Event Set to Automatic to start the recording when the measurement is started and record throughout the measurement, only limited by the Maximum Duration Exclude Event† Set to Manual Event to start recording manually while measuring when the Manual Event pushbutton is pressed, and record until pressing the pushbutton Level Trigger Event† again, however, take Maximum and Minimum Duration into account Timer Event‡ Set to Exclude Event to start recording manually while measuring when the Back-erase pushbutton is All Events† pressed, and record until pressing the pushbutton again, however, take Maximum and Minimum Duration Image Event into account External Event Set to External Event to start recording using external equipment connected to the Trigger Input Socket Set to Level Trigger Event to record while the level trigger conditions are fulfilled, however, take Maximum and Minimum Duration into account Set to Timer Event (BZ-7225 only) to record while the timer trigger conditions are fulfilled, however, take Maximum and Minimum Duration into account (Comments continue on next page) 241 242 Hand-held Analyzer Types 2250 and 2270 – User Manual Table A.13 (Cont.) Signal Recording parameters* Parameter Values Comment Set to All Events to record while any of the events above are active, however, take Maximum and Minimum Duration into account (Cont.) Recording Control If you do not want to record the input signal, then set Recording Control to Off, to economise on power Set to Image Event (Type 2270 only) to make a recording of 1 s + Pre-recording Time + Post-recording Time Note: For Reverberation Time Software BZ-7227, the values are limited to Off and Automatic. Set to Automatic to make signal recordings during the measurements Recorded Channel Ch.1 Select Ch.1 or Ch.2 to record that channel or select Both to record both channels simultaneously. Ch.2 Both Recording Quality Low Fair Medium This setup determines the quality of the recording by adjusting the sampling rate. The amount of space required for the recording will depend on the selected quality (see details in the Specifications chapter) High Recorded Signal † Microphone: Input X-weighted Input C-weighted Input Z-weighted Accelerometer and Direct: Input Linear Use this parameter to select the frequency weighting of the recorded signal Note 1: The frequency weighting of the recorded signal can be selected independently of the frequency weighting of the measurement, the signal at the output socket and the signal at the earphone socket Note 2: X = frequency weighting A or B. ‘A’ requires that the BB (excl. Peak) parameter is set to AC or AZ. ‘B’ requires that the BB (excl. Peak) parameter is set to BC or BZ Note 3: Recording in 2-channel templates will only record Input Z-weighted for Microphone input APPENDIX A Setup Parameters Table A.13 (Cont.) Signal Recording parameters* Parameter Automatic Gain Control Values † On Off Comment To ease identification of sound sources, the gain can be automatically adjusted to keep the average level within a 40 dB range. When playing back the recorded signal, you will then hear clearly the whole signal content, whether the level has been 20 dB or 140 dB. Set Automatic Gain Control to On to convert the recorded signal. The recorded signal is stored as a 16-bit .WAV file. Set Automatic Gain Control to Off for recording the signal with a fixed gain – then set Resolution = 24 bit (recommended) to cover the full 120 dB dynamic range (from max. input level and down) or select Resolution = 16 bit and specify the Peak Recording Level to fit the signal. Note: If the sound contains very high levels at low frequency, then a fixed gain is recommended Resolution 24 bit 16 bit Set Resolution to 24 bit to cover the full dynamic range. Set Resolution to 16 bit to cover up to 96 dB from Peak Recording Level and down. Note: You will only be warned about overload in the recorded signal if Automatic Gain Control is On or if Resolution is 24 bit or if Peak Recording Level is set to its maximum value Note: 24-bit recording not possible in BZ-7227 Peak Recording Level 145 dB 135 dB 125 dB 115 dB 105 dB 95 dB 85 dB 75 dB For Automatic Gain Control = Off and Resolution = 16 bit the recorded wave file has a dynamic range of up to 96 dB. When playing back on the analyzer, the dynamic range of the output is approx. 75 dB. When playing back on a PC it might be even lower. Set Peak Recording Level to fit the signal. The values for Peak Recording Level take the sensitivity of the attached transducer into account. The values shown in the list here are nominal values for a Type 4189 or 4190 microphone. Hint: Monitor the Lpeak value during a trial measurement before selecting the Peak Recording Level Note: For recording in 2-channel templates the Peak Recording Level will automatically be set in accordance with the Input > Range Setting parameter (i.e., High Range or Low Range) 243 244 Hand-held Analyzer Types 2250 and 2270 – User Manual Table A.13 (Cont.) Signal Recording parameters* Parameter Values † Comment 0 to 470 s Recording is started the Pre-recording Time before the trigger conditions are fulfilled (for example, 5 s means the recording will be started 5 s before you hit the Manual Event pushbutton). This is possible because the recording is done continuously in an internal buffer, ready to be saved as a wave file. The Pre-recording Time is limited by this buffer size and the Recording Quality and Resolution (see details in the Specifications chapter) Post-recording Time † 0 to 1:00:00:00 Use this parameter to specify how much extra you want to be recorded after the trigger conditions are no longer fulfilled Duration Limit † On Use this parameter to enable the Minimum Duration and Maximum Duration parameters for overruling the duration of the signal recording determined by the trigger condition parameters Pre-recording Time Off Minimum Duration † 00:00:00 to 1:00:00:00 When Duration Limit is On, then Minimum Duration will determine the minimum recording time regardless of the trigger conditions The total record length will then (as a minimum) be the sum of Minimum Duration, Pre-recording Time and Post-recording Time Maximum Duration † 00:00:00 to 7:00:00:00 When Duration Limit is On, then Maximum Duration will determine the maximum recording time regardless of the trigger conditions. The total record length will then (as a maximum) be the sum of Maximum Duration, Pre-recording Time and Post-recording Time. Note: If Maximum Duration = 00:00:00, then it is disabled and does not limit the duration *. Requires license for Signal Recording Option BZ-7226. †. For Logging (BZ-7224) and Enhanced Logging (BZ-7225) templates only. ‡. For Enhanced Logging (BZ-7225) templates only. APPENDIX A Setup Parameters A.14 Output Socket Signal Table A.14 Output Socket Signal parameters* Parameter Source Values Microphone: Off Input X-weighted Input C-weighted Input Z-weighted LXF DC Voltage Generator Accelerometer and Direct: Comment Output to the Output socket on the connector panel. Select between Off and the input signal for monitoring purposes. The LAF setting will output the X-weighted sound level as a voltage between 0 V and 4 V. Use the DC Voltage parameter to calibrate the connected equipment by setting the DC Output. Use Generator parameter to output the signal specified by the Generator settings. Note 1: If you do not want to output the signal, then select Off to economise the power. Note 2: X = frequency weighting A or B. ‘A’ requires that the Broadband (excl. Peak) parameter is set to AC or AZ. ‘B’ requires that the Broadband (excl. Peak) parameter is set to BC or BZ. Note 3: The Generator setting is only available for Frequency Analysis templates Off Input Linear DC Output (20 mV/dB) 0.0 to 200.0 dB Source = DC Voltage will output: 0 V for DC Output = 0 dB and 4 V for DC Output = 200 dB Output Gain Input –60.0 dB to 60.0 dB Output gain of the input signal. Key in a gain value (0.1 dB resolution) for the input signal. Use ‘@’ to assign the new value for immediate response at the output – or use the up/down navigation keys to increment/decrement the value in steps of 1 dB. Note: 0 dB means 1 V output for 1 V input. *. Not available for Reverberation Time Software BZ-7227. 245 246 Hand-held Analyzer Types 2250 and 2270 – User Manual A.15 Lden Periods Table A.15 Lden Periods parameters* Parameter Values Comment Day Start 00:00:00 to 23:59:59 Determines the start of the day period for the Lday calculation Evening Start 00:00:00 to 23:59:59 Determines the start of the evening period for the Levening calculation Night Start 00:00:00 to 23:59:59 Determines the start of the night period for the Lnight calculation Evening Penalty 0 to 20 dB The Evening Penalty will be added to Levening when calculating Lden Night Penalty 0 to 20 dB The Night Penalty will be added to Lnight when calculating Lden *. For Enhanced Logging (BZ-7225) templates and microphone input only. Note: If Evening Start is set between Night Start and Day Start, then the Levening parameter will be undefined. A.16 Occupational Health Table A.16 Occupational Health Parameters* Parameter Values Comment Exposure Time 00:01:00 to 1.00:00:00 Set the Exposure Time to the actual time that you are exposed to noise during a workday. Used for calculation of Lep,d and Lep,d,v. Note: Exposure Time can be changed after the measurement has been done Reference Time 00:01:00 to 5.00:00:00 Set the Reference Time as required for calculation of Sound Exposure Level or Time Weighed Average with a reference time other than 8 hours. Used for calculation of Lep,d,v and TWAv Threshold Level 0 to 140 dB Any sound levels below the threshold value do not contribute to the Dose measurement data. The time resolution for this calculation is 1 s for calculation of Dose and ProjDose – and 10 ms for calculation of TWA, TWAv, DoseUQ and ProjDoseUQ. Used for calculation of Dose, ProjDose, TWA, TWAv, DoseUQ, ProjDoseUQ. U = Time Weighting for Lav: F or S Q = Exchange Rate for Lav: 4, 5 or 6 dB APPENDIX A Setup Parameters Table A.16 (Cont.) Occupational Health Parameters* Parameter Values Comment Criterion Level 0 to 140 dB Criterion Level is the sound level allowed for an 8-hour period and would yield a 100% dose. The criterion level must be set according to the legislation with which you will have to comply. Used for calculation of Dose, ProjDose, DoseUQ, ProjDoseUQ. U = Time Weighting for Lav: F or S Q = Exchange Rate for Lav: 4, 5 or 6 dB PeaksOver Level 0 to 200 dB Any peak levels that exceed the level set here will be counted. Used for calculation of #XPeaks(>NNNdB) X = A, B, C, Z or G, set by Setup > Frequency Settings > BB Peak, NNN is the PeaksOver Level Note: Two other peak counters are preset to count peaks over 135 dB and 137 dB, respectively Exchange Rate for Lav 4 dB The increase in noise level that corresponds to a doubling of the noise level is determined by Exchange Rate for Lav. Set Exchange Rate for Lav as required by your local standards. Used for calculation of LavUQ, TWA, TWAv DoseUQ, ProjDoseUQ. U = Time Weighting for Lav: F or S Q = Exchange Rate for Lav: 4, 5 or 6 dB Note: TWA and TWAv requires U = S and Q=5 5 dB 6 dB Time Weighting for Lav F S *. Not available for Reverberation Time Software BZ-7227. Lav will be time weighted in accordance with this parameter. Used for calculation of LavUQ, TWA, TWAv DoseUQ, ProjDoseUQ. U = Time Weighting for Lav: F or S Q = Exchange Rate for Lav: 4, 5 or 6 dB Note: TWA and TWAv requires U = S and Q = 5 247 248 Hand-held Analyzer Types 2250 and 2270 – User Manual A.17 Generator Table A.17 Generator Parameters* Parameter Generator Type Values Internal Comment Set to Internal to use the internal noise generator as specified below. External Set to External to switch an external generator on/off using a logic signal: On = 4.5 V; Off = 0 V. The generator signal appears at the Output Socket. Note 1: For Reverberation Time Software BZ-7227, set Measurement Control, Excitation = Interrupted Noise to enable the generator parameters. Note 2: For Frequency Analysis Software BZ-7223, set Output Socket Signal, Source = Generator to enable the generator parameters Noise Type Pink White The type of noise from the internal generator. The bandwidth of the noise will be adjusted to the frequency range from Bottom Frequency to Top Frequency Level [re. 1 V] –60.0 to 0.0 dB This sets the internal noise generator attenuation in dB, referenced to 1 V. This level stays at the set level irrespective of the frequency range Sound Source Unknown This setting optimises the frequency response of the internal generator output to the connected sound source. The ‘Flat’ setting optimises the output for a flat power response, the ‘Optimum’ setting optimises the power difference between adjacent 1/1- or 1/3-octave bands, while maintaining a ‘boost’ at low frequencies. Type 4292 Optimum Type 4295 Optimum Type 4296 Optimum Type 4292 Flat Type 4295 Flat Select a type matching your sound source: OmniPower Sound Source Type 4292 or 4296 or OmniSource Sound Source Type 4295. Type 4296 Flat Select Unknown if you are using another sound source, or don't want to correct the frequency response Escape Time 0 to 60 s Set the Escape Time to allow the operator to leave the room before the generator is turned on and the measurement starts APPENDIX A Setup Parameters Table A.17 (Cont.) Generator Parameters* Parameter Values Comment Build-up Time 1 to 20 s Set the Build-up Time to allow the sound pressure in the room to settle after the sound source is switched on Bottom Frequency† 50 Hz to Top Frequency 1/1-octave: 63 Hz – 8 kHz 1/3-octave: 50 Hz – 10 kHz Note: The settings of Bottom and Top Frequency control the bandwidth of the noise from the internal noise generator Top Frequency† Bottom Frequency to 10 kHz 1/1-octave: 63 Hz – 8 kHz 1/3-octave: 50 Hz – 10 kHz *. Available for Frequency Analysis Software BZ-7223, single channel, and Reverberation Time Software BZ-7227 and microphone input only. †. Available for Frequency Analysis Software BZ-7223 only. A.18 Post-processing Table A.18 Post-processing Parameters* Parameter Ensemble Averaging Values No Yes Comment Set to Yes to average each of the position decays into an average decay (called the ensemble average or room average). The averaged decays of the room can then be displayed in the Decay View. T30 Room, T20 Room and EDT Room will be calculated from the room average. Set to No for no ensemble averaging. There will be no decays available for the room. T30 Room, T20 Room and EDT Room will be calculated as averages of the T30, T20 and EDT, respectively, for all the positionsb 249 250 Hand-held Analyzer Types 2250 and 2270 – User Manual Table A.18 (Cont.) Post-processing Parameters* Parameter Wide Band RT Bottom Values 50 Hz to Wide Band RT Top Wide Band RT Top Wide Band RT Bottom to 10 kHz *. Requires Reverberation Time Software BZ-7227. Comment 1/1-octave: 63 Hz – 8 kHz 1/3-octave: 50 Hz – 10 kHz The settings of Wide Band RT Bottom and Wide Band RT Top control the range of frequency bands used in the averaging of the wide band parameters available below the Spectrum and Decay graphs. Example: Set Wide Band RT Bottom to 100 Hz and Top to 2 kHz, then the average of the frequency bands from 100 Hz to 2 kHz will be calculated for the current position as: • T30 (100 Hz – 2 kHz) • T20 (100 Hz – 2 kHz) • EDT (100 Hz – 2 kHz) and for the Room as: • T30 Room (100 Hz – 2 kHz) • T20 Room (100 Hz – 2 kHz) • EDT Room (100 Hz – 2 kHz) 1/1-octave: 63 Hz – 8 kHz 1/3-octave: 50 Hz – 10 kHz APPENDIX A Setup Parameters A.19 Tone Assessment Table A.19 Tone Assessment Parameters* Parameter Tone Assessment Values On Off Tone Standard ISO 1996:2-2007 Comment Set Tone Assessment to On to enable tone assessment functionality, then select the Tone parameter above the spectrum to display the results Set the Tone Standard in accordance with your requirements: DM 16-03-1998 ISO 1996:2-2007, Annex D is the objective method for assessing the audibility of tones in noise – simplified method. This method uses 1/3-octave spectra DM 16-03-1998 assesses tone using 1/3-octave spectra according to Italian Law: Ministero dell’Ambiente, Decreto 16 marzo 1998 Adjustment 0.0 to 20 dB This is the adjustment you should add to LAeq if audible tones are found in the spectrum. The resulting adjustment can be read below the spectrum Note: The adjustment is fixed to 5 dB in the DM 16-03-1998 standard Low Freq. Last Band 12.5 Hz to 315 Hz Set the frequency for the last band of the low frequency range of the assessment. Default is 125 Hz The low frequency range is from the lowest measured frequency band to the value of the Low Freq. Last Band parameter Note: Only available if Tone Standard parameter is set to ISO 1996:2-2007 Middle Freq. Last Band 160 Hz to 20 kHz Set the frequency for the last band of the middle frequency range of the assessment. Default is 400 Hz The middle frequency range is from one band higher than the Low Freq. Last Band parameter to the value of the Middle Freq. Last Band parameter Note: Only available if Tone Standard parameter is set to ISO 1996:2-2007 251 252 Hand-held Analyzer Types 2250 and 2270 – User Manual Table A.19 (Cont.) Tone Assessment Parameters* Parameter Values Level Difference Low 0.1 to 100.0 dB Set the required level difference for detecting a tone in the low frequency range. Default is 15 dB Note: Only available if Tone Standard parameter is set to ISO 1996:2-2007 Level Difference Middle 0.1 to 100.0 dB Set the required level difference for detecting a tone in the middle frequency range. Default is 8 dB Note: Only available if Tone Standard parameter is set to ISO 1996:2-2007 Level Difference High 0.1 to 100.0 dB Set the required level difference for detecting a tone in the high frequency range. Default is 5 dB Note: Only available if Tone Standard parameter is set to ISO 1996:2-2007 ISO 226 1987 Free-field The tone is checked against levels in other frequency bands using normal equal loudness level contours defined by ISO 226. Select here which version of the standard to use. Note: Only available if Tone Standard parameter is set to DM 16-03-1998 1987 Diffuse-field 2003 Free-field Comment *. Requires Tone Assessment Option BZ-7231. Available for microphone input only. 253 Appendix B Measurement Parameters This appendix describes the measurement parameters. They are measured in accordance with the setup parameters. • Please refer to the Glossary in Appendix E for a description of the parameters • The following letters are substituted in the parameters that follow to represent the wide range of frequency weightings, time weightings and percentile levels available: V = frequency weightings A, B, C or Z (controlled by Setup > Frequency Settings > BB Peak parameter) X = frequency weightings A or B (controlled by Setup > Frequency Settings > BB (excl. peak) parameter) Y = frequency weightings C or Z (controlled by Setup > Frequency Settings > BB (excl. peak) parameter) W = frequency weightings A, B, C, Z or G (controlled by Setup > Frequency Settings > Spectrum parameter) U = time weightings F or S (controlled by Setup > Statistics > Spectral Statistics based on parameter) R = time weightings F or S (controlled by Setup > Occupational Health > Time Weighting for Lav parameter) Q = exchange rate 4, 5 or 6 dB (controlled by Setup > Occupational Health > Exchange Rate for Lav parameter) N = number between 0.1 and 99.9 (controlled by Setup > Statistics > Percentile N parameter) Note: All parameters will be per channel in 2-channel templates unless stated otherwise (Type 2270 only). Hand-held Analyzer Types 2250 and 2270 – User Manual 254 B.1 Total Measurement (Microphone Input) B.1.1 For Sound Level Meter Software BZ-7222, Frequency Analysis Software BZ-7223, Logging Software BZ-7224 and Enhanced Logging Software BZ-7225 The following parameters are measured within the Elapsed Time: Equivalent Continuous Sound Levels • LXeq • LYeq • LCeq – LAeq • LAeq,T1,mov (not saved with data) • LAeq,T1,mov,max • LAeq,T2,mov (not saved with data) • LAeq,T2,mov,max • • • • • LCeq,T1,mov (not saved with data) LCeq,T1,mov,max LCeq,T2,mov (not saved with data) LCeq,T2,mov,max Leq,T1,mov (not saved with data) Leq,T1,mov,max Leq,T2,mov (not saved with data) Leq,T2,mov,max • • • Sound Exposure Level • LXE • LYE Peak Sound Level • LVpeak • TVpeak Maximum Time-weighted Sound Levels • LXFmax • LXSmax • LXImax • LYFmax • LYSmax • LYImax APPENDIX B Measurement Parameters Minimum Time-weighted Sound Levels • LXFmin • LXSmin • LXImin • LYFmin • LYSmin • LYImin ISO/EU Occupational Health Parameters • E • Dose • ProjDose • #VPeaks (>xxx dB) • #VPeaks (>137 dB) • #VPeaks (>135 dB) US Occupational Health Parameters • LavRQ • TWA • TWAv • DoseRQ • ProjDoseRQ General Parameters • Overload in % • Start time (common to both channels in 2-channel templates) • Stop Time (common to both channels in 2-channel templates) • Elapsed Time (excl. pauses; common to both channels in 2-channel templates) Special Parameters *. • LXIeq (also called LXIm) • LYIeq • LAIeq – LAeq • LAFTeq (also called LAFTm5) • LAFTeq – LAeq • SIL (average of LZeq octave band levels: 500 Hz, 1000 Hz, 2000 Hz and 4000 Hz)* • PSIL (average of LZeq octave band levels: 500 Hz, 1000 Hz and 2000 Hz)* • SIL3 (average of LZeq octave band levels: 1000 Hz, 2000 Hz and 4000 Hz)* • LWeq(f1 – f2) (sum of power values for LWeq frequency bands from f1 Hz to f2 Hz)* These parameters require license for BZ-7223 and measurement of spectra. 255 256 Hand-held Analyzer Types 2250 and 2270 – User Manual Noise Indicators* • Lday • Levening • Lnight • Lden • Ldn Statistics to Calculate Percentile Levels and Std.Dev. Low-frequency Parameters (requires Low Frequency Option BZ-7234) • LGeq • LG10max • LG10min • LGpeak • TGpeak • #GPeaks (>xxx dB) • #GPeaks (>137 dB) • #GPeaks (>135 dB) Weather Data (requires connection to a weather station; common to both channels in 2-channel templates) • Wind Dir. avg. • Wind Dir. min. • Wind Dir. max. • Wind Speed avg. • Wind Speed min. • Wind Speed max. • Amb. Temperature • Amb. Humidity • Amb. Pressure • Amb. Rain Gauge Spectrum Parameters† • LWeq • LWFmax • LWSmax • LWFmin • LWSmin Statistics to Calculate Percentile Levels as Spectra* *. †. These parameters are available for Enhanced Logging BZ-7225 only. These parameters require license for BZ-7223 and measurement of spectra. APPENDIX B Measurement Parameters 257 CIC Results • CIC 1 Result* • CIC 1 Dev. from Reference* • CIC 2 Result* • CIC 2 Dev. from Reference* • CIC 3 Result† • CIC 3 Dev. from Reference† • CIC 4 Result† • CIC 4 Dev. from Reference† In addition to the parameters saved within the data (listed above), the following can be inserted in a project annotation as a GPS Note: • Position as Latitude and Longitude • Altitude • Position error (dependant on type of GPS unit) B.2 Periodic Reports (Microphone Input) B.2.1 For Enhanced Logging Software BZ-7225 Parameters measured within a Periodic Report interval: Equivalent Continuous Sound Levels • LXeq • LYeq • LCeq – LAeq • LAeq,T1,mov,max • LAeq,T2,mov,max • • LCeq,T1,mov,max LCeq,T2,mov,max Leq,T,mov,max Leq,T,mov,max • • Sound Exposure Level • LXE • LYE Peak Sound Level *. †. • LVpeak • TVpeak These parameters are available for Logging BZ-7224 and Enhanced Logging BZ-7225 only. These parameters are available for Enhanced Logging BZ-7225 only. 258 Hand-held Analyzer Types 2250 and 2270 – User Manual Maximum Time-weighted Sound Levels • LXFmax • LXSmax • LXImax • LYFmax • LYSmax • LYImax Minimum Time-weighted Sound Levels • LXFmin • LXSmin • LXImin • LYFmin • LYSmin • LYImin ISO/EU Occupational Health Parameters • E • Dose • ProjDose • #VPeaks (>xxx dB) • #VPeaks (>137 dB) • #VPeaks (>135 dB) US Occupational Health Parameters • LavRQ • TWA • TWAv • DoseRQ • ProjDoseRQ General Parameters • Overload in % • Start time (common to both channels in 2-channel templates) • Stop Time (common to both channels in 2-channel templates) • Elapsed Time (excl. pauses; common to both channels in 2-channel templates) APPENDIX B Measurement Parameters 259 Special Parameters • LXIeq (also called LXIm) • LYIeq • LAIeq – LAeq • LAFTeq (also called LAFTm5) • LAFTeq – LAeq • SIL (average of LZeq octave band levels: 500 Hz, 1000 Hz, 2000 Hz and 4000 Hz)* • PSIL (average of LZeq octave band levels: 500 Hz, 1000 Hz and 2000 Hz)* • SIL3 (average of LZeq octave band levels: 1000 Hz, 2000 Hz and 4000 Hz)* • LWeq(f1 – f2) (sum of power values for LWeq frequency bands from f1 Hz to f2 Hz)* Statistics to Calculate Percentile Levels and Std.Dev. Low-frequency Parameters (requires Low Frequency Option BZ-7234) • LGeq • LG10max • LG10min • LGpeak • TGpeak • #GPeaks (>xxx dB) • #GPeaks (>137 dB) • #GPeaks (>135 dB) Weather Data (requires connection to a weather station; common to both channels in 2-channel templates) *. • Wind Dir. avg. • Wind Dir. min. • Wind Dir. max. • Wind Speed avg. • Wind Speed min. • Wind Speed max. • Amb. Temperature • Amb. Humidity • Amb. Pressure • Amb. Rain Gauge These parameters require license for BZ-7223 and measurement of spectra. Hand-held Analyzer Types 2250 and 2270 – User Manual 260 Spectrum Parameters* • LWeq • LWFmax • LWSmax • LWFmin • LWSmin The Statistics can be logged in Periodic Reports to Calculate Percentile Levels as spectra.* B.3 Logged Measurement (Microphone Input) B.3.1 For Logging Software BZ-7224 and Enhanced Logging Software BZ-7225 Parameters measured within a logging interval – up to ten (or all) of the following parameters can be logged: Equivalent Continuous Sound Levels • LXeq • LYeq • LCeq – LAeq • LAeq,T1,mov • LAeq,T2,mov • • • LCeq,T1,mov LCeq,T2,mov • Leq,T,mov Leq,T,mov Sound Exposure Level • LXE • LYE Peak Sound Level: • LVpeak Maximum Time-weighted Sound Levels • LXFmax • LXSmax • LXImax • LYFmax • LYSmax • LYImax APPENDIX B Measurement Parameters Minimum Time-weighted Sound Levels • LXFmin • LXSmin • LXImin • LYFmin • LYSmin • LYImin US Occupational Health Parameters • LavRQ Special Parameters • LXIeq (also called LXIm) • LYIeq • LAIeq – LAeq • LAFTeq (also called LAFTm5) • LAFTeq – LAeq • SIL (average of LZeq octave band levels: 500 Hz, 1000 Hz, 2000 Hz and 4000 Hz)* • PSIL (average of LZeq octave band levels: 500 Hz, 1000 Hz and 2000 Hz)* • SIL3 (average of LZeq octave band levels: 1000 Hz, 2000 Hz and 4000 Hz)* • LWeq(f1 – f2) (sum of power values for LWeq frequency bands from f1 Hz to f2 Hz)* Voltage updated at approx. 5 s intervals and logged with Logging Period intervals • Trig. Input Voltage (requires Trigger Input is set to Voltage for Monitoring) The following parameters are available per set of logged parameters • Overload in % • Start time (common to both channels in 2-channel templates) • Stop Time (common to both channels in 2-channel templates) • Elapsed Time (excl. pauses; common to both channels in 2-channel templates) The Statistics can be logged to calculate Percentile Levels and Std.Dev. per logging interval. Low-frequency Parameters (requires Low Frequency Option BZ-7234) *. • LGeq • LG10max • LG10min • LGpeak These parameters require license for BZ-7223 and measurement of spectra. 261 Hand-held Analyzer Types 2250 and 2270 – User Manual 262 Weather Data (requires connection to a weather station; common to both channels in 2-channel templates) • Wind Dir. avg. • Wind Dir. min. • Wind Dir. max. • Wind Speed avg. • Wind Speed min. • Wind Speed max. • Amb. Temperature • Amb. Humidity • Amb. Pressure • Amb. Rain Gauge Up to three (or all) of the following Spectrum parameters can be logged and displayed on the spectrum display:* • LWeq • LWFmax • LWSmax • LWFmin • LWSmin The Statistics can be logged in Periodic Reports to Calculate Percentile Levels as spectra.* B.4 Logged (100 ms) Measurement (Microphone Input) B.4.1 For Logging Software BZ-7224 and Enhanced Logging Software BZ-7225 The following Broadband parameters can be logged every 100 ms • LAeq • LAF • LAS Note: For 2-channel templates up to four of the six parameters from the two channels can be logged (Type 2270 only). *. These parameters require license for BZ-7223 and measurement of spectra. APPENDIX B Measurement Parameters B.5 Instantaneous Measured Parameters (available at any time; Microphone Input) Instantaneous Time-weighted Sound Levels • LXF • LXS • LXI • LYF • LYS • LYI Sound Pressure Levels (maximum time-weighted sound levels once per second) • LXF(SPL) • LXS(SPL) • LXI(SPL) • LYF(SPL) • LYS(SPL) • LYI(SPL) Peak Sound Levels (maximum peak sound level once per second) • LVpeak,1s Low-frequency Parameters (requires Low Frequency Option BZ-7234) • LG10 • LGpeak,1s Voltage updated at approx. 5 s intervals (common to both channels in 2-channel templates) • Trig. Input Voltage (requires Trigger Input is set to Voltage for Monitoring) Instantaneous Weather Data (common to both channels in 2-channel templates) • Wind Dir. • Wind Speed Instantaneous GPS Data (common to both channels in 2-channel templates) • Latitude • Longitude Instantaneous Measured Spectra:* *. • LWF • LWS These parameters require license for BZ-7223 and measurement of spectra. 263 Hand-held Analyzer Types 2250 and 2270 – User Manual 264 B.5.1 Processed Parameters for Display Only (Microphone Input) The following general parameter is available for display for Total data: Time Remaining (for the current measurement, taking available disk space into account). The following ISO/EU Occupational Health Parameters are calculated and displayed for Total, Periodic Reports and Logged data: Lep,d and Lep,d,v If Statistics are available, then Std.Dev. and 7 percentile levels can be calculated and displayed: LXN1 or LXUN1 to LXN7 or LXUN7. If spectral statistics are available, then 7 percentile levels as spectra can be calculated and displayed: LWUN1 to LWUN7. If LWeq spectrum is available, then NC, NC Decisive Band, NR, NR Decisive Band, RC, RC Classification, NCB, NCB Classification can be calculated and displayed. If LWeq 1/3-octave spectrum is available, then Loudness and Loudness Level can be calculated and displayed. For 2-channel templates: • Single values for display: – Ch.1 – Ch.2 LXeq – Ch.2 – Ch.1 LXeq – Ch.1 – Ch.2 LYeq – Ch.2 – Ch.1 LYeq • Spectra for display: – Ch.1 – Ch.2 LWeq – Ch.2 – Ch.1 LWeq B.6 Total Measurement (Accelerometer and Direct Input) B.6.1 For Sound Level Meter Software BZ-7222, Frequency Analysis Software BZ-7223, Logging Software BZ-7224 and Enhanced Logging Software BZ-7225 The following parameters are measured within the Elapsed Time: Linear Averaged Levels • Linear Peak Levels • Peak • TPeak APPENDIX B Measurement Parameters 265 Maximum Time-weighted Levels • Fast max • Slow max Minimum Time-weighted Levels • Fast min • Slow min General Parameters • Overload in % • Start time (common to both channels in 2-channel templates) • Stop Time (common to both channels in 2-channel templates) • Elapsed Time (excl. pauses; common to both channels in 2-channel templates) Special Parameters • Linear(f1 – f2) (sum of power values for Linear frequency bands from f1 Hz to f2 Hz)* Low Frequency Parameters (requires low frequency option BZ-7234 and accelerometer input) • aW • aWCrest • MTVV • KBFmax • KBFTm • PeakW Spectrum Parametersa • Linear (or aW; requires low frequency option BZ-7234 and accelerometer input) • Fast max • Slow max • Fast min • Slow min In addition to the parameters saved within the data (listed above), the following can be inserted in a project annotation as a GPS Note (common to both channels in 2-channel templates): *. • Position as Latitude and Longitude • Altitude • Position error (dependant on type of GPS unit) These parameters require a license for BZ-7223 and spectra measurement. Hand-held Analyzer Types 2250 and 2270 – User Manual 266 B.6.2 Periodic Reports (Accelerometer or Direct input) For Enhanced Logging Software BZ-7225 Parameters measured within a Periodic Report interval: Linear Averaged Levels • Linear Peak Levels • Peak • TPeak Maximum Time-weighted Levels • Fast max • Slow max Minimum Time-weighted Levels • Fast min • Slow min General Parameters • Overload in % • Start time (common to both channels in 2-channel templates) • Stop Time (common to both channels in 2-channel templates) • Elapsed Time (excl. pauses; common to both channels in 2-channel templates) Special Parameters • Linear(f1 – f2) (sum of power values for Linear frequency bands from f1 Hz to f2 Hz)* Low Frequency Parameters (requires low frequency option BZ-7234 and accelerometer input) • aW • aWCrest • MTVV • KBFmax • KBFTm • PeakW Spectrum Parameters* • *. Linear (or aW; requires low frequency option BZ-7234 and accelerometer input) • Fast max • Slow max • Fast min • Slow min These parameters require a license for BZ-7223 and spectra measurement. APPENDIX B Measurement Parameters B.6.3 267 Logged Measurement (Accelerometer or Direct input) For Logging Software BZ-7224 and Enhanced Logging Software BZ-7225 Parameters measured within a logging interval - up to five (or all) of the following parameters can be logged: Linear Averaged Levels • Linear Peak Levels • Peak Maximum Time-weighted Levels • Fast max • Slow max Minimum Time-weighted Levels • Fast min • Slow min General Parameters • Overload in % • Start time (common to both channels in 2-channel templates) • Stop Time (common to both channels in 2-channel templates) • Elapsed Time (excl. pauses; common to both channels in 2-channel templates) Special Parameters • Linear(f1 – f2) (sum of power values for Linear frequency bands from f1 Hz to f2 Hz)* Low Frequency Parameters (requires low frequency option BZ-7234 and accelerometer input) • aW • aWCrest • MTVV • KBFmax • KBFTm • PeakW Spectrum Parameters* *. • Linear (or aW; requires low frequency option BZ-7234 and accelerometer input) • Fast max • Slow max • Fast min • Slow min These parameters require a license for BZ-7223 and spectra measurement. Hand-held Analyzer Types 2250 and 2270 – User Manual 268 B.6.4 Logged (100 ms) Measurement (Accelerometer or Direct input) For Logging Software BZ-7224 and Enhanced Logging SoftwareBZ-7225 The following Broadband parameters can be logged every 100 ms • Linear • Fast Inst • Slow Inst Note: For 2-channel templates, up to four of the six parameters from the two channels can be logged (Type 2270 only) B.6.5 Instantaneous Measured Parameters (Available at Any Time; Accelerometer or Direct input) Instantaneous Time-weighted Levels • Fast Inst • Slow Inst Low Frequency Parameters (requires Low Frequency Option BZ-7234 and accelerometer input) • aW,1s • KBF Voltage updated at approx. 5 s intervals (common to both channels in 2-channel templates) • Trig. Input Voltage (requires Trigger Input is set to Voltage for Monitoring) Instantaneous GPS Data (common to both channels in 2-Ch. templates) • Latitude • Longitude Instantaneous Measured Spectra* *. • Fast Inst • Slow Inst These parameters require a license for BZ-7223 and spectra measurement. APPENDIX B 269 Measurement Parameters Processed Parameters for Display Only (Accelerometer or Direct input) The following general parameter is available for display for Total data: • Time Remaining (for the current measurement, taking available disk space into account) For 2-channel templates: • Single values for display: – Ch.1 – Ch.2 Linear – Ch.2 – Ch.1 Linear • Spectra for display: – Ch.1 – Ch.2 Linear – Ch.2 – Ch.1 Linear B.6.6 Relationship Between Setup and Measurement Parameters The measurement parameters are measured in accordance with the setup parameters. The following tables describe the relationship between the setup and measurement parameters: Table B.1 Parameter General parameters LXeq LXE LXIeq LAFTeq LVpeak TVpeak LXYmax LXYmin Sound Field Correction Windscreen Correction Low Frequency Broadband (excl. Peak) A Broadband Peak 270 Hand-held Analyzer Types 2250 and 2270 – User Manual Table B.2 Noise indicators and statistics Parameter Lday Levening Lnight Lden Ldn LXYN Sound Field Correction Windscreen Correction Low Frequency Broadband (excl. Peak) A A A A A Broadband Statistics based on Percentile N% Day Start Evening Start Night Start Evening Penalty Night Penalty APPENDIX B 271 Measurement Parameters Table B.3 Occupational health parameters Parameter Lep,d Lep,d,v E Dose ProjDose Sound Field Correction Windscreen Correction Low Frequency Broadband (excl. Peak) A A A A A A A A A A Broadband Peak Exposure Time Reference Time Threshold Level Criterion Level PeaksOver Level #VPeaks LavRQ TWA TWAv DoseProj(>NNNdB) RQ DoseRQ Exchange Rate for Lav 5 5 Time Weighting for Lav S S Hand-held Analyzer Types 2250 and 2270 – User Manual 272 B.7 Reverberation Time Measurement B.7.1 For Reverberation Time Software BZ-7227 The following parameters are measured or calculated at each position: Decays • Reverberation Decays (for each frequency band from Bottom Frequency to Top Frequency) based on sampling LZeq spectra at 5 ms intervals Spectra • T30 Spectrum • T20 Spectrum • EDT Spectrum Single Number Values • T30 (Wide Band RT Bottom – Wide Band RT Top) • T20 (Wide Band RT Bottom – Wide Band RT Top) • EDT (Wide Band RT Bottom – Wide Band RT Top) The following parameters are calculated for the room as an average of all positions: Decays • Ensemble Averaged Reverberation Decays (for each frequency band from Bottom Frequency to Top Frequency) Spectra • T30 Spectrum • T20 Spectrum • EDT Spectrum Single Number Values • T30 (Wide Band RT Bottom – Wide Band RT Top) • T20 (Wide Band RT Bottom – Wide Band RT Top) • EDT (Wide Band RT Bottom – Wide Band RT Top) Quality indicators are given for each frequency band, in each reverberation time spectrum, and for each reverberation time spectrum. Instantaneous Measured Parameters (available at any time) Instantaneous Time-weighted Sound Levels: • LAF • LCF Instantaneous Measured Spectra: • LZF 273 Appendix C Analyzer Parameters This appendix describes the parameters that are common to all users of the analyzer. C.1 Current Transducer Table C.1 Current Transducer parameters Parameter Values Comment Transducer (that is, connected to Top Socket) (Ch. 1 for Type 2270) Name and serial number of transducer This parameter selects which transducer is connected to the Top Socket (displayed in Setup > Input (Type 2250) or Setup > Input under Ch.1 (Type 2270) and at the top of Transducers Database) Transducer (that is, connected to Top Socket or Ch. 2 for Type 2270) Name and serial number of transducer Type 2270 only. This parameter selects which transducer is connected to the Top Socket or Ch. 2 (displayed in Setup > Input under Ch.2 and at the top of Transducers Database) Transducer (that is, connected to the Rear Socket/Ch. 1 of Type 2270) Name and serial number of transducer Type 2270 only. This parameter selects which transducer is connected to the Ch. 1 Rear Socket (displayed in Setup > Input under Ch.1 and at the top of Transducers Database) Hand-held Analyzer Types 2250 and 2270 – User Manual 274 Table C.1 (Cont.) Current Transducer parameters Parameter Values Comment Transducer (that is connected to Rear Socket or Ch. 2 of Type 2270) Name and serial number of transducer This parameter selects which transducer is used in the Rear Socket (displayed in Setup > Input (Type 2250) or Setup > Input under Ch.2 (Type 2270) and at the top of Transducers Database) Input (no text is displayed) Top Socket Determines whether the input is taken from the Top Socket, or the Rear Socket (‘Input’ on connector panel). Connect your transducer to this socket. This parameter is displayed in Setup > Input > and on the second line of the Transducers Database Rear Socket C.2 Transducer Database The Transducer Database consists of a Transducer Setup and a Calibration History – one set per transducer. C.2.1 Transducer Setup Table C.2 Transducer Setup parameters (for Microphone, Accelerometer or Direct, unless stat- ed otherwise) Parameter Values Comment Serial No. Text string Insert unique ID for transducer Name Text string Insert name of transducer to display together with serial number Description Text string Insert description of transducer Preamplifier ID No. Text string Document the preamplifier here APPENDIX C Analyzer Parameters Table C.2 275 (Cont.) Transducer Setup parameters (for Microphone, Accelerometer or Direct, unless stated otherwise) Parameter Values Comment 4189 4190 4191 4950 4955-A 4193 4193, UC-0211 4964 4964, UC-0211 4952 0 4952 90 4184-A 0 4184-A 90 EH-2152 0° EH-2152 90° Unknown Microphone only: If the microphone is a known type, then the rest of the parameters of the transducer are set automatically. Sound Field Correction and Windscreen Correction are possible for known microphone types only. Note: Microphone Types 4952 and 4184-A can be used with 0 reference direction or 90 reference direction. Accelerometer Type 4397-A 4513 4513-001 4513-002 4514 4514-001 4514-002 4533-B 4533-B-001 4533-B-002 4534-B 4534-B-001 4534-B-002 6233-C-10 8324 8341 8343 8347-C, 2647-D Unknown Accelerometer only: If accelerometer is a known type, then the rest of the parameters of the transducer are set automatically. For unknown accelerometer types, set the rest of the parameters. Nominal Sensitivity Double Set automatically for known type. Microphone Type For unknown microphone types, set the rest of the parameters – no corrections can be made for unknown types Note: If you are unsure which microphone to use, please refer to Table C.5, which gives an overview of the microphones, where they can be used and their specifications Otherwise set the nominal sensitivity in mV/Pa for microphones; in mV/(m/s2) for accelerometers; and in V/V for Direct input Polarization Voltage Yes No Microphone only: Set to No if microphone is prepolarized, otherwise set to Yes for polarization voltage of 200 V (Top Socket only). Set automatically for known Microphone Type Hand-held Analyzer Types 2250 and 2270 – User Manual 276 Table C.2 (Cont.) Transducer Setup parameters (for Microphone, Accelerometer or Direct, unless stated otherwise) Parameter Free-field Type Values Comment Microphone only: Set to Yes for Free-field types, otherwise set to No. Set automatically for known Microphone type Yes No Capacitance Double Microphone only: Insert capacitance of microphone in pF. Set automatically for known Microphone type CCLD Yes Set to Yes for CCLD (Constant Current Line Drive) transducers, otherwise set to No. No Set automatically for known Microphone or Accelerometer Type. Note: Set Input to Rear Socket. The CCLD input at the Rear socket will automatically be enabled when selecting a transducer requiring CCLD input Calibration Check Microphone only: For microphone Type 4184-A you can select to check the calibration of the system using CIC or Actuator – for all other microphone types the setting is preset to CIC. CIC Actuator Weight C.2.2 Accelerometer only: Insert weight of the accelerometer in g. Set automatically for known Accelerometer type Double Calibration History Table C.3 Calibration History parameters Parameter Values Comment 1. Calibration date & Time YYYY-MM-DD hh:mm:ss Initial 1. Sensitivity Double Initial mV/Pa 1. Preamplifier ID No. Text string Initial 1. User Text string Initial 1. Input Top Socket, Rear Socket Initial 1. Calibration Type External,Internal Initial 1. Calibrator Serial No. Text string Initial 1. Comment Text string Initial APPENDIX C Analyzer Parameters Table C.3 (Cont.) Calibration History parameters Parameter Values Comment 1. Analyzer Serial No. Text string 2. Calibration date & Time YYYY-MM-DD hh:mm:ss 2. Sensitivity Double 2. Preamplifier ID No. Text string 2. User Text string 2. Input Top Socket, Rear Socket 2. Calibration Type External,Internal 2. Calibrator Serial No. Text string 2. Comment Text string 2. Analyzer Serial No. Text string : : : N. Calibration date & Time YYYY-MM-DD hh:mm:ss Current N. Sensitivity Double Current N. Preamplifier ID No. Text string Current N. User Text string Current N. Input Top Socket, Rear Socket Current N. Calibration Type External,Internal Current N. Calibrator Serial No. Text string Current N. Comment Text string Current N. Analyzer Serial No. Text string Current C.3 Initial Calibration Setup Table C.4 Calibration Setup parameters Parameter (Sound Level) Calibrator Values 4231 Comment Select which calibrator to use Custom Calibration Level (for Custom Sound Level Calibrator) 0.00 to 200.00 dB re 20 µPa Set calibration level for custom calibrator Serial No. for 4231 Text string Serial number will be documented in calibration history 277 Hand-held Analyzer Types 2250 and 2270 – User Manual 278 Table C.4 (Cont.) Calibration Setup parameters Parameter Values Comment Serial No. for Custom Sound Level Calibrator Text string Serial number will be documented in calibration history (Acceleration) Calibrator 4294 4924--002 Custom Select which calibrator to use Calibration Level (for custom Acceleration Calibrator) 0 to 1000 m/s2 Set calibration level for custom calibrator. Note: When displaying acceleration levels as dB the reference will be 1 µm/s2 Serial No. for 4294 Text string Serial number will be documented in calibration history Serial No. for Custom Acceleration Calibrator Text string Serial number will be documented in calibration history Calibration Level (for Direct Input) 0 to 1000 V Set calibration level for Direct Input Note: When displaying voltage levels as dB the reference will be 1 µV Serial No. for Direct Input Calibrator Text string Serial number will be documented in calibration history C.4 Type 2250/2270 Microphones Table C.5 Microphone Overview of Type 2250/2270 Microphones Application Optimised For Dynamic Range* Free-field ±1 dB Frequency Range Free-field ±2 dB Frequency Range 4184-A Weatherproof Free Field 0 28.8 – 150 dB(A) 200 V or 90 Diffuse Field 3.6 Hz – 15.0 kHz† 6.6 Hz – 15.0 kHz 2.5 Hz – 16.5 kHz† 5.6 Hz – 16.5 kHz 4189 Standard Prepolarized Free Field Diffuse Field 16.6 – 140 dB(A) 6.8 Hz – 22.4 kHz† 7.8 Hz – 22.4 kHz 4.2 Hz – 22.4 kHz† 6.3 Hz – 22.4 kHz 4190 Standard 200 V Free Field Diffuse Field 16.5 – 140 dB(A) 4.0 Hz – 22.4 kHz† 6.7 Hz – 22.4 kHz 2.6 Hz – 22.4 kHz† 5.7 Hz – 22.4 kHz 4191 High Levels 200 V Free Field Diffuse Field 25.6 – 152 dB(A) 3.6 Hz – 22.4 kHz† 6.6 Hz – 22.4 kHz 2.5 Hz – 22.4 kHz† 5.6 Hz – 22.4 kHz 4193 Low Frequencies Low Frequencies 23.2 – 152 dB(A) 0.56 Hz – 22.4 kHz† 0.45 Hz – 22.4 kHz† 38.4 – 152 dB(Z)† 6.3 Hz – 22.4 kHz 5.5 Hz – 22.4 kHz APPENDIX C Analyzer Parameters Table C.5 Microphone 279 (Cont.) Overview of Type 2250/2270 Microphones Application Optimised For Dynamic Range* Free-field ±1 dB Frequency Range Free-field ±2 dB Frequency Range 4193 + UC-0211 Low Frequencies 200 V Low Frequencies Free Field Diffuse Field 37.8 – 142 dB(A) 0.38 Hz – 22.4 kHz‡ 0.28 Hz – 22.4 kHz‡ 39.1 – 142 dB(Z)‡ 4950 Standard Prepolarized Free Field Diffuse Field 16.4 –140 dB(A) 4.3 Hz – 19.0 kHz† 6.3 Hz – 19.0 kHz 3.2 Hz – 20.0 kHz† 5.6 Hz – 20.0 kHz 4952 Outdoor Prepolarized Free Field 0 20.0 – 141 dB(A) or 90 Diffuse Field 4.3 Hz – 14.0 kHz† 6.3 Hz – 14.0 kHz 3.2 Hz – 14.5 kHz† 5.6 Hz – 14.5 kHz 4952 + Outdoor EH-2152 Prepolarized Free Field 0 20.0 – 141 dB(A) or 90 Diffuse Field 4.3 Hz – 14.0 kHz† 6.3 Hz – 14.0 kHz 3.2 Hz – 14.5 kHz† 5.6 Hz – 14.5 kHz 4955-A Low Noise 200 V Free Field Diffuse Field 4.2 – 95 dB(A) 9.2 Hz – 19.0 kHz† 9.2 Hz – 19.0 kHz 6.0 Hz – 20.0 kHz† 7.0 Hz – 20.0 kHz 4964 Low Frequencies Prepolarized Low Frequency Free Field Diffuse Field 16.6 – 140 dB(A) 27.3 – 140 db(Z)† 0.6 Hz – 22.4 kHz† 6.0 Hz – 22.4 kHz 0.47 Hz – 22.4 kHz† 5.3 Hz – 22.4 kHz 4964 + UC-0211 Low Frequencies Prepolarized Low Frequency Free Field Diffuse Field 30.0 – 130 dB(A) 34.7 – 130 db(Z)‡ 0.35 Hz – 22.4 kHz‡ 0.28 Hz – 22.4 kHz‡ *. From the typical total inherent noise level for the microphone and Type 2250/2270, to the overload limit for a sinusoidal signal at 1 kHz. †. Type 2250/2270 Low Frequency set to Extended. ‡. Type 2250/2270 Low Frequency set to Very Low. Detailed specifications for the analyzer together with the different microphones are available. Please contact your local Brüel & Kjær representative if you need more information. The analyzer has correction filters to optimise the frequency response of each microphone. The relevant filter is automatically applied when you select the microphone for input, be it via the top socket, or the rear input socket. 280 Hand-held Analyzer Types 2250 and 2270 – User Manual Note for Microphone Type 4193 and Type 4964 Microphone Type 4193 is delivered with the Adaptor UC-0211; for Microphone Type 4964 it is ordered separately. Adaptor UC-0211 is only used when measurements are made on signals that contain components at frequencies below 1 Hz that should be included in the measurement. This is only for the Low Frequency parameter set to Very Low. It is not recommended to use the adaptor for other signals or settings because it reduces the dynamic range significantly. 281 Appendix D Preferences This appendix describes the unique set of parameters that can be set for each user on the analyzer. D.1 Display Settings For each colour scheme select the optimum choice of brightness for the traffic light and whether the backlight for the pushbuttons should be on or off. In addition, you can also change the number of decimal places on your dB results readout Table D.1 Display settings Parameter Values Colour Scheme Arcade Alhambra Indoor Outdoor Night Traffic Light Brightness Off Low Normal High Key Backlight Off On Backlight Brightness Minimum Level 2 Level 3 Level 4 Level 5 Maximum Comment Select between five colour schemes, one optimised for outdoor use in bright conditions and one optimised for very dark conditions Select backlight brightness using the backlight icon at the bottom of the screen. Maximum level uses the most power Hand-held Analyzer Types 2250 and 2270 – User Manual 282 Table D.1 (Cont.) Display settings Parameter Resolution of Readings Values Normal Extended D.2 Comment dB: Number of decimal places for values displayed: Normal, 1; Extended, 2 Engineering: Number of digits for values displayed: Normal, 3; Extended, 4 Note: This setting is for display only and has no effect on the measurement precision or resolution Power Settings Table D.2 Power settings Parameter Values Comment Backlight Dim After 30 sec. After 1 min. After 2 min. After 5 min. After 10 min Never Select optimum value for full backlight on (brightness determined by Backlight Brightness) before the backlight is dimmed (if analyzer is left untouched) Turn off Backlight After 1 min. After 2 min. After 5 min. After 10 min. After 30 min. Never Hardware versions 1 – 3 only: Select optimum value for how long the backlight is dimmed before it is switched off Standby After 1 min. After 2 min. After 5 min. After 10 min. After 30 min. Never Select optimum value for ‘on’ period before the analyzer is set automatically to standby Ext. Power Charge battery only Switch on and charge Hardware version 4 only: The Ext. Power setting determines whether the analyzer automatically switches on and charges when applied to external power or the analyzer just charges the battery. Hardware versions 1 – 3: This functionality is determined by a small, manual switch at the back of the analyzer. Remove the internal battery pack to access the switch Note: If the analyzer is externally powered, then the settings will be ignored. APPENDIX D Preferences D.3 Regional Settings Table D.3 Regional settings Parameter Values Comment Decimal Point . , Select your preferred decimal point Date separator – / . Select your preferred date separator Date Format yyyy-MM-dd HH:mm:ss dd-MM-yyyy HH:mm:ss MM-dd-yyyy HH:mm:ss yy-MM-dd hh:mm:ss XX dd-MM-yy hh:mm:ss XX MM-dd-yy hh:mm:ss XX Select your preferred date format: HH = 24 hour, hh = 12 hour, XX = AM or PM Time Zone GMT–12 GMT GMT+13 Select the time zone of your region Language English, ... A number of different languages are available for the analyzer. Hardware versions 1 – 3: Select your preferred language – if it is not on the list, then it might be available for installation using BZ-5503 Hardware version 4: All languages are installed Keyboard United Kingdom, ... 33 different keyboards. Select your preferred keyboard Wind Speed Unit SI or US/UK Select SI for m/s or US/UK for mph Temperature Unit SI or US/UK Select SI for °C or US/UK for °F Dimension Unit SI or US/UK Select SI for m or US/UK for ft Vibration Unit SI or US/UK Select SI for m/s2 or US/UK for g 283 Hand-held Analyzer Types 2250 and 2270 – User Manual 284 D.4 Storage Settings Table D.4 Storage Settings Parameter Auto-naming of Projects Values Comment Select Yes for automatically naming projects from the start date of the project as Year, Month, Date in the format YYMMDD, (for example, 051112 as 2005, November 12th) Yes No Select No for using the name defined in the Project Name Prefix parameter Project Name Prefix D.5 Prefix for automatically generated project name. Maximum 8 characters Text string Headphone Settings Table D.5 Headphone Settings Parameter Listen to signal Values No Input X-weighted Input C-weighted Input Z-weighted Comment In addition to the commentary annotations, you can listen to the input signal for monitoring purposes. Select one of the A-weighted, B-weighted, C-weighted or Z-weighted signals. Note 1: The frequency weighting of the signal you listen to can be selected independently of the frequency weighting of the measurement, the signal at the output socket and the signal used for signal recording Note 2: X = frequency weighting A or B. ‘A’ requires that the Broadband (excl. Peak) parameter is set to AC or AZ. ‘B’ requires that the Broadband (excl. Peak) parameter is set to BC or BZ APPENDIX D Preferences Table D.5 (Cont.) Headphone Settings Parameter Values Comment Automatic Gain Control On Off To ease identification of sound sources, the gain can be automatically adjusted to keep the average level within a 40 dB range. When playing back the recorded signal, you will then hear clearly the whole signal content, whether the level has been 20 dB or 140 dB. Set Automatic Gain Control to On to convert the signal at the headphone output. Set Automatic Gain Control to Off for listening to the signal with a fixed gain Gain for Meas.Signal – 80.0 dB to 60.0 dB for Automatic Gain Control set to Off Key in a gain value (0.1 dB resolution) for the measurement input signal. Use ‘@’ to assign the new value for immediate response at the output – or use the up/down navigation keys to increment/decrement the value in steps of 1 dB. Note: 0 dB means 1 V output for 1 V input (Automatic Gain Control set to Off) – 60.0 dB to 0.0 dB for Automatic Gain Control set to On Gain for Annotations – 60 dB to 60.0 dB Key in a gain value (1.5 dB resolution) for the commentary annotations. Use ‘@’ to assign the new value for immediate response at the output – or use the up/down navigation keys to increment/decrement the value in steps of 1.5 dB. Note: Maximum gain is limited to 0 dB for 16-bit wav-files 285 Hand-held Analyzer Types 2250 and 2270 – User Manual 286 D.6 Users Table D.6 Users Parameter Values Multi User D.7 Comment Enabled Set to Enabled to enable the Multi-user facility Disabled Set to Disabled if you are the only user Printer Settings Table D.7 Printer settings Parameter Printer Used Values Comment None Select None if you do not have a printer connected to the analyzer. MPS Select MPS for a Mobile Pro Spectrum thermal printer from AM-TECH. PCL Select PCL for a printer accepting PCL printer language. PCL Inkjet Select PCL Inkjet for an inkjet printer accepting PCL language. PCL Laser Select PCL Laser for a laser printer accepting PCL language. Seiko DPU Select Seiko DPU for the DPU-S245 or DPU-S445 thermal printer model from Seiko Instruments. See Chapter 8 for more details Top Margin 0.0 to 20.0 cm Use Top Margin to position the print on the paper Left Margin 0.0 to 20.0 cm Use Left Margin to position the print on the paper Width 1.0 to 15.0 cm Use Width to set the size of the print Height 1.4 to 20.0 cm Use Height to set the size of the print APPENDIX D Preferences D.8 Modem/DynDNS Settings Table D.8 Modem/DynDNS settings Parameter Modem Values Disabled GPRS/EDGE/HSPA Dialup Comment Set to Disabled if you do not have a modem connected; if you have connected a modem, but only want to use the SMS facility of the modem; or, when you physically connect or disconnect the modem. Set to GPRS/EDGE/HSPA Dialup if you have a GPRS/EDGE/HSPA modem connected and you want the analyzer to be connected to the Internet. See Chapter 7 and Chapter 8 for more details Dialup Networking APN (Access Point Name) Character string Access Point Name is an identifier required by the network operator. Examples are ‘Internet’, ‘public’ and ‘www.vodaphone.de’. Please consult your network operator User Name Character string Set User Name as required by your network operator. Typically this can be left empty Password Character string Set Password as required by your network operator. Typically this can be left empty Domain Character string Set Domain as required by your network operator. Typically this can be left empty No Set to Yes to make the update of the IP address at DynDNS.com active. DynDNS Active Yes Set to No if you do not use this service Hostname Character string Set the Hostname defined in your account at DynDNS.com User Name Character string Set the User Name for your account at DynDNS.com Password Character string Set the Password for your account at DynDNS.com. The password will be displayed until you press Enter, then it will be replaced by ‘***’ 287 Hand-held Analyzer Types 2250 and 2270 – User Manual 288 D.9 Network Settings Table D.9 Network settings Parameter Values Comment Location Up to 20 characters Use Location to specify a text identifying the analyzer or location of the analyzer. The Location will be displayed on the PC together with the serial number of the analyzer when browsing for analyzers in BZ-5503, and when connected using the online display Network Connection None Set to None if no Ethernet CF Card is present in CF Socket (Type 2250 only) CF Socket LAN Socket Set to CF Socket if Ethernet CF Card is present in CF Socket Set to LAN Socket if you want to use the built-in LAN Socket (Type 2270 only) Set IP Address Automatically Manually Set to Automatically to obtain an IP address from a DHCP server. If no server is available, then a Link-local address will be set Set to Manually to set the IP address, Subnet Mask, Default Gateway, Preferred DNS and Alternate DNS manually IP Address xxx.xxx.xxx.xxx The IP address of the analyzer Selectable if Set IP Address = Manually Subnet Mask xxx.xxx.xxx.xxx The Subnet Mask combined with the IP address identifies the network segment the analyzer is on Selectable if Set IP Address = Manually Default Gateway xxx.xxx.xxx.xxx Address to a gateway for routing to another network Selectable if Set IP Address = Manually Preferred DNS xxx.xxx.xxx.xxx The IP address of the primary DNS server Alternate DNS xxx.xxx.xxx.xxx The IP address of the secondary DNS server APPENDIX D Preferences Table D.9 (Cont.) Network settings Parameter Values Comment Name Up to 32 characters Name (SSID) of network you want to connect to. Update the name either by entering a name directly, or by tapping on the Available Networks and selecting a name from the list Security Open Select security as required by the network Shared Open and Shared are for WEP (Wired Equivalent Privacy) Infrastructure mode WPA PSK WPA2 PSK WPA PSK is for WPA (Wi-Fi Protected Access) with Pre-shared Key (also called Personal mode) WPA2 PSK – WPA2 is an enhanced version of WPA Encryption None Select Encryption as required by the network WEP Enabled None is for Open security AES Enabled TKIP Enabled WEP Enabled is for Open and Shared security AES Enabled and TKIP Enabled are for WPA PSK and WPA2 PSK Encryption Key Up to 32 characters Insert the encryption key required by the network. The key will be displayed until you press Enter, then it will be replaced by ‘***’ 289 290 Hand-held Analyzer Types 2250 and 2270 – User Manual D.10 Notification Settings Table D.10 Notification settings Parameter Notification Values Disabled E-mail SMS Comment Set to Disabled to disable notifications. Set to E-mail to send notifications as e-mail when an alarm occurs. Set to SMS to send notifications as SMS when an alarm occurs. See section 8.4 for the list of alarm types Daily Status Enable Disable Set to Enable to send a notification once per day Send at 00:00:00 to 23:59:59 Determines the time of day to send the daily status notification Internal Battery High Low Critical A notification is sent, if internal battery enters the set state Trigger Input Voltage –20.0 V to +20.0 V A notification is sent, if voltage level at trigger input drops to or below this setting. Note: This alarm requires Setup > Input > Trigger Input is set to Voltage for Monitoring Disk Space 0% to 100% A notification is sent, if free disk space drops to or below this setting Level Trigger Events Disabled Enabled A notification is sent, if Level Trigger (specified in Setup > Level Trigger in Logging Software or in Setup > Triggers in Enhanced Logging Software) is exceeded Report Level Notifications Disable Enable Set to Enable to send a notification when the measured LAeq for the latest Report Period exceeds Report Threshold Level (the functionality is only available when running the Enhanced Logging template) Report Threshold Level –100.0 dB to 200.0 dB A notification is sent when the measured LAeq (for Microphone input) or Linear (for Acceleration and Direct input) for the latest Report Period exceeds the set Report Threshold Level. Note 1: If you specify a very low Report Threshold Level you will receive a notification at the end of each Report Period Note 2: For 2-channel Enhanced Logging, the Report Threshold Level is for Ch.1 Alarm Settings APPENDIX D Preferences Table D.10 (Cont.) Notification settings Parameter Values Comment –100.0 dB to 200.0 dB A notification is sent when the measured Ch.2 LAeq (for Microphone input) or Linear (for Acceleration and Direct input) for the latest Report Period exceeds the set Report Threshold Level 2. Only used in 2-ch Enhanced Logging. To Character string The e-mail address of the recipient of the e-mail. Example: [email protected] SMTP Character string Name of SMTP (Simple Mail Transfer Protocol) Server.* Examples: gmail: smtp.gmail.com hotmail: smtp.live.com SMTP Port 0 to 65535 Port used by SMTP Server.a Typically this is 25, but for Gmail/Google Mail and Microsoft® Hotmail® it is 587 SSL/TLS No Yes Secure Socket Layer/Transport Layer Security. Set to Yes if required by e-mail providera, otherwise No. SSL/TLS is required by Gmail and Hotmail Account Character string The account is typically the e-mail address of the email used for sending the e-mail.a Examples: [email protected] [email protected] User Name Character string The User Name is typically the e-mail address of the e-mail used for sending the e-mail.a Examples: [email protected] [email protected] If the e-mail account is part of a domain, then it might be necessary to specify the domain as part of the user name Example: Domain\UserName Password Character string Insert the password required for the account.a The password will be displayed until you press Enter, then it will be replaced by ‘***’ Active No Yes Set to Yes to activate the first phone number, otherwise set to No Name Character string Name identifying first phone number Phone Number Number The number of the first SMS recipient Report Threshold Level 2 E-mail SMS 291 Hand-held Analyzer Types 2250 and 2270 – User Manual 292 Table D.10 (Cont.) Notification settings Parameter Values Comment Active No Yes Set to Yes to activate the second phone number, otherwise set to No Name Character string Name identifying second phone number Phone Number Number The number of the second SMS recipient *. Please consult your e-mail provider APPENDIX D Preferences D.11 Remote Access Settings Table D.11 Remote Access settings Parameter Web Server Values Disabled Enabled Comment Set Web Server to Enabled to enable display and control of the analyzer on a web page – see section 7.4. Set to Disabled to disable the web server functionality BZ-5503 Login Required Yes No Set to Yes to require user name and password for access to the instrument from BZ-5503 MPS or from the 2250/2270 SDK. Set to No for free access to the instrument. Note: If set to Yes, then you require BZ-5503 version 4.1 or higher to access the instrument User Name Character string Define the User Name required for full access to the web page, that is, view and control of the analyzer, and for access from BZ-5503 MPS and 2250/2270 SDK. Default: admin Password Character string Define the password required for full access to the web page, and for access from BZ-5503 MPS and 2250/2270 SDK. The password will be displayed until you press Enter, then it will be replaced by ‘***’. Default: admin Guest Login Required Yes Set to Yes to require user name and password for login to the guest web page. No Set to No for free access to the guest web page. Guest User Name Character string Define the User Name required for limited access to the web page, that is view of the analyzer only Default: guest Guest Password Character string Define the password required for limited access to the web page. The password will be displayed until you press Enter, then it will be replaced by ‘***’ Default: guest Note: The remote access parameters are common to all users of the analyzer. 293 294 Hand-held Analyzer Types 2250 and 2270 – User Manual D.12 Image Settings (Type 2270 only) Table D.12 Image settings (Type 2270 only) Parameter Image Control Values View Finder Manual Event Comment Set to View Finder to use the Viewfinder together with the Manual Event key to capture an image. The image can then be saved or rejected after capture Set to Manual Event to capture and save the image each time you press the Manual Event key D.13 NMT Server Settings (Hardware Version 4 only) For setup of NMT Server communication used by Noise Monitoring Software BZ-7232, see User Manual for Noise Monitoring Terminal Types 3639-A, B and C, BE 1818. 295 Appendix E Glossary A-weighting filter: Frequency weighting corresponding approximately to the 40 dB equal loudness curve, that is to say, the human ear’s response at low to medium sound levels. It is by far the most commonly applied frequency weighting and is used for all levels of sound. aWCrest: Crest factor given by PeakW/aW over the entire measurement period aW: Time-averaged (RMS) weighted acceleration value, averaged over the entire measurement period with frequency weighting Wm or Wmb aW,1s Maximum time-weighted acceleration value during the latest second with frequency weighting Wm or Wmb and 1 s exponential time constant B-weighting filter: Frequency weighting corresponding approximately to the 70 dB equal loudness curve, that is to say, the human ear’s response at medium sound levels. C-weighting filter: Frequency weighting corresponding to the 100 dB equal loudness curve, that is to say, the human ear’s response at fairly high sound levels. Mainly used when assessing peak values of high sound pressure levels. Criterion Level: Criterion Level is the maximum averaged sound level allowed for an 8-hour period. Used for calculation of Dose, ProjDose, DoseUQ and ProjDoseUQ, where U = F or S and Q = 4, 5 or 6 dB. 296 Hand-held Analyzer Types 2250 and 2270 – User Manual The measurement unit for expressing the relative intensity of sound. A direct application of linear scales (in Pa) to the measurement of sound pressure leads to large and unwieldy numbers. As the ear responds logarithmically rather than linearly to stimuli, it is more practical to express acoustic parameters as a logarithmic ratio of the measured value to a reference value. This logarithmic ratio is called a decibel or dB. The advantage of using dB can be clearly seen in the below illustration. Here, the linear scale with its large numbers is converted into a manageable scale from 0 dB at the threshold of hearing (20 Pa) to 130 dB at the threshold of pain (100 Pa). Our hearing covers a surprisingly wide range of sound pressures – a ratio of over a million to one. The dB scale makes the numbers manageable Decibel (dB): APPENDIX E Glossary Dose, ProjDose: DoseUQ, ProjDoseUQ: The Noise Dose is the equivalent averaged A-weighted Noise Level (taking the Threshold Level into account) using Exchange Rate = 3 for an 8 hour period (reference duration) relative to the maximum allowed (the Criterion Level) – expressed in percentage. Example: If the Criterion Level is 85 dB and a person is exposed to a constant sound pressure level of 85 dB for 8 hours, then the Dose is 100%. A constant level 88 dB results in a Dose of 200% and a constant level of 82 dB results in a dose of 50%. The Projected Dose is the Noise Dose based on measurement duration less than 8 hours, assuming the sound level for the remaining time stays the same. The Noise Dose is the averaged A-weighted Noise Level (taking the Threshold Level into account) with Time Weighting U = F or S and Exchange Rate Q = 4, 5 or 6 for an 8 hour period (reference duration) relative to the maximum allowed (the Criterion Level) – expressed in percentage. Example: If the Criterion Level is 90 dB and a person is exposed to a constant average sound level of 90 dB for 8 hours with Time Weighting S and Exchange Rate 5, then the DoseS5 is 100%. A constant level 95 dB results in a DoseS5 of 200% and a constant level of 85 dB results in a doseS5 of 50%. The Projected DoseS5 is the Noise DoseS5 based on measurement duration less than 8 hours, assuming the sound level for the remaining time stays the same. E: Sound Exposure is the energy of the A-weighted sound calculated over the measurement time. The unit is Pa2h. Exchange Rate: Exchange Rate is the increase in noise level that corresponds to a doubling of the noise level. The Exchange Rate is used for calculation of LavUQ, TWA, TWAv, DoseUQ and ProjDoseUQ, where U = F or S and Q = Exchange Rate: 4, 5 or 6 dB. Note: LAeq is always based on an Exchange Rate = 3. Exposure Time: Exposure Time is the actual time that a person is exposed to noise during a workday. Used for calculation of Lep,d and Lep,d,v. Fast Max: Maximum time-weighted acceleration or voltage level measured with Linear frequency weighting and Fast time weighting. It is the highest level occurring during the measurement time. Fast Min: Minimum time-weighted acceleration or voltage level measured with Linear frequency weighting and Fast time weighting. It is the lowest level occurring during the measurement time. ‘F’, ‘S’ or ‘I’ time weighting: A time weighting (sometimes called a ‘time constant’) defines how the exponential averaging in root-mean-square (RMS) measurement is done. It defines how the heavily fluctuating sound pressure variations are smoothed or averaged to allow useful readings. The standards define three time weightings: F (Fast), S (Slow) and I (Impulse). Most measurements are carried out using the ‘F’ time weighting, which uses a 125 ms time constant. 297 Hand-held Analyzer Types 2250 and 2270 – User Manual 298 Frequency: The number of pressure variations per second. Frequency is measured in hertz (Hz). The normal hearing for a healthy young person ranges from approximately 20 Hz to 20000 Hz (20 kHz). Frequency weighting: Our hearing is less sensitive at very low and very high frequencies. In order to account for this, weighting filters can be applied when measuring sound. The most commonly used weighting is the ‘A-weighting’, which approximates the human ear’s response to low – medium noise levels. A ‘C-weighting’ curve is also used, particularly when evaluating very loud or low-frequency sounds. Frequency weighting (cont.): Lp (dB) 0 A C –20 –40 –60 10 20 50 100 200 500 1k 2k 5k 10k 20k Frequency (Hz) 000055 G-weighting: Frequency weighting used for infrasound measurements. KBF: Instantaneous time-averaged acceleration level with Wm weighting and with 125 ms exponential time constant. Note: Wm weighting of the acceleration signal corresponds to using HKB weighting on the velocity signal, as defined in DIN 45669–1. KBFmax: Maximum of the KBF values KBFTm: Average of the values of KBFmaxi, where each KBFmaxi has been measured during 30 s. LAE: Sound Exposure Level – sometimes abbreviated SEL and sometimes called Single Event Level, is the Sound Exposure expressed as a level. The letter ‘A’ denotes that the A-weighting has been included. LAeq: A widely used noise parameter that calculates a constant level of noise with the same energy content as the varying acoustic noise signal being measured. The letter ‘A’ denotes that the A-weighting has been included and ‘eq’ indicates that an equivalent level has been calculated. Hence, LAeq is the A-weighted equivalent continuous noise level. APPENDIX E Glossary LXeq,T,mov and Leq,T,mov: Moving (or sliding) X-weighted average (equivalent continuous noise level) for the latest T minutes. Updated every second during measurement. The parameter can be used to monitor the average noise level within T minutes, for example, to monitor that the noise level during a music event doesn't exceed a certain limit at any 15 minutes of observation time during the event. The value is equal to LXeq at the start of the measurement as long as the elapsed time less than or equal to T. Two values with frequency weighting X = A and C are measured simultaneously. ∆Leq,T,mov is calculated as the difference between LCeq,T,mov and LAeq,T,mov LXeq,T,mov,max and Leq,T,mov,max: The maximum of the LXeq,T,mov values during the measurement, only taking values into account where elapsed time is greater than or equal to T. Two values with frequency weighting X = A and C are measured simultaneously. ∆Leq,T,mov,max is calculated as the difference between LCeq,T,mov,max and LAeq,T,mov,max LAF: The instantaneous time-weighted sound level, Lp, is available at any time. ‘A’ denotes that the A-frequency weighting is used. ‘F’ denotes that the Fast time-weighting is used. LAFmax: Maximum time-weighted sound level measured with A-frequency weighting and Fast time weighting. It is the highest level of environmental noise occurring during the measurement time. It is often used in conjunction with another noise parameter (for example LAeq) to ensure a single noise event does not exceed a limit. LAFmin: Minimum time-weighted sound level measured with A-frequency weighting and Fast time weighting. It is the lowest level of environmental noise occurring during the measurement time (time resolution is 1 s). LAF90.0: The noise level exceeded for 90% of the measurement period with Afrequency weighting and Fast time weighting. The level is based on statistical analysis of a parameter (LAF or LAS) sampled at 10 ms intervals into 0.2 dB wide classes. The percentage is user-definable. An analysis of the statistical distributions of sound levels is a useful tool when assessing noise. The analysis not only provides useful information about the variability of noise levels, but is also prominent in many standards as the basis for assessing background noise. For example, LAF90 is used as an indicator of background noise levels while LAF10 or LAF5 are sometimes used to indicate the level of noise events. The noise level exceeded for 90% of the measurement period with Afrequency weighting. The level is based on statistical analysis of LAeq sampled at 1 s intervals into 0.2 dB wide classes. The percentage is user-definable. LA90.0: LAF(SPL): The Sound Pressure Level (maximum time-weighted sound level during the latest second) is available at any time. 'A' denotes that the A frequency weighting is used. ‘F’ denotes that the Fast time-weighting is used. 299 Hand-held Analyzer Types 2250 and 2270 – User Manual 300 LAFTeq: Taktmaximal Mittelungspegel as defined by DIN 45641. LAFTeq has also been called LAFTm5 or LATm5F. LavUQ: Average Sound Level with Time Weighting U = F or S and Exchange Rate Q = 4, 5 or 6. This is a widely used occupational health noise parameter in the USA, corresponding to the LAeq used otherwise. LCpeak: Maximum peak sound level during a measurement. ‘C’ denotes that the C frequency weighting is used. Used for assessing possible damages to human hearing caused by very high short-duration noise levels. LCpeak,1s: Maximum peak sound level during the latest second – is available at any time. ‘C’ denotes that the C frequency weighting is used. Used for monitoring the peak levels. Lden, Lday, Levening, Lnight, Ln: Noise Indicators for describing the annoyance due to exposure to environmental noise. Lden (day-evening-night noise indicator), Lday (day-noise indicator), Levening (evening-noise indicator) and Lnight (night-noise indicator) are defined by the European Union. They are based on LAeq over different periods: Lday over the day period from 7:00 to 19:00, Levening over the evening period from 19:00 to 23:00, Lnight over the night period from 23:00 to 7:00 and Lden over the whole day with a penalty of 5 dB(A) for the evening period and a penalty of 10 dB(A) for the night period. Ldn (day-night level) is defined by the Environmental Protection Agency (EPA) in the USA as a descriptor of noise level based on LAeq over the whole day with a penalty of 10 dB(A) for night time noise (from 22:00 to 7.00). Lep,d: The Daily Noise Exposure Level is the average A-weighted noise exposure level for a nominal 8-hour working day. Lep,d is also known as LEX,8h. Lep,d is calculated from the measured LAE, the setting of Exposure Time and a Reference time of 8 h. Used for assessing the noise exposed to a worker during a working day – in accordance with ISO standards. The European Noise at Work Directive 2003/10/EC defines the following limit and action values: Exposure Limit Value: 87 dB Upper Exposure Action Value: 85 dB Lower Exposure Action Value: 80 dB. Lep,d,v: The Daily Noise Exposure Level for a user-defined reference period. Lep,d,v is calculated from the measured LAE and the settings of Exposure Time and Reference Time. Used, for example, for calculating a Weekly Noise Exposure Level, by setting the Reference Time to 40 h. APPENDIX E Glossary Loudness, Loudness Level: Loudness is the subjective judgement of intensity of a sound by humans. Loudness depends upon the sound pressure and frequency of the stimulus and whether the sound field is diffuse- or free-field. The unit is the Sone. Loudness Level = 10*log2(Loudness) + 40. The unit is the Phone. The Zwicker method of calculation of stationary loudness based on 1/3-octave measurements is described in ISO 532 -1975, Method B. Linear Weighting: ‘Linear’ frequency weighting is without any frequency weighting, that is, equivalent to LIN, Z or FLAT. Linear: Time-averaged (RMS) weighted acceleration (or voltage) value, averaged over the entire measurement period with frequency weighting Linear LGeq: The G-weighted equivalent continuous noise level – used to assess infrasound LGpeak: Maximum peak sound level with G-weighting LG10: Instantaneous time-weighted sound level with G-weighting and 10 s exponential time constant LG10max: Maximum time-weighted sound level measured with G-weighting and 10 s exponential time constant LG10min: Minimum time-weighted sound level measured with G-weighting and 10 s exponential time constant LW: aW expressed in dB with reference 10–6 m/s2. MTVV Maximum of the aW,1s values #CPeaks(>140dB): The number of 1 s peak sound levels over 140 dB. ‘C’ denotes that the C frequency weighting is used. Three peak counters are available – one with a user-definable value (set to 140 dB by default), one with 137 dB and one with 135 dB value. Used for assessing possible damage to human hearing caused by very high, shortduration, noise levels. The European Noise at Work Directive 2003/10/EC defines the following limit and action values: Limit Value: 140 dB corresponding to 200 Pa Upper Action Value: 137 dB corresponding to 140 Pa Lower Action Value: 135 dB corresponding to 112 Pa. 301 302 Hand-held Analyzer Types 2250 and 2270 – User Manual NC, NC Decisive Band: Noise Criteria is used to rate steady-state continuous noise in a room from all types of equipment, including fans, mixing boxes, diffusers, etc. The rating is determined from 1/1-octave LZeq spectra compared with NC curves (based on equal loudness curves). The NC rating is the value of the rating curve that falls entirely above the measured data. The Decisive Band is the frequency band ‘touching’ the NC curve. Defined in ANSI 12.2–2008 NCB, NCB Classification, Balanced Noise Criteria is a refinement of NC. Rumble, Hiss, RV: The rating is determined by the SIL value and gets the Classification (R) for Rumble, if the spectrum is rich in low frequency sound (16 Hz to 500 Hz), the Classification (H) for Hiss, if the spectrum is rich in high frequency sound (1 kHz to 8 kHz), or the Classification (RV) for Vibration and Rattle if the spectrum at low frequencies (16 Hz to 63 Hz) is likely to produce audible rattling in lightweight building elements. The details of the NCB rating are defined in ANSI S12.2-1995 NR, NR Decisive Band: Noise Rating rates noise levels at public or private indoor areas. The rating is determined from 1/1-octave LZeq spectra compared with NR curves (based on equal loudness curves). The NR rating is the value of the highest NR curve ‘touched’ by the measured spectrum. The Decisive Band is the frequency band ‘touching’ the NR curve. Defined in ISO R1996(1971) Occupational Health Standards: Typical Setup Parameter settings for Occupational Health measurements in accordance with various standards: • OSHA (Occupational Safety and Health Administration) – 29 CFR 1910.95 • MSHA (Mine Safety and Health Administration) – 30 CFR 62.0 UMHRPEL • DOD (Department of Defence) – DoD Instruction 6055.12 • ACGIH (American Conference of Government Industrial Hygienists) – DHHS Pub 98-126 • ISO – UK Noise at Work Regulations SI 1989/1790 amended by SI 1992/2966 and SI 1996/341 See the table below, but please also check your local legislation. Table E.1 Occupational Health Setup Parameters and Associated Standards Setup Parameters OSHA MSHA DOD ACGIH ISO Broadband (excl. Peak) A A A A A Broadband Peak Z Z Z Z C N/A N/A N/A 8:00:00 8:00:00 Reference Time (Preset) 8:00:00 8:00:00 8:00:00 8:00:00 8:00:00 Reference Time (user-definable) 40:00:00 40:00:00 40:00:00 40:00:00 40:00:00 80 80 80 80 70 Exposure Time Threshold Level APPENDIX E Glossary Table E.1 Occupational Health Setup Parameters and Associated Standards Setup Parameters OSHA MSHA DOD ACGIH ISO Criterion Level 90 90 85 85 85, 90 PeaksOver Level* 140 140 140 140 140 Exchange Rate for Lav 5 5 4 N/A N/A Weighting for Lav S S S N/A N/A *. This is user-definable – the two other ‘PeaksOver Level’ parameters are preset to 137 and 135 dB resp. Peak Maximum peak of the acceleration signal or voltage input with frequency weighting Linear PeakW Maximum peak of the acceleration value with frequency weighting Wm or Wmb Reference Time: Reference Time is used for calculation of Sound Exposure Level Lep,d,v or Time Weighed Average TWAv with a reference time other than 8 hours. RC, RC Classification: The Room Criterion Mark II is primarily a diagnostic tool for HVAC noise in spaces. The RC curve is chosen as the value of the PSIL, rounded to the nearest integer, in the range 25 RC 50. The RC classification is the combination of the Sound Quality Descriptor and the Probable Occupant Evaluation. The sound quality descriptor can display the values (N) for neutral, where no frequency range is dominant; (LF) for rumble, where the low-frequency range (16 – 63 Hz) is dominant; (MF) for roar, where the mid-frequency range (125 – 500 Hz) is dominant; and (HF) for hiss, where the high-frequency range (1000 – 4000 Hz) is dominant. Furthermore, there are two variations of (LF) if the spectrum in the low-frequency range is likely to introduce vibrations: (LFVA), where there are clearly perceptible vibrations and (LFVB), where there are moderately perceptible vibrations. The probable occupant evaluation describes how an occupant responds to a spectrum and can have the values Acceptable, Marginal or Objectionable. Described in the ASHRAE Handbook – HVAC 2011 and ANSI 12.2–2008. Room Criteria is for rating room noise SIL, PSIL, SIL3: SIL (Speech Interference Level) is the arithmetic average of the 500 Hz, 1 kHz, 2 kHz and 4 kHz octave band levels. PSIL (Preferred Speech Interference Level) is the arithmetic average of the 500 Hz, 1 kHz and 2 kHz octave band levels. Used for evaluating the interference of noise upon speech communication. SIL3 (Speech Interference Level based on highest 3 octaves) is the arithmetic average of the 1 kHz, 2 kHz and 4 kHz octave band levels. Note: Though SIL, PSIL and SIL3 are defined for octave band levels they are also calculated for 1/3-octave band levels by summing the power values in the three bands within each octave before doing the averaging. 303 Hand-held Analyzer Types 2250 and 2270 – User Manual 304 Slow Max Maximum time-weighted acceleration or voltage level measured with Linear frequency weighting and Slow time weighting. It is the highest level occurring during the measurement time. Slow Min Minimum time-weighted acceleration or voltage level measured with Linear frequency weighting and Slow time weighting. It is the lowest level occurring during the measurement time. Sound: Any pressure variation that the human ear can detect. Just like dominoes, a wave motion is set off when an element sets the nearest particle of air into motion. This motion gradually spreads to adjacent air particles further away from the source. Depending on the medium, sound extends and affects a greater area (propagates) at different speeds. In air, sound propagates at a speed of approximately 340 m/s. In liquids and solids, the propagation velocity is greater – 1500 m/s in water and 5000 m/s in steel. Sound level or sound pressure level: The level in decibels of the pressure variation of a sound. See also decibel. Std.Dev. The Std.Dev. is calculated as the Standard Deviation of the noise samples used for statistics. This is either LAF or LAS sampled every 10 ms, or LAeq sampled every second. TCpeak: The time when the peak sound level occurred. ‘C’ denotes that the C frequency weighting is used. Threshold Level: Any sound levels below the threshold level do not contribute to the Dose measurement data. For example, if you set the threshold level to 80, any sound levels below 80 dB are not taking into consideration by the analyzer, when it calculates doses and time weighted averages. Used for calculation of Dose, ProjDose, TWA, TWAv DoseSQ, ProjDoseSQ. TWA: The Time Weighted Average is the average A-weighted sound level for a nominal 8-hour working day with Time Weighting S and Exchange Rate 5. TWA is calculated from the measured LavS5 (taking Threshold Level into account) and a Reference time of 8 h. Mainly used in the USA for assessing the noise exposure for a worker during a working day. TWAv: The Time Weighted Average for a user-defined reference period. TWAv is calculated from the measured LavS5 (taking Threshold Level into account) and the Reference Time. Used, for example, for calculating a Weekly Time Averaged Level by setting the Reference Time to 40 h. APPENDIX E Glossary Underrange Immediate underrange indicates that the broadband sound level is below the lower limit of the Linear Operating Range and is indicated separately for the two selectable frequency weightings and for the two channels (Type 2270 only). Immediate underrange is only indicated on the screen. No underrange information is saved with the final result of the measurement. In case of an underrange indication (2-channel measurements, High Range only), change to Low Range. The underrange indication is implemented as required by ISO 61672–1:2013 and does not account for the influence of self-generated noise from the microphone because the specifications for the lower limit of the Linear Operating Range apply for measurements of electrical signal inserted into the preamplifier through the applicable input device. This makes the underrange indication a dubious indicator of the quality of the measurement, especially on the more sensitive ranges. Example 1: Und. A – Immediate underrange for the A-weighted levels Example 2: U1 AC – Immediate underrange in channel 1 for the A- and C-weighted levels Wm Frequency weighting as defined in ISO 8041:2005 – used for whole-body vibration in buildings, all directions Wmb The band-limiting part of the Wm filter Z-weighting: ‘Zero’ frequency weighting is without any frequency weighting, that is, equivalent to Linear, LIN or FLAT. 305 306 Hand-held Analyzer Types 2250 and 2270 – User Manual 307 Index Symbols #CPeaks(>140dB) .................................................. 301 Numerics 1/1- or 1/3-octave Frequency Analysis .................... 109 1/3-octave Method .................................................. 167 2647-D .................................................................... 275 2-channel Option BZ-7229 ...................................... 179 4184-A .................................................. 202, 209, 278 4189.......................................55, 202, 209, 275, 278 4190.......................................55, 202, 209, 275, 278 4191..............................................202, 209, 275, 278 4193.....................................202, 209, 275, 278, 279 4231.......................................................................... 52 4397-A .................................................................... 275 4513........................................................................ 275 4514........................................................................ 275 4533-B .................................................................... 275 4534-B .................................................................... 275 4950..............................................202, 209, 275, 279 4952..............................................202, 209, 275, 279 4952+EH-2152 .............................................. 202, 209 4955............................................................... 202, 209 4955-A ........................................................... 275, 279 4964..............................................202, 209, 275, 279 6233-C .................................................................... 275 7820................................................................... 36, 69 7825.......................................................................... 69 7831.......................................................................... 69 7841........................................................................ 153 8324........................................................................ 275 8341........................................................................ 275 8343........................................................................ 275 8347-C .................................................................... 275 A About Icon ................................................................. 97 About Menu................................................................. 3 Accelerometer Icon ................................................... 41 Accept Pushbutton ...................................................... 5 Accredited Calibration............................................. 107 Accredited/Traceable Calibration.............................. 57 Acoustic Calibration .................................................. 51 Adaptor AO-0657...................................................... 79 Adaptor for Standard Tripod........................................ 6 Adaptor UC-0211.................................................... 280 Add Image to Current Measurement .................. 28, 39 Add New Timer Icon.................................................. 95 Add Note to Current Measurement............................ 39 Adding Comments on Profiles................................. 128 Adding Notes on Profiles......................................... 128 Adjust Gain of Annotation.......................................... 78 Advanced use of the Analyzer Tips and Tricks .................................................... 73 Alarm Settings .......................................................... 86 Alhambra Colour Scheme......................................... 74 Alternative Measurement Method ............................. 16 Analyzer Assembling.......................................................... 14 Basic Principles ................................................... 36 Cleaning ............................................................ 106 Components .......................................................... 4 Display................................................................... 5 Get to Know......................................................... 31 Handling Instructions......................................... 106 Screen ................................................................... 5 Storing ............................................................... 106 Analyzer Parameters .............................................. 273 Analyzer Reset ............................................8, 12, 103 Annotating a Project ............................................................ 121 the Profile during Measurement ........................ 122 Annotations .............................................................. 65 Editing ............................................................... 128 Gain Adjustment.................................................. 78 In Reverberation Time....................................... 154 Inserting Annotations Using Explorer .................. 65 Inserting Using Explorer ...................................... 65 Paperclip Icon...................................................... 41 Profile ................................................................ 122 Hand-held Analyzer Types 2250 and 2270 – User Manual 308 Sound Categories ............................................. 128 Viewing or Listening to ........................................ 64 Annotations Icon ....................................................... 41 AO-0440 ..................................................................... 7 AO-0657 ................................................................... 79 AO-0697 ................................................................... 16 AO-0697 Microphone Extension Cable ....................... 9 AO-1476 ..................................................................... 7 Applications How to Update/Upgrade Them ........................... 97 Installing, Updating and Upgrading ..................... 97 Optional ............................................................... 97 Pre-installed ........................................................ 97 Temporarily Un-install ....................................... 100 Arcade Colour Scheme............................................. 74 Assembling your Analyzer .......................................... 3 Automatic Measurements ......................................... 94 Automatic Update of Software .................................. 98 Auxiliary Parameters in Reverberation Time Software........................ 159 Averaging Time ........................................................ 41 A-weighting.......................................................31, 295 B Back-erase Pushbutton ........................................5, 43 Backlight Dim............................................................ 75 Backlight Icon ...................................................42, 102 Bandwidth Parameters ........................................... 226 Basic Principles when using the Analyzer ................. 36 Battery Charge Indicator .......................................7, 11 Recalibration ..................................................... 102 Battery Icon ............................................................ 102 Battery Pack QB-0061 .............................................. 14 Troubleshooting ................................................ 102 Battery/power Status Icon...................................11, 42 Bottom F. for Special Leq Parameter ...................... 225 Broadband Frequency Weighting ............................. 24 Broadband View ....................................................... 23 Built-in Help .............................................................. 35 B-weighting............................................................. 295 BZ-5298.................................................................... 36 BZ-5503......... 28, 36, 49, 68, 81, 83, 97, 100, 105, 117, 137, 145, 167 BZ-5503-A Logging Post-processing Tools .............. 69 BZ-5503-B Spectrum Post-processing Tools ............ 69 BZ-7222.................................................................. 202 BZ-7222 Sound Level Meter Software ..................1, 32 BZ-7223 Frequency Analysis Software ........1, 33, 109 BZ-7224 Logging Software ..........................1, 34, 117 BZ-7225 Enhanced Logging Software .........1, 34, 131 BZ-7226 Signal Recording Option ........ 1, 20, 34, 137 BZ-7227 Reverberation Time Software........1, 34, 147 BZ-7229 2-channel Option........................1, 20, 34, 97, 179, 211, 217 BZ-7230 FFT Analysis Software ..............................167 BZ-7231 Tone Assessment Option....... 1, 20, 35, 167 C Calculating the Level Difference Between One Band and the Adjacent Bands....................169 Calibration.................................................................51 Accredited ..........................................................107 Acoustic ...............................................................51 Electrical ..............................................................54 Filter ...................................................................107 History..................................................................54 History Parameter ..............................................276 Initial...................................................................107 Manual .................................................................54 Regular Recalibration ........................................107 Screen..................................................................39 Settings ................................................................53 Standard ..............................................................52 Vibration...............................................................54 Calibration Interval ....................................................58 Calibration Reminder.................................................57 Calibration Reminder Tab..........................................57 Calibration Setup.....................................................277 Calibrator Sound Level .........................................................51 Camera .......................................................................6 Camera Icon..............................................................29 Card Slot CF ..........................................................................8 SD ..................................................................... 8, 9 Care, Cleaning and Storage ....................................106 CF Cards ...................................................................12 Recommended...................................................102 Slot.........................................................................8 Troubleshooting .................................................101 Character Keyboard ..................................................45 Charge Injection Calibration ............. 51, 58, 121, 134 CIC.....................................................................119 Charge Injection Calibration Parameter...................228 Charging the Battery for the First Time.......................14 CIC................................................... 51, 58, 121, 134 Theory..................................................................58 With Active Level Trigger ...................................134 CIC Ratio............................................................ 58, 59 CIC Ref. Date ............................................................59 CIC Reference Ratio .................................................59 CIC Result 1 ................................................... 121, 134 CIC Result 2 ............................................................121 CIC Result 4 ............................................................134 CIC Results .............................................................257 Cleaning the Analyzer .............................................106 Clock Display.............................................................42 Cold Start ..................................................................21 INDEX Colour Schemes........................................................ 74 Commentary Icon............................................... 41, 65 Commentary Pushbutton ..................................... 5, 27 Comments ................................................................ 65 Adding on Profiles.............................................. 128 Microphone ............................................................ 6 Compact Flash Card Slot.............................................................. 12 CF Cards ............................................................. 12 Modems ............................................................... 82 Compliance with Standards..................................... 219 Conformance Test Certificate.................................. 107 Connect RS–232 Modem G4 Hardware ....................................................... 82 Hardware 1–3 ...................................................... 82 Connect to a Printer ............................................................... 10 Analyzer............................................................... 84 Analyzer via Internet Browser.............................. 90 GPS Receivers .................................................... 90 Mobile Phone....................................................... 67 PC........................................................................ 67 Weather Stations ................................................. 90 Connecting Microphone Extension Cable............................... 16 Preamplifier and Measurement Microphone........ 15 Connector Triaxial LEMO ...................................................... 10 Connector Panel G 4 ......................................................................... 8 Hardware versions 1 – 3........................................ 7 Continuous Logging Parameter............................... 132 Controlling Measurements ..................................................... 42 the Frequency Analysis Measurement .............. 110 the Reverberation Time Measurement .............. 153 Conventions Used in this Manual ................................ 1 Copying Jobs/Projects .............................................. 63 Cover Hinged ................................................................... 6 Criterion Level ......................................................... 295 Crossover Cable ................................................ 83, 84 Current Transducer Parameter ............................... 273 C-weighting...................................................... 31, 295 D Daily CIC Parameter ............................................... 228 Daily Noise Exposure Levels (Lep,d) or (LEX,8h) ......... 32 Data Management..................................................... 61 Date Format .............................................................. 77 Date Separator.......................................................... 77 DDNS........................................................................ 82 Decay Graphs in Reverberation Time Software....... 159 Decay Tab in Reverberation Time Software ............ 159 Decay Time ............................................................. 147 309 Decibel (dB) ............................................................ 296 Decimal Places Number of.......................................................... 282 Decimal Point............................................................ 77 Default Measurement Job/Path ....................................... 63 Tone Assessment Measurement....................... 173 Definition of Frequency Ranges ....................... 59, 169 Definition of Reverberation Time............................. 147 Delete Timer Icon...................................................... 95 Delete/Reconfigure Templates and Users .............. 105 Deleting Jobs/Projects .............................................. 63 Description of Inputs/Outputs...................................... 7 Description of Jobs and Projects ............................... 61 DHCP ....................................................................... 83 Diffuse-field Icon ....................................................... 41 DIRAC Room Acoustics Software Type 7841.......... 153 Direct Input Icon........................................................ 41 Disconnecting Preamplifier and Measurement Microphone ....... 15 Display Enhanced Logging Results ............................... 134 Frequency Analysis Results ... 111, 182, 184, 187, 192, 195, 196 Locking ................................................................ 49 Logging Results................................................. 122 Reverberation Time Results.............................. 155 Tone Assessment Results................................. 175 Display Colour Schemes........................................... 74 Display Screen..................................................... 5, 40 Display Settings ........................................................ 74 Display Settings Parameter .................................... 281 Displaying Noise Indicators..................................... 135 DNS.......................................................................... 82 Document your Measurement................................... 26 Domain Name System .............................................. 82 Dose ....................................................................... 297 DoseUQ.................................................................. 297 Downgrade to an Earlier Version............................. 100 DSL Modem/Router .................................................. 82 Dual 10-pole Adaptor JP-1041 ............................. 9, 16 Duration Parameter ................................................ 237 Dynamic Domain Name System ............................... 82 Dynamic Host Configuration Protocol ....................... 83 DynDNS ................................................................... 82 DynDNS Settings............................................. 80, 287 E Earphone Socket ................................................. 7, 10 Economising On Power. ........................................... 78 Edit Mode........................................................... 46, 48 Editing Annotations on Profiles ............................... 128 EH-2152 ................................................................. 275 Elapsed Time............................................................ 41 E-mail Notifications ............................................ 86, 89 Hand-held Analyzer Types 2250 and 2270 – User Manual 310 Enhanced Logging Display Results ................................................. 134 Options .............................................................. 132 Set Up ............................................................... 132 With Tone Assessment ..................................... 177 Enhanced Logging Measurement Screen ............... 134 Enhanced Logging Software BZ-7225 ..............34, 101 Equivalent Continuous Sound Level ...................31, 32 Ethernet Cable.......................................................... 84 Ethernet Interface ..................................................... 83 Evaluator Type 7820...........................................36, 69 Event Marker .......................................................... 125 Exchange Rate ....................................................... 297 Exclude Marker......................................125, 126, 134 Explorer Screen ........................................................ 38 Exposure Time ....................................................... 297 Ext. Power ................................................................ 75 Ext. Power Setting .................................................... 76 Extended Microphone............................................... 16 External Event ........................................................ 138 External Power Socket...................................7, 11, 14 F f1 Parameter ........................................................... 240 f2 Parameter ........................................................... 240 Factory Default Resetting .....................................8, 12 Fast Time Weighting ................................................. 31 FB-0679 Hinged Cover ............................................... 6 FFT Analysis Software BZ-7230 ............................. 167 File Format ............................................................. 101 File Speed .............................................................. 101 Filter Calibration ..................................................... 107 First Check Parameter ............................................ 228 Formatting a Memory Card ..................................... 101 Fourth Check Parameter......................................... 228 Free-field Icon........................................................... 41 Frequency .............................................................. 298 Frequency Analysis 1/1- or 1/3-octave .............................................. 109 Display Results ............. 111, 182, 184, 187, 192, 195, 196 Set up................................................................ 109 Frequency Analysis Software BZ-7223 .............33, 109 Frequency Weighting.................................24, 31, 298 Frequency Weighting Parameters .......................... 224 Full Spectral Stat. for Reports Parameter ................ 227 Full View ................................................................... 46 G G 4 ..........................................................................3, 6 Connector Panel ................................................... 8 General Parameters .......................................255, 273 Generator Parameters........................................................ 248 Set Up ............................................................... 110 Glossary..................................................................295 Good Measurements.................................................14 GPS Data ..................................................................32 Instantaneous ............................................. 33, 263 GPS Note .................................................. 27, 92, 257 GPS Receiver............................................................28 GPS Receivers Connection...........................................................90 Types ...................................................................91 G-weighting.............................................................190 H Hand-held Analyzer...................................................32 Handling the Analyzer .............................................106 Hardware Maintenance ...........................................107 Hardware Overview...................................................13 Hardware Setup ........................................................13 Hardware Version................................................. 3, 35 1 – 3 .......................................................................7 4 ................................................................... 3, 6, 8 Headphone Settings......................................... 78, 284 Help...........................................................................35 Help Icon ............................................................ 35, 42 High Frequency Range............................................169 High Speed USB and LAN Interfaces...........................6 Hinged Cover FB-0679................................................6 Hiss .........................................................................302 Hold Off Parameter......................................... 133, 238 How Do We Measure Reverberation Time?.............148 How to Change Parameter Values.............................44 How to Install New Applications .................................97 How to Manage the Project Templates ......................47 How to Move a License............................................100 How to Update/Upgrade Applications ........................97 How to Use this Manual ...............................................1 Beginners...............................................................2 Experienced Users.................................................2 HT-0015 ......................................................................7 I Icon Annotations ..........................................................41 Backlight ..............................................................42 Battery/power Status............................................42 Commentary ........................................................41 Help............................................................... 35, 42 Input Microphone Parameter ...............................41 Loudspeaker ........................................................27 Main Menu ...........................................................42 No Windscreen Fitted ..........................................41 Overload ..............................................................41 Pause...................................................................41 PC ........................................................................41 Power Supply Connected ....................................42 Running................................................................41 INDEX Stopped ............................................................... 41 Text...................................................................... 27 Transducers......................................................... 41 Windscreen Fitted/Diffuse Field........................... 41 IEC 61672–1 standard............................................... 14 Image Adding ................................................................. 28 Adding to Current Measurement.......................... 39 View ..................................................................... 29 Image Event ............................................................ 138 Image Icon ................................................................ 65 Image Settings (Type 2270 only) ............................. 294 Impulse Time Weighting............................................ 31 Impulse Trigger Parameter...................................... 231 Impulsive Method .................................................... 152 Reverberation Time ........................................... 150 Indicator, Status .......................................................... 5 Indoor Colour Scheme .............................................. 74 Initial Calibration...................................................... 107 Initial Sound Level Meter Screen ............................... 21 Input..................................................................... 7, 11 Input 1 ....................................................................... 11 Input Ch. 1 for Type 2270......................................... 222 Input Ch. 2 for Type 2270........................................... 11 Input for Microphone ................................................... 9 Input Microphone Parameter Icon .................................................... 41 Input Parameters Channel 1 for Type 2270 ................................... 222 For Type 2250 ................................................... 222 For Type 2270 ................................................... 222 Inserting Annotations Using Explorer ........................ 65 Install Applications ......................................................... 97 Language............................................................. 77 Install Language........................................................ 97 Instantaneous GPS Data ................................................... 33, 263 Measured Spectra ............................................. 263 Peak Sound Levels.............................................. 33 Sound Pressure Level ....................................... 263 Time-weighted Sound Levels ..................... 33, 263 Weather Data.............................................. 33, 263 Instantaneous Measured Parameters .............. 33, 263 Internal Battery Pack ................................................... 6 Internet Browsers Connection via ..................................................... 90 Supported ............................................................ 90 Interrupted Noise Method........................................ 152 Reverberation Time ........................................... 148 Introduction ................................................................. 1 ISO 1996-2, Annex D Tone Assessment Calculations ......................... 168 ISO/EU Occupational Health Parameters....... 255, 258 311 J Javascript Support .................................................... 90 Jobs.......................................................................... 61 JP-1041 ...................................................................... 9 L LA90.0 ...................................................................... 299 LAE................................................................... 32, 298 LAeq ................................................................. 32, 298 LAeq,T,mov......................................................... 32, 299 LAeq,T,mov,max .................................................. 32, 299 LAF ...........................................................33, 263, 299 LAF(SPL) .................................................................. 299 LAF90.0 .................................................................... 299 LAFmax ............................................................. 32, 299 LAFmin ..................................................................... 299 LAFTeq ..................................................................... 300 LAN Connection........................................................ 83 LAN Interface.............................................................. 6 LAN Socket.......................................................... 8, 12 Languages................................................................ 77 Install ................................................................... 97 Last Calibration Date ................................................ 57 Latitude..................................................................... 28 LavS5 ......................................................................... 32 LavUQ ...................................................................... 300 LCpeak .............................................................. 32, 300 LCpeak,1s .......................................................... 33, 300 Lday ......................................................................... 300 Lden ......................................................................... 300 Lden Periods........................................................... 246 Lep,d ........................................................................ 300 Lep,d,v...................................................................... 300 Leq ............................................................................ 31 Level Average with Exchange Rates 4, 5 or 6 ............................ 32 Level Event Marker ................................................. 126 Level Trigger 1 Parameters..................................... 238 Level Trigger 2 Parameters..................................... 240 Level Trigger 3 Parameters..................................... 240 Level Trigger 4 Parameters..................................... 240 Level Trigger Parameters ....................................... 235 Level Triggers ......................................................... 133 Levening ................................................................... 300 License Mover VP-0647.......................................... 100 Licenses ................................................................... 97 How to Move Them ........................................... 100 Link-local .................................................................. 83 Listening to Annotations............................................ 64 Ln ............................................................................ 300 Lnight ....................................................................... 300 Locking Pushbuttons and Display..................................... 49 the Template ....................................................... 47 Logged Broadband (100 ms) Parameters ............... 231 Hand-held Analyzer Types 2250 and 2270 – User Manual 312 Logged Broadband Parameters.............................. 231 Logged Measurement Parameters Broadband Parameters ..................................... 262 Equivalent Continuous Sound Levels ............... 260 For Enhanced Logging Software...............260, 262 For Logging Software ................................260, 262 Maximum Time-weighted Sound Levels ........... 260 Minimum Time-weighted Sound Levels ............ 261 Parameters Available Per Logging Interval ....... 261 Parameters to be Logged and Displayed on Spectrum Display .............................................. 262 Sound Exposure Level ...................................... 260 Special Parameters ........................................... 261 Logged Spectrum Parameters ................................ 233 Logging................................................................... 117 Display Results ................................................. 122 Options .............................................................. 117 Set Up ............................................................... 118 With Signal Recording....................................... 140 With Tone Assessment ..................................... 176 Without Frequency Analysis Software .............. 118 Logging Period Parameter ...................................... 227 Logging Post-processing Tools BZ-5503-A .............. 69 Logging Software BZ-7224 ......................34, 101, 117 Longitude.................................................................. 28 Loudness........................................................114, 301 Loudness Level ..............................................114, 301 Loudness Parameter .............................................. 222 Loudspeaker Icon .............................................27, 152 Low Frequency ............................. 256, 259, 261, 263 Low Frequency Option.............................................. 20 Low Frequency Option BZ-7234 ............................. 189 Low Frequency Range............................................ 169 Low-frequency.............................. 256, 259, 261, 263 LWeq ......................................................259, 261, 264 LWeq(f1-f2) .............................................232, 259, 261 LWUN1 Parameter ................................................. 264 LWUN7 Parameter ................................................. 264 LXE.......................................................................... 232 LXeq(f1-f2).......................................................114, 133 LXN1 Parameter ..................................................... 264 LXN7 Parameter ..................................................... 264 LXUN1 Parameter .................................................. 264 LXUN7 Parameter .................................................. 264 LYE.......................................................................... 232 LZeq ........................................................................ 114 M Main Menu Icon ....................................................5, 42 Main Spectrum Icon ................................................ 111 Mains Power Supply .............................................7, 14 Making your First Measurement................................ 19 Manual Event.......................................................... 138 Manual Event Marker.............................................. 126 Manual Event Pushbutton........................................... 5 Manual Ext. Power Switch .........................................76 Map Based Measurement Parameter ......................229 Maps in Reverberation Time Software.....................161 Markers ................................120, 124, 125, 234, 241 Editing ................................................................127 Event..................................................................125 Exclude ..............................................................125 Level Event ........................................................126 Sound.................................................................126 Use of Pushbuttons............................................126 With Types 7820 and 7825 ................................126 Marking Sound Categories ......................................125 Maximum Time-weighted Sound Levels ....................32 Measurement Control Parameters for BZ-7222 to BZ-7225 .....................................227 for Reverberation Time Software BZ-7227 ........229 Measurement Feedback in the Status Field ...............23 Measurement Microphone...........................................5 Connecting...........................................................15 Disconnecting ......................................................15 Mounting the ........................................................15 Placing the ...........................................................14 Measurement Mode Parameter........................ 24, 227 Measurement Parameters.......................................253 Measurement Partner Suite BZ-5503 ......... 28, 36, 49, 68 ,97, 100, 105, 117, 137, 167 Measurements ..........................................................20 Alternative Method ...............................................16 Convenient...........................................................17 Default Job/Path ..................................................63 Documenting........................................................26 Making your First .................................................19 Organising............................................................61 Preparing .............................................................92 Recalling ..............................................................64 Reset............................................................... 5, 42 Saving ..................................................................25 Serial..................................................................153 Tone Assessment ..............................................175 with Graphical Position Management ................161 Memory Devices Formatting..........................................................101 Metadata ...............................64, 65, 92, 93, 94, 205 Metadata Tab ............................................................65 Micro USB ...................................................................8 Microphone Extension Cable.....................................................9 Measurement .........................................................5 Mounting ..............................................................17 Secondary..............................................................6 Type 4189 ..............................................................9 Type 4193 ..........................................................280 Microphone Extension Cable Connecting...........................................................16 Microphone for Commentary .......................................6 INDEX Microphone Holder UA-1317..................................... 17 Microphone Input ........................................................ 9 Microphone Type Parameter................................... 275 Microphones Connecting Two Microphones ............................. 16 Overview for Type 2250/2270............................ 278 Mid Frequency Range ............................................. 169 Mini USB ..................................................................... 7 Minijack Earphone Socket......................................... 10 Minimum Time-weighted Sound Levels................... 255 (LAFmin) ................................................................ 32 MM-0256................................................................... 90 MM-0316................................................................... 90 Mobile Phone Connection ......................................... 67 Modem Settings ...................................... 80, 287, 294 Modems RS–232 Interface................................................. 81 Settings................................................................ 80 Tested.................................................................. 80 USB Interface ...................................................... 81 Mounting Analyzer............................................................... 15 Measurement Microphone ................................... 15 Microphone .......................................................... 17 Outdoor Microphone Kit....................................... 16 Windscreen.......................................................... 15 Mounting Thread For Wrist Strap....................................................... 6 Tripod .................................................................... 6 Moving Equivalent Continuous Sound Level .... 32, 299 Moving Jobs/Projects ................................................ 63 MPS .......................................................................... 80 Multi-user Facility ...................................................... 79 N Navigating in Jobs ..................................................... 62 Navigation Principles Star Navigation Concept...................................... 36 Navigation Pushbuttons ....................................... 5, 44 NC Decisive Band Parameter.................................. 264 Definition............................................................ 302 NC Parameter ................................................ 114, 264 Definition............................................................ 302 NCB Classification Parameter................................. 264 Definition............................................................ 302 NCB Parameter.............................................. 114, 264 Definition............................................................ 302 Network Connection.................................................. 67 Network Settings .............................................. 83, 288 Parameters .......................................................... 84 New Applications How to Install Them ............................................. 97 New User Set Up ....................................................... 79 Next Calibration Date ................................................ 57 Night Colour Scheme ................................................ 74 313 NMT Server Settings............................................... 294 No Windscreen Fitted/Diffuse Field Icon ................... 41 No Windscreen Fitted/Free-field Icon........................ 41 No Windscreen Icon.................................................. 41 Noise Curve ............................................................ 114 Noise Dose (Dose, DoseS5) ..................................... 32 Noise Indicators ...................................................... 256 Noise Parameters ................................................... 114 Nominal Sensitivity ................................................... 56 Notes ........................................................................ 65 Add Note to Current Measurement ..................... 27 Adding on Profiles ............................................. 128 Adding to Current Measurement ......................... 39 Notes Screen ............................................................ 92 Notifications.............................................................. 86 Content................................................................ 88 Settings ............................................................. 290 NR Decisive Band Parameter ................................. 264 Definition ........................................................... 302 NR Parameter................................................ 114, 264 Definition ........................................................... 302 Number Keyboard..................................................... 45 Number of Decimal Places...................................... 282 Number of Peaks (#CPeaks(>140 dB)) ..................... 32 O Occupational Health Parameters ............................ 246 Occupational Health Standards .............................. 302 On-screen Feedback ................................................ 43 Ordering Information............................................... 216 Organising Measurements........................................ 61 Outdoor Colour Scheme ........................................... 74 Outdoor Microphone Kit ............................................ 16 Mounting.............................................................. 16 Output......................................................................... 7 Output of Headphone Socket .................................... 78 Output Socket ........................................................... 10 Output Socket Signal Parameters ........................... 245 Overload Icon ........................................................... 41 Overload Parameter ............................................... 232 Overview of Smileys.......................................................... 115 of Type 2250/2270 Microphones....................... 278 Overview Tab in Reverberation Time Software ....... 155 Overwriting a Locked Template................................. 47 P Padlock Icon ............................................................. 47 Paperclip .................................................................. 41 Parallel Measurements ........................................... 153 Automated Sequence........................................ 154 Parameters Analyzer ............................................................ 273 General.............................................................. 273 Password........................................................... 47, 90 314 Hand-held Analyzer Types 2250 and 2270 – User Manual Pasting Jobs/Projects ............................................... 63 Pattern Evaluation .................................................. 199 Pause Icon................................................................ 41 PC Connection ......................................................... 67 PC Icon ..................................................................... 41 PCL .......................................................................... 80 Peak Sound Levels ...........................................32, 263 Percentile Levels (LAF90.0) ........................................ 32 Performing a Manual CIC Calibration........................ 59 Periodic Report Parameters Equivalent Continuous Sound Level ................. 257 General Parameters .......................................... 258 Maximum Time-weighted Sound Levels ........... 258 Minimum Time-weighted Sound Levels ............ 258 Peak Sound Level ............................................. 257 Sound Exposure Level (LAE)............................. 257 Special Parameters ........................................... 259 Spectrum Parameters ....................................... 260 Periodic Reports .............................................131, 257 Placing the Measurement Microphone...................... 14 Point and Shoot ........................................................ 19 Polarization Voltage Parameter ........................56, 275 Position..................................................................... 28 Post-processing and Reporting................................. 69 Post-processing Parameters ..........................249, 251 Power Consumption ................................................. 75 Power Off.................................................................. 30 Power Settings ..........................................75, 76, 282 Power Settings Screen ............................................. 75 Power Supply Connected Icon ............................11, 42 Power-on Pushbutton ................................................. 5 Preamplifier ..........................................................5, 15 Connecting .......................................................... 15 Disconnecting...................................................... 15 Preferences ............................................................ 281 Preferences Screen ............................................38, 73 Prepare Measurements ............................................ 92 Printer Settings ....................................................... 286 Profile View............................................122, 124, 135 Status Field ....................................................... 123 ProjDose................................................................. 297 ProjDoseUQ ........................................................... 297 Project Name ............................................................ 61 Project Template ...................................................... 20 Edit Mode ............................................................ 48 Enhanced Logging .............................................. 20 Frequency Analysis ............................................. 20 Logging ............................................................... 20 Re-create ............................................................ 49 Sound Level Meter ........................................20, 21 Project Template Bar ................................................ 40 Projects .................................................................... 61 Protector Type 7825 ..................................................69 PSIL ...................................................... 114, 232, 303 PULSE Multi-analyzer ...............................................69 Pushbuttons Accept ....................................................................5 Back-erase...................................................... 5, 43 Commentary ................................................... 5, 27 Locking.................................................................49 Manual Event .........................................................5 Navigation ..............................................................5 Power-on................................................................5 Reset Measurement........................................ 5, 42 Save.............................................................. 25, 43 Start/Pause .............................................. 5, 22, 42 Store ......................................................................5 Use of...................................................................45 Q Qualifier Light Type 7831...........................................69 Quality Indicators In Frequency Analysis Software ........................115 In Reverberation Time Software ........................165 In Tone Assessment Software ...........................177 Quick Start Guide ......................................................19 Quick View ................................................................46 R Range Setting............................... 180, 192, 195, 196 RC Classification .....................................................303 RC Classification Parameter ...................................264 RC Parameter ................................................ 114, 264 Definition ............................................................303 Rear Socket...................................... 11, 56, 100, 274 Recalibration of Battery Charge Indicator ................102 Recalling Measurements .....................................................64 Saved Measurements ............. 178, 182, 184, 187 Recording Icon ........................................................139 Recording Signals .......................................... 122, 137 Re-create Deleted Template .....................................49 Reference Spectrum Icon........................................111 Reference Time.......................................................303 Regional Settings ............................................. 76, 283 Regional Settings Screen ..........................................77 Regular Recalibration..............................................107 Re-installing Software .............................................105 Reminder Pop-up ............................................... 58, 60 Remote Access Settings Parameters ........................................................293 Rental......................................................................108 Repair ............................................................ 106, 107 Report Period Parameter................................ 132, 227 INDEX Reset Analyzer................................................. 8, 12, 103 Button at Bottom .................................... 8, 12, 103 Measurement.................................................. 5, 42 Options .............................................................. 103 Pushbutton ..................................................... 5, 42 to Factory Default .................................. 8, 12, 103 Resolution of Readings ............................................. 74 Result Selector........................................................ 134 Results Display in Enhanced Logging Software ............. 134 Display in Frequency Analysis Software........... 111, 182, 184, 187, 192, 195, 196 Display in Logging Software .............................. 122 Display in Reverberation Time Software ........... 155 Display in Tone Assessment Software .............. 175 Re-using Setups from Projects .................................. 64 Reverberation Time................................................... 20 Annotations........................................................ 154 Decay Tab ......................................................... 159 Definition............................................................ 147 Display Results .................................................. 155 Impulsive Excitation Method .............................. 150 Interrupted Noise Method .................................. 148 Overview Tab..................................................... 155 Parallel Measurements ...................................... 153 Serial Measurements......................................... 153 Set Up................................................................ 151 Spectrum Tab .................................................... 157 Typical Measurement Setup .............................. 149 Reverberation Time Software BZ-7227 ............ 34, 147 Rumble .......................................................... 302, 303 Running Icon ............................................................. 41 RV Parameter Noise Criteria ..................................................... 302 S Save Enhanced Logging Results................................ 136 Frequency Analysis Results .............................. 115 Logging Results ................................................. 129 Measurement................................................ 25, 63 Periodically with Logging ................................... 117 Reverberation Time Results .............................. 166 Settings................................................................ 48 Save As Icon ............................................................. 48 Save Icon .................................................................. 48 Save Project Data at Parameter .............................. 132 Save Pushbutton......................................... 25, 43, 63 Saved Measurement Viewing ................................................................ 26 Screen ................................................................. 5, 40 315 SD Cards Recommended .................................................. 102 Slot ................................................................. 9, 12 Troubleshooting................................................. 101 SDHC Memory Cards ............................................... 12 Second Check Parameter....................................... 228 Secondary Microphone............................................... 6 Secure Digital Card Slot ............................................................. 12 High Capacity Memory Cards ............................. 12 SD Cards............................................................. 12 SDHC .................................................................. 12 Selecting Default Measurement Job/Path........................... 63 Tone Assessment Option .................................. 171 Serial Measurements.............................................. 153 Automated Sequence........................................ 154 Server Settings NMT................................................................... 294 Service and Repair ................................................. 106 Services Calibration ......................................................... 107 Filter Calibration ................................................ 107 Hardware Maintenance ..................................... 107 Initial Calibration................................................ 107 Regular Recalibration........................................ 107 Rental ................................................................ 108 Repair................................................................ 107 Service Agreement............................................ 107 Training ............................................................. 108 Set Up Enhanced Logging ............................................ 132 Frequency Analyzer .......................................... 109 Generator .......................................................... 110 Logging.............................................................. 118 New Users........................................................... 79 Reverberation Time........................................... 151 Sound Level Meter Project Template .................. 21 Tone Assessment.............................................. 171 Transducer ........................................................ 274 Setting up a Tone Assessment Measurement Default Setup..................................................... 173 Manually using ISO 1996–2, Annex D .............. 172 Manually using Italian Law ................................ 173 Setting up the Analyzer Building Vibration .............................................. 194 Settings Alarm ................................................................... 86 DynDNS .............................................................. 80 Modem ................................................................ 80 Setup Edit Mode ............................................................ 46 G-weighting ....................................................... 190 Parameters........................................................ 221 Setup Screen ............................................................ 38 316 Hand-held Analyzer Types 2250 and 2270 – User Manual Shortcut Bar.............................................................. 42 Signal Recording ...................................110, 134, 137 Import .................................................................. 69 Parameters........................................................ 241 Playback............................................................ 124 Setting ............................................................... 120 Size ................................................................... 126 With PULSE Multi-analyzer ............................... 145 With Reverberation Time .................................. 152 With Tone Assessment ..................................... 174 Signal Recording Option BZ-7226 .... 20, 34, 101, 137 Signal Recording Timer .......................................... 133 SIL .........................................................114, 232, 303 SIL3 .......................................................114, 232, 303 SLM (Sound Level Meter) ......................................... 31 Slot for Compact Flash (CF) Cards ............................ 12 for Secure Digital (SD) Cards.............................. 12 Slow Time Weighting ................................................ 31 Small Tripod .......................................................15, 17 Smileys Codes and Remedies in Tone Assessment ...... 178 In Frequency Analysis Software........................ 115 In Reverberation Time Software ....................... 165 In Tone Assessment Software .......................... 177 SMS Notifications ...............................................86, 88 while Online......................................................... 89 Software Version ...................................................... 35 Sound Calibrator.................................................51, 52 Sound Category...................................................... 125 Sound Definition ..................................................... 304 Sound Exposure (E).................................................. 32 Sound Exposure Level.............................................. 32 Sound Level............................................................ 304 Sound Level Calibration............................................ 51 Sound Level Meter Definition ............................................................. 31 Initial Screen ....................................................... 21 Project Template ...........................................19, 21 Set up.................................................................. 21 Standards .......................................................... 199 Sound Level Meter Software BZ-7222 ...................... 32 Sound Marker .................................................126, 141 Sound Pressure Level.......................................33, 304 Special Parameters ................................................ 255 Specifications ......................................................... 199 1/3-octave Based Tone Assessment ................ 213 2250 Enhanced Logging Software BZ-7225 ..... 207 2250 Frequency Analysis Software BZ-7223 .... 205 2250 Logging Software BZ-7224 ...................... 206 2250 Reverberation Time Software BZ-7227.... 208 2250 Sound Level Meter Software BZ-7222 ..... 202 FFT Based Tone Assessment........................... 213 Measurement Partner Suite BZ-5503 ............... 215 Sound Recording Option BZ-7226 .................... 208 Tone Assessment Option BZ-7231....................213 Type 2250/2270 Platform...................................200 Spectrum Graph in Reverberation Time Software ........................157 Spectrum Post-processing Tools BZ-5503-B.............69 Spectrum Statistics..................................................183 Spectrum Tab in Frequency Analysis Software.........................111 in Reverberation Time Software ........................157 Spectrum Weighting ................................................183 Standard Calibration..................................................52 Standards..................................................................14 Standby Mode ............................................. 21, 75, 76 Star Navigation Concept............................................36 Start Duration Parameter.........................................238 Start Level Parameter..............................................238 Start Slope Parameter .............................................238 Start Time Parameter ..............................................238 Start/Pause Pushbutton ................................ 5, 22, 42 Statistics Parameter ....................................... 226, 231 Statistics to Calculate Percentile Levels ......... 256, 259 Status Codes In Tone Assessment Software ...........................177 Status Field ...............................................................40 in Logging Profile ...............................................123 in Reverberation Time Software ........................155 Status Indicator ...........................................................5 Stop Duration Parameter.........................................239 Stop Level Parameter..............................................238 Stop Time Parameter ..............................................238 Stopped Icon .............................................................41 Storage Settings Parameter ............................. 77, 284 Storage Settings Screen............................................78 Store Pushbutton.........................................................5 Storing the Analyzer ................................................106 Stylus ................................................................... 5, 44 Usage...................................................................45 Switch On and Charge Setting...................................76 Switching Off .............................................................30 Switching On .............................................................21 Synchronize with Clock Parameter ..........................237 T Table Format Icon ...................................................113 Tables in Reverberation Time Software...................156 Tacho Input ...............................................................10 Tacho Probe Connection.............................................7 TCpeak .....................................................................304 Template Explorer .....................................................39 Templates .................................................................20 Delete or Reconfigure ........................................105 Temporarily Un-install Applications .........................100 Text Icon............................................................. 27, 65 Text Messages ................................................... 86, 88 Theory of CIC ............................................................58 INDEX Third Check Parameter ........................................... 228 Threshold Level....................................................... 304 Time for Peak Sound Levels (TCpeak) ........................ 32 Time Remaining ...................................................... 102 Time Weighted Average (TWA)................................. 32 Time Weightings .............................................. 31, 297 Time Zone ................................................................. 77 Timed Measured Parameters............................. 32, 33 Timer Event Parameter ........................................... 241 Timer Period Parameter .......................................... 237 Timer Setup Screen .................................................. 94 Timers....................................................................... 94 Delete .................................................................. 95 Setup ................................................................... 39 When Analyzer On............................................... 94 with Switch-on Time............................................. 94 Tone Assessment ................................................... 110 According to ISO 1996-2, Annex D.................... 168 According to Italian Law..................................... 170 Default Setup ..................................................... 173 Display Results .................................................. 175 Manual Measurement ........................................ 172 Measuring .......................................................... 175 Set Up................................................................ 171 Smileys and Remedies ...................................... 178 Using Enhanced Logging Template................... 177 Using Logging Template.................................... 176 With Signal Recording ....................................... 174 Tone Assessment Option BZ-7231............ 20, 35, 167 Top Freq. for Special Leq Parameter ....................... 225 Top Socket ............................................................. 6, 9 Total Measurement Parameters Equivalent Continuous Sound Level.................. 254 For BZ-7222....................................................... 254 For BZ-7223....................................................... 254 For BZ-7224....................................................... 254 For BZ-7225....................................................... 254 Low-frequency Parameters......256, 259, 261, 263 Maximum Time-weighted Sound Levels............ 254 Peak Sound Level ............................................. 254 Sound Exposure Level (LAE) ............................. 254 Spectrum Parameters........................................ 256 Statistics to Calculate Percentile Levels as spectra ........................................... 256 Weather Data Parameters ................................. 256 Total Parameter ............................................. 121, 134 Touch Screen....................................................... 5, 40 Troubleshooting ................................................. 103 Traffic Light ............................................................... 43 Training................................................................... 108 Transducer Connecting ........................................................ 180 Icons .................................................................... 41 Setup ................................................................. 274 Transducer Database................................................ 55 317 Transducer Parameters .......................................... 274 Transducers Screen ................................................. 38 Transfer Data..................................................................... 67 Templates............................................................ 49 Triaxial LEMO connector .......................................... 10 Trigger Input ............................................................. 10 Trigger Parameters................................................. 237 Triggers Parameter................................................. 133 Tripod ....................................................................... 15 Adaptor.................................................................. 6 Extension Stem ................................................... 15 Mounting Thread ................................................... 6 Small ............................................................ 15, 17 Troubleshooting...................................................... 100 Battery Charge Indicator ................................... 102 Battery Pack ...................................................... 102 Reset Options.................................................... 103 SD and CF Cards .............................................. 101 Touch Screen .................................................... 103 USB Stick .......................................................... 101 When Selecting an Interval for Storing.............. 143 When Setting a Marker...................................... 143 Turn off Backlight ...................................................... 75 TWA ....................................................................... 304 TWAv ...................................................................... 304 Type 2250 Input Parameters............................................... 222 Type 2250/2270 Microphones ................................ 278 Type 2270 Camera.................................................................. 6 Channel 1 ............................................................ 11 Channel 2 ............................................................ 11 Connecting Two Microphones............................. 16 High Speed USB and LAN Interfaces ................... 6 Image Settings .................................................. 294 Input Parameters............................................... 222 Input Parameters Channel 1 ............................. 222 Type 4189 Microphone ............................................... 9 Type 4964............................................................... 280 Type Approval......................................................... 199 U UA-0587 ................................................................... 15 UA-0801 ............................................................ 15, 17 UA-1317 ................................................................... 17 UA-1404 ................................................................... 16 UA-1650 ................................................................... 15 UA-1651 ................................................................... 15 UA-1673 ..................................................................... 6 UC-0211 ................................................202, 275, 279 UL-1019.................................................................... 84 Unlock ............................................................... 47, 49 Update or Upgrade ................................................... 98 Updating Applications ............................................... 97 Hand-held Analyzer Types 2250 and 2270 – User Manual 318 Upgrading Applications............................................. 97 US Occupational Health Parameters .....255, 258, 261 USB Connection ....................................................... 67 USB Interface .........................................................6, 9 USB Stick Troubleshooting ................................................ 101 USB Type A .............................................................. 81 Socket ................................................................... 9 Use of Navigation Pushbuttons ...................................... 44 Pushbuttons for Controlling Measurements ........ 42 Stylus .................................................................. 44 Users Delete or Reconfigure ....................................... 105 New ..................................................................... 79 Users Parameter .................................................... 286 V Versions ................................................................... 35 View and Control Instrument Web Page.................... 72 View Area ................................................................. 41 View Instrument Web Page....................................... 71 Viewing Annotations ......................................................... 64 Data..................................................................... 64 Saved Measurement ........................................... 26 Viewing Data ............................................................ 64 VP-0647 ................................................................. 100 W Warm Start ............................................................... 21 Weather.................................................................... 90 Weather Data ................................. 32, 256, 259, 262 Instantaneous ............................................. 33, 263 Weather Station MM-0256.........................................90 Weather Station MM-0316.........................................90 Weather Stations Connection...........................................................90 Types ...................................................................90 Web Page for Veiwing and Control ............................72 Welcome .....................................................................1 What is a Project Template? ......................................20 What is the Hand-held Analyzer?...............................32 Wind Parameters.......................................................90 Windscreen Mounting ..............................................................15 Windscreen Fitted Icon..............................................41 Windscreen Fitted/Diffuse Field Icon .........................41 Wired Connection......................................................84 Wireless LAN Connection...........................................................83 Parameters ..........................................................86 WLAN........................................................................83 WLAN Connection.....................................................84 Wrist Strap Mounting Thread....................................................6 X XL View .....................................................................23 Z ZC-0032 ............................................................. 15, 55 ZG-0426............................................................... 7, 14 Z-weighting ...............................................................31 Technical Documentation Hand-held Analyzer Types 2250 and 2270 With Sound Level Meter Software BZ-7222, Frequency Analysis Software BZ-7223, Logging Software BZ-7224, Enhanced Logging Software BZ-7225, Signal Recording Option BZ-7226, Reverberation Time Software BZ-7227, 2-channel Option BZ-7229 Tone Assessment Option BZ-7231 and Low Frequency Option BZ-7234 HEADQUARTERS: Brüel & Kjær Sound & Vibration Measurement A/S · DK-2850 Nærum · Denmark Telephone: +45 7741 2000 · Fax: +45 4580 1405 · www.bksv.com · [email protected] Local representatives and service organisations worldwide ËBE-1713---|Î User Manual English BE 1713 – 30


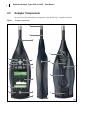


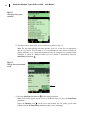


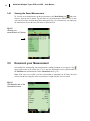

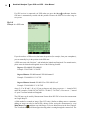


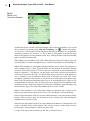

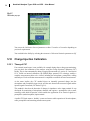
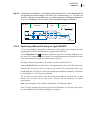
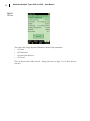
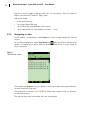

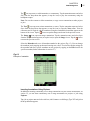


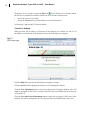
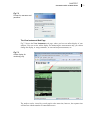
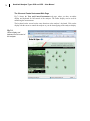


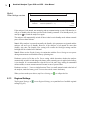
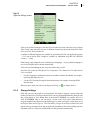

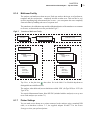


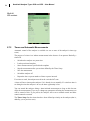


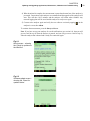


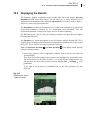
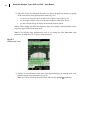
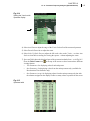


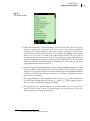

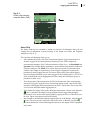

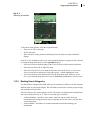


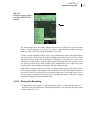

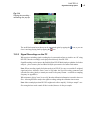


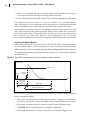


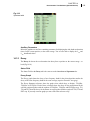

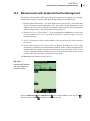


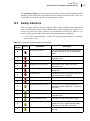

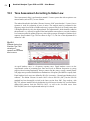

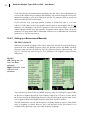
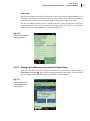
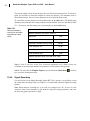
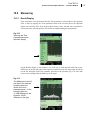

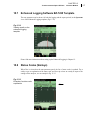
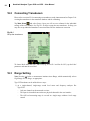
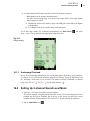
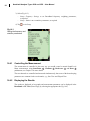

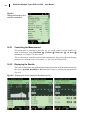
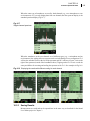


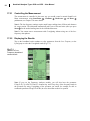


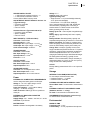


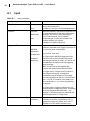


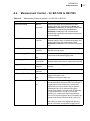

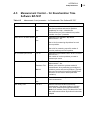

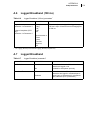


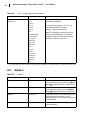

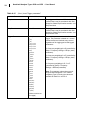

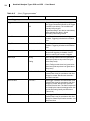
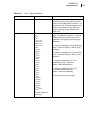
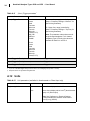

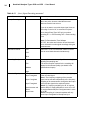
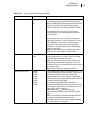

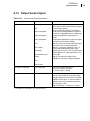

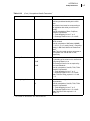


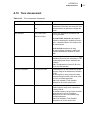
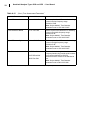

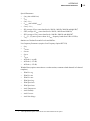
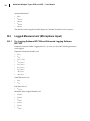

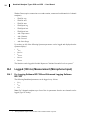


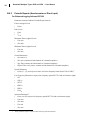
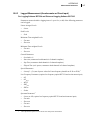
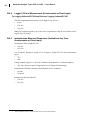
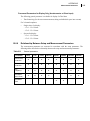
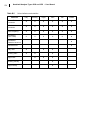


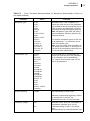
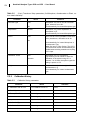

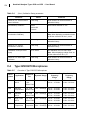
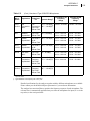

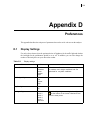
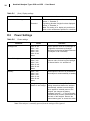
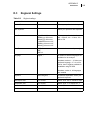

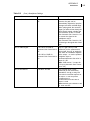
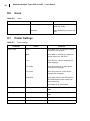
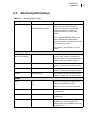
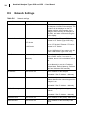
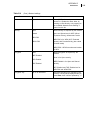
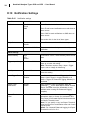
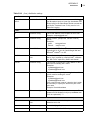


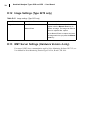


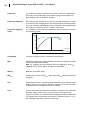


![[Italian]Documentazione Tecnica: Analizzatori portatili](http://vs1.manualzilla.com/store/data/006162879_1-c9f956b7ab0328a00893d3c6418e422c-150x150.png)
![[Italian] Documentazione Tecnica: 2250 Light con](http://vs1.manualzilla.com/store/data/006160524_1-f69e9fdf78c2a064fca03fcd4c87c082-150x150.png)