1
Design and Analysis of a Wireless Telemetry System Utilizing IEEE 802.16
by
Terry Moltzan
Advisor: Dr. Richard Wolff
Montana State University
ECE Master’s Degree Project
Spring 2005
Work Sponsored by Advanced Acoustic Concepts
-1-
TABLE OF CONTENTS
1. Introduction
1.1 Motivation
2. System Selection
3
3
3
2.1 IEEE 802.16 Standard
5
2.2 Redline Equipment
6
2.3 Link Budget
9
3. Test Bed
10
3.1 Test Bed Objectives
10
3.2 Test Bed Architecure
11
3.3 Hardware Selection
13
3.4 Software Selection
14
4.Test Procedure
19
5. Test Results
23
5.1 Packet Size Effects
23
5.2 Received Signal Strength Effects
25
5.3 Additive Noise Effects
25
5.4 Interference Effects
25
5.5 Long Range Tests
28
6. Conclusions
30
Glossary
31
Appendix 1: VB Script
33
Appendix 2: Iperf Commands
35
Appendix 3:Redline Data sheet
39
Appendix 4:IP Traffic Data Sheet
41
Appendix 5:Radio Test Plan
43
2
1. Introduction
1.1 Motivation: Advanced Acoustic Concepts (AAC) has several projects that require a
communications link between remote sites. The distances and data rates vary from project to
project, but they desire a solution that can handle many of their needs by using standards based
off the shelf equipment that can easily be deployed. To be quickly and cost affordable to deploy
a wireless system was determined to be necessary. This also affords the possibility to support
mobile and nomadic units that can be connected very easily with out the need for highly trained
technicians. AAC is experienced at using COTS (consumer off the shelf) components to meet
the needs of military subsystems. The benefits of using COTS components are that the
economics and availability are very good related to custom hardware. The cost and time of
development is also kept to a minimum. The goal of this project was to identify equipment that
is commercially available that would meet the telemetry needs of AAC, and then do lab testing
and a field test to do a proof of concept on both the product and the standard that it is based
upon.
The ideal telemetry system to meet all of the needs of AAC would provide a data rate of 50Mbps
at a range of 50 miles. No system that was investigated was able to simultaneously meet both
requirements. 20 Mbps at a range of 20 miles was chosen to be an appropriate goal with the
current state of consumer products.
To complete this task the first step is to identify appropriate standards and to see what the
capabilities of current systems are. The next step is to design a test bed that would allow for
testing of the equipment. The testing then has to be carried out and the results analyzed.
2. System Selection
In order to gather information on what products were commercially available research was done
both through the Internet and through meeting with vendors at the 2004 CTIA wireless
conference. At this conference several vendors were contacted and their product lines were
3
discussed. It became clear that the emerging IEEE 802.16 standard was the standard that best
met the criteria of the task.
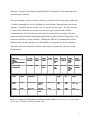
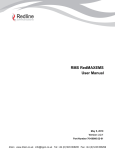
The top contending systems on the basis of being 1) standards based 2) long range capable and
3) capable of throughput in excess of 40Mbps were the Redline Communications and Airspan
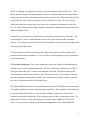
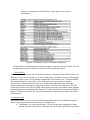
offerings. Technically the two systems were very similar in every aspect. The table in Figure
1.1 shows how similar the two systems are in the basic system specifications. Redline
Communications’ AN-50 was chosen as the system to acquire and test at length. They have
demonstrated high reliability and high throughput links in cellular back haul deployments. This
experience made them a strong candidate. Although the IEEE 802.16 standard had not been
finalized at the time these products were obtained they were engineered with the standard in
mind and use the same modulation formats, so the results are suitable for a proof of concept
demonstration.
Type
Encryption
Tx
Rx
BW
Bit Rate
Range
Interface
Freq
Redline AN50
OFDM
P-P, P-MP
www.redlinecommunications.c
om
Yes, 64 bit
Proprietary
-20 to +
20 dBm
- 86 dBm
(6 Mb/s)
20 MHz
48 Mb/s
at
Ethernet
port
50 M, LOS
6 M, NLOS
Ethernet,
Bridge
10/100
base-T
5.8 GHZ
unlicensed
Airspan AS3030
www.airspan.com
Yes, DES
20dBm
-86 dBm
(6 Mb/s)
20 MHz
49 Mb/s
full
duplex
48 M, LOS
Ethernet
bridge
4 10/100
Base-T
ports
5.8 GHz
unlicensed
R a d io
S y s te m
IP
S u p p o rt
Pow er
C o n s u m p tio n
D im e n s io n s
W e ig h t
A n te n n a
W e ig h t
A n te n n a
G a in
T e m p e ra tu re
R anges
R e d lin e
A N 50
B rid g e
48 V D C 39W
4 3 .2 c m X
305cm X
4 4 .5 c m
2 .0 k g + 1 .0 k g
5 .0 k g
7 .0 k g
28dB i
17dB i
0 -5 5 C
-4 0 - + 6 0 C
A irs p a n
A S4030
B rid g e
2 4 -7 0 V D C
39W
4 3 .2 c m X
305cm X
45cm b
~ 3 .0 k g
5 .0 k g
7 .0 k g
28dB i
17dB i
0 -5 5 C
-4 0 - + 6 0 C
Figure 1.1 A comparison of the Redline AN-50 and the Airspan AS3030. Both systems are very similar and they
were the top two candidates considered for further testing.
4
2.1 IEEE 802.16 Standard: The IEEE 802.16 standard is designed as the air interface for
wireless metropolitan area networks (MANs). A wireless MAN provides a radio connection
between an exterior mounted antenna on a building and a central base station. The MAN is used
as a replacement for a wired access network such as cable, DSL, or fiber optic cable. The ability
to connect sites with out an expensive infrastructure between them can provide economic
advantages as well as advantages in ease of deployment. Although proprietary systems have
been deployed before, a standard has never before existed that would allow for product
interoperability and consequently the price drop that is associated with widespread competition
and deployment.
The 802.16 standard does not specify a frequency that must be used, but instead breaks the
spectrum into two separate sections: 2-11GHz and 11-66GHz. This paper will only deal with the
2-11 GHz portion of the spectrum, as that is the frequency set in which most of the equipment is
available. At higher frequencies it becomes more difficult to get very long-range links, as the
path loss is frequency dependent. IEEE 802.16 can be implemented in both licensed and
unlicensed bands. The use of unlicensed spectrum is appealing since it saves the cost of getting a
license and allows for deployment in a wide geographic range with out the need for licensing.
The IEEE 802.16 medium access control (MAC) was designed with very high bit rates in mind,
in both the uplink and down link directions. Access and bandwidth allocation must be able to
handle multiple different data streams as well as different quality of service (QoS) requirements.
Quality of service requirements may be such that one link has priority over another link when
there is bandwidth contention. Quality of service also dictates what the maximum throughput of
a link is limited to. This is useful for fixed broadband wireless providers to have a flexible way
to serve different types of customers. The 802.16 MAC provides a wide range of service types
analogous to ATM systems.
Each user is given a burst profile that specifies the modulation and coding format to be used for
that user. By adjusting the burst profile the MAC can make use of high data rate and highly
spectrally efficient modulation schemes and still have the ability to scale back to a lower bit rate
and more robust modulation format so that the link can sustain very high availability, with out
5
sacrificing performance. 99.999 percent link availability is planned into the standard. By
making these adjustments the throughput on the link is always maximized for the given
conditions. This “self tuning” of the link will provide for the ability to quickly establish links
with out having to manually adjust the equipment.
In the 2-11 GHz frequencies the MAC layer also issues automatic repeat requests (ARQ) to
insure higher data reliability. The MAC also includes a privacy sub layer that provides
authentication of network access and connection establishment to avoid theft of signal.
Encryption and key exchange are also built into the MAC for added security.
Orthogonal frequency division multiplexing (OFDM) is used in the unlicensed bands with the
media access being by time division multiplexing. The system is also time division duplex. This
makes for efficient use of the spectrum in that the up and down links can be asymmetric with no
loss of efficiency. The use of OFDM also has the effect that each of the OFDM signals occupies
a narrow bandwidth. This loosens the requirement for coherence bandwidth considerably, and
helps with the problems of time domain dispersion caused by multipath interference.
2.2 Redline Equipment: For the purpose of these tests Redline AN-50 radios were purchased.
64 QAM modulation is an option on these radios; it brings the advertised throughput up to
48Mbps measured at the Ethernet port. This option was purchased on three of the radios. A total
of four radios were purchased so that point to point operation could be tested, as well as point to
multipoint operation. The point to multipoint testing did not get completed, as there was a
hardware problem on the base station terminal that has to be resolved under warranty. The four
modulation types that are implemented in the AN-50 are BPSK, QPSK, 16 QAM and 64 QAM.
The AN-50 radios include a forward error-correcting scheme that is identified by the number of
data bits to the total number of bits. For example a ¾ code would contain 3 bits of data for every
4 bits transmitted. The other bit is used for error correction purposes. The coding rate is varied
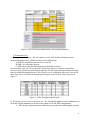
along with the modulation format to provide the highest level of throughput possible. The table
below shows the various settings for modulation type and coding scheme that are used in the
AN-50 radios, along with the data rates that are achievable for each.
6
Figure 2.1 Throughput for various modulation schemes. The over the air throughput is much higher than the
Ethernet rate since it also includes added bits for error detection and link layer retransmission, as well as link
management.
The AN-50 radios operate in the 100MHz available in the 5.8GHz unlicensed band. Each radio
link occupies one 20 MHz wide channel. The spectrum is broken into 9 partially overlapping
channels. Two radio links in close proximity should be separated by 20MHz to avoid co-channel
interference. The table in Figure 2.2 below shows the center frequencies of the 9 channels.
Figure 2.2 Channel Frequency Assignments.
7
The AN-50 functions as a wireless Ethernet bridge. For all of the testing the IP addresses of the
two radios were set to 192.168.25.2 and 192.168.25.4. The subnet mask was set to
255.255.255.0. The computers hooked to the terminals were given IP addresses of
192.168.25.100 and 192.168.25.200. The subnet mask was the same as for the terminals
themselves. The Redline radios are capable of issuing flow control frames. This feature is very
nice for use with UDP traffic. When the radio runs out of resources it is able to issue a pause
frame to the Ethernet devices attached to it. Once resources are again available a resume frame
is transmitted and traffic flows again. The AN-50 runs out of resources because the Ethernet
side is 100Mbps Ethernet but the RF side can only support 48Mbps maximum. Without flow
control data would be discarded at the input to the radio at a rate of 52 (100-48) Mbps. The
complete system specifications are shown below in Figure 2.3.
Fig. 2.3 Redline AN-50 System Specifications
8
2.3 Link Budget Consideration: A link budget for the Redline radio was considered for the
distance of 20 miles. The system was considered with 28dBi panel antennas and a transmit
power of 20dBm. The free space path loss of a 5.8GHz signal at a distance of 20 miles is
(λ )
2
calculated by the equation PL =
(4π )2 (d )2
=138 db. The receive power is then 20+28+28-138 =
-62dbm. The receive sensitivity of the AN-50 is specified as being –86dbm, therefore the link
margin is 24db. This margin is necessary to account for other losses not considered in the ideal
case calculated above. Losses can be occurred in the antenna cable connecting the transceiver to
the antenna, as well as pointing losses due to the antennas not being exactly aligned with each
other. The link margin is also a buffer against seasonal impairments that may occur such as
heavy rain and seasonal foliage obstruction.
For the Redline equipment it is important to note that the received sensitivity of –86dbm is the
received power necessary to complete a BPSK link. To achieve the higher order modulations a
larger received signal strength is required. This is tested and the experimental results are shown
in Figures 5.2 and 5.3. If a higher order modulation is desired to achieve a higher throughput
refer to those graphs to infer the received signal power necessary and use that as the receiver
sensitivity was used above.
9
3.Test Bed
3.1 Test Bed Objectives: A test bed for evaluating a high-speed radio link is required. This test
bed should be able to simulate a real world link and as many of the parameters that a real world
system has to face as possible. The test bed also has to be able to generate and monitor the
traffic on the link.
The link that is to be tested is a high speed RF link between remote terminals. Each terminal
accepts standard RJ-45 Ethernet inputs and has an IF output that goes to a transceiver unit that up
converts to the 5.8GHz band. This output has a standard N-type male connector. The antenna
connects to this port. In lab based testing the antennas weren’t used, but instead the RF ports on
the transceivers were connected together with cables, running through other equipment as
necessary.
The test bed had to be able to do testing of throughput vs. received signal strength, throughput
vs. signal to noise and distortion ratio, throughput vs. packet size, as well as throughput as a
function of configuration settings on the terminal itself.
The RF portion of the test bed had to be able to allow for easy reconfiguration of the test
configuration. The test bed had to be able to create values of added noise, loss, and interference
that would be able to simulate different types of link conditions. The noise value should range
from thermal up to a value that makes the link inoperable. Loss had to be able to be variable so
that the input power of the receive transceiver could be varied between the extremes of saturation
and minimum sensitivity. Both the noise and the loss should be finely adjustable, on the scale of
1-db steps. Interference should be adjustable as well so that strong and weak interferers could
both be simulated.
The interconnects for the test bed had to be able to meet certain requirements as well. The RF
interconnects had to be able to have a low loss at the operating frequency of 5.8GHz. This is so
that the loss over the cable itself is negligible compared to the other losses in the system. High
10
quality of shielding was required so that there would be minimum leakage of RF power. This
insures that the energy is flowing through the test bed as designed, rather then having radiation
leakage that may interfere with another portion of the test bed circuit. The IF interconnects have
to be shielded as well, but the low frequency makes it much less critical. The loss on the IF
cable is not important since the gain of the transceiver is adjusted to compensate for the cable
loss. To connect the terminals to other computer equipment via Ethernet only required the use of
standard 100Mbps cables.
Connected to each terminal we required a device to be able to send and receive IP traffic. This
requires both a PC with a capable Ethernet card as well as some form of traffic generation
software. The software also needed to be able to keep statistics on the amount of throughput that
is flowing through the system.
The last requirement of the test bed was to have some way to observe and record the system
parameters that the host terminals see. This is useful in verifying that the test bed is operating in
a reasonable manner.
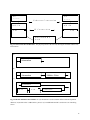
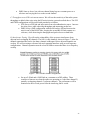
3.2 Test Bed Architecture: The test bed architecture needs to be flexible so that different link
conditions can easily be simulated and tested. The basic architecture is shown below in Fig 3.1.
This figure shows that a PC is connected on each end of the link. These then connect to the
AN-50 terminals, which in turn connect to the T-58 transceiver units. The transceiver units are
then joined together through a RF link that is set to simulate some desired condition. This link
has several variations that will be considered below.
The simulated RF link has to have several different configurations for different testing situations.
The simplest architecture is just to add attenuation on the link. The attenuation will be adjusted
to simulate different link distances. The next more complex architecture is to have both
attenuation and additive white noise. The next progression is to have an interfering source. An
additional AN-50 that is sending out registration requests can be coupled into the RF link.
Figure 3.2 is shown below and shows the different configurations of the simulated RF link.
11
P C
P C
G e n e ra to r
R e c e iv e r
E th e rn e t C o n n e c tio n
A N -5 0
A N -5 0
IF C o n n e c tio n
T - 58
T - 58
T -5 0
T -5 0
S im u la te d R F
L in k
Fig. 3.1 General Test bed Architecture. The physical portion of the test bed, showing the terminals and the basic
interconnects.
A)
Attenuation
B)
Attenuation
Additive Noise
C)
A tte n u a tio n
A N -5 0
T T- 5- 058
A t t e n u a t io n
Fig. 3.2 RF link simulation environments. In (A) attenuation is used to simulate different antenna separation
distances; in (B) white noise is added to the system; in (C) an additional terminal is used to act as an interfering
source.
12
3.3 Hardware Selection: The signal attenuation block shown in the above section was
implemented by using fixed value attenuators, as well as a step attenuator. The set of fixed
attenuators were procured from the Electrical and Computer Engineering Department RF lab.
The attenuators are fixed N-type attenuators from Weinschel Engineering. Not all of the
attenuators were rated for use at this frequency (5.8GHz) so they had to be calibrated by using
the network analyzer located in the Telecommunications lab in the ECE department. The fixed
attenuators were labeled with the value of attenuation that was measured at the desired frequency
of interest (5.8GHz). In addition a variable attenuator (HP 8494B) is also used with values
between 0 and 11 dB in 1 dB steps. This device is rated for use up to 18GHz. The operation of
the step attenuator was verified to be within 0.3 dB of the displayed value throughout its range,
by using the network analyzer. This configuration provided attenuation between 106 and 56 db,
corresponding to a maximum range of 113 miles under free space propagation conditions with
28dBi antennas, -86dbm receive sensitivity and 20dbm of transmit power.
The test bed allows for easy adjustment of the amount of additive noise induced into the system
by using a wide band calibrated noise source that is on loan from The Spectrum Research Lab
located at MSU. The noise source is a Noise Com NC6000 series broadband white noise source
with a built in step attenuator.
For doing high frequency radio testing it is necessary to have very high quality cables with both
low insertion loss and high isolation. The cables that were used for this project are manufactured
by Easy Form Cable Corporation and are excellent for these criteria. They are a flexible cable,
which is beneficial since several different configurations will need to be used. Rigid cables can
meet the technical demands, but are more difficult to work with. Model EZ flex 402 cable was
selected to meet all of the given requirements. A 2-way splitter and a 4-way splitter were
procured from Mini-Circuits and are specified to work at 5.8 GHz.
The radio terminals and transceivers are manufactured by Redline Communications. The
complete system is referred to as the AN-50 radio. The main components of the radio are the
13
AN-50 terminal and the T-58 transceiver. The radios, transceivers and some of the attenuators
are shown in Fig. 3.3
Advanced Acoustic Concepts supplied the PCs that are used to generate and receive traffic. One
terminal was a Compaq Evo N620c laptop with a Pentium M 1.6Ghz processor and 512 MB
RAM and a gigabit Ethernet port. In early testing the other terminal was an IBM ThinkPad
transnote. This machine did not have the resources to support the throughput we needed. It was
subsequently discovered that this terminal was creating a bottleneck in the throughput. Final
testing used a HP PC with a Pentium 4 2.8Ghz processor and 248 MB RAM and a 100 Mbps
Ethernet adaptor.
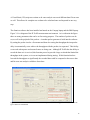
3.4 Software Selection: To able to test the various different configurations and RF environments
that we can create with the RF portion of the test bed we need tools that allow us to both generate
traffic as we desire and be able to log the observed performance. MSU has procured and
installed Omnicor’s “IP Traffic Test & Measure” software suite. This software can generate up
to sixteen simultaneous traffic streams. The parameters (e.g., packet size, priority, inter-packet
delay time, packets per second, etc.) of each stream can easily be set by the GUI on a per
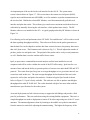
connection basis. A screen shot of the parameters interface is shown below in Figure 3.4. The
receiving computer measures round trip delay, lost packets, bit error rate and throughput. The
software collects, stores, analyzes and graphs the data.
Fig 3.3 Redline AN-50s on the lab bench. 4 T-58 transceivers (left) and 4 AN-50 radio terminals (right) are shown
on the lab bench. Fixed attenuators are connected directly to two of the terminals.
14
A Visual Basic (VB) script was written to do some analysis on several different data files at once
as well. This allows for complete test set data to be calculated once and imported in one easy
step.
The Omnicor software has been installed and tested on the Compaq laptop and the IBM Laptop.
Figure 3.4 is a diagram of the IP Traffic measurement environment. As is evident in the figure
there are many parameters that can be set for testing purposes. The number of packets can be
set, as well as the payload of the packets. A random packet generator is built into the software.
By setting the packet sized to a fix amount and then also setting the throughput the interpacket
delay is automatically set to achieve the throughput with the packet size requested. This facility
even works when pause and resume frames are being sent. Although IP Traffic has the ability to
record the data as it is received, this function proved to provide a huge overhead that limited the
throughput in the system, so it was not implemented during testing. If this function had not
lowered the throughput so significantly the recorded data could be compared to the source data
and bit error rate analysis could have been done.
Fig 3.4 Parameters Menu in IP Traffic. On this screen the packet size and throughput can be set, as well as the
type of data to be transmitted.
15
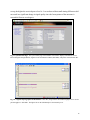
From the IP Generator – Parameters tab the protocol as well as the destination IP address and
port can be specified. These values need to match with the values that are set under the IP
Answering – Parameters + Statistics tab. The parameters #x button access the parameters screen
shown in Figure 3.5.
Fig 3.5 IP Generator Parameter Tab. This tab sets the protocol to use as well as the destination IP address and
port.
Fig 3.6 IP Answering Parameters Tab. This tab sets the source IP address and port. The protocol is also specified
on this tab.
16
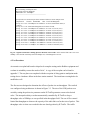
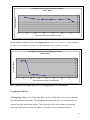
An important part of the test bed is the web interface for the AN-50. The system status
screen is shown below in Figure 3.7. This screen shows the current received power (RSSI),
signal to noise and distortion ratio (SINADR), as well as statistics on packet retransmissions on
the wireless link. Redline has released RF Monitor, a tool that automatically polls this web
interface and plots the results. This software gives much more consistent results then what was
achievable by manually observing the web interface, which updated more slowly. The RF
Monitor software was installed on the PCs. A typical graph produced by RF Monitor is shown in
Figure 3.8
For collecting end-to-end performance data “IP Traffic Test and Measure” will be used to record
the data regarding throughput and delay. This software will also run the packet generation so
that the data flow can be shaped to emulate data from acoustical sensors, the primary data source
that AAC plans to use. The Parameters tab is shown in Fig. 3.4. This tab adjusts the number of
packets, packet size and packet rate. The payload of the packet can be set by several parameters
as well. Random data is used to emulate traffic from a sensor.
Iperf, an open source command line network analysis tool has been installed on several
computers and will be used to validate the results of the IP Traffic testing. Iperf runs for a set
amount of time and has the ability to generate packets of various sizes under both UDP and TCP
protocol. The results from Iperf are given as average throughput over a given time interval, one
second was used in this case. The total average throughput for the duration of the test is also
reported as well as jitter and packet loss statistics. Readout of typical Iperf results is shown
below in Figuer 3.9. Iperf is freely available. This software was able to produce much higher
throughputs then what IP Traffic did. The results obtained with Iperf are more inline with the
manufacturers specifications for the radio system.
An actual deployment test bed is also necessary to support the lab findings and provide a final
proof of performance. This test can be done using the existing Redline equipment. This test is a
simple throughput test under a deployment scenario of 20 miles range using two of the 12° sector
antennas. The antenna alignment is done by listening to the audible sweep that is transmitted
from the transceiver unit while adjusting the antenna aiming. The higher the frequency of the
17
sweep, the higher the received power level is. It was observed that small aiming differences did
not result in a significant change in signal quality since the beam pattern of the antennas is
reasonable flat near zero degrees.
Fig. 3.7 System Status Page. The system status page of the Redline web interface displays information such as
Received Signal Strength (RSSI), Signal to Noise and Distortion Ratio (SINADR), and packet retransmission data.
Fig. 3.8 A typical output graph from RF Monitor. This data, along with the measured throughput can be used to
plot throughput vs. SINADR. The lighter line on the SINADR plot is the transmit power.
18
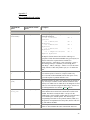
-----------------------------------------------------------Server listening on UDP port 5001
Receiving 1470 byte datagrams
UDP buffer size: 128 MByte
------------------------------------------------------------
[1932] local 192.168.25.100 port 5001 connected with 192.168.25.200 port 1039
[ ID] Interval
Transfer Bandwidth
Jitter Lost/Total Datagrams
[1932] 0.0- 1.0 sec 5.04 MBytes 42.3 Mbits/sec 0.126 ms -842149805/ 4244 (-2
e+007%)
[1932] 0.0- 1.0 sec 842150451 datagrams received out-of-order
[1932] 1.0- 2.0 sec 5.09 MBytes 42.7 Mbits/sec 0.113 ms 677/ 4311 (16%)
[1932] 2.0- 3.0 sec 5.10 MBytes 42.8 Mbits/sec 0.102 ms 672/ 4310 (16%)
[1932] 3.0- 4.0 sec 5.10 MBytes 42.8 Mbits/sec 0.089 ms 675/ 4312 (16%)
[1932] 4.0- 5.0 sec 5.09 MBytes 42.7 Mbits/sec 0.088 ms 676/ 4309 (16%)
[1932] 5.0- 6.0 sec 5.10 MBytes 42.8 Mbits/sec 0.082 ms 675/ 4312 (16%)
[1932] 6.0- 7.0 sec 5.05 MBytes 42.3 Mbits/sec 0.151 ms 672/ 4273 (16%)
[1932] 7.0- 8.0 sec 5.10 MBytes 42.8 Mbits/sec 0.132 ms 675/ 4313 (16%)
[1932] 8.0- 9.0 sec 5.10 MBytes 42.8 Mbits/sec 0.117 ms 671/ 4309 (16%)
[1932] 9.0-10.0 sec 5.10 MBytes 42.8 Mbits/sec 0.102 ms 674/ 4312 (16%)
[1932] 0.0-10.0 sec 51.0 MBytes 42.7 Mbits/sec 1.796 ms 6713/43057 (16%)
Fig. 3.9 A typical readout after running Iperf for duration of 10 seconds. In this test the UDP source was set to
50Mbps. Since the link could only sustain 42.7Mbps 16% of the datagrams were lost.
4. Test Procedure
An extensive test plan had been developed to do complete testing on the Redline equipment and
evaluate its suitability to meet the needs of AAC. A copy of the test plan can be found in
appendix 5. The test plan was completed with the exception of doing point to multipoint mode
testing due to a hardware failure in the base station terminal. The interference testing had to be
modified as well.
The first test was designed to determine the effects of packet size on throughput. The test bed
was configured using architecture A shown in Figure 3.2. The size of the UDP packets were
varied by setting the packet size parameter on the IP-Traffic generator screen to the desired
value. The interpacket delay was then automatically controlled by IP Traffic to keep a
throughput value of 50Mbps, as was specified in the throughput field. The use of flow control
limited the throughput to whatever the capacity of the radio link was for that size of packet. This
throughput value is what was recorded in the raw data logs taken by IP Traffic. The traffic
19
generation was set to produce random packet contents for a duration of 1,000,000 packets. The
average result over the test interval was extracted by using a VB script. The script can be found
in Appendix 1. The traffic generation and data logging functions are not integrated in IP Traffic,
so the data logging had to be started manually before the traffic generation, and then stopped
after the traffic generation section had completed. The script finds the first instance of
throughput and averages the data until the link is silent again. Test results are discussed in
Section 5.
Subsequent testing was done to determine the effect of RSSI on throughput. To do this the
packet size was fixed at 1300 bytes and the amount of attenuation on the link was varied
throughout the operating range of the transceiver. This packet size is close to the size of packets
sent by AAC sensors. The sensitivity of the receiver is –86 dbm, and the dynamic range is
specified as >50db. So the attenuation when connected to 20dbm source had to range from
below 56db to 106db to cover the entire operating range. Throughput was extracted from the
raw data files collected by IP Traffic using the VB script, as stated above. The RSSI data was
manually observed from the web interface, in the initial testing. Later testing using the Iperf
software also included the use of RF Monitor, which graphed the values of RSSI and SNR. The
Iperf software provided the average result over the test interval so no additional analysis was
needed on that data. More information on Iperf can be found in Appendix 2 and the test results
in Section 5.
The next testing was to determine the effect of additive noise on the throughput of the system.
This test used architecture B, shown in figure 3.2. To do this a signal level was set by adding in
a fixed amount of attenuation, then adjusting the attenuator on the noise source set the noise
level. The SNR was adjusted over a range so that the throughput varied from optimum (no
additive noise) to total link loss. The traffic generation and data logging was only done with IP
Traffic for this test, due to the availability of the noise source. The average throughput was
extracted from the raw data files using the VB script, as before. Results are given in Section 5.
For the field testing the radio was run on different channels and with different software
configurations to see if they had any effect on end user throughput. A link was set up between
20
Cobleigh Hall, on the MSU campus and a remote site located twenty miles north on Rocky
Mountain Road. The Cobleigh Hall antenna was located on the roof, approximately 80 feet
above ground level. The antenna at the Rock Mountain Road site was mounted on an 8-foot
mast. The path between the locations was line of site with no blockage within the Fresnel zone.
Figure 4.1 shows a terrain map of the area with the two antenna locations labeled. The elevation
difference between the sites in combination of the antenna heights provided for Fresnal zone
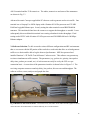
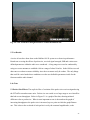
clearance as shown in Figure 4.2. A photo of the remote station is shown below in Figure 4.3.
The view from the Cobleigh Hall site towards the remote site is shown in Figure 4.4. For these
tests 28 dBi sector antennas with a beam width of 4.5 degrees were used at each end. A portable
generator powered the remote site. Results are shown in Section 5.
Fig. 4.1 Locations of the transmit and receive sites
21
Fig. 4.2 Fresnal Zone Clearance
Fig. 4.3 The Remote Site for the Long Range Test. In this photo the generator is visible in front of the SUV, as
well as the antenna and mast at the rear of the vehicle. The laptop and radio were set up on a table at the rear of the
vehicle.
22
Fig. 4.4 View From the Cobleigh Hall Site Towards the Remote Site.
5. Test Results
A series of tests have been done on the Redline AN-50 system to evaluate its performance.
Bench tests covering the effects of packet size, received signal strength, SNR and various userdefined parameters within the radio were conducted. A long-range test was also conducted by
using two sector antennas to establish a link at a range of about 20 miles. In the field test several
data runs were taken to ensure reliability since the test cannot easily be redone. The only things
that could be varied under these conditions were the user definable parameters inside for the
firmware and the radio channel.
Lab Tests
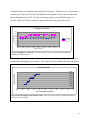
5.1 Packet Size Effects: The explicit effect of variation of the packet size was investigated using
the IP Traffic test and measure suite. Packet size was varied over a large range to see what affect
that had on user throughput. Below in Figure 5.1 is a graph of the data, showing minimal
differences due to packet size. What is most important to note is the trend on the graph of
increasing throughput as the packet size is increased, up to a point at which the graph flattens
out. This is due to the overhead of each packet is set by the constant length header, so the
23
overhead becomes less important as the payload size increases. The packet size was increased to
a maximum of 1480 bytes, the size of the Ethernet frame payload. Packets that are larger than
this are dropped by the AN-50. In order to use larger packets, such as MPLS packets, on a
network with the AN-50 they need to be fragmented before being sent to the AN-50.
Throughput Vs. Packet Size
40000
Throughput (Mbps)
35000
30000
25000
RSSI = -70dbm
20000
RSSI = -47dbm
15000
10000
5000
0
0
200
400
600
800
1000
1200
1400
1600
UDP PAcket size (Bytes)
Fig. 5.1 Throughput Vs. Packet Size. The effects of packet size are minimal once the payload size
dominates the total packet size.
5.2 Received Signal Level Effects: Several tests were run where the received power level was
varied and the throughput was measured. These tests were taken with both IP traffic and Iperf as
Test Results from IP Traffic
Throughput Vs RSSI
40000
Throughput (kbps)
35000
30000
25000
20000
15000
10000
5000
0
-100
-90
-80
-70
-60
-50
-40
-30
-20
-10
0
Recieved Signal Strength (dbm)
Figure 5.2 The throughput results from IP Traffic. Notice how clearly changes in modulation format are
shown as stairs in the graph.
24
the testing software. This is where it first becomes apparent that Iperf is better suited to run tests
at high speeds. As the signal level is lowered it gets closer to the thermal noise floor. This in
effect decreases the SNR without the use of a noise source. The results are shown in Figure 5.2.
The same tests were run using Iperf as the software to both generate and measure the traffic
levels. The results shown in Figure 5.3 show a similar trend. Most noticeably the throughput is
consistently higher when there is a large amount of received power. The steps show a similar
structure for the first three level reductions. The wide fluctuations that are seen as the signal
level gets very low is probably due to a shorter testing time with Iperf then with IP traffic. The
modulation was probably adapting during the duration of these tests and it didn’t run for a long
enough time to average that out.
In both sets of tests the throughput minimum is observed at about –86 dBm, corresponding to the
manufacturer’s specification for received signal sensitivity.
Throughput vs RSSI
50
45
Throughput (Mbps)
40
35
30
25
20
15
10
5
0
-90
-80
-70
-60
-50
-40
-30
-20
-10
0
Recieved Signal Strength(dbm)
Fig. 5.3 Throughput Vs. RSSI data from IPERF.
25
5.3 Additive Noise Effects: The effect of injecting various amounts of noise into the signal was
investigated. This was done at several different levels of signal attenuation. For a fixed level of
signal attenuation the noise power was adjusted by varying the level of attenuation on the front
of the noise source. The results are shown in Figure 5.4. This only changes the amount of noise
added to the signal, and not the power level of the information signal itself.
Throughput Vs. SNADR
40
Throughput (Mbps)
35
30
25
RSSI = -68dbm
20
RSSI = -63dbm
15
RSSI = -53dbm
10
5
0
0
5
10
15
20
25
30
SNADR (db)
Interference
Testing
Fig 5.4 Throughput Vs. SNADR based on IP Traffic Data. Notice that the three graphs for different levels of
received power all overlay each other. This shows that the SNR is the determining factor in what level of
throughput is possible
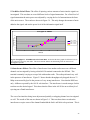
5.4 Interference Effects: The effect of interference from another radio source on a different
channel was investigated by having a third AN-50 terminal connected to the RF link. This
terminal constantly is trying to set-up a link with another radio. The radio performed very well
in the presence of interference. Figure 5.5 shows that the throughput only dropped down to 33
Mbps as measured by Iperf in the presence of very strong interference. Note that the RSSI was
only –64dbm as reported by the AN-50 web interface. The interference is much stronger for this
test than was the desired signal. This shows that the filters in the AN-50 do an excellent job of
rejecting out of band interference.
The case of an interferer being in an adjacent and partially overlapping channel was investigated
as well. The results of this test are shown in Figure 5.6. This test shows that even when the
interference occupies some of the channel bandwidth the link is still able to be persistent. This is
26
probably due to the use of OFDM, which allows for sub-channels to be utilized, some of which
are not sharing any bandwidth with the interferers.
Throughput Vs Interfering Power (Signal at 5.765 GHz)
RSSI = -64dbm
40
Throughput (Mbps)
39
38
37
36
35
34
33
32
-40
-35
-30
-25
-20
-15
-10
-5
0
5
Recieved Interfering Power at 5.815GHz (dbm)
Fig 5.5 Throughput Vs Received Out of Band Interference. The throughput is shown here for various amounts
of out of band interference being caused by a third AN-50 terminal.
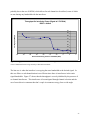
The last case is when the interferer is occupying the same bandwidth as the desired signal. In
this case filters or sub-channelization is not efficient since there is interference in the entire
signal bandwidth. Figure 5.7 shows that the throughput is severely inhibited by the presence of
co-channel interference. This interference is best mitigated through channel selection and the
use of more directive antennas that don’t couple in extraneous energy from a wide angle.
27
Throughput Vs Interfereing Power (Signal at 5.765 GHz)
RSSI = -64dbm
45
Throughput (Mbps)
40
35
30
25
20
15
10
5
0
-70
-60
-50
-40
-30
-20
-10
0
Recieved Interfering Power (dbm) at 5.775GHz
Fig. 5.6 The Effect of Interference In an Overlapping Channel. In this series of tests the occupied bandwidth of
the signal is from 5.765GHz to 5.785GHz. The signal bandwidth is from 5.755GHz to 5.775GHz.
Throughput Vs Interfering Power (Signal at 5.765 GHz)
RSSI = -64dbm
45
40
Throughput (Mbps)
35
30
25
20
15
10
5
0
-80
-70
-60
-50
-40
-30
-20
-10
0
Recieved Interfering power at 5.765 GHz (dbm)
Fig. 5.7 The Effect of Co-channel Interference on Throughput Between Two AN-50 Radios.
Long Range Field Test
5.5 Long Rage Tests: A set of long range field tests were conducted to verify the bench testing
that had been done to that point. The throughput measured on this test was less than what was
expected from the initial bench testing. This is most likely due to the channel experiencing
reflections and dispersion in the time domain. This effect was not simulated in the lab
28
environment. The alignment of the antennas was done by first using a visual alignment and then
fine-tuning by using the built in buzzer in the transceivers. Aiming proved not to be critical, as
the small changes in angle did not change the received power level much since the beam pattern
is relatively flat. The range as given by the user interface of the Redline terminal was 17.03
miles.
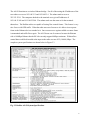
The severe difference in throughput in different channels shown in Figure 5.8 may have been due
to the presence of interfering signals. The signal propagation should not differ significantly
between the different channels. The possibility that additional noise, such as local microwave
radiation from other users of the same spectrum, which might be contributing to the lower SNR
was explored. An RF spectrum analyzer was hooked to the antenna at the Cobleigh Hall site to
look for sources of interference, and to measure the noise floor. The noise floor was observed o
be at about –100 dBm. There were two narrow band interferes noted to be present. Their
characteristics are shown below in Figure 5.9. There is a possibility that there was an interferer
present at the remote site that could not be seen at the Cobleigh Hall site. This would impair the
link, yet not be detectable from the Cobleigh Hall site.
Frequency, MHz
5764.6
5821.8
Power level, dBm
~-90
~-91
Channel
2A
5
Fig. 5.8 The two interferers present at the Cobleigh Hall site.
Channel
Throughput (Mbps)
2A
20.06
3
19.87
4
13.09
4A
13.14
5
11.05
Fig 5.9 The effect of utilizing different channels
29
The effect of using Redline’s proprietary encryption was investigated as well. The results show
little difference if it is on or off. For all of these results the modulation format was set to be
adaptive with a maximum bit rate of 54Mbps with a step size of two levels. This proved to give
better results than any of the attempts to have a fixed level of modulation.
Encryption
Throughput (Mbps)
On
19.48
Off
19.94
Fig 5.10 The Effect of Encryption on Throughput.
6. Conclusions
The Redline communications equipment and the 802.16 standard that they are based have been
demonstrated to be able to provide a reliable telemetry link. Although the specified throughput
of 48Mbps at the Ethernet port was not attainable the system sill performed well. The highest
throughput measured was 44 Mbps at the Ethernet under ideal conditions. The radio performed
well in the presence of adjacent channel interference, likely due to the use of the adaptive
modulation, error correction and the use of OFDM. The long-range test showed that the system,
when properly configured, quickly and easily establishes a link that performs well. With the first
attempt at antenna alignment done purely by visual reference the link became operational as soon
as both units were powered on.
The range of an 802.16 radio can be extended by the use of advanced receiver and transmitter
antenna design and signal processing. Future work on this project involves integrating an
adaptive antenna with an IEEE 802.16 radio transceiver. The antenna will provide for higher on
axis gain, as well as being more directional so that interference from off axis sources will be
minimized. This will aid in both system security and throughput.
30
Glossary
31
32
33
Appendix 1
This macro takes the raw IP Traffic data files that are saved as text files and stored in
the C:\SampleData file.
Sub Macro2()
Dim objFSO As New FileSystemObject
Dim DataDir As Folder
Dim DataDirFiles As Files
Dim DataFile As File
Dim stream As TextStream
Set DataDir = objFSO.GetFolder("C:\SampleData")
j=2
For Each DataFile In DataDir.Files
Set stream = DataFile.OpenAsTextStream
stream.ReadLine
stream.ReadLine
stream.ReadLine
stream.ReadLine
I=1
RunningTotal = 0
Start = 0
Ender = 0
While Not stream.AtEndOfStream
temp = stream.ReadLine
' ActiveSheet.Cells(j, 10) = temp
temp2 = Split(temp, " ")
temp3 = Split(temp2(3), "s")
If IsNumeric(temp3(1)) Then
34
Data = CDbl(temp3(1))
Else
Data = 0
End If
If Data = 0 And Ender = 0 Then
Start = I
Else
If Data > 0 Then
RunningTotal = Data + RunningTotal
Ender = I
End If
End If
I=I+1
Wend
Average = RunningTotal / (Ender - Start)
ActiveSheet.Cells(j, 1) = DataFile.Name
ActiveSheet.Cells(j, 2) = Average
ActiveSheet.Cells(j, 3) = Start
ActiveSheet.Cells(j, 4) = Ender
ActiveSheet.Cells(j, 5) = RunningTotal
j=j+1
Next
End Sub
35
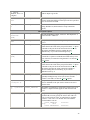
Appendix 2
Iperf commands and options
Command line
option
Environment variable
option
Description
Client and Server options
-f, --format
[bkmaBKMA]
$IPERF_FORMAT
A letter specifying the format to print bandwidth numbers in.
Supported formats are
'b' = bits/sec
'B' =
Bytes/sec
'k' = Kbits/sec
'K' =
KBytes/sec
'm' = Mbits/sec
'M' =
MBytes/sec
'g' = Gbits/sec
'G' =
GBytes/sec
'a' = adaptive bits/sec
'A' =
adaptive Bytes/sec
The adaptive formats choose between kilo- and mega- as
appropriate. Fields other than bandwidth always print bytes, but
otherwise follow the requested format. Default is 'a'.
NOTE: here Kilo = 1024, Mega = 1024^2 and Giga = 1024^3
when dealing with bytes. Commonly in networking, Kilo =
1000, Mega = 1000^2, and Giga = 1000^3 so we use this when
dealing with bits. If this really bothers you, use -f b and do the
math.
-i, --interval
#
$IPERF_INTERVAL
Sets the interval time in seconds between periodic bandwidth,
jitter, and loss reports. If non-zero, a report is made every
interval seconds of the bandwidth since the last report. If zero,
no periodic reports are printed. Default is zero.
-l, --len
#[KM]
$IPERF_LEN
The length of buffers to read or write. Iperf works by writing an
array of len bytes a number of times. Default is 8 KB for TCP,
1470 bytes for UDP. Note for UDP, this is the datagram size and
needs to be lowered when using IPv6 addressing to 1450 or less
to avoid fragmentation. See also the -n and -t options.
-m, -print_mss
$IPERF_PRINT_MSS
Print the reported TCP MSS size (via the TCP_MAXSEG
option) and the observed read sizes which often correlate with
the MSS. The MSS is usually the MTU - 40 bytes for the
TCP/IP header. Often a slightly smaller MSS is reported because
of extra header space from IP options. The interface type
corresponding to the MTU is also printed (ethernet, FDDI, etc.).
This option is not implemented on many OSes, but the read sizes
may still indicate the MSS.
-p, --port #
$IPERF_PORT
The server port for the server to listen on and the client to
connect to This should be the same in both client and server
36
Default is 5001, the same as ttcp.
-u, --udp
$IPERF_UDP
Use UDP rather than TCP. See also the -b option.
-w, --window
#[KM]
$TCP_WINDOW_SIZE
Sets the socket buffer sizes to the specified value. For TCP, this
sets the TCP window size. For UDP it is just the buffer which
datagrams are received in, and so limits the largest receivable
datagram size.
-B, --bind
host
$IPERF_BIND
Bind to host, one of this machine's addresses. For the client this
sets the outbound interface. For a server this sets the incoming
interface. This is only useful on multihomed hosts, which have
multiple network interfaces.
For Iperf in UDP server mode, this is also used to
bind and join to a multicast group. Use addresses in
the range 224.0.0.0 to 239.255.255.255 for multicast.
See also the -T option.
-C, -compatibility
$IPERF_COMPAT
Compatibility mode allows for use with older version of iperf.
This mode is not required for interoperability but it is highly
recommended. In some cases when using representative
streaming you could cause a 1.7 server to crash or cause
undesired connection attempts.
-M, --mss
#[KM}
$IPERF_MSS
Attempt to set the TCP maximum segment size (MSS) via the
TCP_MAXSEG option. The MSS is usually the MTU - 40 bytes
for the TCP/IP header. For ethernet, the MSS is 1460 bytes
(1500 byte MTU). This option is not implemented on many
OSes.
-N, --nodelay
$IPERF_NODELAY
Set the TCP no delay option, disabling Nagle's algorithm.
Normally this is only disabled for interactive applications like
telnet.
Bind to an IPv6 address
Server side:
$ iperf -s -V
-V (from v1.6 or
higher)
.
Client side:
$ iperf -c <Server IPv6 Address> -V
Note: On version 1.6.3 and later a specific IPv6 Address does
not need to be bound with the -B option, previous 1.6 versions
do. Also on most OSes using this option will also respond to
IPv4 clients using IPv4 mapped addresses.
Server specific options
-s, --server
$IPERF_SERVER
Run Iperf in server mode.
-D (from v1.2 or
higher)
.
Run the server as a daemon (Unix platforms)
On Win32 platforms where services are available, Iperf will start
running as a service.
-R (only for
Windows, from v1.2
or higher)
.
Remove the Iperf service (if it's running).
37
-o (only for
Windows, from v1.2
or higher)
.
Redirect output to given file.
-c, --client
host
$IPERF_CLIENT
If Iperf is in server mode, then specifying a host with -c will
limit the connections that Iperf will accept to the host specified.
Does not work well for UDP.
-P, --parallel
#
$IPERF_PARALLEL
The number of connections to handle by the server before
closing. Default is 0 (which means to accept connections
forever).
Client specific options
-b, -bandwidth
#[KM]
$IPERF_BANDWIDTH
The UDP bandwidth to send at, in bits/sec. This implies the -u
option. Default is 1 Mbit/sec.
-c, --client
host
$IPERF_CLIENT
Run Iperf in client mode, connecting to an Iperf server running
on host.
-d, --dualtest
$IPERF_DUALTEST
Run Iperf in dual testing mode. This will cause the server to
connect back to the client on the port specified in the -L option
(or defaults to the port the client connected to the server on).
This is done immediately therefore running the tests
simultaneously. If you want an alternating test try -r.
-n, --num
#[KM]
$IPERF_NUM
The number of buffers to transmit. Normally, Iperf sends for 10
seconds. The -n option overrides this and sends an array of len
bytes num times, no matter how long that takes. See also the -l
and -t options.
-r, --tradeoff
$IPERF_TRADEOFF
Run Iperf in tradeoff testing mode. This will cause the server to
connect back to the client on the port specified in the -L option
(or defaults to the port the client connected to the server on).
This is done following the client connection termination,
therefore running the tests alternating. If you want an
simultaneous test try -d.
-t, --time #
$IPERF_TIME
The time in seconds to transmit for. Iperf normally works by
repeatedly sending an array of len bytes for time seconds.
Default is 10 seconds. See also the -l and -n options.
-L, -listenport #
$IPERF_LISTENPORT This specifies the port that the server will connect back to the
client on. It defaults to the port used to connect to the server
from the client.
-P, --parallel
#
$IPERF_PARALLEL
The number of simultaneous connections to make to the server.
Default is 1. Requires thread support on both the client and
server.
-S, --tos #
$IPERF_TOS
The type-of-service for outgoing packets. (Many routers ignore
the TOS field.) You may specify the value in hex with a '0x'
prefix, in octal with a '0' prefix, or in decimal. For example,
'0x10' hex = '020' octal = '16' decimal. The TOS numbers
specified in RFC 1349 are:
IPTOS_LOWDELAY
minimize
delay
0x10
IPTOS THROUGHPUT
maximize
38
throughput
0x08
IPTOS_RELIABILITY
reliability 0x04
IPTOS_LOWCOST
cost
0x02
maximize
minimize
-T, --ttl #
$IPERF_TTL
-F (from v1.2 or
higher)
.
Use a representative stream to measure bandwidth, e.g. :$ iperf -c <server address> -F <file-name>
-I (from v1.2 or
higher)
.
Same as -F, input from stdin.
The time-to-live for outgoing multicast packets. This is
essentially the number of router hops to go through, and is also
used for scoping. Default is 1, link-local.
Miscellaneous options
-h, --help
Print out a summary of commands and quit.
-v, --version
Print version information and quit. Prints 'pthreads' if compiled
with POSIX threads, 'win32 threads' if compiled with Microsoft
Win32 threads, or 'single threaded' if compiled without threads.
39
Appendix 3
40
41
Appendix 4
42
43
Appendix 5
Radio System Test Plan
AAC Wireless Telemetry Project
Task Order 1
1. Introduction and background
This test plan document outlines the procedures for acceptance and performance testing of the
Redline Communications AN50 radio system being used provide point-to-multipoint wireless
telemetry under AAC Task Order #1 by Montana State University (MSU).
MSU will test the Redline AN50 system in point-to-point (P2P) and point-to-multi-point (PMP)
configurations to establish whether the radio system can meet performance requirements (e.g.,
range, throughput) for wireless telemetry applications associated with high-speed sensor data
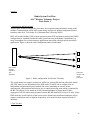
applications. Figure 1 show the radio configuration under consideration.
Base station
and data
acquisition
Test 1)
equipment
Figure 1. Radio configuration for Wireless Telemetry
Subscriber
stations with
traffic
generators
The system under test consists of either one AN50 base station (BS) and one subscriber station
(SS) (P2P mode) or one BS and three SSs (PMP mode). Each SS can be configured as an
independent unsynchronized quasi-uniform data source emulating an acoustic sensor
autonomously collecting data and relaying it to a central processing point which is emulated by
the BS. The objective is to obtain an overall system throughput of greater than 50 Mb/s
(aggregate of all SSs) and a range (distance between BS and furthest SS) of up to 30 miles. In the
PMP mode the overall capacity of the system can be dynamically distributed among the SSs to
support variable data rates as might be required by an event-driven data acquisition mode of
operation.
2. Lab Test bed
44
MSU has constructed a lab test bed to support bench acceptance and performance testing of the
AN50 radio equipment. The lab test bed is located in the AAC Tech Ranch facility consists of
the following components major components.
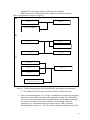
• IP Traffic generators. MSU has procured and installed Omnicor IP traffic generator
measurement software capable of generating and measuring up to sixteen simultaneous
traffic streams consisting of either UDP or TCP packets. The tools measure round trip
delay, lost packets, bit error rate and throughput. The characteristics (e.g., packet size,
priority, inter-packet delay time, packets per second, etc.) of the traffic source can be
varied on a per connection basis. The software collects, stores, analyzes and graphs the
data. The Omnicor software has been installed and tested on the AAC laptop computer
and on several MSU computers that will be used in the test bed. Figure 2 is a diagram of
the IP traffic measurement environment.
Traffic
Generation on
AAC Laptop
Traffic Absorber
and Analyzer on
Laptop
AN-50 Ethernet Interface
SS 1
SS 2
BS 1
SS 3
Packet Sorter on
Linux Router
Key
RF Connection
Ethernet
RF Cable
Figure 2. IP traffic generation and measurement system
•
RF Test equipment. MSU has procured and assembled an RF test environment to emulate
P2P and PMP configurations of the AN50 radio equipment. These components consist of
high-quality RF coax cables (low insertion loss and leakage at the 5.8GHz operating
frequency), fixed and variable RF attenuators (calibrated at 5.8GHz using the MSU
Electrical and Computer Engineering (ECE) department RF network analyzer) and RF
couplers and power splitters (1x3 and 1x2). We have also acquired, under loan from
ECE, a calibrated RF noise source that can be used for noise injection for signal-to-noise
ratio (SNR) performance testing. The equipment supports several configurations:
o Single P2P connection (one BS and One SS), without or with noise injection
45
o Multiple P2P connections with cross talk and noise injection
o PMP connection, one BS and three SSs, without or with noise injection.
These configurations are shown in Figure 3.
A)
SS 1
BS 1
N o is e S o u rc e
B)
SS 1
B S 1
N o is e S o u rc e
SS 2
B S 2
C)
SS 1
SS 2
BS 1
SS 3
N o is e S o u rc e
Figure 3. Testbed configurations for P2P and PMP RF performance measurements
a) P2P with noise; b) P2P with cross talk and noise; c) PMP with noise
•
Data collection and analysis. We will use a combination of methods for acquiring
data in the course of the acceptance and performance testing. The AN50 radios
provide several internal measurement capabilities that can be addressed through
the system web interface by remote computers. These include radio link
parameters (e.g., transmitted and received power levels, SNR, uplink and
downlink packet counts, etc.). We will use these internal measurements, listed in
46
Figure 4, in conjunction with the IP layer traffic data to assess system
performance.
Figure 4. AN50 Radio System web interface diagnostics
All data will be collected and archived under computer control for post-test analysis. We will
use standard tools such as Matlab to analyze the data and generate reports.
3. Field test bed
We will test the radio system in the field after satisfactory completion of the lab bench tests. Our
intention is to test at several ranges, over line-of-sight paths to validate the range and throughput
capabilities of the system. We are making arrangements with TransAria, Inc., a Bozeman-based
telecommunications service provider, to use their radio towers to perform our outdoor
measurements. TransAria has radio tower sites in Bozeman, at Bozeman Pass, and in Big
Timber, which will provide line-of-sight paths of about 12 and 30 miles respectively. We will
test the AN50 radios in the P2P loop-back configuration using these sites and the sector antennas
purchased with the radio equipment (60 Degree X 15 dBi Sectored Panel Antenna and 28 dBi 4.5
Degree 2' Flat Panel Antenna). We will work out the details of these tests in further discussions
with TransAria.
4. Acceptance tests
The Redline radios were received in June 2004 and installed in the AAC TechRanch lab space.
We have begun performing acceptance tests, as outlined below.
• Conformance to system specifications. We will test the radio equipment to assure
that the delivered units conform to the physical and electrical specifications outlined
47
in Figure 5. These tests will include power consumption, transmit output power, RF
frequencies and the various control functions. We will not test for environmental
conformance. RF conformance tests (e.g., throughput versus range) will be carried
out through emulation using the lab test bed and calibrated attenuators.
Figure 5 AN 50 System specifications
48
We will also test the web-based administrative interface to assure that the test points and control
functions and system configuration data are all functioning as specified. The GUIs for these
features are shown in Figure 6. These features include system configuration, SNMP
configuration, subscriber ID and configuration, link configuration and wireless link statistics, RF
error codes and software update status. Our acceptance tests will include exercising all these
features, assuring that the functions work as indicated in the Redline documentation and that we
can control the variables and log the data outputs via the Ethernet computer interface.
49
50
Figure 6. AN50 Web-based administrative and monitoring features
5. Performance tests
A. Throughput measurements. We will conduct a series of lab bench performance tests to
measure throughput versus offered load in several configurations:
A) P2P: one subscriber station used as a reference
B) PMP: two subscriber stations
C) PMP: three subscriber stations (simulate birdstrike scenario)
In each of these tests, we will use the traffic generation software to measure actual packets
received versus offered load with different amounts of traffic on the different channels (B and C)
and also with different input bit rates. The objectives are to establish the efficiency of the AN50
MAC layer and to verify that the through specifications can be realized. These are given in
Figure 7.
Figure 7. AN50 Throughput specifications
B. Throughput versus path loss measurements. We will emulate path loss using combinations of
fixed and variable attenuators to test the radio system in P2P and PMP configurations:
• P2P) increase signal attenuation while observing packet loss and throughput statistics
51
•
PMP) Same as above, but with one channel being kept at a constant power as a
reference and varying the loss on the second channel.
C. Throughput versus SNR ratio measurements. We will test the sensitivity of the radio system
throughput to added white noise using the RF noise injection system described above. The P2P
and P2MP configurations will be tested with procedures as follows.
• P2P) Set-up a P2P link and inject noise from a broadband noise source. Increase
the noise power while observing throughput and measuring packet loss.
• PMP) Set up a PMP configuration with one BS and two SSs and increase the
noise in one of the BS-SS links, keeping the second BS-SS link constant as a
reference, while observing the throughput and packet losses on both links.
D) Interference Testing. We will test the vulnerability of the system to interference from
adjacent and overlapping RF channels. The 802.16 radio channels, shown in Figure 7, allow for
channel separations that can be less than a channel width apart. Hence adjacent channels can
overlap. We will test using a reference link and a potential interferer using several frequency
configurations. Channel separation must be a least 20 MHz to assure that there is no frequency
overlap.
Figure 7. 802.16 Radio channel assignments
•
Set-up a P-P link and a P-MP link on a common set of RF cabling. Three
scenarios of interest are when the radios are operating on 1) the same channel 2)
partially overlapping channels 3) adjacent channels. The performance will be
monitored as the received power from the interfering link is varied.
52
53


![Identifying Embeded Web Servers - [media.blackhat.com]](http://vs1.manualzilla.com/store/data/005833288_1-dd26f65aacb79f754f7b5aa134b8197a-150x150.png)