1
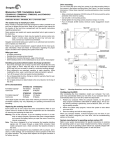
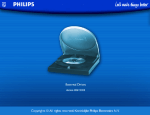
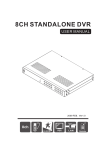
Active@ Hard Disk Monitor
User Guide
Copyright © 2009, LSOFT TECHNOLOGIES INC. All rights reserved. No part of this
documentation may be reproduced in any form or by any means or used to make any
derivative work (such as translation, transformation, or adaptation) without written permission
from LSOFT TECHNOLOGIES INC.
LSOFT TECHNOLOGIES INC. reserves the right to revise this documentation and to make
changes in content from time to time without obligation on the part of LSOFT TECHNOLOGIES
INC. to provide notification of such revision or change.
LSOFT TECHNOLOGIES INC. provides this documentation without warranty of any kind, either
implied or expressed, including, but not limited to, the implied warranties of merchantability
and fitness for a particular purpose. LSOFT may make improvements or changes in the
product(s) and/or the program(s) described in this documentation at any time.
All technical data and computer software is commercial in nature and developed solely at
private expense. As the User, or Installer/Administrator of this software, you agree not to
remove or deface any portion of any legend provided on any licensed program or
documentation contained in, or delivered to you in conjunction with, this User Guide.
LSOFT.NET logo is a trademark of LSOFT TECHNOLOGIES INC.
Other brand and product names may be registered trademarks or trademarks of their
respective holders.
Contents
1.0 Product Overview ............................................................................................................. 4
1.1 About Active@ Hard Disk Monitor.................................................................................. 4
1.2 Requirements .............................................................................................................. 5
1.3 Downloading and installing ........................................................................................... 5
1.4 Product Registration ..................................................................................................... 5
1.5 Active@ Hard Disk Monitor Workspace .......................................................................... 5
2.0 Using Active@ Hard Disk Monitor ...................................................................................... 7
2.1 Viewing hard disk information ....................................................................................... 7
2.2 Setting preferences for Disk Monitor.............................................................................. 8
2.3 Scanning a disk.......................................................................................................... 10
2.4 Viewing the Event log................................................................................................. 11
2.5 Temperature Graphs .................................................................................................. 11
3.0 Using Active@ Hard Disk Monitor Remote Services........................................................... 13
3.1 Adding a network host to monitor ............................................................................... 13
3.2 Viewing network host status ....................................................................................... 14
3.3 Setting preferences for Administrator .......................................................................... 15
3.4 Editing host polling configuration ................................................................................ 16
3.5 Viewing the Administrator Event log ............................................................................ 20
3.6 Windows Service and Firewall Configurator .................................................................. 20
4.0 About S.M.A.R.T. monitoring........................................................................................... 22
4.1 Background ............................................................................................................... 22
4.2 Standards and implementation.................................................................................... 23
4.3 Variations on SMART standards................................................................................... 24
4.4 Attributes .................................................................................................................. 25
3
1.0 Product Overview
This chapter gives an overview of Active@ Hard Disk Monitor.
1.1 About Active@ Hard Disk Monitor
Active@ Hard Disk Monitor – a disk utility that checks and monitors the
reliability status of your hard drives to help prevent data loss due to hard
drive failure.
The system uses S.M.A.R.T. (Self-Monitoring Analysis and Reporting
Technology) monitoring which is based on the fact that hard drive failure
due to mechanical wear happens over time. This software monitors hard disk
parameters such as Temperature, Head Flying Height and Spin-Up Time. It
can notify you when a critical condition occurs.
Active@ Disk Monitor also does the following:
·
Displays hard disk information and the overall status of the hard
disk's health
·
Scans disks for bad sectors
·
Disk Scan can be scheduled (PROFESSIONAL version only)
·
Shows current hard disk temperature in the System Tray
·
Notifies you under warning or critical hard drive conditions; you may
enable notifications to automatically view a popup or send you an
email
·
Displays current values of S.M.A.R.T. attributes, giving you extensive
information about the health of your hard disk
·
Provides detailed information about your hard disk; for example,
model number, serial number, number of cylinders, and so on
·
Can be launched automatically at Windows startup and monitors
hard drives in the background
·
Logs hard drive events and creates a detailed report over a specified
period of time
·
Monitors the health of hard drives remotely ; you may configure
Active@ Hard Disk Monitor to send you notifications from all
computers in your local or global network
·
Displays graphs of temperature changes history Has an easy-to-use
user interface that makes hard disk monitoring a straightforward
task
Instant upgrades are available from our download server.
1.0 Product Overview
1.2 Requirements
Active@ Hard Disk Monitor works on a vast number of Windows platforms.
Its easy-to-use intuitive design makes disk monitoring an easy task.
Hardware Requirements:
* CPU: Pentium III 500MHz and higher or compatible
* RAM: 256 MB
* Disk space: 15 MB
Supported Operating Systems:
* Windows 7 (32-bit & 64-bit)
* Windows Vista (32-bit & 64-bit)
* Windows XP (32-bit & 64-bit)
* Windows 2000 Workstation
* Windows Server 2008 (32-bit & 64-bit)
* Windows Server 2003 (32-bit & 64-bit)
* Windows 2000 Server
1.3 Downloading and installing
To download the free version visit:
www.disk-monitor.com
To install Active@ Hard Disk Monitor, double-click the install executable that
you just downloaded and follow the install wizard steps.
1.4 Product Registration
Free version of the product can be activated to become Professional one.
To purchase the registration key that activates free version, visit:
http://www.disk-monitor.com/buy.html
To activate Active@ Hard Disk Monitor Professional mode, go to menu Help
à Switch to PRO mode, and copy/paste, or type the username and key you
have received.
1.5 Active@ Hard Disk Monitor Workspace
When you open Active@ Hard Disk Monitor, a list of hard disk devices
appears in the left pane. This list is called the monitoring pool. If you have a
5
disk monitoring pool with a number of networked hosts, you may select any
of these to view information about them.
The SMART Info tab is selected and attributes for the selected hard disk
appear in the right pane. To see a description of an attribute, select it. A
description of the selected attribute appears in the Description panel.
The bottom pane displays the following:
·
Disk Status – Overall calculated status of the health of the selected
hard disk. The date and time of last disk information poll is
displayed.
·
Temperature – Displayed on a temperature gauge.
·
Volumes – A list of volumes for the selected system, along with
essential information for each volume. The date and time of last disk
information poll is displayed.
Figure 1-1 Active@ Hard Disk Monitor Workspace
6
Active@ Hard Disk Monitor User Guide
2.0 Using Active@ Hard Disk Monitor
The application monitors all connected hosts continuously. You may turn
monitoring for a host off or on manually.
To turn host’s monitoring off or on:
1. Right-click a host in the monitoring pool.
2. To turn monitoring off, select Monitoring > Off from the context
menu.
3. To turn monitoring on, select Monitoring > On from the context menu.
2.1 Viewing hard disk information
You may view detailed information about each local hard disk.
To view hard disk information:
1. Click a hard disk in the monitoring pool to select it.
2. In the right pane select the Disk Info tab. Detailed information about
the selected hard disk appears.
Hard disk information includes model and firmware information, disk
geometry and volumes allocated on the disk.
Figure 2-1 Disk Info tab selected
2.2 Setting preferences for Disk Monitor
Variable settings allow you to control the behavior and appearance of the
application for each device in the monitoring pool.
Settings that you make here affect the monitoring of all devices in the
monitoring pool.
To set preferences:
1. Click Preferences. The Preferences dialog box appears.
2. In the Poll Settings tab, do the following:
· To change the frequency of data polling, in Check every, indicate a
number and select Hour(s), Minute(s) or Second(s) from the dropdown list.
· To change the frequency of free disk space checking, in Check Free
Disk Space every, indicate a number and select Hour(s), Minute(s) or
Second(s) from the drop-down list.
· To change the Warning and Critical temperature threshold values,
move the slider bars to a different value. Temperature values in Celsius
and Fahrenheit change as you change the slider bar.
· To start monitoring the selected hard disk each time Windows starts,
select the Enable at Windows startup check box.
8
Active@ Hard Disk Monitor User Guide
2.0 Using Active@ Hard Disk Monitor
· To display the running temperature of a hard disk in the system tray,
select the Show Temperature in Tray check box and select the hard
disk for which you want to display the temperature.
· To display the Active@ Hard Disk Monitor status icon in the system
tray, clear the Show Temperature in Tray check box.
3. In the Environment tab, do the following:
· To change the scale in which running temperature is displayed, in the
Show temperature in drop-down list, choose Celsius or Fahrenheit.
· To change the language displayed in the Active@ Hard Disk Monitor
workspace, select a language from the Language drop-down list.
· To change the style in which the Active@ Hard Disk Monitor workspace
is displayed, choose a style from the Style drop-down list.
· To change the color of the Active@ Hard Disk Monitor icon in the
System Tray, choose a different color for each of Normal, Warning
and Critical.
4. In the Notification settings tab, do the following:
· To disable notifications of all kinds, clear the check boxes in the Enable
notifications area.
· To view a popup notification every time the running temperature goes
beyond a threshold, select the Popup notifications check box.
· To receive an email notification every time the running temperature
goes beyond a threshold, select the E-Mail notifications check box
and do the following:
· In From, type who the message is from.
· In To, type the email address where you want the message sent.
· To use your existing email service provider, in Server Name,
type the outgoing mail server (SMTP) address in the format
“servername.hostname.extension”.
· In Port, select a port number using the scroll field.
· If your email server requires authentication, select the My server
requires Authentication check box and provide the user name
and password.
· To validate the SMTP parameters, click Test. The SMTP Test
information box appears. After the test is complete, click Close.
· If you do not have an email service provider, to try to our service,
click Get SMTP Account and click FREE 15-DAY TRIAL at
Secure SMTP Server (www.smtp-server.com).
9
2.3 Scanning a disk
In Active@ Hard Disk Monitor, the Scan Disk procedure allows you to detect
bad blocks located on the drive.
You may perform a disk scan simultaneously on several disks.
If a bad block is found, details of the bad block are displayed with
information down to the sector level layout.
To scan a disk:
1. Select the Scan Disk tab. The Scan Disk workspace appears.
2. Click a hard drive to select it. The number of blocks in the workspace
changes to reflect the size of the selected drive.
3. In Check Block Size, you may choose a different block size. To speed up
the scan process, increase the block size.
4. To view details of any block, hover the mouse pointer over the block.
Information about the block appears temporarily.
5. To start the scan at a specified sector, you may type the sector number
in the From sector field. You may also specify the sector using the spin
controls.
6. To stop the scan at a specified sector, you may type the sector number
in the To sector field. You may also specify the sector using the spin
controls.
7. To start the scan, click Start scan. A progress bar appears. You may
watch as the scan progresses.
8. To stop the scan at any time, click Stop scan.
After the scan completes, an information box appears showing the number
of blocks scanned, total sectors scanned, number of bad blocks and the
elapsed time.
Figure 2-2 Scan Disk workspace
10
Active@ Hard Disk Monitor User Guide
2.0 Using Active@ Hard Disk Monitor
You can specify disk scan schedule: Daily Scan, Weekly Scan, Scan Once. At
the specified time your hard disk will be scanned and disk errors (if
detected) will be reported to the Event Log (PROFESSIONAL version only).
2.4 Viewing the Event log
You can view all events happening on all local drives in the Event log.
To view the Event log:
1. Click a hard disk in the monitoring pool to select it.
2. Select the Event log tab. A list of events for the selected network host
appears.
2.5 Temperature Graphs
You can view temperature changes history as a graph. Temperature changes
for different periods can be displayed.
11
To view the Temperature Graph:
1. Click either a hard disk, or the host being added to the monitoring pool.
2. Select the Temperature Graph tab. A graph for a single hard drive, or
the list of host’s hard drives appears.
3. To view temperature graph for the different period, change the
monitoring scale at the bottom of the graph. In PROFESSIONAL version
you can view temperature changes history for more than one day period
back in time.
Figure 2-3 Temperature Graphs
12
Active@ Hard Disk Monitor User Guide
3.0 Using Active@ Hard Disk Monitor
Remote Services
As a network administrator, with proper licensing, you can monitor the hard
disk in local network and remote network computers. You can display disk
status and information in the Active@ Hard Disk Monitor workspace and
receive notifications when S.M.A.R.T. monitoring detects a value beyond the
specified threshold.
Free version allows you to monitor the only one machine, either local or
remote.
3.1 Adding a network host to monitor
You can add many network hosts. You must purchase a license for each
host.
For example if you have purchased three licenses, you may connect to your
local hard drive and to two network hosts.
Figure 3-1 Monitoring networked hard disks
To add a network host for monitoring:
1. Click Connect to another computer. The Connect to another
computer dialog box appears.
2. Choose which Host you want to add for monitoring: Local Computer,
Network Computer by Name, or type node IP in IP Address area.
3. Enter the node communication port value in the Port scrolling field.
4. Click Add. The added network host appears in the monitoring pool.
Figure 3-2 Connect to another computer dialog box
3.2 Viewing network host status
You may view detailed information about each network host.
To view network host information:
1. Click a network host in the monitoring pool to select it.
2. In the right pane select the Basic Info tab. Detailed information about
the selected network host appears.
Network host information includes:
14
·
IP address of the host.
·
Port used to communicate with the host.
·
Name of the network host.
·
Date and time of the most recent poll and how much time it took to
collect data (in milliseconds).
·
Date and time of the next scheduled poll.
Active@ Hard Disk Monitor User Guide
3.0 Using Active@ Hard Disk Monitor Remote Services
·
Check period displays how much time (in seconds) between data
polls to this network host.
·
SMART Check period displays how much time (in seconds) the
network host takes to collect SMART data from all hard disks
connected locally to it.
·
Free space check period displays how much time (in seconds) the
network host takes to assess used and free disk space on all hard
disks connected locally. The network host makes collected data
available for the next poll by Active@ Hard Disk Monitor (after the
Check period).
Figure 3-3 Network host Disk Info
In the bottom panel, an overall status indicator shows the state of the
selected network host hard disk. As well, volume details of the selected hard
disk are displayed.
3.3 Setting preferences for Administrator
Variable settings allow you to control the behavior and appearance of the
application for each device in the monitoring pool.
Settings that you make here affect the monitoring of all devices in the
monitoring pool.
To set preferences:
1. Click Preferences. The Preferences dialog box appears.
15
2. In the General Settings area, do the following:
· To start monitoring the selected hard disk each time Windows starts,
select the Enable at Windows startup check box.
· To display the running temperature of a hard disk in the system tray,
select Show Temperature in the System Tray and select the hard
disk for which you want to display the temperature.
· To display the Active@ Hard Disk Monitor status icon in the system
tray, select Show Status in the System Tray.
3. In the Additional Options, do the following:
· To change the scale in which running temperature is displayed, in the
Show temperature in drop-down list, choose Celsius or Fahrenheit.
· To change the language displayed in the Active@ Hard Disk Monitor
workspace, select a language from the Language drop-down list.
· To change the style in which the Active@ Hard Disk Monitor workspace
is displayed, choose a style from the Style drop-down list.
4. In TrayIcon Temperature color, to change the color of the Active@ Hard
Disk Monitor icon in the System Tray, choose a different color for each of
Normal, Warning and Critical.
5. Click OK.
3.4 Editing host polling configuration
You can set up how frequently host information is polled, choose between
email and popup notifications and turn the monitoring on and off.
Settings that you make here affect monitoring for all hard disks on the
selected network host.
To edit host polling configuration:
1. Right-click a network host and choose Edit from the context menu. The
Edit host dialog box appears.
2. In the General Settings tab, do the following:
· To change the frequency of data polling, in Check the Host Info
every, indicate a number and select Hour(s), Minute(s) or Second(s)
from the drop-down list.
· To change the frequency of SMART information collection, in Check
SMART Info on the Host every, indicate a number and select
Hour(s), Minute(s) or Second(s) from the drop-down list.
· To change the frequency of free disk space checking, in Check Free
Disk Space on the Host every, indicate a number and select
Hour(s), Minute(s) or Second(s) from the drop-down list.
16
Active@ Hard Disk Monitor User Guide
3.0 Using Active@ Hard Disk Monitor Remote Services
· To change the Warning and Critical temperature threshold values,
use the spinner controls to a different value.
· To record all hard drive monitoring activities into the system event log,
select the Log Info into System Eventlog check box.
· To turn monitoring for this network host off, clear the Monitoring
check box. To turn monitoring on, select the Monitoring check box.
· To disable notifications of all kinds, clear both the Popup
notifications and E-Mail notifications check boxes.
· To view a popup notification every time the running temperature goes
beyond a threshold, select the Popup notifications check box.
· To receive an email notification every time the running temperature
goes beyond a threshold, select the E-Mail notifications check box.
The SMTP Settings tab becomes enabled.
Figure 3-5 Edit host General Settings
3. If you have selected the E-Mail notifications check box, select the
SMTP settings tab, do the following:
· In Subject, type the subject of the email. For example “Active@ Hard
Disk Monitor Notification”.
17
· In From, type the email address used by the network host
administrator.
· In To, type the destination email address where you want the
message sent.
· To use your existing email service provider, do the following:
· In Server Name, type the outgoing mail server (SMTP) address
in the format “servername.hostname.extension”. This is the mail
server that will accept the notification email message from the
application and forward it to the destination email address.
· In Port, select a port number using the scroll field.
· If your email server requires authentication, select the SMTP
server requires Authentication check box and provide the user
name and password.
· To validate the SMTP parameters, click Test. The SMTP Test
information box appears. After the test is complete, click Close.
· If you do not have an email service provider, to try to our service, click
Get SMTP Account and click FREE 15-DAY TRIAL at Secure
SMTP Server (www.smtp-server.com).
Figure 3-6 Edit host SMTP Settings
18
Active@ Hard Disk Monitor User Guide
3.0 Using Active@ Hard Disk Monitor Remote Services
19
3.5 Viewing the Administrator Event log
You can view all events happening on all network hosts.
To view the Event log:
1. Click a network host in the monitoring pool to select it.
2. Select the Event log tab. A list of events for the selected network host
appears.
Figure 3-4 Event log
3.6 Windows Service and Firewall Configurator
For Active@ Hard Disk Monitor to monitor remote hosts, you need to
configure firewall and polling settings on the remote host’s side.
Start Service Configurator in either way:
1. On installation’s last page, mark the related checkbox
2. From the Windows Start menu run Service Configurator
3. From Monitor’s Tools menu click Start service configurator
20
Active@ Hard Disk Monitor User Guide
Figure 3-5 Service Configurator
Specify the following parameters for the remote host:
1. S.M.A.R.T. polling period (in minutes) – how often monitoring service on
the remote host will poll the S.M.A.R.T. information
2. Free space polling (in minutes) - how often monitoring service on the
remote host will ask the Operating System about the free space available
on drives
3. Port – TCP/IP port will be used by the monitoring service.
Click Apply button to save changes in service configuration.
If you have Windows Firewall installed and configured on the remote host,
you need to open the TCP/IP port for the service to be able to accept remote
requests. Click the related button to Open or Close selected firewall port.
After service parameters are configured, you can Stop or Start service
using related buttons.
21
4.0 About S.M.A.R.T. monitoring
Self-Monitoring, Analysis and Reporting Technology, or S.M.A.R.T. is a
monitoring system for computer hard disks. Use it to detect and report on
various reliability factors. When you know more information about your hard
drive, it may assist you in anticipating hard drive failure.
The purpose of S.M.A.R.T. is to warn you about impending drive failure while
there is still time to take preventative action – such as copying data to a
replacement device. Approximately 30% of failures can be predicted by
S.M.A.R.T.
4.1 Background
There are two kinds of hard disk device failure:
·
Unpredictable failure
·
Predictable failure
Unpredictable failure
There are unknown factors at work over which you have no control. An
unpredictable hard drive failure might happen due to the failure of a faulty
electronic component, by static electricity or by mishandling the device.
Unpredictable failures appear without warning and are impossible to predict.
With today’s quality and reliability testing from most manufacturers, the
odds against hard drive problems due to an unpredictable failure are about 3
out of 10.
Normally, unpredictable failures happen in the first 30 days of use.
Predictable failure
Mechanical wear and aging happen gradually, over time. Most hard disk
manufacturers include internal disk monitoring utilities. All disk parameters
that the manufacture feels are important are stored and can be retrieved by
such utilities.
By constantly monitoring these parameters, it is possible to detect variations
in the device's health with great precision. The odds against hard drive
problems due to a predictable mechanical failure are about 6 or 7 out of 10.
Predictable failures are more common than unpredictable failures. After the
first 30 days of use, the real device heath can be predicted with high
probability by monitoring S.M.A.R.T. parameters.
With this in mind, if you monitor hard disk devices constantly, you can
accurately determine the current operating health of your devices and –
after you receive a warning – take the necessary steps to prevent data loss.
Work at Google on over 100,000 drives has shown little overall predictive
value of S.M.A.R.T. status monitoring as a whole. At the same time, in
certain subcategories of performance monitoring, S.M.A.R.T.
implementations do correlate with actual failure rates. Here are the
subcategories:
·
After the first scan error is detected, a hard drive is 39 times more
likely to fail within 60 days than drives with no such errors.
·
After the first errors in reallocation, offline reallocation, and
probational counts are also strongly correlated to higher failure
probabilities.
The PCTechGuide page on S.M.A.R.T. (2006) observes that the technology
has gone through three phases:
"In its original incarnation SMART provided failure prediction by
monitoring certain online hard drive activities. A subsequent version
improved failure prediction by adding an automatic off-line read scan to
monitor additional operations. The latest SMART technology not only
monitors hard drive activities but adds failure prevention by attempting
to detect and repair sector errors. Also, whilst earlier versions of the
technology only monitored hard drive activity for data that was retrieved
by the operating system, this latest SMART tests all data and all sectors
of a drive by using "off-line data collection" to confirm the drive's health
during periods of inactivity."
[Source: http://www.pctechguide.com/31HardDisk_SMART.htm]
4.2 Standards and implementation
In an effort to take a step toward better data integrity, in 1992 IBM created
a hard disk device that could predict its own failure. The new technology
included with the device was called PFA (Predictive Failure Analysis). PFA
would periodically measure specific drive attributes and issue a warning
when a specified threshold was crossed. The threshold in all cases was
primitive by today’s standards. There were two states:
·
1 – Functioning within specifications
·
0 – Threshold exceeded
Following what IBM started, other companies began to create their own
version of a hard disk monitoring utility. The technology developed by
Compaq in partnership with some hard disk manufacturers was named
IntelliSafe. With this technology, each hard disk manufacturer could decide
which parameters to use and what threshold to use for each parameter. In
23
each case, device parameters could be checked only by the proprietary utility
supplied by the manufacturer.
In 1995, a group of leading disk manufacturers, including IBM and Compaq,
produced a jointly-developed standard of predicting device failure which they
called S.M.A.R.T.
Although S.M.A.R.T. is an industry standard among most major hard disk
manufacturers, there is still a need for industry-wide software and hardware
standards for S.M.A.R.T. data interchange. This is a result of the fact that
some proprietary knowledge is held secret by individual manufacturers.
4.3 Variations on SMART standards
One of the reasons that S.M.A.R.T. has been adopted is due to the flexibility
of the standards and the ability of a manufacturer to determine the
thresholds for their own product. As a result of this flexibility, not all
attributes are monitored by every hard disk manufacturer. For example, a
drive manufacturer might claim to support S.M.A.R.T. but not include a
temperature sensor, which the customer might reasonably expect to be
present.
Few external drives connected by USB and FireWire support S.M.A.R.T.
monitoring. In many of these cases, you may still display drive information
and you may scan the drive with Active@ Hard Disk Monitor.
In some cases, S.M.A.R.T. data may not be reported correctly to the
operating system. Some disk controllers can duplicate all write operations on
a secondary "backup" drive in real-time. This feature is known as "RAID
mirroring". In a RAID-configured hard drive system, S.M.A.R.T. alerts to the
operator do not function. This is because under normal RAID array
operational conditions, the computer may not be permitted to 'see' (or
directly access) individual physical drives, but only logical volumes.
On the Microsoft Windows platform, many programs designed to monitor
and report S.M.A.R.T. information will only function under an administrator
account.
One of the other fundamental problems with S.M.A.R.T. is that it slows
performance and for this reason it is disabled by default in many
motherboard BIOSes.
24
Active@ Hard Disk Monitor User Guide
4.4 Attributes
The table in this section should be regarded as a general reference only.
Attributes and threshold values for any given hard disk drive are determined
by the drive manufacturer. Each attribute has a raw value (displayed in
Hexadecimal format) – the meaning of which is up to the manufacturer –
and a normalized value that ranges between 1 and 253 (1 representing the
worst value and 253 representing the best).
Depending on the drive manufacturer, a value of 100 or 200 will often be
chosen as the "normal" value. Manufacturers that have supported one or
more S.M.A.R.T. attributes in various products include: Samsung, Seagate,
IBM (Hitachi), Fujitsu, Maxtor and Western Digital.
These manufacturers do not necessarily agree on precise attribute definitions
and measurements.
For example, the Reallocated Sectors Count (ID 05) attribute value
decreases as the number of reallocated sectors increases. In this case, the
attribute's raw value will often indicate the actual number of sectors that
were reallocated, although vendors are in no way required to adhere to this
convention.
In the table below, the following conventions are used:
·
Higher raw value is better
·
Lower raw value is better
·
?
Value varies by manufacturer
·
Yellow
highlight
Attribute value beyond the threshold value may indicate
imminent hard disk failure
25
Table 3-1 Some S.M.A.R.T. Attributes showing a typical description of their raw values
ID
Hex
01
01
Read Error Rate
Rate of hardware read errors that occurred when
reading data from a disk surface. Any number
above 0 indicates a problem with either disk
surface or read/write heads.
02
02
Throughput
Performance
Overall (general) throughput performance of a hard
disk drive. If the value of this attribute is
decreasing there is a high probability that there is a
problem with the disk.
03
03
Spin-Up Time
Average time of spindle spin up (from zero RPM to
fully operational).
04
04
Start/Stop Count
Tally of spindle start/stop cycles.
05
05
Reallocated
Sectors Count
Count of reallocated sectors. When the hard drive
finds a read/write/verification error, it marks this
sector as "reallocated" and transfers data to a
special reserved area (spare area). This process is
also known as remapping and "reallocated" sectors
are called remaps. This is why, on modern hard
disks, "bad blocks" cannot be found while testing
the surface — all bad blocks are hidden in
reallocated sectors. However, the more sectors that
are reallocated, the more read/write speed will
decrease.
06
06
Read Channel
Margin
Margin of a channel while reading data. The
function of this attribute is not specified.
07
07
Seek Error Rate
Rate of seek errors of the magnetic heads. If there
is a failure in the mechanical positioning system,
servo damage or a thermal widening of the hard
disk, seek errors appear. Increased number of seek
errors indicates a worsening condition of the disk
surface and the mechanical subsystem.
08
08
Seek Time
Performance
Average performance of seek operations of the
magnetic heads. If this value is decreasing, it is a
sign of problems in the mechanical subsystem.
09
09
Power-On Hours
Count of hours in power-on state. The raw value of
26
Attribute name
Better
Description
Active@ Hard Disk Monitor User Guide
ID
Hex
Attribute name
Better
Description
(POH)
this attribute shows total count of hours (or
minutes, or seconds, depending on manufacturer)
in power-on state.
10
0A
Spin Retry Count
Count of retry of spin start attempts. This attribute
stores a total count of the spin start attempts to
reach the fully operational speed under the
condition that the first attempt was unsuccessful).
An increase of this attribute value is a sign of
problems in the hard disk mechanical subsystem.
11
0B
Recalibration
Retries
Number of times recalibration was requested
(under the condition that the first attempt was
unsuccessful). A low attribute value is a sign of
problems in the hard disk mechanical subsystem.
12
0C
Device Power
Cycle Count
Count of full hard disk power on/off cycles.
13
0D
Soft Read Error
Rate
Uncorrected read errors reported to the operating
system. If the value is greater than zero, you
should back up your data.
190 BE
Airflow
Temperature
(WDC)
Airflow temperature on Western Digital hard drives
(Same as Temperature [ID 194], but value is 50
degrees less).
190 BE
Temperature
Difference from
100
Value is equal to (100° C), allowing manufacturer
to set a minimum threshold which corresponds to a
maximum temperature.
·
·
·
·
·
·
Seagate
Seagate
Seagate
Seagate
Seagate
Seagate
ST910021AS: Verified Present
ST3802110A: Verified Present 2007-02-13
ST980825AS: Verified Present 2007-04-05
ST3320620AS: Verified Present 2007-04-23
ST3500641AS: Verified Present 2007-06-12
ST3250824AS: Verified Present 2007-08-07
191 BF
G-sense error rate
Frequency of mistakes as a result of impact loads.
Especially important for mobile devices.
192 C0
Power-off Retract
Count
Number of times the heads are lifted off the media
(retracted) into a safe position. Heads can be lifted
without actually powering off. On Fujitsu drives,
this is Emergency Retract Cycle count.
193 C1
Load/Unload Cycle
Count
Number of times the heads are lifted off the media
to a safe position and then returned to the data
zone position.
27
ID
Hex
Attribute name
Better
Description
194 C2
Temperature
Current internal temperature.
195 C3
Hardware ECC
Recovered
Amount of time between ECC-related (ErrorCorrecting-Code) errors.
196 C4
Reallocation Event
Count
Count of remap operations. The raw value of this
attribute shows the total number of attempts to
transfer data from reallocated sectors to a spare
area. Both successful and unsuccessful attempts
are counted.
197 C5
Current Pending
Sector Count
Number of "unstable" sectors (waiting to be
remapped). If the unstable sector is subsequently
written or read successfully, this value is decreased
and the sector is not remapped. A read error on the
sector will not remap the sector; it will only be
remapped on a failed write attempt. This can be
problematic to test because cached writes will not
remap the sector. Only direct I/O writes to the disk
will remap the sector.
198 C6
Uncorrectable
Sector Count
Total number of uncorrectable errors when
reading/writing a sector. A rise in the value of this
attribute indicates defects of the disk surface
and/or problems in the mechanical subsystem.
199 C7
UltraDMA CRC
Error Count
Number of errors in data transfer via the interface
cable as determined by ICRC (Interface Cyclic
Redundancy Check).
200 C8
Write Error Rate /
Multi-Zone Error
Rate
Total number of errors when writing a sector.
201 C9
Soft Read Error
Rate
If detected, a soft error may be corrected by
rewriting correct data in place of faulty data. If the
value is greater than zero, you should back up your
data.
202 CA
Data Address Mark
errors
Number of data address mark errors. A data
address mark is a position immediately preceding a
data region and is used to establish synchronization
requested for reading data. Values may be vendor
28
Active@ Hard Disk Monitor User Guide
ID
Hex
Attribute name
Better
Description
specific.
203 CB
Run Out Cancel
Frequency of ECC (Error Correction Code) errors.
204 CC
Soft ECC
Correction
Number of errors corrected by software ECC
205 CD
Thermal Asperity
Rate (TAR)
Number of TA (thermal asperity) errors. A TA event
is a read error caused by temperature rise due to
head contact with contaminant particles. Can
render data unreadable for a short period of time.
206 CE
Flying Height
?
The hard drive’s spindle system relies on air
pressure to support the heads at the proper height
while the disk rotates. If the air pressure is too low,
there is not enough pressure for the flying head.
There is a risk of head crashes and associated
issues.
207 CF
Spin High Current
?
Amount of high current used to spin up the drive.
208 D0
Spin Buzz
?
Number retries during spin up because of low
current available.
209 D1
Offline Seek
Performance
?
Drive’s seek performance during offline operations,
such as internal self-tests.
220 DC
Disk Shift
Distance the disk has shifted relative to the spindle
(usually due to shock or high temperature). Unit of
measure is unknown.
221 DD
G-Sense Error
Rate
The number of errors resulting from externallyinduced shock and vibration.
222 DE
Loaded Hours
?
Time spent operating under data load (movement
of magnetic head armature).
223 DF
Load/Unload Retry
Count
?
Number of times head leaves and returns to the
data zone and is unsuccessful at reading data.
224 E0
Load Friction
Resistance caused by friction in mechanical parts
while operating. Higher number indicates a problem
with the mechanical subsystem.
225 E1
Load/Unload Cycle
Count
Total number of load cycles.
29
ID
Hex
Attribute name
Better
Description
?
Total time the heads are in the data zone. (time not
spent in parking area).
226 E2
Load-in Time
227 E3
Torque
Amplification
Count
Number of attempts to increase platter speed to
compensate for speed variations.
228 E4
Power-Off Retract
Cycle
Number of times the magnetic armature was
retracted automatically as a result of cutting power.
230 E6
GMR Head
Amplitude
231 E7
Temperature
240 F0
Head Flying Hours
250 FA
Read Error Retry
Rate
?
Amplitude of "thrashing" (distance of repetitive
forward/reverse head motion)
Temperature inside the hard disk housing.
?
Time while head is positioning.
Number of errors while reading from a disk.
Source: wikipedia.org
see also : http://en.wikipedia.org/wiki/Hard_disk_drive
30
Active@ Hard Disk Monitor User Guide