1
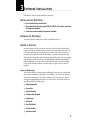
GROWEATHERLINK
®
Software
User’s Guide
For Windows™
Version 1.2
Product #7871
0
0
This equipment has been tested and found to comply with the limits for a Class B digital
device, pursuant to Part 15 of the FCC Rules. These limits are designed to provide reasonable
protection against harmful interference in a residential installation. This equipment generates, uses and can radiate radio frequency energy and, if not installed and used in accordance
with the instructions, may cause harmful interference to radio communications. However,
there is no guarantee that interference will not occur in a particular installation. If this equipment does cause harmful interference to radio or television reception, which can be determined by turning the equipment on and off, the user is encouraged to try to correct the
interference by one or more of the following measures:
• Reorient or relocate the receiving antenna.
• Increase the separation between the equipment and receiver.
• Connect the equipment into an outlet on a circuit different from that to which the
receiver is connected.
• Consult the dealer or an experienced radio/TV technician for help.
Changes or modifications not expressly approved in writing by Davis Instruments may void
the user's authority to operate this equipment.
Product Number: 7871
Davis Instruments Part Number: 7395-075
GroWeatherlink®, Version 1.2
Rev. C Manual (July 16, 1999)
Controlled online: DI:Wx:Software:GroWeatherLink
This product complies with the essential protection requirements of the
EC EMC Directive 89/336/EC.
© Davis Instruments Corp. 1999. All rights reserved.
Weatherlink is a registered trademark of Davis Instruments Corp.
GroWeather is a trademark of Davis Instruments Corp. All other brand
or product names are trademarks or registered trademarks of their
respective companies or organizations.
GROWEATHERLINK
®
Software
User’s Guide
For Windows™
Version 1.2
0
TABLE OF CONTENTS
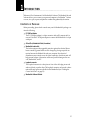
INTRODUCTION
Contents of Package . . . . . . . . . . . . . . . . . . . . . . . . . . . . . . . . . . . . . . . . .
1
HARDWARE INSTALLATION
Hardware Requirements . . . . . . . . . . . . . . . . . . . . . . . . . . . . . . . . . . . . . .
Direct Connection Hardware Requirements . . . . . . . . . . . . . . . . . . . . . .
Phone Modem Connection Hardware Requirements . . . . . . . . . . . . . . .
Radio Multi-Point Connection Hardware Requirements . . . . . . . . . . . . .
Labeling Your Cables . . . . . . . . . . . . . . . . . . . . . . . . . . . . . . . . . . . . . . . . .
Direct Connection. . . . . . . . . . . . . . . . . . . . . . . . . . . . . . . . . . . . . . . . . . . .
Typical Direct Connection . . . . . . . . . . . . . . . . . . . . . . . . . . . . . . . . . . . .
Short-Range Modem Pair (SRM) Direct Connection . . . . . . . . . . . . . . . .
Direct Connection Installation . . . . . . . . . . . . . . . . . . . . . . . . . . . . . . . . .
Phone Modem Connection . . . . . . . . . . . . . . . . . . . . . . . . . . . . . . . . . . . . .
Typical Phone Modem Installation . . . . . . . . . . . . . . . . . . . . . . . . . . . . .
Phone Modem Installation Instructions. . . . . . . . . . . . . . . . . . . . . . . . . .
A Few Notes About Phone Modem Connections . . . . . . . . . . . . . . . . . . .
Hanging Up . . . . . . . . . . . . . . . . . . . . . . . . . . . . . . . . . . . . . . . . . . . . . . .
Radio Multi-Point Connection . . . . . . . . . . . . . . . . . . . . . . . . . . . . . . . . . .
3
3
4
4
4
5
5
5
6
7
7
8
9
9
9
SOFTWARE INSTALLATION
Installing the Software . . . . . . . . . . . . . . . . . . . . . . . . . . . . . . . . . . . . . . .
Running the Software . . . . . . . . . . . . . . . . . . . . . . . . . . . . . . . . . . . . . . . .
Adding a Station . . . . . . . . . . . . . . . . . . . . . . . . . . . . . . . . . . . . . . . . . . . .
About the Walkthrough . . . . . . . . . . . . . . . . . . . . . . . . . . . . . . . . . . . . . .
Adding a Station . . . . . . . . . . . . . . . . . . . . . . . . . . . . . . . . . . . . . . . . . . .
Finding the Correct Serial Port. . . . . . . . . . . . . . . . . . . . . . . . . . . . . . . . . .
11
11
11
11
12
23
USING THE SOFTWARE
The Weather Station. . . . . . . . . . . . . . . . . . . . . . . . . . . . . . . . . . . . . . . . . .
Multiple Stations . . . . . . . . . . . . . . . . . . . . . . . . . . . . . . . . . . . . . . . . . . . .
File Menu . . . . . . . . . . . . . . . . . . . . . . . . . . . . . . . . . . . . . . . . . . . . . . . . . .
New Station . . . . . . . . . . . . . . . . . . . . . . . . . . . . . . . . . . . . . . . . . . . . . .
Open Station . . . . . . . . . . . . . . . . . . . . . . . . . . . . . . . . . . . . . . . . . . . . . .
Delete Station . . . . . . . . . . . . . . . . . . . . . . . . . . . . . . . . . . . . . . . . . . . . .
View Log . . . . . . . . . . . . . . . . . . . . . . . . . . . . . . . . . . . . . . . . . . . . . . . . .
Hang Up . . . . . . . . . . . . . . . . . . . . . . . . . . . . . . . . . . . . . . . . . . . . . . . . .
Merge Data . . . . . . . . . . . . . . . . . . . . . . . . . . . . . . . . . . . . . . . . . . . . . . .
Exit . . . . . . . . . . . . . . . . . . . . . . . . . . . . . . . . . . . . . . . . . . . . . . . . . . . . .
25
25
26
26
27
27
28
28
28
29
i
TABLE OF CONTENTS
Setup Menu . . . . . . . . . . . . . . . . . . . . . . . . . . . . . . . . . . . . . . . . . . . . . . . .
Walkthrough . . . . . . . . . . . . . . . . . . . . . . . . . . . . . . . . . . . . . . . . . . . . . .
Station Config . . . . . . . . . . . . . . . . . . . . . . . . . . . . . . . . . . . . . . . . . . . . .
Serial Port . . . . . . . . . . . . . . . . . . . . . . . . . . . . . . . . . . . . . . . . . . . . . . . .
Auto Download . . . . . . . . . . . . . . . . . . . . . . . . . . . . . . . . . . . . . . . . . . . .
Select Units . . . . . . . . . . . . . . . . . . . . . . . . . . . . . . . . . . . . . . . . . . . . . . .
Set Time . . . . . . . . . . . . . . . . . . . . . . . . . . . . . . . . . . . . . . . . . . . . . . . . .
Set Archive Interval . . . . . . . . . . . . . . . . . . . . . . . . . . . . . . . . . . . . . . . . .
Set Barometer . . . . . . . . . . . . . . . . . . . . . . . . . . . . . . . . . . . . . . . . . . . . .
Set Rain Cal. . . . . . . . . . . . . . . . . . . . . . . . . . . . . . . . . . . . . . . . . . . . . . .
Set Temp Cal . . . . . . . . . . . . . . . . . . . . . . . . . . . . . . . . . . . . . . . . . . . . . .
Set Hum Cal. . . . . . . . . . . . . . . . . . . . . . . . . . . . . . . . . . . . . . . . . . . . . . .
Set Total Rain . . . . . . . . . . . . . . . . . . . . . . . . . . . . . . . . . . . . . . . . . . . . .
Set Deg Day Threshold . . . . . . . . . . . . . . . . . . . . . . . . . . . . . . . . . . . . . .
Reset Period . . . . . . . . . . . . . . . . . . . . . . . . . . . . . . . . . . . . . . . . . . . . . .
Set Auto Clear . . . . . . . . . . . . . . . . . . . . . . . . . . . . . . . . . . . . . . . . . . . . .
Set Alarms. . . . . . . . . . . . . . . . . . . . . . . . . . . . . . . . . . . . . . . . . . . . . . . .
Leaf Wetness. . . . . . . . . . . . . . . . . . . . . . . . . . . . . . . . . . . . . . . . . . . . . .
Display Menu . . . . . . . . . . . . . . . . . . . . . . . . . . . . . . . . . . . . . . . . . . . . . . .
Bulletin . . . . . . . . . . . . . . . . . . . . . . . . . . . . . . . . . . . . . . . . . . . . . . . . . .
Summary. . . . . . . . . . . . . . . . . . . . . . . . . . . . . . . . . . . . . . . . . . . . . . . . .
Strip Charts . . . . . . . . . . . . . . . . . . . . . . . . . . . . . . . . . . . . . . . . . . . . . . .
Station Status . . . . . . . . . . . . . . . . . . . . . . . . . . . . . . . . . . . . . . . . . . . . .
Database Menu . . . . . . . . . . . . . . . . . . . . . . . . . . . . . . . . . . . . . . . . . . . . .
Download . . . . . . . . . . . . . . . . . . . . . . . . . . . . . . . . . . . . . . . . . . . . . . . .
Browse . . . . . . . . . . . . . . . . . . . . . . . . . . . . . . . . . . . . . . . . . . . . . . . . . .
Plot . . . . . . . . . . . . . . . . . . . . . . . . . . . . . . . . . . . . . . . . . . . . . . . . . . . . .
Crop Menu . . . . . . . . . . . . . . . . . . . . . . . . . . . . . . . . . . . . . . . . . . . . . . . . .
New Crop. . . . . . . . . . . . . . . . . . . . . . . . . . . . . . . . . . . . . . . . . . . . . . . . .
Open Crop . . . . . . . . . . . . . . . . . . . . . . . . . . . . . . . . . . . . . . . . . . . . . . . .
Delete Crop . . . . . . . . . . . . . . . . . . . . . . . . . . . . . . . . . . . . . . . . . . . . . . .
Reports Menu. . . . . . . . . . . . . . . . . . . . . . . . . . . . . . . . . . . . . . . . . . . . . . .
Temp/Hum Hours . . . . . . . . . . . . . . . . . . . . . . . . . . . . . . . . . . . . . . . . . .
Soil Temp. Hours . . . . . . . . . . . . . . . . . . . . . . . . . . . . . . . . . . . . . . . . . . .
Hours of Daylight. . . . . . . . . . . . . . . . . . . . . . . . . . . . . . . . . . . . . . . . . . .
PC Degree Days. . . . . . . . . . . . . . . . . . . . . . . . . . . . . . . . . . . . . . . . . . . .
Leaf Wet Hours . . . . . . . . . . . . . . . . . . . . . . . . . . . . . . . . . . . . . . . . . . . .
Chilling Requirement. . . . . . . . . . . . . . . . . . . . . . . . . . . . . . . . . . . . . . . .
Total ET . . . . . . . . . . . . . . . . . . . . . . . . . . . . . . . . . . . . . . . . . . . . . . . . . .
Sunrise and Sunset . . . . . . . . . . . . . . . . . . . . . . . . . . . . . . . . . . . . . . . . .
NOAA Setup . . . . . . . . . . . . . . . . . . . . . . . . . . . . . . . . . . . . . . . . . . . . . . .
NOAA Summarize Month . . . . . . . . . . . . . . . . . . . . . . . . . . . . . . . . . . . . .
NOAA Summarize Year . . . . . . . . . . . . . . . . . . . . . . . . . . . . . . . . . . . . . .
Using the Strip Charts . . . . . . . . . . . . . . . . . . . . . . . . . . . . . . . . . . . . . . . .
Strip Chart Basics . . . . . . . . . . . . . . . . . . . . . . . . . . . . . . . . . . . . . . . . . .
File Menu. . . . . . . . . . . . . . . . . . . . . . . . . . . . . . . . . . . . . . . . . . . . . . . . .
ii
30
30
30
32
34
35
36
37
38
38
39
39
40
41
41
42
43
44
45
45
46
46
47
48
48
49
49
50
50
51
52
53
53
55
56
58
58
60
61
62
62
63
65
67
67
69
TABLE OF CONTENTS
Add/Remove Menu . . . . . . . . . . . . . . . . . . . . . . . . . . . . . . . . . . . . . . . . .
Span Menu . . . . . . . . . . . . . . . . . . . . . . . . . . . . . . . . . . . . . . . . . . . . . . .
Options Menu . . . . . . . . . . . . . . . . . . . . . . . . . . . . . . . . . . . . . . . . . . . . .
Colors Menu . . . . . . . . . . . . . . . . . . . . . . . . . . . . . . . . . . . . . . . . . . . . . .
Using the Plot Window . . . . . . . . . . . . . . . . . . . . . . . . . . . . . . . . . . . . . . . .
Plot Basics . . . . . . . . . . . . . . . . . . . . . . . . . . . . . . . . . . . . . . . . . . . . . . .
File Menu . . . . . . . . . . . . . . . . . . . . . . . . . . . . . . . . . . . . . . . . . . . . . . . .
Add/Remove Menu . . . . . . . . . . . . . . . . . . . . . . . . . . . . . . . . . . . . . . . . .
Span Menu . . . . . . . . . . . . . . . . . . . . . . . . . . . . . . . . . . . . . . . . . . . . . . .
Options Menu . . . . . . . . . . . . . . . . . . . . . . . . . . . . . . . . . . . . . . . . . . . . .
Colors Menu . . . . . . . . . . . . . . . . . . . . . . . . . . . . . . . . . . . . . . . . . . . . . .
Using the Browse Window . . . . . . . . . . . . . . . . . . . . . . . . . . . . . . . . . . . . .
File Menu . . . . . . . . . . . . . . . . . . . . . . . . . . . . . . . . . . . . . . . . . . . . . . . .
Edit Menu . . . . . . . . . . . . . . . . . . . . . . . . . . . . . . . . . . . . . . . . . . . . . . . .
Crop Water Management . . . . . . . . . . . . . . . . . . . . . . . . . . . . . . . . . . . . . .
Irrigation . . . . . . . . . . . . . . . . . . . . . . . . . . . . . . . . . . . . . . . . . . . . . . . . .
K Factors. . . . . . . . . . . . . . . . . . . . . . . . . . . . . . . . . . . . . . . . . . . . . . . . .
Print . . . . . . . . . . . . . . . . . . . . . . . . . . . . . . . . . . . . . . . . . . . . . . . . . . . .
Notes. . . . . . . . . . . . . . . . . . . . . . . . . . . . . . . . . . . . . . . . . . . . . . . . . . . .
Graph . . . . . . . . . . . . . . . . . . . . . . . . . . . . . . . . . . . . . . . . . . . . . . . . . . .
Calculate . . . . . . . . . . . . . . . . . . . . . . . . . . . . . . . . . . . . . . . . . . . . . . . . .
PC Degree-Days . . . . . . . . . . . . . . . . . . . . . . . . . . . . . . . . . . . . . . . . . . . . .
Adding a Degree-Day Total . . . . . . . . . . . . . . . . . . . . . . . . . . . . . . . . . . .
Opening a Degree-Days Total . . . . . . . . . . . . . . . . . . . . . . . . . . . . . . . . .
Deleting a Degree-Day Total . . . . . . . . . . . . . . . . . . . . . . . . . . . . . . . . . .
PC Degree-Day Report . . . . . . . . . . . . . . . . . . . . . . . . . . . . . . . . . . . . . .
70
71
71
72
73
73
76
77
77
77
78
78
81
82
85
85
86
87
87
87
87
88
89
92
93
93
TECHNICAL REFERENCE
Archive Memory vs. Database . . . . . . . . . . . . . . . . . . . . . . . . . . . . . . . . . .
Archive Memory . . . . . . . . . . . . . . . . . . . . . . . . . . . . . . . . . . . . . . . . . . .
Database . . . . . . . . . . . . . . . . . . . . . . . . . . . . . . . . . . . . . . . . . . . . . . . . .
Calibration Numbers . . . . . . . . . . . . . . . . . . . . . . . . . . . . . . . . . . . . . . . . .
Automatic Download . . . . . . . . . . . . . . . . . . . . . . . . . . . . . . . . . . . . . . . . .
Database Organization. . . . . . . . . . . . . . . . . . . . . . . . . . . . . . . . . . . . . . . .
Station Directory . . . . . . . . . . . . . . . . . . . . . . . . . . . . . . . . . . . . . . . . . . .
Station Configuration File . . . . . . . . . . . . . . . . . . . . . . . . . . . . . . . . . . . .
Database Files . . . . . . . . . . . . . . . . . . . . . . . . . . . . . . . . . . . . . . . . . . . .
Modem String. . . . . . . . . . . . . . . . . . . . . . . . . . . . . . . . . . . . . . . . . . . . . . .
Importing WeatherLink Data into Other Programs . . . . . . . . . . . . . . . . . . .
95
95
95
95
96
97
97
97
98
98
99
iii
TABLE OF CONTENTS
iv
1 INTRODUCTION
Welcome to Davis Instruments’ GroWeatherLink Software. The WeatherLink and
software allows you to connect your personal computer to GroWeather™ stations
to store, view, plot, export, and print the weather data gathered by the station.
CONTENTS OF PACKAGE
Before proceeding, please check to make sure your GroWeatherLink package contains the following:
▲ PC COM Port Adapter
The PC COM port adapter is a 9-pin connector with an RJ connector jack in
one end. Use the PC COM port adapter to connect the WeatherLink to a 9-pin
serial port.
▲ 40 feet (12 m) WeatherLink Cable (4-conductor)
▲ WeatherLink Isolator Unit
The isolator unit provides upgraded protection against the electrical disturbances caused by ground offsets or static charges by placing an optical connection between the WeatherLink and your computer. Since electrical
disturbances cannot travel across the optical connection, the isolator unit will
help prevent lockups of the station console and possible damage to the console, WeatherLink, and PC.
▲ Loopback connector
The loopback connector is a short piece of wire with a cable plug at one end
and a red plastic cap at the other. The loopback connector can be used to determine what serial ports are available for the WeatherLink (see “Finding the
Correct Serial Port” on page 23).
▲ WeatherLink Software Diskette
1
INTRODUCTION
Contents of Package
2
2 HARDWARE INSTALLATION
There are three basic types of installations: direct connection, phone modem connection, and radio multi-point connection.
▲ Direct connection
Involves connecting the GroWeatherLink/ET Data Logger (simply referred to
as “WeatherLink”) directly to your computer. Direct connections include
installations that use Davis’ Short-Range Modem Pair (#7875) and/or a base
and station (i.e., single-point) radio.
▲ Phone modem connection
Refers specifically to any installation where the WeatherLink is connected to a
telephone modem and a second modem is connected to your computer.
▲ Radio multi-point connection
Refers to installations where more than one station transmits WeatherLink
data to your computer via radio modem.
Note: If you have not yet purchased a remote communications device—such as a telephone or
radio modem—and you would like to know more about the various options, contact our
tech support team (at 510-732-7814) and ask for the “WeatherLink Radio Communications” application note.
HARDWARE REQUIREMENTS
The required hardware differs depending on whether you are attempting to make
a direct connection, phone modem connection, or radio multi-point connection.
Direct Connection Hardware Requirements
In addition to the provided hardware, check that you have the following items.
▲ GroWeatherLink/ET Data Logger
▲ Computer running Windows™ 3.1, NT, or 95 with at least 5 MB of free disk space, 4MB
of RAM, and one free serial port
The amount of space necessary for the data files depends on the archive interval. Database files containing data stored at a 30-minute archive interval
require approximately 64K of disk space per month of data. The file size
changes in a linear fashion depending on the archive interval. For example,
data stored at a 1 minute interval requires approximately 1.92 MB/month
while the data stored at a 2 hour interval requires approximately 16K/month.
▲ Short-Range Modem Pair (SRM)—optional
For transmitting data over twisted-pair cable at a distance of up to seven miles
(11 km). SRM (#7875) and twisted pair cable (#7884) available from Davis.
▲ Radio—optional
You may use a third-party radio to transmit data from the WeatherLink to the
PC or SRM. Davis offers an installation kit for two such radios (see “Radio
Multi-Point Connection” on page 9 for more information). May also require
Alarm Output Module to conserve power.
3
HARDWARE INSTALLATION
Labeling Your Cables
Phone Modem Connection Hardware Requirements
In addition to the provided hardware, check that you have the following items.
▲ GroWeatherLink/ET Data Logger
▲ Computer running Windows™ 3.1, NT, or 95 with at least 5 MB of free disk space, 4MB
of RAM, and one free serial port
See “Direct Connection Hardware Requirements” on page 3 for an explanation of hard disk requirements.
▲ One external modem to connect to the WeatherLink
The modem must be Hayes® compatible and run at either 1200 or 2400 baud.
▲ One internal modem or external modem connected to your computer
The modem must be Hayes compatible and run at either 1200 or 2400 baud.
▲ Telephone Modem Adapter
The Telephone Modem Adapter (#7870) provides the connection between the
WeatherLink and the modem.
Radio Multi-Point Connection Hardware Requirements
In addition to the provided hardware, check that you have the following items.
▲ GroWeatherLink/ET Data Logger
▲ Computer running Windows™ 3.1, NT, or 95 with at least 5 MB of free disk space, 4MB
of RAM, and one free serial port
See “Direct Connection Hardware Requirements” on page 3 for an explanation of hard disk requirements.
▲ Spread spectrum or UHF radio modems for each weather station and base station
Davis recommends some excellent third-party radio modems: YDI Spread
Spectrum Radio Modem (available at YDI, #910-DAVIS), and RF Neulink
UHF radio modem (available at RF Neulink, #9600).
▲ One Antenna/Installation Kit for each radio modem - optional
The Antenna/Installation Kits include the hardware necessary to connect a
radio modem to a WeatherLink data logger at the field site or to a personal
computer at the base site.
LABELING YOUR CABLES
Use the label sheets provided with your GroWeather to mark your WeatherLink
cables before you begin installation. Make sure you label every cable end, including extension cables. Doing this now will help prevent confusion during the
installation and if you ever need to disconnect a cable at a later date.
▲ Place the C3/LINK label on the end of the short cable coming from the WeatherLink.
▲ Place the LINK/L1 label on the end of the long cable coming from the WeatherLink.
▲ Place a L2/LINK to PC/PC label on each end of the 40-foot (12-m) WeatherLink cable.
This cable runs from the isolator unit to the computer or external modem. On
one end of the cable, orient the label so L2 is closest to the end of the cable. On
the other end, orient the label so PC is closest to the end of the cable.
4
HARDWARE INSTALLATION
Direct Connection
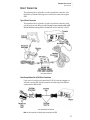
DIRECT CONNECTION
The instructions below explain how to make a typical direct connection. Also
included is an illustration showing how to make a direct connection using the
SRM.
Typical Direct Connection
The instructions below explain how to make a typical direct connection, using
only the hardware and cables provided. You may not use extension cables with
the Link Isolator, meaning that the WeatherLink must be within 48’ of the PC.
TYPICAL DIRECT CONNECTION
Short-Range Modem Pair (SRM) Direct Connection
If you want to locate the console more than 48’ (14.5 m) from the computer you
will need to use the SRM. Specific instructions for connecting via the SRM are
contained in the SRM manual.
SHORT-RANGE MODEM PAIR CONNECTION
Note: You do not need the Link Isolator when connecting via the SRM.
5
HARDWARE INSTALLATION
Direct Connection
Direct Connection Installation
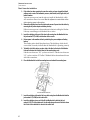
1. If the station has been operating for some time and/or you have changed the default
settings, make a note of the barometric pressure, total rainfall, and (if applicable) calibration numbers.
You must remove power from the station to install the WeatherLink, which
will cause these values to be erased. Use the software to reenter these values
after restoring power to the station.
2. Remove the mounting base from the station and remove all power from the station by
removing the AC-power adapter and battery backup.
Failure to remove power to the weather station before installing the WeatherLink may cause damage to the WeatherLink or station.
3. Insert the cable plug at the end of the short cable coming from the WeatherLink into
the jack marked C3 (To LINK) on the bottom of the console.
4. Restore power to the weather station by reattaching the power adapter and battery
backup.
The weather station should beep three times. The third beep, which should
occur within 30 seconds, indicates that the WeatherLink is operating correctly.
5. To identify which link revision you have, look at the label on the back of the WeatherLink and write down the first two letters of the manufacturing code.
If the first two letters are “LD,” you have revision D. If the first two letters are
“LE,” you have revision E. The Rev. E WeatherLink has been enhanced for use
with radio connections.
6. Place the WeatherLink inside the mounting base and reattach the mounting base.
PLACE WEATHERLINK INSIDE BASE.
7. Insert the cable plug at the end of the long cable coming from the WeatherLink into the
jack marked L1 (To LINK) on the isolator unit.
8. Insert the cable plug at one end of the 40-foot WeatherLink cable into the jack
marked L2 (To PC) on the isolator unit. Use the cable plug on the end of the cable where
the L2 side of the cable label is closest to the cable’s end.
6
HARDWARE INSTALLATION
Phone Modem Connection
9. Insert the cable plug at the other end of the 40-foot WeatherLink cable into the jack
marked PC on the PC COM port adapter. Use the cable plug on the end of the cable
where the PC side of the cable label is closest to the cable’s end.
This connection totals 48 feet (14.5 m) which is the maximum connection distance you may have without using Davis’ SRM.
10. Attach the PC COM port adapter to a free serial port on the back of your computer.
Look for a “male” connector with 9 pins.
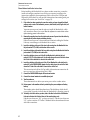
PHONE MODEM CONNECTION
The instructions below explain how to make a typical phone modem connection.
Typical Phone Modem Installation
The illustration below shows a typical phone modem connection. This involves
connecting the WeatherLink to the weather station and to a modem at the station
site and connecting your computer’s modem to a phone line, which will allow
you to “dial” the weather station.
TYPICAL PHONE MODEM INSTALLATION
7
HARDWARE INSTALLATION
Phone Modem Connection
Phone Modem Installation Instructions
Before installing the WeatherLink for a phone modem connection, you need to
install and configure a modem for use with your computer (according to the
instructions supplied by the manufacturer). Make a note of the COM port and
IRQ used by the modem. You will need this information when entering serial port
settings for the station (see “Serial Port” on page 32).
1. If the station has been operating for some time and/or you have changed the default
settings, make a note of the barometric pressure, total rainfall, and (if applicable) calibration numbers.
You must remove power from the station to install the WeatherLink, which
will cause these values to be erased. Use the software to reenter these values
after restoring power to the station.
2. Remove the mounting base from the station and remove all power from the station by
removing the AC-power adapter and battery backup.
Failure to remove power to the weather station before installing the WeatherLink may cause damage to the WeatherLink or station.
3. Insert the cable plug at the end of the short cable coming from the WeatherLink into
the jack marked C3 (To LINK) on the bottom of the console.
4. Insert the cable plug at the end of the long cable coming from the WeatherLink into the
jack marked L1 (To LINK) on the isolator unit.
5. Insert the cable plug at one end of the 40-foot WeatherLink cable into the jack
marked L2 (To PC) on the isolator unit. Use the cable plug on the end of the cable where
the L2 side of the cable label is closest to the cable’s end.
6. Insert the cable plug at the other end of the 40-foot WeatherLink cable into the jack
marked PC on the PHONE MODEM adapter. Use the cable plug on the end of the cable
where the PC side of the cable label is closest to the cable’s end.
This connection totals 48 feet (14.5 m) which is the maximum connection distance you may have without using Davis’ SRM.
7. Connect the PHONE MODEM adapter to the external modem.
8. Connect the external modem to an available phone jack.
9. Turn the modem on.
The modem must be on before you restore power to the weather station.
10. Restore power to the weather station by reattaching the power adapter and battery
backup.
The weather station should beep three times. The third beep, which should
occur within 30 seconds, indicates that the WeatherLink is operating correctly.
11. To identify which link revision you have, look at the label on the back of the WeatherLink and write down the first two letters of the manufacturing code.
If the first two letters are “LD,” you have revision D. If the first two letters are
“LE,” you have revision E. The Rev. E WeatherLink has been enhanced for use
with radio connections.
8
HARDWARE INSTALLATION
Radio Multi-Point Connection
12. Place the WeatherLink inside the mounting base.
PLACE WEATHERLINK INSIDE BASE.
13. Reattach the mounting base to the weather station.
As you do so, guide all the cables through the slots on the mounting base.
A Few Notes About Phone Modem Connections
If you indicate a phone modem connection when setting up your station (see
“Serial Port” on page 32), the software automatically dials the station (using the
phone number you provided) whenever you attempt to initiate a program action
which requires the software to “talk” to the WeatherLink.
Note: The software dials the station only after you choose Ok or Yes to initiate a program action. If
you do not wish to connect, press Esc before you are actually connected.
While connected to a phone modem station, the software displays your on-line
time in the main program window’s title bar. Once connected, the software will
remain “on line” with the phone modem station until you choose to hang up. The
software remains “on line” whether or not you are doing something which
requires it to be connected.
Hanging Up
1. Choose Hang Up.
The software prompts you to confirm that you want to hang up.
2. Choose Yes.
The software hangs up the modem and closes the On Line window.
RADIO MULTI-POINT CONNECTION
If you have more than one station, follow the instructions included with the
Installation Kit. If you have only one station, treat the system as a “Direct Connection” on page 5.
9
HARDWARE INSTALLATION
Radio Multi-Point Connection
10
3 SOFTWARE INSTALLATION
This chapter covers software installation and setup.
INSTALLING THE SOFTWARE
1. Place the Install Disk in your disk drive.
2. Choose Run from the File menu, type A:SETUP (or B:SETUP) in the text box, and choose
OK to begin the installation.
3. Follow the on-screen prompts to complete the installation.
RUNNING THE SOFTWARE
To run the software, double-click on the GroWeatherLink icon.
ADDING A STATION
In order to interact with your station, you must “add” a station, which entails
naming the station, configuring the software to work with that station and with
your computer hardware, and setting station values such as time, barometric
pressure, total rainfall, and calibration numbers. For performance reasons, the
software reads these values from the station configuration file saved on your hard
disk rather than from the station itself. Therefore, you must set station values
from the software. If you set station values from the station itself, the readings
you see in the bulletin, database, and plots may not agree with your station’s
readings.
About the Walkthrough
The software includes a station setup walkthrough which steps you through the
entire station configuration procedure. After adding a new station, the software
automatically prompts you to indicate whether or not you want to be walked
through the configuration procedure. If you choose Yes, the software takes you
through the following dialog boxes:
▲ Station Configuration
▲ Choose Units
▲ Serial Port Settings
▲ Set Degree-Day Thresholds
▲ Set Barometer
▲ Set Rain Cal
▲ Enter Total Rainfall
▲ Set Time and Date
▲ Set Archive Interval
11
SOFTWARE INSTALLATION
Adding a Station
▲ Start Growing Period
▲ Set Auto Clear
▲ Set Station Alarms
▲ Set Auto Download Time(s)
▲ Set Leaf Wetness or Soil Temperature
You may, of course, choose No and set up the station by choosing all of the necessary commands from the menus. A Walkthrough command is included in the
Setup menu which allows you to go through the walkthrough procedure at any
time.
At each step in the walkthrough procedure, the software will provide confirmation boxes prompting you to indicate whether or not you wish to continue.
WALKTHROUGH CONFIRMATION BOX
To continue, choose OK. To skip this step and move to the next step, choose Skip.
To cancel the entire walkthrough procedure, choose Cancel.
Adding a Station
Follow the procedure below to add a station. Note that where necessary in the
procedure below, the software will automatically dial a phone modem station. See
“A Few Notes About Phone Modem Connections” on page 9 for instructions on
dialing and hanging up.
Note: Repeat this procedure for each station you want to add.
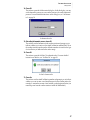
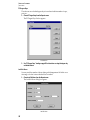
1. Choose New Station from the main menu.
The software opens the Add New Station dialog box.
ADD NEW STATION DIALOG BOX
12
SOFTWARE INSTALLATION
Adding a Station
2. Type the station name into the text box.
The station name may be up to 40 characters/spaces long. Note that the software uses the first eight characters of the station name (not counting spaces or
punctuation marks) as the name of the directory into which it saves this station’s database and configuration files. The first eight characters of each station name must, therefore, be unique. The software also uses the first three
characters as the file extension for that station’s database files (the first three
characters need not be unique).
3. Choose OK.
The software saves the station name, creates a directory for that station using
the first eight characters in the station name (not including punctuation and
spaces), and prompts you to indicate whether you want to enter the walkthrough procedure.
BEGIN WALKTHROUGH CONFIRMATION
4. To begin the walkthrough, choose Yes.
The software prompts you to confirm that you want to select your station and
accessory options.
5. Choose OK.
The software opens the Station Configuration dialog box. In this dialog box,
you may enter information about your station. For more detailed instructions
on this dialog box, see “Station Config” on page 30.
STATION SETUP DIALOG BOX
6. When finished entering information, choose OK.
The software saves the information and prompts you to confirm that you
want to select the units of measure in which information is displayed.
13
SOFTWARE INSTALLATION
Adding a Station
7. Choose OK.
The software opens the Choose Units dialog box. In this dialog box, you may
set the units of measure in which you want the software to display, plot, and
print information.
UNIT PREFERENCES DIALOG BOX
8. When finished selecting units of measure, choose OK.
The software saves the information and prompts you to confirm that you
want to select your serial port options.
14
SOFTWARE INSTALLATION
Adding a Station
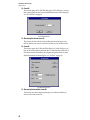
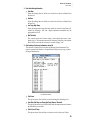
9. Choose OK.
The software opens the Serial Port Settings dialog box. In this dialog box, you
may select all of your communications options, including serial port, IRQ line,
modem baud rate, phone number, etc. For more detailed instructions on this
dialog box, see “Serial Port” on page 32.
SERIAL PORT SETTINGS DIALOG BOX
▲ Serial Port
Select the serial port. If you do not know the serial port setting for your
station, you may use the Loopback button in this dialog box to determine
the correct settings. see “Finding the Correct Serial Port” on page 23 for
instructions on using Loopback.
▲ Link Revision
Select the link revision. To determine which revision you have, check the
manufacturing code on the back of the WeatherLink. The second letter
(the first letter should be an “L”) is the revision letter of the WeatherLink.
▲ Connection Type
Choose the type of connection from the drop down list. For most connections, “Transparent” is the appropriate choice. Otherwise, if applicable,
choose “Phone Modem” or the appropriate multi-point radio modem. (See
“Serial Port” on page 32 for details.)
▲ Radio Name
If you are using a multi-point radio modem to connect to the WeatherLink,
select the name of the radio from the drop down list. The name should
match the name you used when configuring the radio.
▲ Phone
If you are using a telephone modem to connect to the WeatherLink, enter
the modem’s phone number in this field.
15
SOFTWARE INSTALLATION
Adding a Station
▲ Modem String
The default modem string should work for almost all modems. Before
changing the modem string, consult the README.TXT file for an explanation of what each part of the string means.
10. Test your connection to the weather station by choosing Connection Test.
The test will attempt to communicate with the station. If successful, you will
be informed that you are connected to a GroWeather station. If unsuccessful,
use Loopback to find the correct settings in a transparent connection(see
“Finding the Correct Serial Port” on page 23), or use the Modem Test to test
and confirm that a modem is attached at the specified COM port.
11. Once the serial port settings are correct, choose OK.
The software prompts you to confirm that you want to set the station’s degreeday thresholds.
12. Choose OK.
The software opens the Set Deg-Day Threshold dialog box. In this dialog box
you may set the high and low degree-day thresholds on the station. This does
not affect the degree-day totals calculated by the software (see “PC Degree
Days” on page 58).
SET DEG-DAY THRESHOLDS
13. After setting degree-day thresholds, choose OK.
The software sets the degree-day thresholds and prompts you to indicate
whether you want to set the barometer.
16
SOFTWARE INSTALLATION
Adding a Station
14. Choose OK.
The software opens the Set Barometer dialog box. In this dialog box, you may
set the barometric pressure on your weather station to the correct barometric
pressure. For more detailed instructions on this dialog box, see “Set Barometer” on page 38.
SET BAROMETER DIALOG BOX
15. After setting the barometric pressure, choose OK.
The software sets the barometer on the weather station and prompts you to
indicate whether you want to set the rainfall calibration number (Rain Cal) on
the weather station (to make sure the calibration number is correct for the type
of rain collector you indicated in the station setup).
16. Choose OK.
The software opens the Set Rain Cal confirmation box. For more detailed
instructions on this box, see “Set Rain Cal” on page 38.
SET RAIN CAL CONFIRMATION BOX
17. Choose Yes.
The software sets the rainfall calibration number and prompts you to indicate
whether you want to enter a total rainfall amount for the weather station (for
example, to reenter the amount of total rainfall you had registered before you
removed power from the weather station to install the Weatherlink).
17
SOFTWARE INSTALLATION
Adding a Station
18. Choose OK.
The software opens the Set Total Rain dialog box. In this dialog box, you may
enter a total rainfall amount. For more detailed instructions on this dialog box,
see “Set Total Rain” on page 40.
SET TOTAL RAIN DIALOG BOX
19. After entering the total rain, choose OK.
The software sets the total rain on the weather station and prompts you to
indicate whether you want to set the time and date on your weather station.
20. Choose OK.
The software opens the Set Time and Date dialog box. In this dialog box, you
may set the weather station’s time and date. It is important that you do this so
the weather station, Weatherlink, and computer are synchronized. For more
detailed instructions on this dialog box, see “Set Time” on page 36.
SET TIME AND DATE DIALOG BOX
21. After entering the time and date, choose OK.
The software saves the settings and prompts you to indicate whether you
want to set the archive interval.
18
SOFTWARE INSTALLATION
Adding a Station
22. Choose OK.
The software opens the Set Archive Interval dialog box. In this dialog box, you
may set the interval at which data is stored to the Weatherlink. For more
detailed instructions on this dialog box, see “Set Archive Interval” on page 37.
SET ARCHIVE INTERVAL DIALOG BOX
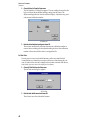
23. When finished selecting an archive interval, choose OK.
The software informs you that this procedure will clear the archive memory.
24. Choose OK.
The software sets the archive interval and clears your archive memory. It then
prompts you to indicate whether you want to start the growing period on the
station.
25. Choose OK.
The software prompts you to confirm that you want to restart the period on
your station. Consult your station’s manual for information on the period.
26. Choose Yes.
The software clears all period totals and averages and begins a new period on
the station. It then prompts you to indicate whether you want to set the AutoClear status on the station.
19
SOFTWARE INSTALLATION
Adding a Station
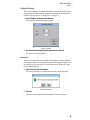
27. Choose OK.
The software opens the Set AutoClear dialog box. From this dialog box, you
may select the which highs, lows, and daily totals should be cleared by the station’s AutoClear feature as set the time at which they should be cleared each
day. For more detailed instructions on this dialog box, see “Set Auto Clear” on
page 42.
SET AUTOCLEAR DIALOG BOX
28. When finished selecting the functions you want cleared, choose OK.
The software sets the station’s AutoClear feature and prompts you to indicate
whether you want to set the station’s alarms.
20
SOFTWARE INSTALLATION
Adding a Station
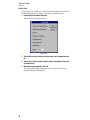
29. Choose OK.
The software opens the Set Station Alarms dialog box. From this dialog box
you may set alarm points for any of your station’s alarms. For more detailed
instructions on this dialog box, see “Set Alarms” on page 43.
SET STATION ALARMS.
30. After entering alarm thresholds, choose OK.
The software sets the station’s alarms and prompts you to indicate whether
you want to set up the software automatic download feature.
21
SOFTWARE INSTALLATION
Adding a Station
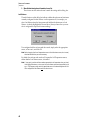
31. Choose OK.
The software opens the Set AutoDownload Time(s) dialog box. From this dialog box, you may select the time (s) at which you want the software to automatically download data from the WeatherLink each day. For more detailed
instructions on this dialog box, see “Auto Download” on page 34.
SET AUTODOWNLOAD TIME(S) DIALOG BOX
32. After selecting automatic download times, choose OK.
The software sets the autodownload times for this station, and prompts you to
indicate if you want to log leaf wetness or soil temperature data.
33. Choose OK.
The software opens the Set Leaf Wetness dialog box. From this dialog box you
may configure your software and console to log either leaf wetness or soil
temperature data. For more detailed instructions on this dialog box, see “Leaf
Wetness” on page 44.
34. After selecting a sensor, choose OK.
The software informs you that you have completed the walkthrough procedure, and prompts you to indicate whether you want to return to the beginning of the walkthrough.
35. To complete the walkthrough, choose No.
The software returns you to the main menu.
36. If necessary, hang up a phone modem connection (see “Hang Up” on page 28).
22
SOFTWARE INSTALLATION
Finding the Correct Serial Port
FINDING THE CORRECT SERIAL PORT
The software contains a procedure for locating the serial port to which your station is connected or determining whether that serial port is working.
Note: This procedure will only work for direct connections. If you are making a phone modem connection, you may want to simply check the communications software you normally use for the
correct serial port setting. Otherwise, you must consult the documentation supplied with your
modem.
In order to use this procedure, you will need the loopback connector (the short
wire with a phone jack on one end and a red plastic tip on the other) supplied
with your GroWeatherlink software package.
1. If necessary, disconnect the 40-foot WeatherLink cable from the PC COM port adapter.
2. Insert the loopback connector into the PC COM port adapter.
3. Choose Serial Port from the File menu.
The software opens the Serial Port Settings dialog box.
SERIAL PORT SETTINGS
4. Choose Loopback.
The software will search the currently selected serial port for the loopback
connector.
23
SOFTWARE INSTALLATION
Finding the Correct Serial Port
5. Choose OK.
If the software located the loopback connector, it returns you to the Serial Port
Settings dialog box. Otherwise, the software prompts you to indicate whether
you want to check all other standard serial ports.
CHECK STANDARD SERIAL PORTS CONFIRMATION
6. Choose OK.
The software will search all standard serial ports for the loopback connector.
When finished, the software will either inform you that it could not locate the
loopback connector or it will inform you of the COM port at which it located
the connector.
LOOPBACK CONNECTOR FOUND CONFIRMATION
7. Choose OK.
The software returns you to the Serial Port Settings dialog box. You will notice
that the software selects the correct COM port.
8. Choose OK.
The software saves these settings.
24
4 USING THE SOFTWARE
Everything you need to know about running the software (once it is correctly
installed) is explained in this chapter.
THE WEATHER STATION
Depending on which optional sensors you have connected to your station, certain
information and options within the software may not function or display data.
The software may only display and plot data for which your weather station has a
sensor. For example, if you do not have the external temperature/humidity sensor, you may not plot, view, or print humidity information. The area set aside for
this information on the bulletin, summary screen, browser, etc. will simply be
blank.
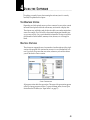
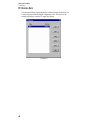
MULTIPLE STATIONS
The software can support the use of any number of weather stations with a single
version of the program. Each station must connect to its own WeatherLink, however. If you have set up more than one station, whenever you load the software
you will be asked to choose a station.
CHOOSE A STATION DIALOG BOX
All program actions affect the open station. The name of the open station appears
at the top of many program windows. To open a different station, choose Open
Station from the File menu (see “Open Station” on page 27).
25
USING THE SOFTWARE
File Menu
FILE MENU
The file menu contains commands relating to station files and stations. Each command is explained separately below.
New Station
Each station connected to the computer must have its own “station” within the
software. This tells the software into which database new information should be
saved and provides the necessary communication settings (serial port, IRQ, etc.).
1. Choose New from the File menu.
The New Station dialog box appears.
ADDING A NEW STATION
2. To add a station, type the desired station name (up to 40 characters/spaces) into the
Station name text box; choose OK.
The software saves the station, creates a directory for that station using the
first eight characters in the station name (not including punctuation and
spaces), and prompts you to indicate whether you want to enter the walkthrough procedure (see “About the Walkthrough” on page 11).
26
USING THE SOFTWARE
File Menu
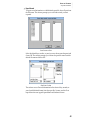
Open Station
Only one station may be open at a time. That way the software knows into which
database downloaded data should be saved, which communications settings to
use, which database to use when plotting, etc.
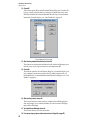
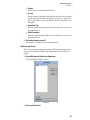
1. Choose Open Station from the File menu.
The Open Station dialog box appears.
OPEN STATION
2. Choose a station from the list box on the left and choose OK to open that station.
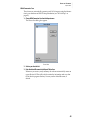
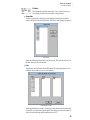
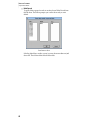
Delete Station
You may delete a station from the software quickly and easily. Deleting a station
removes the station directory and all files and subdirectories from your hard disk.
1. Choose Delete Station from the File menu.
The Delete Station dialog box appears.
DELETE STATION
2. Select a station from the list box on the left and choose OK.
You will be prompted to confirm that you want to delete the station.
3. Choose OK.
The software deletes the station and all related files.
27
USING THE SOFTWARE
File Menu
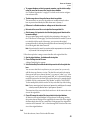
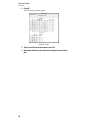
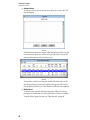
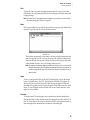
View Log
Information about the automatic download of your station(s) is automatically
written to a file called “download.log” which is saved onto the hard disk in the
directory “ahead” of the station’s directory. The log will sow you whether the
download was successful or not for each station and give you the time and date at
which it started and completed.
Note: It is possible, after continued use, for the log file to become too large for Window’s Notepad to
open. If this occurs, delete the entire file from your hard disk. The software will create a brand
new file at the next automatic download.
1. Choose View Log from the File menu.
The automatic download log appears.
AUTOMATIC DOWNLOAD LOG
2. To close the log window, choose Exit from the File menu.
Hang Up
To hang up on a phone modem connection, choose Hang Up from the File menu.
Merge Data
To fill in missing weather data, you can supplement one weather station’s data
with another. The database you want to supplement is called the original database; the database that provides the missing data is called the source database.
Before merging the databases, keep in mind the following tips and suggestions:
▲ Make sure you have enough space on the disk containing the Windows Temp directory to hold a file with the combined size of the original and source databases.
The operation creates a new data file in the Windows Temp directory that is
erased once the merge operation is complete.
▲ Best results are obtained if the original files and the source files have the same
archive interval.
If the archive intervals are different, try to merge the file with the longer
archive interval into the one with the shorter interval. For example, if one
database has 15-minute intervals and another has 30, open the station with the
15-minute interval and merge the 30-minute interval files into it. This way the
shorter interval database will not add twice as many, possibly conflicting, data
points.
28
USING THE SOFTWARE
File Menu
▲ To compare databases archived on separate computers, copy the station configuration file, as well as the source files, from the source database.
See “Database Organization” on page 97 for details on the station configuration and source files.
▲ The data merge does not change the time or data of merged data.
This means that it can not solve the problem of weather stations that have
been re-powered and thereby had their dates reset to January 1.
▲ Differences in calibration numbers or settings are not taken into account.
▲ Data notes in the source file are not copied into the merged data file.
▲ After the merge, it is important to check the data (paying special attention to the
barometer readings).
Always examine merge results critically after performing a data merge. Use
the “Edit a Record” feature (page 79) to fine tune the data as needed. If you are
not satisfied with the results of the merge, you can restore the original,
unmerged data file by deleting the merged data file and renaming the backup
file to the original three-letter extension.
Note: Only one backup file is made. If you perform multiple merge operations on the same file,
only the results of the last merge can be undone.
Follow the steps below to merge a source data files with original data files:
1. Open the original database - the database with missing data.
2. Choose File Merge from the File menu.
A Merge Data dialog box appears.
3. Select the data file(s) that contain the data that you want to add to the original database.
You can access data files in any directory on your system, but you can only
add files from one directory at a time. The data files are found in the station
directory and will have a name of the form "yyyy-mm.ext" where "yyyy" is the
four digit year, "mm" is the two digit month, and "ext" is the station extension,
usually the same as the first letters of the station directory. For example the file
for March 1999 for a station named "My Weather" would be "1999-03.MYW".
To select multiple files, hold down the Ctrl-key or the Shift-key while clicking.
Note: Directory names longer than 8 characters will appear with a modified name. For example,
a directory named “My Weather Station” might appear as “Myweat~1.”
The extensions of the source data files do not have to be the same as the extensions of the orginal files.
4. Choose OK to merge the selected files (source data) into the original database.
All data from the original database will be preserved in the merge, and any
data points that are missing will be supplied by the source files. If the original
database already has a file for a month that is being merged, the original file’s
extension will be renamed “.bak” so that the merged file can take on the extension of the original database.
Exit
To exit the software, choose Exit from the File menu.
29
USING THE SOFTWARE
Setup Menu
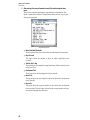
SETUP MENU
The commands in the Setup menu relate to station and software setup. Each of the commands is explained separately
below.
Walkthrough
The station setup walkthrough automatically steps you
through the entire station configuration procedure. It is
explained in some detail in“About the Walkthrough” starting
on page 11.
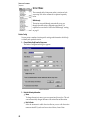
Station Config
You may enter a number of station-specific settings and information which help
to identify each particular station.
1. Choose Station Config from the Setup menu.
The Station Configuration dialog box appears.
STATION CONFIGURATION
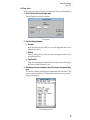
2. Enter the following information:
▲ Name
To change the station’s name, type a new name into this text box. The software automatically changes the name of all station files and directories.
▲ Rain Collector
Select the increment in which the rain collector you use with the station
measures rainfall. If you do not have a rain collector, choose None.
30
USING THE SOFTWARE
Setup Menu
▲ Barometer
The station’s built-in barometer is only really accurate between 50˚F and
90˚F (10˚C to 32˚C). The software will display the barometer graph on the
bulletin or the summary. Installations in which the console is located outside may encounter inaccurate barometer readings when outside of this
temperature range. If you experience this problem and if the inaccurate
readings bother you, turn this option off.
▲ Latitude and Longitude
Enter your latitude and longitude. The software uses latitude and longitude when determining net radiation which is used in the calculation of
Evapotranspiration.
Note: If you do not enter latitude and/or longitude, the software will use the ET calculated
by the console, which is not as precise as the software.
▲ Time Zone
Select the time zone in which the station is located from the drop-down list
box. The software uses the station’s time zone when determining net radiation which is used in the calculation of Evapotranspiration.
▲ Daylight Savings Time
If you are currently on Daylight Savings Time, select this option. The software uses Daylight Savings Time information when determining net radiation which is used in the calculation of Evapotranspiration.
▲ After download create text file of last 2 days
The software is capable of automatically creating a text file (“download.txt”) which contains all downloaded records for the last 2 days (the
day on which you downloaded and the previous day) after each download.
▲ Clear archive memory after download
Data is stored in the WeatherLink’s archive memory (see “Archive Memory” on page 95) until you clear it. You may decide to have the software
automatically clear the archive memory whenever it downloads data by
selecting this option. Clearing after each download will decrease the time
it takes to download because there will be less “accumulated” data in the
archive memory. Not clearing after each download allows you to store
data into multiple databases (if more than one person uses a single
weather station, for example) by downloading the archive memory more
than once.
▲ Sound alarm in Status Window
To have the computer sound its own alarm (by beeping) in the Station Status window (see “Station Status” on page 47) when an alarm is triggered,
select this option.
3. When finished, choose OK.
The software save the station configuration settings.
31
USING THE SOFTWARE
Setup Menu
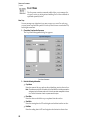
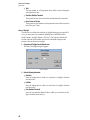
Serial Port
In order to communicate with the WeatherLink and station, you need to specify
communications settings for the station.
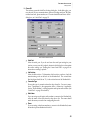
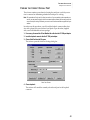
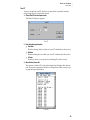
1. Choose Serial Port from the Setup menu.
The Serial Port Settings dialog box appears.
SERIAL PORT SETTINGS
2. Enter the following information:
▲ Serial Port
Select the serial port to which the WeatherLink (or modem) is connected.
▲ Baud Rate
Unless you are using a modem which only operates at 1200 baud, leave
the baud rate setting at 2400.
Note: If you are using a 1200 baud modem, use a ball point pen or paper clip to flip the dip
switch on the back of the WeatherLink data logger.
▲ Connection Type
Choose the type of connection from the drop down list:
▲ Transparent: Direct (local) connections, Short-Range Modem
connections, or point-to-point (one base station, one field station) radio
connections. Used when no dialing or addressing is needed.
▲ Telephone Modem: Telephone modem or cellular telephone modem
connections. For any device using standard AT commands.
▲ YDI Model 910 Multi-Point: For multi-point (single base station,
multiple field stations) connections through YDI radios.
▲ RF Neulink 9600 Multi-Point: For multi-point (single base station,
multiple field stations) connections through RF Neulink radios.
32
USING THE SOFTWARE
Setup Menu
▲ Radio Name
If you are using a YDI or RF Neulink radio, select the remote radio’s name
from the drop down list (this should match the name you used when configuring the radio).
Note: If you have manually configured the remote radio to a custom name, select the Radio
Name: “Other” and type the name (or ID number) into the Phone text box.
▲ Rotary Dial
Select this check box if your phone is rotary dial (as opposed to touch
tone).
▲ Phone
Enter the phone number for the modem connected to the station in the text
box. Make sure to enter the area code and any necessary prefixes (for
example, 1, 011, etc.). You may enter the following special characters.
▲ Enter a comma (",") to cause the modem to pause before dialing the
next digit. You may enter more than one comma to increase the length
of time for which the modem pauses.
▲ Enter a “w” to cause the modem to wait for a dial tone before dialing
the next digit.
▲ Modem String
Enter the desired modem initialization string in the text box. The default
modem initialization string should work in almost all cases. Before changing the modem string, consult the online help file or the readme.txt file for
an explanation of what each part of the string means.
3. When finished selecting options, choose Connection Test.
The software will check the connection to the station (or modem) using the
current settings and indicate whether or not it was successful. If you cannot
connect to the weather station, you may use Loopback (see “Finding the Correct Serial Port” on page 23) to determine the correct serial port, or the Modem
Test to check and confirm that a modem is attached at the specified COM port.
Note: From the Serial Port Settings window, you can also run a “Link Quality Test.” This test
will check the general quality of the connection (it is most useful in wireless connections). The computer will continually request data packets and report the number of valid
packets received and the number of errors which occurred for the listed time periods.
4. Once the serial port settings are correct, choose OK.
The software saves the communications settings.
33
USING THE SOFTWARE
Setup Menu
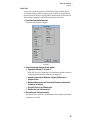
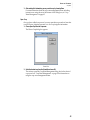
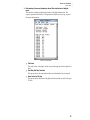
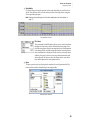
Auto Download
You may select the time(s) at which the station automatically downloads data
each day. For more information on the automatic download feature see “Automatic Download” on page 96.
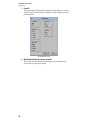
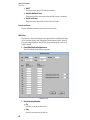
1. Choose Auto Download from the Setup menu.
The Set Auto Download Time(s) dialog box appears.
SET AUTO DOWNLOAD TIME(S)
2. Enter the following information:
▲ Download Times
Select the hours at which the software should automatically download
information from this station by clicking on the desired hour in the list.
You may select as many download times as you want; the software will
download data from your station at each of the specified times. To clear all
of the selections, choose Clear.
▲ Offset Time
If you want the software to download this station a specific number of
minutes after the selected hour(s), enter the number of minutes here. For
example, In the illustration above, the software would automatically
download at 12:02 am and 12:02 pm. The offset time is especially useful is
you have multiple stations and want to stagger download times during a
single hour.
Note: We recommend offsetting the download by at least a few minutes to avoid conflicts.
The WeatherLink cannot create a new record while a download is in progress. If a
record on the hour is delayed and the offset time is “0”, ET will be calculated incorrectly.
3. After setting the download time(s), choose OK.
The software saves the automatic download time settings.
34
USING THE SOFTWARE
Setup Menu
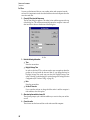
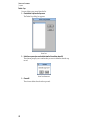
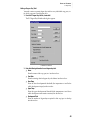
Select Units
You may select the units of measure in which data is displayed within the software. All data displays (bulletin, summary, plots, database, etc.) display data in
the selected units of measure. Choosing units of measure in the software does not
affect the units of measure in which data is displayed on the console.
1. Choose Select Units from the Setup menu.
The Choose Units dialog box appears.
CHOOSE UNITS
2. Select the desired units of measure for each condition:
▲ Temperature: Fahrenheit (˚F) or Celsius (˚C)
Wind chill, dew point, degree-days, and temperature-humidity index are
all displayed in the same unit of measure as temperature.
▲ Barometer: Inches of Hg (in), Millimeters of Hg (mm), Millibars (mb), or
Hectopascals (hPa)
▲ Wind Speed: Miles per Hour (mph), Knots (knot), Kilometers per Hour (km/hr),
or Meters per Second (m/s)
▲ Rain and ET: Inches (in) or Millimeters (mm)
▲ Wind Run: Miles (mi) or Kilometers (km)
3. After selecting units of measure, choose OK.
The software saves your choices. All information will be displayed in the units
of measure you selected.
35
USING THE SOFTWARE
Setup Menu
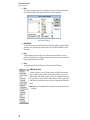
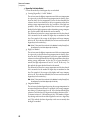
Set Time
You may set the time and date on your weather station and computer from the
software. It is important to make sure that both the station and computer have the
same time and date.
1. Choose Set Time from the Setup menu.
The Set Time dialog box appears. The station’s time and date appear at the top
of the dialog box. The software automatically enters the computer’s time and
date into the text boxes at the bottom of the dialog box.
SET TIME
2. Enter the following information:
▲ Time
Enter the current time.
▲ Daylight Savings Time
In order to calculate ET, the software makes some assumptions about the
position of the sun based the time and date. If you change the time for
Daylight Savings Time, make sure you select the Daylight Savings Time
option. Selecting (or deselecting) this option changes the setting in station
configuration (see “Station Config” on page 30).
▲ Date
Enter the current date.
▲ Set the PC time also
If you want the software to change both the station’s and the computer’s
time and date, select this option.
3. After entering time and date, choose OK.
The software prompts you to indicate whether you want to clear your archive
as well.
4. Choose Yes or No.
The software sets the time and date on the station and the computer.
36
USING THE SOFTWARE
Setup Menu
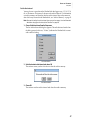
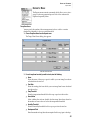
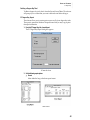
Set Archive Interval
You may choose to store data to the WeatherLink data logger every 1, 5, 10, 15, 30,
60, or 120 minutes. This interval is known as the archive interval. For information
on archive memory and the effect that the archive interval has on the amount of
data which may be stored in the WeatherLink, see “Archive Memory” on page 95.
Note: Be aware that setting the archive interval clears your archive memory. You should download
data before changing archive interval (see “Download” on page 48).
1. Choose Set Archive Interval from the Setup menu.
The Set Archive Interval dialog box appears. The radio button selected when
the dialog opens (in this case, “10 min,”) indicates the WeatherLink’s current
achive interval setting.
SET ARCHIVE INTERVAL
2. Select the desired archive interval and choose OK.
The software warns you that it is about to clear the archive memory.
CLEAR ARCHIVE WARNING
3. Choose OK.
The software sets the archive interval and clears the archive memory.
37
USING THE SOFTWARE
Setup Menu
Set Barometer
You need to set the station’s barometer using the software. For performance reasons, the software saves the necessary calibration number for the barometer in the
station’s configuration file, rather than reading it from the station itself. Therefore,
in order for the software to display the correct barometric pressure, you must set
the station’s barometer from the software.
1. Choose Set Barometer from the Setup menu.
The software opens the Set Barometer dialog box.
SET BAROMETER
2. Enter the correct barometric pressure and choose OK.
The software saves the change in barometric pressure to both the station and
the station’s configuration file.
Set Rain Cal
You may set the rainfall calibration number on your weather station using the
software to make sure your weather station has the correct rainfall calibration
number for the type of rain collector you use. Based on the type of rain collector
you selected in station configuration (see “Station Config” on page 30), the software automatically changes your station’s rainfall calibration number to the correct setting.
Note: Consult your station manual for a more detailed description of the rainfall calibration number.
1. Choose Set Rain Cal from the Setup menu.
The software prompts you to confirm that you wish to change the rainfall calibration number.
SET RAINFALL CALIBRATION CONFIRMATION
2. Choose Yes.
The software sets the rainfall calibration number on your station.
38
USING THE SOFTWARE
Setup Menu
Set Temp Cal
You need to set the station’s temperature calibration numbers using the software.
For performance reasons, the software saves the necessary calibration numbers
for temperature in the station’s configuration file, rather than reading it from the
station itself. Therefore, in order for the software to display the correct temperature readings, you must set the station’s temperature calibration numbers from the software.
Note: Consult your station manual for a more detailed description of temperature calibration numbers.
1. Choose Set Temp Cal from the Setup menu.
The Set Temperature Cal dialog box appears. The raw reading shown in this
dialog box indicates the unadjusted reading coming from the sensor. The
adjusted reading indicates what the software displays, adjusted for any previously entered calibration number.
SET TEMPERATURE CAL
2. Enter the desired adjusted reading and choose OK.
The software automatically calculates the necessary calibration number to
convert the raw reading into the adjusted reading and saves that calibration
number to the station and the station’s configuration file.
Set Hum Cal
You need to set the station’s humidity calibration number using the software. For
performance reasons, the software saves the necessary calibration numbers for
humidity in the station’s configuration file, rather than reading it from the station
itself. Therefore, in order for the software to display the correct humidity reading,
you must set the station’s humidity calibration number from the software.
Note: Consult your station manual for a more detailed description of humidity calibration number.
39
USING THE SOFTWARE
Setup Menu
1. Choose Set Hum Cal from the Setup menu.
The Set Humidity Cal dialog box appears. The raw reading shown in this dialog box indicates the unadjusted reading coming from the sensor. The
adjusted reading indicates what the software displays, adjusted for any previously entered calibration number.
SET HUMIDITY CAL
2. Enter the desired adjusted reading and choose OK.
The software automatically calculates the necessary calibration number to
convert the raw reading into the adjusted reading and saves that calibration
number to the station and the station’s configuration file.
Set Total Rain
You may want to enter a total rainfall amount to reflect any rainfall which
occurred before you obtained your station or before you started using the software. In order for the software’s rainfall totals to remain consistent with the station’s totals, you must enter total rainfall from the software.
1. Choose Set Total Rain from the Setup menu.
The Set Total rain dialog box appears.
SET TOTAL RAIN
2. Enter the total rainfall amount and choose OK.
The software saves the total rainfall amount.
40
USING THE SOFTWARE
Setup Menu
Set Deg Day Threshold
You may set your degree-day thresholds from the software. Note that the station’s
degree-day thresholds and totals are completely separate from the degree-days
tracked by the software (see “PC Degree Days” on page 58).
1. Choose Set Deg Day Threshold from the Setup menu.
The Set Deg Day Threshold dialog box appears.
SET DEG DAY THRESHOLD
2. Enter the desired low and high threshold for degree-days and choose OK.
The software saves the thresholds.
Reset Period
You may restart the period on the weather station using the software. When the
station restarts the period it clears all period totals and averages and begins accumulation new totals and averages. For more information on the period, consult
your GroWeather manual.
1. Choose Reset Period from the Setup menu.
The software prompts you to confirm that you want to restart the period.
RESET PERIOD CONFIRMATION
2. Choose Yes.
The station clears all period total and averages and start a new period.
41
USING THE SOFTWARE
Setup Menu
Set Auto Clear
You may quickly set up the station’s AutoClear feature using the software (see the
GroWeather manual for more details on the station’s AutoClear feature).
1. Choose Set Auto Clear from the Setup menu.
The Set Auto Clear dialog box appears.
SET AUTO CLEAR
2. To turn AutoClear on for a function (or group of functions), select the appropriate check
box.
3. Enter the time at which you want the station to clear the selected highs and lows each
day into the text box.
4. When finished setting up AutoClear, choose OK.
The software automatically configures the station’s AutoClear function to
match the settings in this dialog box.
42
USING THE SOFTWARE
Setup Menu
Set Alarms
You may quickly set the thresholds for the station’s alarms using the software.
The software also includes two “user alarms” which may be turned on and off
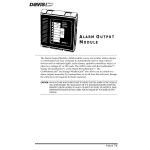
from the software. These two alarms are for use with the Alarm Output Module
and may be used to manually start or stop an external device.
1. Choose Set Alarms from the Setup menu.
The Set Alarms dialog box appears.
SET ALARMS
2. Enter the following information:
▲ High/Low Alarm
For all of the standard high/low alarms, enter the desired alarm threshold
into the text box. To clear an alarm, delete the contents of the text box.
▲ Dew Point
Turn on the dew point alarm by selecting the check box. Clear the alarm by
“de-selecting” the check box.
▲ Barometer
Select the desired change per hour which will trigger the barometer alarm.
To clear the alarm, select Off.
▲ Time
Enter the time at which the alarm should be triggered into the text box.
▲ User Alarms (1 & 2)
These alarms allow you to trigger a device connected to the Alarm Output
Module manually. To turn on either alarm, select the desired check box.
Keep in mind that you will need to manually shut off this alarm.
43
USING THE SOFTWARE
Setup Menu
3. When finished entering alarm information, choose Set.
The software sets the stations alarms to match the settings in this dialog box.
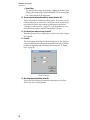
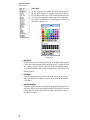
Leaf Wetness
The radio buttons on this dialog box indicate whether the software and station are
currently configured for leaf wetness or soil temperature. If, for example, you
select Leaf Wetness from the Setup menu and find that the button next to Leaf
Wetness is already highlighted (as shown below), then you know that your console is configured to expect leaf wetness readings.
To reconfigure both the software and the console, simply select the appropriate
sensor, or leave as is, and click OK.
Note: Before changing from the soil temperature sensor to the leaf wetness sensor (or vice versa),
download data and clear your archive memory.
By default, the software and console will assume the Soil Temperature sensor,
rather than the Leaf Wetness sensor, is installed.
Note: If, at any point, your data indicate numbers appropriate to soil temperature when you intend
to be logging leaf wetness, or vice versa, then your software and console are probably out of
sync. If this happens, simply select the appropriate sensor in the above dialog box and click
OK to configure both the software and the console at once.
44
USING THE SOFTWARE
Display Menu
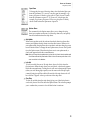
DISPLAY MENU
The commands in the Display menu allow you to view station
information on your computer. Each of the commands is explained
separately below.
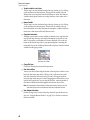
Bulletin
The bulletin shows selected current conditions in “real time” on your computer.
BULLETIN
The bulletin gives you a graphic representation of the current reading and the
numeric reading for each condition. For all bar graphs (air temperature, for example), highs and lows are represented by yellow lines which appear above the bar
(high) or within the bar (low). As long as the bulletin is running, the software
automatically updates highs and lows as they occur.
When you first start the bulletin, the software prompts you to indicate whether
you want to download highs and lows from the station. Downloading highs and
lows causes the software to “get” all of the highs and lows from the weather station and display them on the weather bulletin. If you download highs and lows it
takes a bit longer to open the bulletin. If you do not download highs and lows, the
highs and lows on the bulletin screen will only reflect the highs and lows
recorded while the bulletin is running.
The bulletin displays a line graph of barometric pressure over the past six hours
(unless you have turned of the barometer in “Station Config” on page 30). When
you first open the bulletin, the software graphs the current barometric pressure
and any barometric pressure data which exists in your database for the past six
hours. (For example, if no barometric pressure data for the past six hours exists in
the database, the software will only plot a single point which represents the current barometric pressure. If data exists for only a portion of the six hours, the software plots whatever data it has available in the database.) While the bulletin is
running, the software plots another point on this graph every 15 minutes.
45
USING THE SOFTWARE
Display Menu
▲ To start the bulletin, choose Bulletin from the Display menu.
The software prompts you to indicate whether you want to download highs
and lows. Choose Yes or No to continue.
DOWNLOAD HIGHS AND LOWS CONFIRMATION
▲ To close the bulletin, double-click on the Control-menu box in the upper left corner
of the window.
▲ To print the bulletin, choose Print from the Control menu or press Ctrl-P.
Set your printer options in the Print dialog box (for best results, be sure to
choose landscape mode) and then choose OK.
Summary
The summary shows a text table of all current conditions. Also included on the
high/low summary screen are the highs and lows for each function along with
the time and date they occurred. The information on the high/low summary is
updated in the same way as the bulletin.
▲ To start the summary, choose Summary from the Display menu.
The software prompts you to indicate whether you want to download highs
and lows. Choose Yes or No to continue.
DOWNLOAD HIGHS AND LOWS CONFIRMATION
▲ To close the summary, double-click on the Control-menu box in the upper left corner of the window.
▲ To print the summary, choose Print from the Control menu or press Ctrl-P.
Strip Charts
The strip charts offer you 4 line graphs which update in real-time as long as they
are open. You may select the data you want to plot on the strip charts and the
span over which you want it plotted.
46
USING THE SOFTWARE
Display Menu
▲ To use the strip charts, choose Strip Charts from the Display menu.
If necessary, the software automatically downloads data from the open station
in order to fill out the entire strip chart. After downloading, the Strip Chart
window appears. For complete instructions on using the Strip Charts, see
“Using the Strip Charts” on page 67.
STRIP CHART
Station Status
The software includes a station status display which allows you to monitor the
status of your station’s alarms and power connections.
1. Choose Station Status from the Display menu.
The Station Status window appears.
STATION STATUS
2. To close the station status window, double-click on the Control-menu box in the upper
left corner of the window.
47
USING THE SOFTWARE
Database Menu
DATABASE MENU
The Database menu contains commands related to the weather database created by the software. Each of the commands is explained separately below.
Download
Downloading allows you to transfer weather data from the WeatherLink’s archive
memory to the database stored on your computer’s hard disk. The database consists of a number of individual database files each of which contains all of the data
from a single month. For information on the difference between the data in your
archive memory and the data in your database, see “Archive Memory vs. Database” on page 95.
1. Choose Download from the Database menu.
The software will show you how many records are currently saved in the
archive memory and how much of the archive memory is currently filled.
NUMBER OF RECORD FOR DOWNLOAD
2. Choose OK.
The software will begin to download data. The software shows you the
progress of the download in the form of a status bar and a text display of the
number of records transferred so far and the total number of records to be
transferred.
DOWNLOAD STATUS
After all records have been transferred, the software saves all records into the
open station’s database. If you chose to clear the archive memory after download (see “Clear archive memory after download” on page 31), the software
clears the archive memory.
48
USING THE SOFTWARE
Database Menu
Browse
The Browse window allows you to view the raw data collected by your station. In
addition to viewing the data on your computer, you may print the data, export it
for use in database or spreadsheet programs, or add notes to individual records.
▲ To browse the database, choose Browse from the Database menu.
The Browse window appears. For complete instructions on using the Browse
window, see “Using the Browse Window” on page 78.
BROWSE WINDOW
Plot
The GroWeatherLink software includes a plotting engine which allows you to
plot as many conditions as you want on a single plot. You can also save plots save
plot templates for later viewing.
▲ To plot data, choose Plot from the Database menu.
The Plot window appears. For complete instructions on using the Plot window, see “Using the Plot Window” on page 73.
PLOT WINDOW
49
USING THE SOFTWARE
Crop Menu
CROP MENU
The Crop menu contains commands which allow you to manage a list
of crops to assist you in irrigation scheduling. Each of the commands is
explained separately below.
New Crop
You may manage crop irrigation for as many crops as you want. For each crop
you may enter crop and date-specific K factors (so the software can calculate ETc)
and irrigation amounts.
1. Choose New Crop from the Crop menu.
The Crop Water Management dialog box appears.
CROP WATER MANAGEMENT
2. Enter the following information:
▲ Crop Name
Enter the name of the crop and any other identifying text into the text box.
Note: The software uses the first 8 characters of the Crop Name (not including punctuation
and spaces) as the file name under which it stores crop water management information. The first 8 characters of each crop name must be unique.
▲ Plant Date
Enter the date on which this crop was planted into the text box.
▲ Start Date
Enter the starting date for ETc and irrigation calculation into the text box.
▲ End Date
Enter the ending date for ETc and irrigation calculation into the text box.
50
USING THE SOFTWARE
Crop Menu
3. After entering this information, you may save the crop by choosing Done.
For more information about the crop water management feature, including
instructions on using the rest of the features of this dialog box, see “Crop
Water Management” on page 85.
Open Crop
Once you have added a crop record, you may open that crop record at a later date
to add K Factors, irrigation amounts, or to view crop irrigation information.
1. Choose Open Crop from the Crop menu.
The Choose Crop dialog box appears.
CHOOSE CROP
2. Select the desired crop from the list and then choose OK.
The software opens the Crop Water Management dialog box for the selected
crop record. see “Crop Water Management” on page 85 for information on
using the crop water management feature.
51
USING THE SOFTWARE
Crop Menu
Delete Crop
You may delete a crop record from the list.
1. Choose Delete Crop from the Crop menu.
The Delete Crop dialog box appears.
DELETE CROP
2. Select the crop record you want to delete from the list and then choose OK.
The software prompts you to confirm that you want to delete the selected crop
record.
DELETE CROP CONFIRMATION
3. Choose OK.
The software deletes the selected crop record.
52
USING THE SOFTWARE
Reports Menu
REPORTS MENU
The Reports menu contains commands which allow you to view a
group of software-generated reports. Each of the commands is
explained separately below
Temp/Hum Hours
You may track the number of hours temperature is above or below a certain
threshold and humidity is above a certain threshold.
1. Choose Temp/Hum Hours from the Reports menu.
The Temp/Hum Hours dialog box appears.
TEMP/HUM HOURS DIALOG BOX
2. For each temp/hum hour total you wish to track, enter the following:
▲ Name
Enter the name of the crop or pest for which you want temp/hum hours
calculated into the text box.
▲ Start Date
Enter the starting date from which you want temp/hum hours calculated
into the text box.
▲ Temp Threshold
Enter the temperature threshold for this crop or pest into the text box.
▲ Above/Below
Select whether the software should calculate temp/hum hours based on
the number of hours above or below the temperature threshold.
▲ Humidity Threshold
Enter the humidity threshold for this crop or pest into the text box.
▲ Development Total
Enter the number of temp/hum hours required for this crop/pest to develop.
53
USING THE SOFTWARE
Reports Menu
3. After entering all necessary information, choose OK to view the temp/hum hours
report.
The software calculates and displays temp/hum hours information. The
report is opened into Windows’ Notepad from which you may copy or print
the report information.
TEMP/HUM HOURS REPORT
▲ Name, Start Date, Thresholds
The report shows the start and end dates and the threshold you entered.
▲ Days Occurred
The report shows the number of days on which temp/hum hours
occurred.
▲ Total for prior 3 days
The report shows the number of temp/hum hours which occurred on each
of the past 3 days.
▲ Development Total
The reports shows the development total you entered.
▲ Hours to Go
The report shows the total temp/hum hours left before the development
total is reached.
▲ Days to Go
The report shows the expected number of days before the development
total is reached. This calculation is based on the average number of temp/
hum hours during the last three days.
54
USING THE SOFTWARE
Reports Menu
Soil Temp. Hours
You may track the number of hours soil temperature is above a certain threshold.
1. Choose Soil Temp Hours from the Reports menu.
The Soil Temp Hours dialog box appears.
SOIL TEMP HOURS
2. Enter the following information:
▲ Start Date
Enter the starting date for which you want soil temperature hours calculated into the text box.
▲ End Date
Enter the ending date for which you want soil temperature hours calculated into the text box.
▲ Temp Threshold
Enter the soil temperature threshold above which you want soil temperature hours calculated into the text box.
3. After entering all necessary information, choose OK to view the soil temperature hours
report.
The software calculates and displays soil temperature hours information. The
report is opened into Windows’ Notepad from which you may copy or print
the report information.
SOIL TEMPERATURE HOUR REPORT
55
USING THE SOFTWARE
Reports Menu
▲ Total
The total number of soil temperature hours which occurred during the
selected period of time.
▲ Start Date, End Date, Threshold
The report shows the start and end dates and the threshold you entered.
▲ Hours for the last 15 days
The report shows the number of soil temperature hours which occurred on
each of the past 15 days.
Hours of Daylight
The software can calculate the total hours of daylight during any given period. To
do so, you must enter a solar radiation threshold above which the software
should consider “daylight" (default is 150 W/m2). The software calculates the
amount of time the solar radiation was above the threshold and reports that
amount of time as the hours of daylight.
1. Choose Hours of Daylight from the Reports menu.
The Hours of Daylight dialog box appears.
HOURS OF DAYLIGHT
2. Enter the following information:
▲ Start Date
Enter the starting date for which you want hours of daylight calculated
into the text box.
▲ End Date
Enter the ending date for which you want hours of daylight calculated
into the text box.
▲ Solar Radiation Threshold
Enter the solar radiation threshold above which you want hours of daylight calculated into the text box.
56
USING THE SOFTWARE
Reports Menu
3. After entering all necessary information, choose OK to view the hours of daylight
report.
The software calculates and displays hours of daylight information. The
report is opened into Windows’ Notepad from which you may copy or print
the report information.
HOURS OF DAYLIGHT REPORT
▲ Total Hours
The total hours of daylight which occurred during the selected period of
time.
▲ Start Date, End Date, Threshold
The report shows the start and end dates and the threshold you entered.
▲ Hours for the last 15 days
The report shows the hours of daylight which occurred on each of the past
15 days.
57
USING THE SOFTWARE
Reports Menu
PC Degree Days
The software can calculate degree-days for an almost infinite number of crops,
pests, etc.
1. Choose PC Degree Days from the Reports menu.
The PC Degree Days list box appears.
PC DEGREE DAYS
2. See “PC Degree-Days” starting on page 88 for instructions on using the degree-day
calculation feature.
Leaf Wet Hours
You may track the number of hours during which temperature fell within a certain range and a leaf wetness threshold was exceeded.
1. Choose Leaf Wet Hours from the Reports menu.
The Leaf Wet Hours dialog box appears.
LEAF WET HOURS
58
USING THE SOFTWARE
Reports Menu
2. Enter the following information:
▲ Start Date
Enter the starting date for which you want leaf wet hours calculated into
the text box.
▲ End Date
Enter the ending date for which you want leaf wet hours calculated into
the text box.
▲ Low Temp, High Temp
Enter the temperature range between which you want leaf wet hours calculated by entering a low and a high temperature threshold into the
appropriate text box.
▲ Wet Threshold
The console reports leaf wetness using a scale which runs from 0 (completely dry) to 16 (maximum amount of moisture). Enter the scale number
above which you want the software to consider foliage “wet.”
3. After entering all necessary information, choose OK.
The software calculates leaf wet hours and displays that information. The
report is opened into Windows’ Notepad from which you may copy or print
the report information.
LEAF WET HOURS REPORT
▲ Total Hours
The reports shows the total leaf wet hours during the selected period.
▲ Start Date, End Date, Low Temp, High Temp, Wetness Threshold
The report shows the start and end dates and the temperature and wetness
the thresholds you entered.
▲ Total for last 30 days
The reports shows the total leaf wet hours for each of the past 30 days.
59
USING THE SOFTWARE
Reports Menu
Chilling Requirement
You may calculate chilling requirements by entering a start and end date and a
temperature threshold.
1. Choose Chilling Requirement from the Reports menu.
The Chilling Requirement dialog box appears.
CHILLING REQUIREMENT
2. Enter the following information:
▲ Start Date
Enter the starting date for which you want chilling requirement calculated
into the text box.
▲ End Date
Enter the ending date for which you want chilling requirement calculated
into the text box.
▲ Temp. below
Enter the temperature below which you want chilling requirement calculated.
3. When finished, choose Calculate.
The software calculates chilling requirement for the selected period and displays that information at the bottom of the dialog box.
CHILLING REQUIREMENT CALCULATED
4. To exit, choose Cancel.
60
USING THE SOFTWARE
Reports Menu
Total ET
You may calculate the total ET which has occurred since a specified start date
using a single K factor for the entire period.
1. Choose Total ET from the Reports menu.
The Total ET dialog box appears.
TOTAL ET
2. Enter the following information:
▲ Start Date
Enter the starting date for which you want ET calculated into the text box.
▲ End Date
Enter the ending date for which you want ET calculated into the text box.
▲ K Factor
Enter the K factor you want used in calculating ET into the text box.
3. When finished, choose OK.
The software calculates ET for the selected period and displays that information. The report is opened into Windows’ Notepad from which you may copy
or print the report information.
ET REPORT
61
USING THE SOFTWARE
Reports Menu
▲ Total ET
The reports shows the total ET since the start date.
▲ Start Date, End Date, K Factor
The report shows the start and end dates and the K factor you entered.
▲ Total for last 30 days
The reports shows the total ET on each of the last 30 days.
Sunrise and Sunset
You may calculate sunrise and sunset times for any location.
NOAA Setup
The software will automatically generate reports similar to Monthly and Yearly
NOAA (National Oceanic and Atmospheric Administration) reports. Enter all
necessary setup information using NOAA Setup, and the reports can be calculated in seconds.
1. Choose NOAA Setup from the Reports menu.
The NOAA Report Setup dialog box appears.
NOAA REPORT SETUP
2. Enter the following information:
▲ City
Enter the city name into the text box.
▲ State
Enter the state name into the text box.
62
USING THE SOFTWARE
Reports Menu
▲ Elevation
Enter the location’s elevation into the text box.
▲ Lat, Long
Enter the location’s longitude and latitude into the text box. If you entered
latitude and Longitude when configuring your station (see “Station Config” on page 30), the software automatically enters those numbers in this
dialog box.
▲ Normal Mean Temp
Enter the normal mean temperature for each month of the year into the
appropriate text box.
▲ Normal Precipitation
Enter the normal mean precipitation for each month of the year into the
appropriate text box.
3. After entering information, choose OK.
The software saves all NOAA report setup information.
NOAA Summarize Month
The software can automatically generate monthly NOAA reports using the information in your database and NOAA Setup information (see “NOAA Setup” on
page 62).
1. Choose NOAA Summarize Month from the Reports menu.
The Choose Month dialog box appears.
CHOOSE MONTH
2. Select a month from the list.
63
USING THE SOFTWARE
Reports Menu
3. Enter the desired file name into the Export File text box.
Whenever you create a monthly summary, the software automatically creates
an export file (an ASCII text file) which contains the information and saves
that file in the root program directory. You may use the default file name, if
desired.
4. Choose OK.
The NOAA Monthly Summary appears.
NOAA MONTHLY SUMMARY
5. To print, choose Print from the Control menu or press Ctrl-P.
6. When finished, double-click on the Control-menu in the upper left corner of the window.
64
USING THE SOFTWARE
Reports Menu
NOAA Summarize Year
The software can automatically generate yearly NOAA reports using the information in your database and NOAA Setup information (see “NOAA Setup” on
page 62).
1. Choose NOAA Summarize Year from the Reports menu.
The Choose Year dialog box appears.
CHOOSE YEAR
2. Select a year from the list.
3. Enter the desired file name into the Export File text box.
Whenever you create a yearly summary, the software automatically creates an
export file (an ASCII text file) which contains the information and saves that
file in the root program directory. You may use the default file name, if
desired.
65
USING THE SOFTWARE
Reports Menu
4. Choose OK.
The NOAA yearly summary appears.
NOAA YEARLY SUMMARY
5. To print, choose Print from the Control menu or press Ctrl-P.
6. When finished, double-click on the Control-menu in the upper left corner of the window.
66
USING THE SOFTWARE
Using the Strip Charts
USING THE STRIP CHARTS
The strip charts are four line graphs, stacked one on top of another, onto which
you may plot any data contained in your database. The strip charts can be set to
update automatically which allows you to view changing weather conditions in
real time.
Axis
Buttons
STRIP CHART WINDOW
Strip Chart Basics
Whenever you open the strip chart window, the software automatically downloads data (if necessary) to make sure it has the most current data for the chart.
Thereafter, as long as the strip chart is in “auto update” mode, the software will
download and update the strip charts at each archive interval. You may select
whatever variables (weather conditions) you want plotted onto the four charts,
though each chart may display the axis information for only one of the variables.
In the strip chart shown above, for example, both rain and barometric pressure
are plotted on the bottom strip chart, though the axis button only says Rain and
the axis shows the scale for the rainfall graph. You may also select the desired plot
span to determine how much data you are viewing at any one time.
▲ Place the strip chart into auto update mode
When you first open the strip chart window, the strip chart is automatically
placed into auto update mode. It will remain in that mode (downloading and
updating the graphs at each archive interval) until you select to view historical data on the strip charts (see “View Historical Data” below) at which point
it is automatically taken out of auto update mode. To return to auto update
mode, choose Auto Update from the Options menu. If necessary, the software
will download any data in the archive memory and will move to the most current date in the database.
67
USING THE SOFTWARE
Using the Strip Charts
▲ To add a variable to a strip chart
The first step is to select the desired strip chart (top, bottom, etc.) by clicking
on the axis button for that strip chart. Then choose the variable you want
added to the active strip chart from the Add/Remove menu. Note that any
variables already plotted on the active strip chart have check marks next to
their name.
▲ Remove Variable
The first step is to select the desired strip chart (top, bottom, etc.) by clicking
on the axis button for that strip chart. Then choose the variable you want
removed from the active strip chart from the among the variables with check
marks next to their name in the Add/Remove menu.
▲ Change Axis Information
Although you may have as many variables as desired on any strip chart, the
axis for each strip chart may only display information for one of those variables. To choose the axis information you want displayed, click on the axis
button for the desired strip chart. A pop-up menu appears, containing the
name (and color) of the variables plotted on this strip chart. Select the desired
variable from the pop-up menu.
AXIS BUTTON POP-UP MENU
▲ Change Plot Span
Choose the desired plot span from the Span menu.
▲ View Historical Data
You may use the scroll bar along the bottom of the strip chart window to view
historical data on the strip charts. Clicking on the scroll arrows moves the
strip chart forward or backward one day at a time. Clicking the scroll bar
moves the strip chart one span at a time. Dragging the scroll box allows you to
quickly find a specific date. As you drag the scroll box, watch the bottom of
the window until the desired date appears, then release the scroll box.
Note: For plot spans which show less than a full day’s worth of data, clicking on the scroll
arrow and clicking on the scroll bar move the strip chart one plot span at a time.
▲ View Database Information
Double-clicking on any location in the strip chart will open the Browse window (see “Using the Browse Window” on page 78) to view the raw data for
that time and date.
68
USING THE SOFTWARE
Using the Strip Charts
▲ View Details
Click and drag to select the portion of the strip chart that you wish to see in
detail. The software will zoom in on that section of the strip chart, using the
closest possible plot span.
Note: Viewing historical data may turn off the Auto Update option (see “Auto Update” on
page 71).
CLICK AND DRAG TO SELECT
File Menu
The commands in the File menu allow you to create strip chart
templates for later use, set the default strip chart setup, and
print the strip charts. Strip chart templates save all information
concerning which variables are plotted on the four strip charts,
what information is displayed on the axes for each strip chart,
and the plot span. It does not save any date information and,
when opened, will always show the latest data in your database and be placed into auto update mode.
▲ Open
To open a previously saved strip chart template, choose Open from the File
menu and choose the desired strip chart template file.
OPEN STRIP CHART TEMPLATE
69
USING THE SOFTWARE
Using the Strip Charts
▲ Save
To save the current strip chart as a template, choose Save from the File menu.
Enter the desired file name and choose OK to save the template.
SAVE STRIP CHART TEMPLATE
▲ Make Default
To make the current strip chart the default strip chart (which appears initially
whenever you open the strip chart window), choose Make Default from the
File menu.
▲ Print
To print the strip chart window, choose Print from the File menu. Set your
printer options in the Print dialog box (for best results, be sure to choose landscape mode) and then choose OK.
▲ Close
To close the strip chart window, choose Close from the File menu.
Add/Remove Menu
To add a variable to any of the strip charts, select the desired strip
chart (to make it active) and then select the variable you want to
add from the Add/Remove menu. To remove a variable from any of
the strip charts, select the desired strip chart (to make it active) and
then select the variable you want to remove from the Add/Remove
menu.
Note:Variables which are plotted on the active strip chart have check marks next to
their name.
70
USING THE SOFTWARE
Using the Strip Charts
Span Menu
To change the plot span of the strip charts, select the desired plot span
from the Span menu. To “zoom in” one plot span (for example, to go
from a plot span of a Week to a plot span of 3 Days), choose Zoom In
from the Span menu or press F3. To “zoom out” one plot span (for
example, to go from a plot span of 3 Days to a plot span of a Week),
choose Zoom In from the Span menu or press F4.
Options Menu
The commands in the Options menu allow you to change the strip
charts’ auto update mode status, lock the strip charts axes, and quickly
clear all information from the strip charts.
▲ Auto Update
When in auto update mode, the software downloads data from the archive
memory and updates the strip charts at each archive interval. When not in
auto update mode, the strip charts do not update in real-time though you may
browse historical data. To change the auto update status, choose Auto Update
from the Options menu. When the strip charts are in auto update mode, a
check mark appears beside the command name.
Note: When you change the auto update status to place the strip charts into auto update mode,
the software automatically downloads all data in the archive memory and moves to the
most current date in the database.
▲ Lock Axis
To lock (or unlock) the axes of all strip charts, choose Lock Axis from the
Options menu. When the strip charts’ axes are locked, a check mark appears
beside the command name. Locking the axis will cause subsequent plot spans
(when you scroll through plot spans) to use the same scale as the plot span
currently being viewed.Data which falls outside of the strip chart scale will
have the line “clipped” at the top or bottom of the strip chart.
▲ Clear Plots
To clear all variables from the strip charts (giving you a blank strip chart to
work with), choose Clear Plots from the Options menu. The software prompts
you to confirm that you want to clear all data before it continues.
71
USING THE SOFTWARE
Using the Strip Charts
Colors Menu
You may change the color scheme used by the software in creating strip charts and plots. To change the color used for the plot
text, plot background, or any of the variables plotted by the software, choose the appropriate command from the Colors menu.
The software opens Windows’ Color dialog box from which you
may select or create a color.
COLOR DIALOG BOX
▲ Make Default
To save the current color scheme as the default, choose Make Default from the
Colors menu. Note that the strip charts and the plots (see “Using the Plot Window” starting on page 73) use the same color scheme. Changing the default
color scheme in the strip charts window will change the color scheme used in
the plots window.
▲ Load Default
If you have made changes to the color scheme and want to return to a previously saved default color scheme (see above), choose Load Default from the
Colors menu.
▲ Load Program Default
To load the original color scheme in which the program displayed plots and
strip charts, choose Load Program Default from the Colors menu. If you want
to make this color scheme your default once again, you will need to make it
the default (see above).
72
USING THE SOFTWARE
Using the Plot Window
USING THE PLOT WINDOW
The software includes powerful plotting capabilities which allow you to view and
compare data in graphical format. The plot interface has been designed so that
almost all plot features may be accessed directly from the plot window. You may
use menu commands where you find it easier, of course, and those commands are
explained separately below.
Zoom In/Out
Plot Title
Clear Plot
Axis
Max/Min
Plot Span
Line/Bar
Axis
Info
Date
Lock/Unlock
Axis
Variable
Box
PLOT WINDOW
Plot Basics
The three most basic elements of any plot are the variables (the weather conditions you are plotting), the date you are plotting, and the plot span (the length of
time over which you are plotting those conditions). The software allows you to
quickly and simply select those three elements and also includes many other useful features which make it easier to view and compare data. Almost all of the plot
features may be accessed directly from the plot window. Menu commands are
explained separately below.
▲ Add/Remove Variable
To add or remove a variable from a plot, click on the box next to the variable’s
name in the Variables Box at the bottom of the plot window. When you add a
variable to the plot, the color of that variable fills the box. When you remove a
variable, the box becomes white again.
73
USING THE SOFTWARE
Using the Plot Window
▲ Choose Specific Date
To choose a specific date, click on the Date button. A list of dates in your database appears. Select the desired date from the list and choose OK. For plot
spans which show more than one day, the date you pick will be plotted on the
left side of the axis and the rest of the plot will fill in with subsequent data.
The date which appears on the date button always indicates what data is plotted on the left-most side of the axis.
▲ Scroll Through Dates
You may use the scroll bar along the bottom of the strip chart window to scroll
through data. Clicking on the scroll arrows moves the plot forward or backward one day at a time. Clicking the scroll bar moves the plot one plot span at
a time. Dragging the scroll box allows you to quickly find a specific date. As
you drag the scroll box, watch the bottom of the window until the desired
date appears, then release the scroll box.
Note: For plot spans which show less than a full day’s worth of data, clicking on the scroll
arrow and clicking on the scroll bar move the plot one span at a time.
▲ Choose Plot Span
To choose a plot span, click on the Span button. A pop-up list containing all
available plot spans appears. Choose the desired plot span from the list.
PLOT SPAN LIST
▲ Enter Plot Title
You may enter a plot title into the Plot Title text box at the top of the window.
▲ Choose Axis Information
Although you may have as many variables as desired on any plot, each axis
(left/right) on a plot may only display information for one of those variables.
To choose the axis information you want displayed, click on the desired Axis
Info button. A pop-up menu appears, containing the name (and color) of the
variables on this plot. Select the desired variable from the pop-up menu.
AXIS INFO POP-UP LIST
74
USING THE SOFTWARE
Using the Plot Window
▲ Choose Line/Bar
A line plot simply plots all of the data in the database, drawing a line from one
data point to another until it fills out the whole plot span. Bar graphs, on the
other hand, show cumulative totals during a specific interval (each day on
week and month plots, each month on year plots). You may only use bar
graphs for those variables which accumulate totals (rainfall, ET, etc.) and only
on plot spans of a week, month, or year.
To select either a bar or line graph, click on the Bar/Line button. A pop-up list
appears. Choose either Bar or Line from the list.
BAR/LINE POP-UP LIST
▲ Set Axis Min/Max
You may set your own minimum or maximum for each axis by entering the
desired number into the Axis Min/Max text box. Setting the minimum or
maximum automatically “locks” the axis (see below).
▲ Lock Axis
To lock (or unlock) the axes of all plots, click on the Lock Axis icon for the
desired axis. Locking the axis will cause subsequent plot spans (when you
scroll through plot spans) to use the same scale as the plot span currently
being viewed. Data which falls outside of the plot scale will have the line or
bar “clipped” at the top or bottom of the plot.
CLIPPED DATA
▲ View Database Information
Double-clicking on any location in the plot will open the Browse window (see
“Using the Browse Window” on page 78) to view the raw data for that time
and date.
▲ View Details
You may click and drag on any section of a plot to view that section in more
detail (see “View Details” on page 69).
▲ Zoom In/Out
To “zoom in” one plot span (for example, to go from a plot span of a Week to a
plot span of 3 Days), click on the Zoom In icon. To “zoom out” one plot span
(for example, to go from a plot span of 3 Days to a plot span of a Week), click
on the Zoom Out icon.
75
USING THE SOFTWARE
Using the Plot Window
▲ Clear Entire Plot
To clear all variables from the plot (giving you a blank plot to work with), click
on the Clear Plot icon.
File Menu
The commands in the file menu allow you to save and open
plots and plot templates. When you save a plot, all information is stored. When you open that plot, it automatically loads
all variables and settings, and plots the data from the date
which was on the plot when it was saved. When you save a
plot template, all information except for date is stored. When
you open a plot template, the software loads all variables and
settings, but plots the data from the latest date in the database.
▲ Open Plot
To open a previously saved plot, choose Open Plot from the File menu. Select
the desired plot in the Open dialog box and choose OK.
▲ Save Plot
To save a plot, choose Save Plot from the File menu. Enter the desired file
name and choose OK.
▲ Open Template
To open a previously saved plot template, choose Open Template from the File
menu. Select the desired plot in the Open dialog box and choose OK.
▲ Save Template
To save a plot template, choose Save Template from the File menu. Enter the
desired file name and choose OK.
▲ Make Default
To make the current plot the default (which appears initially whenever you
open the plot window), choose Make Default from the File menu.
▲ Print
To print a plot, choose Print from the File menu. Set your printer options in the
Print dialog box (for best results, be sure to choose landscape mode) and then
choose OK.
▲ Close
To exit the plot window, choose Close.
76
USING THE SOFTWARE
Using the Plot Window
Add/Remove Menu
To add a variable to the plot, choose the variable you want to add from
the Add/Remove menu. To remove a variable from the plot, choose the
variable you want to remove from the Add/Remove menu.
Note:Variables which are plotted have check marks next to their name.
Span Menu
To change the plot span of the plot, select the desired plot span from
the Span menu. To “zoom in” one plot span (for example, to go from
a plot span of a Week to a plot span of 3 Days), choose Zoom In from
the Span menu or press F3. To “zoom out” one plot span (for example, to go from a plot span of 3 Days to a plot span of a Week),
choose Zoom Out from the Span menu or press F4.
Options Menu
The commands in the Options menu allow you to set a variety
of plot options.
▲Gridlines
You may turn the gridlines on or off for the left axis, right
axis, and time axis separately. When the gridlines are on, a
check mark appears beside the menu command. To
change the gridline setting from on to off (or vice versa)
choose the appropriate command from the Options menu.
▲Like Variable Same Scale
Turning this option on facilitates comparison of variables
which use the same unit of measure by forcing the software to use the same scale for any variables which use the
same unit of measure. When this option is on, a check
mark appears beside the menu command. To turn this
option on or off, choose Like Variable Same Scale from the
Options menu.
▲ Lock Scale
To lock (or unlock) the axes of all plots, choose Lock Scale for the desired axis.
▲ Choose Variable
To choose the axis information you want displayed on either axis, choose
Choose Variable for the desired axis. A pop-up menu appears next to the axis
information button. Select the desired variable from the pop-up menu
77
USING THE SOFTWARE
Using the Browse Window
▲ Choose Line/Bar
To select either a bar or line graph, choose Choose Line/Bar for the desired
axis. A pop-up list appears next to the Line/Bar button. Choose either Line or
Bar from the list.
▲ Edit Title
To edit the plot title, choose Edit Title from the options menu. The software
moves the cursor to the Plot Title text box.
▲ Edit Min/Max
To edit the Min/Max setting for either axis, choose the appropriate command
from the Options menu. The software moves the cursor to the appropriate
Min/Max text box.
▲ Hide Variable Box
You may hide the Variables Box in order to maximize the size of your plot.
When the Variables Box is hidden, a check mark appears beside the menu
command. To turn this option on or off, choose Hide Variable Box from the
Options menu.
▲ Clear Plot
To clear all variables from the plot (giving you a blank plot to work with),
choose Clear Plot from the Options menu.
Colors Menu
You may change the color scheme used by the software in creating strip charts
and plots. For instructions, see “Colors Menu” on page 72.
USING THE BROWSE WINDOW
The browse window allows you to view, edit, print, annotate, and export the raw
data collected by the WeatherLink.
BROWSE WINDOW
All of the menu commands are explained in separate sections below, however
there are a several useful operations you may perform directly from the browse
window.
78
USING THE SOFTWARE
Using the Browse Window
▲ Edit a Record
To edit a record, double-click on the desired record. The Edit Record dialog
box appears.
EDIT RECORD
The date and time of the record appear in the title bar. You may enter or
change any of the record data by simply entering the desired data into the
appropriate text box.
If data is either missing or invalid, you can enter two dashes (“--”) to indicate
that that data point is unavailable. (See E.T. and Wind Direction above.) Note
that certain readings (i.e., Degree Days, Wind Speed, High Wind Speed, Wind
Run, and Rain), use “0.0” instead of the dashes.
When finished, choose OK to save the changes and return to the Browser window. Alternatively, choose Next to save your changes and move to the next
record in the database or choose Previous to save your changes and move to
the previous record in the database.
79
USING THE SOFTWARE
Using the Browse Window
▲ Annotate a Record
To add a note, double-click on the area just to the left of a record’s date. The
Note Pad appears.
NOTE PAD
Enter the desired note into the note pad. When finished, choose OK to save the
note and return to the browse window. After you add a note to a record, the
software adds a note icon to the left of the record.
NOTE ICON
To edit, delete, or add to an existing note, double click on the note icon. The
Note Pad (with the text of previously entered notes) appears. Edit or add to
the note and choose OK to save. Choose Remove to delete the note completely.
▲ Delete a Record
To delete a record, select the desired record and press Delete. The software
prompts you to confirm that you wish to delete the record before it continues.
To quickly delete a group of records, see “Delete Records” on page 84.
80
USING THE SOFTWARE
Using the Browse Window
File Menu
The commands in the file menu allow you to select the date you
want displayed in the browse window and print data.
▲ Choose Date
To select a specific date which you want displayed in the browse window,
choose Choose Date from the File menu. The Choose date dialog box appears.
CHOOSE DATE
Select the desired date from the list and choose OK. The software will move to
the first record on the selected date.
▲ Print
To print data, choose Print from the File menu. The software prompts you to
select the day, month, or year you want printed.
CHOOSE RECORDS TO PRINT
Select the desired days, months, or years (you may choose more than one) and
choose OK. Set your printer options in the Print dialog box (for best results, be
sure to choose landscape mode) and then choose OK.
81
USING THE SOFTWARE
Using the Browse Window
▲ Close
To close the browse window, choose Close from the File menu.
Edit Menu
The commands in the Edit menu allow you to edit and delete
records, annotate records, and to copy and export records.
▲ Make a Note
To add a note to a record, select the desired record and choose Make a Note
from the Edit menu. (See “Annotate a Record” on page 80 for details on adding notes to records.)
▲ Edit
To edit a record, select the desired record and choose Edit from the Edit menu.
(See “Edit a Record” on page 79 for details on editing records.)
▲ Delete
To delete a single record, select the desired record and choose Delete from the
Edit menu. The software prompts you to confirm that you want to delete the
selected record before it continues.
▲ Copy Records
To copy all record information for a specific group of records to Windows clipboard (from which you may paste the information into most Windows programs), choose Copy records from the Edit menu. The software prompts you
to select the records you want copied.
CHOOSE RECORDS TO COPY
Select the desired days, months, or years (you may choose more than one) and
choose OK. The software copies the selected to the clipboard.
82
USING THE SOFTWARE
Using the Browse Window
▲ Export Records
To export record information to a tab delimited export file, choose Export from
the Edit menu. The software prompts you to select the records you want
exported.
CHOOSE RECORDS TO EXPORT
Select the desired days, months, or years (you may choose more than one) and
choose OK. The software prompts you to enter an export file name. Enter the
desired file name and choose OK.
ENTER EXPORT FILE NAME
The software saves all record information for the selected days, months, or
years (in tab delimited format) into the export file. You may use this file to
import data into most popular spreadsheet and database software.
83
USING THE SOFTWARE
Using the Browse Window
▲ Delete Records
To quickly delete a group of records at one time, choose Delete Records from
the Edit menu. The software prompts you to select the records you want
deleted.
CHOOSE RECORDS TO DELETE
Select the desired days, months, or years (you may choose more than one) and
choose OK. The software deletes the selected records.
84
USING THE SOFTWARE
Crop Water Management
CROP WATER MANAGEMENT
The GroWeatherLink software includes a versatile crop water management feature which allows you to track, graph, and print crop-specific EvapoTranspiration
and irrigation information. This section of the manual explains how to use the features of the Crop Water Management dialog box. For information on adding,
deleting, and opening crops, see “Crop Menu” on page 50.
CROP WATER MANAGEMENT DIALOG BOX
Irrigation
When you irrigate a crop, enter the irrigation amount. The software
will automatically calculate total irrigation amounts based on your
entries.
Note: The software does not convert irrigation amounts from inches to mm (or vice
versa) when you change the units of measure in which data is displayed.
▲ Add Irrigation Amount
To add an irrigation amount, click on the Irrigate button and choose Add
Amount from the pop-up menu. The software prompts you to enter an irrigation date and amount. Enter the appropriate information and choose OK. The
software adds the irrigation amount to the Irrigation Amt. list.
ADD IRRIGATION AMOUNT
85
USING THE SOFTWARE
Crop Water Management
▲ Edit Irrigation Entry
To edit an irrigation entry, double-click on the desired line in the Irrigation
Amt. List. Edit any of the irrigation information and choose OK to save you
changes.
▲ Delete Irrigation Entry
To delete an irrigation entry, select the desired line in the Irrigation Amt. list,
click on the Irrigate button, and then choose Delete Amount from the pop-up
menu. You will be prompted to confirm that you want to delete the irrigation
entry.
K Factors
Crop-specific K factors allow you to calculate more accurate
evapotranspiration amounts by taking into account the different
transpiration rates of different crops and at different stages of
development. When K factors are used to calculate evapotranspiration, it is referred to as ETc. The software will automatically calculate ETc using the K factors you enter and the ETo information
calculated by the station.
The software allows you to enter different K factors for different stages of crop
development. ETc for each day is calculated using the appropriate K factor. For
example, if you enter a K factor of 1.0 for 4-1-96 and a K factor of 1.25 for 4-15-96,
the software uses the 1.0 K factor in calculating ETc for 4-1-96 through 4-14-96
(inclusive). For 4-15-96 and all subsequent dates (until a new K factor is entered
for a date after 4-15-96), the software uses the 1.25 K factor in calculating ETc.
▲ Add K Factor
To add a K factor, click on the K Factor button and choose Add K Factor from
the pop-up menu. The software prompts you to enter an date and K factor.
Enter the appropriate information and choose OK. The software adds the K
factor to the K Factors list.
ADD K FACTOR
▲ Edit K Factor
To edit a K factor, double-click on the desired line in the K Factors List. Edit
any of the irrigation information and choose OK to save you changes.
▲ Delete K Factor
To delete a K factor, select the desired line in the K Factors list, click on the
K Factors button, and then choose Delete K Factor from the pop-up menu.
86
USING THE SOFTWARE
Crop Water Management
Print
To print all of the crop water management information for a crop, click on the
Print button. Set your printer options in the Print dialog box and then choose OK
to begin printing.
Note: If you want Total ETc and irrigation amounts to appear on your print out, you must calculate
them before printing (see “Calculate” on page 87).
Notes
Each crop record has its own note file into which you may place any desired information. To open the note file, click on the Notes button.
CROP NOTE FILE
The software automatically “date stamps” the entry with the current date each
time you open the note file. You may, of course, edit or delete the date stamp.
Enter any desired notes into the note file, and choose Exit from the File menu
when finished. Be sure to save your changes when you exit.
Note: The software uses Windows Notepad to maintain the note file for each crop. Consult your
Windows documentation for a full explanation of Notepad’s features and commands. You
should not change the file name of the note file when saving or the software will not be
able to locate it.
Graph
To view a quick graph of Daily and Total ETc and Irrigation, click on the Graph
button. A graph showing Total ETc, Total Irrigation, and Daily ETc appears. To
add a note to the crop record’s note file when viewing the graph, double-click
anywhere in the graph window. To print the graph, choose Print from the Control
menu. To close the graph window, double-click on the Control menu box in the
upper left of the window.
Calculate
To calculate total ETc and irrigation since a certain date, enter the desired start
date and end dates for the calculations into the appropriate text box and click on
the Calc. Totals button. The software calculates total ETc and irrigation since that
date and displays that information at the bottom of the dialog box.
87
USING THE SOFTWARE
PC Degree-Days
PC DEGREE-DAYS
The software includes a versatile degree-day calculation feature which allows you
to track an almost unlimited number of degree-day totals. This section of the
manual explains how to use the PC degree-days feature.
PC DEGREE DAYS
88
USING THE SOFTWARE
PC Degree-Days
Adding a Degree-Day Total
You need to enter a separate degree-day total for every individual crop, pest, etc.
for which you want to track degree-days.
1. From the PC Degree-Days list box, choose Add.
The PC Degree-Day Definition dialog box appears.
PC DEGREE-DAY DEFINITION
2. Enter the following information for each degree-day total:
▲ Name
Enter the name of the crop, pest, etc. into the text box.
▲ Start Date
Enter the starting date for degree-day calculations into the text box.
▲ Base Temp.
Enter the base developmental threshold (the temperature at and below
which development stops) into the text box.
▲ Upper Temp.
Enter the upper developmental threshold (the temperature at and above
which development rate remains constant) into the text box.
▲ Development Total
Enter the number of degree-days required for this crop/pest to develop
into the text box.
89
USING THE SOFTWARE
PC Degree-Days
▲ Degree-Day Calculation Method
Choose the method by which degree-days are calculated.
▲ Growing Degree-Day “Cut-Off” Method
The software uses the highest temperature and the lowest temperature
for a given day to calculate the average temperature for that day. Note,
however, that if the low temperature is below the base threshold, the
software uses the base threshold as the low temperature when determining average temperature for the day. In addition, if the high temperature is above the upper threshold, the software uses the upper
threshold as the high temperature when determining average temperature. For this method, both thresholds must be entered.
The difference between the average temperature and the base threshold is assumed to be the number of degree-days accumulated on that
day. (For example, if the average of the highest and lowerst temperatures was 24˚ above the base threshold, the software would assume 24
degree-days for the entire day.)
Note: Unless 15 hours worth of records exist in the database for a day (through 3pm),
the software will not calculate degree-days for that day.
▲ High/Low Method
The software uses the highest temperature and the lowest temperature
for a given day to calculate the average temperature for that day. Note,
however, that if the high temperature is above the upper threshold the
software uses the upper threshold as the high temperature when determining average temperature for the day. (If no upper threshold is
entered, the high temperature will not be “cut off” in this way.) For
this method, the upper threshold need not be entered.
The difference between the average temperature and the base threshold is assumed to be the number of degree-days accumulated on that
day. (For example, if the average of the highest and lowest temperatures was 24˚ above the base threshold, the software would assume 24
degree-days for the entire day.)
Note: Unless 15 hours worth of records exist in the database for a day (through 3pm),
the software will not calculate degree-days for that day.
▲ Integration Method
The software calculates degree-days using the average temperature for
an interval and the interval time. For example, if the average temperature during a 15 minute interval was 24˚ above the base threshold, the
software would calculate 0.25 degree-days dudring that interval (24˚ *
15 minutes in interval / 1440 minutes per day). The number of degreedays during each interval are added together to arrive at a degree-day
total. This method calculates degree-day totals more accurately than
the high/low method.
90
USING THE SOFTWARE
PC Degree-Days
3. To add a note to this degree-day total, choose Notes.
The software opens the note file for this degree-day total. You may enter any
desired notes into this file.
NOTE FILE
4. To view total degree-days since the start date, choose Calculate.
The software calculates the total degree-days since the start date and displays
the number of accumulated degree-days and the degree-days left until the
development total is reached.
DEGREE-DAYS CALCULATED
5. After entering all necessary information, choose OK.
The software saves the degree-day information for this crop/pest. Instead of
closing, the PC degree-day definition dialog box remains open so you can
enter information on the next crop/pest. When finished entering information
for all crops/pests, choose Done.
91
USING THE SOFTWARE
PC Degree-Days
Opening a Degree-Days Total
You may open a previously saved degree-day total to edit information, add notes,
view degree-day totals, etc.
1. To open a degree-day total, double click on the desired total or select it from the list
and choose Open.
The Degree-Day Definition dialog box for that total appears.
DEGREE-DAY DEFINITION
2. You may enter or change any information, add notes, or calculate degree-day totals as
explained in “Adding a Degree-Day Total” on page 89.
92
USING THE SOFTWARE
PC Degree-Days
Deleting a Degree-Day Total
To delete a degree-day total, select it from the list and choose Delete. The software
will prompt you to confirm that you want to delete the total before doing so.
PC Degree-Day Report
The software allows you to create reports on some or all of your degree-day totals.
The report is opened into Windows Notepad from which you may copy or print
the report information.
1. From the PC Degree-Days list, choose Report.
The PC Degree-Day Report dialog box appears.
PC DEGREE-DAY REPORT
2. Set the following report options:
▲ Format
Select either the long or the short report format.
REPORT FORMATS
93
USING THE SOFTWARE
PC Degree-Days
▲ Sort
Select the sort order. You may sort by the number of degree days remaining until the development total (which will show the totals closest to the
development total at the top of the report) or you may sort by name which
will show totals in alphabetical order.
▲ Degree-Day Selection check box
By selecting this check box and entering a number of degree-days into the
text box, you may choose to include only those crops/pests whose degreeday totals are within the specified number of degree-days of their development total.
3. When finished setting options, choose OK.
The software calculates and displays degree-days information. Depending on
which format you chose (long, short), the report shows you some or all of the
following information for each degree-day total:
▲ Start Date, Base Temp, Upper Temp
The report shows the start date and the base and upper thresholds you
entered.
▲ Total for previous 7 days
The report shows the total degree-days for each of the last 7 days.
▲ Total
The report shows the total degree-days since the start date.
▲ Development Total
The report shows the development total you entered.
▲ Deg-Days Left
The report shows the total degree-days left before the development total is
reached.
▲ Days to Go
The report shows the expected number of days before the development
total is reached. This calculation is based on the average number of
degree-days during the last three days.
94
5 TECHNICAL REFERENCE
This chapter covers several technical topics which may help you better understand and use the software.
ARCHIVE MEMORY VS. DATABASE
There are two places where the WeatherLink stores weather data: the archive
memory and the database.
Archive Memory
The archive is the weather information stored in the WeatherLink itself. At each
archive interval the WeatherLink stores one record to archive memory. The
WeatherLink has room in the archive memory for approximately 2/3 of a day of
weather data for each minute in the archive interval. For example, if you use the 1
minute archive interval, the WeatherLink may store approximately 16 hours of
data. If you use the 30 minute archive interval, the WeatherLink may store
approximately 20 days of data. If you use the 2 hour archive interval (120 minutes), the WeatherLink may store approximately 80 days of data.
Note: To aid you in determining when you need to download, the software shows you what percent
of archive memory is full whenever you download data.
When the archive memory “fills” the WeatherLink overwrites old data each time
it stores a new record. Make sure to download data before your archive memory
fills or you will have gaps in your database. It is best to select the longest archive
interval which suits your purpose.
Database
The database is the permanent record of data stored on disk. When you download, the software transfers all information in the archive memory to the computer and writes the information into the appropriate database files. As the
software writes the data to database files, it calculates the average wind chill and
the average dew point during the interval.
The software stores data to disk in monthly blocks, each of which is a separate
data file in the weather station's directory. The name of the data file indicates the
year and the month of the data and has a three character file extension which indicates the station from which that data came.
CALIBRATION NUMBERS
To increase performance, the software maintains calibration numbers separately
from the weather station. If you do not set calibration numbers from the software,
the weather station and software will not “agree” on what the calibration number
is. Therefore, you must set all calibration numbers (temperature, humidity,
barometer) from the software.
The following explanation of how the station and software determine barometric
pressure may help you understand this better.
95
TECHNICAL REFERENCE
Automatic Download
The weather station actually reads atmospheric pressure not barometric pressure.
When you set the barometric pressure from the station, the station automatically
calculates the difference between the barometric pressure you enter and the atmospheric pressure it reads. This difference gets stored as the barometric pressure
calibration number. When displaying the barometric pressure, the station reads
atmospheric pressure and adds the calibration number to determine barometric
pressure.
When you enter barometric pressure from the software, the software calculates
the calibration number and stores it in the weather station’s memory (in the same
way it would if you set the barometer from the station) and in the open station’s
configuration file. In this case, both the software and station “agree” on the barometric pressure calibration number.
If you enter a new barometric pressure from the weather station, nothing gets
stored in the station’s configuration file. The calibration number in the software
now differs from the calibration number in the station, and your readings and
database will be incorrect.
Note: The software does not support wind speed calibration numbers.
AUTOMATIC DOWNLOAD
The automatic download feature allows you to specify the times at which you
wish the WeatherLink Software to download data every day. At the specified
time, the software will prompt you to indicate whether or not you wish to download data. You may choose OK to continue or Cancel to quit the download. If you
do not make a choice within 10 seconds (if your computer is unattended, for
example) the software automatically downloads data.
In order for the software to perform the automatic download at the specified time,
the computer must be on and the software must be running. If you have a remote
connection, the software automatically dials and hangs up the connection for you.
An entry is made in the log file (see “View Log” on page 28) to indicate whether
the automatic download was successful.
Note: The automatic download procedure is disabled if you are actually connected to a remote station at the automatic download time.
Under certain circumstances, the software will actually download data if the current time is less than 10 minutes beyond the automatic download time. This feature allows the software to automatically download data from a station if you
launch the software a little later than the automatic download time or if a previously executed automatic download continues past the automatic download time
of another station. For example, station 1 is set to download at 12:00 and station 2
is set to download at 12:01. Because the archive memory on station 1 is almost
full, it takes until 12:02 before the automatic download of station 1 is completed.
Station 2 will still automatically download despite the fact that its automatic
download time of 12:01 has already passed.
96
TECHNICAL REFERENCE
Database Organization
DATABASE ORGANIZATION
Station Directory
When you create a new station the software creates a station directory (using the
first eight characters of the station name, not including any spaces and punctuation) in the root program directory. Inside of this directory, the software will create
subdirectories as necessary to contain station-specific files.
▲ \CROP
The \CROP directory contains all crop records for which you are using the
software’s water management feature.
▲ \DATANOTE
The \DATANOTE directory contains any notes you have entered for database
records. In order to assign notes to a specific record, the software must assign
its own coded file name (a long series of numbers). If you want to delete a
note, it is best to do so from the software.
▲ \PLOT
The software automatically creates a \PLOT directory into which you may
store plots, plot templates, and strip chart templates. You may, of course, save
plot and strip chart files into any directory you wish.
▲ \DEGDAYS
The software automatically creates a \DEGDAYS directory into which it
stores all PC degree-day information.
Station Configuration File
When you add a station, the software creates a station configuration file (called
“station.cfg”) in the station directory. Each station has its own discrete setup file
which saves the following program settings for the appropriate station.
▲ Station Settings
▲ Serial Port Settings
▲ Archive Interval
This is actually stored in the WeatherLink itself, though it is a station-specific
setting.
▲ Calibration Numbers
See “Calibration Numbers” on page 95.
In order to recognize a station's database files, you will need a station configuration file in the same directory as the database files. If you copy database files from
DOS or Windows (to share or transfer data, for example) do not copy the station
configuration file with them. Copy everything but the station configuration file.
To read the files, you will need to create a new station using the exact same name
as the old station on the computer to which the files are copied. Once you create
this station, copy the files into that station’s directory. After that, you should be
able to read the database files normally.
97
TECHNICAL REFERENCE
Modem String
Database Files
The software stores downloaded data in monthly files. Whenever you download,
the software saves database files into the open station's directory. The file name
which the software applies to database files indicates the year and month of the
data. The three character file extension indicates the station from which they were
downloaded. You must make sure that the file extension for the database files
matches the first three letters or numbers in the directory name (ignore any punctuation). For example, the database file for April,1994 from a directory called
\HOME (and a station called Home) would be named 1994-04.HOM.
Completely filled database files (that is, containing every possible record for a
month) saving data stored at the 30 minute archive interval will occupy approximately 64K of disk space. The file size changes in a linear fashion depending on
the archive interval. For example, a completely filled file containing data stored at
an interval of 1 minute will occupy approximately 1.92 MB of disk space while the
same file containing data stored at an interval of 2 hours will occupy approximately 16K.
You cannot combine database files. For example, if you download half of your
April data to one directory and the other half to another directory, you cannot
combine the two database files into a single file containing all of your April data.
Take extreme care when downloading to make sure the correct station is the open
station.
Note: If you do not clear your archive memory, you may be able to download the data into the correct file at a later date.
MODEM STRING
The software automatically enters the following modem initialization string,
which should work with most Hayes compatible modems: AT E &M Q V X4
S7=60. The individual components of the string have the following meaning.
▲ AT
This string precedes all Hayes commands.
▲ E
Turns echo off.
▲ &M
Selects asynchronous operation which disables error checking and speed buffering in more sophisticated modems.
▲ Q
Tells the modem to return result codes.
▲ V
Tells the modem to return short form result codes.
▲ X4
Enables result codes 0-7 and 10.
▲ S7=60
Tells modem to wait a maximum of 60 seconds for remote modem to answer
and issue a data carrier.
98
TECHNICAL REFERENCE
Importing WeatherLink Data into Other Programs
The software can perform some troubleshooting of modem problems in the form
of error messages. In order for the software to provide error messages, any
modem initialization string you enter must contain the E, Q, and V strings.
Note: If you use another communications program after using the modem with the WeatherLink
Software, you may need to re-initialize the modem using the modem string expected by the
other program.
IMPORTING WEATHERLINK DATA INTO OTHER PROGRAMS
When you create an export file (see “Export Records” on page 83) the software
creates a tab delimited text file. All that means is that the software creates a text
file which places each record on a separate row and inserts a tab between each
piece of data in that row. If you open the file in a text editor, it will look like this:
TAB DELIMITED EXPORT FILE
Most popular spreadsheet and database packages have the ability to open or
import tab delimited text files which maintaining the structure of the original
database. Consult your program’s documentation for instructions on importing
tab delimited text files.
You may also open or import the file in most popular word processor programs as
a text file. Because the data columns are separated by tabs, you may generally
choose any desired font.
99
TECHNICAL REFERENCE
Importing WeatherLink Data into Other Programs
100
HOT KEYS
Main Program Window
Plot Window
Ctrl-A . . . . Set Alarms
Ctrl-H . . . . Hide Variables Box
Ctrl-B . . . . View Bulletin
Ctrl-L . . . . Left Gridlines On/Off
Ctrl-C . . . . Station Configuration
Ctrl-O . . . . Open Plot
Ctrl-D . . . . Download
Ctrl-P . . . . Print Plot
Ctrl-H . . . . Hang Up
Ctrl-R . . . . Right Gridlines On/Off
Ctrl-K . . . . Walkthrough
Ctrl-S . . . . Save Plot
Ctrl-N . . . . New Station
Ctrl-T . . . . Time Gridlines On/Off
Ctrl-O . . . . Open Station
Ctrl-X . . . . Clear Plot
Ctrl-P . . . . Open Plot Window
F3 . . . . . . . Zoom In
Ctrl-S . . . . View Strip Charts
F4 . . . . . . . Zoom Out
Ctrl-T . . . . Set Time
F1 . . . . . . . Context-Sensitive Help
Ctrl-U . . . . Select Units
Ctrl-W . . . Browse Database
Ctrl-Y . . . . View Summary
F1 . . . . . . . Context-Sensitive Help
Strip Chart Window
Database Window
Ctrl-O . . . . Open Strip Chart
Ctrl-D . . . . Choose Date
Ctrl-P . . . . Print Strip Chart
Ctrl-N . . . . Add Note
Ctrl-S . . . . Save Strip Chart
Ctrl-P . . . . Print Records
F3 . . . . . . . Zoom In
Enter . . . . . Edit Record
F4 . . . . . . . Zoom Out
Delete . . . . Delete Record
F1 . . . . . . . Context-Sensitive Help
F1 . . . . . . . Context-Sensitive Help
3465 Diablo Avenue, Hayward, CA 94545-2778
510-732-9229 • Fax: 510-732-9188
E-mail: [email protected] • www.davisnet.com