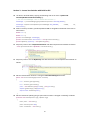
1
Tutorial for Course of Web and Mobile GIS
Autumn 2012
Rui Zhu
School of Architecture and the Built Environment
Royal Institute of Technology-KTH
Stockholm, Sweden
September 2012
Lab 1
Lab 2
Lab 3 & 4
Lab 5
Lab 6
Lab 7
Lab 8
Help File
Design a Dynamic Map
Create Web Maps with Google Mapping Tools
Open Source Solution: OpenLayers + GeoServer + PostGIS
ArcGIS Server
ESRI Mobile Solutions
Locate Your Current Position with Android Built-in GPS
Combination of a Dynamic Website and an Android app
Web and Mobile GIS Developing Environment Solution
1
Page 2
Page 9
Page 11
Page 17
Page 21
Page 25
Page 32
Page 44
AG2417 Web and Mobile GIS
Autumn 2012
Rui Zhu and Gyözö Gidófalvi
Lab 1: Design a Dynamic Map
Due Sep 7
1. Task
The aim of this lab is to gain basic concept of web map, and get basic skills of building maps
based on ArcGIS API. The lab assumes that you are a new beginner with no knowledge of HTML
and CSS. After a short study of some tutorials, following a simple example you will create an
image based static map in Eclipse with HTML and CSS. Then, you will do one more simple
exercise on ArcGIS API for JavaScript.
2. Tutorials
The tutorials on http://www.html.net (last accessed 2012-07-09), can help you get a main idea
of what HTML and CSS are. Before you physically start this lab, you should read the first four
lessons of HTML tutorial (http://www.html.net/tutorials/html/), and the first six lessons of CSS
tutorial (http://www.html.net/tutorials/css/). Also, there is a very good video tutorial that you
can refer to http://code.google.com/edu/submissions/html-css-javascript/.
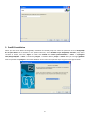
Part 1 – Make a HTML Map
Run Eclipse -> File -> New -> Static Web Project. Fill the Project name: Lab1, leave Context root
and Web content folder name as initially. Click the Finish button to create a project.
In the Project Explorer, right click WebContent, then New -> HTML File. Set File name as
index.html and click Finish to create a new HTML file. Now you will see the initial HTML code as
follows.
<!DOCTYPE html PUBLIC "-//W3C//DTD HTML 4.01 Transitional//EN"
"http://www.w3.org/TR/html4/loose.dtd">
<html>
<head>
<meta http-equiv="Content-Type" content="text/html;
charset=ISO-8859-1">
<title>Insert title here</title>
</head>
<body>
2
</body>
</html>
Now create a root folder of images under WebContent, copy kth.png and kth_rgb.jpg into
images, and refresh the project.
Then write the following lines of html between the <body> and </body> tags.
<div>
<h2><a>
<img width="80" height="80" src="images/kth_rgb.jpg"/> Kungliga
Tekniska Högskolan – KTH
</a></h2>
<a><img src="images/kth.png"/></a>
<p>SE-100 44 Stockholm Sweden</p>
<p>+46 8 790 60 00</p>
</div>
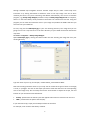
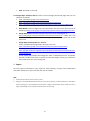
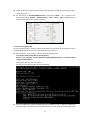
Click the Run button (the logo in the red box as it is shown below) to run it on the server, copy
the URL http://localhost:8080/Lab1/index.html into the web browser. Try to test the webpage in
different web browsers as well. Note that it may take several seconds for the server to update
when you have any HTML changes.
Now CSS will be used to control the style and layout of multiple web pages all at once. Right click
WebContent and New -> Other…-> Web/CSS File, and name the new file as style.css. Write the
following code into the style.css file.
* {
margin: 50; padding: 0;
}
body {
text-align: center;
background-color: #e9e9e9;
}
Link this CSS file to the index.html file by writing the following code into the index.html between
the <head> and </head> tags. Observe the changes in margins, layout, and background color.
<link rel="stylesheet" href="style.css" type="text/css"
charset="utf-8" />
3
As a last step, to edit the appearance of text, write the following code into the style.css file and
change the only <div> element to <div id = "layout"> in the index.html to link the CSS selector
#layout{…} in the style.css file. In CSS, selectors are patterns used to select the element(s) you
want to style (http://www.w3schools.com/cssref/css_selectors.asp).
#layout {
float: center;
font: 13px Verdana;
color: #565656;
padding-bottom: 20px;
}
Part 2 – ArcGIS API for JavaScript
ArcGIS API for JavaScript is a browser-based API for developing high performance, easy to use
mapping applications. The API allows you to easily embed dynamic maps in your webpages;
while map in the first part is based on a linked static image. The JavaScript API is hosted by ESRI
on ArcGIS Online and is available for free use, subject to the terms and conditions. The aim of
this part is to introduce how the ArcGIS API works. There is an ArcGIS resource center that you
can
refer
to
for
additional
tutorials:
http://help.arcgis.com/en/webapi/javascript/arcgis/index.html.
Use the same method to create one more HTML webpage with the name of
Stockholm.html.
Change the title to <title>Stockholm</title>
In the <head></head>, add the following script code.
<script type="text/javascript">var djConfig = {parseOnLoad: true};</script>
<script type="text/javascript"
src="http://serverapi.arcgisonline.com/jsapi/arcgis/?v=3.1"></script>
<script type="text/javascript">
dojo.require("dijit.layout.BorderContainer");
dojo.require("dijit.layout.ContentPane");
dojo.require("esri.map");
// create a variable of map
var map;
function init() {
var initExtent = new
//Locate to Stockholm Region
esri.geometry.Extent({"xmin":2012431,"ymin":8244177,"xmax":2012795,"ymax":8
256379,"spatialReference":{"wkid":102100}});
map = new esri.Map("map",{extent:initExtent});
4
//Add the world street map layer to the map. View the ArcGIS Online site for services
http://arcgisonline/home/search.html?t=content&f=typekeywords:service
var basemap = new
esri.layers.ArcGISTiledMapServiceLayer("http://server.arcgisonline.com/ArcGIS/rest/
services/World_Street_Map/MapServer");
map.addLayer(basemap);
dojo.connect(map, 'onLoad', function(theMap) {
//resize the map when the browser resizes
dojo.connect(dijit.byId('map'), 'resize', map,map.resize);
});
}
dojo.addOnLoad(init);
</script>
In the <body></body>, add the following code.
<body class="claro">
<div dojotype="dijit.layout.BorderContainer" design="headline" gutters="false"
style="width: 100%; height: 100%; margin: 0;">
<div id="map" dojotype="dijit.layout.ContentPane" region="center"
style="overflow:hidden;">
</div>
</div>
</body>
Add <style></style> in <head></head>, to control the layout of the webpage.
<style>
html, body { height: 100%; width: 100%; margin: 0; padding: 0; }
#map{padding:0;}
</style>
Add <link>, which is essential to have a valid scale bar on the web map.
<link rel="stylesheet" type="text/css"
href="http://serverapi.arcgisonline.com/jsapi/arcgis/3.1/js/dojo/dijit/themes/clar
o/claro.css">
Lastly, just click the Run button to see the final web ArcGIS API map. You can also copy this
Stockholm.html file to any independent folder to run it. NOTE: IE browser is better.
Part 3 – Optional Home Exercise
Part 1 introduced how to embed a static map into a webpage. Part 2 introduced how to use a
public JavaScript mapping API to make the embedded map more interactive, among others
5
through standard map navigation controls. Another simple way to make a static map more
interactive is by linking information to different areas of the map image. This can be done
manually, but that is very time consuming and difficult. Alternatively, one can use a freeware
program, e.g., Handy Image Mapper (Install the setup of Heady Image Mapper.exe on computer,
which is in the Lab 1 folder.) which provided a convenient user interface for this task. Using this
program you can mark the interactive areas in your image and produce the HTML code that you
will insert into your HTML file.
To start, copy the file KTHcampus.jpg to your own working directory. The image that you are
going to turn into a map has to be in the same directory as your HTML file that will include the
map code.
Run Start -> Programs -> Handy Image Mapper
Open KTHcampus.jpg by clicking the button Folder and the selecting the image file from your
working directory.
Type the name of your map, for example, ‘student1name_student2name-MAP’.
Now start creating interactive areas on your map. You can create three types of areas: a rectangle,
a circle, or a polygon. Just click on the shape you’d like to have and draw it on the corresponding
area of the image map. You can always choose the arrow button to adjust the shape, size and
location of your interactive areas afterwards.
Tooltip - provide here the advisory text that appears when mouse is hovered over the area.
HREF - provide here the path to the file (link).
If you need more help, simply use the Help link from the interface.
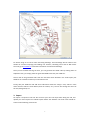
For example, a link create to KTH library as below
6
Do similar thing to at least 4 other interesting buildings. These buildings will be linked to the
website of a school occupying the buildings. For instance, L-building can be link to ABE school.
You must go to www.kth.se to find the information of schools and buildings.
Once you are finished entering the links, you can generate the HTML code by clicking Place on
Clipboard. Then, just simply paste the generated HTML code into your HTML file.
Have a look at the generated code. How are interactive areas defined in the code? Open your
HTML file in a browser and test your interactive areas.
Finally, edit your HTML file and add some information about the map (i.e. title, author’s name
and a link with author’s email address, date of creation, etc.). You can also change the colors of
the text, background, etc.
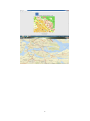
3. Report
No report is required in this lab. You can have your own CSS styles when doing this lab, and
upload your own Project File to Blida system before the deadline. The final result should be
similar to the following screen shots.
7
8
AG2417 Web and Mobile GIS
Autumn 2012
Rui Zhu and Gyözö Gidófalvi
Lab 2: Create Web Maps with Google Mapping Tools
Due Sep 11
4. Task
The task of this lab is to create web maps using the Google mapping tools. This lab is divided to
two parts. In each part you need to go through the tutorial that is given in each section and do
the task. The tools, which you are going to use here, are Google map and Google earth.
5. Create Web Maps
5.1. Creating Your Own Google Account. Sign in or create a new account at www.google.com.
5.2. Creating Maps Using Custom Maps for Google Maps. Study the tutorial (and watch the
video) at http://www.google.com/earth/outreach/tutorials/custommaps.html. Follow the
instructions and create your own Google My Maps. Please give some screenshots and
necessary explanation on this part for your report.
5.3. Embedding Maps into a Website. Study the tutorial (and watch the video) at
http://www.google.com/earth/outreach/tutorials/websitemaps.html.
Follow
the
instructions and create your own web pages or website. Please give some screenshots and
necessary explanation on this part for your report.
5.4. Embed Your Google Earth Project in Your Website. Study the tutorial (and watch the video)
at
http://www.google.com/earth/outreach/tutorials/kmlembed.html.
Follow
the
instructions and publish your maps created in step 3 with the Google Embed KML Gadget.
Please give some screenshots and necessary explanation on this part for your report.
6. Google Map API
6.1. Static Maps API V2 Developer Guide. Read the Google Static Map API documentation and
study the examples at http://code.google.com/apis/maps/documentation/staticmaps/.
Make your own static maps using the following features:
a. Geocoding: Read the information about URL parameters, and create your own static
map with the geocode URL and explain the meaning of each parameter.
b. Markers: Add a few markers in the map. You can get the coordinates of locations via
geocoding or from http://www.gorissen.info/Pierre/maps/googleMapLocationv3.php.
9
c.
Path: Add a path in the map.
6.2. Google Maps JavaScript API V3. There are three Google official web pages that you can
reference as tutorials.
1. https://developers.google.com/maps/articles/
2. https://developers.google.com/maps/documentation/javascript/
3. https://developers.google.com/maps/documentation/javascript/services#Directions
a. Hello World. Create a Google map around Stockholm area and set the zoom level to 12
according to http://code.google.com/apis/maps/documentation/v3/introduction.html.
b. Google Map Events. Read about Google map events in the following link of
http://code.google.com/apis/maps/documentation/v3/events.html. Create your own
events. For example, click a marker and reset your map to a certain place with certain
zoom level.
c. Google Maps JavaScript API V3 – Services.
Firstly, read about the Google map’s directions service at
https://developers.google.com/maps/documentation/javascript/directions.
Secondly, test the example of
https://google-developers.appspot.com/maps/documentation/javascript/examples/dir
ections-waypoints.
Thirdly, modify the examples and change the “from” to Stockholm and “to” to Uppsala.
Add some middle points such as Lund to see what will happen. Finally, try to add some
travel mode options to your routing map.
7. Report
Put some typical screenshots in your report for each questions, and give some explanations
with codes. Submit your report not later than Sep 11 in Blida.
OBS
1.
All the links were last accessed on July 17, 2012.
2.
Bring your own Moveable Hard Disk next time, since we are going to use Virtual Machine in Lab 3&4. In
advance setting your own development environment is highly recommended, which enables you have a
deep understanding of the computer architectures that we are using.
10
AG2417 Web and Mobile GIS
Autumn 2012
Rui Zhu and Gyözö Gidófalvi
Lab 3&4: Open Source Solution: OpenLayers + GeoServer +
PostGIS
Due Sep 18
8. Task
In this exercise you will learn some of the most popular open source (server-side and client-side)
web mapping technologies. The series solution of OpenLayers + GeoServer + PostGIS will give
you a great start to build sophisticated WebGIS applications. Try your best to make this lab
perfect, since it can be a great preparation for your final project of this course.
This lab contains three consecutive exercises. In Part 1 you will get familiar with GeoServer web
admin interface. In Part 2 you will also explore the integration of a popular open source
client-side web mapping technology of OpenLayers to enrich the web GIS applications. In Part 3
you will be using data that are stored in plain files as well as PostgreSQL/PostGIS database.
9. Tutorials and Preparations
There are eight official websites that you should take a careful reading as tutorials before you
physically start the lab exercise. By reading the first three websites, you will get a main concept
of what GeoServer, OpenLayers and PostGIS are, and you will also understand the logical
structures between each of them.
Table 1. Open Source Official Websites
No.
Name
Official Website
Last Accessed
1
GeoServer
http://geoserver.org/display/GEOS/Welcome
7/18/2012
2
OpenLayers
http://openlayers.org/
7/18/2012
3
PostGIS
http://postgis.refractions.net/
7/18/2012
4
GeoExt
http://geoext.org/
7/18/2012
5
OGC
http://www.opengeospatial.org/
7/18/2012
6
OpenGeo
http://opengeo.org/
7/18/2012
7
OpenStreetMap
http://www.openstreetmap.org/
7/18/2012
8
OSGeo
http://www.osgeo.org/
7/18/2012
The software stack and data sources used in labs 3&4 are preinstalled on a Virtual Machine
(VM). You can run this VM (a set of files) using VMware Player by opening a Virtual Machine and
selecting the .vmx file that is associated with the VM (ignore any error messages about copying
11
and moving). Throughout the exercise you will make modifications to your VM, i.e., you will
configure settings and services, and in your project you will potentially install new software on it.
As your modifications are saved in the files that are associated with the VM, to make your
modifications persistent, it is important that you always work on the same VM. To further
secure yourself against the loss of your work, you should have a backup of the VM, and this will
also allows you to work off campus on the same VM. Optionally, for the lab and the later final
project, you can install the same software stack on your private computer by following the
installation guide that is provided with lab materials.
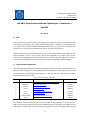
10. GeoServer
10.1.
GeoServer Admin Interface
GeoServer comes with great admin interface that enables you to build almost any map you
want.
In our case GeoServer is installed on your local machine (localhost), and it is installed directly
under our web server root directory, in a folder called geoserver, so to access GeoServer type
into
the
browser:
http://localhost/geoserver,
this
redirect
you
to
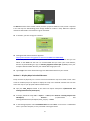
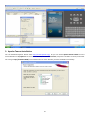
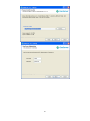
http://localhost/geoserver/web, which is the admin interface (Figure 1).
Figure 1. GeoServer Admin Interface
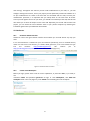
10.2.
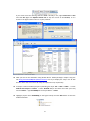
Create a New Workspace
Before you login, please have a look at service capabilities, in particular WMS, try to study it.
Use
username admin and password geoserver to login in. Click Workspaces, click Add new
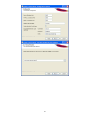
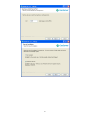
workspace to fill in the rest (Figure 2). Click submit to finish adding the new workspace.
12
Figure 2. Name and Namespace URI of a New Workspace
10.3.
Create a New Store
Click Stores (in the Data set), then click Add new Stores. You will see Vector Data Sources and
Raster Data Sources, respectively. Specifically, we use Shapefile and PostGIS as vector data
sources quite often. In this lab, we choose PostGIS as data source (you can get familiar with the
PostGIS environment), fill in inputs as it is shown in Table 2, and accept other default values.
Table 2. Configurations for Creating a New Store
No.
Input
Values
1
Workspace
medford
2
Data Source Name
medford
3
Enabled
checked
4
dbtype
postgis
5
host
localhost
6
port
5432
7
database
medford
8
schema
medford
9
user
postgres
10
password
postgres
11
validate connections
checked
10.4.
Publish a Layer
After adding a data source, you can publish layers immediately. You can always access the same
configuration stage, i.e., by clicking Layers, Add a new resource, and selecting
medford:medford from the drop list. Publish the layer of buildings; on the Data tab compute
Bounding Boxes; and on Publishing tab fill in WMS Settings if you like. Lastly, check the result
by clicking OpenLayers of buildings in the Layer Preview tab.
10.5.
Publish More Layers
Add some other layers from the same store above. Include URIs to review it in your report. Use
styles in WMS Settings to the relevant layers; include screens capture from reviews (zoom in to
suitable extent).
Visit the following link to create new styles for park and streets layers.
http://docs.geoserver.org/latest/en/user/styling/sld-cookbook/index.html
13
11. GeoServer with OpenLayers
“OpenLayers is a pure JavaScript library for displaying map data in most modern web browsers,
with no server-side dependencies. OpenLayers implements a JavaScript API for building rich
web-based geographic applications, similar to the Google Maps and MSN Virtual Earth APIs,
with one important difference -- OpenLayers is Free Software, developed for and by the Open
Source software community.”
(Reference: http://openlayers.org/)
1.
2.
1.
The best way to learn OpenLayers is to start with the documentation which is available at:
http://docs.openlayers.org/
http://trac.osgeo.org/openlayers/wiki/Documentation
A great number of examples are also available at:
http://openlayers.org/dev/examples/
Pay a visit to the link of http://localhost/spatialdbtips/map-with-wms.html. And jump to the
physical location of this file map-with-wms.html at C:\Program Files\Apache Software
Foundation\Tomcat 7.0\webapps\spatialdbtips. Now you should aware that it will NOT be valid if
you double click the file directly in the spatialdbtips folder.
Now let’s investigate the course code of this file. Right click map-with-wms.html, and click Edit
with Notepad++.
1. <script src="OpenLayers/OpenLayers.js"></script> is included during the <head></head>
part, which means you must include OpenLayers.js file to use OpenLayers in the webpage.
2. Content in the <script type="text/javascript"></script> is a javascript definition of the
OpenLayers map that you have seen.
3. onload="init()" in the <body onload="init()"> means function init() will be initialized to
create OpenLayers whenever the webpage is open.
4. OpenLayers will be showed when <div id="map" class="smallmap"> is executed, and
typically id="map" corresponds with name of the OpenLayers map.
In this example the map is created using the following code:
map = new OpenLayers.Map( 'map' ,
{controls:[ new OpenLayers.Control.MouseDefaults(),
new OpenLayers.Control.LayerSwitcher(),
new OpenLayers.Control.PanZoomBar()],
numZoomLevels:20}); // Set up base map
This map constructor requires an HTML Element, or the ID of an HTML element in which the
map will be placed to be passed as an argument. The following lines create the layer and add it
14
to the map:
// Initialize WMS layer from our local GeoServer
buildings = new OpenLayers.Layer.WMS( "Medford Buildings",
"/geoserver/wms",
{
layers: 'medford:buildings',
'format':'image/png'},
{'reproject': true});
// Add WMS layer to our map
map.addLayers([buildings]);
NOW, IT IS YOUR TAKS!
Task
Description
1
Add tax lots, streets, and zoning layers to your map. Add your code as well as screen shots in your
report.
2
Add Controls such as mouse position, layer switcher and scales to the map.
3
Create an identify control to identify features from building layer.
Review the querying part in the link of http://workshops.opengeo.org/stack-intro/openlayers.html,
and navigate to C:\Program Files\ApacheSoftwareFoundation\Tomcat7.0\webapps\spatialdbtips\Ope
nLayers\examples, view the source code of the getfeatureinfo.html, getfeatureinfo-control.html, and
getfeatureinfo-popup.html files.
4
Describe the background process that OpenLayers runs to get information about a feature. Start your
description from the click event until you get the information about the feature back.
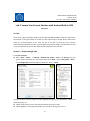
12. PostGIS
“PostGIS adds support for geographic objects to the PostgreSQLobject-relational database. In
effect, PostGIS "spatially enables" the PostgreSQL server, allowing it to be used as a backend
spatial database for geographic information systems (GIS), much like ESRI's SDE or Oracle's
Spatial extension.”
(Reference: http://postgis.refractions.net/)
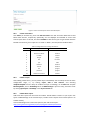
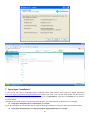
Get familiar with PostGIS. Open PostgreSQL tools pgAdmin, you will see spatial data that we are
using is as the following structures (Figure 3).
15
Figure 3. Structure of PostgreSQL 9.0
Tips: You may use Quantum GIS or shp2sql for importing shapefile into the database in the
future.
13. Report
Put some screenshots in every important step in your report, and give some corresponding
explanations with codes. Submit your report not later than Sep 18 in Blida.
16
AG2417 Web and Mobile GIS
Autumn 2012
Rui Zhu and Gyözö Gidófalvi
Lab 5: ArcGIS Server
Due Sep 25
14. Guides and Help
Virtual Machine for ArcGIS Server will be used in this lab. Use the username of DELETE ME and
password of 123456 to login to the VM. Use ESRI documentation as a main source; remember
Google is your friend; ask TA for help if nothing works.
15. Create a Static Map
15.1.
Author GIS Service Content in ArcMap
From data folder in drive C:
Add some layers (as least three layers with polygon, polyline, and point)
Modify the symbols to make a nice map
Save the project as yourname.mxd
15.2.
Publish a Map Service
Use Map Service Publishing from ArcMap (also feel free to use Map Service Publishing toolbar,
ArcCatalog, or ArcGIS Server Manager), search ArcGIS Desktop help for “Publishing map
services” and follow the appropriate search result.
15.3.
Create a Web Mapping Application
Consult ArcGIS server help to web application using the map service you have created in step 2.
Start ArcGIS Server Manager through web browser
Login by user name (arcserver\DELETE ME) and password (123456)
Click the Service tab
Click Publish a GIS Resource
Navigate the yourname.mxd map document
In the name field, name a new service name
Choose the option to publish it to existing folder
Click Next and keep default all options
Click Next and then Finish
OBS
1. Now the service is in the Service tab, click Start to start or Stop to stop the service.
2. With ESRI ArcGIS solution, you can connect to ArcGIS server and publish a map service with
ArcCatalog, but NOT to create a web mapping application with ArcCatalog
17
16. Add More Functionality to Your Map
Search ArcGIS server help for Geocoding and ArcGIS desktop help for Geocoding tutorial to
learn about geocoding. Working with Atlanta or NorthDakota_CassCounty do the following:
16.1.
Create a Map Document in ArcMap
Add cassroadss.shp and cassparcels.shp
Symbolize them as you like
Save the map document as yourname_parcelmap.mxd (Do not forget the relative
path)
16.2.
Create an Address Locator
In ArcCatalog tree, navigate your data folder NorthDakota_CassCounty (in your group
folder)
Right-click the folder and choose New > Address Locator
In the next wizard, choose Dual Range as the style for the locator, click OK
In the Name field, type FindAddress and navigate the Reference data to your
cassroads.shp, others keep as default setting
Click OK, now you get it
16.3.
Publish a Map Service and a Geocoding Service
Go back to your web browser and connect to ArcGIS Server Manager
Public a GIS resource, do similarly as in the first session to publish your parcelmap
map service
Add New Service, name it as FindAddress and choose Geocode Service type
Navigate your Address locator generated by ArcCatalog above
Click Next to see other settings which can be kept as default
Click Finish
16.4.
Create a Search Application
Now create your web application, name it as Parcel Search
Click Add layers to add your parcelmap service
Click Add Tasks to add Find Address and then Query Attributes
Click Supporting Services to add FindAddress service you have created
Configure for each task. You can keep default setting for Find Address task
Regarding Query Attribute task, change the Task Name to Find Parcel by ID
In Setting, select Map Service to parcelmap and Layer to parcels
Click Add a Query, type Select Parcel ID: in Label Text and change Field to PIN
Now you proceed to finalize your web application
16.5.
Test the Search Application
Launch your web application; you can see your task now shown on the top.
Test Find Parcel by ID by selecting several ID values, after the search results come,
right-click to Zoom to or Pan to
Test Find Address by typing several address in a form such as 16015 19TH ST SE
18
17. Geoprocessing service
This lab section works with the data in folder Sweden.
17.1.
Create a Toolbox and a Map Document
Start ArcCatalog
In ArcCatalog tree, navigate your data folder Sweden (in your group folder)
Right-click the folder and choose New > Toolbox, name it as GP tools
Start ArcMap and add at least 3 layers such as swe_cnty, swe_road, swe_city,
symbolize to make a nice map
Click ArcToolbox under the Menu item Window to open ArcToolbox
Right-click in the ArcToolbox window and choose Add Toolbox, then choose GP tools
created above and click Open
4. 2. Create a Geoprocessing Model
Right-click the GP Tools toolbox and choose New > Model
Model > Model Properties
Type ClipCounties for Name and ClipCounties with Buffer for Label, then click OK
In the ArcToolbox window, expand the Analysis Tools toolbox
Under Analysis Tools, expand the Proximity toolset
Drag the Buffer tool from ArcToolbox onto your model
Double check Output Feature set the output feature class to
Yourfolder\data\sweden\buffer.shp
Right-click the rectangle Buffer > Make Variables > From Parameter > Input Features
Right-click the Input Features variable (oval) in the model and choose Properties
In Data Type tab, select Feature Set from the Drop-down list
From the Import schema and symbology drop-down list, select swehiway
Click Apply and then OK > Input Features turns to blue oval
Right-click the Input Features variable again and choose Model Parameter, a small
letter P appears (feature will be a parameter)
Create another parameter for distance. Right-click on the model window and choose
Create Variable
Select Linear Unit from the list and click OK
Click Add Connection button. Draw a line between Linear Unit and Buffer tool
Right-click the Linear Unit and choose Model Parameter
Double-click the Linear Unit and provide initial 0,5 (kilometers) value
Right-click the Output Features and rename to OutBuffer
Next, expand the Extract toolset, drag the Clip tool onto the model
Double-click rectangle Clip, choose swe_cnty for Input Features and OutBuffer for Clip
Features
Click OK
Right-click the OutBuffer shape and make sure that Model Parameter is unchecked
whereas Managed and Intermediate are checked
Right-click on swe_cnty_Clip.shp and make sure that Managed and Intermediate are
not checked whereas Model Parameter and Add to Display are checked
19
Save and close model
Save your map document as yournameSweden.mxd
4.3. Test the Model
Double-click on your tool in the ArcToolbox window and test it works properly
4.4. Add the Model as Tool Layer of the Map Document
Drag the model from ArcToolbox to the top of the table of contents
You will see swe_cnty_Clip.shp as the results of your test in previous step. Pick up the
red color outline for this layer and then turn it off
Save your map document again
4.5. Publish Map and Geoprocessing Services
If you have no idea on it, please consult the Help
4.6. Create an Application (Containing a Geoprocessing Task)
In ArcGIS manager click the Applications tab
Click Create Web Application
On the first panel of the wizard, name the application Sweden Counties
Click Next
Add the map service created above as a layer
Next, add Geoprocessing Task
For Supporting Service, click Add the geoprocessing service created above
Click Configure
Task Name: Clip Counties with Buffer
Task Definition: expand the available service and click the tool you created
Click OK
Your web application is created
4.7. Addition
Build similar service with another data set
Teach yourself how to add other available tasks
18. Design Your Own Webpage
Feel free to design your own webpage in any style. It should include the following:
Title
Your names and group number
Link to the pages of your WebGIS services. You can contain your WebGIS services into
your page by using <frameset … > frame</frameset>
19. Report
Put some typical screenshots in your report for each questions, and give some explanations
with codes. Submit your report not later than Sep 25 in Blida.
20
AG2417 Web and Mobile GIS
Autumn 2012
Rui Zhu and Gyözö Gidófalvi
Lab 6: ESRI Mobile Solutions
Due Oct 2
20. Task
In this lab you will learn some of the most popular ESRI mobile solutions. The first section
introduces concept of ArcGIS application for mobiles, and installation steps of ArcGIS for
Android. The second section illustrates how to display the map created by ArcGIS API for
JavaScript in the Lab 1 based on Android browser. The third section focuses on ArcGIS Runtime
SDK for Android. The aim of this lab is to learn about various ESRI mobile GIS solutions and to
get a basic skill of mobile GIS development with Android and ArcGIS SDK.
Section 1 – Introduction of ArcGIS for Mobiles
Nowadays ArcGIS for mobile (iOS, Android, and Windows Phone) extends the reach of your GIS
from the office to the field (http://resources.arcgis.com/content/mobilegis/about). Using ArcGIS
applications for Mobiles you will be able to explore maps available from ArcGIS Online or ArcGIS
Server, and:
Display and navigate maps
Find addresses and places
Identify locations and GIS features
Measure lines and areas
Find and share maps from ArcGIS Online
Collect GIS data
Use your phones GPS
There are some quick links for mobile applications:
http://resources.arcgis.com/en/communities/smartphone-apps/
Specifically there are two options for downloading ArcGIS Application for Android:
http://resources.arcgis.com/en/communities/smartphone-apps/01ww00000004000000.htm
Install google app store-3.7.15.apk (which is for Android operation system, and provided in
the lab folder.) to your own Android mobile device. Sign in the Google app in your Android
mobile, then go back to the website to install ArcGIS from the link below.
https://play.google.com/store/apps/details?id=com.esri.android.client
Note: you may unfortunately come across one notice board on the website saying that this
app is incompatible with your [your mobile version, i.e., Tele2 HTC HTC Incredible S].
21
Do NOT download it from Amazon unless you have a payment address in USA, which is required
in the last step for downloading (even though ArcGIS for mobile is free). While the optional
method to download it from Amazon is given as follows.
In Amazon, you have to login to continue.
Getting Started with the Amazon Appstore
https://www.amazon.com/gp/feature.html?ie=UTF8&docId=1000626391
In the link, there is a detail description video and installation instructions that you can
follow. In the Click 4 of the link it is recommended that you enter your email address,
because by downloading the app of Amazon_Appstore-release.apk (8,814kb) from your
computer-based mailbox will save your mobile data usage quite a lot.
Type arcgis from search field of the app, free download ArcGIS from your mobile.
Section 2 – Display Maps in Android Browser
Firstly we have to physically run a server to host the Stockholm map we created in Lab1. Then
create an Android project in Eclipse to display the map in the Android emulator. We can also
access the map on your physical Android mobile device.
Copy the Lab1_Project created in the Lab1 into Eclipse workspace: C:\Documents and
Settings\Administrator\workspace\.
In Eclipse, follow the steps: File -> Import… -> Next (select General – Existing Projects into
Workspace)
->
Browse…
(C:\Documents
and
Settings\Administrator\workspace\Lab1_Project) -> Finish.
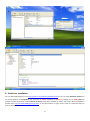
In the Package Explorer select Stockholm.html and select Run. A real server is established
now in your own computer, as it is presented in the figure below.
22
If you come across the warning that Port 8080 is already in use, type services.msc in Run
and click OK. Right click Apache Tomcat 7.0 to stop the service in the Services, as it is
shown in the figures below. Then re-try this producer.
Now you will see the Stockholm map (ArcGIS API for JavaScript Map) in Eclipse. Copy the
link http://localhost:8080/Lab1/Stockholm.html and try to display the map in the IE web
browser. Have two screen shots for maps in Eclipse and in IE, respectively.
In Eclipse create an Android project by following the steps: File -> New -> Other… -> select
Android Test Project and Next> -> Select Android 2.1 (or the latest vision that you have)
and click Next> -> type ArcGISMap in the Project Name -> Finish.
Highlight project name ArcGISMap (as the figure below) and click Run button to start the
Android Emulator.
23
Type cmd in Run and hit Enter. Once the box opens type ipconfig /all and hit Enter. Write
down your current IP Address that you see. We are going to use this IP address in the next
step.
Now type http://192.168.178.140:8080/Lab1/Stockholm.html in the Android browser, and
see the result. NOTE: change the sample IP address (in the red color) into your own current
IP address. Also give a try in your real life Android mobile browser.
Section 3 – ArcGIS Runtime SDK for Android
ArcGIS
Runtime
SDK
for
Android
(http://resources.arcgis.com/en/communities/runtime-android/) allows you to add the power
of the ArcGIS system to your Android apps. It supports apps designed for Android phones and
tablets with the Google Android SDK 2.2 (API 8) or above. To be safe particularly using API 8 is
highly recommended.
Now let us physically create one map by following official instructions according to the link
below to help you understand ArcGIS Runtime SDK for Android. Please make screen shot for
every important step when you do this exercise.
http://resources.arcgis.com/en/help/android-sdk/concepts/index.html#/Installing_the_SDK
/01190000002m000000/
21. Report
Put some typical screenshots in your report for step of the lab, and give some explanations with
codes. Submit your report not later than Oct 2 in Blida.
24
AG2417 Web and Mobile GIS
Autumn 2012
Rui Zhu and Gyözö Gidófalvi
Lab 7: Locate Your Current Position with Android Built-in GPS
Due Oct 4
22. Task
Firstly we are going to display Google map and OpenStreetMap (OSM) in Android, respectively.
Then based on the given OSM, we create our own Android app to enable built-in GPS and to
locate our current positions on the map. The aim of this lab is to lead you have a further
understanding of Android emulator, and the difference between Google map and OSM. This lab
is also a preparation for the further mobile GIS development in the next lab.
Section 1 – Display Google Map
1.1. Create a Project
File -> New -> Other… -> Android – Android Test Project – Next -> fill Group_x (fill your
group number instead of x) in the Project Name field – Next -> select This project – Next ->
select Google APIs (left-below figure, Platform2.1, API 7) – Finish.
A project consists of several folders and files (right-above figure); you should have a basic idea
about what they are:
Folder of src contains all the Java code files which the project needs.
Folder of gen is an auto generated folder, you should not change any file in it.
25
Folder of res stores all the resources which your application needs, like layout files, images,
sounds and so on.
Put the mouse on Test.GoogleMap.test.test, right click to Other…, as it is shown in the
figure below. Select Android – Android Activity – Next -> Next -> Next -> Finish. Now an
empty project without any activity is created.
1.2. Get Your Google API Key
A unique Google API key is required, which helps Google to understand which program connects
to Google Map and which function of the application is going to use.
Take windows 7 as an example, open command window and type:
cd C:\Program Files\Java\jdk1.6.0_23\bin (Enter)
keytool -v -list -keystore “C:\Users\ZHU RUI\.android\debug.keystore” -storepass android
-keypass android (Enter)
(Change ZHU RUI into your-user-name.)
You will get a certificate fingerprint as the following:
Copy your MD5 code, open the web browser and navigate to Link-1, paste your MD5 code
and select agree, then click button Generate API Key. You will see the following page. Copy
26
the content of the page to a .txt file for later usage.
Link-1: http://code.google.com/android/maps-api-signup.html
1.3. Edit res/layout/activity_main.xml for the UI Designing
Delete the following code, since it is useless and will be covered by Google map.
<TextView
android:layout_width="wrap_content"
android:layout_height="wrap_content"
android:layout_centerHorizontal="true"
android:layout_centerVertical="true"
android:text="@string/hello_world"
tools:context=".MainActivity" />
Instead copy the following code, which comes from the .txt file in Section – 1. Add two lines
of code of android:id="@+id/mapview" and android:clickable="true". Then save this file.
<com.google.android.maps.MapView
xmlns:android="http://schemas.android.com/apk/res/android"
android:id="@+id/mapview"
android:layout_width="fill_parent"
android:layout_height="fill_parent"
android:clickable="true"
android:apiKey="0sl-j0Aq8pcpjhlkSjpRgIRZygDhvljxU9eWjXg"/>
1.4. Edit MainActivity.java
Copy the following code exactly following setContentView(R.layout.activity_main).
//set the location(latitude and latitude) of Stockholm
point = new GeoPoint(59398056, 18023222);
//instantiate the variable mapView and specify that its layout is located in the tag named mapview
mapView = (MapView) findViewById(R.id.mapview);
//enable the built-in zoom controls
mapView.setBuiltInZoomControls(true);
//use road map instead of satellite map
27
mapView.setSatellite(false);
//get map controller
mapController = mapView.getController();
//set the initial zoom level
mapController.setZoom(10);
//move the location to Stockholm at the time when the map was loaded
mapController.animateTo(point);
Change public class MainActivity extends Activity into public class MainActivity extends
MapActivity.
Define three variables as follows in the public class MainActivity extends MapActivity.
private MapView mapView;
private MapController mapController;
private GeoPoint point;
Do some necessary modification to ensure MainActivity.java includes following imports.
import com.google.android.maps.GeoPoint;
import com.google.android.maps.MapActivity;
import com.google.android.maps.MapController;
import com.google.android.maps.MapView;
import android.os.Bundle;
import android.view.Menu;
1.5. Edit AndroidManifest.xml
Double click AndroidManifest.xml and choose AndroidManifest.xml tab.
To ensure the application could find the package of Google Map, add <uses-library
android:name="com.google.android.maps" /> between </activity> and </application>.
To ensure our application has the permission to use Internet connection, add
<uses-permission
android:name="android.permission.INTERNET"/>
after
<uses-sdk
android:minSdkVersion="7" />.
1.6. Run the Android Emulator
Before you run the emulator, make sure Google APIs7 has already lunched in Android
Virtual Devices Manager. Good luck if Google map jumps up after running the emulator.
Have a screen shot for your fantastic work.
Section 2 – Display OSM Map
Produce to create OSM map in Android is much simpler compared with section 1, since API key
is not required for OSM map in Android.
File -> New -> Other… -> Android – Android Application Project – Next -> fill OSM
(Application Name), OsmPro (Project Name) and com.osm.project (Package Name) in the
fields, select Android 2.1 (API 7) for Build SDK, select API 7: Android 2.1 (Eclair) for
Minimum Required SDK – Next -> Next -> Next -> Finish.
Physically copy osmdroid-android-3.0.2.jar and slf4j-android-1.5.8.jar to the project folder
of libs and press F5 to refresh the project.
28
Define three variables in the public class of MainActivity in the MainActivity.java.
private MapController mapController;
private MapView mapView;
public GeoPoint point;
Consequently in the MainAcitivity.java, copy the following code exactly behind the code of
setContentView(R.layout.activity_main).
mapView = (MapView) this.findViewById(R.id.mapview);
mapView.setTileSource(TileSourceFactory.MAPNIK);
mapView.setBuiltInZoomControls(true);
mapView.setMultiTouchControls(true);
mapController = mapView.getController();
mapController.setZoom(15);
point = new GeoPoint(59351756, 18057822);
mapController.setCenter(point);
In the res/layout/, edit the file of activity_main.xml. Double click activity_main.xml in the
Package Explorer, and select tab of activity_main.xml as it is shown in the figure below.
Delete the <TextView…/> code; while add <org.osmdroid.views.MapView…/> code. After
editing the activity_main.xml file will be as follows. You will also notice that the only error
in MainActivity.java is disappeared.
<RelativeLayout xmlns:android="http://schemas.android.com/apk/res/android"
xmlns:tools="http://schemas.android.com/tools"
android:layout_width="fill_parent"
android:layout_height="fill_parent" >
<org.osmdroid.views.MapView
xmlns:android="http://schemas.android.com/apk/res/android"
android:id="@+id/mapview"
android:layout_width="fill_parent"
android:layout_height="fill_parent"
android:clickable="true" />
</RelativeLayout>
In the file of AndroidMainfest.xml, exactly behind <uses-sdk android:minSdkVersion="7"
android:targetSdkVersion="15"/> add the following code for getting permissions.
<uses-permission android:name="android.permission.ACCESS_NETWORK_STATE" />
<uses-permission android:name="android.permission.INTERNET" />
<uses-permission android:name="android.permission.ACCESS_FINE_LOCATION" />
<uses-permission android:name="android.permission.ACCESS_COARSE_LOCATION" />
<uses-permission android:name="android.permission.ACCESS_WIFI_STATE" />
<uses-permission android:name="android.permission.WRITE_EXTERNAL_STORAGE" />
<uses-permission android:name="android.permission.ACCESS_MOCK_LOCATION" />
Now run the Android emulator as usual. You will see the OSM map if you successes.
29
Section 3 – Locate Your Position with Built-in GPS
Use built-in Android GPS by copying the following code in the class of public void
onCreate(Bundle savedInstanceState){…}.
/* Use the LocationManager class to obtain GPS locations */
mlocManager = (LocationManager)getSystemService(Context.LOCATION_SERVICE);
mlocManager.requestLocationUpdates(LocationManager.GPS_PROVIDER,
5*1000,
10,
mlocListener);
Define necessary variables; specifically Lon and Lat are longitude and latitude of the built-in
GPS location.
double Lon = 0;
double Lat = 0;
private LocationManager mlocManager;
private LocationListener mlocListener = new MyLocationListener();
private MyOverlay myOverlay = new MyOverlay(null);
Physically create a class of MyLocationListenor and add unimplemented methods as follows.
class MyLocationListener implements LocationListener{…}
Physically create a class of MyOverlay and add constructor and unimplemented methods as
follows.
Edit the method when location is changed in onLocationChanged as follows.
public void onLocationChanged(Location location)
{
Lon = location.getLongitude();
Lat = location.getLatitude();
point = new GeoPoint((int)(Lat*1e6), (int)(Lon*1e6));
mapView.getOverlays().add(myOverlay);
mapController.animateTo(point);
}
Edit the method of updating the geo-point when location is changed in onDraw() as follows.
protected void onDraw(Canvas arg0, MapView arg1)
{
Paint paint = new Paint();
paint.setColor(Color.RED);
Point screenPoint = new Point();
30
mapView.getProjection().toPixels(point, screenPoint);
Bitmap bmp BitmapFactory.decodeResource(getResources(),R.drawable.dot);
canvas.drawBitmap(bmp, screenPoint.x, screenPoint.y, paint);
}
Debug the exiting two errors. Change
as
protected void onDraw(Canvas canvas, MapView arg1). Copy the given dot.png picture into the
folder of res/drawable-ldpi and refresh the project.
Run the Android and use Emulator Control in DDMS to simulate changes of GPS locations.
Hit: Firstly click the Devices to active the emulator.
protected void onDraw(Canvas arg0, MapView arg1)
23. Report
Put some typical screenshots in your report for step of the lab, and give some explanations with
codes. Submit your report not later than Oct 4 in Blida.
31
AG2417 Web and Mobile GIS
Autumn 2012
Rui Zhu and Gyözö Gidófalvi
Lab 8: Combination of a Dynamic Website and an Android app
Due Oct 8
24. Task
In this lab, you will (1) upload your real time physical GPS coordinates from a smart phone to a
dynamic website; (2) show GPS position on the website by OpenLayers (without using
GeoServer); (3) create WMS to draw geometrics on a web map (also accessible on the mobile);
and (4) do an optionally task based on a web-based tutorial to realize a Web Feature Service
(WFS) such that users could use the function also via a smart phone.
Section 1 – Upload Your Coordinates
There is a good web-based Servlet and JSP tutorial that you can refer:
http://www.apl.jhu.edu/~hall/java/Servlet-Tutorial/.
1.1. Complete Your Android app
Based on the result of Section 3 in Lab 7, now the purpose is sending your current GPS
coordinates (latitude and longitude) to the server side. Firstly, modify class MyLocationListener
as it is shown in Appendix-1. Change the URL strUrl as your current IP addcress and Port (as we
did in the previous lab). Now the whole picture of the code structure is shown in Appendix-2.
1.2. Create a Dynamic Website (JSP) in Eclipse
JSP website is built in three constructed layers: Servlet, JavaBeans, and Database Access. In
Eclipse, click File -> New -> Other… -> Web -> Dynamic Web Project -> Next. Fill DynWeb in the
Project name: field, click Next -> Next -> Finish. Now you will see a dynamic website project as
it is shown below in the Project Explorer.
Right click scr -> New -> Package, fill com.demo.mobile in the Name: field, and click Finish.
Right click com.demo.mobile -> New -> Servlet, fill Hub (Servlet) in the Class name: field, click
Next -> Next -> Finish. Modify Hub.java as it is shown in Appendix-3. Right click
32
com.demo.mobile -> New -> Class, fill Location (JavaBeans) in the Name: field, click Finish.
Modify Location.java as it is shown in Appendix-4. Right click com.demo.mobile -> New -> Class,
fill ConnDB (Database Access) in the Name: field, click Finish. Modify Location.java as it is
shown in Appendix-5. Now the basic architecture of JSP is ready.
1.3. Configure an Apache Tomcat Web Server
We have to configure an Apache Tomcat web server to run the website. In Eclipse, click File ->
New -> Other… -> Server -> Next -> Apache – Tomcat v6.0 Server -> Next -> add DynWeb from
Available to Configured -> Finish. Now the server is added as it is shown in the figure below.
1.4. Create a userinfo Database
Open pgAdminⅢ, click Postgres -> Tables -> SQL (as it is shown in the figure below). Create a
userinfo table, and insert values as it is given in Appendix-6. NOTE: execute SQL statement one
by one.
Now run the Android app and use Emulator Control in DDMS to simulate changes of GPS
locations, and check the result of the database by executing the SQL statement of select * from
userinfo. Congratulations if values of reportlat and reportlon in the table of userinfor changes
accordingly.
Section 2 – Create a JSP Webpage
Create a jsp file with the name of stockholm.jsp, and copy style.css file given in the Bilda into
the project. The structure of the website is now as it is shown below. Modify stockholm.jsp as it
is in Appendix-7.
33
This webpage represents OSM map, editable vectors, position dot, switch layers, and scale
bar, all of which are created by OpenLayers in the <script></script>. Study this part
since it can be useful for your final project.
This webpage includes three interfaces of username, userlat, and userlon, as it is
represented below. It is used for getting values from the database.
<%=(String) session.getAttribute("username")%>
<%=(String) session.getAttribute("userlat")%>
<%=(String) session.getAttribute("userlon")%>
You can personally develop functions of Servlet, JavaBeans, and database access for
physically passing three values (username, userlat, userlon) from database to the JSP
webpage, by using the same logical methodology as illustrated in Section 1. Or you can get
further help from the teaching assistant. (This is an optional task.s)
Test drawing editable vectors on your physical mobile.
Section 3 – Optional Task on WFS
Task in this section is optional, since Web Feature Service (WFS) is an advanced Web GIS
application, and hence is more difficulty; while it can be a good reference to your final project.
Here is the web tutorial:
http://www.gistutor.com/openlayers/22-advanced-openlayers-tutorials/47-openlayers-wfs-t-usi
ng-a-geoserver-hosted-postgis-layer.html (Last Accessed 2012/9/26).
WFS enables you draw, edit, and save the modified geometrics in the database.
You may use other data set, but ensure the projection is used correctly.
Also test WFS on the physical mobile web browser, if you implement it successfully.
Look into the statement of OpenLayers.ProxyHost = "/cgi-bin/proxy.cgi?url=", if errors or
exceptions still occur at last.
25. Report
Put some typical screenshots in your report for step of the lab, and give some explanations with
codes. Submit your report not later than Oct 8 in Blida.
34
Appendix-1
// MyLocationListner
class MyLocationListener implements LocationListener
{
public void onLocationChanged(Location loc)
{
// TODO Auto-generated method stub
Lon = loc.getLongitude();
Lat = loc.getLatitude();
point = new GeoPoint((int)(Lat*1e6), (int)(Lon*1e6));
mapView.getOverlays().add(myOverlay);
mapController.animateTo(point);
//send updated latitude and longitude to the server
try
{
url = new URL(strUrl);
HttpURLConnection urlConn = (HttpURLConnection) url.openConnection();
urlConn.setDoInput(true);
urlConn.setDoOutput(true);
urlConn.setRequestMethod("POST");
urlConn.setUseCaches(false);
urlConn.setRequestProperty("Content-Type", "application/x-www-form-urlencoded");
urlConn.setRequestProperty("Charest", "utf-8");
// to connect to the server side
urlConn.connect();
DataOutputStream dop = new DataOutputStream(urlConn.getOutputStream());
dop.writeBytes("point=" + URLEncoder.encode("location","utf-8"));
//it is essential that to add "&" to separate two strings
dop.writeBytes("&username=" + URLEncoder.encode(username,"utf-8"));
dop.writeBytes("&password=" + URLEncoder.encode(password,"utf-8"));
dop.writeBytes("&lon=" + URLEncoder.encode(Double.toString(Lon),"utf-8"));
dop.writeBytes("&lat=" + URLEncoder.encode(Double.toString(Lat),"utf-8"));
dop.flush();
dop.close();
DataInputStream dis = new DataInputStream(urlConn.getInputStream());
String locPassage = dis.readUTF();
// to disconnect the server side
urlConn.disconnect();
if("Succeed".equalsIgnoreCase(locPassage))
{
//nothing
}
}
catch (MalformedURLException e)
35
{
// TODO Auto-generated catch block
e.printStackTrace();
}
catch (IOException e)
{
e.printStackTrace();
}//end of sending updated latitude and longitude to the server
}
}
Appendix-2
public class MainActivity extends Activity
{
private MapController mapController;
private MapView mapView;
public GeoPoint point;
double Lon = 0;
double Lat = 0;
String strUrl = "http://213.103.201.82:8080/zr/trafficweb";
URL url = null;
String username ="";
String password ="";
private LocationManager mlocManager;
private LocationListener mlocListener = new MyLocationListener();
private MyOverlay myOverlay = new MyOverlay(null);
public void onCreate(Bundle savedInstanceState)
{
super.onCreate(savedInstanceState);
setContentView(R.layout.osmmap);
/*
*The followings are all the necessary setting for rendering OSM.
* */
mapView = (MapView) this.findViewById(R.id.mapview);
mapView.setTileSource(TileSourceFactory.MAPNIK);
mapView.setBuiltInZoomControls(true);
mapView.setMultiTouchControls(true);
mapController = mapView.getController();
mapController.setZoom(15);
point = new GeoPoint(59351756, 18057822);
mapController.setCenter(point);
username = "groupx";
36
password = "123456";
/* Be intelligent, you will understand that the following two statements
* are used for getting values of userName and passWord from two independent
* text in the other activity (which can be used in the login page of the app).
* */
//username = ZRTrafficActivity.userName.getText().toString();
//password = ZRTrafficActivity.passWord.getText().toString();
/* Use the LocationManager class to obtain GPS locations */
mlocManager = (LocationManager)getSystemService(Context.LOCATION_SERVICE);
mlocManager.requestLocationUpdates(LocationManager.GPS_PROVIDER, 5*1000, 10, mlocListener);
}
. . . . . .
}
Appendix-3
package com.demo.mobile;
import java.io.IOException;
import javax.servlet.ServletException;
import javax.servlet.http.HttpServlet;
import javax.servlet.http.HttpServletRequest;
import javax.servlet.http.HttpServletResponse;
/**
* Servlet implementation class Hub
*/
public class Hub extends HttpServlet {
private static final long serialVersionUID = 1L;
/**
* @see HttpServlet#HttpServlet()
*/
public Hub() {
super();
// TODO Auto-generated constructor stub
}
/**
* @see HttpServlet#doGet(HttpServletRequest request, HttpServletResponse response)
*/
protected void doGet(HttpServletRequest request, HttpServletResponse response) throws ServletException, IOException {
// TODO Auto-generated method stub
// NOTE: to get the value of POINT
String point = request.getParameter("point");
if("location".equalsIgnoreCase(point))
37
{
Location location = new Location();
location.getLocation(request, response);
}//end of if location
}
/**
* @see HttpServlet#doPost(HttpServletRequest request, HttpServletResponse response)
*/
protected void doPost(HttpServletRequest request, HttpServletResponse response) throws ServletException, IOException {
// TODO Auto-generated method stub
doGet(request, response);
}
}
Appendix-4
package com.demo.mobile;
import java.io.DataOutputStream;
import java.io.IOException;
import java.sql.ResultSet;
import java.sql.Statement;
import javax.servlet.http.HttpServletRequest;
import javax.servlet.http.HttpServletResponse;
public class Location
{
private Connection connect = null;
public void getLocation(HttpServletRequest request, HttpServletResponse response) throws IOException
{
// get the username and password
String username = request.getParameter("username");
String password = request.getParameter("password");
String longitude = request.getParameter("lon");
String latitude = request.getParameter("lat");
double lon = Double.parseDouble(longitude);
double lat = Double.parseDouble(latitude);
// connect to database to update wetherOnService column and clear locations
ConnDB conndb = new ConnDB();
// NOTE: string -> varchar for posrgresql query by using ''
String updateSQL = "update userinfor set reportlat = " + lat + ", reportlon = " + lon +
" where username='" + username + "' and passwords='" + password + "'";
// give feedback on whether can login or not for Android mobile
38
DataOutputStream dos = new DataOutputStream(response.getOutputStream());
dos.writeUTF("Succeed");
try
{
connect = conndb.getConn();
Statement stmt = connect.createStatement(ResultSet.TYPE_SCROLL_INSENSITIVE,ResultSet.CONCUR_UPDATABLE);
stmt.executeUpdate(updateSQL);
}
catch(Exception e)
{
e.printStackTrace();
}
finally
{
ConnDB.releaseConnection(connect);
}
}
}
Appendix-5
package com.demo.mobile;
import java.sql.Connection;
import java.sql.DriverManager;
import java.sql.SQLException;
public class ConnDB
{
private Connection connection = null;
public Connection getConn()
{
try
{
Class.forName("org.postgresql.Driver").newInstance();
String url = "jdbc:postgresql://localhost:5432/postgres" ;
connection = DriverManager.getConnection(url, "postgres" , "postgres" );
}
catch (Exception e)
{
e.printStackTrace();
}
finally
{
}
return connection;
}
39
public static void releaseConnection( Connection c)
{
if(c != null)
{
try
{
c.close();
}
catch (SQLException e)
{
// TODO Auto-generated catch block
e.printStackTrace();
}
}
}
}
Appendix-6
CREATE TABLE userinfor
(
username character varying(20) NOT NULL,
passwords character varying(20) NOT NULL,
reportlat double precision,
reportlon double precision
)
INSERT INTO userinfor (username, passwords, reportlat, reportlon)
VALUES
('groupx', 123456, 0, 0)
Appendix-7
<%@ page language="java" import="java.util.*" pageEncoding="UTF-8"%>
<%String path = request.getContextPath();
String basePath = request.getScheme() + "://"
+ request.getServerName() + ":" + request.getServerPort()
+ path + "/";
%>
<!DOCTYPE html PUBLIC "-//W3C//DTD HTML 4.01 Transitional//EN" "http://www.w3.org/TR/html4/loose.dtd">
<html>
<head>
<base href="<%=basePath%>">
<title>Traffic Hub Login</title>
<meta http-equiv="Content-Type" content="text/html; charset=UTF-8" />
40
<link rel="stylesheet" type="text/css" href="style.css" />
<script src="http://www.openlayers.org/api/OpenLayers.js"></script>
<script>
function init()
{
var map = new OpenLayers.Map("basicMap",{
controls: [
new OpenLayers.Control.Navigation(),
new OpenLayers.Control.PanZoomBar(),
new OpenLayers.Control.Permalink(),
new OpenLayers.Control.MousePosition(),
new OpenLayers.Control.ScaleLine(),
new OpenLayers.Control.LayerSwitcher()]
});
//OpenStreetMap Layer
var mapnik = new OpenLayers.Layer.OSM(
'OpenStreetMap'
);
//Position
var vector_layer2 = new OpenLayers.Layer.Vector(
'Real Time Position',
{
style: {
'fillColor': '#ff0000',
'fillOpacity': .8,
'strokeColor': '#c00000',
'strokeWidth': 3,
'pointRadius': 8}
}
);
//Vector Layer
var vector_layer = new OpenLayers.Layer.Vector(
'Editable Vectors'
);
var userlon = 18.057822;
var userlat = 59.351753;
// the rest two lines are statements to read
// userlon and userlat coordinates of current GPS locateion from the database
//var userlon = <%=(String)session.getAttribute("userlon")%>;
//var userlat = <%=(String)session.getAttribute("userlat")%>;
var fromProjection = new OpenLayers.Projection("EPSG:4326");
// Transform from WGS 1984
var toProjection
= new OpenLayers.Projection("EPSG:900913"); // to Spherical Mercator Projection
var position
= new OpenLayers.LonLat(userlon,userlat).transform(fromProjection,toProjection);
41
var zoom
= 12;
// Add layers
map.addLayers([mapnik,vector_layer2,vector_layer]);
// Add a vector editing control. Must do it after map.addLayers([...]).
map.addControl(new OpenLayers.Control.EditingToolbar(vector_layer));
// Add a point feature.
vector_layer2.addFeatures([new OpenLayers.Feature.Vector(new OpenLayers.Geometry.Point
(userlon,userlat).transform(fromProjection,toProjection))]);
// Set center
map.setCenter(position, zoom);
}
</script>
</head>
<body onload="init();">
<!-- BEGIN wrapper -->
<div id="wrapper">
<!-- BEGIN header -->
<div id="header">
<p class="links"><a>Login Successfully</a></p>
<div class="break"></div>
<div class="logo">
<h1><a>Example of JSP Webpage</a></h1>
</div>
<div class="break"></div>
<ol>
<div class="Logout">
<form name="form1" action="UserServlet.do?method=logout" method="post">
<table width="300" border="0">
<tr>
<td width="40" align="right">Welcome!</td>
<td width="60" align="center"><%=(String) session.getAttribute("username")%></td>
<td width="80" align="right"><%=(String) session.getAttribute("userlat")%></td>
<td width="5" align="left">,</td>
<td width="80" align="left"><%=(String) session.getAttribute("userlon")%></td>
<td width="40" align="right"><input class="btn" type="submit" name="submit" value="Logout"></td>
</tr>
</table>
</form>
</div>
</ol>
</div>
<!-- END header -->
<!-- BEGIN content -->
42
<div id="content2">
<div id="basicMap"></div>
</div>
<!-- END content -->
<!-- BEGIN footer -->
<div id="footer">
<p>Web and Mobile GIS AG2417 | Royal Institute of Technology | Sweden</p>
</div>
<!-- END footer -->
</div>
<!-- END wrapper -->
</body>
</html>
43
Division of Geodesy and Geoinformatics
Department of Urban Planning and Environment
Royal Institute of Technology – KTH
Course of AG2417
Edited by Rui Zhu
Web and Mobile GIS Developing Environment Solution
For each group, you can also set the necessary environment on your own computers or laptops for this course. Instruction
for setting the developing environment (Eclipse with Android + PostGIS with Apache Tomcat + GeoServer + OpenLayers)
based on Windows XP Professional is given for this document.
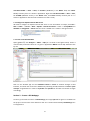
1. Eclipse Installation
1.1. Java Development Kit (JDK)
http://www.oracle.com/technetwork/java/javase/downloads/index.html
You can also install jdk-6u23-windows-i586 in the Virtual Machine of C:\software. Keep the initial routing of C:\Program
Files\Java\jre6\.
1.2. Eclipse IDE for Java EE Developers
http://www.eclipse.org/downloads/
You can also directly copy C:\software\eclipse-jee-indigo-SR2-win32 in the Virtual Machine of C:\software. Keep the
initial workspace of C:\Documents and Settings\Administrator\workspace.
1.3. Software Update
In Java EE – Eclipse, click Help -> Check for Updates for updating.
OBS: You can also reference the following link for different operation systems.
http://www.cs.umd.edu/class/spring2006/cmsc132/EclipseTutorial/install.html
2. Android Installation
2.1. Download Android SDK Tools (choose particular package according to your operation system)
http://developer.android.com/sdk/index.html
44
You can also install installer_r20.0.1-windows in the Virtual Machine of C:\software. Keep the initial routing of
C:\Program Files\Android\android-sdk.
2.2 Click Help -> Install New Software…, in the Work with:, type the following link, and click Next > button to install the
Developer Tools. When the installation is finished, click Restart Now button to restart Eclipse.
http://dl-ssl.google.com/android/eclipse/
45
2.3. Now you will see Android SDK Manager and AVD Manager, as it is shown in the two red boxes below. To be safe for
the later labs (some conflicts with android.jar may happen), download Android 2.1(API 7), Tools->Android SDK Tools
and Tools->Android SDK Platform-tools, as it is shown in the following figure.
46
2.4. In the AVD Manager, click New… button, set Name: Android, Target: Android 2.1 – API Level 7, Built-in: WQVGA432,
and lastly click Create AVD button. Then click Start… button to Launch it. If Android interface jump out accordingly, it
indicates that you have successfully installed Android, as it is shown below in the next page.
OBS: Here is a very good tutorial in the following link on youtube.
http://www.youtube.com/watch?v=OIL1UouA4dE&feature=related
47
3. Apache Tomcat Installation
You can download Apache Tomcat from http://tomcat.apache.org/. Or you can install apache-tomcat-7.0.26 from the
Virtual Machine of C:\software. Set User Name tomcat, set Password tomcat, keep other variables as initials, and install.
You can type http://localhost:8080/ in the web browser to check whether you have installed it successfully.
48
49
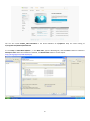
4. PostgreSQL Installation
You can download PostGIS from http://postgis.refractions.net/download/. Or you can install postgresql-8.4.11-1-windows
from the Virtual Machine of C:\software. Set Password as postgres, set Port as 5432, keep other variables as initials, and
install.
50
51
5. PostGIS Installation
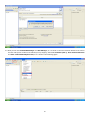
When you click Finish button of PostgreSQL, installation for PostGIS jumps out. Select the particular server of PostgreSQL
8.4 on port 5432 that we installed. In the Spatial Extensions, select PostGIS 2.0 for PostgreSQL 8.4 v2.0.1, keep other
variables as initials, and click I Agree to install. Click PostGIS and Create spatial database -> Next> -> C:\Program
Files\PostgreSQL\8.4 -> Next> -> Password: postgres -> Database Name: postgis -> Install. Now you can login pgAdmin
with the password of postgres to check the database. Screen shots for important steps are given in the figures below.
52
53
54
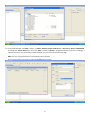
6. GeoServer Installation
You can download GeoServer from http://geoserver.org/display/GEOS/Download. Or you can install geoserver-2.1.3a from
the Virtual Machine of C:\software. Set Username as admin, Password as geoserver, change Port as 8088 (8080 has
already occupied by Tomcat), select Install as a service, keep other variables as initials, and install. When installation is
finished type http://localhost:8088/geoserver/web/ in the web browser to login. Screen shots for important steps are
given in the figures below.
55
56
57
7. OpenLayers “Installation”
In fact you do not have to install OpenLayers. Download Latest stable release vision [.zip] from official OpenLayers
http://trac.osgeo.org/openlayers/wiki/HowToDownload. When you unzip it you will see many folders and files, but you
just have to focus on two folders (img and theme) and one .jr file (OpenLayers). Copy them into C:\code, as it is shown in
the figure below.
Index the particular OpenLayers routing in the JavaScript when you independently use OpenLayers. For example:
<script type='text/javascript' src='OpenLayers.js'></script>.
Or you do nothing but use an absolute path of a URL for indexing to OpenLayers.org hosts where the script files locates:
<script type='text/javascirpt' src='http://openlayers.org/api/OpenLayers.js'></script>.
58
59