1
Shark 200S
This page intentionally left blank.
Shark® 200S Meter Installation and Operation Manual Version 1.06
Published by:
Electro Industries/GaugeTech
1800 Shames Drive
Westbury, NY 11590
All rights reserved. No part of this publication may be reproduced or transmitted in
any form or by any means, electronic or mechanical, including photocopying, recording, or information storage or retrieval systems or any future forms of duplication, for
any purpose other than the purchaser's use, without the expressed written permission
of Electro Industries/GaugeTech.
© 2012 Electro Industries/GaugeTech
Nexus® and Shark® are registered trademarks of Electro Industries/GaugeTech.
Electro Industries/GaugeTech
Electro Industries/GaugeTech
The Leader In Power Monitoring and Smart Grid Solutions
The Leader In Power Monitoring and Smart Grid Solutions
Doc#
E149721
i
This page intentionally left blank.
Electro Industries/GaugeTech
Electro Industries/GaugeTech
The Leader In Power Monitoring and Smart Grid Solutions
The Leader In Power Monitoring and Smart Grid Solutions
Doc#
E149721
ii
Customer Service and Support
Customer support is available 9:00 am to 4:30 pm, Eastern Standard Time, Monday
through Friday. Please have the model, serial number and a detailed problem description available. If the problem concerns a particular reading, please have all meter
readings available. When returning any merchandise to EIG, a return materials
authorization number is required. For customer or technical assistance, repair or
calibration, phone 516-334-0870 or fax 516-338-4741.
Product Warranty
Electro Industries/GaugeTech warrants all products to be free from defects in material
and workmanship for a period of four years from the date of shipment. During the
warranty period, we will, at our option, either repair or replace any product that
proves to be defective.
To exercise this warranty, fax or call our customer-support department. You will
receive prompt assistance and return instructions. Send the instrument, transportation prepaid, to EIG at 1800 Shames Drive, Westbury, NY 11590. Repairs will be made
and the instrument will be returned.
This warranty does not apply to defects resulting from unauthorized modification,
misuse, or use for any reason other than electrical power monitoring. The Shark®
200S meter is not a user-serviceable product.
OUR PRODUCTS ARE NOT TO BE USED FOR PRIMARY OVER-CURRENT PROTECTION.
ANY PROTECTION FEATURE IN OUR PRODUCTS IS TO BE USED FOR ALARM OR
SECONDARY PROTECTION ONLY.
THIS WARRANTY IS IN LIEU OF ALL OTHER WARRANTIES, EXPRESSED
OR IMPLIED, INCLUDING ANY IMPLIED WARRANTY OF MERCHANTABILITY OR FITNESS FOR A PARTICULAR PURPOSE. ELECTRO INDUSTRIES/
GAUGETECH SHALL NOT BE LIABLE FOR ANY INDIRECT, SPECIAL OR
CONSEQUENTIAL DAMAGES ARISING FROM ANY AUTHORIZED OR
UNAUTHORIZED USE OF ANY ELECTRO INDUSTRIES/GAUGETECH
PRODUCT. LIABILITY SHALL BE LIMITED TO THE ORIGINAL COST OF
THE PRODUCT SOLD.
Electro Industries/GaugeTech
Electro Industries/GaugeTech
The Leader In Power Monitoring and Smart Grid Solutions
The Leader In Power Monitoring and Smart Grid Solutions
Doc#
E149721
iii
Statement of Calibration
Our instruments are inspected and tested in accordance with specifications published
by Electro Industries/GaugeTech. The accuracy and a calibration of our instruments
are traceable to the National Institute of Standards and Technology through
equipment that is calibrated at planned intervals by comparison to certified standards.
Disclaimer
The information presented in this publication has been carefully checked for
reliability; however, no responsibility is assumed for inaccuracies. The information
contained in this document is subject to change without notice.
This symbol indicates that the operator must refer to an
explanation in the operating instructions. Please see Chapter 4 for
important safety information regarding installation and hookup of
the Shark® 200S meter.
FCC Information
Regarding the wireless module:
• This device complies with Part 15 of the FCC rules. Operation is subject to the
following two conditions: 1) this device may not cause harmful interference, and 2)
this device must accept any interference received, including interference that may
cause undesired operation.
• The antenna provided must not be replaced with an different type. Attaching a
different antenna will void the FCC approval and the FCC ID can no longer be
considered.
Electro Industries/GaugeTech
Electro Industries/GaugeTech
The Leader In Power Monitoring and Smart Grid Solutions
The Leader In Power Monitoring and Smart Grid Solutions
Doc#
E149721
iv
About Electro Industries/GaugeTech
Founded in 1975 by engineer and inventor Dr. Samuel Kagan, Electro Industries/
GaugeTech changed the face of power monitoring forever with its first breakthrough
innovation: an affordable, easy-to-use AC power meter. A few of our many technology
firsts include:
• 1975: First multifunction meter
• 1981: First micro-processor based power monitor
• 1986: First PC-based power monitoring software for plant-wide power distribution
analysis
• 1994: First 1 MegaByte memory high-performance power monitor for data analysis
and recording
• 1999: First auto-calibrating power monitoring - Nexus® Series
• 2001: First auto-calibrating meter under glass
• 2005: Shark® 100 submeter and Shark® 100S wireless submeter with 802.11 WiFi
capability
• 2007: Shark® 200 data-logging submeter with optional I/O
• 2008: First Nexus® 1500 transient recorder and power meter with advanced PQ
and dual Ethernet communication ports
• 2012: EIG released many products specializing in the Smart meter and Alternative
Energy marketplace.
Thirty years since its founding, Electro Industries/GaugeTech, the leader in power
monitoring and control, continues to revolutionize the industry with the highest quality, cutting edge power monitoring and control technology on the market today. An
ISO 9001:2000 certified company, EIG sets the industry standard for advanced power
quality and reporting, revenue metering and substation data acquisition and control.
EIG products can be found on site at virtually all of today's leading manufacturers,
industrial giants and utilities.
Electro Industries/GaugeTech
Electro Industries/GaugeTech
The Leader In Power Monitoring and Smart Grid Solutions
The Leader In Power Monitoring and Smart Grid Solutions
Doc#
E149721
v
All EIG products are designed, manufactured, tested and calibrated at our facility in
Westbury, New York.
Applications
• Web-accessed multifunction power monitoring and control
• Single and multifunction power monitoring
• Power quality monitoring
• Onboard data logging for trending power usage and quality
• Disturbance analysis
• Revenue metering and billing
• Smart grid solutions
Electro Industries/GaugeTech
Electro Industries/GaugeTech
The Leader In Power Monitoring and Smart Grid Solutions
The Leader In Power Monitoring and Smart Grid Solutions
Doc#
E149721
vi
Table of Contents
Table of Contents
Customer Service and Support
iii
Product Warranty
iii
Statement of Calibration
iv
Disclaimer
iv
FCC Information
iv
About Electro Industries/GaugeTech
v
1: Three-Phase Power Measurement
1-1
1.1: Three-Phase System Configurations
1-1
1.1.1: Wye Connection
1-1
1.1.2: Delta Connection
1-4
1.1.3: Blondell’s Theorem and Three Phase Measurement
1-6
1.2: Power, Energy and Demand
1-8
1.3: Reactive Energy and Power Factor
1-12
1.4: Harmonic Distortion
1-14
1.5: Power Quality
1-17
2: Shark® 200S Submeter Overview and
Specifications
2-1
2.1: Hardware Overview
2-1
2.1.1: Model Number plus Option Numbers
2-3
2.1.2: Measured Values
2-3
2.1.3: Utility Peak Demand
2-5
2.2: Specifications
2-5
Electro Industries/GaugeTech
Electro Industries/GaugeTech
The Leader In Power Monitoring and Smart Grid Solutions
The Leader In Power Monitoring and Smart Grid Solutions
Doc#
E149721
TOC - 1
Table of Contents
2.3: Compliance
2-10
2.4: Accuracy
2-10
3: Mechanical Installation
3-1
3.1: Overview
3-1
3.2: Install the Base
3-1
3.2.1:Mounting Diagrams
3-3
3.3: Secure the Cover
3-7
4: Electrical Installation
4-1
4.1: Considerations When Installing Meters
4-1
4.2: Electrical Connections
4-2
4.3: Ground Connections
4-3
4.4: Voltage Fuses
4-3
4.5: Electrical Connection Diagrams
4-4
5: Communication Installation
5-1
5.1: Shark® 200S Communication
5-1
5.1.1: IrDA Port (Com 1)
5-1
5.1.1.1: USB to IrDA Adapter
5-2
5.1.2: RS485 Communication Com 2 (485 Option)
5-3
5.1.3: KYZ Output
5-5
5.1.4: Ethernet Connection
5-6
5.2: Meter Communication and Programming Overview
5-7
5.2.1: How to Connect to the Submeter
5-8
5.2.2: Shark® 200S Meter Device Profile Settings
5-11
Electro Industries/GaugeTech
Electro Industries/GaugeTech
The Leader In Power Monitoring and Smart Grid Solutions
The Leader In Power Monitoring and Smart Grid Solutions
Doc#
E149721
TOC - 2
Table of Contents
6: Ethernet Configuration
6-1
6.1: Introduction
6-1
6.2: Setting up the Host PC to Communicate with
Shark® 200S Meter
6-1
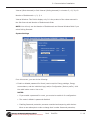
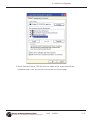
6.2.1: Configuring the Host PC's Ethernet Adapter Using
Windows XP©
6-2
6.3: Setting up the Ethernet Module in the
Shark® 200S Meter
6-5
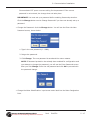
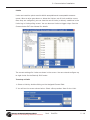
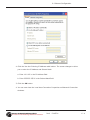
6.3.1: Configuring the Ethernet Module in the Shark® 200S
Meter using Windows XP© on the Host Computer
6.3.2: Example of Modifying Parameters in Groups 1 and 6
6-6
6-8
6.4: Network Module Hardware Initialization
6-9
7: Using the Submeter
7-1
7.1: Introduction
7-1
7.1.A: Understanding Submeter Face Elements
7-1
7.1.B: Understanding Submeter Face Buttons
7-2
7.2: Using the Front Panel
7-3
7.2.1: Understanding Startup and Default Displays
7-3
7.2.2: Using the Main Menu
7-4
7.2.3: Using Reset Mode
7-5
7.2.4: Entering a Password
7-6
7.2.5: Using Configuration Mode
7-7
7.2.5.1: Configuring the Scroll Feature
7-9
7.2.5.2: Configuring CT Setting
7-10
7.2.5.3: Configuring PT Setting
7-11
Electro Industries/GaugeTech
Electro Industries/GaugeTech
The Leader In Power Monitoring and Smart Grid Solutions
The Leader In Power Monitoring and Smart Grid Solutions
Doc#
E149721
TOC - 3
Table of Contents
7.2.5.4: Configuring Connection Setting
7-13
7.2.5.5: Configuring Communication Port Setting
7-13
7.2.6: Using Operating Mode
7-15
7.3: Understanding the % of Load Bar
7-16
7.4: Performing Watt-Hour Accuracy Testing (Verification)
7-17
A: Shark® 200S Meter Navigation Maps
A-1
A.1: Introduction
A-1
A.2: Navigation Maps (Sheets 1 to 4)
A-1
B: Modbus Map and Retrieving Logs
A-1
B.1: Introduction
B-1
B.2: Modbus Register Map Sections
B-1
B.3: Data Formats
B-1
B.4: Floating Point Values
B-2
B.5: Retrieving Logs Using the Shark® 200S Meter's
Modbus Map
B-3
B.5.1: Data Formats
B-4
B.5.2: Shark® 200S Meter Logs
B-4
B.5.3: Block Definitions
B-5
B.5.4: Log Retrieval
B-15
B.5.4.1: Auto-Increment
B-15
B.5.4.2: Modbus Function Code 0x23
B-16
B.5.4.3: Log Retrieval Procedure
B-17
B.5.4.4: Log Retrieval Example
B-20
B.5.5: Log Record Interpretation
B-29
Electro Industries/GaugeTech
Electro Industries/GaugeTech
The Leader In Power Monitoring and Smart Grid Solutions
The Leader In Power Monitoring and Smart Grid Solutions
Doc#
E149721
TOC - 4
Table of Contents
B.5.6: Examples
B-37
B.6: Important Note Concerning the Shark ® 200S
Meter's Modbus Map
B-40
B.6.1: Hex Representation
B-40
B.6.2: Decimal Representation
B-40
B.7: Modbus Register Map (MM-1 to MM-15)
B-41
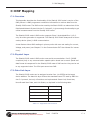
C: DNP Mapping
C-1
C.1: Overview
C-1
C.2: Physical Layer
C-1
C.3: Data Link Layer
C-1
C.4: Application Layer
C-2
C.5: Error Reply
C-3
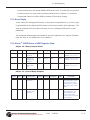
C.6: Shark® 200S Meter’s DNP Register Map
C-3
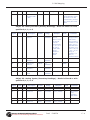
C.7: DNP Message Layouts
C-6
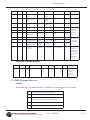
C.8: Internal Indication Bits
C-9
D: Using the USB to IrDA Adapter (CAB6490)
D-1
D.1: Introduction
D-1
D.2: Installation Procedures
D-1
Electro Industries/GaugeTech
Electro Industries/GaugeTech
The Leader In Power Monitoring and Smart Grid Solutions
The Leader In Power Monitoring and Smart Grid Solutions
Doc#
E149721
TOC - 5
Table of Contents
This page intentionally left blank.
Electro Industries/GaugeTech
Electro Industries/GaugeTech
The Leader In Power Monitoring and Smart Grid Solutions
The Leader In Power Monitoring and Smart Grid Solutions
Doc#
E149721
TOC - 6
1: Three Phase Power Measurement
1: Three-Phase Power Measurement
This introduction to three-phase power and power measurement is intended to
provide only a brief overview of the subject. The professional meter engineer or meter
technician should refer to more advanced documents such as the EEI Handbook for
Electricity Metering and the application standards for more in-depth and technical
coverage of the subject.
1.1: Three-Phase System Configurations
Three-phase power is most commonly used in situations where large amounts of
power will be used because it is a more effective way to transmit the power and
because it provides a smoother delivery of power to the end load. There are two
commonly used connections for three-phase power, a wye connection or a delta
connection. Each connection has several different manifestations in actual use.
When attempting to determine the type of connection in use, it is a good practice to
follow the circuit back to the transformer that is serving the circuit. It is often not
possible to conclusively determine the correct circuit connection simply by counting
the wires in the service or checking voltages. Checking the transformer connection
will provide conclusive evidence of the circuit connection and the relationships
between the phase voltages and ground.
1.1.1: Wye Connection
The wye connection is so called because when you look at the phase relationships and
the winding relationships between the phases it looks like a Y. Figure 1.1 depicts the
winding relationships for a wye-connected service. In a wye service the neutral (or
center point of the wye) is typically grounded. This leads to common voltages of 208/
120 and 480/277 (where the first number represents the phase-to-phase voltage and
the second number represents the phase-to-ground voltage).
Electro Industries/GaugeTech
Electro Industries/GaugeTech
The Leader In Power Monitoring and Smart Grid Solutions
The Leader In Power Monitoring and Smart Grid Solutions
Doc#
E149721
1-1
1: Three Phase Power Measurement
VC
Phase 2
N
Phase 1
Phase 3
VB
VA
Figure 1.1: Three-phase Wye Winding
The three voltages are separated by 120o electrically. Under balanced load conditions
the currents are also separated by 120o. However, unbalanced loads and other
conditions can cause the currents to depart from the ideal 120oseparation. Threephase voltages and currents are usually represented with a phasor diagram. A phasor
diagram for the typical connected voltages and currents is shown in Figure 1.2.
VC
IC
N
IA
VB
IB
VA
Figure 1.2: Phasor Diagram Showing Three-phase Voltages and Currents
Electro Industries/GaugeTech
Electro Industries/GaugeTech
The Leader In Power Monitoring and Smart Grid Solutions
The Leader In Power Monitoring and Smart Grid Solutions
Doc#
E149721
1-2
1: Three Phase Power Measurement
The phasor diagram shows the 120o angular separation between the phase voltages.
The phase-to-phase voltage in a balanced three-phase wye system is 1.732 times the
phase-to-neutral voltage. The center point of the wye is tied together and is typically
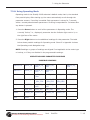
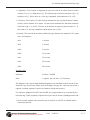
grounded. Table 1.1 shows the common voltages used in the United States for wyeconnected systems.
Phase to Ground Voltage
Phase to Phase Voltage
120 volts
208 volts
277 volts
480 volts
2,400 volts
4,160 volts
7,200 volts
12,470 volts
7,620 volts
13,200 volts
Table 1: Common Phase Voltages on Wye Services
Usually a wye-connected service will have four wires: three wires for the phases and
one for the neutral. The three-phase wires connect to the three phases (as shown in
Figure 1.1). The neutral wire is typically tied to the ground or center point of the wye.
In many industrial applications the facility will be fed with a four-wire wye
service
but only three wires will be run to individual loads. The load is then often referred to
as a delta-connected load but the service to the facility is still a wye service; it
contains four wires if you trace the circuit back to its source (usually a transformer).
In this type of connection the phase to ground voltage will be the phase-to-ground
voltage indicated in Table 1, even though a neutral or ground wire is not physically
present at the load. The transformer is the best place to determine the circuit
connection type because this is a location where the voltage reference to ground can
be conclusively identified.
Electro Industries/GaugeTech
Electro Industries/GaugeTech
The Leader In Power Monitoring and Smart Grid Solutions
The Leader In Power Monitoring and Smart Grid Solutions
Doc#
E149721
1-3
1: Three Phase Power Measurement
1.1.2: Delta Connection
Delta-connected services may be fed with either three wires or four wires. In a threephase delta service the load windings are connected from phase-to-phase rather than
from phase-to-ground. Figure 1.3 shows the physical load connections for a delta
service.
VC
Phase 3
VB
Phase 2
Phase 1
VA
Figure 1.3: Three-phase Delta Winding Relationship
In this example of a delta service, three wires will transmit the power to the load. In a
true delta service, the phase-to-ground voltage will usually not be balanced because
the ground is not at the center of the delta.
Figure 1.4 shows the phasor relationships between voltage and current on a threephase delta circuit.
In many delta services, one corner of the delta is grounded. This means the phase to
ground voltage will be zero for one phase and will be full phase-to-phase voltage for
the other two phases. This is done for protective purposes.
Electro Industries/GaugeTech
Electro Industries/GaugeTech
The Leader In Power Monitoring and Smart Grid Solutions
The Leader In Power Monitoring and Smart Grid Solutions
Doc#
E149721
1-4
1: Three Phase Power Measurement
VBC
VCA
IC
IA
IB
VAB
Figure 1.4: Phasor Diagram, Three-Phase Voltages and Currents, Delta-Connected
Another common delta connection is the four-wire, grounded delta used for lighting
loads. In this connection the center point of one winding is grounded. On a 120/240
volt, four-wire, grounded delta service the phase-to-ground voltage would be 120
volts on two phases and 208 volts on the third phase. Figure 1.5 shows the phasor
diagram for the voltages in a three-phase, four-wire delta system.
VC
VCA
VBC
N
VA
VAB
VB
Figure 1.5: Phasor Diagram Showing Three-phase Four-Wire Delta-Connected System
Electro Industries/GaugeTech
Electro Industries/GaugeTech
The Leader In Power Monitoring and Smart Grid Solutions
The Leader In Power Monitoring and Smart Grid Solutions
Doc#
E149721
1-5
1: Three Phase Power Measurement
1.1.3: Blondell’s Theorem and Three Phase Measurement
In 1893 an engineer and mathematician named Andre E. Blondell set forth the first
scientific basis for polyphase metering. His theorem states:
If energy is supplied to any system of conductors through N wires, the total power in
the system is given by the algebraic sum of the readings of N wattmeters so arranged
that each of the N wires contains one current coil, the corresponding potential coil
being connected between that wire and some common point. If this common point is
on one of the N wires, the measurement may be made by the use of N-1 Wattmeters.
The theorem may be stated more simply, in modern language:
In a system of N conductors, N-1 meter elements will measure the power or energy
taken provided that all the potential coils have a common tie to the conductor in
which there is no current coil.
Three-phase power measurement is accomplished by measuring the three individual
phases and adding them together to obtain the total three phase value. In older
analog meters, this measurement was accomplished using up to three separate elements. Each element combined the single-phase voltage and current to produce a
torque on the meter disk. All three elements were arranged around the disk so that
the disk was subjected to the combined torque of the three elements. As a result the
disk would turn at a higher speed and register power supplied by each of the three
wires.
According to Blondell's Theorem, it was possible to reduce the number of elements
under certain conditions. For example, a three-phase, three-wire delta system could
be correctly measured with two elements (two potential coils and two current coils) if
the potential coils were connected between the three phases with one phase in
common.
In a three-phase, four-wire wye system it is necessary to use three elements. Three
voltage coils are connected between the three phases and the common neutral
conductor. A current coil is required in each of the three phases.
In modern digital meters, Blondell's Theorem is still applied to obtain proper
metering. The difference in modern meters is that the digital meter measures each
phase voltage and current and calculates the single-phase power for each phase. The
meter then sums the three phase powers to a single three-phase reading.
Electro Industries/GaugeTech
Electro Industries/GaugeTech
The Leader In Power Monitoring and Smart Grid Solutions
The Leader In Power Monitoring and Smart Grid Solutions
Doc#
E149721
1-6
1: Three Phase Power Measurement
Some digital meters calculate the individual phase power values one phase at a time.
This means the meter samples the voltage and current on one phase and calculates a
power value. Then it samples the second phase and calculates the power for the
second phase. Finally, it samples the third phase and calculates that phase power.
After sampling all three phases, the meter combines the three readings to create the
equivalent three-phase power value. Using mathematical averaging techniques, this
method can derive a quite accurate measurement of three-phase power.
More advanced meters actually sample all three phases of voltage and current
simultaneously and calculate the individual phase and three-phase power values. The
advantage of simultaneous sampling is the reduction of error introduced due to the
difference in time when the samples were taken.
C
B
Phase B
Phase C
Node "n"
Phase A
A
N
Figure 1.6: Three-Phase Wye Load Illustrating Kirchhoff’s Law and Blondell’s Theorem
Blondell's Theorem is a derivation that results from Kirchhoff's Law. Kirchhoff's Law
states that the sum of the currents into a node is zero. Another way of stating the
same thing is that the current into a node (connection point) must equal the current
out of the node. The law can be applied to measuring three-phase loads. Figure 1.6
shows a typical connection of a three-phase load applied to a three-phase, four-wire
service. Krichhoff's Law holds that the sum of currents A, B, C and N must equal zero
or that the sum of currents into Node "n" must equal zero.
If we measure the currents in wires A, B and C, we then know the current in wire N by
Kirchhoff's Law and it is not necessary to measure it. This fact leads us to the
conclusion of Blondell's Theorem- that we only need to measure the power in three of
Electro Industries/GaugeTech
Electro Industries/GaugeTech
The Leader In Power Monitoring and Smart Grid Solutions
The Leader In Power Monitoring and Smart Grid Solutions
Doc#
E149721
1-7
1: Three Phase Power Measurement
the four wires if they are connected by a common node. In the circuit of Figure 1.6 we
must measure the power flow in three wires. This will require three voltage coils and
three current coils (a three-element meter). Similar figures and conclusions could be
reached for other circuit configurations involving Delta-connected loads.
1.2: Power, Energy and Demand
It is quite common to exchange power, energy and demand without differentiating
between the three. Because this practice can lead to confusion, the differences
between these three measurements will be discussed.
Power is an instantaneous reading. The power reading provided by a meter is the
present flow of watts. Power is measured immediately just like current. In many
digital meters, the power value is actually measured and calculated over a one second
interval because it takes some amount of time to calculate the RMS values of voltage
and current. But this time interval is kept small to preserve the instantaneous nature
of power.
Energy is always based on some time increment; it is the integration of power over a
defined time increment. Energy is an important value because almost all electric bills
are based, in part, on the amount of energy used.
Typically, electrical energy is measured in units of kilowatt-hours (kWh). A kilowatthour represents a constant load of one thousand watts (one kilowatt) for one hour.
Stated another way, if the power delivered (instantaneous watts) is measured as
1,000 watts and the load was served for a one hour time interval then the load would
have absorbed one kilowatt-hour of energy. A different load may have a constant
power requirement of 4,000 watts. If the load were served for one hour it would
absorb four kWh. If the load were served for 15 minutes it would absorb ¼ of that
total or one kWh.
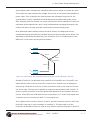
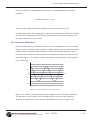
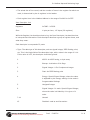
Figure 1.7 shows a graph of power and the resulting energy that would be transmitted
as a result of the illustrated power values. For this illustration, it is assumed that the
power level is held constant for each minute when a measurement is taken. Each bar
in the graph will represent the power load for the one-minute increment of time. In
real life the power value moves almost constantly.
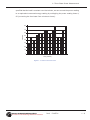
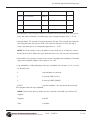
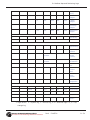
The data from Figure 1.7 is reproduced in Table 2 to illustrate the calculation of
energy. Since the time increment of the measurement is one minute and since we
Electro Industries/GaugeTech
Electro Industries/GaugeTech
The Leader In Power Monitoring and Smart Grid Solutions
The Leader In Power Monitoring and Smart Grid Solutions
Doc#
E149721
1-8
1: Three Phase Power Measurement
specified that the load is constant over that minute, we can convert the power reading
to an equivalent consumed energy reading by multiplying the power reading times 1/
60 (converting the time base from minutes to hours).
80
70
kilowat t s
60
50
40
30
20
10
0
1
2
3
4
5
6
7
8
9
10
11
12
13
14
15
Time (minutes)
Figure 1.7: Power Use over Time
Electro Industries/GaugeTech
Electro Industries/GaugeTech
The Leader In Power Monitoring and Smart Grid Solutions
The Leader In Power Monitoring and Smart Grid Solutions
Doc#
E149721
1-9
1: Three Phase Power Measurement
Time
Interval
(minute)
Power
(kW)
Energy
(kWh)
Accumulated
Energy
(kWh)
1
30
0.50
0.50
2
50
0.83
1.33
3
40
0.67
2.00
4
55
0.92
2.92
5
60
1.00
3.92
6
60
1.00
4.92
7
70
1.17
6.09
8
70
1.17
7.26
9
60
1.00
8.26
10
70
1.17
9.43
11
80
1.33
10.76
12
50
0.83
12.42
13
50
0.83
12.42
14
70
1.17
13.59
15
80
1.33
14.92
Table 1.2: Power and Energy Relationship over Time
As in Table 1.2, the accumulated energy for the power load profile of Figure 1.7 is
14.92 kWh.
Demand is also a time-based value. The demand is the average rate of energy use
over time. The actual label for demand is kilowatt-hours/hour but this is normally
reduced to kilowatts. This makes it easy to confuse demand with power, but demand
is not an instantaneous value. To calculate demand it is necessary to accumulate the
energy readings (as illustrated in Figure 1.7) and adjust the energy reading to an
hourly value that constitutes the demand.
In the example, the accumulated energy is 14.92 kWh. But this measurement was
made over a 15-minute interval. To convert the reading to a demand value, it must be
normalized to a 60-minute interval. If the pattern were repeated for an additional
three 15-minute intervals the total energy would be four times the measured value or
Electro Industries/GaugeTech
Electro Industries/GaugeTech
The Leader In Power Monitoring and Smart Grid Solutions
The Leader In Power Monitoring and Smart Grid Solutions
Doc#
E149721
1 - 10
1: Three Phase Power Measurement
59.68 kWh. The same process is applied to calculate the 15-minute demand value.
The demand value associated with the example load is 59.68 kWh/hr or 59.68 kWd.
Note that the peak instantaneous value of power is 80 kW, significantly more than the
demand value.
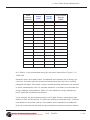
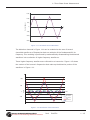
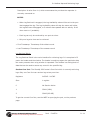
Figure 1.8 shows another example of energy and demand. In this case, each bar represents the energy consumed in a 15-minute interval. The energy use in each interval
typically falls between 50 and 70 kWh. However, during two intervals the energy rises
sharply and peaks at 100 kWh in interval number 7. This peak of usage will result in
setting a high demand reading. For each interval shown the demand value would be
four times the indicated energy reading. So interval 1 would have an associated
demand of 240 kWh/hr.
Interval 7 will have a demand value of 400 kWh/hr. In the
data shown, this is the peak demand value and would be the number that would set
the demand charge on the utility bill.
100
kilowat t-hours
80
60
40
20
0
1
2
3
4
5
6
Intervals (15 mins.)
7
8
Figure 1.8: Energy Use and Demand
As can be seen from this example, it is important to recognize the relationships
between power, energy and demand in order to control loads effectively or to monitor
use correctly.
Electro Industries/GaugeTech
Electro Industries/GaugeTech
The Leader In Power Monitoring and Smart Grid Solutions
The Leader In Power Monitoring and Smart Grid Solutions
Doc#
E149721
1 - 11
1: Three Phase Power Measurement
1.3: Reactive Energy and Power Factor
The real power and energy measurements discussed in the previous section relate to
the quantities that are most used in electrical systems. But it is often not sufficient to
only measure real power and energy. Reactive power is a critical component of the
total power picture because almost all real-life
applications have an impact on
reactive power. Reactive power and power factor concepts relate to both load and
generation applications. However, this discussion will be limited to analysis of reactive
power and power factor as they relate to loads. To simplify the discussion, generation
will not be considered.
Real power (and energy) is the component of power that is the combination of the
voltage and the value of corresponding current that is directly in phase with the
voltage. However, in actual practice the total current is almost never in phase with the
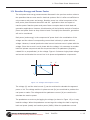
voltage. Since the current is not in phase with the voltage, it is necessary to consider
both the inphase component and the component that is at quadrature (angularly
rotated 90o or perpendicular) to the voltage. Figure 1.9 shows a single-phase voltage
and current and breaks the current into its in-phase and quadrature components.
IR
V
0
IX
I
Figure 1.9: Voltage and Complex Current
The voltage (V) and the total current (I) can be combined to calculate the apparent
power or VA. The voltage and the in-phase current (IR) are combined to produce the
real power or watts. The voltage and the quadrature current (IX) are combined to
calculate the reactive power.
The quadrature current may be lagging the voltage (as shown in Figure 1.9) or it may
lead the voltage. When the quadrature current lags the voltage the load is requiring
both real power (watts) and reactive power (VARs). When the quadrature current
Electro Industries/GaugeTech
Electro Industries/GaugeTech
The Leader In Power Monitoring and Smart Grid Solutions
The Leader In Power Monitoring and Smart Grid Solutions
Doc#
E149721
1 - 12
1: Three Phase Power Measurement
leads the voltage the load is requiring real power (watts) but is delivering reactive
power (VARs) back into the system; that is VARs are flowing in the opposite direction
of the real power flow.
Reactive power (VARs) is required in all power systems. Any equipment that uses
magnetization to operate requires VARs. Usually the magnitude of VARs is relatively
low compared to the real power quantities. Utilities have an interest in maintaining
VAR requirements at the customer to a low value in order to maximize the return on
plant invested to deliver energy. When lines are carrying VARs, they cannot carry as
many watts. So keeping the VAR content low allows a line to carry its full capacity of
watts. In order to encourage customers to keep VAR requirements low, some utilities
impose a penalty if the VAR content of the load rises above a specified value.
A common method of measuring reactive power requirements is power factor. Power
factor can be defined in two different ways. The more common method of calculating
power factor is the ratio of the real power to the apparent power. This relationship is
expressed in the following formula:
Total PF = real power / apparent power = watts/VA
This formula calculates a power factor quantity known as Total Power Factor. It is
called Total PF because it is based on the ratios of the power delivered. The delivered
power quantities will include the impacts of any existing harmonic content. If the
voltage or current includes high levels of harmonic distortion the power values will be
affected. By calculating power factor from the power values, the power factor will
include the impact of harmonic distortion. In many cases this is the preferred method
of calculation because the entire impact of the actual voltage and current are
included.
A second type of power factor is Displacement Power Factor. Displacement PF is based
on the angular relationship between the voltage and current. Displacement power
factor does not consider the magnitudes of voltage, current or power. It is solely
based on the phase angle differences. As a result, it does not include the impact of
Electro Industries/GaugeTech
Electro Industries/GaugeTech
The Leader In Power Monitoring and Smart Grid Solutions
The Leader In Power Monitoring and Smart Grid Solutions
Doc#
E149721
1 - 13
1: Three Phase Power Measurement
harmonic distortion. Displacement power factor is calculated using the following
equation:
Displacement PF = cos T
where T is the angle between the voltage and the current (see Fig. 1.9).
In applications where the voltage and current are not distorted, the Total Power Factor
will equal the Displacement Power Factor. But if harmonic distortion is present, the
two power factors will not be equal.
1.4: Harmonic Distortion
Harmonic distortion is primarily the result of high concentrations of non-linear loads.
Devices such as computer power supplies, variable speed drives and fluorescent light
ballasts make current demands that do not match the sinusoidal waveform of AC
electricity. As a result, the current waveform feeding these loads is periodic but not
sinusoidal. Figure 1.10 shows a normal, sinusoidal current waveform. This example
has no distortion.
1000
0
Amps
500
Time
– 500
– 1000
Figure 1.10: Nondistorted Current Waveform
Figure 1.11 shows a current waveform with a slight amount of harmonic distortion.
The waveform is still periodic and is fluctuating at the normal 60 Hz frequency.
However, the waveform is not a smooth sinusoidal form as seen in Figure 1.10.
Electro Industries/GaugeTech
Electro Industries/GaugeTech
The Leader In Power Monitoring and Smart Grid Solutions
The Leader In Power Monitoring and Smart Grid Solutions
Doc#
E149721
1 - 14
1: Three Phase Power Measurement
1500
Current (amps)
1000
500
t
0
a
2a
–500
–1000
–1500
Figure 1.11: Distorted Current Waveform
The distortion observed in Figure 1.11 can be modeled as the sum of several
sinusoidal waveforms of frequencies that are multiples of the fundamental 60 Hz
frequency. This modeling is performed by mathematically disassembling the distorted
waveform into a collection of higher frequency waveforms.
These higher frequency waveforms are referred to as harmonics. Figure 1.12 shows
the content of the harmonic frequencies that make up the distortion portion of the
waveform in Figure 1.11.
1000
0
Amps
500
Time
3rd harmonic
5th harmonic
– 500
7th harmonic
Total
fundamental
Figure 1.12: Waveforms of the Harmonics
Electro Industries/GaugeTech
Electro Industries/GaugeTech
The Leader In Power Monitoring and Smart Grid Solutions
The Leader In Power Monitoring and Smart Grid Solutions
Doc#
E149721
1 - 15
1: Three Phase Power Measurement
The waveforms shown in Figure 1.12 are not smoothed but do provide an indication of
the impact of combining multiple harmonic frequencies together.
When harmonics are present it is important to remember that these quantities are
operating at higher frequencies. Therefore, they do not always respond in the same
manner as 60 Hz values.
Inductive and capacitive impedance are present in all power systems. We are
accustomed to thinking about these impedances as they perform at 60 Hz. However,
these impedances are subject to frequency variation.
XL = jZL
and
XC = 1/jZC
At 60 Hz, Z = 377; but at 300 Hz (5th harmonic) Z = 1,885. As frequency changes
impedance changes and system impedance characteristics that are normal at 60 Hz
may behave entirely differently in the presence of higher order harmonic waveforms.
Traditionally, the most common harmonics have been the low order, odd frequencies,
such as the 3rd, 5th, 7th, and 9th. However newer, new-linear loads are introducing
significant quantities of higher order harmonics.
Since much voltage monitoring and almost all current monitoring is performed using
instrument transformers, the higher order harmonics are often not visible. Instrument
transformers are designed to pass 60 Hz quantities with high accuracy. These devices,
when designed for accuracy at low frequency, do not pass high frequencies with high
accuracy; at frequencies above about 1200 Hz they pass almost no information. So
when instrument transformers are used, they effectively filter out higher frequency
harmonic distortion making it impossible to see.
However, when monitors can be connected directly to the measured circuit (such as
direct connection to a 480 volt bus) the user may often see higher order harmonic
distortion. An important rule in any harmonics study is to evaluate the type of
equipment and connections before drawing a conclusion. Not being able to see
harmonic distortion is not the same as not having harmonic distortion.
It is common in advanced meters to perform a function commonly referred to as
waveform capture. Waveform capture is the ability of a meter to capture a present
picture of the voltage or current waveform for viewing and harmonic analysis.
Electro Industries/GaugeTech
Electro Industries/GaugeTech
The Leader In Power Monitoring and Smart Grid Solutions
The Leader In Power Monitoring and Smart Grid Solutions
Doc#
E149721
1 - 16
1: Three Phase Power Measurement
Typically a waveform capture will be one or two cycles in duration and can be viewed
as the actual waveform, as a spectral view of the harmonic content, or a tabular view
showing the magnitude and phase shift of each harmonic value. Data collected with
waveform capture is typically not saved to memory. Waveform capture is a real-time
data collection event.
Waveform capture should not be confused with waveform recording that is used to
record multiple cycles of all voltage and current waveforms in response to a transient
condition.
1.5: Power Quality
Power quality can mean several different things. The terms "power quality" and
"power quality problem" have been applied to all types of conditions. A simple
definition of "power quality problem" is any voltage, current or frequency deviation
that results in mis-operation or failure of customer equipment or systems. The causes
of power quality problems vary widely and may originate in the customer equipment,
in an adjacent customer facility or with the utility.
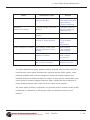
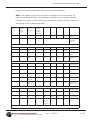
In his book Power Quality Primer, Barry Kennedy provided information on different
types of power quality problems. Some of that information is summarized in Table
1.3.
Electro Industries/GaugeTech
Electro Industries/GaugeTech
The Leader In Power Monitoring and Smart Grid Solutions
The Leader In Power Monitoring and Smart Grid Solutions
Doc#
E149721
1 - 17
1: Three Phase Power Measurement
Cause
Disturbance Type
Source
Impulse transient
Transient voltage disturbance,
sub-cycle duration
Lightning
Electrostatic discharge
Load switching
Capacitor switching
Oscillatory
transient with decay
Transient voltage, sub-cycle
duration
Line/cable switching
Capacitor switching
Load switching
Sag/swell
RMS voltage, multiple cycle
duration
Remote system faults
Interruptions
RMS voltage, multiple
seconds or longer duration
System protection
Circuit breakers
Fuses
Maintenance
Under voltage/over voltage
RMS voltage, steady state,
multiple seconds or longer
duration
Motor starting
Load variations
Load dropping
Voltage flicker
RMS voltage, steady state,
repetitive condition
Intermittent loads
Motor starting
Arc furnaces
Harmonic distortion
Steady state current or voltage, long-term duration
Non-linear loads
System resonance
Table 1.3: Typical Power Quality Problems and Sources
It is often assumed that power quality problems originate with the utility. While it is
true that may power quality problems can originate with the utility system, many
problems originate with customer equipment. Customer-caused problems may
manifest themselves inside the customer location or they may be transported by the
utility system to another adjacent customer. Often, equipment that is sensitive to
power quality problems may in fact also be the cause of the problem.
If a power quality problem is suspected, it is generally wise to consult a power quality
professional for assistance in defining the cause and possible solutions to the
problem.
Electro Industries/GaugeTech
Electro Industries/GaugeTech
The Leader In Power Monitoring and Smart Grid Solutions
The Leader In Power Monitoring and Smart Grid Solutions
Doc#
E149721
1 - 18
2: Meter Overview and Specifications
2: Shark® 200S Submeter Overview and
Specifications
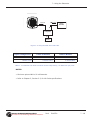
2.1: Hardware Overview
The Shark® 200S multifunction submeter is designed
to measure revenue grade electrical energy usage and
communicate that information via various communication media. The unit supports RS485, RJ45 wired Ethernet or IEEE 802.11 WiFi Ethernet connections. This
allows the Shark® 200S submeter to be placed anywhere within an industrial or commercial facility and
still communicate quickly and easily back to central
software. The unit also has a front IrDA port that can be
read and configured with an IrDA-equipped device,
such as a laptop PC.
The unit is designed with advanced measurement
capabilities, allowing it to achieve high performance
accuracy. The Shark® 200S meter is specified as a
0.2% class energy meter (Current class 10 only) for
billing applications. To verify the submeter’s performance and calibration, power providers use field test standards to verify that the unit’s energy measurements are correct. The Shark® 200S meter is a traceable
revenue meter and contains a utility grade test pulse to verify rated accuracy.
The Shark® 200S meter has up to 2 MegaBytes* for datalogging. It offers three
historical logs, a Limits (Alarm) log, and a System Events log.
*NOTE: Because the memory is flash-based rather than NVRAM (non-volatile
random-access memory), some sectors are reserved for overhead, erase procedures,
and spare sectors for long-term wear reduction.
Shark® 200S meter features detailed in this manual are:
• 0.2% Class Revenue Certifiable Energy and Demand Submeter (Current Class 10
only)
• Meets ANSI C12.20 (0.2%) and IEC 62053-22 (0.2%) Classes
Electro Industries/GaugeTech
Electro Industries/GaugeTech
The Leader In Power Monitoring and Smart Grid Solutions
The Leader In Power Monitoring and Smart Grid Solutions
Doc#
E149721
2-1
2: Meter Overview and Specifications
• Multifunction Measurement including Voltage, Current, Power, Frequency, Energy,
etc.
• Three line 0.56” bright red LED display
• 2 MegaBytes Memory for Datalogging
• Real Time Clock for Time-Stamping of Logs
• Percentage of Load Bar for Analog Meter Perception
• Modbus RTU (over Serial) and Modbus TCP (over Ethernet)
• Serial RS485 Communication
• Ethernet and Wireless Ethernet (WiFi)
• Easy to Use Faceplate Programming
• IrDA Port for Laptop PC Remote Read
• Direct Interface with Most Building Management Systems
The Shark® 200S submeter uses standard 5 or 1 Amp CTs (either split or donut). It
surface mounts to any wall and is easily programmed in minutes. The unit is
designed specifically for easy installation and advanced communication.
Electro Industries/GaugeTech
Electro Industries/GaugeTech
The Leader In Power Monitoring and Smart Grid Solutions
The Leader In Power Monitoring and Smart Grid Solutions
Doc#
E149721
2-2
2: Meter Overview and Specifications
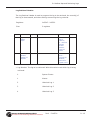
2.1.1: Model Number plus Option Numbers
Model
Frequency
Current
Class
Shark®
200S
Submeter
-50
50 Hz
System
-10
5 Amp
Secondary
-60
60 Hz
System
-2
1 Amp
Secondary
Power
Supply
V-SwitchTM
Pack
-V33
Multifunction
Meter with 2
MegaBytes Datalogging memory
-D2
(90-400)
VAC
(100370)VDC
Communication
Format
-485
RS485
-WIFI
Wireless and LAN
Based (Also
configurable for
RS485)
Example:
Shark 200S
- 60
- 10
- V33
- D2
- 485
which translates to a Shark® 200S submeter with a 60Hz system, Current class 10,
Default V-SwitchTM, D2 power supply, and RS485 communication.
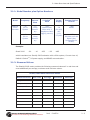
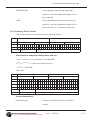
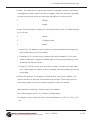
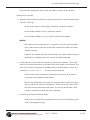
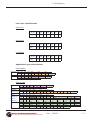
2.1.2: Measured Values
The Shark® 200S meter provides the following measured values all in real time and
some additionally as average, maximum and minimum values.
Shark® 200S Meter Measured Values
Measured Values
Real Time
Average
Maximum
Minimum
Voltage L-N
X
X
X
Voltage L-L
X
X
X
Current per Phase
X
X
X
X
Current Neutral
X
X
Watts
X
X
X
X
VAR
X
X
X
X
VA
X
X
X
X
PF
X
X
X
X
+Watt-hr
X
Electro Industries/GaugeTech
Electro Industries/GaugeTech
The Leader In Power Monitoring and Smart Grid Solutions
The Leader In Power Monitoring and Smart Grid Solutions
Doc#
E149721
2-3
2: Meter Overview and Specifications
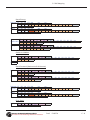
Shark® 200S Meter Measured Values
Measured Values
Real Time
-Watt-hr
X
Watt-hr Net
X
+VAR-hr
X
-VAR-hr
X
VAR-hr Net
X
VA-hr
X
Frequency
X
Voltage Angles
X
Current Angles
X
% of Load Bar
X
Electro Industries/GaugeTech
Electro Industries/GaugeTech
The Leader In Power Monitoring and Smart Grid Solutions
The Leader In Power Monitoring and Smart Grid Solutions
Average
Doc#
Maximum
Minimum
X
X
E149721
2-4
2: Meter Overview and Specifications
2.1.3: Utility Peak Demand
The Shark® 200S meter provides user-configured Block (Fixed) window or Rolling
window Demand. This feature allows you to set up a customized Demand profile.
Block window Demand is Demand used over a user-configured Demand period
(usually 5, 15 or 30 minutes). Rolling window Demand is a fixed window Demand that
moves for a user-specified subinterval period.
For example, a 15-minute Demand using 3 subintervals and providing a new Demand
reading every 5 minutes, based on the last 15 minutes.
Utility Demand features can be used to calculate kW, kVAR, kVA and PF readings. All
other parameters offer Max and Min capability over the user-selectable averaging
period. Voltage provides an Instantaneous Max and Min reading which displays the
highest surge and lowest sag seen by the meter
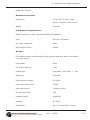
2.2: Specifications
Power Supply
Range:
Universal, (90 to 400)VAC
@50/60Hz or
(100 to 370)VDC
Power Consumption:
16 VA Maximum
Voltage Inputs (Measurement Category III)
Range:
Universal, Auto-ranging up to
576VAC L-N, 721VAC L-L
Supported hookups:
3 Element Wye, 2.5 Element Wye,
2 Element Delta, 4 Wire Delta
Input Impedance:
1M Ohm/Phase
Burden:
0.36VA/Phase Max at 600V,
0.0144VA/Phase at 120V
Pickup Voltage:
10VAC
Connection:
Screw terminal - #6 - 32 screws
See Figure 4.1
Electro Industries/GaugeTech
Electro Industries/GaugeTech
The Leader In Power Monitoring and Smart Grid Solutions
The Leader In Power Monitoring and Smart Grid Solutions
Doc#
E149721
2-5
2: Meter Overview and Specifications
Input Wire Gauge:
AWG#16 - 26
Fault Withstand:
Meets IEEE C37.90.1 (Surge
Withstand Capability)
Reading:
Programmable Full Scale to any PT
Ratio
Current Inputs
Class 10:
5A Nominal, 10 Amp Maximum
Class 2:
1A Nominal, 2 Amp Secondary
Burden:
0.005VA Per Phase Max at 11 Amps
Pickup Current:
0.1% of Nominal
Connections:
Screw terminal - #6-32 screws
(Diagram 4.1)
Current Surge Withstand:
100A/10 seconds at 23o C
Reading:
Programmable Full Scale to any CT
Ratio
Isolation
All Inputs and Outputs are galvanically isolated and tested to 2500VAC
Environmental Rating
Storage:
(-20 to +70)o C
Operating:
(-20 to +70)o C
Humidity:
to 95% RH Non-condensing
Faceplate Rating:
NEMA12 (Water Resistant)
Electro Industries/GaugeTech
Electro Industries/GaugeTech
The Leader In Power Monitoring and Smart Grid Solutions
The Leader In Power Monitoring and Smart Grid Solutions
Doc#
E149721
2-6
2: Meter Overview and Specifications
Measurement Methods
Voltage, Current:
True RMS
Power:
Sampling at 400+ Samples per
Cycle on All Channels Measured
Readings Simultaneously
A/D Conversion:
6 Simultaneous 24 bit Analog to
Digital Converters
Update Rate
Watts, VAR and VA:
Every 6 cycles, e.g., 100
milliseconds (Ten times per
second) @60Hz
All other parameters:
Every 60 cycles, e.g, 1 second
@60Hz
Communication Format
1. RS485
2. IrDA Port through Face Plate
Protocols:
Modbus RTU, Modbus ASCII, DNP
3.0, Modbus TCP (for Ethernetenabled)
Com Port Baud Rate:
9600 to 57600 b/s
Com Port Address:
001-247
Data Format:
8 Bit, No Parity
Wireless Ethernet (Optional)
802.11b Wireless or
WiFi or RJ45 Connection
10/100BaseT Ethernet
128 bit WEP Encryption
Electro Industries/GaugeTech
Electro Industries/GaugeTech
The Leader In Power Monitoring and Smart Grid Solutions
The Leader In Power Monitoring and Smart Grid Solutions
128 bit Wireless Security
Doc#
E149721
2-7
2: Meter Overview and Specifications
Modbus TCP Protocol
Mechanical Parameters
Dimensions:
(H7.9 x W7.6 x D3.2) inches,
(H200.7 x W193.0 x D81.3) mm
Weight:
4 pounds
KYZ/RS485 Port Specifications
RS485 Transceiver; meets or exceeds EIA/TIA-485 Standard:
Type:
Two-wire, half duplex
Min. Input Impedance:
96kƻ
Max. Output Current:
±60mA
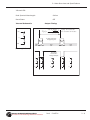
Wh Pulse
KYZ output contacts (and infrared LED light pulses through face plate): (See Section
7.4 for Kh values.)
Pulse Width:
90ms
Full Scale Frequency:
~3Hz
Contact type:
Solid State – SPDT (NO – C – NC)
Relay type:
Solid state
Peak switching voltage:
DC ±350V
Continuous load current:
120mA
Peak load current:
350mA for 10ms
On resistance, max.:
35ƻ
Leakage current:
1μA@350V
Isolation:
AC 3750V
Reset State:
(NC - C) Closed; (NO - C) Open
Electro Industries/GaugeTech
Electro Industries/GaugeTech
The Leader In Power Monitoring and Smart Grid Solutions
The Leader In Power Monitoring and Smart Grid Solutions
Doc#
E149721
2-8
2: Meter Overview and Specifications
Infrared LED:
Peak Spectral Wavelength:
940nm
Reset State:
Off
Internal Schematic:
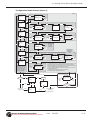
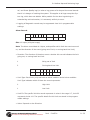
Output Timing:
T [s]
NC
C
ª Watthour
3600 Kh «
¬ pulse
P [ Watt ]
º
»
¼
IR LED Light Pulses
Through face plate
90ms
NO
P[Watt] - Not a scaled value
Kh See Section 7-4 for values
LED
OFF
LED
ON
90ms
LED
OFF
(De-energized
state)
Internal Schematic:
LED
OFF
LED
ON
Output Timing:
KYZ output
Contact States
Through Backplate
NC
NC
NC
NC
NC
C
C
C
C
C
NO
NO
NO
NO
NO
Electro Industries/GaugeTech
Electro Industries/GaugeTech
The Leader In Power Monitoring and Smart Grid Solutions
The Leader In Power Monitoring and Smart Grid Solutions
Doc#
E149721
2-9
2: Meter Overview and Specifications
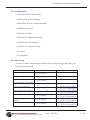
2.3: Compliance
• IEC 62053-22 (0.2% Accuracy)
• ANSI C12.20 (0.2% Accuracy)
• ANSI (IEEE) C37.90.1 Surge Withstand
• ANSI C62.41 (Burst)
• IEC1000-4-2: ESD
• IEC1000-4-3: Radiated Immunity
• IEC1000-4-4: Fast Transient
• IEC1000-4-5: Surge Immunity
• UL Listed
• CE Compliant
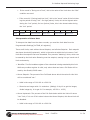
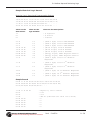
2.4: Accuracy
For 23oC, 3 Phase balanced Wye or Delta load, at 50 or 60 Hz (as per order), 5A
(Class 10) nominal unit:
Parameter
Accuracy
Accuracy Input Range
Voltage L-N [V]
0.1% of reading2
(69 to 480)V
Voltage L-L [V]
0.1% of reading
(120 to 600)V
Current Phase [A]
0.1% of reading1
(0.15 to 5)A
Current Neutral (calculated) 2.0% of Full Scale1
[A]
Active Power Total [W]
0.2% of reading1,2
Active Energy Total [Wh]
0.2% of reading1,2
Reactive Power Total [VAR] 0.2% of reading1,2
Reactive Energy Total
[VARh]
Apparent Power Total [VA]
0.2% of reading1,2
0.2% of reading1,2
Electro Industries/GaugeTech
Electro Industries/GaugeTech
The Leader In Power Monitoring and Smart Grid Solutions
The Leader In Power Monitoring and Smart Grid Solutions
Doc#
(0.15 to 5)A @ (45 to 65)Hz
(0.15 to 5)A @ (69 to 480)V
@ +/- (0.5 to 1) lag/lead PF
(0.15 to 5)A @ (69 to 480)V
@ +/- (0.5 to 1) lag/lead PF
(0.15 to 5)A @ (69 to 480)V
@ +/- (0 to 0.8) lag/lead PF
(0.15 to 5)A @ (69 to 480)V
@ +/- (0 to 0.8) lag/lead PF
(0.15 to 5)A @ (69 to 480)V
@ +/- (0.5 to 1) lag/lead PF
E149721
2 - 10
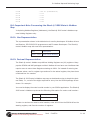
2: Meter Overview and Specifications
Apparent Energy Total [VAh]0.2% of reading1,2
Power Factor
0.2% of reading1,2
Frequency
+/- 0.01Hz
(0.15 to 5)A @ (69 to 480)V
@ +/- (0.5 to 1) lag/lead PF
(0.15 to 5)A @ (69 to 480)V
@ +/- (0.5 to 1) lag/lead PF
(45 to 65)Hz
Load Bar
+/- 1 segment
(0.005 to 6)A
1
For 2.5 element programmed units, degrade accuracy by an additional 0.5% of
reading.
• For 1A (Class 2) Nominal, degrade accuracy by an additional 0.5% of reading.
• For 1A (Class 2) Nominal, the input current range for Accuracy specification is
20% of the values listed in the table.
2
For unbalanced voltage inputs where at least one crosses the 150V auto-scale
threshold (for example, 120V/120V/208V system), degrade accuracy by additional
0.4%.
Electro Industries/GaugeTech
Electro Industries/GaugeTech
The Leader In Power Monitoring and Smart Grid Solutions
The Leader In Power Monitoring and Smart Grid Solutions
Doc#
E149721
2 - 11
2: Meter Overview and Specifications
This page intentionally left blank.
Electro Industries/GaugeTech
Electro Industries/GaugeTech
The Leader In Power Monitoring and Smart Grid Solutions
The Leader In Power Monitoring and Smart Grid Solutions
Doc#
E149721
2 - 12
3: Mechanical Installation
3: Mechanical Installation
3.1: Overview
The Shark® 200S meter can be installed on any wall. See Chapter 4 for wiring
diagrams.
Mount the meter in a dry location, which is free from dirt and corrosive substances.
Recommended Tools for Shark® 200S Installation
• #2 Phillips screwdriver
• Wire cutters
WARNING! During normal operation of the Shark® 200S meter, dangerous voltages flow through many parts of the meter, including: Terminals
and any connected CTs (Current Transformers) and PTs (Potential Transformers), all I/O Modules (Inputs and Outputs) and their circuits. All
Primary and Secondary circuits can, at times, produce lethal voltages and
currents. Avoid contact with any current-carrying surfaces. Before performing ANY
work on the meter, make sure the meter is powered down and all connected
circuits are de-energized.
3.2: Install the Base
1. Determine where you want to install the submeter.
Electro Industries/GaugeTech
Electro Industries/GaugeTech
The Leader In Power Monitoring and Smart Grid Solutions
The Leader In Power Monitoring and Smart Grid Solutions
Doc#
E149721
3-1
3: Mechanical Installation
2. With the submeter power off, open the top of the submeter. Use the front
cover support to keep the cover open as you perform the installation (see Figure
3.1).
Front cover
support
Opened
Screw
Figure 3.1: Shark Submeter with Cover Open
CAUTIONS!
• Remove the antenna before opening the unit.
• Only use the front cover support if you are able to open the front cover to the
extent that you can fit the front cover support into its base. DO NOT rest the front
cover support on the inside of the meter, even for a short time - by doing so, you
may damage components on the board assembly.
3. Find the 4 Installation Slots and insert screws through each slot into the wall or
panel.
4. Fasten securely - DO NOT overtighten.
Electro Industries/GaugeTech
Electro Industries/GaugeTech
The Leader In Power Monitoring and Smart Grid Solutions
The Leader In Power Monitoring and Smart Grid Solutions
Doc#
E149721
3-2
3: Mechanical Installation
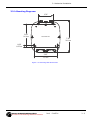
3.2.1:Mounting Diagrams
v
CM
v
CM
-/5.4).'0,!4%
v
CM
v
CM
v
CM
Figure 3.2: Mounting Plate Dimensions
Electro Industries/GaugeTech
Electro Industries/GaugeTech
The Leader In Power Monitoring and Smart Grid Solutions
The Leader In Power Monitoring and Smart Grid Solutions
Doc#
E149721
3-3
3: Mechanical Installation
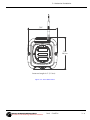
v
CM
v
CM
!NTENNA,ENGTHvCM
Figure 3.3: Front Dimensions
Electro Industries/GaugeTech
Electro Industries/GaugeTech
The Leader In Power Monitoring and Smart Grid Solutions
The Leader In Power Monitoring and Smart Grid Solutions
Doc#
E149721
3-4
3: Mechanical Installation
v
CM
Figure 3.4: Side Dimensions
Electro Industries/GaugeTech
Electro Industries/GaugeTech
The Leader In Power Monitoring and Smart Grid Solutions
The Leader In Power Monitoring and Smart Grid Solutions
Doc#
E149721
3-5
3: Mechanical Installation
12”/30.4cm
Figure 3.5: Open Cover Dimensions
w
DN
$57PMUBHF$POUSPM1PXFS(SPVOE
5ISPVHI)FSF $PNNVOJDBUJPOT,:;5ISPVHI)FSF
Figure 3.6: Bottom View with Access Holes
Electro Industries/GaugeTech
Electro Industries/GaugeTech
The Leader In Power Monitoring and Smart Grid Solutions
The Leader In Power Monitoring and Smart Grid Solutions
Doc#
E149721
3-6
3: Mechanical Installation
3.3: Secure the Cover
1. Close the cover, making sure that power and communications wires exit the
submeter through the openings at the base (see Figure 3.6).
CAUTION! To avoid damaging components on the board assembly, make sure the
front cover support is in the upright position before closing the front cover.
2. Using the 3 enclosed screws, secure the cover to the base in three places - DO
NOT overtighten (you may damage the cover).
3. The unit can be sealed after the front cover is closed. To seal the unit, thread the
seal tag through the housing located between the bottom access holes (see figures
3.6 and 3.7).
4. Reattach the antenna, if applicable.
Closed
Screw
Lockable Revenue Seal
Figure 3.7: Submeter with Closed Cover
Electro Industries/GaugeTech
Electro Industries/GaugeTech
The Leader In Power Monitoring and Smart Grid Solutions
The Leader In Power Monitoring and Smart Grid Solutions
Doc#
E149721
3-7
3: Mechanical Installation
This page intentionally left blank.
Electro Industries/GaugeTech
Electro Industries/GaugeTech
The Leader In Power Monitoring and Smart Grid Solutions
The Leader In Power Monitoring and Smart Grid Solutions
Doc#
E149721
3-8
4: Electrical Installation
4: Electrical Installation
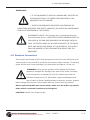
4.1: Considerations When Installing Meters
Installation of the Shark® 200S meter must be performed only by
qualified personnel who follow standard safety precautions during all
procedures. Those personnel should have appropriate training and
experience with high voltage devices. Appropriate safety gloves,
safety glasses and protective clothing is recommended.
WARNING! During normal operation of the Shark® 200S meter, dangerous voltages
flow through many parts of the meter, including: Terminals and any connected CTs
(Current Transformers) and PTs (Potential Transformers), all I/O Modules (Inputs and
Outputs) and their circuits. All Primary and Secondary circuits can, at times, produce
lethal voltages and currents. Avoid contact with any current-carrying surfaces.
Before performing ANY work on the meter, make sure the meter is powered
down and all connected circuits are de-energized.
Do not use the meter or any I/O Output Device for primary protection or in
an energy-limiting capacity. The meter can only be used as secondary protection.
Do not use the meter for applications where failure of the meter may cause harm or
death.
Do not use the meter for any application where there may be a risk of fire.
All meter terminals should be inaccessible after installation.
Do not apply more than the maximum voltage the meter or any attached device can
withstand. Refer to meter and/or device labels and to the Specifications for all devices
before applying voltages.
Do not HIPOT/Dielectric test any Outputs, Inputs or Communications terminals.
EIG recommends the use of Shorting Blocks and Fuses for voltage leads and power
supply to prevent hazardous voltage conditions or damage to CTs, if the meter needs
to be removed from service. CT grounding is optional.
Electro Industries/GaugeTech
Electro Industries/GaugeTech
The Leader In Power Monitoring and Smart Grid Solutions
The Leader In Power Monitoring and Smart Grid Solutions
Doc#
E149721
4-1
4: Electrical Installation
IMPORTANT!
• IF THE EQUIPMENT IS USED IN A MANNER NOT SPECIFIED BY
THE MANUFACTURER, THE PROTECTION PROVIDED BY THE
EQUIPMENT MAY BE IMPAIRED.
• THERE IS NO REQUIRED PREVENTIVE MAINTENANCE OR
INSPECTION NECESSARY FOR SAFETY. HOWEVER, ANY REPAIR OR MAINTENANCE
SHOULD BE PERFORMED BY THE FACTORY.
DISCONNECT DEVICE: The following part is considered the equipment disconnect device. A SWITCH OR CIRCUIT-BREAKER SHALL BE
INCLUDED IN THE END-USE EQUIPMENT OR BUILDING INSTALLATION. THE SWITCH SHALL BE IN CLOSE PROXIMITY TO THE EQUIPMENT AND WITHIN EASY REACH OF THE OPERATOR. THE SWITCH
SHALL BE MARKED AS THE DISCONNECTING DEVICE FOR THE
EQUIPMENT.
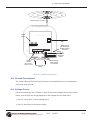
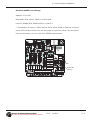
4.2: Electrical Connections
All wiring for the Shark® 200S is done through the front of the unit (lifting the cover
with the power to the unit OFF) so that the unit can be surface mounted. Connecting
cables exit the unit via two openings in the base plate (see figures 3.5 and 4.1).
WARNING! During normal operation of the Shark® 200S meter,
dangerous voltages flow through many parts of the meter, including:
Terminals and any connected CTs (Current Transformers) and PTs
(Potential Transformers), all I/O Modules (Inputs and Outputs) and
their circuits. All Primary and Secondary circuits can, at times, produce
lethal voltages and currents. Avoid contact with any current-carrying surfaces.
Before performing ANY work on the meter, make sure the meter is powered
down and all connected circuits are de-energized.
CAUTION! DO NOT over-torque screws.
Electro Industries/GaugeTech
Electro Industries/GaugeTech
The Leader In Power Monitoring and Smart Grid Solutions
The Leader In Power Monitoring and Smart Grid Solutions
Doc#
E149721
4-2
4: Electrical Installation
Wireless Ethernet Connection
Current
Inputs
Electronic Circuits
Ethernet, RJ45
Jack
RS485 Output
(Do not put the
Voltage on these
terminals!)
Ia Ia Ib Ib Ic Ic
(+) (-) (+) (-) (+) (-)
Va Vb Vc Vn L1 L2 PE
Z K Y + - SH
RS-485
KYZ Pulse
Output
Voltage
Inputs
Power Supply
Inputs (Inputs
are unipolar)
(Do not overtorque screws)
Access Holes for
Wiring
Figure 4.1: Submeter Connections
4.3: Ground Connections
The meter's Ground Terminal (PE) should be connected directly to the installation's
protective earth ground.
4.4: Voltage Fuses
EIG recommends the use of fuses on each of the sense voltages and on the control
power, even though the wiring diagrams in this chapter do not show them.
• Use a 0.1 Amp fuse on each Voltage input.
• Use a 3 Amp fuse on the power supply.
Electro Industries/GaugeTech
Electro Industries/GaugeTech
The Leader In Power Monitoring and Smart Grid Solutions
The Leader In Power Monitoring and Smart Grid Solutions
Doc#
E149721
4-3
4: Electrical Installation
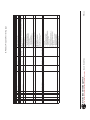
4.5: Electrical Connection Diagrams
Choose the diagram that best suits your application. Make sure the CT polarity is
correct.
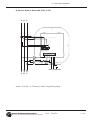
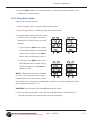
1. Three Phase, Four-Wire System Wye with Direct Voltage, 3 Element
a. Dual Phase Hookup
b. Single Phase Hookup
3. Three Phase, Four-Wire System Wye with Direct Voltage, 2.5 Element
4. Three-Phase, Four-Wire Wye with PTs, 3 Element
5. Three-Phase, Four-Wire Wye with PTs, 2.5 Element
6. Three-Phase, Three-Wire Delta with Direct Voltage (No PTs, 2 CTs)
7. Three-Phase, Three-Wire Delta with Direct Voltage (No PTs, 3 CTs)
8. Three-Phase, Three-Wire Delta with 2 PTs, 2 CTs
9. Three-Phase, Three-Wire Delta with 2 PTs, 3 CTs
10. Current Only Measurement (Three Phase)
11. Current Only Measurement (Dual Phase)
12. Current Only Measurement (Single Phase)
Electro Industries/GaugeTech
Electro Industries/GaugeTech
The Leader In Power Monitoring and Smart Grid Solutions
The Leader In Power Monitoring and Smart Grid Solutions
Doc#
E149721
4-4
4: Electrical Installation
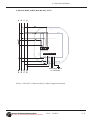
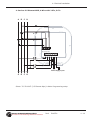
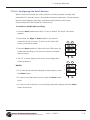
1. Service: WYE, 4-Wire with No PTs, 3 CTs
A
B
C
N
Ic
Ib
Electronic Circuits
Ia
Ia Ia Ib Ib Ic Ic
(+) (-) (+) (-) (+) (-)
Va Vb Vc Vref L1 L2 PE
Power Supply Inputs
L2 is for Neutral
A
B
C
N
Select: "3 EL WYE" (3 Element Wye) in Meter Programming setup.
Electro Industries/GaugeTech
Electro Industries/GaugeTech
The Leader In Power Monitoring and Smart Grid Solutions
The Leader In Power Monitoring and Smart Grid Solutions
Doc#
E149721
4-5
4: Electrical Installation
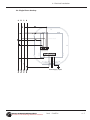
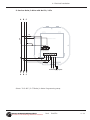
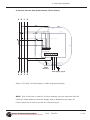
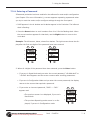
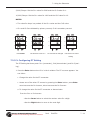
1a. Dual Phase Hookup
A
B
C
N
Ic
Ib
Electronic Circuits
Ia
Ia Ia Ib Ib Ic Ic
(+) (-) (+) (-) (+) (-)
Va Vb Vc Vref L1 L2 PE
Power Supply Inputs
A
B
C
N
Electro Industries/GaugeTech
Electro Industries/GaugeTech
The Leader In Power Monitoring and Smart Grid Solutions
The Leader In Power Monitoring and Smart Grid Solutions
Doc#
E149721
4-6
4: Electrical Installation
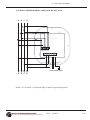
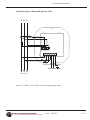
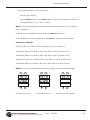
1b. Single Phase Hookup
A
B
C
N
Ic
Ib
Electronic Circuits
Ia
Ia Ia Ib Ib Ic Ic
(+) (-) (+) (-) (+) (-)
Va Vb Vc Vref L1 L2 PE
Power Supply Inputs
A
B
C
N
Electro Industries/GaugeTech
Electro Industries/GaugeTech
The Leader In Power Monitoring and Smart Grid Solutions
The Leader In Power Monitoring and Smart Grid Solutions
Doc#
E149721
4-7
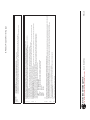
4: Electrical Installation
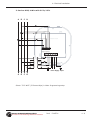
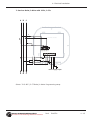
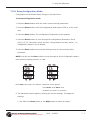
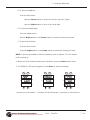
2. Service: 2.5 Element WYE, 4-Wire with No PTs, 3 CTs
A
B
C
N
Ic
Ib
Electronic Circuits
Ia
Ia Ia Ib Ib Ic Ic
(+) (-) (+) (-) (+) (-)
Va Vb Vc Vref L1 L2 PE
Power Supply Inputs
A
B
C
N
Select: "2.5 EL WYE" (2.5 Element Wye) in Meter Programming setup.
Electro Industries/GaugeTech
Electro Industries/GaugeTech
The Leader In Power Monitoring and Smart Grid Solutions
The Leader In Power Monitoring and Smart Grid Solutions
Doc#
E149721
4-8
4: Electrical Installation
3. Service: WYE, 4-Wire with 3 PTs, 3 CTs
A
B
C
N
Ic
Ib
Electronic Circuits
Ia
Ia Ia Ib Ib Ic Ic
(+) (-) (+) (-) (+) (-)
Va Vb Vc Vn L1 L2 PE
Power Supply Inputs
A
B
C
N
Select: "3 EL WYE" (3 Element Wye) in Meter Programming setup.
Electro Industries/GaugeTech
Electro Industries/GaugeTech
The Leader In Power Monitoring and Smart Grid Solutions
The Leader In Power Monitoring and Smart Grid Solutions
Doc#
E149721
4-9
4: Electrical Installation
4. Service: 2.5 Element WYE, 4-Wire with 2 PTs, 3 CTs
A
B
C
N
Ic
Ib
Ia
Ia Ia Ib Ib Ic Ic
(+) (-) (+) (-) (+) (-)
Va Vb Vc Vref L1 L2 PE
Power Supply Inputs
A
B
C
N
Select: "2.5 EL WYE" (2.5 Element Wye) in Meter Programming setup.
Electro Industries/GaugeTech
Electro Industries/GaugeTech
The Leader In Power Monitoring and Smart Grid Solutions
The Leader In Power Monitoring and Smart Grid Solutions
Doc#
E149721
4 - 10
4: Electrical Installation
5. Service: Delta, 3-Wire with No PTs, 2 CTs
A
B
C
Ia
Electronic Circuits
Ic
Ia Ia Ib Ib Ic Ic
(+) (-) (+) (-) (+) (-)
Va Vb Vc Vref L1 L2 PE
Power Supply Inputs
A
B
C
Select: "2 Ct dEL" (2 CT Delta) in Meter Programming setup.
Electro Industries/GaugeTech
Electro Industries/GaugeTech
The Leader In Power Monitoring and Smart Grid Solutions
The Leader In Power Monitoring and Smart Grid Solutions
Doc#
E149721
4 - 11
4: Electrical Installation
6. Service: Delta, 3-Wire with No PTs, 3 CTs
A
B
C
Ia
Ib
Electronic Circuits
Ic
Ia Ia Ib Ib Ic Ic
(+) (-) (+) (-) (+) (-)
Va Vb Vc Vref L1 L2 PE
Power Supply Inputs
A
B
C
Select: "2 Ct dEL" (2 CT Delta) in Meter Programming setup.
Electro Industries/GaugeTech
Electro Industries/GaugeTech
The Leader In Power Monitoring and Smart Grid Solutions
The Leader In Power Monitoring and Smart Grid Solutions
Doc#
E149721
4 - 12
4: Electrical Installation
7. Service: Delta, 3-Wire with 2 PTs, 2 CTs
A
B
C
Ia
Electronic Circuits
Ic
Ia Ia Ib Ib Ic Ic
(+) (-) (+) (-) (+) (-)
Va Vb Vc Vref L1 L2 PE
Power Supply Inputs
A
B
C
Select: "2 Ct dEL" (2 CT Delta) in Meter Programming setup.
Electro Industries/GaugeTech
Electro Industries/GaugeTech
The Leader In Power Monitoring and Smart Grid Solutions
The Leader In Power Monitoring and Smart Grid Solutions
Doc#
E149721
4 - 13
4: Electrical Installation
8. Service: Delta, 3-Wire with 2 PTs, 3 CTs
A
B
C
Ia
Electronic Circuits
Ib
Ic
Ia Ia Ib Ib Ic Ic
(+) (-) (+) (-) (+) (-)
Va Vb Vc Vref L1 L2 PE
Power Supply Inputs
A
B
C
Select: "2 Ct dEL" (2 CT Delta) in Meter Programming setup.
Electro Industries/GaugeTech
Electro Industries/GaugeTech
The Leader In Power Monitoring and Smart Grid Solutions
The Leader In Power Monitoring and Smart Grid Solutions
Doc#
E149721
4 - 14
4: Electrical Installation
9. Service: Current Only Measurement (Three Phase)
A
B
C
N
Ic
Ib
Electronic Circuits
Ia
Ia Ia Ib Ib Ic Ic
(+) (-) (+) (-) (+) (-)
Va Vb Vc Vref L1 L2 PE
20VAC
Minimum*
Power Supply Inputs
A
B
C
N
Select: "3 EL WYE" (3 Element Wye) in Meter Programming setup.
NOTE: Even if the meter is used for only Amp readings, the unit requires a Volts AN
reference. Please make sure that the Voltage input is attached to the meter. AC
Control Power can be used to provide the reference signal.
Electro Industries/GaugeTech
Electro Industries/GaugeTech
The Leader In Power Monitoring and Smart Grid Solutions
The Leader In Power Monitoring and Smart Grid Solutions
Doc#
E149721
4 - 15
4: Electrical Installation
10. Service: Current Only Measurement (Dual Phase)
A
B
N
Ib
Electronic Circuits
Ia
Ia Ia Ib Ib Ic Ic
(+) (-) (+) (-) (+) (-)
Va Vb Vc Vref L1 L2 PE
20VAC
Minimum*
Power Supply Inputs
A
B
N
Select: "3 EL WYE" (3 Element Wye) in Meter Programming setup.
NOTE: Even if the meter is used for only Amp readings, the unit requires a Volts AN
reference. Please make sure that the Voltage input is attached to the meter. AC
Control Power can be used to provide the reference signal.
Electro Industries/GaugeTech
Electro Industries/GaugeTech
The Leader In Power Monitoring and Smart Grid Solutions
The Leader In Power Monitoring and Smart Grid Solutions
Doc#
E149721
4 - 16
4: Electrical Installation
11. Service: Current Only Measurement (Single Phase)
A
N
Electronic Circuits
Ia
Ia Ia Ib Ib Ic Ic
(+) (-) (+) (-) (+) (-)
Va Vb Vc Vref L1 L2 PE
20VAC
Minimum*
A
Power Supply Inputs
N
Select: "3 EL WYE" (3 Element Wye) in Meter Programming setup.
NOTE: Even if the meter is used for only Amp readings, the unit requires a Volts AN
reference. Please make sure that the Voltage input is attached to the meter. AC
Control Power can be used to provide the reference signal.
Electro Industries/GaugeTech
Electro Industries/GaugeTech
The Leader In Power Monitoring and Smart Grid Solutions
The Leader In Power Monitoring and Smart Grid Solutions
Doc#
E149721
4 - 17
4: Electrical Installation
This page intentionally left blank.
Electro Industries/GaugeTech
Electro Industries/GaugeTech
The Leader In Power Monitoring and Smart Grid Solutions
The Leader In Power Monitoring and Smart Grid Solutions
Doc#
E149721
4 - 18
5: Communication Installation
5: Communication Installation
5.1: Shark® 200S Communication
The Shark® 200S submeter provides two independent communication ports plus a
KYZ pulse output. The first port, Com 1, is an IrDA Port, which uses Modbus ASCII.
The second port, Com 2, provides RS485 or RJ45 Ethernet or WiFi Ethernet
communication (see Chapter 6 for Ethernet communication).
5.1.1: IrDA Port (Com 1)
The Com 1 IrDA port is located on the face of the submeter. The IrDA Port allows the
unit to be set up and programmed with any device capable of IrDA communication,
such as an IrDA-equipped laptop PC or a USB/IrDA wand (such as the USB to IrDA
Adapter [CAB6490] described in Appendix D).
IrDA port settings are
Address: 1
Baud Rate: 57600 Baud
Protocol: Modbus ASCII
Figure 5.1: IrDA Communication
Electro Industries/GaugeTech
Electro Industries/GaugeTech
The Leader In Power Monitoring and Smart Grid Solutions
The Leader In Power Monitoring and Smart Grid Solutions
Doc#
E149721
5-1
5: Communication Installation
5.1.1.1: USB to IrDA Adapter
PC
USB
Extension
Cable
USB
Port
IrDA
Enabled
Device
USB to IrDA Adapter
IrDA
Module
Figure 5.2: USB to IrDA Adapter
The USB to IrDA Adapter (CAB6490) enables IrDA wireless data communication
through a standard USB port. The adapter is powered through the USB bus and
does not require any external power adapter. The effective data transmission
distance is 0 to .3 meters (approximately 1 foot).
The USB to IrDA Adapter enables wireless data transfer between a PC and the
submeter. The adapter can also be used with other IrDA-compatible devices. The
adapter is fully compatible with IrDA 1.1 and USB 1.1 specifications.
System Requirements
• IBM PC Pentium based computer
• 2 Gigabytes of RAM preferable
• Available USB port
• CD-ROM drive
• Windows 98, Windows XP, or Windows 7
See Appendix D for instructions on using the USB to IrDA Adapter. You can order
CAB6490 from EIG’s webstore: www.electroind.com/store. Select Cables and Accessories from the list on the left side of the screen.
Electro Industries/GaugeTech
Electro Industries/GaugeTech
The Leader In Power Monitoring and Smart Grid Solutions
The Leader In Power Monitoring and Smart Grid Solutions
Doc#
E149721
5-2
5: Communication Installation
5.1.2: RS485 Communication Com 2 (485 Option)
The Shark® 200S submeter's RS485 port RS485 port uses standard 2-Wire, half
duplex architecture. The RS485 connector is located on the front of the meter, under
the cover. A connection can easily be made to a Master device or to other slave
devices, as shown below.
WARNING! During normal operation of the Shark® 200S meter,
dangerous voltages flow through many parts of the meter, including:
Terminals and any connected CTs (Current Transformers) and PTs (Potential
Transformers), all I/O Modules (Inputs and Outputs) and their circuits. All
Primary and Secondary circuits can, at times, produce lethal voltages and currents.
Avoid contact with any current-carrying surfaces. Before performing ANY work on
the meter, make sure the meter is powered down and all connected circuits
are de-energized.
NOTE: Care should be taken to connect + to + and - to - connections.
Wireless Ethernet Connection
Electronic Circuits
JP2: Must be in
position 1-2 for
RS485
Ia Ia Ib Ib Ic Ic
(+) (-) (+) (-) (+) (-)
Va Vb Vc Vn L1 L2 PE
RS485
Z K Y + - SH
To Other
Devices
Pulse Contacts
The Shark® 100S submeter's RS485 connection can be programmed with the
buttons on the face of the meter or by using Communicator EXT software.
Electro Industries/GaugeTech
Electro Industries/GaugeTech
The Leader In Power Monitoring and Smart Grid Solutions
The Leader In Power Monitoring and Smart Grid Solutions
Doc#
E149721
5-3
5: Communication Installation
Standard RS485 Port Settings
Address: 001 to 247
Baud Rate: 9600, 19200, 38400 or 57600 Baud
Protocol: Modbus RTU, Modbus ASCII, or DNP 3.0
** The position of Jumper 2 (JP2) must be set for either RS485 or Ethernet communication. See the figure below. You put the jumper on positions 2 and 3 for LAN (Ethernet) communication, and on 1 and 2 for RS485 communication.
Electro Industries
/GaugeTech
14
7
7
7
8
8
8
13
WD
*0
13
23,!.
3ETTINGS
Electro Industries/GaugeTech
Electro Industries/GaugeTech
The Leader In Power Monitoring and Smart Grid Solutions
The Leader In Power Monitoring and Smart Grid Solutions
Doc#
E149721
5-4
5: Communication Installation
5.1.3: KYZ Output
The KYZ pulse output provides pulsing energy values that verify the submeter's
readings and accuracy. The KYZ Pulse Output is located on the face of the meter,
under the cover and just below the RS485 connection.
WARNING! During normal operation of the Shark® 200S meter,
dangerous voltages flow through many parts of the meter, including:
Terminals and any connected CTs (Current Transformers) and PTs (Potential
Transformers), all I/O Modules (Inputs and Outputs) and their circuits. All
Primary and Secondary circuits can, at times, produce lethal voltages and currents.
Avoid contact with any current-carrying surfaces. Before performing ANY work on
the meter, make sure the meter is powered down and all connected circuits
are de-energized.
See Section 2.2 for the KYZ output specifications; see Section 7.4 for pulse constants.
Wireless Ethernet Connection
Electronic Circuits
Ia Ia Ib Ib Ic Ic
(+) (-) (+) (-) (+) (-)
Va Vb Vc Vn L1 L2 PE
RS-485
Z K Y + - SH
To Other
Devices
Pulse Contacts
Electro Industries/GaugeTech
Electro Industries/GaugeTech
The Leader In Power Monitoring and Smart Grid Solutions
The Leader In Power Monitoring and Smart Grid Solutions
Doc#
E149721
5-5
5: Communication Installation
5.1.4: Ethernet Connection
In order to use the Shark® 200S submeter’s Ethernet capability, the Ethernet
Module must be installed in your meter, and the JP2 must be set to positions 2-3. You
can use either wired Ethernet, or WiFi.
• For wired Ethernet, use Standard RJ45 10/100BaseT cable to connect to the
Shark® 200S submeter. The RJ45 line is inserted into the RJ45 port of the meter.
• For WiFi connections, make sure you have the correct antenna attached to the
meter.
WARNING! During normal operation of the Shark® 200S meter,
dangerous voltages flow through many parts of the meter, including:
Terminals and any connected CTs (Current Transformers) and PTs (Potential
Transformers), all I/O Modules (Inputs and Outputs) and their circuits. All
Primary and Secondary circuits can, at times, produce lethal voltages and currents.
Avoid contact with any current-carrying surfaces. Before performing ANY work on
the meter, make sure the meter is powered down and all connected circuits
are de-energized.
•
Electro Industries/GaugeTech
Electro Industries/GaugeTech
The Leader In Power Monitoring and Smart Grid Solutions
The Leader In Power Monitoring and Smart Grid Solutions
Doc#
E149721
5-6
5: Communication Installation
Wireless Ethernet Connection
Ethernet Module
Electronic Circuits
JP2: Must be in
position 2-3 for
Ethernet (RJ45 or WiFi) **
Ia Ia Ib Ib Ic Ic
(+) (-) (+) (-) (+) (-)
Va Vb Vc Vn L1 L2 PE
RS-485
Z K Y + - SH
To Other
Devices
Refer to Chapter 6 for instructions on how to set up the Network Module.
** See the JP2 figure and instructions on page 5-4.
5.2: Meter Communication and Programming Overview
Programming and communication can utilize the RS485 connection shown in Section
5.1.2 or the RJ45/WiFi connection shown in Section 5.1.4. Once a connection is
established, Communicator EXT software can be used to program the meter and
communicate to other devices.
Meter Connection
To provide power to the meter, use one of the wiring diagrams in Chapter 4 or attach
an Aux cable to GND, L(+) and N(-).
The RS485 cable attaches to SH, - and + as shown in Section 5.1.2.
Electro Industries/GaugeTech
Electro Industries/GaugeTech
The Leader In Power Monitoring and Smart Grid Solutions
The Leader In Power Monitoring and Smart Grid Solutions
Doc#
E149721
5-7
5: Communication Installation
5.2.1: How to Connect to the Submeter
1. Open Communicator EXT software.
2. Click the Connect icon on the Icon bar.
The Connect screen opens, showing the Initial settings. Make sure your settings are
the same as those shown on the next page, except for the IP Address field, which
must be your device’s IP address.The address shown here is the default Ethernet
option address.
NOTE: The settings you make will depend on whether you are connecting to the
meter via Serial Port or Network. Use the pull-down menus to make any necessary
changes.
Serial Port Connection
Network Connection
3. Click the Connect button on the screen.
NOTE: You may have to disconnect power, reconnect power and then click
Connect.
The Device Status screen appears, confirming a connection.
4. Click OK.
Electro Industries/GaugeTech
Electro Industries/GaugeTech
The Leader In Power Monitoring and Smart Grid Solutions
The Leader In Power Monitoring and Smart Grid Solutions
Doc#
E149721
5-8
5: Communication Installation
5. The Communicator EXT Main screen appears. Click the Profile icon in the Title Bar.
6. You will see the Shark® 200S meter’s Device Profile screen. Use the Tree menu on
the left of the screen to navigate between settings screens (see below).
7. Click the Communications tab. You will see the screen shown below. Use this
screen to enter communication settings for the meter's two on-board ports: the
IrDA port (COM 1) and RS485 port (COM 2) Make any necessary changes to
settings.
Electro Industries/GaugeTech
Electro Industries/GaugeTech
The Leader In Power Monitoring and Smart Grid Solutions
The Leader In Power Monitoring and Smart Grid Solutions
Doc#
E149721
5-9
5: Communication Installation
Valid Communication Settings are as follows:
COM1
(IrDA)
Response Delay
(0-750 msec)
COM2
(RS485)
Address
(1-247)
Protocol
(Modbus RTU, Modbus ASCII or DNP)
Baud Rate
(9600 to 57600)
Response Delay
(0-750 msec)
DNP Options for Voltage, Current, and Power - these fields allow you to choose
Primary or Secondary Units for DNP, and to set custom scaling if you choose
Primary. See Chapter 5 in the Communicator EXT User Manual for more
information.
8. When changes are complete, click the Update Device button to send a new profile
to the meter.
9. Click Exit to leave the Device Profile or click other menu items to change other
aspects of the Device Profile (see the following section for instructions).
Electro Industries/GaugeTech
Electro Industries/GaugeTech
The Leader In Power Monitoring and Smart Grid Solutions
The Leader In Power Monitoring and Smart Grid Solutions
Doc#
E149721
5 - 10
5: Communication Installation
5.2.2: Shark® 200S Meter Device Profile Settings
NOTE: Only the basic Shark® 200S meter Device Profile settings are explained in this
manual. Refer to Chapter 5 in the Communicator EXT User Manual for detailed
instructions on configuring all settings of the meter’s Device Profile. You can view the
manual online by clicking Help>Contents from the Communicator EXT Main screen.
CT, PT Ratios and System Hookup
The screen fields and acceptable entries are as follows:
CT Ratios
CT Numerator (Primary): 1 - 9999
CT Denominator (Secondary): 5 or 1 Amp
NOTE: This field is display only.
CT Multiplier: 1, 10 or 100
Current Full Scale: Display only
PT Ratios
PT Numerator (Primary): 1 - 9999
Electro Industries/GaugeTech
Electro Industries/GaugeTech
The Leader In Power Monitoring and Smart Grid Solutions
The Leader In Power Monitoring and Smart Grid Solutions
Doc#
E149721
5 - 11
5: Communication Installation
PT Denominator (Secondary): 40 - 600
PT Multiplier: 1, 10, 100, or 1000
Voltage Full Scale: Display only
System Wiring
3 Element Wye; 2.5 Element Wye; 2 CT Delta
NOTE: Voltage Full Scale = PT Numerator x PT Multiplier
Example:
A 14400/120 PT would be entered as:
PT Numerator:
1440
PT Denominator:
120
Multiplier:
10
This example would display a 14.40kV.
Example CT Settings:
200/5 Amps: Set the Ct-n value for 200, Ct-Multiplier value for 1
800/5 Amps: Set the Ct-n value for 800, Ct-Multiplier value for 1
2,000/5 Amps: Set the Ct-n value for 2000, Ct-Multiplier value for 1
10,000/5 Amps: Set the Ct-n value for 1000, Ct-Multiplier value for 10
Example PT Settings:
277/277 Volts: Pt-n value is 277, Pt-d value is 277, Pt-Multiplier is 1
14,400/120 Volts: Pt-n value is 1440, Pt-d value is 120, Pt-Multiplier value is 10
138,000/69 Volts: Pt-n value is 1380, Pt-d value is 69, Pt-Multiplier value is 100
345,000/115 Volts: Pt-n value is 3450, Pt-d value is 115, Pt-Multiplier value is 100
345,000/69 Volts: Pt-n value is 345, Pt-d value is 69, Pt-Multiplier value is 1000
Electro Industries/GaugeTech
Electro Industries/GaugeTech
The Leader In Power Monitoring and Smart Grid Solutions
The Leader In Power Monitoring and Smart Grid Solutions
Doc#
E149721
5 - 12
5: Communication Installation
NOTE: Settings are the same for Wye and Delta configurations.
Display Configuration
The settings on this screen determine the display configuration of the meter’s
faceplate.
The screen fields and acceptable entries are as follows:
Phases Displayed: A; A and B; A, B, and C. This field determines which phases are
displayed on the faceplate. For example, if you select A and B, only those two phases
will be displayed on the faceplate.
Auto Scroll Display: Yes or No. This field enables/disables the scrolling of selected
readings on the faceplate. If enabled, the readings scroll every 5 seconds.
Enable on Face Plate of Display: Check the boxes of the Readings you want
displayed on the faceplate of the meter. You must select at least one reading.
Power Direction: View as Load or View as Generator
Flip Power Factor Sign: Yes or No
Electro Industries/GaugeTech
Electro Industries/GaugeTech
The Leader In Power Monitoring and Smart Grid Solutions
The Leader In Power Monitoring and Smart Grid Solutions
Doc#
E149721
5 - 13
5: Communication Installation
Current (I) Display Autoscale: On to apply scaling to the current display or Off (No
decimal places)
Display Voltage in Secondary: Yes or No
Load Bar Custom Configuration: To enter scaling for the Load Bar, click the Load
Bar Custom Configuration checkbox. Fields display on the screen that allow you to
enter a Scaling factor for the display. See the figure below.
Enter the scaling factor you want in the Current Scale field. This field is multiplied by
the CT Multiplier (set in the CT, PT Ratios, and System Hookup screen) to arrive at the
Primary Full Scale. Make sure you set the CT multiplier correctly.
Enable Fixed Scale for Voltage Display: To enter a scaling factor for the Voltage
display, click the checkbox next to Enable Fixed Scale for Voltage Display. The screen
changes - see the figure below.
Select the scaling you want to use from the pull-down menu. The options are: 0,
100.0kV, 10.00kV, or 0kV.
Electro Industries/GaugeTech
Electro Industries/GaugeTech
The Leader In Power Monitoring and Smart Grid Solutions
The Leader In Power Monitoring and Smart Grid Solutions
Doc#
E149721
5 - 14
5: Communication Installation
Energy, Power Scaling, and Averaging
The screen fields and acceptable entries are as follows:
Energy Settings
Energy Digits: 5; 6; 7; 8
Energy Decimal Places: 0 - 6
Energy Scale: unit; kilo (K); Mega (M)
Example: a reading for Digits: 8; Decimals: 3; Scale: K would be formatted as
00123.456k
Power Settings
Power Scale: Auto; unit; kilo (K); Mega (M)
Apparent Power (VA) Calculation Method: Arithmetic Sum; Vector Sum
Demand Averaging
Type: Block or Rolling
Electro Industries/GaugeTech
Electro Industries/GaugeTech
The Leader In Power Monitoring and Smart Grid Solutions
The Leader In Power Monitoring and Smart Grid Solutions
Doc#
E149721
5 - 15
5: Communication Installation
Interval (Block demand) or Sub-Interval (Rolling demand) in minutes: 5; 15; 30; 60
Number of Subintervals: 1; 2; 3; 4
Interval Window: This field is display only. It is the product of the values entered in
the Sub-Interval and Number of Subintervals fields.
NOTE: You will only see the Number of Subintervals and Interval Window fields if you
select Rolling Demand.
System Settings
From this screen, you can do the following:
• Enable or disable password for Reset (reset max/min Energy settings, Energy
accumulators, and the individual logs) and/or Configuration (Device profile): click
the radio button next to Yes or No.
NOTES:
• If you enable a password for reset, you must also enable it for configuration.
• The meter’s default is password disabled.
• Enabling Password protection prevents unauthorized tampering with devices.
When a user attempts to make a change that is under Password protection,
Electro Industries/GaugeTech
Electro Industries/GaugeTech
The Leader In Power Monitoring and Smart Grid Solutions
The Leader In Power Monitoring and Smart Grid Solutions
Doc#
E149721
5 - 16
5: Communication Installation
Communicator EXT opens a screen asking for the password. If the correct
password is not entered, the change does not take place.
IMPORTANT! You must set up a password before enabling Password protection.
Click the Change button next to Change Password if you have not already set up a
password.
• Change the Password: click the Change button. You will see the Enter the New
Password screen, shown below.
1. Type in the new password (0 - 9999).
2. Retype the password.
3. Click Change. The new password is saved and the meter restarts.
NOTE: If Password protection has already been enabled for configuration and
you attempt to change the password, you will see the Enter Password screen
after you click Change. Enter the old password and click OK to proceed with
the password change.
• Change the Meter Identification: input a new meter label into the Meter Designation
field.
Electro Industries/GaugeTech
Electro Industries/GaugeTech
The Leader In Power Monitoring and Smart Grid Solutions
The Leader In Power Monitoring and Smart Grid Solutions
Doc#
E149721
5 - 17
5: Communication Installation
Limits
Limits are transition points used to divide acceptable and unacceptable measurements. When a value goes above or below the limit an out-of-limit condition occurs.
Once they are configured, you can view the out-of-Limits (or Alarm) conditions in the
Limits log or Limits polling screen. You can also use Limits to trigger relays. See the
Communicator EXT User Manual for details.
The current settings for Limits are shown in the screen. You can set and configure up
to eight Limits for the Shark® 200S meter.
To set up a Limit:
1. Select a Limit by double-clicking on the Assigned Channel field.
2. You will see the screen shown below. Select a Group and an Item for the Limit.
Electro Industries/GaugeTech
Electro Industries/GaugeTech
The Leader In Power Monitoring and Smart Grid Solutions
The Leader In Power Monitoring and Smart Grid Solutions
Doc#
E149721
5 - 18
5: Communication Installation
3. Click OK.
To configure a Limit:
Double-click on the field to set the following values:
Above and Below Setpoint: % of Full Scale (the point at which the reading goes
out of limit)
Examples:
100% of 120V Full Scale = 120V
90% of 120V Full Scale = 108V
Above and Below Return Hysteresis: the point at which the reading goes back
within limit (see figure below)
Examples:
Above Setpoint = 110%; Below Setpoint = 90%
(Out of Limit above 132V);(Out of Limit below 108V)
Above Return Hysteresis = 105%; Below Return Hysteresis = 95%
(Stay out of Limit until below 126V)(Stay out of Limit until above 114V)
+ MEASURED VALUE
Above Limit
condition
Above Limit Trigger point
HYSTERESIS
Return point from Above Limit condition
Return point from Below Limit condition
HYSTERESIS
Below Limit Trigger point
Below Limit
condition
0
TIME
- MEASURED VALUE
(if applicable)
Primary Fields: These fields are display only. They show what the setpoint and
return hysteresis value are for each limit.
Electro Industries/GaugeTech
Electro Industries/GaugeTech
The Leader In Power Monitoring and Smart Grid Solutions
The Leader In Power Monitoring and Smart Grid Solutions
Doc#
E149721
5 - 19
5: Communication Installation
NOTES:
• If you are entering negative Limits, be aware that the negative value affects the
way the above and below Limits function, since negative numbers are processed as
signed values.
• If the Above Return Hysteresis is greater than the Above Setpoint, the Above Limit
is Disabled; if the Below Return Hysteresis is less than the Below Setpoint, the
Below Limit is Disabled. You may want to use this feature to disable either Above or
Below Limit conditions for a reading.
IMPORTANT! When you finish making changes to the Device Profile, click Update
Device to send the new Profile settings to the meter.
NOTE: Refer to Chapter 5 of the Communicator EXT User Manual for additional
instructions on configuring the Shark® 200S meter settings, including Time Setting,
Transformer and Line Loss Compensation, CT and PT Compensation, Secondary
Voltage display, Symmetrical Components, Voltage and Current Unbalance, and
scaling Primary readings for use with DNP.
Electro Industries/GaugeTech
Electro Industries/GaugeTech
The Leader In Power Monitoring and Smart Grid Solutions
The Leader In Power Monitoring and Smart Grid Solutions
Doc#
E149721
5 - 20
6: Ethernet Configuration
6: Ethernet Configuration
6.1: Introduction
The Shark® 200S submeter offers an optional WiFi (Wireless) or RJ45 Ethernet
connection. This option allows the submeter to be set up for use in a LAN (Local Area
Network), using standard WiFi base stations. Configuration for these connections is
easily accomplished through your PC using Telnet connections. Then you can access
the submeter to perform meter functions directly through any computer on your LAN:
the Shark® 200S meter does not need to be directly connected (wired) to these computers for it to be accessed. This chapter outlines the procedures for setting up the
parameters for Ethernet communication.
•
Host PC setup - Section 6.2
• Shark® 200S submeter setup - Section 6.3
6.2: Setting up the Host PC to Communicate with Shark® 200S Meter
• Consult with your Network Administrator before performing these steps because
some of the functions may be restricted to Administrator privileges.
• The Host PC could have multiple Ethernet Adapters (Network Cards) installed.
Identify and configure the one that will be used for accessing the Shark® 200S
meter.
• The PC's Ethernet Adapter must be set up for point-to-point communication when
setting up for the Shark® 200S meter. The Factory Default IP parameters programmed in the Shark® 200S meter are:
IP Address: 10.0.0.1
Subnet Mask: 255.255.255.0
See other parameters in Section 6.3.
• The factory default Ethernet mode is WLAN (WiFi) disabled. This means the meter
can be accessed via the RJ45 jack and cable connection only!
Electro Industries/GaugeTech
Electro Industries/GaugeTech
The Leader In Power Monitoring and Smart Grid Solutions
The Leader In Power Monitoring and Smart Grid Solutions
Doc#
E149721
6-1
6: Ethernet Configuration
If the settings are lost or unknown in the Shark® 200S meter, follow
the procedure in Section 6.4 for restoring Factory Default parameters. Default settings are listed in Section 6.3.
6.2.1: Configuring the Host PC's Ethernet Adapter Using
Windows XP©
The following example shows the PC configuration settings that allow you to access
the Shark® 200S meter in default mode. Use the same procedure when the settings
are different than the default settings, but are also known to you.
1. From the Start Menu, select Settings>Network Connections or Control
Panel>Network Connections. You will see a screen like the one shown below.
2. Right click on the Local Area Network connection you will be using to connect to the
Shark® 200S submeter, and select Properties from the pull-down menu. You will
see the screen shown on the next page.
Electro Industries/GaugeTech
Electro Industries/GaugeTech
The Leader In Power Monitoring and Smart Grid Solutions
The Leader In Power Monitoring and Smart Grid Solutions
Doc#
E149721
6-2
6: Ethernet Configuration
3. Select Internet Protocol [TCP/IP] from the middle of the screen and click the
Properties button. You will see the screen shown on the next page.
Electro Industries/GaugeTech
Electro Industries/GaugeTech
The Leader In Power Monitoring and Smart Grid Solutions
The Leader In Power Monitoring and Smart Grid Solutions
Doc#
E149721
6-3
6: Ethernet Configuration
4. Click the Use the Following IP Address radio button. The screen changes to allow
you to enter the IP Address and Subnet Mask.
a. Enter 10.0.0.2 in the IP Address field.
b. Enter 255.255.255.0 in the Subnet Mask field.
3. Click the OK button.
4. You can now close the Local Area Connection Properties and Network Connection
windows.
Electro Industries/GaugeTech
Electro Industries/GaugeTech
The Leader In Power Monitoring and Smart Grid Solutions
The Leader In Power Monitoring and Smart Grid Solutions
Doc#
E149721
6-4
6: Ethernet Configuration
6.3: Setting up the Ethernet Module in the Shark® 200S Meter
Below are the Factory Default settings for the Shark® 200S meter's Ethernet
Module. These are programmed into the meter before it is shipped out from the
factory. Parameters indicated in bold letters (1, 6) may need to be altered to satisfy
the local Ethernet configuration requirements. Other parameters (2, 3, 4) should not
be altered.
Follow the procedure described in Section 6.4 if these Factory Default
parameters need to be restored in the meter.
1) Network/IP Settings:
Network Mode…………Wired Only
IP Address ...............….. 10.0.0.1
Default Gateway ............ --- not set --Netmask .................... …255.255.255.0
2) Serial & Mode Settings:
Protocol ................... Modbus/RTU,Slave(s) attached
Serial Interface ........... 57600,8,N,1,RS232,CH1
3) Modem/Configurable Pin Settings:
CP0..! Defaults (In) CP1..! GPIO (In) CP2..! GPIO (In)
CP3..! GPIO (In) CP4..! GPIO (In) CP5..! GPIO (In)
CP6..! GPIO (In) CP7..! GPIO (In) CP8..! GPIO (In)
CP9..! GPIO (In) CP10.! GPIO (In)
RTS Output ................. Fixed High/Active
4) Advanced Modbus Protocol settings:
Slave Addr/Unit Id Source .. Modbus/TCP header
Modbus Serial Broadcasts ... Disabled (Id=0 auto-mapped to 1)
MB/TCP Exception Codes ..... Yes (return 00AH and 00BH)
Char, Message Timeout ...... 00050msec, 05000msec
6) WLAN Settings:
WLAN ....................... Disabled, network:LTRX_IBSS
Topology……………. AdHoc, Country: US, Channel: 11
Security……………… none
TX Data rate………… 11 Mbps auto fallback
Power management….. not supported in ad hoc mode
• The Ethernet Module in the Shark® 200S meter can be locally or remotely configured using a Telnet connection over the network.
Electro Industries/GaugeTech
Electro Industries/GaugeTech
The Leader In Power Monitoring and Smart Grid Solutions
The Leader In Power Monitoring and Smart Grid Solutions
Doc#
E149721
6-5
6: Ethernet Configuration
• The configuration parameters can be changed at any time and are retained when
the meter is not powered up. After the configuration has been changed and saved,
the Ethernet module performs a Reset.
• Only one person at a time should be logged into the network port used for setting
up the meter. This eliminates the possibility of several people trying to configure
the Ethernet interface simultaneously.
6.3.1: Configuring the Ethernet Module in the Shark® 200S Meter
using Windows XP© on the Host Computer
Establish a Telnet connection to port 9999:
NOTE: If your PC is running
Windows 7, you need to enable
Telnet before using it.
1. Open the Control Panel.
2. Select Programs and Features.
3. Select Turn Windows features
on or off.
4. Check the box for Telnet Client.
5. Click OK. The Telnet client is
now available.
1. From the Windows Start menu,
click Run and type 'cmd'.
2. Click the OK button to bring up Windows's Command Prompt window.
3. In the Command Prompt window, type:
telnet 10.0.0.1 9999 and press the Enter key.
NOTE: Be sure to include a space between the IP address and 9999.
Microsoft Windows XP [Version 5.1.2600]
(C) Copyright 1985-2001 Microsoft Corp.
C:\Documents and Settings\Administrator>telnet 10.0.0.1 9999
Electro Industries/GaugeTech
Electro Industries/GaugeTech
The Leader In Power Monitoring and Smart Grid Solutions
The Leader In Power Monitoring and Smart Grid Solutions
Doc#
E149721
6-6
6: Ethernet Configuration
When the Telnet connection is established you will see a message similar to the
example shown below.
Serial Number 5415404 MAC Address 00:20:4A:54:3C:2C
Software Version V01.2 (000719)
Press Enter to go into Setup Mode
4. To proceed to Setup Mode press Enter again. You will see a screen similar to the
one shown below.
1) Network/IP Settings:
Network Mode…………Wired Only
IP Address ...............….. 10.0.0.1
Default Gateway ............ --- not set --Netmask .................... …255.255.255.0
2) Serial & Mode Settings:
Protocol ................... Modbus/RTU,Slave(s) attached
Serial Interface ........... 57600,8,N,1,RS232,CH1
3) Modem/Configurable Pin Settings:
CP0..! Defaults (In) CP1..! GPIO (In) CP2..! GPIO (In)
CP3..! GPIO (In) CP4..! GPIO (In) CP5..! GPIO (In)
CP6..! GPIO (In) CP7..! GPIO (In) CP8..! GPIO (In)
CP9..! GPIO (In) CP10.! GPIO (In)
RTS Output ................. Fixed High/Active
4) Advanced Modbus Protocol settings:
Slave Addr/Unit Id Source .. Modbus/TCP header
Modbus Serial Broadcasts ... Disabled (Id=0 auto-mapped to 1)
MB/TCP Exception Codes ..... Yes (return 00AH and 00BH)
Char, Message Timeout ...... 00050msec, 05000msec
6) WLAN Settings:
WLAN ....................... Disabled, network:LTRX_IBSS
Topology……………. AdHoc, Country: US, Channel: 11
Security……………… none
TX Data rate………… 11 Mbps auto fallback
Power management….. not supported in ad hoc mode
D)efault settings, S)ave, Q)uit without save
Select Command or parameter set (1..6) to change:
5. Type the number for the group of parameters you need to modify. After the group
is selected, the individual parameters display for editing. Either:
• Enter a new parameter if a change is required.
Electro Industries/GaugeTech
Electro Industries/GaugeTech
The Leader In Power Monitoring and Smart Grid Solutions
The Leader In Power Monitoring and Smart Grid Solutions
Doc#
E149721
6-7
6: Ethernet Configuration
• Press Enter to proceed to the next parameter without changing the current one.
Change Settings 1 and 6 ONLY! Settings 2, 3, and 4 MUST
have the default values shown above.
6. Continue setting up parameters as needed. After finishing your modifications,
make sure to press the "S" key on the keyboard. This will save the new values and
perform a Reset in the Ethernet Module.
6.3.2: Example of Modifying Parameters in Groups 1 and 6
Follow the steps in 6.3.1 to enter Setup Mode.
• Network IP Settings Detail (1) (Set device with static IP Address.)
Network Mode: 0=Wired only, 1=Wireless Only <0> ? 1
IP Address <010> 192.<000> 168.<000> .<000> .<001>
Set Gateway IP Address <N> ? Y
Gateway IP Address : <192> .<168> .<000> .<001>
Set Netmask <N for default> <Y> ? Y
<255> .<255> .<255> .<000>
Change telnet config password <N> ? N
• WLAN Settings Detail (6) (The settings shown are recommended by EIG for use
with Shark® 200S submeter.)
Topology: 0=Infrastructure, 1=Ad-Hoc <1> ? 0
Network name <SSID> <LTRX_IBSS> ? EIG_SHARKS
Security suite: 0=none, 1=WEP, 2=WPA, 3=WPA2/802.11i <0> ? 0
TX Data rate: 0=fixed, 1=auto fallback <1> ? 1
TX Data rate: 0=1, 1=2, 2=5.5, 3=11, 4=18, 5=24, 6=36, 7=54 Mbps <3> ? 7
Enable power management <N> ? Y
EIG recommends using 128-bit encryption for WiFi communication:
In the WLAN Settings (6), set Security WEP (1), Authentication shared (1), WEP128
(1) and Change Key (Y).
NOTE: Any key combination will work, but for added convenience a Passphrase-
Electro Industries/GaugeTech
Electro Industries/GaugeTech
The Leader In Power Monitoring and Smart Grid Solutions
The Leader In Power Monitoring and Smart Grid Solutions
Doc#
E149721
6-8
6: Ethernet Configuration
generated WEP Key can be also be used: a Passphrase can be short and thus easy
to remember. Numerous WEP Key providers offer this service free of charge on the
Internet.
IMPORTANT NOTES:
•
If you are opting for Infrastructure network topology, the Wireless Access Point
device (e.g. Wireless Router) used should have IDENTICAL settings to the WLAN
settings in the Shark® 200S meter. For programming details refer to the
Wireless Access Point device User's Manual.
• When exiting Setup Mode don't forget to save changes by pressing "S."
CAUTION! DO NOT PRESS 'D' as it will overwrite all changes and will save the
default values.
6.4: Network Module Hardware Initialization
If you don't know your current Network Module settings, or if the settings are lost,
you can use this method to initialize the hardware with known settings you can then
work with.
WARNING! During normal operation of the Shark® 200S meter,
dangerous voltages flow through many parts of the meter, including:
Terminals and any connected CTs (Current Transformers) and PTs
(Potential Transformers), all I/O Modules (Inputs and Outputs) and
their circuits. All Primary and Secondary circuits can, at times,
produce lethal voltages and currents. Avoid contact with any current-carrying
surfaces. Before performing ANY work on the meter, make sure the meter is
powered down and all connected circuits are de-energized.
Electro Industries/GaugeTech
Electro Industries/GaugeTech
The Leader In Power Monitoring and Smart Grid Solutions
The Leader In Power Monitoring and Smart Grid Solutions
Doc#
E149721
6-9
6: Ethernet Configuration
Main Board
2ESET"UTTON
Electro Industries
/GaugeTech
14
*0
7
7
7
8
8
8
13
WD
*0
13
1. Place a shorting block on JP3 and press the Reset button on the main board.
NOTE: JP3 is located on the right hand side, upper corner of the main board. The
shorting block can be "borrowed" from JP2, located at the middle, right hand side.
See the figure shown above.
2. After you press the Reset button, move the jumper back to JP2.
Electro Industries/GaugeTech
Electro Industries/GaugeTech
The Leader In Power Monitoring and Smart Grid Solutions
The Leader In Power Monitoring and Smart Grid Solutions
Doc#
E149721
6 - 10
7: Using the Submeter
7: Using the Submeter
7.1: Introduction
The Shark® 200S submeter can be configured and a variety of functions can be
accomplished by using the Elements and the Buttons on the submeter face. This
chapter reviews front panel navigation. See Appendix A for complete Navigation
maps.
7.1.A: Understanding Submeter Face Elements
Reading
Type
Indicator
MENU
MAX
ENTER
VOLTS L-N
VOLTS L-L
MIN
LM1
LM2
-
AMPS
A
WNARP
%THD
IrDA Com
Port
VA/Hz
PRG
-
lrDA
120%-
% of Load
Bar
Parameter
Designator
90%60%-
0000
-
Wh
VARh
B
VAh
C
Wh Pulse
30%-
KILO
MEGA
%LOAD
Watt-hour
Test Pulse
Scaling
Factor
Figure 7.1: Faceplate with Elements
The meter face features the following elements:
• Reading Type Indicator: e.g., Max
• Parameter Designator: e.g., Volts L-N
• Watt-Hour Test Pulse: Energy pulse output to test accuracy
• Scaling Factor: Kilo or Mega multiplier of displayed readings
• % of Load Bar: Graphic Display of Amps as % of the Load (Refer to Section 7.3 for
additional information.)
• IrDA Communication Port: Com 1 port for wireless communication
Electro Industries/GaugeTech
Electro Industries/GaugeTech
The Leader In Power Monitoring and Smart Grid Solutions
The Leader In Power Monitoring and Smart Grid Solutions
Doc#
E149721
7-1
7: Using the Submeter
7.1.B: Understanding Submeter Face Buttons
Menu
MENU
MAX
ENTER
VOLTS L-N
LM1
LM2
-
AMPS
A
WNARP
%THD
VA/Hz
PRG
-
lrDA
120%90%60%-
0000
-
Wh
VARh
B
VAh
C
Wh Pulse
30%-
Down
Enter
VOLTS L-L
MIN
KILO
MEGA
%LOAD
Right
Figure 7.2: Faceplate with Buttons
The meter face has Menu, Enter, Down and Right buttons, which let you perform
the following functions:
• View Meter Information
• Enter Display Modes
• Configure Parameters (may be Password Protected)
• Perform Resets (may be Password Protected)
• Perform LED Checks
• Change Settings
• View Parameter Values
• Scroll Parameter Values
• View Limit States
Electro Industries/GaugeTech
Electro Industries/GaugeTech
The Leader In Power Monitoring and Smart Grid Solutions
The Leader In Power Monitoring and Smart Grid Solutions
Doc#
E149721
7-2
7: Using the Submeter
7.2: Using the Front Panel
You can access four modes using the Shark® 200S submeter’s front panel buttons:
• Operating mode (Default)
• Reset mode
• Configuration mode
• Information mode - Information mode displays a sequence of screens that show
model information, such as Frequency, Amps, V-Switch, etc.
Use the Menu, Enter, Down and Right buttons to navigate through each mode and
its related screens.
NOTES:
• See Appendix A for the complete display mode Navigation maps.
• The meter can also be configured using software; see Chapter 5 and the Communicator EXT User Manual for instructions.
7.2.1: Understanding Startup and Default Displays
Upon Power Up, the meter displays a sequence of screens:
• Lamp Test screen where all LEDs are lit
• Lamp Test screen where all digits are lit
• Firmware screen showing build number
• Error screen (if an error exists)
After startup, if auto-scrolling is enabled, the Shark® 200S meter scrolls the parameter readings on the right side of the front panel. The Kilo or Mega LED lights, showing
the scale for the Wh, VARh and VAh readings. Figure 7.3 shows an example of a Wh
reading.
Electro Industries/GaugeTech
Electro Industries/GaugeTech
The Leader In Power Monitoring and Smart Grid Solutions
The Leader In Power Monitoring and Smart Grid Solutions
Doc#
E149721
7-3
7: Using the Submeter
MENU
MAX
ENTER
VOLTS L-N
VOLTS L-L
MIN
LM1
LM2
-
AMPS
A
WNARP
%THD
VA/Hz
PRG
0000
- 0.659
-
lrDA
120%90%60%30%-
Wh
VARh
B
VAh
C
Wh Pulse
KILO
MEGA
%LOAD
Figure 7.3: Display Showing Watt-hr Reading
The Shark® 200S meter continues to provide scrolling readings until one of the
buttons on the front panel is pressed, causing the meter to enter one of the other
Modes.
7.2.2: Using the Main Menu
1. Press the Menu button. The Main Menu screen appears.
• The Reset: Demand mode (rStd) appears in the A window. Use the Down button to
scroll, causing the Reset: Energy (rStE), Configuration (CFG), Operating (OPr), and
Information (InFo) modes to move to the A window.
• The mode that is currently flashing in the A window is the “Active” mode, which
means it is the mode that can be configured.
MENU
ENTER
MENU
ENTER
MENU
ENTER
-
A
-
A
-
A
-
B
-
B
-
B
-
C
-
C
-
C
For example: Press Down Twice -
CFG moves to A window. Press Down Twice - OPr moves to
A
Electro Industries/GaugeTech
Electro Industries/GaugeTech
The Leader In Power Monitoring and Smart Grid Solutions
The Leader In Power Monitoring and Smart Grid Solutions
Doc#
E149721
window.
7-4
7: Using the Submeter
2. Press the Enter button from the Main Menu to view the Parameters screen for the
mode that is currently active.
7.2.3: Using Reset Mode
Reset mode has two options:
• Reset: Demand (rStd): resets the Max and Min values.
• Reset: Energy (rStE): resets the energy accumulator fields.
1. Press the Enter button while either rStd
or rStE is in the A window. The Reset
MENU
Demand No or Reset Energy No screen
appears.
• If you press the Enter button again,
MENU
ENTER
ENTER
-
A
-
A
-
B
-
B
-
C
-
C
the Main Menu appears, with the next
mode in the A window. (The Down
button does not affect this screen.)
• If you press the Right button, the
MENU
Reset Demand YES or Reset Energy
YES screen appears. Press Enter to
perform a reset.
NOTE: If Password protection is enabled
ENTER
MENU
ENTER
-
A
-
A
-
B
-
B
-
C
-
C
for reset, you must enter the four digit
password before you can reset the meter
(see Chapter 5 for information on Password protection). To enter a password, follow
the instructions in Section 7.2.4.
CAUTION! Reset Demand YES resets all Max and Min values.
2. Once you have performed a reset, the screen displays either “rSt dMd donE” or
“rSt EnEr donE”and then resumes auto-scrolling parameters.
Electro Industries/GaugeTech
Electro Industries/GaugeTech
The Leader In Power Monitoring and Smart Grid Solutions
The Leader In Power Monitoring and Smart Grid Solutions
Doc#
E149721
7-5
7: Using the Submeter
7.2.4: Entering a Password
If Password protection has been enabled in the software for reset and/or configuration
(see Chapter 5 for more information), a screen appears requesting a password when
you try to reset the meter and/or configure settings through the front panel.
• PASS appears in the A window and 4 dashes appear in the B window. The leftmost
dash is flashing.
1. Press the Down button to scroll numbers from 0 to 9 for the flashing dash. When
the correct number appears for that dash, use the Right button to move to the
next dash.
Example: The left screen, below, shows four dashes. The right screen shows the display after the first two digits of the password have been entered.
MENU
MENU
ENTER
-
A
-
-
B
-
-
C
-
ENTER
PASS
12__
A
B
C
2. When all 4 digits of the password have been selected, press the Enter button.
• If you are in Reset Mode and you enter the correct password, “rSt dMd donE” or
“rSt EnEr donE”appears and the screen resumes auto-scrolling parameters.
• If you are in Configuration Mode and you enter the correct password, the display
returns to the screen that required a password.
• If you enter an incorrect password, “PASS ---- FAIL”
appears and:
• The previous screen is re-displayed, if you are in
Reset Mode.
• The previous Operating mode screen is re-dis-
MENU
ENTER
-
A
-
B
-
C
played, if you are in Configuration mode.
Electro Industries/GaugeTech
Electro Industries/GaugeTech
The Leader In Power Monitoring and Smart Grid Solutions
The Leader In Power Monitoring and Smart Grid Solutions
Doc#
E149721
7-6
7: Using the Submeter
7.2.5: Using Configuration Mode
Configuration mode follows Reset: Energy on the Main Menu.
To access Configuration mode
1. Press the Menu button while the meter is auto-scrolling parameters.
2. Press the Down button until the Configuration Mode option (CFG) is in the A window.
3. Press the Enter button. The Configuration Parameters screen appears.
4. Press the Down button to scroll through the configuration parameters: Scroll
(SCrL), CT, PT, Connection (Cnct) and Port. The parameter currently ‘Active,” i.e.,
configurable, flashes in the A window.
5. Press the Enter button to access the Setting screen for the currently active
parameter.
NOTE: You can use the Enter button to scroll through all of the Configuration parameters and their Setting screens, in order.
MENU
ENTER
MENU
ENTER
-
A
-
A
-
B
-
B
-
C
-
C
Press Enter when CFG is in A window - Parameter screen appears Press Down- Press Enter when
Parameter you want is in A window
6. The parameter screen appears, showing the current settings. To change the
settings:
• Use either the Down button or the Right button to select an option.
Electro Industries/GaugeTech
Electro Industries/GaugeTech
The Leader In Power Monitoring and Smart Grid Solutions
The Leader In Power Monitoring and Smart Grid Solutions
Doc#
E149721
7-7
7: Using the Submeter
• To enter a number value, use the Down button to select the number value for a
digit and the Right button to move to the next digit.
NOTE: When you try to change the current setting and Password protection is
enabled for the meter, the Password screen appears. See Section 7.2.4 for instructions on entering a password.
7. Once you have entered the new setting, press the Menu button twice.
8. The Store ALL YES screen appears. You can either:
• Press the Enter button to save the new setting.
• Press the Right button to access the Store ALL no screen; then press the Enter
button to cancel the Save.
9. If you have saved the settings, the Store ALL done screen appears and the meter
resets.
MENU
MENU
ENTER
MENU
ENTER
ENTER
-
A
-
A
-
A
-
B
-
B
-
B
-
C
-
C
-
C
Press the Enter button to save
the settings. Press the Right
Press the Enter button to
The settings have been
Cancel the Save.
saved.
button for Stor All no screen.
Electro Industries/GaugeTech
Electro Industries/GaugeTech
The Leader In Power Monitoring and Smart Grid Solutions
The Leader In Power Monitoring and Smart Grid Solutions
Doc#
E149721
7-8
7: Using the Submeter
7.2.5.1: Configuring the Scroll Feature
When in Auto Scroll mode, the meter performs a scrolling display, showing each
parameter for 7 seconds, with a 1 second pause between parameters. The parameters
that the meter displays have been selected through software (refer to the
Communicator EXT User Manual for instructions).
To enable or disable Auto-scrolling:
1. Press the Enter button when SCrl is in the A window. The Scroll YES screen
appears.
2. Press either the Right or Down button if you want to
access the Scroll no screen. To return to the Scroll YES
screen, press either button.
3. Press the Enter button on either the Scroll YES screen (to
MENU
ENTER
-
A
-
B
-
C
enable auto-scrolling) or the Scroll no screen (to disable
auto-scrolling).
4. The CT- n screen appears (this is the next Configuration
mode parameter).
MENU
NOTES:
• To exit the screen without changing scrolling options, press
the Menu button.
ENTER
-
A
-
B
-
C
• To return to the Main Menu screen, press the Menu button
twice.
• To return to the scrolling (or non-scrolling) parameters display, press the Menu
button three times.
Electro Industries/GaugeTech
Electro Industries/GaugeTech
The Leader In Power Monitoring and Smart Grid Solutions
The Leader In Power Monitoring and Smart Grid Solutions
Doc#
E149721
7-9
7: Using the Submeter
7.2.5.2: Configuring CT Setting
The CT Setting has three parts: Ct-n (numerator), Ct-d (denominator), and Ct-S
(scaling).
1. Press the Enter button when Ct is in the A window. The Ct-n screen appears. You
can either:
• Change the value for the CT numerator.
• Access one of the other CT screens by pressing the Enter button: press Enter
once to access the Ct-d screen, twice to access the Ct-S screen.
NOTE: The Ct-d screen is preset to a 5 Amp or 1 Amp value at the factory and
cannot be changed.
a. To change the value for the CT numerator:
From the Ct-n screen:
• Use the Down button to select the number value for a digit.
• Use the Right button to move to the next digit.
b. To change the value for CT scaling
From the Ct-S screen:
Use the Right button or the Down button to choose the scaling you want. The
Ct-S setting can be 1, 10, or 100.
NOTE: If you are prompted to enter a password, refer to Section 7.2.4 for instructions on doing so.
2. When the new setting is entered, press the Menu button twice.
3. The Store ALL YES screen appears. Press Enter to save the new CT setting.
Example CT Settings:
200/5 Amps: Set the Ct-n value for 200 and the Ct-S value for 1.
800/5 Amps: Set the Ct-n value for 800 and the Ct-S value for 1.
Electro Industries/GaugeTech
Electro Industries/GaugeTech
The Leader In Power Monitoring and Smart Grid Solutions
The Leader In Power Monitoring and Smart Grid Solutions
Doc#
E149721
7 - 10
7: Using the Submeter
2,000/5 Amps: Set the Ct-n value for 2000 and the Ct-S value for 1.
10,000/5 Amps: Set the Ct-n value for 1000 and the Ct-S value for 10.
NOTES:
• The value for Amps is a product of the Ct-n value and the Ct-S value.
• Ct-n and Ct-S are dictated by primary current; Ct-d is secondary current.
MENU
MENU
ENTER
ENTER
MENU
ENTER
MENU
ENTER
-
A
-
A
-
A
-
A
-
B
-
B
-
B
-
B
-
C
-
C
-
C
-
C
Press Enter
Use buttons to set Ct-n
Ct-d cannot be changed
Use buttons to select
scaling
7.2.5.3: Configuring PT Setting
The PT Setting has three parts: Pt-n (numerator), Pt-d (denominator), and Pt-S (scaling).
1. Press the Enter button when Pt is in the A window. The PT-n screen appears. You
can either:
• Change the value for the PT numerator.
• Access one of the other PT screens by pressing the Enter button: press Enter
once to access the Pt-d screen, twice to access the Pt-S screen.
a. To change the value for the PT numerator or denominator:
From the Pt-n or Pt-d screen:
• Use the Down button to select the number value for a digit.
• Use the Right button to move to the next digit.
Electro Industries/GaugeTech
Electro Industries/GaugeTech
The Leader In Power Monitoring and Smart Grid Solutions
The Leader In Power Monitoring and Smart Grid Solutions
Doc#
E149721
7 - 11
7: Using the Submeter
b. To change the value for the PT scaling:
From the Pt-S screen:
Use the Right button or the Down button to choose the scaling you want. The
Pt-S setting can be 1, 10, 100, or 1000.
NOTE: If you are prompted to enter a password, refer to Section 7.2.4 for instructions on doing so.
2. When the new setting is entered, press the Menu button twice.
3. The STOR ALL YES screen appears. Press Enter to save the new PT setting.
Example PT Settings:
277/277 Volts: Pt-n value is 277, Pt-d value is 277, Pt-S value is 1.
14,400/120 Volts: Pt-n value is 1440, Pt-d value is 120, Pt-S value is 10.
138,000/69 Volts: Pt-n value is 1380, Pt-d value is 69, Pt-S value is 100.
345,000/115 Volts: Pt-n value is 3450, Pt-d value is 115, Pt-S value is 100.
345,000/69 Volts: Pt-n value is 345, Pt-d value is 69, Pt-S value is 1000.
NOTE: Pt-n and Pt-S are dictated by primary voltage; Pt-d is secondary voltage.
MENU
ENTER
MENU
ENTER
MENU
ENTER
-
A
-
A
-
A
-
B
-
B
-
B
-
C
-
C
-
C
Use buttons to set Pt-n
Use buttons to set Pt-d
Electro Industries/GaugeTech
Electro Industries/GaugeTech
The Leader In Power Monitoring and Smart Grid Solutions
The Leader In Power Monitoring and Smart Grid Solutions
Doc#
Use buttons to select scaling
E149721
7 - 12
7: Using the Submeter
7.2.5.4: Configuring Connection Setting
1. Press the Enter button when Cnct is in the A window. The Cnct screen appears.
2. Press the Right button or Down button to select a configuration. The choices are:
• 3 Element Wye (3 EL WYE)
• 2.5 Element Wye (2.5EL WYE)
• 2 CT Delta (2 Ct dEL)
NOTE: If you are prompted to enter a password, refer to Section 7.2.4 for instructions on doing so.
3. When you have made your selection, press the Menu button twice.
4. The STOR ALL YES screen appears. Press Enter to save the setting.
MENU
ENTER
-
A
-
B
-
C
Use buttons to select configuration
7.2.5.5: Configuring Communication Port Setting
Port configuration consists of: Address (a three digit number), Baud Rate (9600;
19200; 38400; or 57600), and Protocol (DNP 3.0; Modbus RTU; or Modbus ASCII).
1. Press the Enter button when POrt is in the A window. The Adr (address) screen
appears. You can either:
• Enter the address.
• Access one of the other Port screens by pressing the Enter button: press Enter
once to access the bAUd screen (Baud Rate), twice to access the Prot screen
(Protocol).
Electro Industries/GaugeTech
Electro Industries/GaugeTech
The Leader In Power Monitoring and Smart Grid Solutions
The Leader In Power Monitoring and Smart Grid Solutions
Doc#
E149721
7 - 13
7: Using the Submeter
a. To enter the Address
From the Adr screen:
• Use the Down button to select the number value for a digit.
• Use the Right button to move to the next digit.
b. To select the Baud Rate:
From the bAUd screen:
Use the Right button or the Down button to select the setting you want.
c. To select the Protocol:
From the Prot screen:
Press the Right button or the Down button to select the setting you want.
NOTE: If you are prompted to enter a password, refer to Section 7.2.4 for instructions on doing so.
2. When you have finished making your selections, press the Menu button twice.
3. The STOR ALL YES screen appears. Press Enter to save the settings.
MENU
MENU
ENTER
ENTER
MENU
ENTER
-
A
-
A
-
A
-
B
-
B
-
B
-
C
-
C
-
C
Use buttons to enter Address
Electro Industries/GaugeTech
Electro Industries/GaugeTech
Use buttons to select Baud Rate Use buttons to select Protocol
The Leader In Power Monitoring and Smart Grid Solutions
The Leader In Power Monitoring and Smart Grid Solutions
Doc#
E149721
7 - 14
7: Using the Submeter
7.2.6: Using Operating Mode
Operating mode is the Shark® 200S submeter’s default mode, that is, the standard
front panel display. After starting up, the meter automatically scrolls through the
parameter screens, if scrolling is enabled. Each parameter is shown for 7 seconds,
with a 1 second pause between parameters. Scrolling is suspended for 3 minutes after
any button is pressed.
1. Press the Down button to scroll all the parameters in Operating mode. The
currently “Active,” i.e., displayed, parameter has the Indicator light next to it, on
the right face of the meter.
2. Press the Right button to view additional readings for that parameter. The table
below shows possible readings for Operating mode. Sheet 2 in Appendix A shows
the Operating mode Navigation map.
NOTE: Readings or groups of readings are skipped if not applicable to the meter type
or hookup, or if they are disabled in the programmable settings.
OPERATING MODE PARAMETER READINGS
POSSIBLE READINGS
VOLTS L-N
VOLTS_LN
VOLTS_LN_
MAX
VOLTS_LN_
MIN
VOLTS L-L
VOLTS_LL
VOLTS_LL_
MAX
VOLTS_LL_
MIN
AMPS
AMPS
AMPS_NEU
TRAL
AMPS_MAX
AMPS_MIN
W/VAR/PF
W_VAR_PF
W_VAR_PF
_MAX_POS
W_VAR_PF
_MIN_POS
W_VAR_PF
_MIN_NEG
VA/Hz
VA_FREQ
VA_FREQ_
MAX
VA_FREQ_
MIN
Wh
KWH_REC
KWH_DEL
KWH_NET
KWH_TOT
VARh
KVARH_PO
S
KVARH_NE
G
KVARH_NE
T
KVARH_TO
T
VAh
KVAH
Electro Industries/GaugeTech
Electro Industries/GaugeTech
The Leader In Power Monitoring and Smart Grid Solutions
The Leader In Power Monitoring and Smart Grid Solutions
Doc#
VOLTS_LN_
THD
E149721
AMPS_THD
7 - 15
7: Using the Submeter
7.3: Understanding the % of Load Bar
The 10-segment LED bar graph at the bottom left of the Shark® 200S meter’s front
panel provides a graphic representation of Amps. The segments light according to the
load, as shown in the table below.
When the Load is over 120% of Full Load, all segments flash “On” (1.5 secs) and “Off”
(0.5 secs).
Segments
Load >= % Full Load
none
no load
1
1%
1-2
15%
1-3
30%
1-4
45%
1-5
60%
1-6
72%
1-7
84%
1-8
96%
1-9
108%
1-10
120%
All Blink
>120%
MENU
MAX
ENTER
VOLTS L-N
VOLTS L-L
MIN
LM1
LM2
-
AMPS
A
WNARP
%THD
VA/Hz
PRG
10
-
lrDA
120%90%60%-
0000
-
Electro Industries/GaugeTech
Electro Industries/GaugeTech
VARh
VAh
C
Wh Pulse
30%-
1
Wh
B
KILO
MEGA
%LOAD
The Leader In Power Monitoring and Smart Grid Solutions
The Leader In Power Monitoring and Smart Grid Solutions
Doc#
E149721
7 - 16
7: Using the Submeter
7.4: Performing Watt-Hour Accuracy Testing (Verification)
To be certified for revenue metering, power providers and utility companies must
verify that the billing energy meter performs to the stated accuracy. To confirm the
meter’s performance and calibration, power providers use field test standards to
ensure that the unit’s energy measurements are correct. Since the Shark® 200S submeter is a traceable revenue meter, it contains a utility grade test pulse that can be
used to gate an accuracy standard. This is an essential feature required of all billing
grade meters.
• Refer to Figure 7.5 for an example of how this process works.
• Refer to Table 7.1 for the Wh/Pulse constants for accuracy testing.
MENU
MAX
ENTER
VOLTS L-N
VOLTS L-L
MIN
LM1
LM2
-
AMPS
A
WNARP
%THD
VA/Hz
PRG
0000
- 0.659
-
lrDA
120%90%60%30%-
Wh
VARh
B
VAh
C
Wh Pulse
Watt-hour
Test Pulse
KILO
MEGA
%LOAD
Figure 7.4: Watt-hour Test Pulse
Electro Industries/GaugeTech
Electro Industries/GaugeTech
The Leader In Power Monitoring and Smart Grid Solutions
The Leader In Power Monitoring and Smart Grid Solutions
Doc#
E149721
7 - 17
7: Using the Submeter
MENU
MAX
ENTER
VOLTS L-N
MIN
LM1
LM2
VOLTS L-L
-
A
-
B
-
C
AMPS
WNARP
%THD
VA/Hz
PRG
Wh
lrDA
VARh
VAh
Test Pulses
120%90%60%-
Energy Pulses
Wh Pulse
30%-
KILO
Energy
Standard
MEGA
%LOAD
Comparator
Error
Results
Figure 7.5: Using the Watt-hour Test Pulse
Input Voltage Level
Class 10 Models
Below 150V
Above 150V
Class 2 Models
0.500017776
2.000071103
0.1000035555
0.400014221
Table 7.1: Infrared & KYZ Pulse Constants for Accuracy Testing - Kh Watt-hour per pulse
NOTES:
• Minimum pulse width is 90 milliseconds.
• Refer to Chapter 2, Section 2.2, for Wh Pulse specifications.
Electro Industries/GaugeTech
Electro Industries/GaugeTech
The Leader In Power Monitoring and Smart Grid Solutions
The Leader In Power Monitoring and Smart Grid Solutions
Doc#
E149721
7 - 18
A: Shark® 200-S Meter Navigation Maps
A: Shark® 200S Meter Navigation Maps
A.1: Introduction
You can configure the Shark® 200S meter and perform related tasks using the
buttons on the meter face. Chapter 7 contains a description of the buttons on the
meter face and instructions for programming the meter using them. The meter can
also be programmed using software (see Chapter 5 and the Communicator EXT User
Manual).
A.2: Navigation Maps (Sheets 1 to 4)
The Shark® 200S meter’s Navigation maps begin on the next page. The maps show
in detail how to move from one screen to another and from one display mode to
another using the buttons on the face of the meter. All display modes automatically
return to Operating mode after 10 minutes with no user activity.
Shark® 200S meter Navigation map titles
• Main Menu Screens (Sheet 1)
• Operating mode screens (Sheet 2)
• Reset mode screens (Sheet 3)
• Configuration mode screens (Sheet 4)
Electro Industries/GaugeTech
Electro Industries/GaugeTech
The Leader In Power Monitoring and Smart Grid Solutions
The Leader In Power Monitoring and Smart Grid Solutions
Doc#
E149721
A-1
A: Shark® 200-S Meter Navigation Maps
Main Menu Screens (Sheet 1)
STARTUP
sequence run once at meter startup:
2 lamp test screens, hardware information
screen, firmware version screen,
(conditional) error screens
10 minutes with no user activity
sequence completed
MENU
MAIN MENU:
OPR (blinking)
RSTD
RSTE
OPERATING MODE
ENTER
DOWN
RESET DEMAND MODE
ENTER
DOWN
DOWN
10 minutes
with no
user activity
MENU
MAIN MENU:
RSTD (blinking)
RSTE
CFG
sequence
completed
grid of meter data screens.
See pages A-3
sequence of screens to get password, if
required, and reset max/min data.
See page A-4
MENU
MAIN MENU:
RSTE (blinking)
CFG
INFO
RESET ENERGY MODE
ENTER
DOWN
sequence of screens to get password, if
required, and reset energy accumulators.
See page A-4
MENU
MAIN MENU:
CFG (blinking)
INFO
OPR
CONFIGURATION MODE
ENTER
DOWN
grid of meter settings screens with
password-protected edit capability.
See page A-5
Configuration Mode is not
available during a
Programmable Settings
update via a COM port.
MENU
MAIN MENU:
INFO (blinking)
OPR
RSTD
INFORMATION
ENTER
sequence of screens to show model
information, same as STARTUP except
lamp tests omitted.
MAIN MENU Screen
MAIN MENU screen scrolls through 4 choices,
showing 3 at a time. The top choice is always the
"active" one, which is indicated by blinking the legend.
SYMBOLS
BUTTONS
MENU
Returns to previous menu from any screen in any mode
ENTER
Indicates acceptance of the current screen and advances to the
next one
DOWN, RIGHT
Navigation:
Navigation and edit buttons
No digits or legends are blinking. On a menu, down advances
to the next menu selection, right does nothing. In a grid of
screens, down advances to the next row, right advances to the
next column. Rows, columns, and menus all navigate circularly.
A digit or legend is blinking to indicate that it is eligible for
change. When a digit is blinking, down increases the digit
value, right moves to the next digit. When a legend is blinking,
either button advances to the next choice legend.
single screen
all screens
for a display
mode
group of
screens
Editing:
action taken
button
Electro Industries/GaugeTech
Electro Industries/GaugeTech
The Leader In Power Monitoring and Smart Grid Solutions
The Leader In Power Monitoring and Smart Grid Solutions
Doc#
E149721
A-2
A: Shark® 200-S Meter Navigation Maps
Operating Mode Screens (Sheet 2)
See Notes 1 & 3
RIGHT
VOLTS_LN
RIGHT
VOLTS_LN_MAX
RIGHT
VOLTS_LN_MIN
DOWN2
DOWN2
(from any VOLTS_LN
screen)
See Note 1
RIGHT
VOLTS_LL
RIGHT
VOLTS_LL_MAX
RIGHT
VOLTS_LL_MIN
DOWN2
(from any VOLTS_LL screen)
RIGHT
AMPS
RIGHT
IN
RIGHT
See Note 1
AMPS_MAX
RIGHT
AMPS_MIN
DOWN2
DOWN2
(from any AMPS screen)
See Note 1
RIGHT
W_VAR_PF
DOWN2
RIGHT
W_VAR_PF
_MAX_POS
RIGHT
W_VAR_PF
_MIN_POS
RIGHT
W_VAR_PF
_MAX_NEG
RIGHT
W_VAR_PF
_MIN_NEG
DOWN2
(from any W_VAR_PF screen)
See Note 1
RIGHT
VA_FREQ
RIGHT
VA_FREQ_MAX
RIGHT
VA_FREQ_MIN
DOWN2
(from any VA_FREQ screen)
See Note 1
RIGHT
KWH_REC
RIGHT
KWH_DEL
RIGHT
KWH_NET
RIGHT
KWH_TOT
DOWN2
(from any KWH screen)
See Note 1
RIGHT
KVARH_POS
RIGHT
KVARH_NEG
RIGHT
KVARH_NET
RIGHT
KVARH_TOT
DOWN2
(from any KVARH screen)
See Note 1
KVAH
MENU
(from any
operating mode
screen)
Electro Industries/GaugeTech
Electro Industries/GaugeTech
Notes
1 Group is skipped if not applicable to the meter type or hookup or if explicitly disabled via
programmable settings.
2 DOWN occurs without user intervention every 7 seconds if scrolling is enabled.
3 No Volts LN screens for Delta 2CT hookup.
4 Scrolling is suspended for 3 minutes after any button press.
to Main Menu
see page A-2
The Leader In Power Monitoring and Smart Grid Solutions
The Leader In Power Monitoring and Smart Grid Solutions
Doc#
E149721
A-3
A: Shark® 200-S Meter Navigation Maps
Reset Mode Screens (Sheet 3)
from MAIN MENU
from MAIN MENU
(RSTD selected)
(RSTE selected)
RESET_ENERGY_NO:
RST
ENER
no (blinking)
ENTER
RESET_MM_NO:
RST
DMD
no (blinking)
RIGHT
RIGHT
RIGHT
RESET_ENERGY_YES:
RST
ENER
yes (blinking)
RIGHT
RESET_MM_YES:
RST
DMD
yes (blinking)
ENTER
ENTER
is password required?
is password required?
yes
yes
increment
blinking digit
DOWN
energy
no
RESET_ENTER_PW:
PASS
#### (one # blinking)
make next digit
blink
RIGHT
demand
no
ENTER
is password
correct?
ENTER
yes
reset all max &
min values
reset all max &
min values
energy
which reset?
demand
which reset?
RESET_MM_CONFIRM:
RST
DMD
DONE
no
2 sec
RESET_PW_FAIL:
PASS
####
FAIL
RESET_ENERGY_CONFIRM:
RST
ENER
DONE
2 sec.
2 sec.
to previous operating
mode screen
see page A-3
to previous operating
mode screen
see page A--3 or
this page, above
MENU
(from any
reset mode
screen)
to Main Menu
see page A-2
Electro Industries/GaugeTech
Electro Industries/GaugeTech
The Leader In Power Monitoring and Smart Grid Solutions
The Leader In Power Monitoring and Smart Grid Solutions
Doc#
E149721
A-4
A: Shark® 200-S Meter Navigation Maps
Configuration Mode Screens (Sheet 4)
See Note 1
CONFIG_MENU:
SCRL (blinking)
CT
PT
ENTER
DOWN
DOWN or
RIGHT3
toggle
scroll
setting
ENTER
MENU
ENTER
CONFIG_MENU:
CT (blinking)
PT
CNCT
DOWN
SCROLL_EDIT:
SCRL
yes or no
(choice blinking if edit)
ENTER
ENTER
CTN_EDIT:
DOWN
increment
blinking
digit
MENU
CONFIG_MENU:
PT (blinking)
CNCT
PORT
CT-N
####
(one # blinking if edit)
CTD_SHOW:
CT-D
1 or 5
RIGHT
blink
next
digit
ENTER
DOWN
increment
blinking
digit
MENU
ENTER
PTD_EDIT:
PT-N
####
(one # blinking if edit)
RIGHT
blink
next
digit
DOWN
increment
blinking
digit
PT-D
####
(one # blinking if edit)
RIGHT
blink
next
digit
PT_MULT_EDIT:
PT-S
1 or 10 or 100 or 1000
(choice blinking if edit)
DOWN
MENU
CONFIG_MENU:
CNCT (blinking)
PORT
PASS2
DOWN
DOWN2
CONNECT_EDIT:
CNCT
1 of 3 choices
(choice blinking if edit)
ENTER
MENU2
DOWN
increment
blinking
digit
ADDRESS_EDIT:
ADR
###
(one # blinking if edit)
DOWN
increment
blinking
digit
RIGHT
blink
next
digit
yes
MENU
see page A-2
PROTOCOL_EDIT:
PROT
1 of 3 choices
(choice blinking if edit)
DOWN or
RIGHT
show
next
choice
ENTER2
PASSWORD_EDIT:
PASS
#### (one # blinking)
RIGHT
blink
next
digit
SAVE_YES:
STOR
ALL?
yes (blinking)
RIGHT RIGHT
ENTER
first DOWN or RIGHT in view
access (if password required)
save new
configuration
SAVE_NO:
STOR
ALL?
no (blinking)
Electro Industries/GaugeTech
Electro Industries/GaugeTech
DOWN
CFG_ENTER_PW:
PASS
### (one # blinking)
increment
blinking
digit
reboot
ENTER
The Leader In Power Monitoring and Smart Grid Solutions
The Leader In Power Monitoring and Smart Grid Solutions
See Note 1
RIGHT
yes
blink
next
digit
ENTER
SAVE_CONFIRM:
STOR
ALL
DONE
2 sec.
MENU
DOWN or
RIGHT
show
next
choice
PROT choices:
MOD RTU,
MOD ASCI,
DNP
Notes:
1. Initial access is view-only. View access shows the existing settings. At the
first attempt to change a setting (DOWN or RIGHT pressed), password is
requested (if enabled) and access changes to edit. Edit access blinks the digit
or list choice eligible for change and lights the PRG LED.
2. Skip over password edit screen and menu selection if access is view-only
or if password is disabled.
3. Scroll setting may be changed with view or edit access.
4. ENTER accepts an edit; MENU abandons it.
MENU
(per row of the originating screen)
MENU
to Main Menu
ENTER
BAUD_EDIT:
BAUD
##.#
(choice blinking if edit)
ENTER
CONFIG_MENU screen
scrolls through 6 choices,
showing 3 at a time. The
top choice is always the
"active" one, indicated by
blinking the legend.
no
ENTER
ENTER
CONFIG_MENU:
PASS2 (blinking)
SCRL
CT
any changes?
CNCT choices:
3 EL WYE,
2 CT DEL,
2.5EL WYE
DOWN or
RIGHT
show
next
choice
MENU
CONFIG_MENU:
PORT (blinking)
PASS2
SCRL
DOWN or
RIGHT
show
next
choice
ENTER
ENTER
ENTER
DOWN or
RIGHT
show
next
choice
ENTER
ENTER
PTN_EDIT:
DOWN
CT_MULT_EDIT:
CT-S
1 or 10 or 100
(choice blinking if edit)
is password
correct?
no
to the originating
EDIT screen
to previous operating
mode screen
see page A-3 or A-4
Doc#
E149721
A-5
A: Shark® 200-S Meter Navigation Maps
This page intentionally left blank.
Electro Industries/GaugeTech
Electro Industries/GaugeTech
The Leader In Power Monitoring and Smart Grid Solutions
The Leader In Power Monitoring and Smart Grid Solutions
Doc#
E149721
A-6
B: Modbus Map and Retrieving Logs
B: Modbus Map and Retrieving Logs
B.1: Introduction
The Modbus Map for the Shark® 200S meter gives details and information about the
possible readings of the meter and its programming. The Shark® 200S meter can be
programmed using the buttons on the face of the meter (Chapter 7), or by using
software (Chapter 5).
B.2: Modbus Register Map Sections
The Shark® 200S meter's Modbus Register map includes the following sections:
Fixed Data Section, Registers 1- 47, details the meter's Fixed Information.
Meter Data Section, Registers 1000 - 12031, details the meter's Readings, including
Primary Readings, Energy Block, Demand Block, Phase Angle Block, Status Block,
Minimum and Maximum in Regular and Time Stamp Blocks, and Accumulators.
Operating mode readings are described in Section 7.2.6.
Commands Section, Registers 20000 - 26011, details the meter's Resets Block,
Programming Block, Other Commands Block and Encryption Block.
Programmable Settings Section, Registers 30000 - 33575, details all the setups you
can program to configure your meter.
Secondary Readings Section, Registers 40001 - 40100, details the meter's Secondary
Readings.
Log Retrieval Section, Registers 49997 - 51127, details log and retrieval. See Section
B.5 for instructions on retrieving logs.
B.3: Data Formats
ASCII:
ASCII characters packed 2 per register in high,
low order and without any termination characters
SINT16/UINT16:
Electro Industries/GaugeTech
Electro Industries/GaugeTech
16-bit signed/unsigned integer
The Leader In Power Monitoring and Smart Grid Solutions
The Leader In Power Monitoring and Smart Grid Solutions
Doc#
E149721
B-1
B: Modbus Map and Retrieving Logs
SINT32/UINT32:
32-bit signed/unsigned integer spanning 2
registers - the lower-addressed register is the
high order half
FLOAT:
32-bit IEEE floating point number spanning 2
registers - the lower-addressed register is the
high order half (i.e., contains the exponent)
B.4: Floating Point Values
Floating Point Values are represented in the following format:
Register
0
Byte
1
0
1
7
6
5
4
3
2
1
0
7
6
Meaning
s
e
e
e
e
e
e
e
e
m m m m m m m m m m m m m m m m m m m m m m m
exponent
4
3
2
1
0
7
6
5
1
Bit
sign
5
0
4
3
2
1
0
7
6
5
4
3
2
1
0
mantissa
The formula to interpret a Floating Point Value is:
-1sign x 2 exponent-127 x 1.mantissa = 0x0C4E11DB9
-1sign x 2 137-127 x 1· 1000010001110110111001
-1 x 210 x 1.75871956
-1800.929
Register
0x0C4E1
Byte
0x01DB9
0x0C4
Bit
Meaning
0x01D
0x0B9v
7
6
5
4
3
2
1
0
7
6
5
4
3
2
1
0
7
6
5
4
3
2
1
0
7
6
5
4
3
2
1
0
1
1
0
0
0
1
0
0
1
1
1
0
0
0
0
1
0
0
0
1
1
1
0
1
1
0
1
1
1
0
0
1
s
e
e
e
e
e
e
e
e
m m m m m m m
m
m m m m m m m m m m m m m m m
sign
1
0x0E1
exponent
mantissa
0x089 + 137
0b011000010001110110111001
Formula Explanation:
C4E11DB9 (hex)
11000100 11100001 00011101 10111001
(binary)
Electro Industries/GaugeTech
Electro Industries/GaugeTech
The Leader In Power Monitoring and Smart Grid Solutions
The Leader In Power Monitoring and Smart Grid Solutions
Doc#
E149721
B-2
B: Modbus Map and Retrieving Logs
The sign of the mantissa (and therefore the number) is 1, which represents a
negative value.
The Exponent is 10001001 (binary) or 137 decimal.
The Exponent is a value in excess 127. So, the Exponent value is 10.
The Mantissa is 11000010001110110111001 binary.
With the implied leading 1, the Mantissa is (1).611DB9 (hex).
The Floating Point Representation is therefore -1.75871956 times 2 to the 10.
Decimal equivalent: -1800.929
NOTES:
• Exponent = the whole number before the decimal point.
• Mantissa = the positive fraction after the decimal point.
B.5: Retrieving Logs Using the Shark® 200S Meter's Modbus Map
This section describes the log interface system of the Shark® 200S meter from a
programming point of view. It is intended for programmers implementing independent drivers for log retrieval from the meter. It describes the meaning of the meter's
Modbus Registers related to log retrieval and conversion, and details the procedure
for retrieving a log's records.
NOTES:
• All references assume the use of Modbus function codes 0x03, 0x06, and 0x10,
where each register is a 2 byte MSB (Most Significant Byte) word, except where
otherwise noted.
• The carat symbol (^) notation is used to indicate mathematical "power." For
example, 2^8 means 28; which is 2 x 2 x 2 x 2 x 2 x 2 x 2 x 2, which equals 256.
Electro Industries/GaugeTech
Electro Industries/GaugeTech
The Leader In Power Monitoring and Smart Grid Solutions
The Leader In Power Monitoring and Smart Grid Solutions
Doc#
E149721
B-3
B: Modbus Map and Retrieving Logs
B.5.1: Data Formats
Time stamp: Stores a date from 2000 to 2099. Time stamp has a Minimum resolution
of 1 second.
Byte
0
1
2
3
4
5
Value
Year
Month
Day
Hour
Minute
Second
Range
0-99 (+2000)
1-12
1-31
0-23
0-59
0-59
Mask
0x7F
0x0F
0x1F
0x1F
0x3F
0x3F
The high bits of each time stamp byte are used as flags to record meter state
information at the time of the time stamp. These bits should be masked out, unless
needed.
B.5.2: Shark® 200S Meter Logs
The Shark® 200S meter has 5 logs: System Event, Alarm (Limits), and 3 Historical
logs. Each log is described below.
1. System Event (0): The System Event log is used to store events which happen in,
and to, the meter. Events include Startup, Reset Commands, Log Retrievals, etc.
The System Event Log Record takes 20 bytes, 14 bytes of which are available when
the log is retrieved.
Byte
0
1
2
Value
timestamp
3
4
5
6
7
8
9
10
11
12
13
Group
Event
Mod
Chan
Param1
Param2
Param3
Param4
NOTE: The complete Systems Events table is shown in Section B.5.5, step 1, on page
B-19.
2. Alarm Log (1): The Alarm Log records the states of the 8 Limits programmed in
the meter.
• Whenever a limit goes out (above or below), a record is stored with the value
that caused the limit to go out.
• Whenever a limit returns within limit, a record is stored with the "most out of
limit" value for that limit while it was out of limit.
Electro Industries/GaugeTech
Electro Industries/GaugeTech
The Leader In Power Monitoring and Smart Grid Solutions
The Leader In Power Monitoring and Smart Grid Solutions
Doc#
E149721
B-4
B: Modbus Map and Retrieving Logs
The Alarm Log Record uses 16 bytes, 10 bytes of which are available when the log is
retrieved.
Byte
0
1
2
Value
timestamp
3
4
5
6
7
8
9
direction
limit#
Value%
The limit # byte is broken into a type and an ID.
Bit
0
1
Value
type
0
2
3
0
0
4
5
6
7
0
Limit ID
3. Historical Log 1 (2): The Historical Log records the values of its assigned registers at the programmed interval.
NOTE: See Section B.5.3, Number 1, for details on programming and interpreting the
log.
Byte
0
1
2
Value
timestamp
3
4
5
6
-
-
N
values . . .
4. Historical Log 2 (3): Same as Historical Log 1.
5. Historical Log 3 (4): Same as Historical Log 1.
B.5.3: Block Definitions
This section describes the Modbus Registers involved in retrieving and interpreting a
Shark® 200S Meter Log. Other sections refer to certain 'values' contained in this section. See the corresponding value in this section for details.
NOTES:
• “Register” is the Modbus Register Address in 0-based Hexadecimal notation. To
convert it to 1-based decimal notation, convert from hex16 to decimal10 and add
1. For example: 0x03E7 = 1000.
• “Size” is the number of Modbus Registers (2 byte) in a block of data.
Historical Log Programmable Settings:
Electro Industries/GaugeTech
Electro Industries/GaugeTech
The Leader In Power Monitoring and Smart Grid Solutions
The Leader In Power Monitoring and Smart Grid Solutions
Doc#
E149721
B-5
B: Modbus Map and Retrieving Logs
The Historical Logs are programmed using a list of Modbus Registers that will be copied into the Historical Log record. In other words, Historical Log uses a direct copy of
the Modbus Registers to control what is recorded at the time of record capture.
To supplement this, the programmable settings for the Historical Logs contain a list of
descriptors, which group registers into items. Each item descriptor lists the data type
of the item, and the number of bytes for that item. By combining these two lists, the
Historical Log record can be interpreted.
For example: Registers 0x03E7 and 0x03E8 are programmed to be recorded by the
historical log. The matching descriptor gives the data type as float, and the size as 4
bytes. These registers program the log to record "Primary Readings Volts A-N."
Historical Log Blocks:
Start Register:
0x7917 (Historical Log 1)
0x79D7 (Historical Log 2)
0x7A97 (Historical Log 3)
Block Size:
192 registers per log (384 bytes)
The Historical Log programmable settings are comprised of 3 blocks, one for each log.
Each is identical to the others, so only Historical Log 1 is described here. All register
addresses in this section are given as the Historical Log 1 address (0x7917).
Each Historical Log Block is composed of 3 sections: The header, the list of registers to
log, and the list of item descriptors.
Header:
Registers:
0x7917 - 0x7918
Size:
2 registers
Byte
0
1
Value
# Registers
# Sectors
Electro Industries/GaugeTech
Electro Industries/GaugeTech
The Leader In Power Monitoring and Smart Grid Solutions
The Leader In Power Monitoring and Smart Grid Solutions
2
Doc#
3
Interval
E149721
B-6
B: Modbus Map and Retrieving Logs
• # Registers: The number of registers to log in the record. The size of the record in
memory is [12 + (# Registers x 2)]. The size during normal log retrieval is [6 + (#
Registers x 2)]. If this value is 0, the log is disabled. Valid values are {0-117}.
• # Sectors: The number of Flash Sectors allocated to this log. Each sector is 64kb,
minus a sector header of 20 bytes. 15 sectors are available for allocation between
Historical Logs 1, 2, and 3. The sum of all Historical Logs may be less than 15. If
this value is 0, the log is disabled. Valid values are {0-15}.
• Interval: The interval at which the Historical Log's Records are captured. This value
is an enumeration:
0x01
1 minute
0x02
3 minute
0x04
5 minute
0x08
10 minute
0x10
15 minute
0x20
30 minute
0x40
60 minute
Register List:
Registers:
0x7919 - 0x798D
Size:
1 register per list item, 117 list items
The Register List controls what Modbus Registers are recorded in each record of the
Historical Log. Since many items, such as Voltage, Energy, etc., take up more than 1
register, multiple registers need to be listed to record those items.
For example: Registers 0x03E7 and 0x03E8 are programmed to be recorded by the
historical log. These registers program the log to record "Primary Readings Volts A-N."
• Each unused register item should be set to 0x0000 or 0xFFFF to indicate that it
should be ignored.
Electro Industries/GaugeTech
Electro Industries/GaugeTech
The Leader In Power Monitoring and Smart Grid Solutions
The Leader In Power Monitoring and Smart Grid Solutions
Doc#
E149721
B-7
B: Modbus Map and Retrieving Logs
• The actual size of the record, and the number of items in the register list which are
used, is determined by the # registers in the header.
• Each register item is the Modbus Address in the range of 0x0000 to 0xFFFF.
Item Descriptor List:
Registers:
0x798E - 0x79C8
Size:
1 byte per item, 117 bytes (59 registers)
While the Register List describes what to log, the Item Descriptor List describes how
to interpret that information. Each descriptor describes a group of register items, and
what they mean.
Each descriptor is composed of 2 parts:
• Type: The data type of this descriptor, such as signed integer, IEEE floating point,
etc. This is the high nibble of the descriptor byte, with a value in the range of 0-14.
If this value is 0xFF, the descriptor should be ignored.
0
ASCII: An ASCII string, or byte array
1
Bitmap: A collection of bit flags
2
Signed Integer: A 2's Complement integer
3
Float: An IEEE floating point
4
Energy: Special Signed Integer, where the value
is adjusted by the energy settings in the meter's
Programmable Settings.
5
Unsigned Integer
6
Signed Integer 0.1 scale: Special Signed Integer,
where the value is divided by 10 to give a 0.1
scale.
7-14
Unused
15
Disabled: used as end list marker.
Electro Industries/GaugeTech
Electro Industries/GaugeTech
The Leader In Power Monitoring and Smart Grid Solutions
The Leader In Power Monitoring and Smart Grid Solutions
Doc#
E149721
B-8
B: Modbus Map and Retrieving Logs
• Size: The size in bytes of the item described. This number is used to determine the
pairing of descriptors with register items.
For example: If the first descriptor is 4 bytes, and the second descriptor is 2 bytes,
then the first 2 register items belong to the 1st descriptor, and the 3rd register item
belongs to the 2nd descriptor.
NOTE: As can be seen from the example, above, there is not a 1-to-1 relation
between the register list and the descriptor list. A single descriptor may refer to
multiple register items.
Register Items
Descriptors
0x03C7/
0x03C8
Float, 4 byte
0x1234
Signed Int, 2 byte
NOTE: The sum of all descriptor sizes must equal the number of bytes in the data
portion of the Historical Log record.
Log Status Block:
The Log Status Block describes the current status of the log in question. There is one
header block for each of the logs. Each log's header has the following base address:
Log
Base Address
Alarms:
0xC737
System:
0xC747
Historical 1:
0xC757
Historical 2:
0xC767
Historical 3:
0xC777
Bytes
Value
Type
Range
# Bytes
0-3
Max Records
UINT32
0 to 4,294,967,294
4
4-7
Number of Records Used
UINT32
1 to 4,294,967,294
4
Electro Industries/GaugeTech
Electro Industries/GaugeTech
The Leader In Power Monitoring and Smart Grid Solutions
The Leader In Power Monitoring and Smart Grid Solutions
Doc#
E149721
B-9
B: Modbus Map and Retrieving Logs
8-9
Record Size in Bytes
UINT16
4 to 250
2
10-11
Log Availability
UINT16
12-17
Timestamp, First Record
TSTAMP
1Jan2000 - 31Dec2099
6
18-23
Timestamp, Last Record
TSTAMP
1Jan2000 - 31Dec2099
6
24-31
Reserved
2
8
• Max Records: The maximum number of records the log can hold given the record
size, and sector allocation. The data type is an unsigned integer from 0 - 2^32.
• Records Used: The number of records stored in the log. This number will equal the
Max Records when the log has filled. This value will be set to 1 when the log is
reset. The data type is an unsigned integer from 1 - 2^32.
NOTE: The first record in every log before it has rolled over is a "dummy" record,
filled with all 0xFF's. When the log is filled and rolls over, this record is overwritten.
• Record Size: The number of bytes in this record, including the timestamp. The data
type is an unsigned integer in the range of 14 - 242.
• Log Availability: A flag indicating if the log is available for retrieval, or if it is in use
by another port.
0
Log Available for retrieval
1
In use by COM1 (IrDA)
2
In use by COM2 (RS485)
0xFFFF
Log Not Available - the log cannot be retrieved.
This indicates that the log is disabled.
NOTE: To query the port by which you are currently connected, use the Port ID
register:
Register:
0x1193
Size:
1 register
Electro Industries/GaugeTech
Electro Industries/GaugeTech
The Leader In Power Monitoring and Smart Grid Solutions
The Leader In Power Monitoring and Smart Grid Solutions
Doc#
E149721
B - 10
B: Modbus Map and Retrieving Logs
Description: A value from 1-4, which enumerates the port that the requestor is
currently connected on.
NOTES:
• When Log Retrieval is engaged, the Log Availability value will be set to the port
that engaged the log. The Log Availability value will stay the same until either
the log has been disengaged, or 5 minutes have passed with no activity. It will
then reset to 0 (available).
• Each log can only be retrieved by one port at a time.
• Only one log at a time can be retrieved.
• First Timestamp: Timestamp of the oldest record.
• Last Timestamp: Timestamp of the newest record.
Log Retrieval Block:
The Log Retrieval Block is the main interface for retrieving logs. It is comprised of 2
parts: the header and the window. The header is used to program the particular data
the meter presents when a log window is requested. The window is a sliding block of
data that can be used to access any record in the specified log.
Session Com Port: The Shark® 200S meter's Com Port which is currently retrieving
logs. Only one Com Port can retrieve logs at any one time.
Registers:
0xC34E - 0xC34E
Size:
1 register
0
No Session Active
1
COM1 (IrDA)
2
COM2 (RS-485)
To get the current Com Port, see the NOTE on querying the port, on the previous
page.
Electro Industries/GaugeTech
Electro Industries/GaugeTech
The Leader In Power Monitoring and Smart Grid Solutions
The Leader In Power Monitoring and Smart Grid Solutions
Doc#
E149721
B - 11
B: Modbus Map and Retrieving Logs
Log Retrieval Header:
The Log Retrieval Header is used to program the log to be retrieved, the record(s) of
that log to be accessed, and other settings concerning the log retrieval.
Registers:
0xC34F - 0xC350
Size:
2 registers
Bytes
Value
Type
Format
Description
# Bytes
0-1
Log Number,
Enable,
Scope
UINT16
nnnnnnnn esssssss
nnnnnnnn log to
retrieve,
e - retrieval
session
enable
sssssss retrieval
mode
2
2-3
Records per
Window,
Number of
Repeats
UINT16
wwwwwwww nnnnnnnn
wwwwwwww records per
window,
nnnnnnnn repeat count
2
• Log Number: The log to be retrieved. Write this value to set which log is being
retrieved.
0
System Events
1
Alarms
2
Historical Log 1
3
Historical Log 2
4
Historical Log 3
Electro Industries/GaugeTech
Electro Industries/GaugeTech
The Leader In Power Monitoring and Smart Grid Solutions
The Leader In Power Monitoring and Smart Grid Solutions
Doc#
E149721
B - 12
B: Modbus Map and Retrieving Logs
• Enable: This value sets if a log retrieval session is engaged (locked for retrieval) or
disengaged (unlocked, read for another to engage). Write this value with 1(enable)
to begin log retrieval. Write this value with 0(disable) to end log retrieval.
0
Disable
1
Enable
• Scope: Sets the amount of data to be retrieved for each record. The default should
be 0 (normal).
0
Normal
1
Timestamp Only
2
Image
• Normal [0]: The default record. Contains a 6-byte timestamp at the beginning,
then N data bytes for the record data.
• Timestamp [1]: The record only contains the 6-byte timestamp. This is most
useful to determine a range of available data for non-interval based logs, such
as Alarms and System Events.
• Image [2]: The full record, as it is stored in memory. Contains a 2-byte checksum, 4-byte sequence number, 6-byte timestamp, and then N data bytes for the
record data.
• Records Per Window: The number of records that fit evenly into a window. This
value is set-able, as less than a full window may be used. This number tells the
retrieving program how many records to expect to find in the window.
(RecPerWindow x RecSize) = #bytes used in the window.
This value should be ((123 x 2) \ recSize), rounded down.
For example, with a record size of 30, the RecPerWindow = ((123 x 2) \ 30) = 8.2
~= 8
Electro Industries/GaugeTech
Electro Industries/GaugeTech
The Leader In Power Monitoring and Smart Grid Solutions
The Leader In Power Monitoring and Smart Grid Solutions
Doc#
E149721
B - 13
B: Modbus Map and Retrieving Logs
• Number of Repeats: Specifies the number of repeats to use for the Modbus Function Code 0x23 (35). Since the meter must pre-build the response to each log window request, this value must be set once, and each request must use the same
repeat count. Upon reading the last register in the specified window, the record
index will increment by the number of repeats, if auto-increment is enabled. Section B.5.4.2 has additional information on Function Code 0x23.
0
Disables auto-increment
1
No Repeat count, each request will only get 1
window.
2-8
2-8 windows returned for each Function Code
0x23 request.
Bytes
Value
Type
Format
Description
# Bytes
0-3
Offset of
First Record
in Window
UINT32
ssssssss nnnnnnnn
nnnnnnnn nnnnnnnn
ssssssss window status nn…nn 24-bit record
index number.
4
4-249
Log Retrieve
Window
UINT16
246
Log Retrieval Window Block:
The Log Retrieval Window block is used to program the data you want to retrieve from
the log. It also provides the interface used to retrieve that data.
Registers:
0xC351 - 0xC3CD
Size:
125 registers
• Window Status: The status of the current window. Since the time to prepare a window may exceed an acceptable modbus delay (1 second), this acts as a state flag,
signifying when the window is ready for retrieval. When this value indicates that
the window is not ready, the data in the window should be ignored. Window Status
is Read-only, any writes are ignored.
Electro Industries/GaugeTech
Electro Industries/GaugeTech
The Leader In Power Monitoring and Smart Grid Solutions
The Leader In Power Monitoring and Smart Grid Solutions
Doc#
E149721
B - 14
B: Modbus Map and Retrieving Logs
0
Window is Ready
0xFF
Window is Not Ready
• Record Number: The record number of the first record in the data window. Setting
this value controls which records will be available in the data window.
• When the log is engaged, the first (oldest) record is "latched." This means that
record number 0 will always point to the oldest record at the time of latching,
until the log is disengaged (unlocked).
• To retrieve the entire log using auto-increment, set this value to 0, and retrieve
the window repeatedly, until all records have been retrieved.
NOTES:
• When auto-increment is enabled, this value will automatically increment
so that the window will "page" through the records, increasing by
RecordsPerWindow each time that the last register in the window is read.
• When auto-increment is not enabled, this value must be written-to
manually, for each window to be retrieved.
• Log Retrieval Data Window: The actual data of the records, arranged according to
the above settings.
B.5.4: Log Retrieval
Log Retrieval is accomplished in 3 basic steps:
1. Engage the log.
2. Retrieve each of the records.
3. Disengage the log.
B.5.4.1: Auto-Increment
In EIG's traditional Modbus retrieval system, you write the index of the block of data
to retrieve, then read that data from a buffer (window). To improve the speed of
retrieval, the index can be automatically incremented each time the buffer is read.
Electro Industries/GaugeTech
Electro Industries/GaugeTech
The Leader In Power Monitoring and Smart Grid Solutions
The Leader In Power Monitoring and Smart Grid Solutions
Doc#
E149721
B - 15
B: Modbus Map and Retrieving Logs
In the Shark® 200S meter, when the last register in the data window is read, the
record index is incremented by the Records per Window.
B.5.4.2: Modbus Function Code 0x23
QUERY
Field Name
Example (Hex)
Slave Address
01
Function
23
Starting Address Hi
C3
Starting Address Lo
51
# Points Hi
00
# Points Lo
7D
Repeat Count
04
RESPONSE
Field Name
Example (Hex)
Slave Address
01
Function
23
# Bytes Hi
03
# Bytes Lo
E0
Data
...
Function Code 0x23 is a user defined Modbus function code, which has a format similar to Function Code 0x03, except for the inclusion of a "repeat count." The repeat
count (RC) is used to indicate that the same N registers should be read RC number of
times. (See the Number of Repeats bullet on page B-14.)
Electro Industries/GaugeTech
Electro Industries/GaugeTech
The Leader In Power Monitoring and Smart Grid Solutions
The Leader In Power Monitoring and Smart Grid Solutions
Doc#
E149721
B - 16
B: Modbus Map and Retrieving Logs
NOTES:
• By itself this feature would not provide any advantage, as the same data will be
returned RC times. However, when used with auto-incrementing, this function condenses up to 8 requests into 1 request, which decreases communication time, as
fewer transactions are being made.
• Keep in mind that the contents of the response data is the block of data you
requested, repeated N times. For example, when retrieving log windows, you
normally request both the window index, and the window data. This means that the
first couple of bytes of every repeated block will contain the index of that
window.
• In the Shark® 200S meter repeat counts are limited to 8 times for Modbus RTU,
and 4 times for Modbus ASCII.
The response for Function Code 0x23 is the same as for Function Code 0x03, with the
data blocks in sequence.
IMPORTANT! Before using Function Code 0x23, always check to see if the current
connection supports it. Some relay devices do not support user defined function
codes; if that is the case, the message will stall. Other devices don't support 8 repeat
counts.
B.5.4.3: Log Retrieval Procedure
The following procedure documents how to retrieve a single log from the oldest record
to the newest record, using the "normal" record type (see Scope). All logs are
retrieved using the same method. See Section B.5.4.4 for a Log Retrieval example.
NOTES:
• This example uses auto-increment.
• In this example, Function Code 0x23 is not used.
• You will find referenced topics in Section B.5.3. Block Definitions.
• Modbus Register numbers are listed in brackets.
1. Engage the Log:
Electro Industries/GaugeTech
Electro Industries/GaugeTech
The Leader In Power Monitoring and Smart Grid Solutions
The Leader In Power Monitoring and Smart Grid Solutions
Doc#
E149721
B - 17
B: Modbus Map and Retrieving Logs
a. Read the Log Status Block.
i.. Read the contents of the specific logs' status block [0xC737+, 16
reg] (see Log Headers).
ii. Store the # of Records Used, the Record Size, and the Log Availability.
iii. If the Log Availability is not 0, stop Log Retrieval; this log is not
available at this time. If Log Availability is 0, proceed to step 1b
(Engage the log).
This step is done to ensure that the log is available for retrieval, as well as
retrieving information for later use.
b. Engage the log: write log to engage to Log Number, 1 to Enable, and the desired
mode to Scope (default 0 (Normal)) [0xC34F, 1 reg]. This is best done as a
single-register write.
This step will latch the first (oldest) record to index 0, and lock the log so that
only this port can retrieve the log, until it is disengaged.
c. Verify the log is engaged: read the contents of the specific logs' status block
[0xC737+, 16 reg] again to see if the log is engaged for the current port (see
Log Availability). If the Log is not engaged for the current port, repeat step 1b
(Engage the log).
d. Write the retrieval information.
i. Compute the number of records per window, as follows:
RecordsPerWindow = (246 \ RecordSize)
• If using 0x23, set the repeat count to 2-8. Otherwise, set it to 1.
• Since we are starting from the beginning for retrieval, the first
record index is 0.
ii. Write the Records per window, the Number of repeats (1), and
Record Index (0) [0xC350, 3 reg].
Electro Industries/GaugeTech
Electro Industries/GaugeTech
The Leader In Power Monitoring and Smart Grid Solutions
The Leader In Power Monitoring and Smart Grid Solutions
Doc#
E149721
B - 18
B: Modbus Map and Retrieving Logs
This step tells the Shark® 200S meter what data to return in the window.
2. Retrieve the records:
a. Read the record index and window: read the record index, and the data window
[0xC351, 125 reg].
• If the meter Returns a Slave Busy Exception, repeat the request.
• If the Window Status is 0xFF, repeat the request.
• If the Window Status is 0, go to step 2b (Verify record index).
NOTES:
• We read the index and window in 1 request to minimize communication
time, and to ensure that the record index matches the data in the data
window returned.
• Space in the window after the last specified record (RecordSize x RecordPerWindow) is padded with 0xFF, and can be safely discarded.
b. Verify that the record index incremented by Records Per Window. The record
index of the retrieved window is the index of the first record in the window. This
value will increase by Records Per Window each time the window is read, so it
should be 0, N, N x 2, N x 3 . . . for each window retrieved.
• If the record index matches the expected record index, go to step 2c
(Compute next expected record index).
• If the record index does not match the expected record index, then go to
step 1d (Write the retrieval information), where the record index will be
the same as the expected record index. This will tell the Shark® 200S
meter to repeat the records you were expecting.
c. Compute next Expected Record Index.
• If there are no remaining records after the current record window, go to
step 3 (Disengage the log).
Electro Industries/GaugeTech
Electro Industries/GaugeTech
The Leader In Power Monitoring and Smart Grid Solutions
The Leader In Power Monitoring and Smart Grid Solutions
Doc#
E149721
B - 19
B: Modbus Map and Retrieving Logs
• Compute the next expected record index by adding Records Per Window,
to the current expected record index. If this value is greater than the
number of records, re-size the window so it only contains the remaining
records and go to step 1d (Write the retrieval information), where the
Records Per Window will be the same as the remaining records.
3. Disengage the log: write the Log Number (of log being disengaged) to the Log
Index and 0 to the Enable bit [0xC34F, 1 reg].
B.5.4.4: Log Retrieval Example
The following example illustrates a log retrieval session. The example makes the
following assumptions:
• Log Retrieved is Historical Log 1 (Log Index 2).
• Auto-Incrementing is used.
• Function Code 0x23 is not used (Repeat Count of 1).
• The Log contains Volts-AN, Volts-BN, Volts-CN (12 bytes).
• 100 Records are available (0-99).
• COM Port 2 (RS485) is being used (see Log Availability).
• There are no Errors.
• Retrieval is starting at Record Index 0 (oldest record).
• Protocol used is Modbus RTU. The checksum is left off for simplicity.
• The Shark® 200S meter is at device address 1.
• No new records are recorded to the log during the log retrieval process.
Electro Industries/GaugeTech
Electro Industries/GaugeTech
The Leader In Power Monitoring and Smart Grid Solutions
The Leader In Power Monitoring and Smart Grid Solutions
Doc#
E149721
B - 20
B: Modbus Map and Retrieving Logs
1. Read [0xC757, 16 reg], Historical Log 1 Header Block.
Send:
0103 C757 0010
Command:
Register Address:
0xC757
# Registers:
16
--------------------------------------------------Receive:
010320 00000100 00000064 0012 0000
060717101511 060718101511
0000000000000000
Data:
Max Records:
0x100 = 256 records maximum.
Num Records:
0x64 = 100 records currently logged.
Record Size:
0x12 = 18 bytes per record.
Log Availability:
0x00 = 0, not in use, available for retrieval.
First Timestamp:
0x060717101511 = July 23, 2006, 16:21:17
Last Timestamp:
0x060717101511 = July 24, 2006, 16:21:17
NOTE: This indicates that Historical Log 1 is available for retrieval.
2. Write 0x0280 -> [0xC34F, 1 reg], Log Enable.
Send:
0106 C34F 0280
Command:
Register Address:
0xC34F
# Registers:
1 (Write Single Register Command)
Data:
Log Number:
Electro Industries/GaugeTech
Electro Industries/GaugeTech
2 (Historical Log 1)
The Leader In Power Monitoring and Smart Grid Solutions
The Leader In Power Monitoring and Smart Grid Solutions
Doc#
E149721
B - 21
B: Modbus Map and Retrieving Logs
Enable:
1 (Engage log)
Scope:
0 (Normal Mode)
--------------------------------------------------Receive:
0106C34F0280 (echo)
NOTE: This engages the log for use on this COM Port, and latches the oldest record as
record index 0.
3. Read [0xC757, 16 reg], Availability is 0.
Send:
0103 C757 0010
Command:
Register Address:
0xC757
# Registers:
16
--------------------------------------------------Receive:
010320 00000100 00000064 0012 0002
060717101511 060718101511
0000000000000000
Data:
Max Records:
0x100 = 256 records maximum.
Num Records:
0x64 = 100 records currently logged.
Record Size:
0x12 = 18 bytes per record.
Log Availability:
0x02 = 2, In use by COM2, RS485 (the current
port)
First Timestamp:
0x060717101511 = July 23, 2006, 16:21:17
Last Timestamp:
0x060717101511 = July 24, 2006, 16:21:17
NOTE: This indicates that the log has been engaged properly in step 2. Proceed to
retrieve the log.
Electro Industries/GaugeTech
Electro Industries/GaugeTech
The Leader In Power Monitoring and Smart Grid Solutions
The Leader In Power Monitoring and Smart Grid Solutions
Doc#
E149721
B - 22
B: Modbus Map and Retrieving Logs
4. Compute #RecPerWin as (246\18)=13. Write 0x0D01 0000 0000 -> [0xC350, 3
reg] Write Retrieval Info. Set Current Index as 0.
Send:
0110 C350 0003 06 0D01 00 000000
Command:
Register Address:
0xC350
# Registers:
3, 6 bytes
Data:
Records per Window:
13. Since the window is 246 bytes, and the record
is 18 bytes, 246\18 = 13.66, which means that
13 records evenly fit into a single window. This is
234 bytes, which means later on, we only need to
read 234 bytes (117 registers) of the window to
retrieve the records.
# of Repeats:
1. We are using auto-increment (so not 0), but
not function code 0x23.
Window Status:
0 (ignore)
Record Index:
0, start at the first record.
---------------------------------------------------Receive:
0110C3500003 (command ok)
NOTES:
• This sets up the window for retrieval; now we can start retrieving the records.
• As noted above, we compute the records per window as 246\18 = 13.66, which is
rounded to 13 records per window. This allows the minimum number of requests to
be made to the meter, which increases retrieval speed.
Electro Industries/GaugeTech
Electro Industries/GaugeTech
The Leader In Power Monitoring and Smart Grid Solutions
The Leader In Power Monitoring and Smart Grid Solutions
Doc#
E149721
B - 23
B: Modbus Map and Retrieving Logs
5. Read [0xC351, 125 reg], first 2 reg is status/index, last 123 reg is window data.
Status OK.
Send:
0103 C351 007D
Command:
Register Address:
0xC351
# Registers:
0x7D, 125 registers
--------------------------------------------------Receive:
0103FA 00000000
060717101511FFFFFFFFFFFFFFFFFFFFFFFF
06071710160042FAAACF42FAAD1842FAA9A8 . . .
Data:
Window Status:
0x00 = the window is ready.
Index:
0x00 = 0, The window starts with the 0'th record,
which is the oldest record.
Record 0:
The next 18 bytes is the 0'th record (filler).
Timestamp:
0x060717101511, = July 23, 2006, 16:21:17
Data:
This record is the "filler" record. It is used by the
meter so that there is never 0 records. It should
be ignored. It can be identified by the data being
all 0xFF.
NOTE: Once a log has rolled over, the 0'th record
will be a valid record, and the filler record will
disappear.
Record 1:
The next 18 bytes is the 1'st record.
Timestamp:
0x060717101600 July 23, 2006, 16:22:00
Data:
Volts AN:
0x42FAAACF, float = 125.33~
Volts BN:
0x42FAAD18, float = 125.33~
Electro Industries/GaugeTech
Electro Industries/GaugeTech
The Leader In Power Monitoring and Smart Grid Solutions
The Leader In Power Monitoring and Smart Grid Solutions
Doc#
E149721
B - 24
B: Modbus Map and Retrieving Logs
Volts CN:
0x42FAA9A8, float = 125.33~
. . . 13 records
NOTES:
• This retrieves the actual window. Repeat this command as many times as necessary
to retrieve all of the records when auto-increment is enabled.
• Note the filler record. When a log is reset (cleared) in the meter, the meter always
adds a first "filler" record, so that there is always at least 1 record in the log. This
"filler" record can be identified by the data being all 0xFF, and it being index 0. If a
record has all 0xFF for data, the timestamp is valid, and the index is NOT 0, then
the record is legitimate.
• When the "filler" record is logged, its timestamp may not be "on the interval." The
next record taken will be on the next "proper interval," adjusted to the hour. For
example, if the interval is 1 minute, the first "real" record will be taken on the next
minute (no seconds). If the interval is 15 minutes, the next record will be taken at
:15, :30, :45, or :00 - whichever of those values is next in sequence.
6. Compare the index with Current Index.
NOTES:
• The Current Index is 0 at this point, and the record index retrieved in step 5 is 0:
thus we go to step 8.
• If the Current Index and the record index do not match, go to step 7. The data that
was received in the window may be invalid, and should be discarded.
7. Write the Current Index to [0xC351, 2 reg].
Send:
0110 C351 0002 04 00 00000D
Command:
Register Address:
0xC351
# Registers:
2, 4 bytes
Data:
Electro Industries/GaugeTech
Electro Industries/GaugeTech
The Leader In Power Monitoring and Smart Grid Solutions
The Leader In Power Monitoring and Smart Grid Solutions
Doc#
E149721
B - 25
B: Modbus Map and Retrieving Logs
Window Status:
0 (ignore)
Record Index:
0x0D = 13, start at the 14th record.
---------------------------------------------------Receive:
0110C3510002 (command ok)
NOTES:
• This step manually sets the record index, and is primarily used when an out-oforder record index is returned on a read (step 6).
• The example assumes that the second window retrieval failed somehow, and we
need to recover by requesting the records starting at index 13 again.
8. For each record in the retrieved window, copy and save the data for later interpretation.
9. Increment Current Index by RecordsPerWindow.
NOTES:
• This is the step that determines how much more of the log we need to retrieve.
• On the first N passes, Records Per Window should be 13 (as computed in step 4),
and the current index should be a multiple of that (0, 13, 26, . . .). This amount will
decrease when we reach the end (see step 10).
• If the current index is greater than or equal to the number of records (in this case
100), then all records have been retrieved; go to step 12. Otherwise, go to step 10
to check if we are nearing the end of the records.
10. If number records - current index < RecordsPerWindow, decrease to match.
NOTES:
• Here we bounds-check the current index, so we don't exceed the records available.
• If the number of remaining records (#records - current index) is less than the
Records per Window, then the next window is the last, and contains less than a full
window of records. Make records per window equal to remaining records
Electro Industries/GaugeTech
Electro Industries/GaugeTech
The Leader In Power Monitoring and Smart Grid Solutions
The Leader In Power Monitoring and Smart Grid Solutions
Doc#
E149721
B - 26
B: Modbus Map and Retrieving Logs
(#records-current index). In this example, this occurs when current index is 91
(the 8'th window). There are now 9 records available (100-91), so make Records
per Window equal 9.
11. Repeat steps 5 through 10.
NOTES:
• Go back to step 5, where a couple of values have changed.
Pass
CurIndex
FirstRecIndex
RecPerWindow
0
0
0
13
1
13
13
13
2
26
26
13
3
39
39
13
4
52
52
13
5
65
65
13
6
78
78
13
7
91
91
9
8
100
------
-------
• At pass 8, since Current Index is equal to the number of records (100), log retrieval
should stop; go to step 12 (see step 9 Notes).
12. No more records available, clean up.
Electro Industries/GaugeTech
Electro Industries/GaugeTech
The Leader In Power Monitoring and Smart Grid Solutions
The Leader In Power Monitoring and Smart Grid Solutions
Doc#
E149721
B - 27
B: Modbus Map and Retrieving Logs
13. Write 0x0000 -> [0xC34F, 1 reg], disengage the log.
Send:
0106 C34F 0000
Command:
Register Address:
0xC34F
# Registers:
1 (Write Single Register Command)
Data:
Log Number:
0 (ignore)
Enable:
0 (Disengage log)
Scope:
0 (ignore)
---------------------------------------------------Receive:
0106C34F0000 (echo)
NOTES:
• This disengages the log, allowing it to be retrieved by other COM ports.
• The log will automatically disengage if no log retrieval action is taken for 5 minutes.
Electro Industries/GaugeTech
Electro Industries/GaugeTech
The Leader In Power Monitoring and Smart Grid Solutions
The Leader In Power Monitoring and Smart Grid Solutions
Doc#
E149721
B - 28
B: Modbus Map and Retrieving Logs
B.5.5: Log Record Interpretation
The records of each log are composed of a 6 byte timestamp, and N data. The content
of the data portion depends on the log.
System Event Record:
Byte
0
1
2
Value
timestamp
3
4
5
6
7
8
9
10
11
12
13
Group
Event
Mod
Chan
Param1
Param2
Param3
Param4
Size: 14 bytes (20 bytes image).
Data: The System Event data is 8 bytes; each byte is an enumerated value.
• Group: Group of the event.
• Event: Event within a group.
• Modifier: Additional information about the event, such as number of sectors or log
number.
• Channel: The port of the Shark® 200S meter that caused the event.
0
Firmware
1
COM 1 (IrDA)
2
COM 2 (RS485)
7
User (Face Plate)
Electro Industries/GaugeTech
Electro Industries/GaugeTech
The Leader In Power Monitoring and Smart Grid Solutions
The Leader In Power Monitoring and Smart Grid Solutions
Doc#
E149721
B - 29
B: Modbus Map and Retrieving Logs
Param 1-4: These are defined for each event (see following table).
NOTE: The System Log Record is 20 bytes, consisting of the Record Header (12
bytes) and Payload (8 bytes). The Timestamp (6 bytes) is in the header. Typically,
software will retrieve only the timestamp and payload, yielding a 14-byte record. The
table below shows all defined payloads.
Group
(Event
group)
Event
(Event
within
group)
Mod
(Event
modifier)
Channel
(1-2 for
COMs, 7
for USER,
0 for FW)
Parm1
Parm2
Parm3
Parm4
0
Comments
Startup
0
0
0
FW version
Meter Run
Firmware
Startup
1
Log Activity
1
log#
1-4
0xFF
0xFF
0xFF
0xFF
Reset
2
log#
1-4
0xFF
0xFF
0xFF
0xFF
Log Retrieval
Begin
3
log#
0-4
0xFF
0xFF
0xFF
0xFF
Log Retrieval
End
2
Clock Activity
1
0
1-4
0xFF
0xFF
0xFF
0xFF
Clock Changed
2
0
0
0xFF
0xFF
0xFF
0xFF
Daylight Time
On
3
0
0
0xFF
0xFF
0xFF
0xFF
Daylight Time
Off
4
sync
method
0
0xFF
0xFF
0xFF
0xFF
Auto Clock
Sync Failed
5
sync
method
0
0xFF
0xFF
0xFF
0xFF
Auto Clock
Sync Resumed
3
System Resets
1
0
0-4, 7
0xFF
0xFF
0xFF
0xFF
Max & Min
Reset
2
0
0-4, 7
0xFF
0xFF
0xFF
0xFF
Energy Reset
3
slot#
0-4
1
(inputs)
or 2
(outputs)
0xFF
0xFF
0xFF
Accumulators
Reset
Electro Industries/GaugeTech
Electro Industries/GaugeTech
The Leader In Power Monitoring and Smart Grid Solutions
The Leader In Power Monitoring and Smart Grid Solutions
Doc#
E149721
B - 30
B: Modbus Map and Retrieving Logs
4
Settings
Activity
1
0
1-4, 7
0xFF
0xFF
0xFF
0xFF
Password
Changed
2
0
1-4
0xFF
0xFF
0xFF
0xFF
V-switch
Changed
3
0
1-4, 7
0xFF
0xFF
0xFF
0xFF
Programmable Settings
Changed
4
0
1-4, 7
0xFF
0xFF
0xFF
0xFF
Measurement
Stopped
5
Boot Activity
1
0
1-4
FW version
Exit to Boot
6
Error Reporting & Recovery
4
log #
0
0xFF
0xFF
0xFF
0xFF
Log Babbling
Detected
5
log #
0
# records
discarded
time in seconds
Babbling Log
Periodic
Summary
6
log #
0
# records
discarded
time in seconds
Log Babbling
End Detected
7
sector#
0
error count
stimulus
0xFF
Flash Sector
Error
8
0
0
0xFF
0xFF
0xFF
0xFF
Flash Error
Counters
Reset
9
0
0
0xFF
0xFF
0xFF
0xFF
Flash Job
Queue
Overflow
10
1
0
0xFF
0Xff
0xFF
0xFF
Bad NTP
Configuration
1
sector#
0
log #
0xFF
0xFF
0xFF
acquire sector
2
sector#
0
log #
0xFF
0xFF
0xFF
release sector
3
sector#
0
erase count
4
log#
0
0xFF
0x88
erase sector
0xFF
0xFF
0xFF
write log start
record
• log# values: 0 = system log, 1 = alarms log, 2-4 = historical logs 1-3, 5 = I/O
change log
Electro Industries/GaugeTech
Electro Industries/GaugeTech
The Leader In Power Monitoring and Smart Grid Solutions
The Leader In Power Monitoring and Smart Grid Solutions
Doc#
E149721
B - 31
B: Modbus Map and Retrieving Logs
• sector# values: 0-63
• slot# values: 1-2
NOTES:
• The clock changed event shows the clock value just before the change in the Mod
and Parm bytes. Parms are bit-mapped:
• b31 - b28
month
• b27 - b23
day
• b22
daylight savings time flag
• b20 - b16
hour
• b13 - b8
minute
• b5 - b0
second
• unused bits are always 0
• Sync method: 1 = NTP.
• Stimulus for a flash sector error indicates what the flash was doing when the error
occurred: 1 = acquire sector, 2 = startup, 3 = empty sector, 4 = release sector, 5 =
write data.
• Flash error counters are reset to zero in the unlikely event that both copies in
EEPROM are corrupted.
• The flash job queue is flushed (and log records are lost) in the unlikely event that
the queue runs out of space.
• A "babbling log" is one that is saving records faster than the meter can handle long
term. When babbling is detected, the log is frozen and no records are appended
until babbling ceases. For as long as babbling persists, a summary of records
discarded is logged every 60 minutes. Normal logging resumes when there have
been no new append attempts for 30 seconds. Onset of babbling occurs when a log
fills a flash sector in less than an hour (applies only to Alarm, I/O Change, Histori-
Electro Industries/GaugeTech
Electro Industries/GaugeTech
The Leader In Power Monitoring and Smart Grid Solutions
The Leader In Power Monitoring and Smart Grid Solutions
Doc#
E149721
B - 32
B: Modbus Map and Retrieving Logs
cal, and Power Quality logs) or when a log grows so far beyond its normal bounds
that it is in danger of crashing the system. This applies to all logs except the System log, which does not babble. While possible for the other logs during an
extended log retrieval session, it is extremely unlikely to occur.
• Logging of diagnostic records may be suppressed via a bit in programmable
settings.
Alarm Record:
Byte
0
1
2
Value
timestamp
3
4
5
6
7
8
9
direction
limit#
Value%
Size: 10 bytes (16 bytes image)
Data: The Alarm record data is 4 bytes, and specifies which limit the event occurred
on, and the direction of the event (going out of limit, or coming back into limit).
• Direction: The direction of the alarm event: whether this record indicates the limit
going out, or coming back into limit.
1
Going out of limit
2
Coming back into limit
Bit
0
1
Value
type
0
2
0
3
0
4
5
6
0
Limit ID
7
• Limit Type: Each limit (1-8) has both an above condition and a below condition.
Limit Type indicates which of those the record represents.
0
High Limit
1
Low Limit
• Limit ID: The specific limit this record represents. A value in the range 0-7, Limit ID
represents Limits 1-8. The specific details for this limit are stored in the programmable settings.
• Value: Depends on the Direction:
Electro Industries/GaugeTech
Electro Industries/GaugeTech
The Leader In Power Monitoring and Smart Grid Solutions
The Leader In Power Monitoring and Smart Grid Solutions
Doc#
E149721
B - 33
B: Modbus Map and Retrieving Logs
•
If the record is "Going out of limit," this is the value of the limit when the "Out"
condition occurred.
• If the record is "Coming back into limit," this is the "worst" value of the limit during the period of being "out": for High (above) limits, this is the highest value
during the "out" period; for Low (below) limits, this is the lowest value during
the “out" period.
Byte
0
Value
Identifier
1
2
3
Above Setpoint
4
5
6
Above Hyst.
7
Below Setpoint
8
9
Below Hyst.
Interpretation of Alarm Data:
To interpret the data from the alarm records, you need the limit data from the
Programmable Settings [0x754B, 40 registers].
There are 8 limits, each with an Above Setpoint, and a Below Setpoint. Each setpoint
also has a threshold (hysteresis), which is the value at which the limit returns "into"
limit after the setpoint has been exceeded. This prevents "babbling" limits, which can
be caused by the limit value fluttering over the setpoint, causing it to go in and out of
limit continuously.
• Identifier: The first modbus register of the value that is being watched by this limit.
While any modbus register is valid, only values that can have a Full Scale will be
used by the Shark® 200S meter.
• Above Setpoint: The percent of the Full Scale above which the value for this limit
will be considered "out."
• Valid in the range of -200.0% to +200.0%
• Stored as an integer with 0.1 resolution. (Multiply % by 10 to get the integer,
divide integer by 10 to get %. For example, 105.2% = 1052.)
• Above Hysteresis: The percent of the Full Scale below which the limit will return
"into" limit, if it is out. If this value is above the Above Setpoint, this Above limit will
be disabled.
• Valid in the range of -200.0% to +200.0%.
Electro Industries/GaugeTech
Electro Industries/GaugeTech
The Leader In Power Monitoring and Smart Grid Solutions
The Leader In Power Monitoring and Smart Grid Solutions
Doc#
E149721
B - 34
B: Modbus Map and Retrieving Logs
• Stored as an integer with 0.1 resolution. (Multiply % by 10 to get the integer,
divide integer by 10 to get %. For example, 104.1% = 1041.)
• Below Setpoint: The percent of the Full Scale below which the value for this limit
will be considered "out."
• Valid in the range of -200.0% to +200.0%.
• Stored as an integer with 0.1 resolution. (Multiply % by 10 to get the integer,
divide integer by 10 to get %. For example, 93.5% = 935.)
• Below Hysteresis: The percent of the Full Scale above which the limit will return
"into" limit, if it is out. If this value is below the Below Setpoint, this Below limit will
be disabled.
• Valid in the range of -200.0% to +200.0%.
• Stored as an integer with 0.1 resolution. (Multiply % by 10 to get the integer,
divide integer by 10 to get %. For example, 94.9% = 949.)
NOTES:
• The Full Scale is the "nominal" value for each of the different types of readings. To
compute the Full Scale, use the following formulas:
Current
[CT Numerator] x [CT Multiplier]
Voltage
[PT Numerator] x [PT Multiplier]
Power 3-Phase (WYE)
[CT Numerator] x [CT Multiplier] x [PT Numerator] x [PT Multiplier] x 3
Power 3-Phase (Delta)
[CT Numerator] x [CT Multiplier] x [PT Numerator] x [PT Multiplier] x 3 x sqrt(3)
Power Single Phase (WYE)
[CT Numerator] x [CT Multiplier] x [PT Numerator] x [PT Multiplier]
Power Single Phase (Delta)
[CT Numerator] x [CT Multiplier] x [PT Numerator] x [PT Multiplier] x sqrt(3)
Frequency (Calibrated at 60 Hz) 60
Electro Industries/GaugeTech
Electro Industries/GaugeTech
The Leader In Power Monitoring and Smart Grid Solutions
The Leader In Power Monitoring and Smart Grid Solutions
Doc#
E149721
B - 35
B: Modbus Map and Retrieving Logs
Frequency (Calibrated at 50 Hz) 50
Power Factor
1.0
Angles
180°
• To interpret a limit alarm fully, you need both the start and end record (for duration).
• There are a few special conditions related to limits:
• When the meter powers up, it detects limits from scratch. This means that
multiple "out of limit" records can be in sequence with no "into limit" records.
Cross- reference the System Events for Power Up events.
• This also means that if a limit is "out," and it goes back in during the
power off condition, no "into limit" record will be recorded.
• The "worst" value of the "into limit" record follows the above restrictions;
it only represents the values since power up. Any values before the power
up condition are lost.
Historical Log Record:
Byte
0
1
2
Value
timestamp
3
4
5
6
-
-
N
values . . .
Size: 6+2 x N bytes (12+2 x N bytes), where N is the number of registers stored.
Data: The Historical Log Record data is 2 x N bytes, which contains snapshots of the
values of the associated registers at the time the record was taken. Since the meter
uses specific registers to log, with no knowledge of the data it contains, the Programmable Settings need to be used to interpret the data in the record. See Historical Logs
Programmable Settings for details.
Electro Industries/GaugeTech
Electro Industries/GaugeTech
The Leader In Power Monitoring and Smart Grid Solutions
The Leader In Power Monitoring and Smart Grid Solutions
Doc#
E149721
B - 36
B: Modbus Map and Retrieving Logs
B.5.6: Examples
Log Retrieval Section:
send:
recv:
01 03 75 40 00 08 - Meter designation
01 03 10 4D 65 74 72 65 44 65 73 69 6E 67 5F 20 20 20 20 00 00
send:
recv:
:01 03 C7 57 00 10 - Historical Log 1 status block
:01 03 20 00 00 05 1E 00 00 05 1E 00 2C 00 00 06 08 17 51 08
00 06 08 18 4E 39 00 00 00 00 00 00 00 00 00 00 00
send:
recv:
:01
:01
42
67
00
00
00
00
03
03
1F
18
00
00
00
00
79
80
43
68
00
00
00
00
17
13
1F
18
00
00
00
00
00
01
44
69
00
00
00
00
40
00
06
00
00
00
00
00
- Historical Log 1 PS settings
01 23 75 23 76 23 77 1F 3F 1F 40
0B 06 0C 06 0D 06 0E 17 75 17 76
00 00 00 00 00 00 00 00 00 00 00
00 00 00 00 00 00 00 00 00 00 00
00 00 00 00 00 00 00 00 00 00 00
00 00 00 00 00 00 00 00 00 00 00
00 00 00 00 00 00 00
1F
17
00
00
00
00
41
77
00
00
00
00
1F
18
00
00
00
00
send:
recv:
:01
:01
00
00
00
00
00
44
03
03
00
00
00
00
00
62
79
80
00
00
00
00
00
62
57
00
00
00
00
00
00
62
00
00
00
00
00
00
00
62
40
00
00
00
00
00
00
62
- ""
00 00
00 00
00 00
00 00
00 00
00 00
62 00
00
00
00
00
00
34
00
00
00
00
00
34
00
00
00
00
00
44
send:
recv:
:01 03 75 35 00 01 - Energy PS settings
:01 03 02 83 31 00 00
send:
recv:
:01 03 11 93 00 01 - Connected Port ID
:01 03 02 00 02 00 00
send:
recv:
:01 03 C7 57 00 10 - Historical Log 1 status block
:01 03 20 00 00 05 1E 00 00 05 1E 00 2C 00 00 06 08 17 51 08
00 06 08 18 4E 39 00 00 00 00 00 00 00 00 00 00 00
send:
recv:
:01 03 C3 4F 00 01 - Log Retrieval header
:01 03 02 FF FF 00 00
send:
recv:
:01 10 C3 4F 00 04 08 02 80 05 01 00 00 00 00 - Engage the log
:01 10 C3 4F 00 04
send:
recv:
:01 03 C7 57 00 10 - Historical Log 1 status block
:01 03 20 00 00 05 1E 00 00 05 1E 00 2C 00 02 06 08 17 51 08
00 06 08 18 4E 39 00 00 00 00 00 00 00 00 00 00 00
Electro Industries/GaugeTech
Electro Industries/GaugeTech
The Leader In Power Monitoring and Smart Grid Solutions
The Leader In Power Monitoring and Smart Grid Solutions
00
00
00
00
00
00
00
00
00
00
00
00
00
00
Doc#
00
00
00
00
00
00
00
00
00
00
00
00
00
00
00
00
00
00
00
00
00
00
00
00
00
00
62
E149721
00
00
00
00
00
62
00
00
00
00
00
62
00
00
00
00
00
34
B - 37
B: Modbus Map and Retrieving Logs
send:
recv:
:01 10 C3 51 00 02 04 00 00 00 00 - Set the retrieval index
:01 10 C3 51 00 02
send:
recv:
:01
:01
00
E8
2F
00
00
00
03
03
00
00
27
00
00
00
C3
80
00
01
0F
00
19
00
51
00
00
00
00
03
00
00
00
00
00
05
00
E8
2F
00
40
00
00
00
00
00
27
00
- Read first half
00 06 08 17 51 08
00 00 00 00 00 00
00 00 00 00 00 06
00 00 00 00 00 00
01 00 04 00 00 00
0F 00 00 00 00 00
00 03 E8 00 00 00
window
00 19 00
00 00 00
17 51 09
00 00 00
00 00 06
00 00 00
2F
00
00
00
08
00
27
00
00
00
17
00
0F
00
19
00
51
00
00
03
00
00
0A
00
send:
recv:
:01
:01
2F
00
00
00
00
03
03
27
00
00
00
C3
60
0F
00
19
00
91
00
00
03
00
00
00
05
00
E8
2F
00
30
00
00
00
27
00
- Read second half of window
00 00 00 00 00 06 08 17 51 0B
00 00 00 00 00 00 00 00 00 00
01 00 04 00 00 00 00 00 00 06
0F 00 00 00 00 00 00 00 00 00
00 03 E8 00 01 00 04 00 00 00
00
00
08
00
00
00
00
17
00
00
19
00
51
00
00
00
00
0C
00
00
send:
recv:
:01
:01
00
E8
2F
00
00
00
03
03
00
00
27
00
00
00
C3
80
00
01
0F
00
19
00
51
00
00
00
00
03
00
00
00
00
00
04
00
E8
2F
00
40
05
00
00
00
00
27
00
- Read first half
19 06 08 18 4E 35
00 00 00 00 00 00
00 00 00 00 00 06
00 00 00 00 00 00
01 00 04 00 00 00
0F 00 00 00 00 00
00 03 E8 00 00 00
last window
00 19 00 2F
00 00 00 00
18 4E 36 00
00 00 00 00
00 00 06 08
00 00 00 00
27
00
00
00
18
00
0F
00
19
00
4E
00
00
03
00
00
37
00
send:
recv:
:01
:01
2F
00
00
00
00
03
03
27
00
00
00
C3
60
0F
00
19
00
91
00
00
03
00
00
00
05
00
E8
2F
00
30
00
00
00
27
00
- Read second half of last
00 00 00 00 00 06 08 18 4E
00 00 00 00 00 00 00 00 00
01 00 04 00 00 00 00 00 00
0F 00 00 00 00 00 00 00 00
00 03 E8 00 00 00 05 00 00
window
38 00 00
00 00 00
06 08 18
00 00 00
00 00 00
19
00
4E
00
00
00
00
39
00
00
send:
recv:
:01 06 C3 4F 00 00 - Disengage the log
:01 06 C3 4F 00 00
Electro Industries/GaugeTech
Electro Industries/GaugeTech
The Leader In Power Monitoring and Smart Grid Solutions
The Leader In Power Monitoring and Smart Grid Solutions
Doc#
of
00
00
08
00
00
00
00
of
00
00
08
00
00
00
00
E149721
B - 38
B: Modbus Map and Retrieving Logs
Sample Historical Log 1 Record:
Historical Log 1 Record and Programmable Settings
13|01|00
1F 42|1F
17 76|17
62 62 62
01|23
43 1F
77|18
34 34
These are the
Item Values:
75|23
44|06
67|18
34 44
76|23
0B 06
68|18
44 62
77|1F
0C|06
69|00
62 62
These are the
Type and Size:
1F 40|1F 41
06 0E|17 75|
. . . . . .
62 62 . . .
These are the Descriptions:
13
01
01
23
23
23
1F
1F
1F
06
06
3F
0D
00
62
- # registers
- # sectors
- interval
75
76
77
3F
41
43
0B
0D
1F
1F
1F
06
06
40
42
44
0C
0E
6
6
6
3
3
3
4
4
2
2
2
4
4
4
4
4
-
(SINT 2 byte) Volts A THD Maximum
(SINT 2 byte) Volts B THD Maximum
(SINT 2 byte) Volts C THD Maximum
(Float 4 byte) Volts A Minimum
(Float 4 byte) Volts B Minimum
(Float 4 byte) Volts C Minimum
(Energy 4 byte) VARhr Negative Phase A
(Energy 4 byte) VARhr Negative Phase B
17 75
6 2
- (SINT 2 byte) Volts A 1st Harmonic
Magnitude
17 76
6 2
- (SINT 2 byte) Volts A 2nd Harmonic
Magnitude
17 77
6 2
- (SINT 2 byte) Volts A 3rd Harmonic
Magnitude
18 67
6 2
- (SINT 2 byte) Ib 3rd Harmonic Magnitude
18 68
6 2
- (SINT 2 byte) Ib 4th Harmonic Magnitude
18 69
6 2
- (SINT 2 byte) Ib 5th Harmonic Magnitude
Sample Record
06 08 17 51 08 00|00 19|00 2F|27 0F|00 00 00 00|00
00 00 00|00 00 00 00|00 00 00 00|00 00 00 00|03 E8|
00 01|00 05|00 00|00 00|00 00 . . .
11
00
00
27
00
00
00
00
00
08
19
2F
0F
00
00
00
00
00
17 51 08 00
00
00
00
00
00
00
00
00
00
00
Electro Industries/GaugeTech
Electro Industries/GaugeTech
-
August 23, 2011 17:08:00
2.5%
4.7%
999.9% (indicates the value isn’t valid)
0
0
0
0
0
The Leader In Power Monitoring and Smart Grid Solutions
The Leader In Power Monitoring and Smart Grid Solutions
Doc#
E149721
B - 39
B: Modbus Map and Retrieving Logs
03
00
00
00
00
00
E8
01
05
00
00
00
-
100.0% (Fundamental)
0.1%
0.5%
0.0%
0.0%
0.0%
B.6: Important Note Concerning the Shark ® 200S Meter's Modbus
Map
In depicting Modbus Registers (Addresses), the Shark® 200S meter's Modbus map
uses Holding Registers only.
B.6.1: Hex Representation
The representation shown in the table below is used by developers of Modbus drivers
and libraries, SEL 2020/2030 programmers and Firmware Developers. The Shark ®
meter's Modbus map also uses this representation.
Hex
Description
0008 - 000F
Meter Serial Number
B.6.2: Decimal Representation
The Shark ® meter's Modbus map defines Holding Registers as (4X) registers. Many
popular SCADA and HMI packages and their Modbus drivers have user interfaces that
require users to enter these Registers starting at 40001. So instead of entering two
separate values, one for register type and one for the actual register, they have been
combined into one number.
The Shark ® 200S meter's Modbus map uses a shorthand version to depict the decimal fields, i.e., not all of the digits required for entry into the SCADA package UI are
shown. For example:
You need to display the meter's serial number in your SCADA application. The Shark®
200S meter's Modbus map shows the following information for meter serial number:
Decimal
Description
9 - 16
Meter Serial Number
In order to retrieve the meter's serial number, enter 40009 into the SCADA UI as the
starting register, and 8 as the number of registers.
Electro Industries/GaugeTech
Electro Industries/GaugeTech
The Leader In Power Monitoring and Smart Grid Solutions
The Leader In Power Monitoring and Smart Grid Solutions
Doc#
E149721
B - 40
B: Modbus Map and Retrieving Logs
• In order to work with SCADA and Driver packages that use the 40001 to 49999
method for requesting holding registers, take 40000 and add the value of the register (Address) in the decimal column of the Modbus Map. Then enter the number
(e.g., 4009) into the UI as the starting register.
• For SCADA and Driver packages that use the 400001 to 465536 method for
requesting holding registers take 400000 and add the value of the register
(Address) in the decimal column of the Modbus Map. Then enter the number (e.g.,
400009) into the UI as the starting register. The drivers for these packages strip off
the leading four and subtract 1 from the remaining value. This final value is used as
the starting register or register to be included when building the actual modbus
message.
B.7: Modbus Register Map (MM-1 to MM-15)
The Shark® 200S meter's Modbus Register map begins on the following page.
Electro Industries/GaugeTech
Electro Industries/GaugeTech
The Leader In Power Monitoring and Smart Grid Solutions
The Leader In Power Monitoring and Smart Grid Solutions
Doc#
E149721
B - 41
B: Modbus Map and Retrieving Logs
This page intentionally left blank.
Electro Industries/GaugeTech
Electro Industries/GaugeTech
The Leader In Power Monitoring and Smart Grid Solutions
The Leader In Power Monitoring and Smart Grid Solutions
Doc#
E149721
B - 42
$
(
Decimal
Hex
(
($
(&
((
)
)
)
)
)
)$
)&
)(
$
&
(
$
&
Description (Note 1)
Decimal
Description (Note 1)
9ROWV$1
9ROWV%1
9ROWV&1
9ROWV$%
9ROWV%&
9ROWV&$
$PSV$
$PSV%
$PSV&
:DWWV3KWRWDO
9$5V3KWRWDO
9$V3KWRWDO
3RZHU)DFWRU3KWRWDO
)UHTXHQF\
1HXWUDO&XUUHQW
:DWWV3KDVH$
:DWWV3KDVH%
:DWWV3KDVH&
9$5V3KDVH$
9$5V3KDVH%
9$5V3KDVH&
9$V3KDVH$
9$V3KDVH%
9$V3KDVH&
3RZHU)DFWRU3KDVH$
3RZHU)DFWRU3KDVH%
3RZHU)DFWRU3KDVH&
5HVHUYHG
$6,&9HUVLRQ
%RRW)LUPZDUH9HUVLRQ
5HVHUYHG
5HVHUYHG
0HWHU7\SH1DPH
5HVHUYHG
5HVHUYHG
)LUPZDUH9HUVLRQ
0DS9HUVLRQ
0HWHU&RQILJXUDWLRQ
0HWHU1DPH
0HWHU6HULDO1XPEHU
0HWHU7\SH
Range (Note 6)
WR0
WR0
WR0
WR0
WR0
WR0
WR0
WR0
WR0
0WR0
0WR0
0WR0
WR
WR
WR0
0WR0
0WR0
0WR0
0WR0
0WR0
0WR0
0WR0
0WR0
0WR0
WR
WR
WR
Doc# E149721
Format
)/2$7
)/2$7
)/2$7
)/2$7
)/2$7
)/2$7
)/2$7
)/2$7
)/2$7
)/2$7
)/2$7
)/2$7
)/2$7
)/2$7
)/2$7
)/2$7
)/2$7
)/2$7
)/2$7
)/2$7
)/2$7
)/2$7
)/2$7
)/2$7
)/2$7
)/2$7
)/2$7
QRQH
QRQH
QRQH
QRQH
QRQH
FFFIIIIII
Units or Resolution
QRQH
QRQH
VWYYY
Units or Resolution
YROWV
YROWV
YROWV
YROWV
YROWV
YROWV
DPSV
DPSV
DPSV
ZDWWV
9$5V
9$V
QRQH
+]
DPSV
ZDWWV
ZDWWV
ZDWWV
9$5V
9$5V
9$5V
9$V
9$V
9$V
QRQH
QRQH
QRQH
Meter Data Section (Note 2)
FKDU
$6&,,
FKDU
WR
ELWPDSSHG
FKDU
Fixed Data Section
Range (Note 6)
FKDU
FKDU
ELWPDSSHG
8,17
$6&,,
$6&,,
8,17
8,17
Format
$6&,,
$6&,,
8,17
The Leader In Power Monitoring and Smart Grid Solutions
Electro Industries/GaugeTech
(
(
(%
('
()
)
)
)
)
)
)%
)'
))
%
'
)
%
'
Primary Readings Block
'
(
Hex
)
Identification Block
Modbus Address
5HVHUYHG
%ORFN6L]H
read-only
Comments
Comments
3HUSKDVHSRZHUDQG3)KDYHYDOXHV
RQO\IRU:<(KRRNXSDQGZLOOEH
]HURIRUDOORWKHUKRRNXSV
W V YYY 9VZLWFK
9 VWDQGDUG6
FFF &7GHQRPLQDWRURU
IIIIII FDOLEUDWLRQIUHTXHQF\RU
5HVHUYHG
5HVHUYHG
%ORFN6L]H
read-only
B: Modbus Map and Retrieving Logs
MM-1
# Reg
# Reg
(
(
(
(
(
($
(&
((
)
)
)
)
)
)$
)&
)(
$
&
(
$
&
(
')
(
(
(
(
(
(%
('
()
)
)
)
)
)
)%
)'
))
%
'
)
%
'
)
:KRXUV1HW3KDVH$
:KRXUV1HW3KDVH%
:KRXUV1HW3KDVH&
:KRXUV7RWDO3KDVH$
:KRXUV7RWDO3KDVH%
:KRXUV7RWDO3KDVH&
9$5KRXUV3RVLWLYH3KDVH$
9$5KRXUV3RVLWLYH3KDVH%
9$5KRXUV3RVLWLYH3KDVH&
9$5KRXUV1HJDWLYH3KDVH$
9$5KRXUV1HJDWLYH3KDVH%
9$5KRXUV1HJDWLYH3KDVH&
9$5KRXUV1HW3KDVH$
9$5KRXUV1HW3KDVH%
9$5KRXUV1HW3KDVH&
9$5KRXUV7RWDO3KDVH$
9$5KRXUV7RWDO3KDVH%
9$5KRXUV7RWDO3KDVH&
9$KRXUV3KDVH$
9$KRXUV3KDVH%
9$KRXUV3KDVH&
:KRXUV'HOLYHUHG3KDVH&
:KRXUV'HOLYHUHG3KDVH%
:KRXUV'HOLYHUHG3KDVH$
:KRXUV5HFHLYHG3KDVH&
:KRXUV5HFHLYHG3KDVH%
:KRXUV1HW
:KRXUV7RWDO
9$5KRXUV3RVLWLYH
9$5KRXUV1HJDWLYH
9$5KRXUV1HW
9$5KRXUV7RWDO
9$KRXUV7RWDO
:KRXUV5HFHLYHG3KDVH$
:KRXUV'HOLYHUHG
Decimal
Description (Note 1)
:KRXUV5HFHLYHG
Range (Note 6)
WRRU
WR
WRRU
WR
WR
WR
WR
WR
WR
WR
WR
WRRU
WR
WRRU
WR
WRRU
WR
WRRU
WR
WRRU
WR
WRRU
WR
WR
WR
WR
WR
WR
WR
WR
WR
WR
WR
WR
WR
WR
WR
WR
WR
WR
WR
WR
WR
WR
Doc# E149721
6,17
6,17
6,17
6,17
6,17
6,17
6,17
6,17
6,17
6,17
6,17
6,17
6,17
6,17
6,17
6,17
6,17
6,17
6,17
6,17
6,17
6,17
6,17
6,17
6,17
6,17
6,17
6,17
6,17
6,17
6,17
6,17
6,17
6,17
6,17
Format
6,17
The Leader In Power Monitoring and Smart Grid Solutions
Electro Industries/GaugeTech
'(
''
Hex
'&
Primary Energy Block
'%
:KSHUHQHUJ\IRUPDW
:KSHUHQHUJ\IRUPDW
:KSHUHQHUJ\IRUPDW
:KSHUHQHUJ\IRUPDW
:KSHUHQHUJ\IRUPDW
:KSHUHQHUJ\IRUPDW
9$5KSHUHQHUJ\IRUPDW
9$5KSHUHQHUJ\IRUPDW
9$5KSHUHQHUJ\IRUPDW
9$5KSHUHQHUJ\IRUPDW
9$5KSHUHQHUJ\IRUPDW
9$5KSHUHQHUJ\IRUPDW
9$5KSHUHQHUJ\IRUPDW
9$5KSHUHQHUJ\IRUPDW
9$5KSHUHQHUJ\IRUPDW
9$5KSHUHQHUJ\IRUPDW
9$5KSHUHQHUJ\IRUPDW
9$5KSHUHQHUJ\IRUPDW
9$KSHUHQHUJ\IRUPDW
9$KSHUHQHUJ\IRUPDW
9$KSHUHQHUJ\IRUPDW
:KSHUHQHUJ\IRUPDW
:KSHUHQHUJ\IRUPDW
:KSHUHQHUJ\IRUPDW
:KSHUHQHUJ\IRUPDW
:KSHUHQHUJ\IRUPDW
:KSHUHQHUJ\IRUPDW
:KSHUHQHUJ\IRUPDW
9$5KSHUHQHUJ\IRUPDW
9$5KSHUHQHUJ\IRUPDW
9$5KSHUHQHUJ\IRUPDW
9$5KSHUHQHUJ\IRUPDW
9$KSHUHQHUJ\IRUPDW
:KSHUHQHUJ\IRUPDW
:KSHUHQHUJ\IRUPDW
Units or Resolution
:KSHUHQHUJ\IRUPDW
Comments
:KUHFHLYHGGHOLYHUHGDOZD\VKDYHRSSRVLWHVLJQV
%ORFN6L]H
VHHQRWH
UHVROXWLRQRIGLJLWEHIRUHGHFLPDOSRLQW XQLWVNLORRUPHJDSHUHQHUJ\IRUPDW
GHFLPDOSRLQWLPSOLHGSHUHQHUJ\IRUPDW
WRGLJLWV
:KUHFHLYHGLVSRVLWLYHIRUYLHZDVORDGGHOLYHUHGLVSRVLWLYHIRUYLHZDVJHQHUDWRU
read-only
B: Modbus Map and Retrieving Logs
MM-2
# Reg
Decimal
Description (Note 1)
$PSV$$YHUDJH
$PSV%$YHUDJH
$PSV&$YHUDJH
3RVLWLYH:DWWV3K$YHUDJH
3RVLWLYH9$5V3K$YHUDJH
1HJDWLYH:DWWV3K$YHUDJH
1HJDWLYH9$5V3K$YHUDJH
9$V3K$YHUDJH
3RVLWLYH3)3K$YHUDJH
1HJDWLYH3)3)$YHUDJH
1HXWUDO&XUUHQW$YHUDJH
3RVLWLYH:DWWV3KDVH$$YHUDJH
3RVLWLYH:DWWV3KDVH%$YHUDJH
3RVLWLYH:DWWV3KDVH&$YHUDJH
3RVLWLYH9$5V3KDVH$$YHUDJH
3RVLWLYH9$5V3KDVH%$YHUDJH
3RVLWLYH9$5V3KDVH&$YHUDJH
1HJDWLYH:DWWV3KDVH$$YHUDJH
1HJDWLYH:DWWV3KDVH%$YHUDJH
1HJDWLYH:DWWV3KDVH&$YHUDJH
1HJDWLYH9$5V3KDVH$$YHUDJH
1HJDWLYH9$5V3KDVH%$YHUDJH
1HJDWLYH9$5V3KDVH&$YHUDJH
9$V3KDVH$$YHUDJH
9$V3KDVH%$YHUDJH
9$V3KDVH&$YHUDJH
3RVLWLYH3)3KDVH$$YHUDJH
3RVLWLYH3)3KDVH%$YHUDJH
3RVLWLYH3)3KDVH&$YHUDJH
1HJDWLYH3)3KDVH$$YHUDJH
1HJDWLYH3)3KDVH%$YHUDJH
1HJDWLYH3)3KDVH&$YHUDJH
Range (Note 6)
WR0
WR0
WR0
0WR0
0WR0
0WR0
0WR0
0WR0
WR
WR
WR0
0WR0
0WR0
0WR0
0WR0
0WR0
0WR0
0WR0
0WR0
0WR0
0WR0
0WR0
0WR0
0WR0
0WR0
0WR0
WR
WR
WR
WR
WR
WR
Doc# E149721
Format
)/2$7
)/2$7
)/2$7
)/2$7
)/2$7
)/2$7
)/2$7
)/2$7
)/2$7
)/2$7
)/2$7
)/2$7
)/2$7
)/2$7
)/2$7
)/2$7
)/2$7
)/2$7
)/2$7
)/2$7
)/2$7
)/2$7
)/2$7
)/2$7
)/2$7
)/2$7
)/2$7
)/2$7
)/2$7
)/2$7
)/2$7
)/2$7
The Leader In Power Monitoring and Smart Grid Solutions
Electro Industries/GaugeTech
Hex
'
'
'
'
'
'$
'&
'(
(
(
(
(
(
($
(&
((
)
)
)
)
)
)$
)&
)(
$
&
(
Primary Demand Block
&)
'
'
'
'
'
'%
''
')
(
(
(
(
(
(%
('
()
)
)
)
)
)
)%
)'
))
%
'
Units or Resolution
DPSV
DPSV
DPSV
ZDWWV
9$5V
ZDWWV
9$5V
9$V
QRQH
QRQH
DPSV
ZDWWV
ZDWWV
ZDWWV
9$5V
9$5V
9$5V
ZDWWV
ZDWWV
ZDWWV
9$5V
9$5V
9$5V
9$V
9$V
9$V
QRQH
QRQH
QRQH
QRQH
QRQH
QRQH
%ORFN6L]H
read-only
Comments
B: Modbus Map and Retrieving Logs
MM-3
# Reg
%'&
%'(
%(
%(
%(
%(
%(
%($
%(&
%((
%)
%)
%)
%)
%)
%)$
%)&
%)(
&
&
&
&
&
&$
&&
&(
&
&
&
&
&
&$
&&
&(
%'%
%''
%')
%(
%(
%(
%(
%(
%(%
%('
%()
%)
%)
%)
%)
%)
%)%
%)'
%))
&
&
&
&
&
&%
&'
&)
&
&
&
&
&
&%
&'
:KRXUV1HW3KDVH$
:KRXUV1HW3KDVH%
:KRXUV1HW3KDVH&
:KRXUV7RWDO3KDVH$
:KRXUV7RWDO3KDVH%
:KRXUV7RWDO3KDVH&
9$5KRXUV3RVLWLYH3KDVH$
9$5KRXUV3RVLWLYH3KDVH%
9$5KRXUV3RVLWLYH3KDVH&
9$5KRXUV1HJDWLYH3KDVH$
9$5KRXUV1HJDWLYH3KDVH%
9$5KRXUV1HJDWLYH3KDVH&
9$5KRXUV1HW3KDVH$
9$5KRXUV1HW3KDVH%
9$5KRXUV1HW3KDVH&
9$5KRXUV7RWDO3KDVH$
9$5KRXUV7RWDO3KDVH%
9$5KRXUV7RWDO3KDVH&
9$KRXUV3KDVH$
9$KRXUV3KDVH%
9$KRXUV3KDVH&
:KRXUV'HOLYHUHG3KDVH&
:KRXUV'HOLYHUHG3KDVH%
:KRXUV'HOLYHUHG3KDVH$
:KRXUV5HFHLYHG3KDVH&
:KRXUV5HFHLYHG3KDVH%
:KRXUV1HW
:KRXUV7RWDO
9$5KRXUV3RVLWLYH
9$5KRXUV1HJDWLYH
9$5KRXUV1HW
9$5KRXUV7RWDO
9$KRXUV7RWDO
:KRXUV5HFHLYHG3KDVH$
:KRXUV'HOLYHUHG
Decimal
Description (Note 1)
:DWWV3KWRWDO
9$5V3KWRWDO
9$V3KWRWDO
3RZHU)DFWRU3KWRWDO
:DWWV3KDVH$
:DWWV3KDVH%
:DWWV3KDVH&
9$5V3KDVH$
9$5V3KDVH%
9$5V3KDVH&
9$V3KDVH$
9$V3KDVH%
9$V3KDVH&
3RZHU)DFWRU3KDVH$
3RZHU)DFWRU3KDVH%
3RZHU)DFWRU3KDVH&
:KRXUV5HFHLYHG
Range (Note 6)
0WR0
0WR0
0WR0
WR
0WR0
0WR0
0WR0
0WR0
0WR0
0WR0
0WR0
0WR0
0WR0
WR
WR
WR
WRRU
WR
WRRU
WR
WR
WR
WR
WR
WR
WR
WR
WRRU
WR
WRRU
WR
WRRU
WR
WRRU
WR
WRRU
WR
WRRU
WR
WR
WR
WR
WR
WR
WR
WR
WR
WR
WR
WR
WR
WR
WR
WR
WR
WR
WR
WR
WR
WR
Doc# E149721
6,17
6,17
6,17
6,17
6,17
6,17
6,17
6,17
6,17
6,17
6,17
6,17
6,17
6,17
6,17
6,17
6,17
6,17
6,17
6,17
6,17
6,17
6,17
6,17
6,17
6,17
6,17
6,17
6,17
6,17
6,17
6,17
6,17
6,17
6,17
Format
)/2$7
)/2$7
)/2$7
)/2$7
)/2$7
)/2$7
)/2$7
)/2$7
)/2$7
)/2$7
)/2$7
)/2$7
)/2$7
)/2$7
)/2$7
)/2$7
6,17
The Leader In Power Monitoring and Smart Grid Solutions
Electro Industries/GaugeTech
%'$
%'
Hex
%%
%%$
%%&
%%(
%&
%&
%&
%&
%&
%&$
%&&
%&(
%'
%'
%'
%'
%'
Uncompensated Readings Block
%%
%%
%%%
%%'
%%)
%&
%&
%&
2%&
%&
%&%
%&'
%&)
%'
%'
%'
%'
:KSHUHQHUJ\IRUPDW
:KSHUHQHUJ\IRUPDW
:KSHUHQHUJ\IRUPDW
:KSHUHQHUJ\IRUPDW
:KSHUHQHUJ\IRUPDW
:KSHUHQHUJ\IRUPDW
9$5KSHUHQHUJ\IRUPDW
9$5KSHUHQHUJ\IRUPDW
9$5KSHUHQHUJ\IRUPDW
9$5KSHUHQHUJ\IRUPDW
9$5KSHUHQHUJ\IRUPDW
9$5KSHUHQHUJ\IRUPDW
9$5KSHUHQHUJ\IRUPDW
9$5KSHUHQHUJ\IRUPDW
9$5KSHUHQHUJ\IRUPDW
9$5KSHUHQHUJ\IRUPDW
9$5KSHUHQHUJ\IRUPDW
9$5KSHUHQHUJ\IRUPDW
9$KSHUHQHUJ\IRUPDW
9$KSHUHQHUJ\IRUPDW
9$KSHUHQHUJ\IRUPDW
:KSHUHQHUJ\IRUPDW
:KSHUHQHUJ\IRUPDW
:KSHUHQHUJ\IRUPDW
:KSHUHQHUJ\IRUPDW
:KSHUHQHUJ\IRUPDW
:KSHUHQHUJ\IRUPDW
:KSHUHQHUJ\IRUPDW
9$5KSHUHQHUJ\IRUPDW
9$5KSHUHQHUJ\IRUPDW
9$5KSHUHQHUJ\IRUPDW
9$5KSHUHQHUJ\IRUPDW
9$KSHUHQHUJ\IRUPDW
:KSHUHQHUJ\IRUPDW
:KSHUHQHUJ\IRUPDW
Units or Resolution
ZDWWV
9$5V
9$V
QRQH
ZDWWV
ZDWWV
ZDWWV
9$5V
9$5V
9$5V
9$V
9$V
9$V
QRQH
QRQH
QRQH
:KSHUHQHUJ\IRUPDW
:KUHFHLYHGGHOLYHUHGDOZD\VKDYHRSSRVLWHVLJQV
3HUSKDVHSRZHUDQG3)KDYHYDOXHV
RQO\IRU:<(KRRNXSDQGZLOOEH
]HURIRUDOORWKHUKRRNXSV
Comments
VHHQRWH
UHVROXWLRQRIGLJLWEHIRUHGHFLPDOSRLQW XQLWVNLORRUPHJDSHUHQHUJ\IRUPDW
GHFLPDOSRLQWLPSOLHGSHUHQHUJ\IRUPDW
WRGLJLWV
:KUHFHLYHGLVSRVLWLYHIRUYLHZDVORDGGHOLYHUHGLVSRVLWLYHIRUYLHZDVJHQHUDWRU
%ORFN6L]H
read-only
B: Modbus Map and Retrieving Logs
MM-4
# Reg
$
'
(
)
%
(
)
Description (Note 1)
Decimal
9ROWV$1SUHYLRXV'HPDQGLQWHUYDO6KRUW7HUP0LQLPXP
9ROWV%1SUHYLRXV'HPDQGLQWHUYDO6KRUW7HUP0LQLPXP
9ROWV&1SUHYLRXV'HPDQGLQWHUYDO6KRUW7HUP0LQLPXP
9ROWV$%SUHYLRXV'HPDQGLQWHUYDO6KRUW7HUP0LQLPXP
9ROWV%&SUHYLRXV'HPDQGLQWHUYDO6KRUW7HUP0LQLPXP
9ROWV&$SUHYLRXV'HPDQGLQWHUYDO6KRUW7HUP0LQLPXP
9ROWV$16KRUW7HUP0LQLPXP
9ROWV%16KRUW7HUP0LQLPXP
9ROWV&16KRUW7HUP0LQLPXP
9ROWV$%6KRUW7HUP0LQLPXP
9ROWV%&6KRUW7HUP0LQLPXP
9ROWV&$6KRUW7HUP0LQLPXP
Range (Note 6)
WR0
WR0
WR0
WR0
WR0
WR0
WR0
WR0
WR0
WR0
WR0
WR0
WR
-DQ'HF
-DQ'HF
WR
ELWPDSSHG
Range (Note 6)
WR
ELWPDSSHG
Range (Note 6)
WR
WR
WR
WR
WR
WR
Doc# E149721
Format
)/2$7
)/2$7
)/2$7
)/2$7
)/2$7
)/2$7
)/2$7
)/2$7
)/2$7
)/2$7
)/2$7
)/2$7
8,17
767$03
767$03
8,17
8,17
Format
8,17
8,17
The Leader In Power Monitoring and Smart Grid Solutions
Electro Industries/GaugeTech
)
)
)%
)'
))
)
)
)
)
)
)%
)'
Hex
)
)$
)&
)(
)
)
)
)
)
)$
)&
)(
Description (Note 1)
7LPH6LQFH5HVHW
0HWHU2Q7LPH
&XUUHQW'DWHDQG7LPH
5HVHUYHG
&XUUHQW'D\RI:HHN
/LPLWV6WDWXV
Decimal
3RUW,'
0HWHU6WDWXV
Short term Primary Minimum Block
Hex
Status Block
Format
6,17
6,17
6,17
6,17
6,17
6,17
Units or Resolution
YROWV
YROWV
YROWV
YROWV
YROWV
YROWV
YROWV
YROWV
YROWV
YROWV
YROWV
YROWV
PVHF
VHF
VHF
GD\
Units or Resolution
QRQH
PPPSFKIIHHFFF
Units or Resolution
GHJUHH
GHJUHH
GHJUHH
GHJUHH
GHJUHH
GHJUHH
Comments
Comments
%ORFN6L]H
0LQLPXPLQVWDQWDQHRXVYDOXHPHDVXUHGGXULQJWKHPRVWUHFHQWO\FRPSOHWHGGHPDQGLQWHUYDO
0LQLPXPLQVWDQWDQHRXVYDOXHPHDVXUHGGXULQJWKHGHPDQGLQWHUYDOEHIRUHWKHRQHPRVW
UHFHQWO\FRPSOHWHG
read-only
KLJKE\WHLVVHWSW LQ RXW
ORZE\WHLVVHWSW LQ RXW
VHHQRWHV
ZUDSVDURXQGDIWHUPD[FRXQW
5HVHUYHG
6XQ 0RQHWF
%ORFN6L]H
%ORFN6L]H
Comments
,GHQWLILHVZKLFK6KDUN&20SRUWDPDVWHULVFRQQHFWHGWRIRU&20IRU&20HWF
PPP PHDVXUHPHQWVWDWH RII UXQQLQJQRUPDOO\ OLPSPRGH ZDUPXS ERRW
RWKHUVXQXVHG6HHQRWH
SFK 190(0EORFN2.IODJVS SURILOHF FDOLEUDWLRQK KHDGHUIODJLVLI2.
II IODVKVWDWH LQLWLDOL]LQJ ORJJLQJGLVDEOHGE\9VZLWFK ORJJLQJ
HH HGLWVWDWH VWDUWXS QRUPDO SULYLOHJHGFRPPDQGVHVVLRQ SURILOHXSGDWHPRGH
FFF SRUWHQDEOHGIRUHGLW QRQH &20&20 IURQWSDQHO
read-only
read-only
Description (Note 1)
%ORFN6L]H
Decimal
3KDVH$&XUUHQW
3KDVH%&XUUHQW
3KDVH&&XUUHQW
$QJOH9ROWV$%
$QJOH9ROWV%&
$QJOH9ROWV&$
Hex
Phase Angle Block
B: Modbus Map and Retrieving Logs
MM-5
# Reg
# Reg
# Reg
Decimal
Description (Note 1)
9ROWV$10LQLPXP
9ROWV%10LQLPXP
9ROWV&10LQLPXP
9ROWV$%0LQLPXP
9ROWV%&0LQLPXP
9ROWV&$0LQLPXP
$PSV$0LQLPXP$YJ'HPDQG
$PSV%0LQLPXP$YJ'HPDQG
$PSV&0LQLPXP$YJ'HPDQG
3RVLWLYH:DWWV3K0LQLPXP$YJ'HPDQG
3RVLWLYH9$5V3K0LQLPXP$YJ'HPDQG
1HJDWLYH:DWWV3K0LQLPXP$YJ'HPDQG
1HJDWLYH9$5V3K0LQLPXP$YJ'HPDQG
9$V3K0LQLPXP$YJ'HPDQG
3RVLWLYH3RZHU)DFWRU3K0LQLPXP$YJ'HPDQG
1HJDWLYH3RZHU)DFWRU3K0LQLPXP$YJ'HPDQG
)UHTXHQF\0LQLPXP
1HXWUDO&XUUHQW0LQLPXP$YJ'HPDQG
3RVLWLYH:DWWV3KDVH$0LQLPXP$YJ'HPDQG
3RVLWLYH:DWWV3KDVH%0LQLPXP$YJ'HPDQG
3RVLWLYH:DWWV3KDVH&0LQLPXP$YJ'HPDQG
3RVLWLYH9$5V3KDVH$0LQLPXP$YJ'HPDQG
3RVLWLYH9$5V3KDVH%0LQLPXP$YJ'HPDQG
3RVLWLYH9$5V3KDVH&0LQLPXP$YJ'HPDQG
1HJDWLYH:DWWV3KDVH$0LQLPXP$YJ'HPDQG
1HJDWLYH:DWWV3KDVH%0LQLPXP$YJ'HPDQG
1HJDWLYH:DWWV3KDVH&0LQLPXP$YJ'HPDQG
1HJDWLYH9$5V3KDVH$0LQLPXP$YJ'HPDQG
1HJDWLYH9$5V3KDVH%0LQLPXP$YJ'HPDQG
1HJDWLYH9$5V3KDVH&0LQLPXP$YJ'HPDQG
9$V3KDVH$0LQLPXP$YJ'HPDQG
9$V3KDVH%0LQLPXP$YJ'HPDQG
9$V3KDVH&0LQLPXP$YJ'HPDQG
3RVLWLYH3)3KDVH$0LQLPXP$YJ'HPDQG
3RVLWLYH3)3KDVH%0LQLPXP$YJ'HPDQG
3RVLWLYH3)3KDVH&0LQLPXP$YJ'HPDQG
1HJDWLYH3)3KDVH$0LQLPXP$YJ'HPDQG
1HJDWLYH3)3KDVH%0LQLPXP$YJ'HPDQG
1HJDWLYH3)3KDVH&0LQLPXP$YJ'HPDQG
5HVHUYHG
5HVHUYHG
5HVHUYHG
5HVHUYHG
5HVHUYHG
5HVHUYHG
5HVHUYHG
Doc# E149721
Range (Note 6)
WR0
WR0
WR0
WR0
WR0
WR0
WR0
WR0
WR0
WR0
WR0
WR0
WR0
0WR0
WR
WR
WR
WR0
0WR0
0WR0
0WR0
0WR0
0WR0
0WR0
0WR0
0WR0
0WR0
0WR0
0WR0
0WR0
0WR0
0WR0
0WR0
WR
WR
WR
WR
WR
WR
Format
)/2$7
)/2$7
)/2$7
)/2$7
)/2$7
)/2$7
)/2$7
)/2$7
)/2$7
)/2$7
)/2$7
)/2$7
)/2$7
)/2$7
)/2$7
)/2$7
)/2$7
)/2$7
)/2$7
)/2$7
)/2$7
)/2$7
)/2$7
)/2$7
)/2$7
)/2$7
)/2$7
)/2$7
)/2$7
)/2$7
)/2$7
)/2$7
)/2$7
)/2$7
)/2$7
)/2$7
)/2$7
)/2$7
)/2$7
The Leader In Power Monitoring and Smart Grid Solutions
Electro Industries/GaugeTech
Hex
)
)
)
)
)
)$
)&
)(
)
)
)
)
)
)$
)&
)(
)
)
)
)
)
)$
)&
)(
)
)
)
)
)
)$
)&
)(
)
)
)
)
)
)$
)&
)'
)(
))
)
)
)
)%
Primary Minimum Block
))
)
)
)
)
)
)%
)'
))
)
)
)
)
)
)%
)'
))
)
)
)
)
)
)%
)'
))
)
)
)
)
)
)%
)'
))
)
)
)
)
)
)%
)'
)(
))
)
)
)
)
Units or Resolution
YROWV
YROWV
YROWV
YROWV
YROWV
YROWV
DPSV
DPSV
DPSV
ZDWWV
9$5V
ZDWWV
9$5V
9$V
QRQH
QRQH
+]
DPSV
ZDWWV
ZDWWV
ZDWWV
9$5V
9$5V
9$5V
ZDWWV
ZDWWV
ZDWWV
9$5V
9$5V
9$5V
9$V
9$V
9$V
QRQH
QRQH
QRQH
QRQH
QRQH
QRQH
5HVHUYHG
%ORFN6L]H
read-only
Comments
B: Modbus Map and Retrieving Logs
MM-6
# Reg
Decimal
Description (Note 1)
9ROWV$10LQ7LPHVWDPS
9ROWV%10LQ7LPHVWDPS
9ROWV&10LQ7LPHVWDPS
9ROWV$%0LQ7LPHVWDPS
9ROWV%&0LQ7LPHVWDPS
9ROWV&$0LQ7LPHVWDPS
$PSV$0LQ$YJ'PG7LPHVWDPS
$PSV%0LQ$YJ'PG7LPHVWDPS
$PSV&0LQ$YJ'PG7LPHVWDPS
3RVLWLYH:DWWV3K0LQ$YJ'PG7LPHVWDPS
3RVLWLYH9$5V3K0LQ$YJ'PG7LPHVWDPS
1HJDWLYH:DWWV3K0LQ$YJ'PG7LPHVWDPS
1HJDWLYH9$5V3K0LQ$YJ'PG7LPHVWDPS
9$V3K0LQ$YJ'PG7LPHVWDPS
3RVLWLYH3RZHU)DFWRU3K0LQ$YJ'PG7LPHVWDPS
1HJDWLYH3RZHU)DFWRU3K0LQ$YJ'PG7LPHVWDPS
)UHTXHQF\0LQ7LPHVWDPS
1HXWUDO&XUUHQW0LQ$YJ'PG7LPHVWDPS
3RVLWLYH:DWWV3KDVH$0LQ$YJ'PG7LPHVWDPS
3RVLWLYH:DWWV3KDVH%0LQ$YJ'PG7LPHVWDPS
3RVLWLYH:DWWV3KDVH&0LQ$YJ'PG7LPHVWDPS
3RVLWLYH9$5V3KDVH$0LQ$YJ'PG7LPHVWDPS
3RVLWLYH9$5V3KDVH%0LQ$YJ'PG7LPHVWDPS
3RVLWLYH9$5V3KDVH&0LQ$YJ'PG7LPHVWDPS
1HJDWLYH:DWWV3KDVH$0LQ$YJ'PG7LPHVWDPS
1HJDWLYH:DWWV3KDVH%0LQ$YJ'PG7LPHVWDPS
1HJDWLYH:DWWV3KDVH&0LQ$YJ'PG7LPHVWDPS
1HJDWLYH9$5V3KDVH$0LQ$YJ'PG7LPHVWDPS
1HJDWLYH9$5V3KDVH%0LQ$YJ'PG7LPHVWDPS
1HJDWLYH9$5V3KDVH&0LQ$YJ'PG7LPHVWDPS
9$V3KDVH$0LQ$YJ'PG7LPHVWDPS
9$V3KDVH%0LQ$YJ'PG7LPHVWDPS
9$V3KDVH&0LQ$YJ'PG7LPHVWDPS
3RVLWLYH3)3KDVH$0LQ$YJ'PG7LPHVWDPS
3RVLWLYH3)3KDVH%0LQ$YJ'PG7LPHVWDPS
3RVLWLYH3)3KDVH&0LQ$YJ'PG7LPHVWDPS
1HJDWLYH3)3KDVH$0LQ$YJ'PG7LPHVWDPS
1HJDWLYH3)3KDVH%0LQ$YJ'PG7LPHVWDPS
1HJDWLYH3)3KDVH&0LQ$YJ'PG7LPHVWDPS
5HVHUYHG
5HVHUYHG
5HVHUYHG
5HVHUYHG
5HVHUYHG
5HVHUYHG
5HVHUYHG
Doc# E149721
Range (Note 6)
-DQ'HF
-DQ'HF
-DQ'HF
-DQ'HF
-DQ'HF
-DQ'HF
-DQ'HF
-DQ'HF
-DQ'HF
-DQ'HF
-DQ'HF
-DQ'HF
-DQ'HF
-DQ'HF
-DQ'HF
-DQ'HF
-DQ'HF
-DQ'HF
-DQ'HF
-DQ'HF
-DQ'HF
-DQ'HF
-DQ'HF
-DQ'HF
-DQ'HF
-DQ'HF
-DQ'HF
-DQ'HF
-DQ'HF
-DQ'HF
-DQ'HF
-DQ'HF
-DQ'HF
-DQ'HF
-DQ'HF
-DQ'HF
-DQ'HF
-DQ'HF
-DQ'HF
Format
767$03
767$03
767$03
767$03
767$03
767$03
767$03
767$03
767$03
767$03
767$03
767$03
767$03
767$03
767$03
767$03
767$03
767$03
767$03
767$03
767$03
767$03
767$03
767$03
767$03
767$03
767$03
767$03
767$03
767$03
767$03
767$03
767$03
767$03
767$03
767$03
767$03
767$03
767$03
The Leader In Power Monitoring and Smart Grid Solutions
Electro Industries/GaugeTech
Hex
'
'
'
'$
''
(
(
(
(
(&
()
)
)
)
)%
)(
$
'
&
)
%
(
$
'
&
)
Primary Minimum Timestamp Block
&)
'
'
'
'%
'(
(
(
(
($
('
)
)
)
)
)&
))
%
(
$
'
&
)
%
(
$
'
Units or Resolution
VHF
VHF
VHF
VHF
VHF
VHF
VHF
VHF
VHF
VHF
VHF
VHF
VHF
VHF
VHF
VHF
VHF
VHF
VHF
VHF
VHF
VHF
VHF
VHF
VHF
VHF
VHF
VHF
VHF
VHF
VHF
VHF
VHF
VHF
VHF
VHF
VHF
VHF
VHF
5HVHUYHG
%ORFN6L]H
read-only
Comments
B: Modbus Map and Retrieving Logs
MM-7
# Reg
$
&
(
Decimal
Description (Note 1)
9ROWV$1SUHYLRXV'HPDQGLQWHUYDO6KRUW7HUP0D[LPXP
9ROWV%1SUHYLRXV'HPDQGLQWHUYDO6KRUW7HUP0D[LPXP
9ROWV&1SUHYLRXV'HPDQGLQWHUYDO6KRUW7HUP0D[LPXP
9ROWV$%SUHYLRXV'HPDQGLQWHUYDO6KRUW7HUP0D[LPXP
9ROWV%&SUHYLRXV'HPDQGLQWHUYDO6KRUW7HUP0D[LPXP
9ROWV&$SUHYLRXV'HPDQGLQWHUYDO6KRUW7HUP0D[LPXP
9ROWV$10D[LPXP
9ROWV%10D[LPXP
9ROWV&10D[LPXP
9ROWV$%0D[LPXP
9ROWV%&0D[LPXP
9ROWV&$0D[LPXP
Hex
$
&
(
$
&
(
$
&
(
$
&
(
$
&
(
$
Decimal
Description (Note 1)
9ROWV$10D[LPXP
9ROWV%10D[LPXP
9ROWV&10D[LPXP
9ROWV$%0D[LPXP
9ROWV%&0D[LPXP
9ROWV&$0D[LPXP
$PSV$0D[LPXP$YJ'HPDQG
$PSV%0D[LPXP$YJ'HPDQG
$PSV&0D[LPXP$YJ'HPDQG
3RVLWLYH:DWWV3K0D[LPXP$YJ'HPDQG
3RVLWLYH9$5V3K0D[LPXP$YJ'HPDQG
1HJDWLYH:DWWV3K0D[LPXP$YJ'HPDQG
1HJDWLYH9$5V3K0D[LPXP$YJ'HPDQG
9$V3K0D[LPXP$YJ'HPDQG
3RVLWLYH3RZHU)DFWRU3K0D[LPXP$YJ'HPDQG
1HJDWLYH3RZHU)DFWRU3K0D[LPXP$YJ'HPDQG
)UHTXHQF\0D[LPXP
1HXWUDO&XUUHQW0D[LPXP$YJ'HPDQG
3RVLWLYH:DWWV3KDVH$0D[LPXP$YJ'HPDQG
3RVLWLYH:DWWV3KDVH%0D[LPXP$YJ'HPDQG
3RVLWLYH:DWWV3KDVH&0D[LPXP$YJ'HPDQG
3RVLWLYH9$5V3KDVH$0D[LPXP$YJ'HPDQG
3RVLWLYH9$5V3KDVH%0D[LPXP$YJ'HPDQG
3RVLWLYH9$5V3KDVH&0D[LPXP$YJ'HPDQG
1HJDWLYH:DWWV3KDVH$0D[LPXP$YJ'HPDQG
1HJDWLYH:DWWV3KDVH%0D[LPXP$YJ'HPDQG
1HJDWLYH:DWWV3KDVH&0D[LPXP$YJ'HPDQG
1HJDWLYH9$5V3KDVH$0D[LPXP$YJ'HPDQG
1HJDWLYH9$5V3KDVH%0D[LPXP$YJ'HPDQG
1HJDWLYH9$5V3KDVH&0D[LPXP$YJ'HPDQG
9$V3KDVH$0D[LPXP$YJ'HPDQG
9$V3KDVH%0D[LPXP$YJ'HPDQG
9$V3KDVH&0D[LPXP$YJ'HPDQG
3RVLWLYH3)3KDVH$0D[LPXP$YJ'HPDQG
3RVLWLYH3)3KDVH%0D[LPXP$YJ'HPDQG
3RVLWLYH3)3KDVH&0D[LPXP$YJ'HPDQG
1HJDWLYH3)3KDVH$0D[LPXP$YJ'HPDQG
1HJDWLYH3)3KDVH%0D[LPXP$YJ'HPDQG
1HJDWLYH3)3KDVH&0D[LPXP$YJ'HPDQG
5HVHUYHG
5HVHUYHG
5HVHUYHG
5HVHUYHG
5HVHUYHG
5HVHUYHG
5HVHUYHG
Doc# E149721
Range (Note 6)
WR0
WR0
WR0
WR0
WR0
WR0
WR0
WR0
WR0
WR0
WR0
WR0
WR0
0WR0
WR
WR
WR
WR0
0WR0
0WR0
0WR0
0WR0
0WR0
0WR0
0WR0
0WR0
0WR0
0WR0
0WR0
0WR0
0WR0
0WR0
0WR0
WR
WR
WR
WR
WR
WR
Range (Note 6)
WR0
WR0
WR0
WR0
WR0
WR0
WR0
WR0
WR0
WR0
WR0
WR0
Format
)/2$7
)/2$7
)/2$7
)/2$7
)/2$7
)/2$7
)/2$7
)/2$7
)/2$7
)/2$7
)/2$7
)/2$7
)/2$7
)/2$7
)/2$7
)/2$7
)/2$7
)/2$7
)/2$7
)/2$7
)/2$7
)/2$7
)/2$7
)/2$7
)/2$7
)/2$7
)/2$7
)/2$7
)/2$7
)/2$7
)/2$7
)/2$7
)/2$7
)/2$7
)/2$7
)/2$7
)/2$7
)/2$7
)/2$7
Format
)/2$7
)/2$7
)/2$7
)/2$7
)/2$7
)/2$7
)/2$7
)/2$7
)/2$7
)/2$7
)/2$7
)/2$7
The Leader In Power Monitoring and Smart Grid Solutions
Electro Industries/GaugeTech
%
'
)
%
'
)
%
'
)
%
'
)
%
'
)
$
%
Primary Maximum Block
Hex
Short term Primary Maximum Block
)
%
'
)
Units or Resolution
YROWV
YROWV
YROWV
YROWV
YROWV
YROWV
DPSV
DPSV
DPSV
ZDWWV
9$5V
ZDWWV
9$5V
9$V
QRQH
QRQH
+]
DPSV
ZDWWV
ZDWWV
ZDWWV
9$5V
9$5V
9$5V
ZDWWV
ZDWWV
ZDWWV
9$5V
9$5V
9$5V
9$V
9$V
9$V
QRQH
QRQH
QRQH
QRQH
QRQH
QRQH
Units or Resolution
YROWV
YROWV
YROWV
YROWV
YROWV
YROWV
YROWV
YROWV
YROWV
YROWV
YROWV
YROWV
Comments
5HVHUYHG
%ORFN6L]H
read-only
%ORFN6L]H
Comments
0D[LPXPLQVWDQWDQHRXVYDOXHPHDVXUHGGXULQJWKHPRVWUHFHQWO\FRPSOHWHGGHPDQGLQWHUYDO
0D[LPXPLQVWDQWDQHRXVYDOXHPHDVXUHGGXULQJWKHGHPDQGLQWHUYDOEHIRUHWKHRQHPRVW
UHFHQWO\FRPSOHWHG
read-only
B: Modbus Map and Retrieving Logs
MM-8
# Reg
# Reg
Decimal
Description (Note 1)
9ROWV$10D[7LPHVWDPS
9ROWV%10D[7LPHVWDPS
9ROWV&10D[7LPHVWDPS
9ROWV$%0D[7LPHVWDPS
9ROWV%&0D[7LPHVWDPS
9ROWV&$0D[7LPHVWDPS
$PSV$0D[$YJ'PG7LPHVWDPS
$PSV%0D[$YJ'PG7LPHVWDPS
$PSV&0D[$YJ'PG7LPHVWDPS
3RVLWLYH:DWWV3K0D[$YJ'PG7LPHVWDPS
3RVLWLYH9$5V3K0D[$YJ'PG7LPHVWDPS
1HJDWLYH:DWWV3K0D[$YJ'PG7LPHVWDPS
1HJDWLYH9$5V3K0D[$YJ'PG7LPHVWDPS
9$V3K0D[$YJ'PG7LPHVWDPS
3RVLWLYH3RZHU)DFWRU3K0D[$YJ'PG7LPHVWDPS
1HJDWLYH3RZHU)DFWRU3K0D[$YJ'PG7LPHVWDPS
)UHTXHQF\0D[7LPHVWDPS
1HXWUDO&XUUHQW0D[$YJ'PG7LPHVWDPS
3RVLWLYH:DWWV3KDVH$0D[$YJ'PG7LPHVWDPS
3RVLWLYH:DWWV3KDVH%0D[$YJ'PG7LPHVWDPS
3RVLWLYH:DWWV3KDVH&0D[$YJ'PG7LPHVWDPS
3RVLWLYH9$5V3KDVH$0D[$YJ'PG7LPHVWDPS
3RVLWLYH9$5V3KDVH%0D[$YJ'PG7LPHVWDPS
3RVLWLYH9$5V3KDVH&0D[$YJ'PG7LPHVWDPS
1HJDWLYH:DWWV3KDVH$0D[$YJ'PG7LPHVWDPS
1HJDWLYH:DWWV3KDVH%0D[$YJ'PG7LPHVWDPS
1HJDWLYH:DWWV3KDVH&0D[$YJ'PG7LPHVWDPS
1HJDWLYH9$5V3KDVH$0D[$YJ'PG7LPHVWDPS
1HJDWLYH9$5V3KDVH%0D[$YJ'PG7LPHVWDPS
1HJDWLYH9$5V3KDVH&0D[$YJ'PG7LPHVWDPS
9$V3KDVH$0D[$YJ'PG7LPHVWDPS
9$V3KDVH%0D[$YJ'PG7LPHVWDPS
9$V3KDVH&0D[$YJ'PG7LPHVWDPS
3RVLWLYH3)3KDVH$0D[$YJ'PG7LPHVWDPS
3RVLWLYH3)3KDVH%0D[$YJ'PG7LPHVWDPS
3RVLWLYH3)3KDVH&0D[$YJ'PG7LPHVWDPS
1HJDWLYH3)3KDVH$0D[$YJ'PG7LPHVWDPS
1HJDWLYH3)3KDVH%0D[$YJ'PG7LPHVWDPS
1HJDWLYH3)3KDVH&0D[$YJ'PG7LPHVWDPS
5HVHUYHG
5HVHUYHG
5HVHUYHG
5HVHUYHG
5HVHUYHG
5HVHUYHG
5HVHUYHG
Doc# E149721
Range (Note 6)
-DQ'HF
-DQ'HF
-DQ'HF
-DQ'HF
-DQ'HF
-DQ'HF
-DQ'HF
-DQ'HF
-DQ'HF
-DQ'HF
-DQ'HF
-DQ'HF
-DQ'HF
-DQ'HF
-DQ'HF
-DQ'HF
-DQ'HF
-DQ'HF
-DQ'HF
-DQ'HF
-DQ'HF
-DQ'HF
-DQ'HF
-DQ'HF
-DQ'HF
-DQ'HF
-DQ'HF
-DQ'HF
-DQ'HF
-DQ'HF
-DQ'HF
-DQ'HF
-DQ'HF
-DQ'HF
-DQ'HF
-DQ'HF
-DQ'HF
-DQ'HF
-DQ'HF
Format
767$03
767$03
767$03
767$03
767$03
767$03
767$03
767$03
767$03
767$03
767$03
767$03
767$03
767$03
767$03
767$03
767$03
767$03
767$03
767$03
767$03
767$03
767$03
767$03
767$03
767$03
767$03
767$03
767$03
767$03
767$03
767$03
767$03
767$03
767$03
767$03
767$03
767$03
767$03
The Leader In Power Monitoring and Smart Grid Solutions
Electro Industries/GaugeTech
Hex
%
%&
%)
&
&
&
&%
&(
'
'
'
'$
''
(
(
(
(
(&
()
)
)
)
)%
)(
$
'
&
)
%
(
$
'
)
Primary Maximum Timestamp Block
%
%$
%'
&
&
&
&
&&
&)
'
'
'
'%
'(
(
(
(
($
('
)
)
)
)
)&
))
%
(
$
'
&
)
%
(
Units or Resolution
VHF
VHF
VHF
VHF
VHF
VHF
VHF
VHF
VHF
VHF
VHF
VHF
VHF
VHF
VHF
VHF
VHF
VHF
VHF
VHF
VHF
VHF
VHF
VHF
VHF
VHF
VHF
VHF
VHF
VHF
VHF
VHF
VHF
VHF
VHF
VHF
VHF
VHF
VHF
5HVHUYHG
%ORFN6L]H
read-only
Comments
B: Modbus Map and Retrieving Logs
MM-9
# Reg
(
(
(
(
(
((
($
(%
(&
('
((
Hex
()
(
(
5HVHW6\VWHP/RJ1RWH
5HVHW+LVWRULFDO/RJ1RWH
5HVHW+LVWRULFDO/RJ1RWH
5HVHW+LVWRULFDO/RJ1RWH
5HVHUYHG
5HVHUYHG
5HVHUYHG
5HVHUYHG
5HVHUYHG
5HVHUYHG
5HVHUYHG
Decimal
Description (Note 1)
5HVHW0D[0LQ%ORFNV
5HVHW(QHUJ\$FFXPXODWRUV
5HVHW$ODUP/RJ1RWH
$
%
&
'
(
$
Hex
Hex
$
Decimal
Description (Note 1)
3HUIRUPD6HFXUH2SHUDWLRQ
,QLWLDWH3URJUDPPDEOH6HWWLQJV8SGDWH
&DOFXODWH3URJUDPPDEOH6HWWLQJV&KHFNVXP1RWH
3URJUDPPDEOH6HWWLQJV&KHFNVXP1RWH
:ULWH1HZ3DVVZRUG1RWH
7HUPLQDWH3URJUDPPDEOH6HWWLQJV8SGDWH1RWH
6HW0HWHU&ORFN
5HVHUYHG
5HVHUYHG
&ORVH3ULYLOHJHG&RPPDQG6HVVLRQ
Range (Note 6)
SDVVZRUG1RWH
WR
WR
WR
DQ\YDOXH
-DQ'HF
DQ\YDOXH
Range (Note 6)
SDVVZRUG1RWH
SDVVZRUG1RWH
SDVVZRUG1RWH
SDVVZRUG1RWH
SDVVZRUG1RWH
SDVVZRUG1RWH
SDVVZRUG1RWH
Range (Note 6)
SDVVZRUG1RWH
SDVVZRUG1RWH
SDVVZRUG1RWH
Units or Resolution
Units or Resolution
Units or Resolution
VHF
Commands Section (Note 4)
Doc# E149721
Format
8,17
8,17
8,17
8,17
8,17
8,17
767$03
8,17
Format
8,17
8,17
8,17
8,17
8,17
8,17
8,17
Format
8,17
8,17
8,17
The Leader In Power Monitoring and Smart Grid Solutions
Electro Industries/GaugeTech
)
Decimal
Description (Note 1)
,QLWLDWH0HWHU)LUPZDUH5HSURJUDPPLQJ
)RUFH0HWHU5HVWDUW
2SHQ3ULYLOHJHG&RPPDQG6HVVLRQ
Encryption Block
$
%
&
'
(
)
$
Privileged Commands Block
(
(
(
(
(
(
(
(%
(&
('
((
()
(
(
Resets Block (Note 9)
Comments
HQFU\SWHGFRPPDQGWRUHDGSDVVZRUGRUFKDQJHPHWHUW\SH
%ORFN6L]H
read/write
Comments
FDXVHVDZDWFKGRJUHVHWDOZD\VUHDGV
PHWHUZLOOSURFHVVFRPPDQGUHJLVWHUVWKLVUHJLVWHUWKURXJK
&ORVH3ULYLOHJHG&RPPDQG
6HVVLRQ
UHJLVWHUEHORZIRUPLQXWHVRUXQWLOWKHVHVVLRQLVFORVHGZKLFKHYHUFRPHVILUVW
PHWHUHQWHUV36XSGDWHPRGH
PHWHUFDOFXODWHVFKHFNVXPRQ5$0FRS\RI36EORFN
UHDGZULWHFKHFNVXPUHJLVWHU36EORFNVDYHGLQQRQYRODWLOHPHPRU\RQZULWH1RWH
ZULWHRQO\UHJLVWHUDOZD\VUHDGV]HUR
PHWHUOHDYHV36XSGDWHPRGHYLDUHVHW
VDYHGRQO\ZKHQUGUHJLVWHULVZULWWHQ
5HVHUYHG
5HVHUYHG
HQGVDQRSHQFRPPDQGVHVVLRQ
%ORFN6L]H
conditional write
MM-10
# Reg
# Reg
Comments
# Reg
5HSO\WRDUHVHWORJFRPPDQGLQGLFDWHVWKDWWKHFRPPDQGZDVDFFHSWHGEXWQRWQHFHVVDULO\WKDW
WKHUHVHWLVILQLVKHG3ROOORJVWDWXVEORFNWRGHWHUPLQHWKLV
6HWWR
5HVHUYHG
%ORFN6L]H
write-only
B: Modbus Map and Retrieving Logs
'
(
)
(
)
)XOO6FDOH&XUUHQWIRUORDGEDUJUDSK
'D\OLJKW6DYLQJ2II5XOH
5HVHUYHG
8VHU6HWWLQJV)ODJV
'D\OLJKW6DYLQJ2Q5XOH
2SHUDWLQJ0RGH6FUHHQ(QDEOHV
3RZHU(QHUJ\)RUPDW
$YHUDJLQJ0HWKRG
&7QXPHUDWRU
37QXPHUDWRU
37GHQRPLQDWRU
37PXOWLSOLHUKRRNXS
Decimal
Description (Note 1)
&7PXOWLSOLHUGHQRPLQDWRU
WR
ELWPDSSHG
ELWPDSSHG
ELWPDSSHG
ELWPDSSHG
ELWPDSSHG
ELWPDSSHG
WR
WR
WR
ELWPDSSHG
Doc# E149721
8,17
8,17
8,17
8,17
8,17
8,17
8,17
8,17
8,17
8,17
8,17
Range (Note 6)
ELWPDSSHG
write only in PS update mode
QRQH
KKKKKZZZGGGPPPP
JLQQVUSG\ZID
5HVHUYHG
J HQDEOHDOWHUQDWHIXOOVFDOHEDUJUDSKFXUUHQW
RQ RII
L IL[HGVFDOHDQGIRUPDWFXUUHQWGLVSOD\
QRUPDODXWRVFDOHGFXUUHQWGLVSOD\
DOZD\VVKRZDPSVZLWKQRGHFLPDOSODFHV
QQ QXPEHURISKDVHVIRUYROWDJHFXUUHQWVFUHHQ
$%& $% $ $%&
V VFUROO RQ RII
U SDVVZRUGIRUUHVHWLQXVH RQ RII
S SDVVZRUGIRUFRQILJXUDWLRQLQXVH RQ RII
G GD\OLJKWVDYLQJWLPHFKDQJHV RII RQ
\ GLDJQRVWLFHYHQWVLQV\VWHPORJ \HV QR
Z SRZHUGLUHFWLRQ
YLHZDVORDG YLHZDVJHQHUDWRU
I IOLSSRZHUIDFWRUVLJQ \HV QR
D DSSDUHQWSRZHUFRPSXWDWLRQPHWKRG
DULWKPHWLFVXP YHFWRUVXP
,IQRQ]HURDQGXVHUVHWWLQJVELWJLVVHWWKLVYDOXHUHSODFHV&7QXPHUDWRULQWKHIXOOVFDOH
FXUUHQWFDOFXODWLRQ6HH1RWH
Units or Resolution
Comments
GGGGGGGGPPPPPPPP KLJKE\WHLVGHQRPLQDWRURUUHDGRQO\
ORZE\WHLVPXOWLSOLHURU
QRQH
QRQH
QRQH
PPPPPPPP
PP«PP 37PXOWLSOLHURU
PPPPKKKK
KKKK KRRNXSHQXPHUDWLRQ HOHPHQWZ\H>6@ GHOWD&7V>6@ HOHPHQW
Z\H>6@
LLLLLLEVVV
LLLLLL LQWHUYDO
E EORFNRUUROOLQJ
VVV VXELQWHUYDOV
SSSSLLQQIHHHGGG
SSSS SRZHUVFDOHXQLWNLORPHJDDXWR
LL SRZHUGLJLWVDIWHUGHFLPDOSRLQW
DSSOLHVRQO\LII DQGSSSSLVQRWDXWR
QQ QXPEHURIHQHUJ\GLJLWV!
HHH HQHUJ\VFDOHXQLWNLORPHJD
I GHFLPDOSRLQWIRUSRZHU
GDWDGHSHQGDQWSODFHPHQW
IL[HGSODFHPHQWSHULLYDOXH
GGG HQHUJ\GLJLWVDIWHUGHFLPDOSRLQW
6HHQRWH
[HHHHHHHH
HHHHHHHH RSPRGHVFUHHQURZVRQRIIURZVWRSWRERWWRPDUHELWVORZRUGHUWRKLJKRUGHU
[ VHWWRVXSSUHVV3)RQ:9$53)VFUHHQV
KKKKKZZZGGGPPPP
DSSOLHVRQO\LIGD\OLJKWVDYLQJVLQ8VHU6HWWLQJV)ODJV RQVSHFLILHVZKHQWRPDNHFKDQJHRYHU
KKKKK KRXU
ZZZ ZHHNIRUVWWKIRUODVW
GGG GD\RIZHHNIRU6XQ6DW
PPPP PRQWK
([DPSOH$0RQWKHWK6XQGD\RI0DUFK
KKKKK ZZZ GGG PPPP Programmable Settings Section
Format
8,17
The Leader In Power Monitoring and Smart Grid Solutions
Electro Industries/GaugeTech
Hex
)
)
Basic Setups Block
B: Modbus Map and Retrieving Logs
MM-11
# Reg
$
%
&
'
(
)
(
'
&
&
&
&
&
&
&
&
&$
&%
(
(
%
%
5HVHUYHG
3URJUDPPDEOH6HWWLQJV8SGDWH&RXQWHU
/LPLW
/LPLW
/LPLW
/LPLW
/LPLW
/LPLW
/LPLW
5HVHUYHG
5HVHUYHG
ZDWWVORVVGXHWRLURQZKHQZDWWVSRVLWLYH
ZDWWVORVVGXHWRFRSSHUZKHQZDWWVSRVLWLYH
YDUORVVGXHWRLURQZKHQZDWWVSRVLWLYH
YDUORVVGXHWRFRSSHUZKHQZDWWVSRVLWLYH
ZDWWVORVVGXHWRLURQZKHQZDWWVQHJDWLYH
ZDWWVORVVGXHWRFRSSHUZKHQZDWWVQHJDWLYH
YDUORVVGXHWRLURQZKHQZDWWVQHJDWLYH
YDUORVVGXHWRFRSSHUZKHQZDWWVQHJDWLYH
WUDQVIRUPHUORVVFRPSHQVDWLRQXVHUVHWWLQJVIODJ
5HVHUYHGIRU6RIWZDUH8VH
/LPLW2XW/RZ6HWSRLQW
/LPLW,Q/RZ7KUHVKROG
&20VHWXS
&20DGGUHVV
/LPLW,GHQWLILHU
/LPLW2XW+LJK6HWSRLQW
/LPLW,Q+LJK7KUHVKROG
+LVWRULFDO/RJ6L]HV,QWHUYDO5HJLVWHUV6RIWZDUH%XIIHU
+LVWRULFDO/RJ5HJLVWHU,GHQWLILHU
+LVWRULFDO/RJ5HJLVWHU,GHQWLILHUV
+LVWRULFDO/RJ6RIWZDUH%XIIHU
+LVWRULFDO/RJ6L]HV,QWHUYDO5HJLVWHUV6RIWZDUH%XIIHU
+LVWRULFDO/RJ,QWHUYDO
Decimal
Description (Note 1)
+LVWRULFDO/RJ6L]HV
5HVHUYHG
5HVHUYHG
5HVHUYHG
Description (Note 1)
WR
WR
ELWPDSSHG
Doc# E149721
8,17
8,17
VDPHDV+LVWRULFDO
/RJ
VDPHDV+LVWRULFDO
/RJ
8,17
Range (Note 6)
ELWPDSSHG
Format
8,17
VDPHDV/LPLW
WR
WR
WR
WR
WR
WR
WR
WR
ELWPDSSHG
WR
WR
ELWPDSSHG
WR
WR
WR
WR
Range (Note 6)
FKDU
ELWPDSSHG
8,17
6,17
6,17
6,17
6,17
6,17
6,17
6,17
8,17
8,17
8,17
8,17
8,17
8,17
8,17
8,17
8,17
6,17
6,17
8,17
8,17
8,17
6,17
6,17
Format
$6&,,
8,17
The Leader In Power Monitoring and Smart Grid Solutions
Electro Industries/GaugeTech
)(
%
$
&))
(
'
'
$
$
(
'
Hex
Decimal
0HWHU'HVLJQDWLRQ
&20VHWXS
Log Setups Block
(
&&
(
$
)
(
&
&
&
&
&
&
&
&$
&%
(
)
$
%
&
'
Hex
Basic Setups Block - continued
KJIHGFED
Units or Resolution
HHHHHHHHVVVVVVVV
FIZY
VDPHDV/LPLW
RIIXOOVFDOH
RIIXOOVFDOH
GGGGSSSEEE
QRQH
RIIXOOVFDOH
RIIXOOVFDOH
write only in PS update mode
5HVHUYHG
%ORFN6L]H
Comments
KLJKE\WHLVQXPEHURIUHJLVWHUVWRORJLQHDFKUHFRUG
ORZE\WHLVQXPEHURIIODVKVHFWRUVIRUWKHORJVHHQRWH
LQHLWKHUE\WHGLVDEOHVWKHORJ
RQO\ELWVHWD PLQE PLQF PLQG PLQH PLQI PLQJ PLQK (2,
SXOVH
XVH0RGEXVDGGUHVVDVWKHLGHQWLILHUVHHQRWH
VDPHDV5HJLVWHU,GHQWLILHU
5HVHUYHGIRUVRIWZDUHXVH
write only in PS update mode
Comments
GGGG UHSO\GHOD\PVHF
SSS SURWRFRO0RGEXV5780RGEXV$6&,,'13
EEE EDXGUDWH
XVH0RGEXVDGGUHVVDVWKHLGHQWLILHUVHHQRWHV
6HWSRLQWIRUWKHDERYHOLPLW/0VHHQRWHV
7KUHVKROGDWZKLFKDERYHOLPLWFOHDUVQRUPDOO\OHVVWKDQRUHTXDOWRWKHDERYHVHWSRLQWVHH
QRWHV
6HWSRLQWIRUWKHEHORZOLPLW/0VHHQRWHV
7KUHVKROGDWZKLFKEHORZOLPLWFOHDUVQRUPDOO\JUHDWHUWKDQRUHTXDOWRWKHEHORZVHWSRLQW
VHHQRWHV
VDPHDV/LPLW
5HVHUYHG
5HVHUYHG
FGLVDEOHFRPSHQVDWLRQIRUORVVHVGXHWRFRSSHU
HQDEOHFRPSHQVDLRQIRUORVVHVGXHWRFRSSHU
IGLVDEOHFRPSHQVDWLRQIRUORVVHVGXHWRLURQ
HQDEOHFRPSHQVDLRQIRUORVVHVGXHWRLURQ
ZDGGZDWWFRPSHQVDWLRQ
VXEWUDFWZDWWFRPSHQVDWLRQ
YDGGYDUFRPSHQVDWLRQ
VXEWUDFWYDUFRPSHQVDWLRQ
5HVHUYHG
,QFUHPHQWVHDFKWLPHSURJUDPPDEOHVHWWLQJVDUHFKDQJHGRFFXUVZKHQQHZFKHFNVXPLV
FDOFXODWHG
5HVHUYHG
%ORFN6L]H
Units or Resolution
QRQH
GGGG
B: Modbus Map and Retrieving Logs
MM-12
# Reg
# Reg
&
&
&$
&$
3RZHU)DFWRU3KDVH%
3RZHU)DFWRU3KDVH&
5HVHUYHG
5HVHW(QHUJ\$FFXPXODWRUV
9ROWV$%
9ROWV%&
9ROWV&$
&7QXPHUDWRU
&7PXOWLSOLHU
&7GHQRPLQDWRU
37QXPHUDWRU
37PXOWLSOLHU
37GHQRPLQDWRU
:KRXUV3RVLWLYH
:KRXUV1HJDWLYH
9$5KRXUV3RVLWLYH
9$5KRXUV1HJDWLYH
9$KRXUV
:KRXUV3RVLWLYH3KDVH$
:KRXUV3RVLWLYH3KDVH%
:KRXUV3RVLWLYH3KDVH&
:KRXUV1HJDWLYH3KDVH$
:KRXUV1HJDWLYH3KDVH%
:KRXUV1HJDWLYH3KDVH&
9$5KRXUV3RVLWLYH3KDVH$
9$5KRXUV3RVLWLYH3KDVH%
9$5KRXUV3RVLWLYH3KDVH&
9$5KRXUV1HJDWLYH3KDVH$
9$5KRXUV1HJDWLYH3KDVH%
9$5KRXUV1HJDWLYH3KDVH&
9$KRXUV3KDVH$
9$KRXUV3KDVH%
9$KRXUV3KDVH&
:DWWV3KDVH$
:DWWV3KDVH%
:DWWV3KDVH&
9$5V3KDVH$
9$5V3KDVH%
9$5V3KDVH&
9$V3KDVH$
9$V3KDVH%
9$V3KDVH&
3RZHU)DFWRU3KDVH$
)UHTXHQF\
Decimal
Description (Note 1)
6\VWHP6DQLW\,QGLFDWRU
9ROWV$1
9ROWV%1
9ROWV&1
$PSV$
$PSV%
$PSV&
:DWWV3KWRWDO
9$5V3KWRWDO
9$V3KWRWDO
3RZHU)DFWRU3KWRWDO
WR
WR
1$
SDVVZRUG1RWH
WR
WR
WR
WR
RU
WR
WR
WR
WR
WR
WR
WR
WR
WR
WR
WR
WR
WR
WR
WR
WR
WR
WR
WR
WR
WR
WR
WR
WR
WR
WR
WR
WR
WR
WR
WR
WR
WR
Doc# E149721
8,17
8,17
1$
8,17
8,17
8,17
8,17
8,17
8,17
8,17
8,17
8,17
8,17
8,17
8,17
8,17
8,17
8,17
8,17
8,17
8,17
8,17
8,17
8,17
8,17
8,17
8,17
8,17
8,17
8,17
8,17
8,17
8,17
8,17
8,17
8,17
8,17
8,17
8,17
8,17
8,17
8,17
8,17
8,17
Range (Note 6)
RU
WR
WR
WR
WR
WR
WR
WR
WR
WR
WR
QRQH
QRQH
QRQH
YROWV
YROWV
YROWV
QRQH
QRQH
QRQH
QRQH
QRQH
QRQH
:KSHUHQHUJ\IRUPDW
:KSHUHQHUJ\IRUPDW
9$5KSHUHQHUJ\IRUPDW
9$5KSHUHQHUJ\IRUPDW
9$KSHUHQHUJ\IRUPDW
:KSHUHQHUJ\IRUPDW
:KSHUHQHUJ\IRUPDW
:KSHUHQHUJ\IRUPDW
:KSHUHQHUJ\IRUPDW
:KSHUHQHUJ\IRUPDW
:KSHUHQHUJ\IRUPDW
9$5KSHUHQHUJ\IRUPDW
9$5KSHUHQHUJ\IRUPDW
9$5KSHUHQHUJ\IRUPDW
9$5KSHUHQHUJ\IRUPDW
9$5KSHUHQHUJ\IRUPDW
9$5KSHUHQHUJ\IRUPDW
9$KSHUHQHUJ\IRUPDW
9$KSHUHQHUJ\IRUPDW
9$KSHUHQHUJ\IRUPDW
ZDWWV
ZDWWV
ZDWWV
9$5V
9$5V
9$5V
9$V
9$V
9$V
QRQH
+]
Units or Resolution
QRQH
YROWV
YROWV
YROWV
DPSV
DPSV
DPSV
ZDWWV
9$5V
9$V
QRQH
12-Bit Readings Section
Format
8,17
8,17
8,17
8,17
8,17
8,17
8,17
8,17
8,17
8,17
8,17
The Leader In Power Monitoring and Smart Grid Solutions
Electro Industries/GaugeTech
&
&
&
&$
&&
&'
&(
&)
&
&
&
&
&
&
&
&$
&&
&(
&
&
&
&
&
&$
&&
&(
&
&
&
&
&
&$
&&
&'
&(
&)
&
&
&
&
&
&
&
&%
&&
&'
&(
&)
&
&
&
&
&
&
&
&
&%
&'
&)
&
&
&
&
&
&%
&'
&)
&
&
&
&
&
&%
&'
&(
&)
&
&
&
&
&
&
&
Hex
&
&
&
&
&
&
&
&
&
&
&$
&%
&
&
&
&
&
&
&
&
&
&
&$
12-Bit Block
Comments
LQGLFDWHVSURSHUPHWHURSHUDWLRQ
YROWV UHJLVWHU
DPSV UHJLVWHU
ZDWWV9$5V9$V UHJLVWHU
SI UHJLVWHU
RUOHVV RUPRUHIUHT UHJLVWHU
YROWV UHJLVWHU
&7 QXPHUDWRUPXOWLSOLHUGHQRPLQDWRU
37 QXPHUDWRUPXOWLSOLHUGHQRPLQDWRU
WRGLJLWV
GHFLPDOSRLQWLPSOLHGSHUHQHUJ\IRUPDW
UHVROXWLRQRIGLJLWEHIRUHGHFLPDOSRLQW XQLWVNLORRUPHJDSHUHQHUJ\IRUPDW
VHHQRWH
ZDWWV9$5V9$V UHJLVWHU
SI UHJLVWHU
5HVHUYHG
ZULWHRQO\UHJLVWHUDOZD\VUHDGVDV
%ORFN6L]H
read-only except as noted
B: Modbus Map and Retrieving Logs
MM-13
# Reg
&&'
/RJ5HWULHYH:LQGRZ
&
&
&
&
&
&
+LVWRULFDO/RJ6WDWXV%ORFN
+LVWRULFDO/RJ6WDWXV%ORFN
+LVWRULFDO/RJ6WDWXV%ORFN
5HVHUYHG
5HVHUYHG
7LPHVWDPS)LUVW5HFRUG
7LPHVWDPS/DVW5HFRUG
5HVHUYHG
6\VWHP/RJ6WDWXV%ORFN
VHF
VHF
Units or Resolution
UHFRUG
UHFRUG
E\WH
QRQH
QRQH
VVVVVVVVQQQQQQQQ
QQQQQQQQQQQQQQQQ
ZZZZZZZZVQQQQQQQ
Units or Resolution
PVHF
QQQQQQQQHVVVVVVV
End of Map
-DQ'HF
-DQ'HF
VDPHDVDODUPORJVWDWXV
EORFN
VDPHDVDODUPORJVWDWXV
EORFN
VDPHDVDODUPORJVWDWXV
EORFN
VDPHDVDODUPORJVWDWXV
EORFN
Range (Note 6)
WR
WR
WR
VHHFRPPHQWV
ELWPDSSHG
ELWPDSSHG
Range (Note 6)
WR
WR
ELWPDSSHG
Log Retrieval Section
Doc# E149721
767$03
767$03
Format
8,17
8,17
8,17
8,17
8,17
8,17
8,17
Format
8,17
8,17
8,17
The Leader In Power Monitoring and Smart Grid Solutions
Electro Industries/GaugeTech
&
&%
&
&
&)
&
&
&
Hex
Decimal
Description (Note 1)
Alarm Log Status Block
&
/RJ6L]HLQ5HFRUGV
&$
1XPEHURI5HFRUGV8VHG
&%
5HFRUG6L]HLQ%\WHV
&&
/RJ$YDLODELOLW\
&'
&
&
&
&
&
&%
&&
Log Status Block
2IIVHWRI)LUVW5HFRUGLQ:LQGRZ
&
&
5HFRUGVSHU:LQGRZRU%DWFK5HFRUG6FRSH6HOHFWRU
1XPEHURI5HSHDWV
&
&
Decimal
Description (Note 1)
/RJ5HWULHYDO6HVVLRQ'XUDWLRQ
/RJ5HWULHYDO6HVVLRQ&RP3RUW
/RJ1XPEHU(QDEOH6FRSH
Hex
&'
&(
&)
&
&&
&(
&)
Log Retrieval Block
%ORFN6L]H
DYDLODEOH
LQXVHE\&20
[)))) QRWDYDLODEOHORJVL]H 5HVHUYHG
,QGLYLGXDO/RJ6WDWXV%ORFN6L]H
read only
Comments
MM-14
# Reg
Comments
# Reg
LIQRVHVVLRQDFWLYHZUDSVDURXQGDIWHUPD[FRXQW
LIQRVHVVLRQDFWLYHIRUVHVVLRQDFWLYHRQ&20&20
KLJKE\WHLVWKHORJQXPEHUV\VWHPDODUPKLVWRU\KLVWRU\KLVWRU\,2FKDQJHV
ZDYHIRUPUHVHUYHGIRUIXWXUHXVH
HLVUHWULHYDOVHVVLRQHQDEOHRUGLVDEOH
VVVVVVVLVZKDWWRUHWULHYHQRUPDOUHFRUGWLPHVWDPSVRQO\FRPSOHWHPHPRU\LPDJHQR
GDWDYDOLGDWLRQLILPDJH
KLJKE\WHLVUHFRUGVSHUZLQGRZLIV RUUHFRUGVSHUEDWFKLIV ORZE\WHLVQXPEHURIUHSHDWV
IRUIXQFWLRQRUWRVXSSUHVVDXWRLQFUHPHQWLQJPD[QXPEHURIUHSHDWVLV578RU
$6&,,WRWDOZLQGRZVDEDWFKLVDOOWKHZLQGRZV
VVVVVVVVLVZLQGRZVWDWXVWRZLQGRZQXPEHU[))QRWUHDG\WKLVE\WHLVUHDGRQO\
QQ«QQLVDELWUHFRUGQXPEHU7KHORJ
VILUVWUHFRUGLVODWFKHGDVDUHIHUHQFHSRLQWZKHQWKH
VHVVLRQLVHQDEOHG7KLVRIIVHWLVDUHFRUGLQGH[UHODWLYHWRWKDWSRLQW9DOXHSURYLGHGLVWKH
UHODWLYHLQGH[RIWKHZKROHRUSDUWLDOUHFRUGWKDWEHJLQVWKHZLQGRZ
PDSSHGSHUUHFRUGOD\RXWDQGUHWULHYDOVFRSHUHDGRQO\
%ORFN6L]H
read/write except as noted
B: Modbus Map and Retrieving Logs
Data Formats
The Leader In Power Monitoring and Smart Grid Solutions
Doc# E149721
MM-15
:ULWLQJWKLVUHJLVWHUFDXVHVGDWDWREHVDYHGSHUPDQHQWO\LQQRQYRODWLOHPHPRU\5HSO\WRWKHFRPPDQGLQGLFDWHVWKDWLWZDVDFFHSWHGEXWQRWZKHWKHURUQRWWKHVDYHZDVVXFFHVVIXO7KLVFDQRQO\EHGHWHUPLQHGDIWHUWKHPHWHUKDVUHVWDUWHG
5HVHWFRPPDQGVPDNHQRVHQVHLIWKHPHWHUVWDWHLV/,03$QLOOHJDOIXQFWLRQH[FHSWLRQZLOOEHUHWXUQHG
(QHUJ\UHJLVWHUVVKRXOGEHUHVHWDIWHUDIRUPDWFKDQJH
(QWLWLHVWREHPRQLWRUHGDJDLQVWOLPLWVDUHLGHQWLILHGE\0RGEXVDGGUHVV(QWLWLHVRFFXS\LQJPXOWLSOH0RGEXVUHJLVWHUVVXFKDVIORDWLQJSRLQWYDOXHVDUHLGHQWLILHGE\WKHORZHUUHJLVWHUDGGUHVV,IDQ\RIWKHOLPLWVLVXQXVHGVHWLWVLGHQWLILHUWR]HUR
,IWKHLQGLFDWHG0RGEXVUHJLVWHULVQRWXVHGRULVDQRQVHQVLFDOHQWLW\IRUOLPLWVLWZLOOEHKDYHDVDQXQXVHGOLPLW
7KHUHDUHVHWSRLQWVSHUOLPLWRQHDERYHDQGRQHEHORZWKHH[SHFWHGUDQJHRIYDOXHV/0LVWKHWRRKLJKOLPLW/0LVWRRORZ7KHHQWLW\JRHVRXWRIOLPLWRQ/0ZKHQLWVYDOXHLVJUHDWHUWKDQWKHVHWSRLQW
,WUHPDLQVRXWRIOLPLWXQWLOWKHYDOXHGURSVEHORZWKHLQWKUHVKROG/0ZRUNVVLPLODUO\LQWKHRSSRVLWHGLUHFWLRQ,IOLPLWVLQRQO\RQHGLUHFWLRQDUHRILQWHUHVWVHWWKHLQWKUHVKROGRQWKHZURQJVLGHRIWKHVHWSRLQW
/LPLWVDUHVSHFLILHGDVRIIXOOVFDOHZKHUHIXOOVFDOHLVDXWRPDWLFDOO\VHWDSSURSULDWHO\IRUWKHHQWLW\EHLQJPRQLWRUHG
FXUUHQW
)6 &7QXPHUDWRU&7PXOWLSOLHU
YROWDJH
)6 37QXPHUDWRU37PXOWLSOLHU
SKDVHSRZHU
)6 &7QXPHUDWRU&7PXOWLSOLHU37QXPHUDWRU37PXOWLSOLHU>6457IRUGHOWDKRRNXS@
VLQJOHSKDVH
)6 &7QXPHUDWRU&7PXOWLSOLHU37QXPHUDWRU37PXOWLSOLHU>6457IRUGHOWDKRRNXS@
IUHTXHQF\
)6 RU
SRZHUIDFWRU
)6 SHUFHQWDJH
)6 DQJOH
)6 QD
QD
$EORFNRIGDWDDQGFRQWUROUHJLVWHUVLVDOORFDWHGIRUHDFKRSWLRQVORW,QWHUSUHWDWLRQRIWKHUHJLVWHUGDWDGHSHQGVRQZKDWFDUGLVLQWKHVORW
0HDVXUHPHQWVWDWHV2IIRFFXUVGXULQJSURJUDPPDEOHVHWWLQJVXSGDWHV5XQLVWKHQRUPDOPHDVXULQJVWDWH/LPSLQGLFDWHVWKDWDQHVVHQWDLOQRQYRODWLOHPHPRU\EORFNLVFRUUXSWHGDQG:DUPXSRFFXUVEULHIO\DSSUR[LPDWHO\VHFRQGVDWVWDUWXSZKLOHWKHUHDGLQJVVWDELOL]H
5XQVWDWHLVUHTXLUHGIRUPHDVXUHPHQWKLVWRULFDOORJJLQJGHPDQGLQWHUYDOSURFHVVLQJOLPLWDODUPHYDOXDWLRQDQGPLQPD[FRPSDULVRQVV5HVHWWLQJPLQPD[RUHQHUJ\LVDOORZHGRQO\LQUXQDQGRIIVWDWHVZDUPXSZLOOUHWXUQDEXV\H[FHSWLRQ
,QOLPSVWDWHWKHPHWHUUHERRWVDWPLQXWHLQWHUYDOVLQDQHIIRUWWRFOHDUWKHSUREOHP
/LPLWVHYDOXDWLRQIRUDOOHQWLWHVH[FHSWGHPDQGDYHUDJHVFRPPHQFHVLPPHGLDWHO\DIWHUWKHZDUPXSSHULRG(YDOXDWLRQIRUGHPDQGDYHUDJHVPD[LPXPGHPDQGVDQGPLQLPXPGHPDQGVFRPPHQFHVDWWKHHQGRIWKHILUVWGHPDQGLQWHUYDODIWHUVWDUWXS
QD
7KHUHDUHRUIODVKVHFWRUVDYDLODEOHLQDFRPPRQSRROIRUGLVWULEXWLRQDPRQJWKHKLVWRULFDOORJV
7KHSRROVL]HQXPEHURIVHFWRUVIRUHDFKORJDQGWKHQXPEHURIUHJLVWHUVSHUUHFRUGWRJHWKHUGHWHUPLQHWKHPD[LPXPQXPEHURIUHFRUGVDORJFDQKROG
6 QXPEHURIVHFWRUVDVVLJQHGWRWKHORJ
QD
/RJVFDQQRWEHUHVHWGXULQJORJUHWULHYDO%XV\H[FHSWLRQZLOOEHUHWXUQHG
$OOUHJLVWHUVQRWH[SOLFLWO\OLVWHGLQWKHWDEOHUHDGDV:ULWHVWRWKHVHUHJLVWHUVZLOOEHDFFHSWHGEXWZRQ
WDFWXDOO\FKDQJHWKHUHJLVWHUVLQFHLWGRHVQ
WH[LVW
0HWHU'DWD6HFWLRQLWHPVUHDGDVXQWLOILUVWUHDGLQJVDUHDYDLODEOHRULIWKHPHWHULVQRWLQRSHUDWLQJPRGH:ULWHVWRWKHVHUHJLVWHUVZLOOEHDFFHSWHGEXWZRQ
WDFWXDOO\FKDQJHWKHUHJLVWHU
5HJLVWHUYDOLGRQO\LQSURJUDPPDEOHVHWWLQJVXSGDWHPRGH,QRWKHUPRGHVWKHVHUHJLVWHUVUHDGDVDQGUHWXUQDQLOOHJDOGDWDDGGUHVVH[FHSWLRQLIDZULWHLVDWWHPSWHG
0HWHUFRPPDQGUHJLVWHUVDOZD\VUHDGDV7KH\PD\EHZULWWHQRQO\ZKHQWKHPHWHULVLQDVXLWDEOHPRGH7KHUHJLVWHUVUHWXUQDQLOOHJDOGDWDDGGUHVVH[FHSWLRQLIDZULWHLVDWWHPSWHGLQDQLQFRUUHFWPRGH
,IWKHSDVVZRUGLVLQFRUUHFWDYDOLGUHVSRQVHLVUHWXUQHGEXWWKHFRPPDQGLVQRWH[HFXWHG8VHIRUWKHSDVVZRUGLISDVVZRUGVDUHGLVDEOHGLQWKHSURJUDPPDEOHVHWWLQJV
0GHQRWHVDPXOWLSOLHU
(DFKLGHQWLILHULVD0RGEXVUHJLVWHU)RUHQWLWLHVWKDWRFFXS\PXOWLSOHUHJLVWHUV)/2$76,17HWFDOOUHJLVWHUVPDNLQJXSWKHHQWLW\PXVWEHOLVWHGLQDVFHQGLQJRUGHU
)RUH[DPSOHWRORJSKDVH$YROWV9$VDQG9$KRXUVWKHUHJLVWHUOLVWZRXOGEH[([([[['[(DQGWKHQXPEHURIUHJLVWHUV[KLJKE\WHZRXOGEH
Notes
$6&,,FKDUDFWHUVSDFNHGSHUUHJLVWHULQKLJKORZRUGHUDQGZLWKRXWDQ\WHUPLQDWLRQFKDUDFWHUV
ELWVLJQHGXQVLJQHGLQWHJHU
ELWVLJQHGXQVLJQHGLQWHJHUVSDQQLQJUHJLVWHUV7KHORZHUDGGUHVVHGUHJLVWHULVWKHKLJKRUGHUKDOI
ELW,(((IORDWLQJSRLQWQXPEHUVSDQQLQJUHJLVWHUV7KHORZHUDGGUHVVHGUHJLVWHULVWKHKLJKRUGHUKDOILHFRQWDLQVWKHH[SRQHQW
DGMDFHQWUHJLVWHUVE\WHVHDFK)LUVWORZHVWDGGUHVVHGUHJLVWHUKLJKE\WHLV\HDUORZE\WHLVPRQWK0LGGOHUHJLVWHUKLJKE\WHLVGD\ORZE\WHLVKRXUSOXV'67ELW
'67GD\OLJKWVDYLQJWLPHELWLVELW[7KLUGUHJLVWHUKLJKE\WHLVPLQXWHVORZE\WHLVVHFRQGV)RUH[DPSOH$0RQ2FWREHUZRXOGEH[$[&[DVVXPLQJ'67LVLQHIIHFW
Electro Industries/GaugeTech
$6&,,
6,178,17
6,178,17
)/2$7
767$0 3
B: Modbus Map and Retrieving Logs
Electro Industries/GaugeTech
The Leader In Power Monitoring and Smart Grid Solutions
Doc# E149721
This page intentionally left blank.
B: Modbus Map and Retrieving Logs
MM-16
C: DNP Mapping
C: DNP Mapping
C.1: Overview
This Appendix describes the functionality of the Shark® 200S meter's version of the
DNP protocol. A DNP programmer needs this information to retrieve data from the
Shark® 200S meter. The DNP version used by the Shark 200S is a reduced set of the
Distributed Network Protocol Version 3.0 subset 2; it gives enough functionality to get
critical measurements from the Shark® 200S meter.
The Shark® 200S meter's DNP version supports Class 0 object/qualifiers 0,1,2,6,
only. No event generation is supported. The Shark® 200S meter always acts as a secondary device (slave) in DNP communication.
A new feature allows DNP readings in primary units with user-set scaling for current,
Voltage, and power (see Chapter 5 in the Communicator EXT User Manual for instructions).
C.2: Physical Layer
The Shark® 200S meter's DNP version uses serial communication. Port 2 (RS485
compliant port) or any communication capable option board can be used. Speed and
data format is transparent for the Shark® 200S meter's DNP version: they can be set
to any supported value. The IrDA port cannot use DNP.
C.3: Data Link Layer
The Shark® 200S meter can be assigned a value from 1 to 65534 as the target
device address. The data link layer follows the standard frame FT3 used by DNP Version 3.0 protocol, but only 4 functions are implemented: Reset Link, Reset User,
Unconfirmed User Data, and Link Status, as depicted in the following table.
Function
Function Code
Reset Link
0
Reset User
1
Unconfirmed User Data
4
Link Status
9
Table C.1: Supported Link Functions
Electro Industries/GaugeTech
Electro Industries/GaugeTech
The Leader In Power Monitoring and Smart Grid Solutions
The Leader In Power Monitoring and Smart Grid Solutions
Doc#
E149721
C-1
C: DNP Mapping
[dst] and [src] are the device address of the Shark® 200S meter and Master device,
respectively. Refer to Section C.7 for more detail on supported frames for the data
link layer.
In order to establish optimal communication with the Shark® 200S meter, we
recommend that you perform the Reset Link and Reset User functions. The Link
Status is not mandatory, but can be performed as well. The inter-character time-out
for DNP is 1 second. If this amount of time, or more, elapses between two consecutive characters within a FT3 frame, the frame will be dropped.
C.4: Application Layer
The Shark® 200S meter’s DNP version supports the Read, Write, Direct Operate and
Direct Operate Unconfirmed functions.
• The Read function (code 01) provides a means for reading the critical measurement
data from the meter. This function should be posted to read object 60 variation 1,
which will read all the available Class 0 objects from the DNP register map. See the
register map in Section C.6. In order to retrieve all objects with their respective
variations, the qualifier must be set to ALL (0x06). See Section C.7 for an example
showing a read Class 0 request data from the meter.
• The Write function (code 02) provides a means for clearing the Device restart bit in
the Internal Indicator register only. This is mapped to Object 80, point 0 with variation 1. When clearing the restart device indicator use qualifier 0. Section C.7 shows
the supported frames for this function.
• The Direct Operate function (code 05) is intended for resetting the energy counters
and the Demand counters (minimum and maximum energy registers). These
actions are mapped to Object 12, points 0 and 2, which act as control relays. The
relays must be operated (On) in 0 msec and released (Off) in 1 msec only. Qualifiers 0x17 or x28 are supported for writing the energy reset. Sample frames are
shown in Section C.7.
• The Direct Operate Unconfirmed (or Unacknowledged) function (code 06) is
intended for asking the communication port to switch to Modbus RTU protocol from
DNP. This switching acts as a control relay mapped into Object 12, point 1 in the
meter. The relay must be operated with qualifier 0x17, code 3 count 0, with 0
milliseconds on and 1 millisecond off, only. After sending this request the current
Electro Industries/GaugeTech
Electro Industries/GaugeTech
The Leader In Power Monitoring and Smart Grid Solutions
The Leader In Power Monitoring and Smart Grid Solutions
Doc#
E149721
C-2
C: DNP Mapping
communication port will accept Modbus RTU frames only. To make this port go back
to DNP protocol, the unit must be powered down and up. Section C.7 shows the
constructed frame to perform DNP to Modbus RTU protocol change.
C.5: Error Reply
In the case of an unsupported function, or any other recognizable error, an error reply
is generated from the Shark® 200S meter to the Primary station (the requester). The
Internal Indicator field will report the type of error: unsupported function or bad
parameter.
The broadcast acknowledge and restart bit are also signaled in the Internal Indicator
field, but they do not indicate an error condition.
C.6: Shark® 200S Meter’s DNP Register Map
Object 10 - Binary Output States
Object
Point
Var
Description
Format
10
0
2
Reset Energy
Counters
BYTE
10
1
2
Change to
Modbus RTU
Protocol
10
2
2
Reset Demand
Cntrs (Max /
Min )
Range
Multiplier
Units
Comments
Always 1
N/A
None
Read by Class 0 or with
qualifier 0, 1, 2, or 6
BYTE
Always 1
N/A
None
Read by Class 0 or with
qualifier 0, 1, 2, or 6
BYTE
Always 1
N/A
None
Read by Class 0 or with
qualifier 0, 1, 2, or 6
Object 12 - Control Relay Outputs
Object
Point
Var
12
0
1
12
1
1
Description
Format
Range
Multiplier
Units
Comments
Reset Energy
Counters
N/A
N/A
N/A
none
Responds to Function 5
(Direct Operate), Qualifier Code 17x or 28x,
Control Code 3, Count 0,
On 0 msec, Off 1 msec
ONLY.
Change to
Modbus RTU
Protocol
N/A
N/A
N/A
none
Responds to Function 6
(Direct Operate - No
Ack), Qualifier Code
17x, Control Code 3,
Count 0, On 0 msec, Off
1 msec ONLY.
Electro Industries/GaugeTech
Electro Industries/GaugeTech
The Leader In Power Monitoring and Smart Grid Solutions
The Leader In Power Monitoring and Smart Grid Solutions
Doc#
E149721
C-3
C: DNP Mapping
Object
Point
Var
12
2
1
Description
Reset Demand
Counters (Max
/ Min)
Format
Range
Multiplier
Units
Comments
N/A
N/A
N/A
none
Responds to Function 5
(Direct Operate), Qualifier Code 17x or 28x,
Control Code 3, Count 0,
On 0 msec, Off 1 msec
ONLY.
Object 20 - Binary Counters (Primary Readings) - Read via Class 0 or with
qualifier 0, 1, 2, or 6
Object
Point
Var
20
0
5
20
1
20
Description
Format
Range
Multiplier
Units
W-hours,
Positive
UINT32
0 to
99999999
Multiplier =
10(n-d),
where n and d
are derived
from the
energy format.
n = 0, 3, or 6
per energy
format scale
and d =
number of
decimal
places.
5
W-hours,
Negative
UINT32
0 to
99999999
Whr
2
5
VAR-hours,
Positive
UINT32
0 to
99999999
VARhr
20
3
5
VAR-hours,
Negative
UINT32
0 to
99999999
VARhr
20
4
5
VA-hours,
Total
UINT32
0 to
99999999
VAhr
Whr
Comments
example:
energy format =
7.2K and Whours counter =
1234567 n=3 (K
scale), d=2 ( 2
digits after decimal point), multiplier = 10(3-2)
= 101 = 10, so
energy is
1234567 * 10
Whrs, or
12345.67 KWhrs
Object 30 - Analog Inputs (Secondary Readings) - Read via Class 0 or with
qualifier 0, 1, 2, or 6
Object
Point
Var
Description
30
0
4
Meter Health
sint16
0 or 1
N/A
None
0 = OK
30
1
4
Volts A-N
sint16
0 to 32767
(150 / 32768)
V
Values above
150V
secondary
read 32767.
30
2
4
Volts B-N
sint16
0 to 32767
(150 / 32768)
V
30
3
4
Volts C-N
sint16
0 to 32767
(150 / 32768)
V
Electro Industries/GaugeTech
Electro Industries/GaugeTech
Format
The Leader In Power Monitoring and Smart Grid Solutions
The Leader In Power Monitoring and Smart Grid Solutions
Range
Doc#
Multiplier
E149721
Units
Comments
C-4
C: DNP Mapping
Object
Point
Var
Description
30
4
4
Volts A-B
sint16
0 to 32767
(300 / 32768)
V
30
5
4
Volts B-C
sint16
0 to 32767
(300 / 32768)
V
30
6
4
Volts C-A
sint16
0 to 32767
(300 / 32768)
V
30
7
4
Amps A
sint16
0 to 32767
(10 / 32768)
A
30
8
4
Amps B
sint16
0 to 32767
(10 / 32768)
A
30
9
4
Amps C
sint16
0 to 32767
(10 / 32768)
A
30
10
4
Watts, 3-Ph
total
sint16
-32768 to
+32767
(4500 /
32768)
W
30
11
4
VARs, 3-Ph
total
sint16
-32768 to
+32767
(4500 /
32768)
VAR
30
12
4
VAs, 3-Ph total
sint16
0 to +32767
(4500 /
32768)
VA
30
13
4
Power Factor,
3-Ph total
sint16
-1000 to
+1000
0.001
None
30
14
4
Frequency
sint16
0 to 9999
0.01
Hz
30
15
4
Positive Watts,
3-Ph,
Maximum Avg
Demand
sint16
-32768 to
+32767
(4500 /
32768)
W
30
16
4
Positive VARs,
3-Ph,
Maximum Avg
Demand
sint16
-32768 to
+32767
(4500 /
32768)
VAR
30
17
4
Negative
Watts, 3-Ph,
Maximum Avg
Demand
sint16
-32768 to
+32767
(4500 /
32768)
W
30
18
4
Negative
VARs, 3-Ph,
Maximum Avg
Demand
sint16
-32768 to
+32767
(4500 /
32768)
VAR
30
19
4
VAs, 3-Ph,
Maximum Avg
Demand
sint16
-32768 to
+32767
(4500 /
32768)
VA
30
20
4
Angle, Phase A
Current
sint16
-1800 to
+1800
0.1
degree
30
21
4
Angle, Phase B
Current
sint16
-1800 to
+1800
0.1
degree
30
22
4
Angle, Phase C
Current
sint16
-1800 to
+1800
0.1
degree
Electro Industries/GaugeTech
Electro Industries/GaugeTech
Format
The Leader In Power Monitoring and Smart Grid Solutions
The Leader In Power Monitoring and Smart Grid Solutions
Range
Doc#
Multiplier
E149721
Units
Comments
Values above
300V
secondary
read 32767.
Values above
10A
secondary
read 32767.
C-5
C: DNP Mapping
Object
Point
Var
Description
Format
Range
Multiplier
Units
Comments
30
23
4
Angle, Volts
A-B
sint16
-1800 to
+1800
0.1
degree
30
24
4
Angle, Volts
B-C
sint16
-1800 to
+1800
0.1
degree
30
25
4
Angle, Volts
C-A
sint16
-1800 to
+1800
0.1
degree
30
26
4
CT numerator
sint16
1 to 9999
N/A
none
30
27
4
CT multiplier
sint16
1, 10, or 100
N/A
none
30
28
4
CT
denominator
sint16
1 or 5
N/A
none
30
29
4
PT numerator
SINT16
1 to 9999
N/A
none
30
30
4
PT multiplier
SINT16
1, 10, or 100
N/A
none
30
31
4
PT
denominator
SINT16
1 to 9999
N/A
none
30
32
4
Neutral
Current
SINT16
0 to 32767
(10 / 32768)
A
CT ratio =
(numerator
* multiplier)
/ denominator
PT ratio =
(numerator
* multiplier)
/ denominator
For 1A
model, multiplier is (2 /
32768) and
values above
2A
secondary
read 32767
Object 80 - Internal Indicator
Object
Point
Var
80
7
1
Description
Device Restart Bit
Format
Range
Multiplier
Units
N/A
N/A
N/A
none
Comments
Clear via
Function 2
(Write),
Qualifier
Code 0.
C.7: DNP Message Layouts
Legend
All numbers are in hexadecimal base. In addition the following symbols are used.
dst
16 bit frame destination address
src
16 bit frame source address
crc
DNP Cyclic redundant checksum (polynomial
x16+x13+x12+x11+x10+x7+x6+x5+x2+1)
x
transport layer data sequence number
y
application layer data sequence number
Electro Industries/GaugeTech
Electro Industries/GaugeTech
The Leader In Power Monitoring and Smart Grid Solutions
The Leader In Power Monitoring and Smart Grid Solutions
Doc#
E149721
C-6
C: DNP Mapping
Link Layer related frames
Reset Link
Request
05
64
05
C0
dst
src
crc
Reply
05
64
05
00
src
dst
crc
Request
05
64
05
C1
dst
src
crc
Reply
05
64
05
00
src
dst
crc
Request
05
64
05
C9
dst
src
crc
Reply
05
64
05
0B
src
dst
crc
Reset User
Link Status
Application Layer related frames
Clear Restart
Request 05
Cx
64
Cy
0E
02
C4 dst
50 01 00
Reply
64
Cy
0A
81
44 src
dst
int. ind. crc
05
Cx
src
07 07
crc
00 crc
crc
Class 0 Data
Request
05
Cx
64
Cy
0B
01
C4 dst
3C 01 06
src
crc
crc
Request
05
(alternate) Cx
64
Cy
14
01
C4 dst
3C 02 06
src
3C 03
crc
06 3C 04
Reply
(same for
either
request)
05 64
Cx Cy
pt 1
00 00
pt6 pt
pt
pt
pt
06
3C 01
72 44 src
dst
crc
81 int. ind. 14 05 00 00 04 pt 0
pt 2
pt 3
pt 4
20 pt 0
pt 1
pt 2
pt 3
pt 4
7
15
23
31
pt
pt
pt
pt
8
16
24
32
pt 9
pt 17
pt 25
0A 02
Electro Industries/GaugeTech
Electro Industries/GaugeTech
pt 10
pt 18
pt 26
00 00
The Leader In Power Monitoring and Smart Grid Solutions
The Leader In Power Monitoring and Smart Grid Solutions
pt 11
pt 19
pt 27
02 pt0
Doc#
pt 12
pt 20
pt 28
pt1 pt2
E149721
06 crc
pt 1
1E 04
pt 5
pt6
crc
crc
crc
pt 13
pt 21
pt 29
crc
crc
crc
crc
C-7
C: DNP Mapping
Reset Energy
Request 05
Cx
00
64
Cy
00
18
05
00
C4 dst
0C 01 17
crc
src
01 00
crc
03 00
00
00
00
00
01
00
crc
Reply
64
Cy
00
1A
81
00
44 src
dst
int. ind. 0C 01 17
00 00 crc
crc
01 00
03
00
00
00
00
00
crc
05
Cx
01
05
Request
(alternate) Cx
01
64
Cy
00
1A
05
00
Reply
64
Cy
00
1C 44 src
dst
crc
81 int. ind. 0C 01 28 01 00
01 00 00 00 00 crc
05
Cx
00
C4 dst
src
0C 01 28 01 00
00 00 crc
crc
00 00
03
00
00
00
00
00
crc
00
00
03
00
00
00
crc
Switch to Modbus
Request 05
Cx
00
64
Cy
00
18
06
00
C4 dst
0C 01 17
crc
src
01 01
crc
03 00
00
00
00
00
01
00
crc
No Reply
Reset Demand (Maximums & Minimums)
Request 05
Cx
00
64
Cy
00
18
05
00
C4 dst
0C 01 17
crc
src
01 02
crc
03 00
00
00
00
00
01
00
crc
Reply
05
Cx
01
64
Cy
00
1A
81
00
44 src
dst
int. ind. 0C 01 17
00 00 crc
crc
01 02
03
00
00
00
00
00
crc
Request 05
(alternate) Cx
01
64
Cy
00
1A
05
00
C4 dst
src
0C 01 28 01 02
00 00 crc
crc
00 00
03
00
00
00
00
00
crc
Reply
64
Cy
00
1C 44 src
dst
crc
81 int. ind. 0C 01 28 01 02
01 00 00 00 00 crc
00
00
03
00
00
00
crc
05
Cx
00
Error Reply
Reply
05
Cx
64
Cy
0A 44 src
dst
81 int. ind. crc
Electro Industries/GaugeTech
Electro Industries/GaugeTech
The Leader In Power Monitoring and Smart Grid Solutions
The Leader In Power Monitoring and Smart Grid Solutions
crc
Doc#
E149721
C-8
C: DNP Mapping
C.8: Internal Indication Bits
Bits implemented in the Shark® 200S meter are listed below. All others are always
reported as zeroes.
Bad Function
Occurs if the function code in a User Data request is not Read (0x01), Write (0x02),
Direct Operate (0x05), or Direct Operate, No Ack (0x06).
Object Unknown
Occurs if an unsupported object is specified for the Read function. Only objects 10,
20, 30, and 60 are supported.
Out of Range
Occurs for most other errors in a request, such as requesting points that don’t exist or
direct operate requests in unsupported formats.
Buffer Overflow
Occurs if a read request or a read response is too large for its respective buffer. In
general, if the request overflows, there will be no data in the response while if the
response overflows at least the first object will be returned. The largest acceptable
request has a length field of 26, i.e. link header plus 21 bytes more, not counting
checksums. The largest possible response has 7 blocks plus the link header.
Restart
All Stations
These 2 bits are reported in accordance with standard practice.
Electro Industries/GaugeTech
Electro Industries/GaugeTech
The Leader In Power Monitoring and Smart Grid Solutions
The Leader In Power Monitoring and Smart Grid Solutions
Doc#
E149721
C-9
C: DNP Mapping
This page intentionally left blank.
Electro Industries/GaugeTech
Electro Industries/GaugeTech
The Leader In Power Monitoring and Smart Grid Solutions
The Leader In Power Monitoring and Smart Grid Solutions
Doc#
E149721
C - 10
D: Using the USB to IrDA Adapter
D: Using the USB to IrDA Adapter (CAB6490)
D.1: Introduction
Com 1 of the Shark® 200S meter is the IrDA port, located on the face of the meter.
One way to communicate with the IrDA port is with EIG's USB to IrDA Adapter
(CAB6490), which allows you to access the Shark® 200S meter's data from a PC. This
Appendix contains instructions for installing the USB to IrDA Adapter.
D.2: Installation Procedures
You can order CAB6490 from EIG’s webstore: www.electroind.com/store. Select
Cables and Accessories from the list on the left side of the screen. The USB to IrDA
Adapter comes packaged with a USB cable and an Installation CD. Follow this procedure to install the Adapter on your PC.
1. Connect the USB cable to the USB to IrDA Adapter, and plug the USB into your PC's
USB port.
2. Insert the Installation CD into your PC's CD ROM drive.
3. You will see the screen shown below. The Found New Hardware Wizard allows you
to install the software for the Adapter. Click the Radio Button next to Install from
a list or specific location.
4. Click Next. You will see the screen shown on the next page.
Electro Industries/GaugeTech
Electro Industries/GaugeTech
The Leader In Power Monitoring and Smart Grid Solutions
The Leader In Power Monitoring and Smart Grid Solutions
Doc#
E149721
D-1
D: Using the USB to IrDA Adapter
Select
these
options
5. Make sure the first Radio Button and the first Checkbox are selected, as shown
above. These selections allow the Adapter's driver to be copied from the
Installation disk to your PC.
6. Click Next. You will see the screen shown below.
7. When the driver for the Adapter is found, you will see the screen shown on the next
page.
Electro Industries/GaugeTech
Electro Industries/GaugeTech
The Leader In Power Monitoring and Smart Grid Solutions
The Leader In Power Monitoring and Smart Grid Solutions
Doc#
E149721
D-2
D: Using the USB to IrDA Adapter
8. You do not need to be concerned about the message on the bottom of the screen.
Click Next to continue with the installation.
9. You will see the two windows shown below. Click Continue Anyway.
Electro Industries/GaugeTech
Electro Industries/GaugeTech
The Leader In Power Monitoring and Smart Grid Solutions
The Leader In Power Monitoring and Smart Grid Solutions
Doc#
E149721
D-3
D: Using the USB to IrDA Adapter
10.You will see the screen shown below while the Adapter's driver is being installed on
your PC.
11.When driver installation is complete, you will see the screen shown below.
12.Click Finish to close the Found New Hardware Wizard.
IMPORTANT! Do NOT remove the Installation CD until the entire procedure
has been completed.
Electro Industries/GaugeTech
Electro Industries/GaugeTech
The Leader In Power Monitoring and Smart Grid Solutions
The Leader In Power Monitoring and Smart Grid Solutions
Doc#
E149721
D-4
D: Using the USB to IrDA Adapter
13.Position the USB to IrDA Adapter so that it points directly at the IrDA on the front
of the Shark® 200S meter. It should be as close as possible to the meter, and not
more than 15 inches/38 cm away from it.
14.The Found New Hardware Wizard screen opens again. This time, click the Radio
Button next to Install the software automatically.
15.Click Next. You will see the screen shown below.
16.Make sure the first Radio Button and the first Checkbox are selected, as shown
above screen. Click Next. You will see the two screens shown on the next page.
Electro Industries/GaugeTech
Electro Industries/GaugeTech
The Leader In Power Monitoring and Smart Grid Solutions
The Leader In Power Monitoring and Smart Grid Solutions
Doc#
E149721
D-5
D: Using the USB to IrDA Adapter
Electro Industries/GaugeTech
Electro Industries/GaugeTech
The Leader In Power Monitoring and Smart Grid Solutions
The Leader In Power Monitoring and Smart Grid Solutions
Doc#
E149721
D-6
D: Using the USB to IrDA Adapter
17.When installation is complete, you will see the screen shown below.
18.Click Finish to close the Found New Hardware Wizard.
19.To verify that your Adapter has been installed properly, click Start>Settings>Control Panel>System>Hardware>Device Manager. The USB to IrDA
Adapter should appear under both Infrared Devices and Modems (click on the +
sign to display all configured modems). See the example screen on the next page.
Electro Industries/GaugeTech
Electro Industries/GaugeTech
The Leader In Power Monitoring and Smart Grid Solutions
The Leader In Power Monitoring and Smart Grid Solutions
Doc#
E149721
D-7
D: Using the USB to IrDA Adapter
NOTE: If the Adapter doesn't show up under Modems, move it away from the
meter for a minute and then position it pointing at the IrDA, again.
20.Double-click on the Standard Modem over IR link (this is the USB to IrDA
Adapter). You will see the Properties screen for the Adapter.
21.Click the Modem tab. The Com Port that the Adapter is using is displayed in the
screen.
22.Use this Com Port to connect to the meter from your PC, using the Communicator
EXT software. Refer to Chapter 2 of the Communicator EXT User Manual for
detailed connection instructions.
Electro Industries/GaugeTech
Electro Industries/GaugeTech
The Leader In Power Monitoring and Smart Grid Solutions
The Leader In Power Monitoring and Smart Grid Solutions
Doc#
E149721
D-8