1
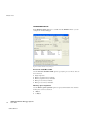
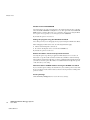
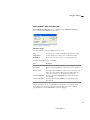
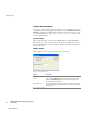
IAR C-SPY Hardware
Debugger Systems
User Guide
for Renesas
PC7501 Emulator and Compact Emulator
CSPC7501R-3
CSPC7501R-3
COPYRIGHT NOTICE
Copyright © 1995–2010 IAR Systems AB.
No part of this document may be reproduced without the prior written consent of IAR
Systems AB. The software described in this document is furnished under a license and
may only be used or copied in accordance with the terms of such a license.
DISCLAIMER
The information in this document is subject to change without notice and does not
represent a commitment on any part of IAR Systems. While the information contained
herein is assumed to be accurate, IAR Systems assumes no responsibility for any errors
or omissions.
In no event shall IAR Systems, its employees, its contractors, or the authors of this
document be liable for special, direct, indirect, or consequential damage, losses, costs,
charges, claims, demands, claim for lost profits, fees, or expenses of any nature or kind.
TRADEMARKS
IAR Systems, IAR Embedded Workbench, C-SPY, visualSTATE, From Idea To Target,
IAR KickStart Kit, IAR PowerPac, IAR YellowSuite, IAR Advanced Development Kit,
IAR, and the IAR Systems logotype are trademarks or registered trademarks owned by
IAR Systems AB. J-Link is a trademark licensed to IAR Systems AB.
Microsoft and Windows are registered trademarks of Microsoft Corporation.
Renesas is a registered trademark of Renesas Electronics Corporation.
Adobe and Acrobat Reader are registered trademarks of Adobe Systems Incorporated.
All other product names are trademarks or registered trademarks of their respective
owners.
EDITION NOTICE
Third edition: June 2010
Part number: CSPC7501R-3
Internal reference: IJOA.
CSPC7501R-3
Contents
Preface
.................................................................................................................................... v
Who should read this guide ...........................................................................v
How to use this guide .........................................................................................v
What this guide contains ................................................................................vi
Other documentation .......................................................................................vi
Document conventions ...................................................................................vii
Introduction to C-SPY hardware debugger systems
..... 1
Overview .....................................................................................................................1
Differences between the C-SPY systems ...................................................2
The emulator drivers .........................................................................................2
Getting started with the emulator .................................................................3
Setting up C-SPY hardware debugger systems ..................... 5
Generic options for hardware debugging ............................................5
Setup options .....................................................................................................5
Download options ............................................................................................6
Extra Options ....................................................................................................7
Images .................................................................................................................7
Using the emulator ................................................................................................. 9
Setting up the debugger system .................................................................9
Communication ................................................................................................9
Emulator menu .................................................................................................... 11
Hardware Setup ............................................................................................. 12
Edit Memory Map dialog box .................................................................... 15
Download Firmware ..................................................................................... 16
TCP/IP Setup ................................................................................................. 16
Trace Setup ..................................................................................................... 16
Trace ................................................................................................................ 17
iii
CSPC7501R-2:1
Using breakpoints .............................................................................................. 17
Breakpoint Usage dialog box ..................................................................... 17
IAR C-SPY Hardware Debugger Systems
iv
User Guide
CSPC7501R-2:1
Preface
Welcome to the IAR C-SPY Hardware Debugger Systems User Guide for
Renesas PC7501 Emulator and Compact Emulator. The purpose of this guide
is to provide you with detailed reference information that can help you use the
features in the IAR C-SPY® Hardware Debugger Systems.
Note: Because the descriptions apply to more than one debugger system, and
because the debugger systems support more than one microcontroller, some
of the features and options described might not apply to your particular
combination of hardware debugger and microcontroller.
Who should read this guide
You should read this guide if you want to get the most out of the features in the C-SPY
hardware debugger systems. In addition, you should have a working knowledge of:
●
●
●
●
The C or C++ programming language
Application development for embedded systems
The architecture and instruction set of the target processor (refer to the chip
manufacturer's documentation)
The operating system of your host machine.
This guide also assumes that you already have a working knowledge of the target system
you are using, as well as some working knowledge of the IAR C-SPY Debugger. For a
quick introduction to the IAR C-SPY Debugger, see the tutorials available in the IAR
Embedded Workbench® IDE User Guide.
How to use this guide
This guide describes the C-SPY interface to the target system you are using; it does not
describe the general features available in the IAR C-SPY Debugger or the hardware
target board. To take full advantage of the whole debugger system, you must read this
guide in combination with:
●
●
The IAR Embedded Workbench® IDE User Guide which describes the general
features available in the C-SPY debugger
The documentation supplied with the target board you are using.
v
CSPC7501R-2:1
What this guide contains
Note that additional features may have been added to the software after the IAR C-SPY
Hardware Debugger Systems User Guide was produced. The release notes contain the
latest information.
What this guide contains
Below is a brief outline and summary of the chapters in this guide.
●
●
●
Introduction to C-SPY hardware debugger systems introduces you to the available
C-SPY hardware debugger systems to be used with the target board. The chapter
briefly shows the difference in functionality provided by the different C-SPY
drivers.
Setting up C-SPY hardware debugger systems describes the general options that
must be set for all hardware debugger systems.
Using the emulator describes the additional options, menus, and features provided
by the emulator debugger systems.
Other documentation
The complete set of IAR development tools for the target processor are described in a
series of guides. For information about:
●
●
●
●
Programming for the IAR Compiler, refer to the IAR C/C++ Compiler Reference
Guide
Programming for the IAR Assembler, refer to the IAR Assembler Reference Guide
Using the IAR XLINK Linker, the IAR XAR Library Builder, and the IAR XLIB
Librarian, refer to the IAR Linker and Library Tools Reference Guide
Using the IAR CLIB or DLIB library, refer to the IAR Embedded Workbench IDE
online help system.
All of these guides are delivered in hypertext PDF or HTML format on the installation
media. Some of them are also delivered as printed books.
Recommended web sites:
●
●
●
IAR C-SPY Hardware Debugger Systems
vi
User Guide
CSPC7501R-2:1
The Renesas web site, www.renesas.com, contains information and news about the
target processors.
The IAR Systems web site, www.iar.com, holds application notes and other
product information.
Finally, the Embedded C++ Technical Committee web site,
www.caravan.net/ec2plus, contains information about the Embedded C++
standard.
Preface
Document conventions
This book uses the following typographic conventions:
Style
Used for
computer
Filename or text that you type or that appears on the screen.
parameter
A label representing the actual value you should type as part of a
command.
bold
Names of menus, menu commands, buttons, and dialog boxes that
appear on the screen.
reference
A cross-reference within this guide or to another guide.
Identifies instructions specific to the IAR Embedded Workbench IDE
interface.
Identifies instructions specific to the command line interface.
Identifies helpful tips and programming hints.
Table 1: Typographic conventions used in this guide
vii
CSPC7501R-2:1
Document conventions
IAR C-SPY Hardware Debugger Systems
viii
User Guide
CSPC7501R-2:1
Introduction to C-SPY
hardware debugger
systems
This guide introduces you to the IAR C-SPY hardware debugger systems and
to how they differ from the IAR C-SPY Simulator.
This guide assumes that you already have some working knowledge of the
target system you are using, as well as some working knowledge of the IAR
C-SPY Debugger. For a quick introduction, see the tutorials in the IAR
Embedded Workbench® IDE User Guide.
Please note that a few additional features may have been added to the software
after this guide was produced. The release notes contain the latest
information. Also remember that not all options and features apply to your
particular combination of hardware debugger and microcontroller.
Overview
The IAR C-SPY Debugger consists of both a general part which provides a basic set of
C-SPY features, and a driver. The C-SPY driver is the part that provides communication
with and control of the target system. The driver also provides a user interface—special
menus, windows, and dialog boxes—to the functions provided by the target system, for
instance special breakpoints. This driver is automatically installed during the
installation of IAR Embedded Workbench.
This guide describes the operation of the following IAR C-SPY Debugger drivers:
●
●
PC7501 emulator driver
Compact Emulator driver.
For further details about the concepts that are related to the IAR C-SPY Debugger, see
the IAR Embedded Workbench® IDE User Guide.
1
CSPC7501R-2:1
The emulator drivers
DIFFERENCES BETWEEN THE C-SPY SYSTEMS
The following table summarizes the key differences between the C-SPY target systems:
Feature
Simulator
Data breakpoints
x
Code breakpoint (OP-fetch)
x
Execution in real time
Simulated interrupts
x
x
x
x
x
x
x1
x1
x
Data coverage
x
Profiling
x
Trace
x
x2
Execution time counter
Code coverage
Compact Emulator
x
Real interrupts
Cycle counter
PC7501 Emulator
x3
x
x
x
Table 2: Differences between available debug support for different target systems
1. Not during single-stepping.
2. Only one at a time.
3. Limited to small code sections and a maximum of 64 breakpoints.
Contact your software distributor or IAR Systems representative for information about
available C-SPY drivers. Below are general descriptions of the different drivers.
The emulator drivers
To use the C-SPY debugger for the your emulator debugger, you must choose the
emulator driver—PC7501 Emulator or Compact Emulator—on the Debugger Setup
page in the IAR Embedded Workbench IDE.
The C-SPY driver is the part that provides communication with and control of the target
system. The driver also provides the user interface—menus, windows, and dialog
IAR C-SPY Hardware Debugger Systems
2
User Guide
CSPC7501R-2:1
Introduction to C-SPY hardware debugger systems
boxes—to the functions provided by the target system, for instance, control of the
available hardware breakpoints.
Host computer
C-SPY
Debugger
C-SPY driver
LAN or USB
connection
On-chip
emulation
CPU
Memory
Emulator
Figure 1: Communication overview
GETTING STARTED WITH THE EMULATOR
This section demonstrates how to get started with the IAR C-SPY Emulator. The
application is built and downloaded to the target system, and then executed.
As an example, use one of the example project available by choosing
Help>Startup Screen. Click on the Example workspaces button. In the
Open Example Workspace dialog, select C and C++ tutorial. In the Workspace
window that appears, click the tutor page.
Running the application
1 Select the Debug build configuration from the drop-down list at the top of the
Workspace window.
2 Choose Project>Options to choose the derivative to emulate and the settings you want
to use.
For more information about the C-SPY Emulator options, see Using the emulator, page
9.
Click OK to close the Options dialog box.
3
CSPC7501R-2:1
The emulator drivers
3 Choose Project>Make to compile and link the source code.
4 Start C-SPY by clicking the Debug button or by choosing Project>Debug. The
Hardware Setup dialog box appears. Press OK; C-SPY will download the application
to the target system.
5 To open the Terminal I/O window, choose View>Terminal I/O.
6 Choose Debug>Go or click the Go button to start the execution.
7 Click the Stop button to stop the execution or wait until program exit is reached.
IAR C-SPY Hardware Debugger Systems
4
User Guide
CSPC7501R-2:1
Setting up C-SPY
hardware debugger
systems
This chapter describes the generic options and settings for the drivers.
Generic options for hardware debugging
Before you start the C-SPY debugger you must set up the generic options for the
debugger system. Choose Project>Options to open the Options dialog box.
SETUP OPTIONS
On the Setup page, select the appropriate driver.
Figure 2: Project options dialog box
5
CSPC7501R-2:1
Generic options for hardware debugging
For information about the settings Setup macros, Run to, and Device description file,
as well as for information about the Plugins page, see the IAR Embedded Workbench®
IDE User Guide.
To set the driver-specific options, select the appropriate driver from the Category list.
When you have set all the required options, click OK in the Options dialog box. See
Using the emulator, page 9 for details about these options.
DOWNLOAD OPTIONS
The Download page contains the options related to downloading.
Figure 3: Download page
Verify download
Select this option to check every byte after loading to verify the download and that the
memory of the target hardware is writable and mapped in a consistent way. A warning
message will be generated if there are any errors during download.
Suppress download
If you already have your application in memory, for instance when debugging a live
target, select Suppress Download. The time-consuming downloading is then disabled.
The implicit RESET performed at C-SPY startup is not disabled.
IAR C-SPY Hardware Debugger Systems
6
User Guide
CSPC7501R-2:1
Setting up C-SPY hardware debugger systems
EXTRA OPTIONS
The Extra Options page provides you with a command line interface to the C-SPY
debugger.
Figure 4: Extra Options page for C-SPY command line options
Use command line options
Additional command line arguments (not supported by the IAR Embedded Workbench
IDE) for the C-SPY debugger can be specified here.
IMAGES
On the Images page you can specify additional debug files to be downloaded.
Figure 5: Images page for C-SPY
7
CSPC7501R-2:1
Generic options for hardware debugging
Use Extra Images
Use the text boxes to specify additional images that you want to be downloaded:
Path
Specifies the debug file to be downloaded. A browse button is
available for your convenience.
Suppress download
Downloads only debug information, and not the complete
debug file.
If you want to download more than three images, use the related C-SPY macro described
in the IAR Embedded Workbench® IDE User Guide.
IAR C-SPY Hardware Debugger Systems
8
User Guide
CSPC7501R-2:1
Using the emulator
This chapter describes the driver-specific options and settings needed for
using the C-SPY PC7501 or Compact Emulator debugger system. The chapter
also describes how to use the debugger. The application can be run in real time
when using these features, which provides a powerful tool for locating
problems in the application or the hardware.
Note: Not all options and features apply to your particular combination of
emulator debugger and microcontroller. Refer to the documentation for your
emulator.
Setting up the debugger system
Before you start the C-SPY debugger you must set up the generic options for the
debugger system. For information about how to do this, see the chapter Setting up C-SPY
hardware debugger systems in this guide. When this is done, you must set the
emulator-specific options. To set emulator options, choose Project>Options and click
the Communication tab in the C-SPY Debugger>PC7501 Emulator or the C-SPY
Debugger>Compact Emulator category, respectively.
COMMUNICATION
With the options on the Communication page you can modify the behavior of the
communication with the emulator.
Figure 6: Emulator communication options
9
CSPC7501R-2:1
Setting up the debugger system
USB
Use this option if an emulator is connected to your host computer via a USB cable. If
more than one emulator is connected, choose which one to use with the Serial No
option.
LAN
Use this option to debug using a PC7501 Emulator on the same local area network that
your host computer is connected to. The emulator must first be assigned a TCP/IP
address with the Emulator>TCP/IP Setup command, see Emulator menu, page 11.
Log communication
Use this option to log the communication between C-SPY and the target system to a file.
To interpret the result, a detailed knowledge of the communication protocol is required.
HARDWARE CONFIGURATION
Before C-SPY is started for the first time in a new project, and when you change the
derivative, the hardware must have been set up. If you have not set it up already by
choosing Emulator>Hardware Setup, this dialog box will be displayed when you start
the debugging session.
Figure 7: Emulator Hardware Setup message
Click OK to enter the Hardware Setup dialog box. See Hardware Setup, page 12.
When the hardware setup is done and you click OK, the download of the debug file is
started.
If the debug file contains a memory area that is not defined in the hardware setup, several
warnings will be displayed in the Debug Log window.
The hardware setup is saved for each project and does not have to be set more than once.
If you want to change the setup for a project, choose Hardware Setup from the
Emulator menu.
For further details about the Emulator menu, see Emulator menu, page 11.
IAR C-SPY Hardware Debugger Systems
10
User Guide
CSPC7501R-2:1
Using the emulator
Emulator menu
The Emulator menu appears when you run any of the C-SPY emulator drivers.
Figure 8: The Emulator menu
Menu command
Description
Hardware Setup
Displays the Hardware Setup dialog box, in which the basic
configuration for the emulator is done.
Download Firmware
Opens a dialog box for selecting a firmware file to download to the
target board.
TCP/IP Setup
Opens a dialog box where you can assign a TCP/IP address to the
emulator.
Trace Setup
Opens a dialog box where you can make some basic trace settings.
Trace
Opens the Trace window where the recorded trace data is shown.
Breakpoint Usage
Opens the Breakpoint Usage dialog box, which lists all activated
breakpoints.
Table 3: Description of Emulator menu commands
11
CSPC7501R-2:1
Emulator menu
HARDWARE SETUP
In the Hardware Setup dialog box—available from the Emulator menu—you can
configure the emulator debugger.
Figure 9: Emulator Hardware Setup dialog box
Processor mode/Bus width
Use the Processor mode/Bus width options to specify the processor mode. You can
choose between:
●
●
●
●
●
Single-chip mode
Memory expansion mode, 8-bit bus
Memory expansion mode, 16-bit bus
Microprocessor mode, 8-bit bus
Microprocessor mode, 16-bit bus.
Memory space expansion
Use the Memory space expansion options to specify if the hardware has extended
memory. You can choose between:
●
●
IAR C-SPY Hardware Debugger Systems
12
User Guide
CSPC7501R-2:1
1 Mbytes
1.7 Mbytes
Using the emulator
●
4 Mbytes.
PM13 (enable FLASH > 192K & RAM > 16K)
To extend the internal reserved memory area, select this option to set the control bit
(PM13, bit 3 at 000005H) to 1. By default, the internal reserved area expansion bit is set
to 0. When this option is selected, flash memory larger than 192 Kbytes and RAM larger
than 16 Kbytes can be used.
PM10 (enable data FLASH)
Select this option to set the CS2 area select bit (PM10, bit 0 at 000005H) to 1. By default,
the CS2 area select bit is set to 0. When this option is selected, data flash memory can
be used.
Main clock
Use the Main clock options to set the CPU clock source:
●
●
●
The Internal option uses the target clock as the CPU clock
The External option uses the emulator as the CPU clock
The Generated option uses a clock generated by the PC7501 Emulator, running at a
frequency between 1000 kHz and 99,999 kHz. Type the desired frequency.
Sub clock
Use the Sub clock options to set the CPU sub clock source:
●
●
The Internal option uses the target clock as the CPU sub clock.
The External option uses the emulator as the CPU sub clock
Memory map
With the Memory map options you can specify the emulation memory areas.
To define a new memory area, click the New button. This opens the Edit Memory Map
dialog box; see Edit Memory Map dialog box, page 15.
To edit an existing user-defined memory area, select it in the list and click Edit to open
the Edit Memory Map dialog box; see Edit Memory Map dialog box, page 15.
To clear an existing user-defined memory area, select it in the Memory map list and
click Delete.
13
CSPC7501R-2:1
Emulator menu
Disable internal FLASH ROM
Select this option to prevent your application to be downloaded into the microcontroller
unit’s internal FLASH ROM. You might have to use this option if the internal FLASH
ROM cannot be rewritten. This is the case, for instance, when you are using the MCU
in low power mode; typically at a clock frequency below 10,000 kHz.
By default, this option is not selected.
Debug the program using the CPU Rewrite Mode
Select this option if you are debugging the target system using the CPU Rewrite Mode.
When debugging in CPU rewrite mode, the following limitations apply:
●
●
Address match breakpoints cannot be set
No software breakpoints can be set in the internal ROM area.
By default, the option is not selected.
Enable the address match interrupt break function
Selecting this option stops the target application immediately before it executes an
instruction at a specified address. This mechanism uses the MCU’s address interrupt
function (that is, hardware breakpoints), so when you debug that interrupt function itself
you must deselect this option. The number of available hardware breakpoints depends
on the derivative you are using.
Overwrite data in FLASH without erasing the FLASH area block
If you select this option, writing to the flash memory area will merge the new data with
the previous flash contents, and the addresses that are not being written to will keep their
previous contents.
Factory Settings
Click the Factory Settings button to restore the factory settings.
IAR C-SPY Hardware Debugger Systems
14
User Guide
CSPC7501R-2:1
Using the emulator
EDIT MEMORY MAP DIALOG BOX
In the Edit Memory Map dialog box—available from the Hardware Setup dialog
box—you can specify emulation memory areas.
Figure 10: Edit Memory Map dialog box
Memory range
Use these settings to define the emulation memory areas:
Type
The memory type; see Table 4, Available memory types in the emulator.
Start address
The start address for the memory area, in hexadecimal notation.
End address
The end address for the memory area, in hexadecimal notation.
The following memory types are available:
Type
Description
SFR Area
The size of the SFR area is defined by the device description file.
Internal RAM
The size of the Internal RAM area is defined by the device description
file.
Emulation RAM
The emulator alternate RAM area, which can be selected in steps of 4
Kbytes. Up to four emulation RAM areas can be defined. This is the
only memory area whose size can defined in this dialog box.
Internal DATA/FLASH
The size of the Internal DATA/FLASH area is defined by the device
description file.
Internal FLASH/ROM
The size of the Internal FLASH/ROM area is defined by the device
description file.
Table 4: Available memory types in the emulator
Unallocated memory areas, except the SFR area, are always set as guarded, which
means that they are read- and write-protected. If an application reads or writes in
guarded memory or writes in ROM, the execution is stopped.
15
CSPC7501R-2:1
Emulator menu
DOWNLOAD FIRMWARE
If you need to download new firmware, for example if you are changing the processor
configuration or if you need to upgrade the firmware, choose the Emulator>Download
Firmware command. The emulator firmware files have the filename extension .s and
are located in subdirectories of the target_processor\config\Renesas\ directory
of your product installation.
TCP/IP SETUP
Opens a dialog box where you can assign a TCP/IP address to the PC7501 Emulator.
The first time you do this, you must connect to the emulator via USB. After you have
changed a TCP/IP address, you must switch the emulator off and then on again for the
change to take effect.
TRACE SETUP
Opens a dialog box where you can make some basic trace settings.
Figure 11: Trace Setup dialog box
Option
Description
Time measurement
source
This option decides whether the clock tick counter takes its value
from a built-in 16 MHz clock or increments per executed machine
instruction (Machine cycles). This value is used by both the cycle
counter and the Trace window.
Trace buffer size
The size of the trace buffer in bytes. The trace buffer can be between
10 and 262143 bytes. The larger the buffer is, the longer it takes each
time you stop.
Table 5: Trace Setup options
IAR C-SPY Hardware Debugger Systems
16
User Guide
CSPC7501R-2:1
Using the emulator
TRACE
The Trace window—available from the Emulator menu—displays a recorded sequence
of executed machine instructions. In addition, the window can display trace data for
expressions. For more information, see the IAR Embedded Workbench® IDE User
Guide.
Using breakpoints
This section describes issues related to using breakpoints in the C-SPY hardware
debugger systems.
BREAKPOINT USAGE DIALOG BOX
The Breakpoint Usage dialog box—available from the Emulator menu—lists all
active breakpoints. For more information, see the IAR Embedded Workbench® IDE
User Guide.
C-SPY USE OF BREAKPOINTS
If you set a breakpoint using the IAR CLIB runtime environment, C-SPY sets two
breakpoints for internal use. To do this, the breakpoints in the emulator are used. The
fact that C-SPY uses breakpoints is normally not a problem. However, one exception is
C-SPY profiling, which require many breakpoints. (The emulators have 64 software
breakpoints and 2–8 hardware breakpoints.)
Note: If you are using the IAR DLIB runtime environment, only one internal
breakpoint will be needed per breakpoint that you set.
C-SPY will set a breakpoint if:
●
●
●
the C-SPY option Run to has been selected (one breakpoint is set temporarily after
each reset)
the stack plugin is being used (if the C-SPY option Run to has been selected, the
breakpoint needed for that will be used also by the stack plugin)
the linker option With runtime control modules has been selected (debug support
for program termination and optionally file I/O).
Exceeding the number of available software breakpoints will cause the debugger to
single step. This will significantly reduce the execution speed.
You can prevent the debugger from using breakpoints in these situations by deselecting
these options.
17
CSPC7501R-2:1
Using breakpoints
IAR C-SPY Hardware Debugger Systems
18
User Guide
CSPC7501R-2:1