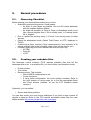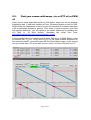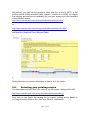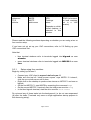
1
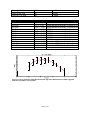
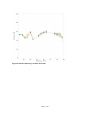
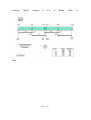
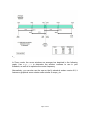
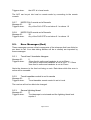
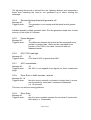
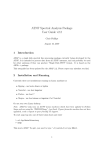
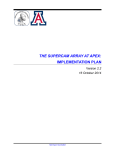
Mopra QRH
The Mopra Quick Reference Handbook
Available online at
http://www.narrabri.atnf.csiro.au/mopra/
Current Date / Version
15 MAY 2013
Author
Dr Balthasar Indermuehle ([email protected])
I
THIS PAGE
INTENTIONALLY
LEFT BLANK
II
Table of contents
1. Preamble................................................................. 1 1.1. How to use the Quick Reference Handbook (QRH) ........................... 1 1.2. Important note..................................................................................... 2 2. Changes .................................................................. 3 3. Observatory Characteristics .................................. 5 3.1. Location .............................................................................................. 5 3.2. System Characteristics ....................................................................... 5 3.3. MOPS configurations .......................................................................... 8 3.4. Data rates ......................................................................................... 12 3.5. Fast mapping mode .......................................................................... 12 4. Command references ........................................... 13 4.1. SPD................................................................................................... 13 4.2. MOTP................................................................................................ 14 4.3. MOPS ............................................................................................... 14 5. Normal procedures ............................................... 15 5.1. Observing Checklist .......................................................................... 15 5.2. Creating your schedule files.............................................................. 15 5.3. Find your zooms with mops_vis or OTF v6 or PSW v5 .................... 16 5.4. Selecting your pointing source.......................................................... 17 5.5. Setting up the observatory software ................................................. 18 5.5.1. Setup using four monitors .......................................................... 19 5.5.2. Setup using two monitors ........................................................... 23 5.6. Setting up your VNC connections ..................................................... 24 5.6.1. Four screen setup ...................................................................... 24 5.6.2. Two screen setup ....................................................................... 25 5.7. Handover between observers ........................................................... 25 5.7.1. Using Python Chat for coordination ........................................... 26 5.7.2. Using Skype Chat for coordination............................................. 26 5.7.3. Handing over from 2-screen to 4-screen and vice versa ........... 26 5.8. Running your observations ............................................................... 27 5.8.1. Moving/copying your schedule files ........................................... 27 III
5.8.2. 5.8.3. 5.8.4. 5.8.5. 5.8.6. Setting focus............................................................................... 27 Pointing ...................................................................................... 28 Starting your observations ......................................................... 29 Verifying your data (QuickData.py) ............................................ 29 Processing your data ................................................................. 30 5.9. Online data analysis tools ................................................................. 31 5.9.1. Beam position mapping tool ....................................................... 31 5.10. Monitoring ....................................................................................... 33 5.10.1. TOAD ....................................................................................... 33 5.10.2. Monica...................................................................................... 37 5.11. Finishing the observations .............................................................. 39 6. Abnormal procedures ........................................... 40 6.1. Restarting TCS ................................................................................. 40 6.2. Restarting MOPS .............................................................................. 40 6.3. Restarting atdaemon......................................................................... 41 6.4. Restarting the ACC ........................................................................... 41 6.4.1. Via remote access / VNC ........................................................... 41 6.4.2. Via MAPS reset button ............................................................... 42 6.5. MOPS programming errors............................................................... 42 6.6. Problems with the VNC sessions...................................................... 43 6.6.1. VNC Server does no longer accept keyboard input ................... 43 6.6.2. Mouse exhibits weird behaviour, can’t set Z-order of windows
when clicking on them. ........................................................................... 43 6.6.3. Ok, VNC completely pooped itself. How can I restart the VNC
Server? ................................................................................................... 43 6.7. Generator messages ........................................................................ 43 6.8. Unable to bring GTP’s down/up into normal range ........................... 44 7. Emergency ............................................................ 45 8. Glossary ................................................................ 46 9. TOAD Message Reference ................................... 46 9.1. Information Messages (Gray) ........................................................... 46 9.1.1. 9.1.2. 9.1.3. 9.1.4. Track has started........................................................................ 46 Track has ended ........................................................................ 46 Tsys high .................................................................................... 46 Tsys noise high .......................................................................... 46 9.2. Caution Messages (Yellow) .............................................................. 46 IV
9.2.1. 9.2.2. 9.2.3. 9.2.4. 9.2.5. 9.2.6. 9.2.7. 9.2.8. 30min WindMax High ................................................................. 47 Telescope idle and not stowed................................................... 47 Generator is running .................................................................. 47 Some lightning activity ............................................................... 47 Heavy lightning activity nearby................................................... 47 ACC in local mode...................................................................... 47 MOPS Pol A counts out of bounds............................................. 48 MOPS Pol B counts out of bounds............................................. 48 9.3. Error Messages (Red)....................................................................... 48 9.3.1. Turret feed / translator disagree ................................................. 48 9.3.2. Turret translator control is not in remote .................................... 48 9.3.3. Severe lightning threat ............................................................... 48 9.3.4. Severe lightning threat with generator off .................................. 49 9.3.5. Focus disagree........................................................................... 49 9.3.6. ACC CPU load high.................................................................... 49 9.3.7. ACC unreachable ....................................................................... 49 9.3.8. Drive Error in AzEl exceeds 1 minute ........................................ 49 9.3.9. Drive Error .................................................................................. 49 9.3.10. MOPS B5 module error ............................................................ 50 9.3.11. MOPS B6 module error ............................................................ 50 9.3.12. Turret rotation control is not in remote ..................................... 50 9.3.13. Focus control is not in remote .................................................. 50 9.3.14. MOPRA PROTECT Hardware Stow ........................................ 50 9.3.15. WIND Hardware Stow .............................................................. 51 9.3.16. NARRABRI Hardware Stow ..................................................... 51 9.3.17. Dataset Query Failed ............................................................... 51 9.3.18. MAPS M Card Error occurred .................................................. 51 9.3.19. Dataset Query Failed (MAPS).................................................. 51 9.3.20. MAPS Serial Heartbeat Error occurred .................................... 51 9.3.21. MAPS System Error occurred .................................................. 51 9.3.22. MOPS Pol A noise diode faulty ................................................ 52 9.3.23. MOPS Pol B noise diode faulty ................................................ 52 9.3.24. Sound is switched off ............................................................... 52 9.3.25. MAPS dataset RPC server down ............................................. 52 9.3.26. Monitoring data error ................................................................ 52 10. Index of Figures.................................................. 52 11. Index of Tables ................................................... 53 V
1.
Preamble
1.1.
How to use the Quick Reference Handbook
(QRH)
The QRH is meant to be used as a reference for all observers. It contains
checklists, procedures and recommendations on how to proceed when certain
conditions exist.
Most importantly, the QRH should be consulted by new observers on how to set
up their observing environment. The QRH alone provides sufficient guidance for
a new observer who has never observed with Mopra before to get all observing
software up and running.
Important notes are outlined like this text. Please take extra care to follow
instructions precisely as indicated.
The QRH features seven sections:
•
•
•
•
•
•
•
Preamble
Changes
Observatory Characteristics
Normal Procedures
Abnormal Procedures
Emergency
TOAD Message Reference
The preamble is this section you are reading now. It contains general
information on how to use this handbook.
Changes provides a list of changes that were made to the QRH. Whenever you
observe with Mopra, you are expected to read at the very least that section of the
QRH. For your convenience, the changes are dated, therefore you only need to
read up on the sections that changed since you last.
The Observatory characteristics section lists tables and figures
characterising the telescope such as beam efficiency, beam maps, tuning
limitations, spectral resolution tables and the likes.
Page 1 of 54
Normal procedures provide you with checklists on how to set up the software
when you take over from previous observers, and how to configure standard
parameters.
The Abnormal procedures section is what you refer to when a problem has
occurred and you need to work around it within the scope of what we expect you
to be able to accomplish.
The Emergency section lists some initial actions you should perform when
operationally critical problems occur, as well as information on whom to contact
and when to contact them.
The TOAD Message Reference gives more detailed information on
message and alert states as issued by TOAD.
1.2.
Important note
The Mopra Telescope is a very complex system exhibiting a plentitude of
peculiarities. It is imperative that instructions are followed to the iota.
The purpose of this QRH is not to give you in depth knowledge about why
things should be done a certain way, but how they should be done to make
sure everything is set up in a way that avoids potential pitfalls.
We herewith acknowledge that certain individuals amongst you are more
proficient than others in matters IT.
We kindly request the advanced users to treat the Mopra VNC sessions as a
critical and static aspect of the Mopra observing software suite. Specifically,
•
please avoid moving windows around and/or opening new terminal
sessions unless required to start observatory software
•
please stick to the two approved observing configurations (see the section
on VNC setup in Normal Procedures for details)
•
please either use your own computer, or a virtual desktop outside the
VNC sessions to log into bigrock and modify, copy and manage files.
The support staff as well as the next observer are grateful for your compliance in
these matters.
Page 2 of 54
2.
Changes
Date
20 JUN 2009
06 JUL 2009
Who
ind006
ind006
07 JUL 2009
ind006
22 JUL 2009
ind006
05 AUG 2009
ind006
17 SEP 2009
ind006
08 OCT 2009
ind006
02 FEB 2010
ind006
What
QRH created
New chapters:
5.2 Creating your schedule
5.3 Selecting your pointing source
5.3 Find your zooms with mops_vis or OTF v6
Modified:
Table formatting has been changed.
5.10 Monitoring
New chapters:
5.8.5 Verifying your data (QuickData.py)
5.10.1 TOAD
New chapters:
5.11 Finishing the observations
Modified:
5.5.1 Setup using four monitors
5.8.1 Moving/copying your schedule files
5.10.1 TOAD
Modified:
Focus position for 3mm
Modified:
Focus position and graphs for 3mm
Modified:
Fig 3 Tsys calculation annotation
New Chapters:
3.5 Fast mapping mode
5.9 Online data analysis tools
6.5 MOPS programming errors
6.6 Problems with the VNC sessions
Modified:
3.3 MOPS configurations
4.1 SPD
Table 8 SPD command reference
03 FEB 2010
ind006
MOTP
5.3 Find your zooms with mops_vis or OTF v6
6.4 Restarting the ACC
New Chapters:
Page 3 of 54
5.7.1 Using Python Chat for coordination
Error! Reference source not found. Error! Reference
source not found.
30 MAY 2011
ind006
Modified:
Replaced missing figure 14
Consistently put captions below figures
5.7.3 Handing over from 2-screen to 4-screen and vice
versa
New Chapters:
5.7.1 Using Python Chat for Coordination
6.8 Unable to bring GTP’s down/up into normal range
Replaced Chapters:
5.7.1 IRC instructions for Coordination (replaced by
Python Chat)
06 AUG 2012
ind006
15 MAY 2013
ind006
Modified:
5.3 Find your zooms with mops_vis or OTF v6 or PSW
v5
5.10 Monitoring
Modified:
3.2 Updated focus position
New Chapters:
5.7.2 Using Skype Chat for coordination
Modified:
Preamble
3.2 Removed Figures 1 & 2 (old focus positions)
Updated global pointing model parameters
3.3 Updated Bandwidths in Table 7
4.1 Updated Table 8
5.1 Added recommendation for pointing maser
5.8.2 Table 12 Focus positions
6.3 Restarting atdaemon
Page 4 of 54
3.
Observatory Characteristics
3.1.
Location
Mopra is located in the foothills of Siding Spring, near Coonabarabran in rural
New South Wales, Australia.
Latitude
S 31° 16’ 04”
S 31.2678
Longitude
E 149° 05’ 59”
E 149.0997
Altitude
866m
866m
Table 1 Observatory position
3.2.
System Characteristics
Parameter
Global pointing model
Global fx
Global fz
Value
8.3”
13.0”
-197.5
10.1
Comment
rms model error in fz
rms model error in fx
Derived October 2008
Derived October 2008
Table 2 Pointing parameters
Band
3mm
7mm
Frequency
77 – 116 GHz
30 – 50 GHz
12mm
16 – 27 GHz
Comment
Due to LO chain tuning limitations,
the center frequency cannot be
within 38 – 44 GHz
Table 3 Tuning and center frequency limitations
Band / Mode
12mm Broadband
12mm Zoom mode
7mm Broadband
7mm Zoom mode
3mm Broadband
3mm Zoom mode
BW
112050 km/s
1863 km/s
56025 km/s
932 km/s
30378 km/s
505 km/s
Resolution
3.38 km/s
0.41 km/s
1.69 km/s
0.21 km/s
0.915 km/s
0.11 km/s
Comment
BW for one entire IF
BW per window
BW for one entire IF
BW per window
BW for one entire IF
BW per window
Table 4 MOPS spectral resolution in all bands
Band
12mm @ 24 GHz
Beam
FWHM
119”
width Average good weather Tsys
~ 70K
Page 5 of 54
7mm @ 42 GHz
3mm @ 90 GHz
3mm @ 115 GHz
82”
38”
30”
~ 80K
~200K
~ 600K
Table 5 Beam widths and average Tsys's
Frequency
16 GHZ
20 GHz
25 GHz
31 GHz
35 GHz
37 GHz
43 GHz
45 GHz
49 GHz
86 GHz
100 GHz
115 GHz
Efficiency
0.55 +/- 0.05
0.5 +/- 0.03
0.55 +/- 0.05
0.5 +/- 0.05
0.57 +/- 0.02
0.58 +/- 0.02
0.55 +/- 0.03
0.53 +/- 0.03
0.46 +/- 0.03
0.49 +/- 0.03
0.44 +/- 0.03
0.42 +/- 0.02
Comment
2009 Measurements by Urquhart et al
2009 Measurements by Urquhart et al
2009 Measurements by Urquhart et al
2009 Measurements by Urquhart et al
2009 Measurements by Urquhart et al
2009 Measurements by Urquhart et al
2009 Measurements by Urquhart et al
2009 Measurements by Urquhart et al
2009 Measurements by Urquhart et al
Based on 2005 data (Ladd et al)
Based on 2005 data (Ladd et al)
Based on 2005 data (Ladd et al)
Table 6 Antenna efficiency
Figure 1 Focus positions at 86 GHz measured July 2012. Gaussian fit to data suggests
best focus position is at 16.2mm.
Page 6 of 54
Figure 2 Antenna efficiency at 12mm and 7mm
Page 7 of 54
Figure 3 Tsys at 3mm from Ladd et al.
The following fit is used to calculate in TOAD whether the Tsys is in range
that yields a somewhat conservative fit to the Ladd data
above. The yellow limit is Tsys[max], the red limit is Tsys[max]+150.
0.02487 f
Tsys[max] = 21.86e
3.3.
MOPS configurations
€
MOPS is a spectrometer implemented as a digital filter bank rather than a
correlator. Note that for historical reasons, it is often and throughout the
community referred to as the correlator as well.
Configuration
BW
[MHz]
mops_2208_8192_4f 2208
mops_2208_1024_4f 2208
mops_il_zoom
138
mops_bn8_zoom
138
Chans
[nch]
8192
1024
4096
4096
Table 7 MOPS configurations and data rates
Page 8 of 54
IF’s [nIF]
4
4
16
8 * 8 bins
Data
rate
[MB/h]
Max 193 MB/h
Max 24 MB/h
Max 770 MB/h
Max 1.44 GB/h
Internally,
MOPS
contains
4
IF’s,
or
Bands.
Refer
to
Figure 4 MOPS bands and IF's to see how they are arranged and relate to each
other.
Page 9 of 54
Figure 4 MOPS bands and IF's
In Zoom mode, the zoom windows are arranged as depicted in the following
graph. Use mops_vis to determine the window numbers to use in your
schedule, as well as to optimize the center frequency.
Alternatively, you can also use the new on the fly schedule maker version 6.0, it
features a graphical zoom window editor similar to mops_vis.
Page 10 of 54
Figure 5 MOPS zoom window definitions
Further to this, the MOPS zoom window setups and spectral resolutions can be
seen in the following graph
Page 11 of 54
Figure 6 MOPS zoom mode specifications
3.4.
Data rates
You need to make sure you bring enough disk space to take your data home.
Refer to Table 7 MOPS configurations and data rates above to calculate the
amount of data your observing run will generate.
3.5.
Fast mapping mode
As of 2010, Mopra now also supports a fast mapping mode, where a maximum of
8 zoom windows can record spectra in 8 time bins per cycle. The cycle time for
fast mapping is changed from 2 seconds to 2.048 seconds, so each time bin
lasts for 256 milliseconds. The data rate correspondingly increases to twice the
amount of regular zoom mode observations. The noise figure also increases by
8 or approximately 3 fold. More information will be available soon.
€
Page 12 of 54
4.
Command references
4.1.
SPD
Command
select 1 2 3 4
select 1 & 2
a
auto
noauto
av
save
d
q
a y1 y2
d y1 y2
chan x1 x2
chan f2 x1 x2
chan
bins u v w
Action
View both pols in IF’s 1 & 2 in separate graphs, amplitude
vs. frequency
View both pols in one graph
View the bandpass amplitude
Performs the av and save functions automatically to
capture the reference scan in the background and display
the data in quotient mode
switch off auto
Average the data
saves the current scan as reference
View the difference between source and reference
View the quotient between source and reference
Displays the amplitude in range y1 to y2
Displays data in difference mode and sets the range to y1
to y2
Changes the display range of IF 1 to channels x1 to x2
Changes the display range of IF 2 to channels x1 to x2
Shows all channels
Show the individual time bins when fast mapping. U v w
stand for IF’s 1 2 and 3. You’ll have to insert “dummy”
bins, e.g. if you want to display bins 1 through 8 for IF5,
you need to enter:
bins 1 1 1 1 1-8
sca [lin, log]
Note 1-8 is the fifth entry on the line.
Set scaling to linear or logarithmic
Table 8 SPD command reference
Page 13 of 54
4.2.
MOTP
Command
sel *
sca y1 y2
sca
sel cal
Action
Selects all powers, required when MOPS has been
restarted.
Changes the Y scale of the display to the range y1 to y2
Changes the scale automatically to include the largest
and smallest values.
Displays the calibration signal powers.
Table 9 MOTP command reference
4.3.
MOPS
Command
matten au
matten ma
matten a w x y z
Action
Switches the attenuators to automatic. A maximum
attenuation of 12 is set when automatic mode is selected.
If more attenuation is required, use the manual setting
method below.
Switches the attenuators to manual
Switches the attenuators for polarization A to w, x, y and
z. Always 4 values must be given.
Table 10 MOPS command reference
Page 14 of 54
5.
Normal procedures
5.1.
Observing Checklist
Before starting your observations make sure you have
• Selected a good pointing source. Good means:
o As close to your target as possible. Use our SiO maser database
with the angular distance display.
o As bright as possible: At 3mm in Zoom or Broadband mode you’d
like a source brighter than 1.5K to reliably point, in Fastmap mode
2K or brighter.
• Plan to update the pointing every 1.5 hours if not moving away to other
sources.
• Check the attenuation levels (Gated Total Power, or GTP, displayed in
TOAD)
• If observing at 3mm, include a Tsys measurement in your schedule in 30
minute intervals (the online schedule maker tools include that for you)
• Consider observing one of the standard sources once per day:
o M17SW
o Orion KL
o L1527
5.2.
Creating your schedule files
The telescope control software (TCS) requires schedule files that tell the
telescope what to do. In a schedule file, you must define (and therefore know):
•
•
•
Project number
Your initials
Receiver setup. This includes
o Which MOPS configuration to use
o Center frequency
o If using zoom configuration, the zoom window numbers. Refer to
the next chapter on using mops_vis to find the appropriate Band
and Zoom window numbers, or use the OTF schedule maker
version 6.
Optionally, you can define:
•
Source and offset positions.
You can also create your own source catalogues if you have a large number of
objects to observe. Refer to the TCS manual accessible online from the main
Mopra website http://www.narrabri.atnf.csiro.au/mopra/
Page 15 of 54
5.3.
v5
Find your zooms with mops_vis or OTF v6 or PSW
mops_vis is a script application written by Erik Muller, which runs on any platform
supporting wish. It has been tested on Linux, Windows/Cygwin as wel as OSX.
Simply enter the frequencies of the lines you are interested in or select them from
a list of preloaded molecular species. Then enter a center frequency you think
will optimize detection. You can optimize the center frequency by pressing the
+10 MHz or -10 MHz buttons. Download the script from here:
http://www.narrabri.atnf.csiro.au/mopra/mops_vis.tgz
In the example below, you would enter a center frequency of 86080 MHz in order
to observe SiO, H13CO+, HCN, and CH3OH. In the zoom window definitions of
the schedule maker, you would leave the first Zoom Band empty, in the second
one you would enter -23, in the third one you enter 2,10 and in the third one 37.
Figure 7 mops_vis sample screen
Page 16 of 54
Alternatively, you can use the graphical editor from the on the fly (OTF) or the
position switch (PSW) schedule maker version 6 (version 5 for PSW). It’s slightly
less elegant, but requires no installation on your part, simply point your browsers
at the schedule maker
http://www.narrabri.atnf.csiro.au/mopra/scheduler/potf-v6.0.html
or
http://www.narrabri.atnf.csiro.au/mopra/scheduler/pswitch-v5.0.html
and open the Graphical Zoom Window Editor:
Figure 8 OTF v6 Graphical zoom window editor
Simply follow the on screen instructions on how to fill in the values.
5.4.
Selecting your pointing source
For observations at 3mm and 7mm, refer to our SiO maser catalog at this URL:
http://www.narrabri.atnf.csiro.au/cgi-bin/obstools/siomaserdb.cgi
Note that you can search the catalog for the nearest pointing source based on
your target position either in RA / Dec or in Galactic coordinates.
Page 17 of 54
5.5.
Setting up the observatory software
While observing from an ATNF supported Mopra control desk, you will be
presented with a four-monitor setup. The screens are meant to display the
following softwares (in brackets the names of the corresponding virtual
desktops):
Page 18 of 54
Screen 1 (TCS)
Screen 2 (MOPS)
Screen 3 (SPD)
Screen 4 (TOAD)
atdaemon
TCS
dclocks
MOPS
MOTP
atdrivemon
SPD
Pointings
attest
TOAD (in browser,
on local machine,
not in a VNC
session)
Depends on which
virtual desktop is
selected in this
window.
Table 11 Application distribution in the VNC sessions
Please read the following sections depending on whether you are using a two or
four monitor setup.
If you have not yet set up your VNC connections, refer to 5.6 Setting up your
VNC connections first.
Note that
•
•
5.5.1.
blue terminal windows refer to terminals logged into bigrock as user
atcaobs
green terminal windows refer to terminals logged into MPCCC1 as user
corr
Setup using four monitors
Begin by setting up Screen 2.
•
•
•
•
•
•
Connect your VNC client to mpvnc1.atnf.csiro.au:11
Make sure the top left “virtual screen square” says MOPS. If it doesn’t,
click the up or down arrow until it does.
Right click on the desktop to produce two xterms on MPCCC1 and one on
bigrock
On the first MPCCC1, start MOPS by executing the command mops
On the second MPCCC1 terminal, start the total power monitor motp
In the blue bigrock terminal, start the drive monitor: atdrivemon
Do not send any of those tasks into the background (i.e. do not use ampersand
(&) after the tasks. Terminals only serve a single application startup purpose in
this observing setup).
Page 19 of 54
Compare the layout of the screen you have just created, try to make it look
similar:
Figure 9 VNC screen 1
Then set up screen number 1, the one that is controlling TCS:
• Connect your VNC client to mpvnc1.atnf.csiro.au:10
• Make sure the virtual screen square says “TCS”, if not, press the up or
down arrows with the mouse until it does so.
• Start a blue bigrock terminal (right click on background) and execute the
following commands in it:
o Restart atdaemon: atdaemonrestart
o Start the clocks. Note the ampersand: dclocks &
o Arrange the clocks as displayed in the screen below.
o Start TCS by first issuing a killtcs
o Make sure you’re aware which version of TCS is used, current or
next. If in doubt, contact the DA.
o Execute atcsver current or atcsver next, depending on
which version is used
o Then start TCS: tcs
Page 20 of 54
o When the window has come up, dismiss the skyviewer window
(unless you would like to use it), and dismiss any warnings that
might be present.
o Ascertain that the “antenna”, “LO chain”, “attenuator” and
“correlator” indicators are green. If any of them are amber, click on
them and try to enable/set them. If that does not work, contact the
DA or staff.
Figure 10 VNC screen 2
Continue by setting up screen number three:
• Connect your VNC client to mpvnc1.atnf.csiro.au:12
• Make sure the top left virtual screen square states “SPD”.
• Again, use the up and down arrows with your mouse to make it say “SPD”
if it doesn’t.
• Open a terminal window to MPCCC1 (green) and start SPD: spd
• Move/resize the windows to match this setup:
Page 21 of 54
Figure 11 VNC screen 3
•
•
•
Clicke the up arrow in the virtual screen square until it says “Pointing”.
Right click on the background to create blue bigrock terminal and
execute sio_point
Move/resize the windows to match this layout:
Page 22 of 54
Figure 12 VNC screen 3 on the pointing virtual desktop
•
•
•
Lastly, click on the up arrow one more time to access the “Utilities” screen.
Open another blue bigrock terminal and execute attest
You can also use this utilities screen to muck around with other terminal
windows and editors to your liking.
Last, but not least, start a web browser and point it at the TOAD address:
http://www.narrabri.atnf.csiro.au/mopra/TOAD
Please do not start any other terminals on any of the other monitors you have just
started. You will needlessly confuse others and draw the wrath of the Moprabub if
you do so.
5.5.2.
Setup using two monitors
The identical setup procedure as above applies, however, all of the screens 2
and 3 functions are taking place in a virtual desktop on screen 1. For that
Page 23 of 54
purpose make use of the virtual screen button’s top right and bottom left arrows
to click into to the next available virtual desktop:
Figure 13 Virtual desktop switcher
5.6.
Setting up your VNC connections
All Mopra observing is done from one machine residing physically at Mopra by
way of connecting to it via VNC. VNC is a remote desktop software, allowing you
to control the observatory software.
The computer you will be connecting to for all your observing is called
mpvnc1.atnf.csiro.au
On that machine, three VNC servers are running. Depending on what kind of
display setup you have available for observing, you will be connecting either to all
three servers, or just to one of them.
5.6.1.
Four screen setup
In the four screen setup:
•
•
The first three screens connect to each of the VNC servers.
The last screen runs TOAD (locally, not in a VNC window!)
Please note that in each of those VNC servers, all five virtual desktops are visible
as outlined below, however, you should only use the desktops outlined in blue
below.
To avoid confusion when handing over between two screen and four screen
observers, do not use the virtual desktops outlined in red!
Page 24 of 54
Figure 14 VNC screens and virtual desktop arrangements in multi screen mode
5.6.2.
Two screen setup
In the two screen setup:
•
•
One screen is used to connect to the first VNC server
The second screen runs TOAD (locally, not in a VNC window!)
Most remote observers that operate from their own institutions will probably find
themselves connecting in this kind of setup. Note that all observatory software is
run in that one single VNC session and you must switch between the virtual
desktops to monitor different aspects of your observing program.
Figure 15 VNC screen and arrangement in single screen mode
5.7.
Handover between observers
When one observer hands over to the next, it is advisable to establish contact at
some point prior to when your scheduled time starts. Please refer to the next
Page 25 of 54
section (5.7.1) detailing one facility we have installed to facilitate this
coordination. This is to
•
•
5.7.1.
Exchange information on the status of Mopra
Coordinate the actual handover details:
o Are you taking over immediately and does the telescope not need
to be stowed?
o Will you be running a four-screen setup and the previous observer
ran in a two-screen setup? If so, follow the procedures below.
Using Python Chat for coordination
When several observers are remote observing, it becomes impractical to rely on
telephone connections or emails. Sometimes you will also depend on one of the
technical staff at Narrabri to communicate with you. In the TCS window, you will
find a chat window which you can use to type in.
In the event that this chat window is not available, you can start the chat client in
any other bigrock window by simply typing this command:
bigrock-101% python bin/chat.py
5.7.2.
Using Skype Chat for coordination
Since 2013, we use the Skype “Mopra Operations” chat to keep in touch between
observers and observatory staff. Please have your skype ID added. Anyone who
already is a member of the chat can add you.
5.7.3.
Handing over from 2-screen to 4-screen and vice versa
The only program that requires attention when switching between the two and
four screen observing modes is MOPS.
In the four-screen observing mode, MOPS runs in the second VNC server.
In the two screen observing mode, MOPS runs in the second virtual Desktop of
the VNC server
If you’re in four-screen mode and would like to make sure MOPS is not running
already, in the terminal window that starts MOPS in the second VNC window,
type killmops, then mops to start it.
Page 26 of 54
If you’re in two-screen mode and would like to make sure MOPS is not running
already, in the terminal window that starts MOPS in the second VNC window,
type killmops, then mops to start it.
5.8.
Running your observations
5.8.1.
Moving/copying your schedule files
Your schedule files need to be copied to bigrock into the following directory
structure:
bigrock:/nfs/online/local/tcs/sched/2011/MXXX
where XXX is your project number.
If your project directory does not exist, create it using the mkdir command.
If you’re on a pink visitor network cable, you cannot access bigrock directly. In
that case, scp the files onto minos, and then from minos, scp them to bigrock.
Contact observatory staff if you need help with this.
Directory structure on bigrock:
/nfs/online/local/tcs/sched/2011/M123
this is where all schedules and catalogs you would use for project M123 go.
/nfs/online/local/tcs/sched/CALIB
is where all the pointing schedules and other calibration schedules are kept. DO
NOT copy anything in there yourself. The Moprabub will get you if you do!
/nfs/online/current/aux/tcsgui/catalogue
is where the source catalogues are kept. If observing with TCS version next,
substitute “current” with “next” in the path.
/nfs/online/local/tcs/sched is the same directory as
~/sched_tcs or /home/atcaobs/sched_tcs
5.8.2.
Setting focus
Use attest in the utilities screen to set the focus. Refer to this table for focus
values:
Page 27 of 54
Wavelength
3mm
7mm
12mm
2.5cm
3cm
20cm
Subreflector
position
16.2
16.2
16.2
10.0
-2.0
-25
focus
Table 12 Focus positions
Select the slider in the focus tab, and click the GO button:
Figure 16 Focusing screen
5.8.3.
Pointing
The telescope needs pointings done about once every 1.5 hours during
observing in the same area of the sky, or whenever you move more than 30
degrees away from the last pointing source, and once before you start your
observations.
In the unlikely event that you cannot see a maser at all, you might want to reset
the pointing model to the global pointing model by executing the command
newcain pparam in the same blue bigrock terminal where you start the
sio_point command from and then restart the pointing schedule.
Page 28 of 54
5.8.4.
Starting your observations
Upon completion of the pointing, you can start your schedule by loading the
schedule file into TCS and execute them. Use appropriate monitoring to make
sure you are receiving proper data.
Remember to always check the bandpasses in your data in SPD on your first
scan of the day, and every time you change from broadband to zoom mode.
FPGA programming errors can result to spikes in the bandpasses that will ruin
the data for that particular IF.
To verify this, use the SPD screen, type a to go into bandpass mode and verify
that there are not extreme spikes visible. Talk to the DA or observatory staff if
you see anything suspicious.
5.8.5.
Verifying your data (QuickData.py)
Cormac Purcell has created a quick GUI for verifying your data with ASAP. The
script is called QuickData.py and is accessible from Kaputar. It lets you easily
preview Mopra data (not OTF Mapping data however). You can run this by
logging
into
Kaputar
and
running
the
command
python
/DATA/ARCHIVE_1/Mopra/QuickData.py
QuickData quickly lets you
•
•
•
•
•
Load rpf files
Average scans
Average polarisations
Display the line profiles
Save them in FITS format
Refer to the following screenshot.
Page 29 of 54
Figure 17 QuickData interface
5.8.6.
Processing your data
Your data is initially stored on MPCCC1 (the MOPS control computer), and gets
rsynced every 15 minutes to the archive disk at Narrabri, where you will be
picking the data up.
Page 30 of 54
Mopra data is stored in /DATA/ARCHIVE_1/Mopra/ accessible from Kaputar.
The file name convention is YYYY-MM-DD_HHMM-MXXX.rpf, where XXX is
your project number.
You can access those files by logging into Kaputar with your ATNF account.
For further details on data processing, refer to the online tutorials for ASAP as
well as Livedata/Gridzilla here:
http://www.atnf.csiro.au/computing/software/asap/
http://www.atnf.csiro.au/computing/software/livedata.html
5.9.
Online data analysis tools
We provide a few web-based tools that help you taking a first glimpse at your
data. This is currently mainly oriented towards on the fly mapping observations,
where it is important to get a grasp on the beam positions and noise in the maps.
This will then help you in assessing whether a map needs to be repeated or not.
5.9.1.
Beam position mapping tool
Point your browser at
http://www.narrabri.atnf.csiro.au/cgi-bin/obstools/beammap.pl
and you’ll be presented with a file listing of recent observations. Note that these
files are located on ARCHIVE_1, and hence only updated when the rsync
between MPCCC_1 and Kaputar is started, once every 15 minutes. Please allow
for enough time before inspecting your data or you will wrongfully suspect
incomplete data because the file didn’t finish copying before you analysed it!
By clicking on a filename, you’re sending this file into a batch process that
extracts all beam positions and plots them. Here’s what a map on windy day
looks like:
Page 31 of 54
Figure 18 Beam position map on a windy day
Compare this to a map with missing scans. If you see a map like this, you are
very likely going to want to redo it.
Page 32 of 54
Figure 19 Beam position map with scans gone badly
5.10.
Monitoring
5.10.1.
TOAD
TOAD (Telescope Operator Alerting Display) is a web browser based monitoring
tool. It monitors well over 400 parameters of the telescope systems and knows
dozens of failure modes of various components and how to fix them.
Page 33 of 54
Use this URL from inside or outside ATNF to load TOAD:
http://mopra-ops.atnf.csiro.au/TOAD
TOAD is compatible with Mozilla based browsers such as:
•
•
•
•
Firefox / Iceweasel
Google Chrome
Safari
Opera
It is NOT compatible with Internet Explorer due to Microsoft’s lack of canvas
object support. TOAD somewhat works on IE5 through 7, but does not work at
all in IE8. It is also NOT compatible with Konqueror.
On first startup in a new browser, TOAD will display an INVALID PAGE. Simply
click on one of the page buttons such as SYNOP to select the synoptic page.
Figure 20 TOAD invalid data page
Page 34 of 54
The
SYNOPtic
page
displays
(Refer
to
Figure 21 TOAD synoptic display):
•
•
•
•
•
•
•
•
•
•
•
•
•
Antenna state (TRACKING, SLEWING, STOWED etc.)
Weather conditions. Note that the weather condition quality (i.e. Fine)
refers to Antenna safety, not observing data quality due to weather!
Cryogenics system status
Environment temperatures
Power / Generator status
Subreflector position and status
Paddle status
Receiver and Turret status and positions, as well as center frequency
Millimetre switch position
Upstairs attenuators and samplers (B6)
Laser diode status (B5)
MOPS samplers
o GTP = Gated Total Power expressed in scaled units. Ideal range is
between 0.2 – 1.0
o SDO = Noise injection in % over the signal floor.
o Tsys per sub band (i.e. each is a 2 GHz wide band!)
o Tsys sigma = standard deviation of the Tsys over the specified
amount of time. You can reset those calculations by pressing the
“Reset / Restart Tsys sigma calculations” at the top of the screen.
Messages
Page 35 of 54
•
Static quick access data. This data is always displayed, regardless of
which page is selected.
o Drive state, Azimuth and Elevation
o Wind direction and speed
o Temperature, relative humidity, precipitable water vapour
(calculated figure) and atmospheric pressure.
o Timestamp in UTC when the last chunk of monitoring data was
received. This can be useful to determine whether TOAD is
updating properly or whether it has frozen
.
Figure 21 TOAD synoptic display
Page 36 of 54
Always follow the instructions TOAD gives to recover from a failure.
Acquaint yourself with the CLEAR and RECALL functions for the warning
display:
•
•
CLEAR stops any alarm sounds and puts the warnings into the
background.
RECALL displays those warnings that are still current and have been
CLEARed.
These functions will help you manage a clean workflow with good situation
awareness.
5.10.2.
Monica
Apart from TOAD, which should give you all operationally required monitoring
information, you can selectively monitor data points using Monica, the ATNF’s
monitoring tool used throughout all observatories.
Monica uses a Java based viewer. You can install it on your computer and use
from both inside and outside the ATNF network. If you’re using it from outside,
you will be prompted for your ATNF UNIX login and password.
Install the Java webstart Monica from here:
http://www.narrabri.atnf.csiro.au/monitor/monica/
Once installation has been completed, you first need to select which observatory
to connect to, then you can either select from predefined standard pages or add
your own pages with your datapoints of interest.
Good starting points are the standard pages accessible from the menu Navigator
-> Favourites. As an example, refer to the wind-monitoring page:
Page 37 of 54
Figure 22 Wind monitoring page in Monica
Page 38 of 54
5.11.
Finishing the observations
When your observations are done, either hand over the telescope to the next
observers or stow it. There is no further cleanup activity required apart from
stowing. Stowing is accomplished by pressing the “Park” button in TCS.
Page 39 of 54
6.
Abnormal procedures
Most system malfunctions and advisory conditions are programmed into TOAD.
You will be presented with a diagnostic message along with a recommended
remedial action to resolve the conflict. Please follow the on screen instructions
in the event of such a failure.
Consult with the DA or observatory staff if you’re not sure what to do.
6.1.
Restarting TCS
If TCS is hanging, or starting to behave very sluggishly, a restart of TCS can be
indicated:
•
•
•
•
6.2.
•
•
•
•
•
If possible, press the EXIT button in TCS and wait for the TCS window to
disappear.
If TCS is hung:
o bring forward the blue bigrock terminal that started TCS (hidden
behind the TCS window)
o press <ctrl>-c to kill TCS
Make sure all TCS related processes have ended by executing the
command killtcs repeatedly until killtcs does not report any processes
left. If some processes are hung stubbornly, you may have to manually
force kill them by executing a kill -9 PID, where PID is the process ID
number shown during the killtcs command.
Restart TCS by issuing the command tcs
Restarting MOPS
If possible, attempt to quit MOPS by pressing the QUIT button on the
lower right of the MOPS GUI.
If that is not possible, switch to the green terminal window behind the
MOPS window which started MOPS and press <ctrl>-c to kill MOPS
Execute the command killmops repeatedly until no more processes are
found.
If some processes are stubbornly refusing to go away, you may have to
manually force kill them by issuing a kill -9 PID command, where PID
is the process ID that is displayed by the killmops command.
start MOPS by executing the command mops.
Page 40 of 54
•
6.3.
After MOPS has restarted, TCS must be reconnected to MOPS. For that
purpose,
o dismiss the warning messages informing you of the demise of
MOPS
o click on the amber indication displaying CORRELATOR
o select ENABLE from the dropdown menu
Restarting atdaemon
Do not run this procedure unless instructed to do so by observatory staff. No
wiki/FAQ/someone’s notes should be used to justify running this. Only do it
when staff tell you explicitly to do so.
Because an atdaemon restart requires TCS to restart and atdaemon requires a
terminal that never goes away, atdaemon must only be restarted from the same
terminal window that starts TCS.
•
•
•
•
•
If possible, press the EXIT button in TCS and wait for the TCS window to
disappear.
If TCS is hung:
o bring forward the blue bigrock terminal that started TCS (hidden
behind the TCS window)
o press <ctrl>-c to kill TCS
Make sure all TCS related processes have ended by executing the
command killtcs repeatedly until killtcs does not report any processes
left. If some processes are hung stubbornly, you may have to manually
force kill them by executing a kill -9 PID, where PID is the process ID
number shown during the killtcs command.
issue the command atdaemonrestart and wait. This will take a minute
or so, and you will momentarily lose all monitoring data in TOAD
Restart TCS by issuing the command tcs
6.4.
Restarting the ACC
6.4.1.
Via remote access / VNC
•
•
•
•
connect your vnc client to mpacc-con.atnf.csiro.au.
the password is the same as the atcaobs password.
press the ctrl-alt-del button in the top left hand side of the VNC window.
watch the ACC boot and note any error messages.
Page 41 of 54
6.4.2.
•
•
Via MAPS reset button
Walk to the MAPS panel in the PMON rack at Narrabri (this obviously only
works if you’re on site in Narrabri)
Press the button labelled “ACC Reset” for at least 30 seconds (you will
need a watch) and give it a minute to reboot
Once the ACC has rebooted, it automatically becomes available and the required
setup information is automatically furnished to the ACC.
6.5.
MOPS programming errors
MOPS sometimes does not properly complete its own programming. In such
cases, a terminal window that was displaying the progress will remain open on
top of the MOPS window, so it will be immediately obvious that something has
gone wrong.
Simply click the mouse into that terminal, hit [RETURN] and then type “prog” and
hit [RETURN]”. The programming will restart. If it fails again, repeat until it
worked.
Figure 23 MOPS programming error
Page 42 of 54
6.6.
Problems with the VNC sessions
6.6.1.
VNC Server does no longer accept keyboard input
Right-click with the mouse on the desktop, and select “Workspace Menu” ->
“Restart Window Manager”. This will make a temporary mess on your screen,
and you will find yourself in the wrong virtual desktop inside the VNC session.
Simply go back to the original desktop using the navigation buttons on the top
lefthand side and you should now be able to enter text with the keyboard again.
6.6.2.
Mouse exhibits weird behaviour, can’t set Z-order of windows
when clicking on them.
This can be fixed be restarting your VNC connection. Simply close the VNC client
on your end, and restart it.
6.6.3.
Server?
Ok, VNC completely pooped itself. How can I restart the VNC
You’ll need to ssh [email protected], cd into .tightvnc (note the
leading dot) and execute restart_Xtightvnc{x}.pl, where {x} stands for 10, 11 or
12, depending on which VNC server you would like to restart.
Please note that executing the restart_Xtightvnc{x}.pl script will terminate, quite
forcefully, all applications running in those VNC servers. You also will need to
set up your screen as you found it after doing this.
6.7.
Generator messages
Generator operation at Mopra is completely automated. You do not really need to
interfere at all, except for letting us know when something happens that you or
TOAD feel is out of the ordinary.
If, however, you wish to be a particularly good Mopra observer, we appreciate it
if you turn the generators on manually using the MAPS control panel when you
see a storm approaching on the weather radar.
This is only possible when you are observing from Narrabri. You cannot
use attest or any other software method to start the generator!
Page 43 of 54
6.8.
Unable to bring GTP’s down/up into normal range
Under some circumstances (usually weather inflicted), it is possible that you are
unable to use “matten au” in MOPS to bring the gated total powers into the
appropriate range. In these cases you always first try to tame the powers with the
MOPS attenuators: MOPS only automatically sets attenuators in the range of 0 to
12. Any higher attenuation (up to 15 is available) must be set manually.
To set them manually, use this command in MOPS (example to set all IF’s in Pol
A to 15):
matten a 15 15 15 15
Repeat for Polarisation B and use different attenuator values as needed.
If that still does not produce enough attenuation (or if you are already at a
marginally low power with attenuators set to 0), you can change the upstairs
attenuators (B6).
Here’s how to do it properly:
1. Check the B6 attenuator settings in the TOAD SYNOP window while
observing your science target. Take note of what the numbers are at
your observing frequency of interest.
2. Note: The attenuators change completely depending on what frequency
you are observing at, so you cannot make a guess while pointing at 86
GHz for what the attenuators will be at your observing frequency of 111
GHz!
3. Open a bigrock terminal (blue) and prepare the following command (do
not press enter yet):
4. atds control -a 27 -d 0xa9 -f 0x100 -h mpacc -p 8019
5. The 0xa9 part defines the attenuator values for Pol B and Pol A (in that
order) in hexadecimal format. You need to replace those with the values
you want. In this example, the numbers would set Polarisation B to 10 (‘A’
in hexadecimal) and Polarisation A to 9 (same in hexadecimal).
6. Start the schedule on your science target.
7. Run the above command and make sure your GTP’s are within range.
8. Stop and restart, a few seconds after you’ve started the schedule, run the
atds command again.
Note that this atds command must be repeated after every start of a
schedule because TCS resets the B6 after every start!
Page 44 of 54
7.
Emergency
If an emergency occurs that is not covered by any of the other checklists or is not
covered by TOAD:
•
Contact the Duty Astronomer. If you are remote observing, the telephone
numbers for the DA should have been communicated to you. If not, ring the
following numbers and ask for the Duty Astronomer:
o ATCA Control Room: +61 2 6790 4033
o Mopra Control Desk: +61 2 6790 4088
o Observers Area: +61 2 6790 4031 (near MAPS Rack)
o Observers Area: +61 2 6790 4022 (middle of the area)
o Observers Area: +61 2 6790 4048 (near Mopra Desk)
o Lodge +61 2 6790 4027
o DA Bedrooms: +61 2 6790 4008 or +61 2 6790 4009
•
During working hours, If the DA is not available, proceed to contact one of the
observatory staff:
o +61 2 6790 4033 (ATCA Control Room in Narrabri)
o +61 2 6790 4088 (Mopra control desk in Narrabri)
Page 45 of 54
8.
Glossary
Moprabub
Your nemesis. Do you know what "nemesis" means? A righteous infliction of
retribution manifested by an appropriate agent, personified in this case by an
'orrible <bleep>... me! (For the full, uncensored version of this, refer to the movie
“Snatch”)
9.
TOAD Message Reference
9.1.
Information Messages (Gray)
These messages refer to information content only.
9.1.1.
Track has started
Message ID:
Triggers when:
9.1.2.
Track has ended
Message ID:
Triggers when:
9.1.3.
22
The telescope has stopped moving from either slewing
or tracking.
Tsys high
Message ID:
Triggers when:
9.1.4.
21
The telescope has started moving from either stowed or idle.
28
at 12mm, the Tsys is greater than 190K, with no paddle
in, and the telescope unstowed.
at 3mm, the Tsys is greater than 410K with no paddle
in and the telescope unstowed
Tsys noise high
Message ID:
Triggers when:
29
at 12mm, the Tsys standard deviation is greater than 3K
This is indicative of cloudy and variable conditions.
9.2.
Caution Messages (Yellow)
These messages alert the observer to conditions that can affect your data and
the operation of the telescope.
Page 46 of 54
9.2.1.
30min WindMax High
Message ID:
Triggers when:
and
3
The 30 minute maximum wind is greater or equal 35km/h
the antenna servo state is not stowed.
This message alerts the observer to strong winds and the possibility of a wind
stow.
9.2.2.
Telescope idle and not stowed
Message ID:
Triggers when:
4
Idle or drive_error time exceeds 5 minutes while at an
elevation of less than 84 degrees.
Alerts the observer to stow the telescope, or to initiate action to resolve the drive
error condition preventing the telescope from stowing.
9.2.3.
Generator is running
Message ID:
Triggers when:
11
Generator is running and lightning threat level equals 0
The generator should not normally run, only when the lightning threat level is
significant . This message can be indicative of a mains power failure.
9.2.4.
Some lightning activity
Message ID:
Triggers when:
12
Generator is not running and lightning threat level is
greater than 1
This alerts the observer to keep an eye on the weather. The generator does not
need to be started (yet).
9.2.5.
Heavy lightning activity nearby
Message ID:
Triggers when:
stowed.
13
Lightning threat level equals 3 and the telescope is not
Alerts the user to a potentially impending storm stow.
9.2.6.
ACC in local mode
Message ID:
17
Page 47 of 54
Triggers when:
the ACC is in local mode.
The ACC can be put into local or remote mode by connecting to the remote
console.
9.2.7.
MOPS Pol A counts out of bounds
Message ID:
Triggers when:
9.2.8.
MOPS Pol B counts out of bounds
Message ID:
Triggers when:
9.3.
38
Any of the Pol A GTP’s are below 0.1 or above 1.0
39
Any of the Pol B GTP’s are below 0.1 or above 1.0
Error Messages (Red)
These messages concern critical components of the telescope that have failed or
are about to fail. Your data taking abilities will be or already are impacted by
these messages.
9.3.1.
Turret feed / translator disagree
Message ID:
Triggers when:
5
12mm feed is online and translator is not at 0.0mm
7mm feed is online and translator is not at 105.7 +/- 0.2mm
3mm feed is online and translator is not at 0.0mm
Alerts the observer to the feed not being on axis. Data taken while this error is
active will be unusable.
9.3.2.
Turret translator control is not in remote
Message ID:
Triggers when:
6
Turret translator remote control is set to Local
The receiver will not be able to be changed.
9.3.3.
Severe lightning threat
Message ID:
Triggers when:
9
The telescope is not stowed and the lightning threat level
equals 4.
Page 48 of 54
The lightning threa level is derived from the lightning detector and expresses a
threat level indicating the need to run generators up to storm stowing the
telescope.
9.3.4.
Severe lightning threat with generator off
Message ID:
Triggers when:
10
The generator is not running and the threat level is greater
than 2
Indicates possibly a failed generator start. Give the generator ample time to start
running, on the order of 5 minutes.
9.3.5.
Focus disagree
Message ID:
Triggers when:
9.3.6.
ACC CPU load high
Message ID:
Triggers when:
9.3.7.
16
CPU load of ACC is greater than 98%
ACC unreachable
Message ID:
Triggers when:
pings
9.3.8.
15
The difference between the actual and the requested focus
position is greater than 1.0mm and the requested focus
position is not 1000.0, the value it reverts to after an
atdaemonrestart
18
the ACC is not pingable from bigrock for three consecutive
Drive Error in AzEl exceeds 1 minute
Message ID: 19
Triggers when:
the drive error in azimuth or elevation is larger than 1 minute
and it persists for more than 2 consecutive data polls
(i.e. 10 seconds).
This error can hint at tracking problems.
9.3.9.
Drive Error
Message ID:
Triggers when:
20
the drive error condition persists for more than 2 consecutive
Data polls (i.e. 10 seconds).
Page 49 of 54
This error can have many different origins and does not necessarily mean
something is broken. When a hardware stow is issued for instance, the drive
error triggers as well, because the ACC is no longer in control of the drives. The
hardware stow can be issued manually by setting the stow switch on the PMON
rack in Narrabri, or when the anemometers on the dish register winds in excess
of 45km/h, or when the Mopra protect script detects lightning and/or wind above
threshold values, a hardware storm stow is also triggered.
9.3.10.
MOPS B5 module error
Message ID:
Triggers when:
23
the B5 module indicates an error
The message provides detailed recovery information on how to reactivate the B5
9.3.11.
MOPS B6 module error
Message ID:
Triggers when:
24
B6 Pol A or B sampler levels are dropping below 0.1V
This message indicates no signal is being fed down the conversion chain.
9.3.12.
Turret rotation control is not in remote
Message ID:
Triggers when:
25
The turret is in local mode and cannot be rotated.
You will not be able to change receivers. Apart from that, your observations will
not be affected.
9.3.13.
Focus control is not in remote
Message ID:
Triggers when:
26
The focus control is in local mode.
You will not be able to change the focus.
9.3.14.
MOPRA PROTECT Hardware Stow
Message ID:
Triggers when:
30
Mopra protect has issued a hardware stow.
This stow cannot be overridden, you have to wait for it to be released.
Page 50 of 54
9.3.15.
WIND Hardware Stow
Message ID:
Triggers when:
31
Mopra anemometers have issued a hardware stow.
This stow cannot be overridden, you have to wait for it to be released.
9.3.16.
NARRABRI Hardware Stow
Message ID:
Triggers when:
32
Mopra has been issued a hardware stow from the
PMON rack in Narrabri.
This stow cannot be overridden, you have to wait for it to be released.
9.3.17.
Dataset Query Failed
Message ID:
Triggers when:
failed
33
MAPS 5MQ failed. An attempt at reading stow information
This is indicative of a severe problem involving hardware. Please contact staff if
this error occurs.
9.3.18.
MAPS M Card Error occurred
Message ID:
Triggers when:
9.3.19.
Dataset Query Failed (MAPS)
Message ID:
Triggers when:
9.3.20.
35
MAPS 7MQ has failed
MAPS Serial Heartbeat Error occurred
Message ID:
Triggers when:
9.3.21.
34
Any of the MAPS M cards could not be read.
36
MAPS SC6, SC7 or SC8 heartbeat failure indicator is set
MAPS System Error occurred
Message ID:
Triggers when:
37
MAPS system error flag is set
Page 51 of 54
9.3.22.
MOPS Pol A noise diode faulty
Message ID:
Triggers when:
40
Pol A SDO is below 0.002 or above 1
This is indicative of the noise injection having failed.
9.3.23.
MOPS Pol B noise diode faulty
Message ID:
Triggers when:
41
Pol B SDO is below 0.002 or above 1
This is indicative of the noise injection having failed.
9.3.24.
Sound is switched off
Message ID:
Triggers when:
42
The sound is switched off on TOAD.
Note that the sound should never be switched off. If you encounter nuisance
warnings, please let staff know so that they can be addressed rather than
silencing an essential monitoring tool!
9.3.25.
MAPS dataset RPC server down
Message ID:
Triggers when:
43
The dataset queries fail due to an RPC timeout
This can be indicative of the RPC server on bigrock having failed
9.3.26.
Monitoring data error
Message ID:
Triggers when:
44
The webserver fails to deliver monitoring data
This can be indicative of the web server being down, connectivity problems
between the browser and the web server, as well as connectivity problems
between the web server and the monica server (bigrock).
10.
Index of Figures
Figure 1 Focus positions at 86 GHz measured July 2012. Gaussian fit to data
suggests best focus position is at 16.2mm. .......................................................... 6 Figure 2 Antenna efficiency at 12mm and 7mm ................................................... 7 Figure 3 Tsys at 3mm from Ladd et al. ................................................................. 8 Figure 4 MOPS bands and IF's........................................................................... 10 Page 52 of 54
Figure 5 MOPS zoom window definitions ........................................................... 11 Figure 6 MOPS zoom mode specifications ......................................................... 12 Figure 7 mops_vis sample screen ...................................................................... 16 Figure 8 OTF v6 Graphical zoom window editor................................................. 17 Figure 9 VNC screen 1 ....................................................................................... 20 Figure 10 VNC screen 2 ..................................................................................... 21 Figure 11 VNC screen 3 ..................................................................................... 22 Figure 12 VNC screen 3 on the pointing virtual desktop..................................... 23 Figure 13 Virtual desktop switcher ...................................................................... 24 Figure 14 VNC screens and virtual desktop arrangements in multi screen mode
............................................................................................................................ 25 Figure 15 VNC screen and arrangement in single screen mode ........................ 25 Figure 16 Focusing screen ................................................................................. 28 Figure 17 QuickData interface ............................................................................ 30 Figure 18 Beam position map on a windy day .................................................... 32 Figure 19 Beam position map with scans gone badly......................................... 33 Figure 20 TOAD invalid data page...................................................................... 34 Figure 21 TOAD synoptic display ....................................................................... 36 Figure 22 Wind monitoring page in Monica ........................................................ 38 Figure 23 MOPS programming error .................................................................. 42 11.
Index of Tables
Table 1 Observatory position ................................................................................ 5 Table 2 Pointing parameters ................................................................................. 5 Table 3 Tuning and center frequency limitations .................................................. 5 Table 4 MOPS spectral resolution in all bands ..................................................... 5 Table 5 Beam widths and average Tsys's ............................................................ 6 Table 6 Antenna efficiency.................................................................................... 6 Table 7 MOPS configurations and data rates ....................................................... 8 Table 8 SPD command reference....................................................................... 13 Table 9 MOTP command reference.................................................................... 14 Table 10 MOPS command reference ................................................................. 14 Table 11 Application distribution in the VNC sessions........................................ 19 Table 12 Focus positions .................................................................................... 28 Page 53 of 54
THIS PAGE
INTENTIONALLY
LEFT BLANK
Page 54 of 54