1
ARM Debugger
TRACE32 Online Help
TRACE32 Directory
TRACE32 Index
TRACE32 Documents ......................................................................................................................
ICD In-Circuit Debugger ................................................................................................................
Processor Architecture Manuals ..............................................................................................
ARM/CORTEX/XSCALE ...........................................................................................................
ARM Debugger .....................................................................................................................
1
Brief Overview of Documents for New Users .................................................................
7
Warning ..............................................................................................................................
8
Quick Start of the JTAG Debugger ..................................................................................
9
Troubleshooting ................................................................................................................
11
Communication between Debugger and Processor can not be established
FAQ .....................................................................................................................................
11
12
ARM
12
ARM7
14
JANUS
15
ARM9
15
ARM10
16
ARM11
16
Cortex-A/-R
17
XSCALE
17
Trace Extensions ...............................................................................................................
18
Symmetric Multiprocessing .............................................................................................
19
ARM Specific Implementations ........................................................................................
20
Breakpoints
20
Software Breakpoints
20
On-chip Breakpoints for Instructions
20
On-chip Breakpoints for Data
20
Hardware Breakpoints (Bus Trace only)
22
Example for Standard Breakpoints
23
Complex Breakpoints
25
Direct ICE Breaker Access
25
Trigger
26
Virtual Terminal
27
©1989-2014 Lauterbach GmbH
ARM Debugger
1
Semihosting
28
SVC (SWI) Emulation Mode
28
DCC Communication Mode (DCC = Debug Communication Channel)
30
Runtime Measurement
31
Coprocessors
32
Access Classes
33
TrustZone Technology
35
Debug Permission
35
Checking Debug Permission
36
Checking Secure State
36
Changing the Secure State from within TRACE32
36
Accessing Memory
36
Accessing Coprocessor CP15 Register
37
Accessing Cache and TLB Contents
37
Breakpoints and Vector Catch Register
37
Large Physical Address Extension (LPAE)
38
Consequence for Debugging
38
Virtualization Extension, Hypervisor
39
Consequence for Debugging
39
big.LITTLE
40
Debugger Setup
40
Consequence for Debugging
41
Requirements for the Target Software
41
big.LITTLE MP
41
ARM specific SYStem Commands ...................................................................................
SYStem.BdmClock
Define JTAG frequency
42
Inform debugger about core clock
42
Configure debugger according to target topology
43
SYStem.CLOCK
SYStem.CONFIG
42
<parameter> “General”
48
<parameter> describing the “Debugport”
49
<parameter> describing the “JTAG” scan chain and signal behavior
54
<parameter> describing a system level TAP “Multitap”
58
<parameter> configuring a CoreSight Debug Access Port “DAP”
60
<parameter> describing debug and trace “Components”
64
<parameter> which are “Deprecated”
73
SYStem.CPU
SYStem.CpuAccess
Select the used CPU
77
Run-time memory access (intrusive)
78
Define JTAG frequency
79
SYStem.JtagClock
SYStem.LOCK
Tristate the JTAG port
81
Run-time memory access
82
Establish the communication with the target
86
Do not access 0x0-0x1f
88
Select AHB-AP HPROT bits
88
SYStem.MemAccess
SYStem.Mode
SYStem.Option ABORTFIX
SYStem.Option AHBHPROT
©1989-2014 Lauterbach GmbH
ARM Debugger
2
SYStem.Option AMBA
SYStem.Option ASYNCBREAKFIX
Select AMBA bus mode
88
Asynchronous break bugfix
89
ACE enable flag of the AXI-AP
89
SYStem.Option AXICACHEFLAGS
Select AXI-AP CACHE bits
89
SYStem.Option AXIHPROT
Select AXI-AP HPROT bits
89
SYStem.Option AXIACEEnable
SYStem.Option BUGFIX
SYStem.Option BUGFIXV4
Breakpoint bug fix
90
Asynch. break bug fix for ARM7TDMI-S REV4
90
Define byte order (endianess)
91
Define boot mode
91
SYStem.Option BigEndian
SYStem.Option BOOTMODE
SYStem.Option CINV
Invalidate the cache after memory modification
92
FLUSH the cache before step/go
92
Define external cache
92
Debugger ignores DACR access permission settings
93
No DAP instruction register check
93
Rearrange DAP memory map
93
DBGACK active on debugger memory accesses
93
DSCR bit 9 will be set when in debug mode
94
SYStem.Option CFLUSH
SYStem.Option CacheParam
SYStem.Option DACR
SYStem.Option DAPNOIRCHECK
SYStem.Option DAPREMAP
SYStem.Option DBGACK
SYStem.Option DBGNOPWRDWN
SYStem.Option DBGUNLOCK
SYStem.Option DCDIRTY
SYStem.Option DCFREEZE
Unlock debug register via OSLAR
94
Bugfix for erroneously cleared dirty bits
94
Disable data cache linefill in debug mode
95
Activate more data.log messages
95
SYStem.Option DIAG
SYStem.Option DisMode
Define disassembler mode
96
Dynamic trap vector interpretation
97
Allow the debugger to drive nRESET/nSRST
97
Read out on-chip trace data
97
SYStem.Option DynVector
SYStem.Option EnReset
SYStem.Option ETBFIXMarvell
SYStem.Option ETMFIX
Shift data of ETM scan chain by one
98
Bugfix for write-only ETM register
98
Use only every fourth ETM data package
98
EXEC signal can be used by bustrace
98
Switch off the fake TAP mechanism
99
Faster detection if core has halted
99
Lock on-chip breakpoints
99
Only ICEPick registers accessible
100
SYStem.Option ETMFIXWO
SYStem.Option ETMFIX4
SYStem.Option EXEC
SYStem.Option EXTBYPASS
SYStem.Option FASTBREAKDETECTION
SYStem.Option ICEBreakerETMFIXMarvell
SYStem.Option ICEPICKONLY
SYStem.Option IMASKASM
SYStem.Option IMASKHLL
Disable interrupts while single stepping
100
Disable interrupts while HLL single stepping
100
Disable all interrupts
101
Break bugfix by using IRQ
101
SYStem.Option INTDIS
SYStem.Option IRQBREAKFIX
SYStem.Option IntelSOC
SYStem.Option KEYCODE
Debugging of an Intel SOC
101
Define key code to unsecure processor
101
L2 cache used
102
Define base address of L2 cache register
102
SYStem.Option L2Cache
SYStem.Option L2CacheBase
SYStem.Option LOCKRES
Go to 'Test-Logic Reset' when locked
102
Select memory-AP HPROT bits
103
SYStem.Option MEMORYHPROT
©1989-2014 Lauterbach GmbH
ARM Debugger
3
SYStem.Option MMUSPACES
Enable multiple address spaces support
103
SYStem.Option MonitorHoldoffTime
SYStem.Option MPU
Delay between monitor accesses
103
Debugger ignores MPU access permission settings
103
No multiple loads/stores
104
No data connected to the trace
104
SYStem.Option MultiplesFIX
SYStem.Option NODATA
No JTAG instruction register check
105
SYStem.Option NoPRCRReset
SYStem.Option NOIRCHECK
Do not cause reset by PRCR
105
SYStem.Option NoRunCheck
No check of the running state
105
SYStem.Option NoSecureFix
Do not switch to secure mode
106
SYStem.Option OVERLAY
Enable overlay support
106
Extend debugger timeout
106
Define address for dummy fetches
107
Sends an unsecure sequence to the core
107
SYStem.Option PWRCHECK
Check power and clock
107
SYStem.Option PWRCHECKFIX
Check power and clock
108
Allow power-down mode
108
Mode to handle special power recovery
108
SYStem.Option PALLADIUM
SYStem.Option PC
SYStem.Option PROTECTION
SYStem.Option PWRDWN
SYStem.Option PWRDWNRecover
SYStem.Option PWRDWNRecoverTimeOut
Timeout for power recovery
109
SYStem.Option PWROVR
Specifies power override bit
109
SYStem.Option ResBreak
Halt the core after reset
109
Choose method to detect a target reset
110
SYStem.Option ResetDetection
SYStem.Option RESTARTFIX
Wait after core restart
111
SYStem.Option RisingTDO
Target outputs TDO on rising edge
111
SYStem.Option ShowError
Show data abort errors
111
Use 32-bit access to set breakpoint
112
SYStem.Option SOFTLONG
SYStem.Option SOFTQUAD
Use 64-bit access to set breakpoint
112
SYStem.Option SOFTWORD
Use 16-bit access to set breakpoint
112
Access memory depending on CPSR
112
Delay for activating trace after reset
113
SYStem.Option SPLIT
SYStem.Option StandByTraceDelaytime
SYStem.Option STEPSOFT
Use software breakpoints for ASM stepping
113
Force system power
113
SYStem.Option TIDBGEN
Activate initialization for TI derivatives
113
SYStem.Option TIETMFIX
Bug fix for customer specific ASIC
114
SYStem.Option TIDEMUXFIX
Bug fix for customer specific ASIC
114
Obsolete command
115
Allow debugger to drive TRST
115
Speed up memory access
115
SYStem.Option SYSPWRUPREQ
SYStem.Option TraceStrobe
SYStem.Option TRST
SYStem.Option TURBO
Wait with JTAG activities after deasserting reset
116
SYStem.Option ZoneSPACES
SYStem.Option WaitReset
Enable symbol management for ARM zones
117
SYStem.RESetOut
Assert nRESET/nSRST on JTAG connector
122
Display SYStem window
122
ARM Specific Benchmarking Commands .......................................................................
123
SYStem.view
BMC.EXPORT
Export benchmarking events from event bus
©1989-2014 Lauterbach GmbH
ARM Debugger
4
123
BMC.MODE
Define the operating mode of the benchmark counter
BMC.PMNx
Configure the performance monitor
Functions
124
125
129
BMC.PRESCALER
Prescale the measured cycles
129
Calibrate the benchmark counter
129
ARM Specific TrOnchip Commands ................................................................................
130
BMC.TARA
TrOnchip.A
Programming the ICE breaker module
130
Define data selector
130
Define access size for data selector
130
Define access type
131
TrOnchip.A.Value
TrOnchip.A.Size
TrOnchip.A.CYcle
TrOnchip.A.Address
TrOnchip.A.Trans
TrOnchip.A.Extern
TrOnchip.AddressMask
TrOnchip.ContextID
TrOnchip.CONVert
TrOnchip.Mode
TrOnchip.RESet
TrOnchip.Set
TrOnchip.TEnable
Define address selector
132
Define access mode
132
Define the use of EXTERN lines
133
Define an address mask
133
Enable context ID comparison
133
Extend the breakpoint range
133
Configure unit A and B
134
Reset on-chip trigger settings
134
Set bits in the vector catch register
135
Define address selector for bus trace
136
Define cycle type for bus trace
137
TrOnchip.TCYcle
TrOnchip Example
137
TtrOnchip.VarCONVert
Convert variable breakpoints
138
Display on-chip trigger window
138
CPU specific MMU Commands ........................................................................................
139
TrOnchip.view
MMU.DUMP
Display MMU table
139
MMU.List
Display MMU table
142
Load MMU table from CPU
143
Target Adaption .................................................................................................................
145
MMU.SCAN
Probe Cables
145
Interface Standards JTAG, Serial Wire Debug, cJTAG
145
Connector Type and Pinout
145
Debug Cable
145
CombiProbe
146
Preprocessor
146
Support ...............................................................................................................................
Available Tools
147
147
ARM7
147
ARM9
157
ARM10
165
ARM11
165
Cortex-A/-R
167
©1989-2014 Lauterbach GmbH
ARM Debugger
5
Compilers
173
Realtime Operation Systems
174
3rd Party Tool Integrations
176
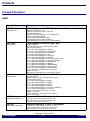
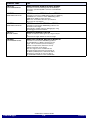
Products .............................................................................................................................
Product Information
177
177
ARM7
177
ARM9
179
ARM10
181
ARM11
183
Cortex-A/-R
185
Order Information
187
ARM7
187
ARM9
188
ARM10
190
ARM11
191
Cortex-A/-R
193
©1989-2014 Lauterbach GmbH
ARM Debugger
6
ARM Debugger
Version 11-Nov-2014
07-Aug-14
Added new access classes, see “Coprocessors” and “Access Classes”.
30-Jun-14
TrBus.Out and TrBus.Set were moved to general_ref_t.pdf.
26-Jun-14
New command SYStem.Option ZoneSPACES.
13-Mar-14
Added section “big.LITTLE”, revised sections “TrustZone Technology”, “Large Physical
Address Extension (LPAE)”, and “Virtualization Extension, Hypervisor”.
05-Nov-13
Updated the BMC.EXPORT description.
16-Sep-13
The architecture-independent BMC commands are documented in general_ref_b.pdf.
Architecture-specific BMC commands remain in this manual.
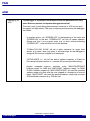
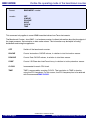
Brief Overview of Documents for New Users
Architecture-independent information:
•
”Debugger Basics - Training” (training_debugger.pdf): Get familiar with the basic features of a
TRACE32 debugger.
•
”T32Start” (app_t32start.pdf): T32Start assists you in starting TRACE32 PowerView instances
for different configurations of the debugger. T32Start is only available for Windows.
•
“General Commands” (general_ref_<x>.pdf): Alphabetic list of debug commands.
Architecture-specific information:
•
“Processor Architecture Manuals”: These manuals describe commands that are specific for the
processor architecture supported by your debug cable. To access the manual for your processor
architecture, proceed as follows:
©1989-2014 Lauterbach GmbH
ARM Debugger
7
Brief Overview of Documents for New Users
-
Choose Help menu > Processor Architecture Manual.
•
“RTOS Debugger” (rtos_<x>.pdf): TRACE32 PowerView can be extended for operating systemaware debugging. The appropriate RTOS manual informs you how to enable the OS-aware
debugging.
•
This manual does not cover the Cortex-A5x (ARMv8) cores, please refer to ”ARMv8-A
Debugger” (debugger_armv8a.pdf) if you are using this processor architecture.
•
This manual does not cover the Cortex-M processor architecture, please refer to ”Cortex-M
Debugger” (debugger_cortexm.pdf) for details.
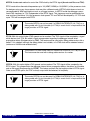
Warning
NOTE:
To prevent debugger and target from damage it is recommended to connect or
disconnect the debug cable only while the target power is OFF.
Recommendation for the software start:
•
Disconnect the debug cable from the target while the target power is off.
•
Connect the host system, the TRACE32 hardware and the debug cable.
•
Power ON the TRACE32 hardware.
•
Start the TRACE32 software to load the debugger firmware.
•
Connect the debug cable to the target.
•
Switch the target power ON.
•
Configure your debugger e.g. via a start-up script.
Power down:
•
Switch off the target power.
•
Disconnect the debug cable from the target.
•
Power OFF the TRACE32 hardware.
©1989-2014 Lauterbach GmbH
ARM Debugger
8
Warning
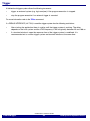
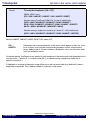
Quick Start of the JTAG Debugger
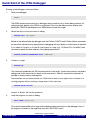
Starting up the debugger is done as follows:
1.
Reset the debugger.
RESet
The RESet command ensures that no debugger setting remains from a former debug session. All
settings get their default value. RESet is not required if you start the debug session directly after
booting the TRACE32 development tool. RESet does not reset the target.
2.
Select the chip or core you intend to debug.
SYStem.CPU <cputype>
Based on the selected chip the debugger sets the SYStem.CONFIG and SYStem.Option commands
the way which should be most appropriate for debugging this chip. Ideally no further setup is required.
If you select a Cortex-A or Cortex-R core instead of a chip (e.g. “SYStem.CPU CortexR4”) then
you need to specify the base address of the debug register block:
SYStem.CONFIG.COREDEBUG.Base <address>
3.
Connect to target.
SYStem.Up
This command establishes the JTAG communication to the target. It resets the processor and enters
debug mode (halts the processor; ideally at the reset vector). After this command is executed it is
possible to access memory and registers.
Some devices can not communicate via JTAG while in reset or you might want to connect to a
running program without causing a target reset. In this case use
SYStem.Mode Attach
instead. A “Break” will halt the processor.
4.
Load the program you want to debug.
Data.LOAD armle.axf
This loads the executable to the target and the debug/symbol information to the debugger’s host. If
the program is already on the target then load with “/NOCODE” option.
©1989-2014 Lauterbach GmbH
ARM Debugger
9
Quick Start of the JTAG Debugger
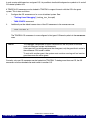
A start sequence example is shown below. This sequence can be written to an ASCII file (script file) and
executed with the command DO <filename>.
WinCLEAR
; Clear all windows
SYStem.CPU ARM940T
; Select the core type
MAP.BOnchip 0x100000++0xfffff
; Specify where FLASH/ROM is
SYStem.Up
; Reset the target and enter debug mode
Data.LOAD armle.axf
; Load the application
Register.Set pc main
; Set the PC to function main
Register.Set r13 0x8000
; Set the stack pointer to address 8000
PER.view
; Show clearly arranged peripherals
; in window *)
List
; Open source code window *)
Register /SpotLight
; Open register window *)
Frame.view /Locals /Caller
; Open the stack frame with
; local variables *)
Var.Watch var1 var2
; Open watch window for variables *)
Break.Set 0x1000 /Program
; Set software breakpoint to address
; 1000 (address 1000 outside of BOnchip
; range)
Break.Set 0x101000 /Program
; Set on-chip breakpoint to address
; 101000 (address 101000 is within
; BOnchip range)
*) These commands open windows on the screen.
©1989-2014 Lauterbach GmbH
ARM Debugger
10
Quick Start of the JTAG Debugger
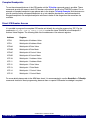
Troubleshooting
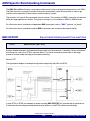
Communication between Debugger and Processor can not be established
Typically the SYStem.Up command is the first command of a debug session where communication with the
target is required. If you receive error messages like “debug port fail” or “debug port time out” while executing
this command this may have the reasons below. “target processor in reset” is just a follow-up error message.
Open the “AREA” window to see all error messages.
•
The target has no power or the debug cable is not connected to the target. This results in the
error message “target power fail”.
•
You did not select the correct core type SYStem.CPU <type>.
•
There is an issue with the JTAG interface. See ”ARM JTAG Interface Specifications”
(arm_app_jtag.pdf) and the manuals or schematic of your target to check the physical and
electrical interface. Maybe there is the need to set jumpers on the target to connect the correct
signals to the JTAG connector.
•
There is the need to enable (jumper) the debug features on the target. It will e.g. not work if
nTRST signal is directly connected to ground on target side.
•
The target is in an unrecoverable state. Re-power your target and try again.
•
The target can not communicate with the debugger while in reset. Try SYStem.Mode Attach
followed by “Break” instead of SYStem.Up or use SYStem.Option EnReset OFF.
•
The default JTAG clock speed is too fast, especially if you emulate your core or if you use an
FPGA based target. In this case try SYStem.JtagClock 50kHz and optimize the speed when you
got it working.
•
Your core needs adaptive clocking. Use the RTCK mode: SYStem.JtagClock RTCK.
•
The core is used in a multicore system and the appropriate multicore settings for the debugger
are missing. See for example SYStem.CONFIG IRPRE. This is the case if you get a value
IR_Width > 5 when you enter “DIAG 3400” and “AREA”. If you get IR_Width = 4 (ARM7, ARM9,
Cortex) or IR_Width = 5 (ARM11), then you have just your core and you do not need to set these
options. If the value can not be detected, then you might have a JTAG interface issue.
•
The core has no clock.
•
The core is kept in reset.
•
There is a watchdog which needs to be deactivated.
•
Your target needs special debugger settings. Check the directory \demo\arm\hardware if there is
an suitable script file *.cmm for your target.
©1989-2014 Lauterbach GmbH
ARM Debugger
11
Troubleshooting
FAQ
ARM
Debugging via
VPN
The debugger is accessed via Internet/VPN and the performance is very
slow. What can be done to improve debug performance?
The main cause for bad debug performance via Internet or VPN are low data
throughput and high latency. The ways to improve performance by the debugger
are limited:
in practice scripts, use "SCREEN.OFF" at the beginning of the script and
"SCREEN.ON" at the end. "SCREEN.OFF" will turn off screen updates.
Please note that if your program stops (e.g. on error) without executing
"SCREEN.OFF", some windows will not be updated.
"SYStem.POLLING SLOW" will set a lower frequency for target state
checks (e.g. power, reset, jtag state). It will take longer for the debugger to
recognize that the core stopped on a breakpoint.
"SETUP.URATE 1.s" will set the default update frequency of Data.List/
Data.dump/Variable windows to 1 second (the slowest possible setting).
prevent unneeded memory accesses using "MAP.UPDATEONCE
[address-range]" for RAM and "MAP.CONST [address--range]" for ROM/
FLASH. Address ranged with "MAP.UPDATEONCE" will read the specified
address range only once after the core stopped at a breakpoint or manual
break. "MAP.CONST" will read the specified address range only once per
SYStem.Mode command (e.g. SYStem.Up).
©1989-2014 Lauterbach GmbH
ARM Debugger
12
FAQ
Setting a
Software
Breakpoint fails
What can be the reasons why setting a software breakpoint fails?
Setting a software breakpoint can fail when the target HW is not able to
implement the wanted breakpoint.
Possible reasons:
The wanted breakpoint needs special features that are only possible to
realize by the trigger unit inside the controller.
Example: Read, write and access (Read/Write) breakpoints ("type" in Break.Set
window). Breakpoints with checking in real-time for data-values ("Data").
Breakpoints with special features ("action") like TriggerTrace, TraceEnable,
TraceOn/TraceOFF.
TRACE32 can not change the memory.
Example: ROM and Flash when no preparation with FLASH.Create,
FLASH.TARGET and FLASH.AUTO was made. All type of memory if the
memory device is missing the necessary control signals like WriteEnable or
settings of registers and SpecialFunctionRegisters (SFR).
Contrary settings in TRACE32.
Like: MAP.BOnchip for this memory range. Break.SELect.<breakpoint-type>
Onchip (HARD is only available for ICE and FIRE).
RTOS and MMU:
If the memory can be changed by Data.Set but the breakpoint doesn't work it
might be a problem of using an MMU on target when setting the breakpoint to a
symbolic address that is different than the writable and intended memory
location.
Data values
onchip
breakpoints
Error Message
Emulator Berr
Error
Is it possible to set onchip breakpoints with data values?
ARM7/9 support setting onchip breakpoints with data values. ARM11, CORTEX
A/R does not support this capability. However, if the processor has an ETM
logic, TRACE32 can provide this functionality by using two of the address and
data comparators provided in the ETM. By setting the option
ETM.ReadWriteBreak, the resource management of TRACE32 is reconfigured
so that two address/data comparators of the ETM can be used as standard
read/write breakpoints. If the CPU does not support data values breakpoints and
the ETM is not used, TRACE32 will stop the CPU when the data address is
accessed, compare the data value with the condition and restart the CPU if the
values are not equal.
The message "emulator berr error" is displayed in some windows.
This message indicates that the ARM has entered the ABORT mode as result of
a system speed access from debug mode. The reason is, that at least one
memory access which was necessary to update the window was terminated
with active ABORT (if AMBA: ERROR) signal.
©1989-2014 Lauterbach GmbH
ARM Debugger
13
FAQ
Unstable Data
Why do I have flickering data in some windows?
Please make sure that the TURBO mode is off (SYStem.Option TURBO OFF).
Another setting that may solve the problem is the reduction of the JTAG
frequency (SYStem.JtagClock 5 MHz).
ARM7
Setting a
Software
Breakpoint fails
What can be the reasons why setting a software-breakpoint fails?
Setting a software breakpoint can fail when the target HW is not able to realize
the wanted breakpoint.
Possible reasons:
•
The wanted breakpoint needs special features that are only possible to
realize by the trigger unit inside the controller.
Example: Read, Write and Access (Read/Write) breakpoints ("type" in
Break.Set window). Breakpoints with checking in real-time for data-values
("Data"). Breakpoints with special features ("action") like TriggerTrace,
TraceEnable, TraceOn/TraceOFF.
• TRACE32 can not change the memory.
Example: ROM. Flash when no preparation with FLASH.Create,
FLASH.TARGET and FLASH.AUTO was made. All memory if the memory
device is missing the necessary control signals like WriteEnable or settings of
registers and SpecialFunctionRegisters (SFR).
• Contrary settings in TRACE32.
Like: MAP.BOnchip for this memory range. Break.SELect.<breakpoint-type>
Onchip (HARD is only available for ICE and FIRE).
• RTOS and MMU:
If the memory is able to be changed by Data.Set but the breakpoint doesn't work
it might be a problem of using an MMU on target when setting the breakpoint to
a symbolic address that is different than the writable and intended memory
location.
Arm Dongle
Modifications for ARM Debug Cable
http://www.lauterbach.com/faq/arm_dongle.pdf Modifications ARM Dongle
©1989-2014 Lauterbach GmbH
ARM Debugger
14
FAQ
JANUS
No information available
ARM9
Setting a
Software
Breakpoint fails
What can be the reasons why setting a software-breakpoint fails?
Setting a software breakpoint can fail when the target HW is not able to realize
the wanted breakpoint.
Possible reasons:
•
The wanted breakpoint needs special features that are only possible to
realize by the trigger unit inside the controller.
Example: Read, Write and Access (Read/Write) breakpoints ("type" in
Break.Set window). Breakpoints with checking in real-time for data-values
("Data"). Breakpoints with special features ("action") like TriggerTrace,
TraceEnable, TraceOn/TraceOFF.
• TRACE32 can not change the memory.
Example: ROM. Flash when no preparation with FLASH.Create,
FLASH.TARGET and FLASH.AUTO was made. All memory if the memory
device is missing the necessary control signals like WriteEnable or settings of
registers and SpecialFunctionRegisters (SFR).
• Contrary settings in TRACE32.
Like: MAP.BOnchip for this memory range. Break.SELect.<breakpoint-type>
Onchip (HARD is only available for ICE and FIRE).
• RTOS and MMU:
If the memory is able to be changed by Data.Set but the breakpoint doesn't work
it might be a problem of using an MMU on target when setting the breakpoint to
a symbolic address that is different than the writable and intended memory
location.
Arm Dongle
Modifications for ARM Debug Cable
http://www.lauterbach.com/faq/arm_dongle.pdf Modifications ARM Dongle
©1989-2014 Lauterbach GmbH
ARM Debugger
15
FAQ
ARM10
Arm Dongle
Modifications for ARM Dongle
ARM11
Setting a
Software
Breakpoint fails
What can be the reasons why setting a software-breakpoint fails?
Setting a software breakpoint can fail when the target HW is not able to realize
the wanted breakpoint.
Possible reasons:
•
The wanted breakpoint needs special features that are only possible to
realize by the trigger unit inside the controller.
Example: Read, Write and Access (Read/Write) breakpoints ("type" in
Break.Set window). Breakpoints with checking in real-time for data-values
("Data"). Breakpoints with special features ("action") like TriggerTrace,
TraceEnable, TraceOn/TraceOFF.
• TRACE32 can not change the memory.
Example: ROM. Flash when no preparation with FLASH.Create,
FLASH.TARGET and FLASH.AUTO was made. All memory if the memory
device is missing the necessary control signals like WriteEnable or settings of
registers and SpecialFunctionRegisters (SFR).
• Contrary settings in TRACE32.
Like: MAP.BOnchip for this memory range. Break.SELect.<breakpoint-type>
Onchip (HARD is only available for ICE and FIRE).
• RTOS and MMU:
If the memory is able to be changed by Data.Set but the breakpoint doesn't work
it might be a problem of using an MMU on target when setting the breakpoint to
a symbolic address that is different than the writable and intended memory
location.
Arm Dongle
Modifications for ARM Debug Cable
http://www.lauterbach.com/faq/arm_dongle.pdf Modifications ARM Dongle
©1989-2014 Lauterbach GmbH
ARM Debugger
16
FAQ
Cortex-A/-R
No information available
XSCALE
Setting a
Software
Breakpoint fails
What can be the reasons why setting a software-breakpoint fails?
Setting a software breakpoint can fail when the target HW is not able to realize
the wanted breakpoint.
Possible reasons:
•
The wanted breakpoint needs special features that are only possible to
realize by the trigger unit inside the controller.
Example: Read, Write and Access (Read/Write) breakpoints ("type" in
Break.Set window). Breakpoints with checking in real-time for data-values
("Data"). Breakpoints with special features ("action") like TriggerTrace,
TraceEnable, TraceOn/TraceOFF.
• TRACE32 can not change the memory.
Example: ROM. Flash when no preparation with FLASH.Create,
FLASH.TARGET and FLASH.AUTO was made. All memory if the memory
device is missing the necessary control signals like WriteEnable or settings of
registers and SpecialFunctionRegisters (SFR).
• Contrary settings in TRACE32.
Like: MAP.BOnchip for this memory range. Break.SELect.<breakpoint-type>
Onchip (HARD is only available for ICE and FIRE).
• RTOS and MMU:
If the memory is able to be changed by Data.Set but the breakpoint doesn't work
it might be a problem of using an MMU on target when setting the breakpoint to
a symbolic address that is different than the writable and intended memory
location.
Arm Dongle
Modifications for ARM Debug Cable
http://www.lauterbach.com/faq/arm_dongle.pdf Modifications ARM Dongle
©1989-2014 Lauterbach GmbH
ARM Debugger
17
FAQ
Trace Extensions
There are two types of trace extensions available on the ARM:
•
ARM-ETM: an Embedded Trace Macrocell or Program Trace Macrocell is integrated into the
core. The Embedded Trace Macrocell provides program and data flow information plus trigger
and filter features. The Program Trace Macrocell provide similar features but no data trace. The
TRACE32 does not distinguish between ETM and PTM. The ETM command group is used for
both.
Please refer to the online help books ”ARM-ETM Trace” (trace_arm_etm.pdf) and ”ARM-ETM
Programming Dialog” (trace_arm_etm_dialog.pdf) for detailed information about the usage of
ARM ETM/PTM.
Please note that in case of CoreSight ETM/PTM you need to inform the debugger about the
CoreSight trace system on the chip. If you can select the chip you are using (e.g. ‘SYStem.CPU
OMAP4430’) then this is automatically done. If you select a core (e.g. ‘SYStem.CPU CortexA9’)
then you need to configure the debugger in your start-up script by using commands like
SYStem.CONFIG.ETM.Base, SYStem.CONFIG.FUNNEL.Base, SYStem.CONFIG.TPIU.Base,
SYStem.CONFIG.FUNNEL.ATBSource, SYStem.CONFIG.TPIU.ATBSource. In case a HTM or
ITM/STM module is available and shall be used you need also settings for that.
•
ARM7 Bus Trace: the Preprocessor for ARM7 family samples the external address and data bus.
The features for the Bus Trace are described in this book.
The commands for the ARM7 bus trace are: SYStem.Option AMBA, SYStem.Option NODATA,
TrOnchip.TEnable and TrOnchip.TCYcle.
©1989-2014 Lauterbach GmbH
ARM Debugger
18
Trace Extensions
Symmetric Multiprocessing
A multi-core system used for Asymmetric Multiprocessing (AMP) has specialized cores which are used
for specific tasks. To debug such a system you need to open separate TRACE32 graphical user interfaces
(GUI) one for each core. On each GUI you debug the application which is assigned to this core and will
never be executed on an other core. The GUIs can be synchronized regarding program start and halt in
order to debug the cores interaction.
ARM11 MPCore and Cortex-A9 MPCore are examples for multi-core architectures which allow Symmetric
Multiprocessing (SMP). The included cores of identical type are connected to a single shared main
memory. Typically a proper SMP real-time operating system assigns the tasks to the cores. You will not know
on which core the task you are interested in will be executed.
To debug a SMP system you start only one TRACE32 GUI.
The selection of the proper SMP chip (e.g. ’CNS3420’ or ’OMAP4430’) causes the debugger to connect to
all included SMP-able cores on start-up (e.g. by ’SYStem.Up’). If you have a SMP-able core type selected
(e.g. ’ARM11MPCore’ or ’CortexA9MPCore’) you need to specify the number of cores you intend to SMPdebug by SYStem.CONFIG CoreNumber <number>.
On a selected SMP chip (e.g. ’CNS3420’ or ’OMAP4430’) the CONFIG parameters of all cores are typically
known by the debugger. For a SMP-able core type you need to set them yourself (e.g. IRPRE, COREBASE,
...). Where needed multiple parameters are possible (e.g. ’SYStem.CONFIG.COREDEBUG.Base
0x80001000 0x80003000’.
System options and selected JTAG clock affect all cores. For the start-up the first core gets control over the
reset signals. ’SYStem.CONFIG Slave ON’ may only be used if none of the SMP cores may control the reset
lines and initialize the JTAG interface.
All cores will be started, stepped and halted together. An exception is the assembler single-step which will
affect only one core.
TRACE32 takes care that software and on-chip breakpoints will have effect on whatever core the task will
run.
When the task halts, e.g. due to a breakpoint hit, the TRACE32 GUI shows the core on which the debug
event has happened. The core number is shown in the state line at the bottom of the main window. You can
switch the GUIs perspective to the other cores when you right-click on the core number there. Alternatively
you can use the command CORE.select <number>.
©1989-2014 Lauterbach GmbH
ARM Debugger
19
Symmetric Multiprocessing
ARM Specific Implementations
Breakpoints
Software Breakpoints
If a software breakpoint is used, the original code at the breakpoint location is patched by a breakpoint code.
While software breakpoints are used one of the two ICE breaker units is programmed with the breakpoint
code (on ARM7 and ARM9, except ARM9E variants). This means whenever a software breakpoint is set
only one ICE unit breakpoint is remaining for other purposes. There is no restriction in the number of
software breakpoints.
On-chip Breakpoints for Instructions
If on-chip breakpoints are used, the resources to set the breakpoints are provided by the CPU. For the ARM
architecture the on-chip breakpoints are provided by the “ICEbreaker” unit. on-chip breakpoints are usually
needed for instructions in FLASH/ROM.
With the command MAP.BOnchip <range> it is possible to tell the debugger where you have ROM / FLASH
on the target. If a breakpoint is set into a location mapped as BOnchip one ICEbreaker unit is automatically
programmed.
On-chip Breakpoints for Data
To stop the CPU after a read or write access to a memory location on-chip breakpoints are required. In the
ARM notation these breakpoints are called watchpoints. A watchband may use one or two ICEbreaker units.
The number of on-chip breakpoints for data accesses can be extended by using the ETM Address and Data
comparators. Refer to ETM.ReadWriteBreak.
©1989-2014 Lauterbach GmbH
ARM Debugger
20
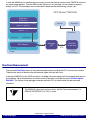
ARM Specific Implementations
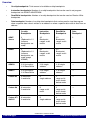
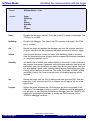
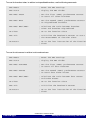
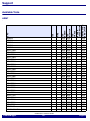
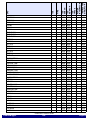
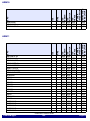
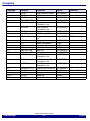
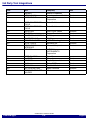
Overview
•
On-chip breakpoints: Total amount of available on-chip breakpoints.
•
Instruction breakpoints: Number of on-chip breakpoints that can be used to set program
breakpoints into ROM/FLASH/EPROM.
•
Read/Write breakpoints: Number of on-chip breakpoints that can be used as Read or Write
breakpoints.
•
Data breakpoint: Number of on-chip data breakpoints that can be used to stop the program
when a specific data value is written to an address or when a specific data value is read from an
address
On-chip
Breakpoints
Instruction
Breakpoints
Read/Write
Breakpoints
Data
Breakpoint
ARM7
Janus
2
(Reduced to 1 if
software
breakpoints are
used)
2/1
Breakpoint
ranges as bit
masks
2/1
Breakpoint
ranges as bit
masks
2
ARM9
2
(Reduced to 1 if
software
breakpoints are
used, except
ARM9E)
2/1
Breakpoint
ranges as bit
masks
2/1
Breakpoint
ranges as bit
masks
2
ARM10
2-16 Instruction
2-16 Read/Write
2-16 single
address
2-16 single
address
—
ARM11
2-16 Instruction
2-16 Read/Write
2-16 single
address
2-16 single
address
—
Cortex-A5
3 instruction
2 read/write
3
single address
2
range as bit
mask, break
before make
—
Cortex-A8
6 instruction
2 read/write
6
range as bit
mask
2
range as bit
mask, break
before make
—
Cortex-A7/
A9/A15
6 instruction
4 read/write
6
single address
4
range as bit
mask, break
before make
—
©1989-2014 Lauterbach GmbH
ARM Debugger
21
ARM Specific Implementations
Hardware Breakpoints (Bus Trace only)
When a Preprocessor for ARM7 family is used, hardware breakpoints are available to filter the trace
information. Refer to TrOnchip.TEnable for more information.
If a hardware breakpoint is used the resources to set the breakpoint are provided by the TRACE32
development tool.
©1989-2014 Lauterbach GmbH
ARM Debugger
22
ARM Specific Implementations
Example for Standard Breakpoints
Assume you have a target with
•
FLASH from 0x0--0xfffff
•
RAM from 0x100000--0x11ffff
The command to configure TRACE32 correctly for this configuration is:
Map.BOnchip 0x0--0xfffff
The following standard breakpoint combinations are possible.
1.
2.
3.
4.
Unlimited breakpoints in RAM and one breakpoint in ROM/FLASH
Break.Set 0x100000 /Program
; Software breakpoint 1
Break.Set 0x101000 /Program
; Software breakpoint 2
Break.Set addr /Program
; Software breakpoint 3
Break.Set 0x100 /Program
; On-chip breakpoint
Unlimited breakpoints in RAM and one breakpoint on a read or write access
Break.Set 0x100000 /Program
; Software breakpoint 1
Break.Set 0x101000 /Program
; Software breakpoint 2
Break.Set addr /Program
; Software breakpoint 3
Break.Set 0x108000 /Write
; On-chip breakpoint
Two breakpoints in ROM/FLASH
Break.Set 0x100 /Program
; On-chip breakpoint 1
Break.Set 0x200 /Program
; On-chip breakpoint 2
Two breakpoints on a read or write access
Break.Set 0x108000 /Write
; On-chip breakpoint 1
Break.Set 0x108010 /Read
; On-chip breakpoint 2
©1989-2014 Lauterbach GmbH
ARM Debugger
23
ARM Specific Implementations
5.
One breakpoint in ROM/FLASH and one breakpoint on a read or write access
Break.Set 0x100 /Program
; On-chip breakpoint 1
Break.Set 0x108010 /Read
; On-chip breakpoint 2
©1989-2014 Lauterbach GmbH
ARM Debugger
24
ARM Specific Implementations
Complex Breakpoints
To use the advanced features of the ICE breaker unit the TrOnchip command group is possible. These
commands provide full access to both ICE breaker units called A and B in the TRACE32 system. For an
example of complex breakpoint usage please refer to the chapter TrOnchip Example. Most features can
also be used by setting advanced breakpoints (e.g. task selective breakpoints, exclude breakpoints).
Ranged breakpoints use multiple breakpoint resources to better fit the range when the resources are
available.
Direct ICE Breaker Access
It is possible to program the complete ICE breaker unit directly, by using the access class ICE. E.g. the
command Data.Set ICE:10 %Long 12345678 writes the value 12345678 to the Watchpoint 1
Address Value Register. The following table lists the addresses of the relevant registers.
Address
Register
ICE:8
Watchpoint 0 Address Value
ICE:9
Watchpoint 0 Address Mask
ICE:0A
Watchpoint 0 Data Value
ICE:0B
Watchpoint 0 Data Mask
ICE:0C
Watchpoint 0 Control Value
ICE:0D
Watchpoint 0 Control Mask
ICE:10
Watchpoint 1 Address Value
ICE:11
Watchpoint 1 Address Mask
ICE:12
Watchpoint 1 Data Value
ICE:13
Watchpoint 1 Data Mask
ICE:14
Watchpoint 1 Control Value
ICE:15
Watchpoint 1 Control Mask
For more details please refer to the ARM data sheet. It is recommended to use the Break.Set or TrOnchip
commands instead of direct programming, because then no special ICEbreaker knowledge is required.
©1989-2014 Lauterbach GmbH
ARM Debugger
25
ARM Specific Implementations
Trigger
A bidirectional trigger system allows the following two events:
•
trigger an external system (e.g. logic analyzer) if the program execution is stopped.
•
stop the program execution if an external trigger is asserted.
For more information refer to the TrBus command.
If a DEBUG INTERFACE (LA-7701) is used the trigger system has the following restrictions:
•
After starting the application there is a delay until the trigger system is working. The delay
depends on the host system and the JTAG frequency. It will be typically between 25 and 100 us.
•
If a terminal window is open the response time of the trigger system is undefined. It is
recommended not to use the trigger system and terminal window at the same time.
©1989-2014 Lauterbach GmbH
ARM Debugger
26
ARM Specific Implementations
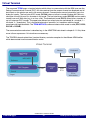
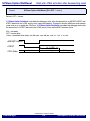
Virtual Terminal
The command TERM opens a terminal window which allows to communicate with the ARM core over the
Debug Communications Channel (DCC). All data received from the comms channel are displayed and all
data inputs to this window are sent to the comms channel. Communication occurs byte wide or up to four
bytes per transfer. The four bytes ASCII mode (DCC4A) does not allow to transfer the byte 00. Each nonzero byte of the 32 bit word is a character in this mode. The four byte binary mode (DCC4B) can be used to
transfer non-ascii 32bit data (e.g. to or from a file). The three bytes mode (DCC3) allows binary transfers of
up to 3 bytes per DCC transfer. The upper byte defines how many bytes are transferred (0 = one byte, 1 =
two bytes, 2 = three bytes). This is the preferred mode of operation, as it combines arbitrary length
messages with high bandwidth. The TERM.METHOD command selects which mode is used (DCC, DCC3,
DCC4A or DCC4B).
The communication mechanism is described e.g. in the ARM7TDMI data sheet in chapter 9.11. Only three
move to/from coprocessor 14 instructions are necessary.
The TRACE32 demo/arm/etc/vitual_terminal directory contains examples for the different ARM families
which demonstrate how the communication works.
#$
%
&'
( )
*
!"
©1989-2014 Lauterbach GmbH
ARM Debugger
27
ARM Specific Implementations
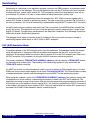
Semihosting
Semihosting is a technique for an application program running on an ARM processor to communicate with
the host computer of the debugger. This way the application can use the I/O facilities of the host computer
like keyboard input, screen output, and file I/O. This is especially useful if the target platform does not yet
provide these I/O facilities or in order to output additional debug information in printf() style.
A semihosting call from the application causes an exception by a SVC (SWI) instruction together with a
certain SVC number to indicate a semihosting request. The type of operation is passed in R0. R1 points to
the other parameters. On Cortex-M semihosting is implemented using the BKPT instead of SVC instruction.
Normally semihosting is invoked by code within the C library functions of the ARM RealView compiler like
printf() and scanf(). The application can also invoke the operations used for keyboard input, screen output,
and file I/O directly. The operations are described in the RealView Compilation Tools Developer Guide from
ARM in the chapter ‚Semihosting Operations'.
The debugger which needs to interface to the I/O facilities on the host provides two ways to handle a
semihosting request which results in a SVC (SWI) or BKPT exception:
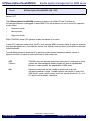
SVC (SWI) Emulation Mode
A breakpoint placed on the SVC exception entry stops the application. The debugger handles the request
while the application is stopped, provides the required communication with the host, and restarts the
application at the address which was stored in the link register R14 on the SVC exception call. Other as for
the DCC mode the SVC parameter has to be 0x123456 to indicate a semihosting request.
This mode is enabled by TERM.METHOD ARMSWI [<address>] and by opening a TERM.GATE window
for the semihosting screen output. The handling of the semihosting requests is only active when the
TERM.GATE window is existing.
On ARM7 an on-chip or software breakpoint needs to be set at address 8 (SWI exception entry). On other
ARM cores also the vector catch register can be used: TrOnchip.Set SWI ON. The Cortex-M does not need
a breakpoint because it already uses the breakpoint instruction BKPT for the semihosting request.
When using the <address> option of the TERM.METHOD ARMSWI [<address>] any memory location with
a breakpoint on it can be used as a semihosting service entry instead of the SVC call at address 8. The
application just needs to jump to that location. After servicing the request the program execution continues at
that address (not at the address in the link register R14). You could for example place a ’BX R14’ command
at that address and hand the return address in R14. Since this method does not use the SVC command no
parameter (0x123456) will be checked to identify a semihosting call.
©1989-2014 Lauterbach GmbH
ARM Debugger
28
ARM Specific Implementations
TERM.HEAPINFO defines the system stack and heap location. The C library reads these memory
parameters by a SYS_HEAPINFO semihosting call and uses them for initialization. An example can be
found in demo/arm/etc/semihosting_arm_emulation/swisoft_x.cmm.
+"
! "
( "
,-
.
# /
# $%
& ' & )* ©1989-2014 Lauterbach GmbH
ARM Debugger
29
ARM Specific Implementations
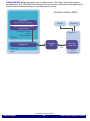
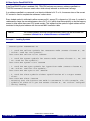
DCC Communication Mode (DCC = Debug Communication Channel)
A semihosting exception handler will be called by the SVC (SWI) exception. It uses the Debug
Communication Channel based on the JTAG interface to communicate with the host. The target application
will not be stopped, but the semihosting exception handler needs to be loaded or linked to the application.
The Cortex-M does not provide a DCC, therefore this mode can not be used.
This mode is enabled by TERM.METHOD DCC3 and by opening a TERM.GATE window for the
semihosting screen output. The handling of the semihosting requests is only active when the TERM.GATE
window is existing. TERM.HEAPINFO defines the system stack and heap location. The ARM C library reads
these memory parameters by a SYS_HEAPINFO semihosting call and uses them for initialisation. An
example (swidcc_x.cmm) and the source of the ARM compatible semihosting handler (t32swi.c,
t32helper_x.c) can be found in demo/arm/etc/semihosting_arm_dcc.
*+
! "# $ %
' %
,-
. /
! 0
! "#
$ & $ () ©1989-2014 Lauterbach GmbH
ARM Debugger
30
ARM Specific Implementations
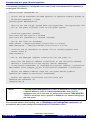
In case the ARM library for semihosting is not used, you can alternatively use the native TRACE32 format for
the semihosting requests. Then the SWI handler (t32swi.c) is not required. You can send the requests
directly via DCC. Find examples and source codes in demo/arm/etc/semihosting_trace32_dcc.
(%!)
%
*+
! " , .
# $ # &' Runtime Measurement
The command RunTime allows run time measurement based on polling the CPU run status by software.
Therefore the result will be about few milliseconds higher than the real value.
If the signal DBGACK on the JTAG connector is available, the measurement will automatically be based on
this hardware signal which delivers very exact results. Please do not disable the option SYStem.Option
DBGACK. The runtime of the debugger accesses while the CPU is halted would also be measured,
otherwise.
The DBGACK signal can not be used for the RunTime measurement if a
DEBUG INTERFACE (LA-7701) is used.
©1989-2014 Lauterbach GmbH
ARM Debugger
31
ARM Specific Implementations
Coprocessors
The following coprocessors can be accessed if available in the processor:
Coprocessor 14. Please refer to the chapter Virtual Terminal and to your ARM documentation for details.
On Cortex-A and Cortex-R the debug register can be accessed by ’C14’ access class and the address is the
address offset in the debug register block divided by 4. Recommended is to use the ’DAP:’ or ’EDAP:’
access class, but then the address is the address offset plus the base address of the debug register block
which is 0xd4011000.
Coprocessor 15, which allows the control of basic CPU functions. This coprocessor can be accessed with
the access class C15. For the detailed definition of the CP15 registers please refer to the ARM data sheet.
The CP15 registers can also be controlled in the PER window.
The TRACE32 address is composed of the CRn, CRm, op1, op2 fields of the corresponding coprocessor
register command
<MCR|MRC> p15, <op1>, Rd, CRn, CRm, <op2>
BIT0-3:CRn, BIT4-7:CRm, BIT8-10:<op2>, BIT12-14:<op1>, Bit16=0 (32-bit
access)
<MCRR|MRRC> p15, <op1>, <Rd1>, <Rd2>, <CRm>
BIT0-3: -, BIT4-7:CRm, BIT8-10: -, BIT12-14:<op1>, Bit16=1 (64-bit access)
is the corresponding TRACE32 address (one nibble for each field)
On Cortex-A/R or ARM11 you can access other available coprocessors by using the same addressing
scheme. The access class is then e.g. ’C10:’ instead of ’C15’. You need to secure that access to this
coprocessor is permitted in the Coprocessor Access Control Register.
The “C15:” access class provides the view of the mode the core currently is in. On devices having
“TrustZone” (ARM1176, Cortex-A) there are some banked CP15 register, one for secure and one for nonsecure mode. With “ZC15:” and “NC15:” you can access the secure / non-secure bank independent of the
current core mode. On devices having a “Hypervisor” mode (e.g. Cortex-A7, -A15) there are CP15 register
which are only available in hypervisor mode or in monitor mode with NS bit set. With “HC15:” you can
access these register independent of the current core mode.
©1989-2014 Lauterbach GmbH
ARM Debugger
32
ARM Specific Implementations
Access Classes
The following ARM specific access classes are available.
Memory Class
Description
P
Program Memory
D
Data Memory
S
Supervisor Memory (privileged access)
U
User Memory (non-privileged access)
not yet implemented; privileged access will be performed
R
ARM Code (32-bit)
T
Thumb Code (16-bit)
J
Java Code (8-bit)
Z
Secure Mode (TrustZone devices)
N
Non-Secure Mode (TrustZone devices)
H
Hypervisor Mode (devices having Virtualization Extension)
A
Absolute addressing (physical address)
I
Intermediate absolute/physical addressing
(devices having Virtualization Extension)
ICE
ICE Breaker Register (debug register; ARM7, ARM9)
C14
Coprocessor 14 Register (debug register; ARM10, ARM11)
C15
Coprocessor 15 Register (if implemented)
ETM
Embedded Trace Macrocell Registers (if implemented)
©1989-2014 Lauterbach GmbH
ARM Debugger
33
ARM Specific Implementations
DAP, DAP2,
AHB,AHB2,
APB,APB2,
AXI,AXI2
Memory access via bus masters, so named Memory Access Ports
(MEM-AP), provided by a Debug Access Port (DAP). The DAP is a
CoreSight component mandatory on Cortex based devices.
Which bus master (MEM-AP) is used by which access class (e.g. AHB) is
defined by assigning a MEM-AP number to the access class:
SYStem.CONFIG DEBUGACCESSPORT <mem-ap#> -> “DAP”
SYStem.CONFIG AHBACCESSPORT <mem-ap#> -> “AHB”
SYStem.CONFIG APBACCESSPORT <mem-ap#> -> “APB”
SYStem.CONFIG AXIACCESSPORT <mem-ap#> -> “AXI”
You should assign the memory access port connected to an AHB (AHB
MEM-AP) to “AHB” access class, APB MEM-AP to “APB” access class
and AXI MEM-AP to “AXI” access class. “DAP” should get the memory
access port where the debug register can be found which typically is an
APB MEM-AP (AHB MEM-AP in case of a Cortex-M).
There is a second set of access classes (DAP2, AHB2, APB2, AXI2) and
configuration commands (e.g. SYStem.CONFIG
DAP2AHBACCESSPORT <mem-ap#>) available in case there are two
DAPs which needs to be controlled by the debugger.
VM
Virtual Memory (memory on the debug system)
USR
Access to Special Memory via User Defined Access Routines
E
Run-time memory access
(see SYStem.CpuAccess and SYStem.MemAccess)
Combinations of the classes are possible. Example: ’ZSR ’ accesses ARM code in secure, privileged mode.
To access a memory class write the class in front of the address. Example:
Data.dump NSD:0--3
Normally there is no need to use the following memory classes: P, D, SP, UP, SR, ST, UR, UT, U, S, R, or T.
The memory class is set automatically depending on the setting of SYStem.Option DisMode.
The “User” memory classes are available if a DEBUG INTERFACE (LA-7701) is used for the ARM7.
The memory class ICE, C14 and ETM should only be used from very advanced users. Wrong usage may
cause unpredictable problems.
©1989-2014 Lauterbach GmbH
ARM Debugger
34
ARM Specific Implementations
TrustZone Technology
The Cortex-A and ARM1176 processor integrate ARM’s TrustZone technology, a hardware security
extension, to facilitate the development of secure applications.
It splits the computing environment into two isolated worlds. Most of the code runs in the ‘non-secure’ world,
whereas trusted code runs in the ‘secure’ world. There are core operations that allow you to switch between
the secure and non-secure world. For switching purposes, TrustZone introduces a new secure ‘monitor’
mode. Reset enters the secure world:
Secure state
Only when the core is in the secure world, core and debugger can access the secure memory. There are
some CP15 registers accessible in secure state only, and there are banked CP15 registers, with both secure
and non-secure versions.
Debug Permission
Debugging is strictly controlled. It can be enabled or disabled by the SPIDEN (Secure Privileged Invasive
Debug Enable) input signal and SUIDEN (Secure User Invasive Debug Enable) bit in SDER (Secure Debug
Enable Register):
•
SPIDEN=0, SUIDEN=0: debug in non-secure world, only
•
SPIDEN=0, SUIDEN=1: debug in non-secure world and secure user mode
•
SPIDEN=1: debug in non-secure and secure world
SPIDEN is a chip internal signal and it’s level can normally not be changed. The SUIDEN bit can be
changed in secure privileged mode, only.
Debug mode can not be entered in a mode where debugging is not allowed. Breakpoints will not work there.
A Break command or a SYStem.Up will work the moment a mode is entered where debugging is allowed.
©1989-2014 Lauterbach GmbH
ARM Debugger
35
ARM Specific Implementations
Checking Debug Permission
The DBGDSCR (Debug Status and Control Register) bit 16 shows the signal level of SPIDEN. In the SDER
(Secure Debug Enable Register) you can see the SUIDEN flag assuming you are in the secure state which
allows reading the SDER register.
Checking Secure State
In the peripheral file, the DBGDSCR register bit 18 (NS) shows the current secure state. You can also see it
in the Register.view window if you scroll down a bit. On the left side you will see ‘sec’ which means the core
is in the secure state, ‘nsec’ means the core is in non-secure state. Both reflect the bit 0 (NS) of the SCR
(Secure Control Register). However SCR is only accessible in secure state.
In monitor mode, which is also indicated in the Register.view window, the core is always in secure state
independent of the NS bit (non-secure bit) described above. However, in monitor mode, you can access the
secure CP15 register if NS=secure. And you can access the non-secure CP15 register if NS=non-secure.
Changing the Secure State from within TRACE32
From the TRACE32 PowerView GUI, you can switch between secure mode (0) and non-secure mode (1) by
toggling the ‘sec’, ‘nsec’ indicator in the Register.view window or by executing this command:
Register.Set NS 0 ;secure mode
Register.Set NS 1 ;non-secure mode
It sets or clears the NS (Non-Secure) bit in the SCR register. You will get a ‘emulator function blocked by
device security’ message in case you are trying to switch to secure mode although debugging is not allowed
in secure mode.
This way you can also inspect the register of the other world. Please note that a change in state affects
program execution. Remember to set the bit back to its original value before continuing the application
program.
Accessing Memory
If you do not specify otherwise, the debugger shows you the memory of the secure state the core is currently
in.
•
The access class ‘Z:’ indicates secure mode (‘Z’ -> trustZone, ‘S’ -> Supervisor)
•
The access class ‘N:’ indicates non-secure mode.
By preceding an address with the ‘Z:’ and ‘N:’ access class, you can force a certain memory view for all
memory operations.
©1989-2014 Lauterbach GmbH
ARM Debugger
36
ARM Specific Implementations
Accessing Coprocessor CP15 Register
The peripheral file and ‘C15:’ access class will show you the CP15 register bank of the secure mode the
core is currently in. When you try to access registers in non-secure world which are accessible in secure
world only, the debugger will show you ‘????????’.
You can force to see the other bank by using access class “ZC15:” for secure, “NC15:” for non-secure
respectively.
Accessing Cache and TLB Contents
Reading cache and TLB (Translation Look-aside Buffer) contents is only possible if the debugger is allowed
to debug in secure state. You get a ‘function blocked by device security’ message otherwise.
However, a lot of devices do not provide this debug feature at all. Then you get the message ‘function not
supported by this device’.
Breakpoints and Vector Catch Register
Software breakpoints will be set in secure or non-secure memory depending on the current secure mode of
the core. Alternatively, software breakpoints can be set by preceding an address with the access class “Z:”
(secure) or “N:” (non-secure).
On-chip breakpoints will halt the core in any secure mode. Setting breakpoints for certain secure mode is not
yet available.
Vector catch debug events (TrOnchip.Set …) can individually be activated for secure state, non-secure
state, and monitor mode.
©1989-2014 Lauterbach GmbH
ARM Debugger
37
ARM Specific Implementations
Large Physical Address Extension (LPAE)
LPAE is an optional extension for the ARMv7-AR architecture. It allows physical addresses above 32-bit.
The instructions still use 32-bit addresses, but the extended memory management unit can map the address
within a 40-bit physical memory range.
virtual address (32-bit) --> extended MMU --> physical address (40-bit)
It is for example implemented on Cortex-A7 and Cortex-A15.
Consequence for Debugging
We have extended only the physical address, because the virtual address is still 32-bit.
Example: Memory dump starting at physical address 0x0280004000.
“A:” = absolute address = physical address.
Data.dump A:02:80004000
Unfortunately the above command will result in a bus error (‘????????’) on a real chip because the debug
interface does not support physical accesses beyond the 4GByte. It will work on the TRACE32 instruction
set simulator and on virtual platforms.
In case the Debug Access Port (DAP) of the chip provides an AXI MEM-AP then the debugger can act as a
bus master on the AXI, and you can access the physical memory independent of TLB entries.
Data.dump AXI:02:80004000
However this does not show you the cache contents in case of a write-back cache. For a cache coherent
access you need to set:
SYStem.Option AXIACEEnable ON
©1989-2014 Lauterbach GmbH
ARM Debugger
38
ARM Specific Implementations
Virtualization Extension, Hypervisor
The ‘Virtualization Extension’ is an optional extension in ARMv7-A. It can for example be found on Cortex-A7
and Cortex-A15. It adds a ‘Hypervisor’ processor mode used to switch between different guest operating
systems. The extension assumes LPAE and TrustZone. It adds a second stage address translation.
virtual addr. (32-bit) --> MMU --> intermediate physical addr. (40-bit) --> MMU_2nd --> physical addr. (40-bit)
Consequence for Debugging
The debugger shows you the memory view of the mode the core is currently in. The address translation and
therefore the view can/will be different for secure mode, non-secure mode, and hypervisor mode.
You can force a certain view/translation by switching to another mode or by using the access classes “Z:”
(secure), “N:” (non-secure) or “H:” (hypervisor).
If you want to perform an access addressed by an intermediate physical address, you can use the ‘I:’ access
class.
OS awareness for multiple operating systems is under development. At the moment you can have only one
OS awareness at a time.
©1989-2014 Lauterbach GmbH
ARM Debugger
39
ARM Specific Implementations
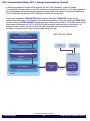
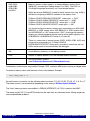
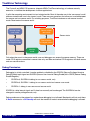
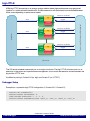
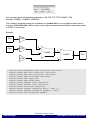
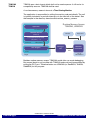
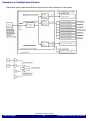
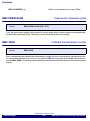
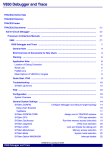
big.LITTLE
ARM big.LITTLE processing is an energy savings method where high-performance cores get paired
together in a cache-coherent combination. Software execution will dynamically be transitioned between
these cores depending on performance needs.
measure workload
big
task
toggle
CPU
#0
measure workload
Scheduler
task
big
toggle
CPU
#1
LITTLE
.
.
.
measure workload
big
task
CPU
#n
toggle
LITTLE
Power versa Performance Management
LITTLE
OS Kernel
The OS kernel scheduler sees each pair as a single virtual core. The big.LITTLE software works as an
extension to the power-versa-performance management. It can switch the execution context between the
big and the LITTLE core.
Qualified for pairing is Cortex-A15 (as ‘big’) and Cortex-A7 (as ‘LITTLE’).
Debugger Setup
Example for a symmetric big.LITTLE configuration (2 Cortex-A15, 2 Cortex-A7):
SYStem.CPU CORTEXA15A7
SYStem.CONFIG CoreNumber 4.
CORE.ASSIGN BIGLITTLE 1. 2. 3. 4.
SYStem.CONFIG.COREDEBUG.Base <CA15_1> <CA7_2> <CA15_3> <CA7_4>
©1989-2014 Lauterbach GmbH
ARM Debugger
40
ARM Specific Implementations
Example for a non-symmetric big.LITTLE configuration (1 Cortex-A15, 2 Cortex-A7):
SYStem.CPU CORTEXA15A7
SYStem.CONFIG CoreNumber 4.
CORE.ASSIGN BIGLITTLE 1. 2. NONE 4.
SYStem.CONFIG.COREDEBUG.Base <CA15_1> <CA7_2> <dummy_3> <CA7_4>
Consequence for Debugging
The shown core numbers are extended by ‘b’ = ‘big’ or ‘l’ = ‘LITLLE’.
The core status (active or powered down) can be checked with CORE.SHOWACTIVE or in the state line of
the TRACE32 main window, where you can switch between the cores.
The debugger assumes that one core of the pair is inactive.
The OS awareness sees each pair as one virtual core.
The peripheral file respects the core type (Cortex-A15 or Cortex-A7).
Requirements for the Target Software
The routine (OS on target) which switches between the cores needs to take care of (copying) transferring the
on-chip debug settings to the core which wakes up.
This needs also to be done when waking up a core pair. In this case you copy the settings from an already
active core.
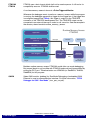
big.LITTLE MP
Another logical use-model is (‘MP’ = Multi-Processing). It allows both the big and the LITTLE core to be
powered on and to simultaneously execute code.
From the debuggers point of view, this is not a big.LITTLE system in the narrow sense. There are no pairs of
cores. It is handled like a normal multicore system but with mixed core types.
Therefore for the setup, we need SYStem.CPU CORTEXA15A7, but we use CORE.ASSIGN instead of
CORE.ASSIGN BIGLITTLE.
Example for a symmetric big.LITTLE MP configuration (2 Cortex-A15, 2 Cortex-A7):
SYStem.CPU CORTEXA15A7
SYStem.CONFIG CoreNumber 4.
CORE.ASSIGN 1. 2. 3. 4.
SYStem.CONFIG.COREDEBUG.Base <CA15_1> <CA7_2> <CA15_3> <CA7_4>
©1989-2014 Lauterbach GmbH
ARM Debugger
41
ARM Specific Implementations
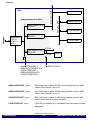
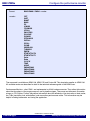
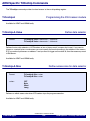
ARM specific SYStem Commands
SYStem.BdmClock
Define JTAG frequency
Obsolete command syntax. It has the same effect as SYStem.JtagClock. Use SYStem.JtagClock instead.
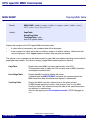
SYStem.CLOCK
Format:
Inform debugger about core clock
SYStem.CLOCK <freq>
The command informs the debugger about the core clock frequency. The information is used for
analysis functions where the core frequency needs to be known. This command is only available if the
debugger is used as front end for virtual prototyping.
©1989-2014 Lauterbach GmbH
ARM Debugger
42
ARM specific SYStem Commands
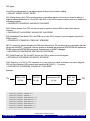
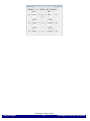
SYStem.CONFIG
Configure debugger according to target topology
Format:
SYStem.CONFIG <parameter>
SYStem.MultiCore <parameter> (deprecated syntax)
<parameter>:
(General)
state
<parameter>:
(Debugport)
CJTAGFLAGS <flags>
CJTAGTCA <value>
CONNECTOR [MIPI34 | MIPI20T]
CORE <core> <chip>
CoreNumber <number>
DEBUGPORT [DebugCable0 | DebugCableA | DebugCableB]
DEBUGPORTTYPE [JTAG | SWD | CJTAG | CJTAGSWD]
NIDNTTRSTTORST [ON | OFF]
NIDNTPSRISINGEDGE [ON | OFF]
NIDNTRSTPOLARITY [High | Low]
Slave [ON | OFF]
SWDP [ON | OFF]
SWDPIDLEHIGH [ON | OFF]
SWDPTargetSel <value>
TriState [ON | OFF]
<parameter>:
(JTAG)
CHIPDRLENGTH <bits>
CHIPDRPATTERN [Standard | Alternate <pattern>]
CHIPDRPOST <bits>
CHIPDRPRE <bits>
CHIPIRLENGTH <bits>
CHIPIRPATTERN [Standard | Alternate <pattern>]
CHIPIRPOST<bits>
CHIPIRPRE <bits>
DAP2DRPOST <bits>
DAP2DRPRE <bits>
DAP2IRPOST <bits>
DAP2IRPRE <bits>
DAPDRPOST <bits>
DAPDRPRE <bits>
DAPIRPOST <bits>
DAPIRPRE <bits>
DRPOST <bits>
DRPRE <bits>
ETBDRPOST <bits>
ETBDRPRE <bits>
ETBIRPOST <bits>
©1989-2014 Lauterbach GmbH
ARM Debugger
43
ARM specific SYStem Commands
ETBIRPRE <bits>
IRPOST<bits>
IRPRE <bits>
NEXTDRPOST <bits>
NEXTDRPRE <bits>
NEXTIRPOST<bits>
NEXTIRPRE <bits>
RTPDRPOST <bits>
RTPDRPRE <bits>
RTPIRPOST <bits>
RTPIRPRE <bits>
Slave [ON | OFF]
TAPState <state>
TCKLevel <level>
TriState [ON | OFF]
<parameter>:
(Multitap)
CFGCONNECT <code>
DAP2TAP <tap>
DAPTAP <tap>
DEBUGTAP <tap>
ETBTAP <tap>
MULTITAP [NONE | IcepickA | IcepickB | IcepickC | IcepickD | IcepickBB |
IcepickBC | IcepickCC | IcepickDD | STCLTAP1 | STCLTAP2 |
STCLTAP3 |
MSMTAP <irlength> <irvalue> <drlength> <drvalue>]
NJCR <tap>
RTPTAP <tap>
SLAVETAP <tap>
<parameter>:
(DAP)
AHBACCESSPORT <port>
APBACCESSPORT <port>
AXIACCESSPORT <port>
COREJTAGPORT <port>
DAP2AHBACCESSPORT <port>
DAP2APBACCESSPORT <port>
DAP2AXIACCESSPORT <port>
DAP2COREJTAGPORT <port>
DAP2DEBUGACCESSPORT <port>
DAP2JTAGPORT <port>
DAP2AHBACCESSPORT <port>
DEBUGACCESSPORT <port>
JTAGACCESSPORT <port>
MEMORYACCESSPORT <port>
©1989-2014 Lauterbach GmbH
ARM Debugger
44
ARM specific SYStem Commands
<parameter>:
(Components)
ADTF.Base <address>
ADTF.RESET
AET.Base <address>
AET.RESET
BMC.Base <address>
BMC.RESET
CMI.Base <address>
CMI.RESET
CMI.TraceID <id>
COREDEBUG.Base <address>
COREDEBUG.RESET
CTI.Base <address>
CTI.Config [NONE | ARMV1 | ARMPostInit | OMAP3 | TMS570 | CortexV1 |
QV1]
CTI.RESET
DRM.Base <address>
DRM.RESET
©1989-2014 Lauterbach GmbH
ARM Debugger
45
ARM specific SYStem Commands
DTM.RESET
DTM.Type [None | Generic]
DWT.Base <address>
DWT.RESET
EPM.Base <address>
EPM.RESET
ETB2AXI.Base <address>
ETB2AXI.RESET
ETB.ATBSource <source>
ETB.Base <address>
ETB.RESET
ETB.Size <size>
ETF.ATBSource <source>
ETF.Base <address>
ETF.RESET
ETM.Base <address>
ETM.RESET
ETR.ATBSource <source>
ETR.Base <address>
ETR.RESET
FUNNEL.ATBSource <sourcelist>
FUNNEL.Base <address>
FUNNEL.Name <string>
FUNNEL.RESET
HSM.Base <address>
HSM.RESET
HTM.Base <address>
HTM.RESET
ICE.Base <address>
ICE.RESET
ITM.Base <address>
ITM.RESET
OCP.Base <address>
OCP.RESET
OCP.TraceID <id>
OCP.Type <type>
PMI.Base <address>
PMI.RESET
PMI.TraceID <id>
RTP.Base <address>
RTP.PerBase <address>
RTP.RamBase <address>
RTP.RESET
SC.Base <address>
SC.RESET
SC.TraceID <id>
STM.Base <address>
STM.Mode [NONE | XTIv2 | SDTI | STP | STP64 | STPv2]
STM.RESET
STM.Type [None | Generic | ARM | SDTI | TI]
TPIU.ATBSource <source>
©1989-2014 Lauterbach GmbH
ARM Debugger
46
ARM specific SYStem Commands
TPIU.Base <address>
TPIU.RESET
<parameter>:
(Deprecated)
BMCBASE <address>
BYPASS <seq>
COREBASE <address>
CTIBASE <address>
CTICONFIG [NONE | ARMV1 | ARMPostInit | OMAP3 | TMS570 | CortexV1 |
QV1]
DEBUGBASE <address>
DTMCONFIG [ON | OFF]
DTMETBFUNNELPORT <port>
DTMFUNNEL2PORT <port>
DTMFUNNELPORT <port>
DTMTPIUFUNNELPORT <port>
DWTBASE <address>
ETB2AXIBASE <address>
ETBBASE <address>
ETBFUNNELBASE <address>
ETFBASE <address>
ETMBASE <address>
ETMETBFUNNELPORT <port>
ETMFUNNEL2PORT <port>
ETMFUNNELPORT <port>
ETMTPIUFUNNELPORT <port>
FILLDRZERO [ON | OFF]
FUNNEL2BASE <address>
FUNNELBASE <address>
HSMBASE <address>
HTMBASE <address>
HTMETBFUNNELPORT <port>
HTMFUNNEL2PORT <port>
HTMFUNNELPORT <port>
HTMTPIUFUNNELPORT <port>
ITMBASE <address>
ITMETBFUNNELPORT <port>
ITMFUNNEL2PORT <port>
ITMFUNNELPORT <port>
ITMTPIUFUNNELPORT <port>
PERBASE <address>
RAMBASE <address>
RTPBASE <address>
SDTIBASE <address>
STMBASE <address>
STMETBFUNNELPORT<port>
STMFUNNEL2PORT<port>
STMFUNNELPORT<port>
STMTPIUFUNNELPORT<port>
TIADTFBASE <address>
TIDRMBASE <address>
©1989-2014 Lauterbach GmbH
ARM Debugger
47
ARM specific SYStem Commands
TIEPMBASE <address>
TIICEBASE <address>
TIOCPBASE <address>
TIOCPTYPE <type>
TIPMIBASE <address>
TISCBASE <address>
TISTMBASE <address>
TPIUBASE <address>
TPIUFUNNELBASE <address>
TRACEETBFUNNELPORT <port>
TRACEFUNNELPORT<port>
TRACETPIUFUNNELPORT <port>
view
The SYStem.CONFIG commands inform the debugger about the available on-chip debug and trace
components and how to access them.
This is a common description of the SYStem.CONFIG command group for the ARM, CevaX, TI DSP and
Hexagon debugger. Each debugger will provide only a subset of these commands. Some commands need
a certain CPU type selection (SYStem.CPU <type>) to become active and it might additionally depend on
further settings.
Ideally you can select with SYStem.CPU the chip you are using which causes all setup you need and you do
not need any further SYStem.CONFIG command.
The SYStem.CONFIG command information shall be provided after the SYStem.CPU command which
might be a precondition to enter certain SYStem.CONFIG commands and before you start up the debug
session e.g. by SYStem.Up.
Syntax remarks:
The commands are not case sensitive. Capital letters show how the command can be shortened.
Example: “SYStem.CONFIG.DWT.Base 0x1000” -> “SYS.CONFIG.DWT.B 0x1000”
The dots after “SYStem.CONFIG” can alternatively be a blank.
Example: “SYStem.CONFIG.DWT.Base 0x1000” or “SYStem.CONFIG DWT Base 0x1000”.
<parameter> “General”
state
Opens a window showing most of the SYStem.CONFIG settings
and allows to modify them.
©1989-2014 Lauterbach GmbH
ARM Debugger
48
ARM specific SYStem Commands
<parameter> describing the “Debugport”
CJTAGFLAGS <flags>
Activates bug fixes for “cJTAG” implementations.
Bit 0: Disable scanning of cJTAG ID.
Bit 1: Target has no “keeper”.
Bit 2: Inverted meaning of SREDGE register.
Bit 3: Old command opcodes.
Bit 4: Unlock cJTAG via APFC register.
Default: 0
CJTAGTCA <value>
Selects the TCA (TAP Controller Address) to address a device in a
cJTAG Star-2 configuration. The Star-2 configuration requires a
unique TCA for each device on the debug port.
CONNECTOR
[MIPI34 | MIPI20T]
Specifies the connector “MIPI34” or “MIPI20T” on the target. This
is mainly needed in order to notify the trace pin location.
Default: MIPI34 if CombiProbe is used.
©1989-2014 Lauterbach GmbH
ARM Debugger
49
ARM specific SYStem Commands
CORE <core> <chip>
The command helps to identify debug and trace resources which
are commonly used by different cores. The command might be
required in a multicore environment if you use multiple debugger
instances (multiple TRACE32 GUIs) to simultaneously debug
different cores on the same target system.
Because of the default setting of this command
debugger#1: <core>=1 <chip>=1
debugger#2: <core>=1 <chip>=2
...
each debugger instance assumes that all notified debug and trace
resources can exclusively be used.
But some target systems have shared resources for different
cores. For example a common trace port. The default setting
causes that each debugger instance will control the (same) trace
port. Sometimes it does not hurt if such a module will be controlled
twice. So even then it might work. But the correct specification
which might be a must is to tell the debugger that these cores
sharing resources are on the same <chip>. Whereby the “chip”
does not need to be identical with the device on your target board:
debugger#1: <core>=1 <chip>=1
debugger#2: <core>=2 <chip>=1
For cores on the same <chip> the debugger assumes they share
the same resource if the control registers of the resource has the
same address.
Default:
<core> depends on CPU selection, usually 1.
<chip> derives from CORE= parameter in the configuration file
(config.t32), usually 1. If you start multiple debugger instances with
the help of t32start.exe you will get ascending values (1, 2, 3,...).
CoreNumber <number>
Number of cores considered in a SMP (symmetric
multiprocessing) debug session. There are core types like
ARM11MPCore, CortexA5MPCore, CortexA9MPCore and
Scorpion which can be used as a single core processor or as a
scalable multicore processor of the same type. If you intend to
debug more than one such core in a SMP debug session you need
to specify the number of cores you intend to debug.
Default: 1.
DEBUGPORT
[DebugCable0 | DebugCableA | DebugCableB]
It specifies which probe cable shall be used. At the moment only
the CombiProbe allows to connect more than one probe cable.
Default: depends on detection.
©1989-2014 Lauterbach GmbH
ARM Debugger
50
ARM specific SYStem Commands
DEBUGPORTTYPE
[JTAG | SWD | CJTAG |
CJTAGSWD]
It specifies the used debug port type “JTAG”, “SWD”, “CJTAG”,
“CJTAG-SWD”. It assumes the selected type is supported by the
target.
Default: JTAG.
What is NIDnT?
NIDnT is an acronym for “Narrow Interface for Debug and Test”.
NIDnT is a standard from the MIPI Alliance, which defines how to
reuse the pins of an existing interface (like for example a microSD
card interface) as a debug and test interface.
To support the NIDnT standard in different implementations,
TRACE32 has several special options:
NIDNTPSRISINGEDGE
[ON | OFF]
Send data on rising edge for NIDnT PS switching.
NIDnT specifies how to switch, for example, the microSD card
interface to a debug interface by sending in a special bit sequence
via two pins of the microSD card.
TRACE32 will send the bits of the sequence incident to the falling
edge of the clock, because TRACE32 expects that the target
samples the bits on the rising edge of the clock.
Some targets will sample the bits on the falling edge of the clock
instead. To support such targets, you can configure TRACE32 to
send bits on the rising edge of the clock by using
SYStem.CONFIG NIDNTPSRISINGEDGE ON
NOTE: Only enable this option right before you send the NIDnT
switching bit sequence.
Make sure to DISABLE this option, before you try to connect to the
target system with for example SYStem.Up.
NIDNTRSTPOLARITY
[High | Low]
Usually TRACE32 requires that the system reset line of a target
system is low active and has a pull-up on the target system.
When connecting via NIDnT to a target system, the reset line
might be a high-active signal.
To configure TRACE32 to use a high-active reset signal, use
SYStem.CONFIG NIDNTRSTPOLARITY High
This option must be used together with
SYStem.CONFIG NIDNTTRSTTORST ON
because you also have to use the TRST signal of an ARM debug
cable as reset signal for NIDnT in this case.
©1989-2014 Lauterbach GmbH
ARM Debugger
51
ARM specific SYStem Commands
NIDNTTRSTTORST
[ON | OFF]
Usually TRACE32 requires that the system reset line of a target
system is low active and has a pull-up on the target system.
This is how the system reset line is usually implemented on regular
ARM-based targets.
When connecting via NIDnT (e.g. a microSD card slot) to the
target system, the reset line might not include a pull-up on the
target system.
To circumvent problems, TRACE32 allows to drive the target reset
line via the TRST signal of an ARM debug cable.
Enable this option if you want to use the TRST signal of an ARM
debug cable as reset signal for a NIDnT.
Slave [ON | OFF]
If several debuggers share the same debug port, all except one
must have this option active.
JTAG: Only one debugger - the “master” - is allowed to control the
signals nTRST and nSRST (nRESET). The other debugger need
to have Slave=OFF.
Default: OFF; ON if CORE=... >1 in config file (e.g. config.t32).
SWDP [ON | OFF]
With this command you can change from the normal JTAG
interface to the serial wire debug mode. SWDP (Serial Wire Debug
Port) uses just two signals instead of five. It is required that the
target and the debugger hard- and software supports this
interface.
Default: OFF.
SWDPIdleHigh
[ON | OFF]
Keep SWDIO line high when idle. Only for Serialwire Debug mode.
Usually the debugger will pull the SWDIO data line low, when no
operation is in progress, so while the clock on the SWCLK line is
stopped (kept low).
You can configure the debugger to pull the SWDIO data line
high, when no operation is in progress by using
SYStem.CONFIG SWDPIDLEHIGH ON
Default: OFF.
©1989-2014 Lauterbach GmbH
ARM Debugger
52
ARM specific SYStem Commands
SWDPTargetSel <value>
Device address in case of a multidrop serial wire debug port.
Default: 0.
TriState [ON | OFF]
TriState has to be used if several debug cables are connected to a
common JTAG port. TAPState and TCKLevel define the TAP state
and TCK level which is selected when the debugger switches to
tristate mode. Please note: nTRST must have a pull-up resistor on the
target, TCK can have a pull-up or pull-down resistor, other trigger
inputs needs to be kept in inactive state.
Default: OFF.
©1989-2014 Lauterbach GmbH
ARM Debugger
53
ARM specific SYStem Commands
<parameter> describing the “JTAG” scan chain and signal behavior
With the JTAG interface you can access a Test Access Port controller (TAP) which has implemented a state
machine to provide a mechanism to read and write data to an Instruction Register (IR) and a Data Register
(DR) in the TAP. The JTAG interface will be controlled by 5 signals: nTRST(reset), TCK (clock), TMS (state
machine control), TDI (data input), TDO (data output). Multiple TAPs can be controlled by one JTAG
interface by daisy-chaining the TAPs (serial connection). If you want to talk to one TAP in the chain you need
to send a BYPASS pattern (all ones) to all other TAPs. For this case the debugger needs to know the
position of the TAP he wants to talk to which can be notified with the first four commands in the table below.
... DRPOST <bits>
Defines the TAP position in a JTAG scan chain. Number of TAPs
in the JTAG chain between the TDI signal and the TAP you are
describing. In BYPASS mode each TAP contributes one data
register bit. See possible TAP types and example below.
Default: 0.
... DRPRE <bits>
Defines the TAP position in a JTAG scan chain. Number of TAPs
in the JTAG chain between the TAP you are describing and the
TDO signal. In BYPASS mode each TAP contributes one data
register bit. See possible TAP types and example below.
Default: 0.
... IRPOST <bits>
Defines the TAP position in a JTAG scan chain. Number of
Instruction Register (IR) bits of all TAPs in the JTAG chain
between TDI signal and the TAP you are describing. See
possible TAP types and example below.
Default: 0.
... IRPRE <bits>
Defines the TAP position in a JTAG scan chain. Number of
Instruction Register (IR) bits of all TAPs in the JTAG chain
between the TAP you are describing and the TDO signal. See
possible TAP types and example below.
Default: 0.
CHIPDRLENGTH <bits>
Number of Data Register (DR) bits which needs to get a certain
BYPASS pattern.
CHIPDRPATTERN [Standard | Alternate <pattern>]
Data Register (DR) pattern which shall be used for BYPASS
instead of the standard (1...1) pattern.
CHIPIRLENGTH <bits>
Number of Instruction Register (IR) bits which needs to get a
certain BYPASS pattern.
CHIPIRPATTERN [Standard |
Alternate <pattern>]
Instruction Register (IR) pattern which shall be used for BYPASS
instead of the standard pattern.
©1989-2014 Lauterbach GmbH
ARM Debugger
54
ARM specific SYStem Commands
Slave [ON | OFF]
If several debugger share the same debug port, all except one
must have this option active.
JTAG: Only one debugger - the “master” - is allowed to control
the signals nTRST and nSRST (nRESET). The other debugger
need to have Slave=OFF.
Default: OFF; ON if CORE=... >1 in config file (e.g. config.t32).
For CortexM: Please check also
SYStem.Option DISableSOFTRES [ON | OFF]
TAPState <state>
This is the state of the TAP controller when the debugger
switches to tristate mode. All states of the JTAG TAP controller
are selectable.
0 Exit2-DR
1 Exit1-DR
2 Shift-DR
3 Pause-DR
4 Select-IR-Scan
5 Update-DR
6 Capture-DR
7 Select-DR-Scan
8 Exit2-IR
9 Exit1-IR
10 Shift-IR
11 Pause-IR
12 Run-Test/Idle
13 Update-IR
14 Capture-IR
15 Test-Logic-Reset
Default: 7 = Select-DR-Scan.
TCKLevel <level>
Level of TCK signal when all debuggers are tristated. Normally
defined by a pull-up or pull-down resistor on the target.
Default: 0.
TriState [ON | OFF]
TriState has to be used if several debug cables are connected to a
common JTAG port. TAPState and TCKLevel define the TAP state
and TCK level which is selected when the debugger switches to
tristate mode. Please note: nTRST must have a pull-up resistor on
the target, TCK can have a pull-up or pull-down resistor, other
trigger inputs needs to be kept in inactive state.
Default: OFF.
©1989-2014 Lauterbach GmbH
ARM Debugger
55
ARM specific SYStem Commands
TAP types:
Core TAP providing access to the debug register of the core you intend to debug.
-> DRPOST, DRPRE, IRPOST, IRPRE.
DAP (Debug Access Port) TAP providing access to the debug register of the core you intend to debug. It
might be needed additionally to a Core TAP if the DAP is only used to access memory and not to access the
core debug register.
-> DAPDRPOST, DAPDRPRE, DAPIRPOST, DAPIRPRE.
DAP2 (Debug Access Port) TAP in case you need to access a second DAP to reach other memory
locations.
-> DAP2DRPOST, DAP2DRPRE, DAP2IRPOST, DAP2IRPRE.
ETB (Embedded Trace Buffer) TAP if the ETB has an own TAP to access its control register (typical with
ARM11 cores).
-> ETBDRPOST, ETBDRPRE, ETBIRPOST, ETBIRPRE.
NEXT: If a memory access changes the JTAG chain and the core TAP position then you can specify the new
values with the NEXT... parameter. After the access for example the parameter NEXTIRPRE will replace the
IRPRE value and NEXTIRPRE becomes 0. Available only on ARM11 debugger.
-> NEXTDRPOST, NEXTDRPRE, NEXTIRPOST, NEXTIRPRE.
RTP (RAM Trace Port) TAP if the RTP has an own TAP to access its control register.
-> RTPDRPOST, RTPDRPRE, RTPIRPOST, RTPIRPRE.
CHIP: Definition of a TAP or TAP sequence in a scan chain that needs a different Instruction Register
(IR) and Data Register (DR) pattern than the default BYPASS (1...1) pattern.
-> CHIPDRPOST, CHIPDRPRE, CHIPIRPOST, CHIPIRPRE.
Example:
TDI
ARM11 TAP
ETB TAP
OfNoInterest TAP
DAP TAP
IR: 5bit
IR: 4bit
IR: 7bit
IR: 4bit
SYStem.CONFIG
SYStem.CONFIG
SYStem.CONFIG
SYStem.CONFIG
SYStem.CONFIG
SYStem.CONFIG
SYStem.CONFIG
SYStem.CONFIG
TDO
IRPRE 15.
DRPRE 3.
DAPIRPOST 16.
DAPDRPOST 3.
ETBIRPOST 5.
ETBDRPOST 1.
ETBIRPRE 11.
ETBDRPRE 2.
©1989-2014 Lauterbach GmbH
ARM Debugger
56
ARM specific SYStem Commands
©1989-2014 Lauterbach GmbH
ARM Debugger
57
ARM specific SYStem Commands
<parameter> describing a system level TAP “Multitap”
A “Multitap” is a system level or chip level test access port (TAP) in a JTAG scan chain. It can for example
provide functions to re-configure the JTAG chain or view and control power, clock, reset and security of
different chip components.
At the moment the debugger supports three types and its different versions:
Icepickx, STCLTAPx, MSMTAP:
Example:
JTAG
TDI
Multitap
“IcepickC”
ARM11
TAP
DAP
TAP
ETB
TAP
TDO
MULTITAP
DEBUGTAP
DAPTAP
ETBTAB
TMS
TCK
IcepickC
1
4
5
nTRST
CFGCONNECT <code>
The <code> is a hexadecimal number which defines the JTAG
scan chain configuration. You need the chip documentation to
figure out the suitable code. In most cases the chip specific
default value can be used for the debug session.
Used if MULTITAP=STCLTAPx.
DAPTAP <tap>
Specifies the TAP number which needs to be activated to get the
DAP TAP in the JTAG chain.
Used if MULTITAP=Icepickx.
DAP2TAP <tap>
Specifies the TAP number which needs to be activated to get a
2nd DAP TAP in the JTAG chain.
Used if MULTITAP=Icepickx.
©1989-2014 Lauterbach GmbH
ARM Debugger
58
ARM specific SYStem Commands
DEBUGTAP <tap>
Specifies the TAP number which needs to be activated to get the
core TAP in the JTAG chain. E.g. ARM11 TAP if you intend to
debug an ARM11.
Used if MULTITAP=Icepickx.
ETBTAP <tap>
Specifies the TAP number which needs to be activated to get the
ETB TAP in the JTAG chain.
Used if MULTITAP=Icepickx. ETB = Embedded Trace Buffer.
MULTITAP
[NONE | IcepickA | IcepickB
| IcepickC | IcepickD |
IcepickBB | IcepickBC |
IcepickCC | IcepickDD |
STCLTAP1 | STCLTAP2 |
STCLTAP3 | MSMTAP
<irlength> <irvalue>
<drlength> <drvalue>]
Selects the type and version of the MULTITAP.
NJCR <tap>
Number of a Non-JTAG Control Register (NJCR) which shall be
used by the debugger.
In case of MSMTAP you need to add parameters which specify
which IR pattern and DR pattern needed to be shifted by the
debugger to initialize the MSMTAP. Please note some of these
parameters need a decimal input (dot at the end).
IcepickXY means that there is an Icepick version “X” which
includes a subsystem with an Icepick of version “Y”.
Used if MULTITAP=Icepickx.
RTPTAP <tap>
Specifies the TAP number which needs to be activated to get the
RTP TAP in the JTAG chain.
Used if MULTITAP=Icepickx. RTP = RAM Trace Port.
SLAVETAP <tap>
Specifies the TAP number to get the Icepick of the sub-system in
the JTAG scan chain.
Used if MULTITAP=IcepickXY (two Icepicks).
©1989-2014 Lauterbach GmbH
ARM Debugger
59
ARM specific SYStem Commands
<parameter> configuring a CoreSight Debug Access Port “DAP”
A Debug Access Port (DAP) is a CoreSight module from ARM which provides access via its debugport
(JTAG, cJTAG, SWD) to:
1. Different memory busses (AHB, APB, AXI). This is especially important if the on-chip debug register
needs to be accessed this way. You can access the memory buses by using certain access classes with the
debugger commands: “AHB:”, “APB:”, “AXI:, “DAP”, “E:”. The interface to these buses is called Memory
Access Port (MEM-AP).
2. Other, chip-internal JTAG interfaces. This is especially important if the core you intend to debug is
connected to such an internal JTAG interface. The module controlling these JTAG interfaces is called JTAG
Access Port (JTAG-AP). Each JTAG-AP can control up to 8 internal JTAG interfaces. A port number between
0 and 7 denotes the JTAG interfaces to be addressed.
3. At emulation or simulation system with using bus transactors the access to the busses must be specified
by using the transactor identification name instead using the access port commands. For emulations/
simulations with a DAP transactor the individual bus transactor name don’t need to be configured. Instead of
this the DAP transactor name need to be passed and the regular access ports to the busses.
©1989-2014 Lauterbach GmbH
ARM Debugger
60
ARM specific SYStem Commands
Debug Access Port (DAP)
Debugger
0 Memory Access Port
(MEM-AP)
Debug Port
JTAG or
cJTAG or
SWD
System Memory
Debug Bus (APB)
Chip
System Bus (AHB)
Example:
Debug Register
Trace Register
1 Memory Access Port
(MEM-AP)
ROM Table
0 JTAG
2 JTAG Access Port
(JTAG-AP)
7 JTAG
AHBACCESSPORT 0
MEMORYACCESSPORT 0
APBACCESSPORT 1
DEBUGACCESSPORT 1
JTAGACCESSPORT 2
ARM9
COREJTAGPORT 7
AHBACCESSPORT <port>
DAP access port number (0-255) which shall be used for “AHB:”
access class. Default: <port>=0.
APBACCESSPORT <port>
DAP access port number (0-255) which shall be used for “APB:”
access class. Default: <port>=1.
AXIACCESSPORT <port>
DAP access port number (0-255) which shall be used for “AXI:”
access class. Default: port not available
COREJTAGPORT <port>
JTAG-AP port number (0-7) connected to the core which shall be
debugged.
©1989-2014 Lauterbach GmbH
ARM Debugger
61
ARM specific SYStem Commands
DAP2AHBACCESSPORT
<port>
DAP2 access port number (0-255) which shall be used for
“AHB2:” access class. Default: <port>=0.
DAP2APBACCESSPORT
<port>
DAP2 access port number (0-255) which shall be used for
“APB2:” access class. Default: <port>=1.
DAP2AXIACCESSPORT
<port>
DAP2 access port number (0-255) which shall be used for
“AXI2:” access class. Default: port not available
DAP2DEBUGACCESSPORT <port>
DAP2 access port number (0-255) where the debug register can
be found (typically on APB). Used for “DAP2:” access class.
Default: <port>=1.
DAP2COREJTAGPORT
<port>
JTAG-AP port number (0-7) connected to the core which shall be
debugged. The JTAG-AP can be found on an other DAP (DAP2).
DAP2JTAGPORT <port>
JTAG-AP port number (0-7) for an (other) DAP which is
connected to a JTAG-AP.
DAP2MEMORYACCESSPORT <port>
DAP2 access port number where system memory can be
accessed even during runtime (typically on AHB). Used for “E:”
access class while running, assuming “SYStem.MemoryAccess
DAP2”. Default: <port>=0.
DEBUGACCESSPORT
<port>
DAP access port number (0-255) where the debug register can
be found (typically on APB). Used for “DAP:” access class.
Default: <port>=1.
JTAGACCESSPORT <port>
DAP access port number (0-255) of the JTAG Access Port.
MEMORYACCESSPORT
<port>
DAP access port number where system memory can be
accessed even during runtime (typically on AHB). Used for “E:”
access class while running, assuming “SYStem.MemoryAccess
DAP”. Default: <port>=0.
AHBNAME <name>
AHB bus transactor name that shall be used for “AHB:” access
class.
APBNAME <name>
APB bus transactor name that shall be used for “APB:” access
class.
AXINAME <name>
AXI bus transactor name that shall be used for “AXI:” access
class.
DAP2AHBNAME <name>
AHB bus transactor name that shall be used for “AHB2:” access
class.
©1989-2014 Lauterbach GmbH
ARM Debugger
62
ARM specific SYStem Commands
DAP2APBNAME <name>
APB bus transactor name that shall be used for “APB2:” access
class.
DAP2AXINAME <name>
AXI bus transactor name that shall be used for “AXI2:” access
class.
DAP2DEBUGBUSNAME
<name>
APB bus transactor name identifying the bus where the debug
register can be found. Used for “DAP2:” access class.
DAP2MEMORYBUSNAME
<name>
AHB bus transactor name identifying the bus where system
memory can be accessed even during runtime. Used for “E:”
access class while running, assuming “SYStem.MemoryAccess
DAP2”.
DEBUGBUSNAME <name>
APB bus transactor name identifying the bus where the debug
register can be found. Used for “DAP:” access class.
MEMORYBUSNAME
<name>
AHB bus transactor name identifying the bus where system
memory can be accessed even during runtime. Used for “E:”
access class while running, assuming “SYStem.MemoryAccess
DAP”.
DAPNAME <name>
DAP transactor name that shall be used for DAP access ports.
DAP2NAME <name>
DAP transactor name that shall be used for DAP access ports of
2nd order.
©1989-2014 Lauterbach GmbH
ARM Debugger
63
ARM specific SYStem Commands
<parameter> describing debug and trace “Components”
In the “Components” folder in the “SYStem.CONFIG.state” window you can comfortably add the debug and
trace components your chip includes and which you intend to use with the debugger’s help.
Each configuration can be done by a command in a script file as well. Then you do not need to enter
everything again on the next debug session. If you press the button with the three dots you get the
corresponding command in the command line where you can view and maybe copy it into a script file.
©1989-2014 Lauterbach GmbH
ARM Debugger
64
ARM specific SYStem Commands
You can have several of the following components: CMI, ETB, ETF, ETR, FUNNEL, STM.
Example: FUNNEL1, FUNNEL2, FUNNEL3,...
The <address> parameter can be just an address (e.g. 0x80001000) or you can add the access class in
front (e.g. AHB:0x80001000). Without access class it gets the command specific default access class which
is “EDAP:” in most cases.
Example:
Core
ETM
Core
ETM
0
1
FUNNEL
0
FUNNEL
STM
TPIU
7
SYStem.CONFIG.COREDEBUG.Base 0x80010000 0x80012000
SYStem.CONFIG.BMC.Base 0x80011000 0x80013000
SYStem.CONFIG.ETM.Base 0x8001c000 0x8001d000
SYStem.CONFIG.STM1.Base EAHB:0x20008000
SYStem.CONFIG.STM1.Type ARM
SYStem.CONFIG.STM1.Mode STPv2
SYStem.CONFIG.FUNNEL1.Base 0x80004000
SYStem.CONFIG.FUNNEL2.Base 0x80005000
SYStem.CONFIG.TPIU.Base 0x80003000
SYStem.CONFIG.FUNNEL1.ATBSource ETM.0 0 ETM.1 1
SYStem.CONFIG.FUNNEL2.ATBSource FUNNEL1 0 STM1 7
SYStem.CONFIG.TPIU.ATBSource FUNNEL2
©1989-2014 Lauterbach GmbH
ARM Debugger
65
ARM specific SYStem Commands
... .ATBSource <source>
Specify for components collecting trace information from where the
trace data are coming from. This way you inform the debugger
about the interconnection of different trace components on a
common trace bus.
You need to specify the “... .Base <address>” or other attributes
that define the amount of existing peripheral modules before you
can describe the interconnection by “... .ATBSource <source>”.
A CoreSight trace FUNNEL has eight input ports (port 0-7) to
combine the data of various trace sources to a common trace
stream. Therefore you can enter instead of a single source a list
of sources and input port numbers.
Example:
SYStem.CONFIG FUNNEL.ATBSource ETM 0 HTM 1 STM 7
Meaning: The funnel gets trace data from ETM on port 0, from
HTM on port 1 and from STM on port 7.
In an SMP (Symmetric MultiProcessing) debug session where
you used a list of base addresses to specify one component per
core you need to indicate which component in the list is meant:
©1989-2014 Lauterbach GmbH
ARM Debugger
66
ARM specific SYStem Commands
Example: Four cores with ETM modules.
SYStem.CONFIG ETM.Base 0x1000 0x2000 0x3000 0x4000
SYStem.CONFIG FUNNEL1.ATBSource ETM.0 0 ETM.1 1
ETM.2 2 ETM.3 3
"...2" of "ETM.2" indicates it is the third ETM module which has
the base address 0x3000. The indices of a list are 0, 1, 2, 3,...
If the numbering is accelerating, starting from 0, without gaps,
like the example above then you can shorten it to
SYStem.CONFIG FUNNEL1.ATBSource ETM
Example: Four cores, each having an ETM module and an ETB
module.
SYStem.CONFIG ETM.Base 0x1000 0x2000 0x3000 0x4000
SYStem.CONFIG ETB.Base 0x5000 0x6000 0x7000 0x8000
SYStem.CONFIG ETB.ATBSource ETM.2 2
The third "ETM.2" module is connected to the third ETB. The last
"2" in the command above is the index for the ETB. It is not a port
number which exists only for FUNNELs.
For a list of possible components including a short description
see Components and available commands.
... .BASE <address>
This command informs the debugger about the start address of
the register block of the component. And this way it notifies the
existence of the component. An on-chip debug and trace
component typically provides a control register block which
needs to be accessed by the debugger to control this
component.
Example: SYStem.CONFIG ETMBASE APB:0x8011c000
Meaning: The control register block of the Embedded Trace
Macrocell (ETM) starts at address 0x8011c000 and is accessible
via APB bus.
In a SMP (Symmetric MultiProcessing) debug session you can
enter for the components BMC, COREBEBUG, CTI, ETB, ETF,
ETM, ETR a list of base addresses to specify one component per
core.
Example assuming four cores: SYStem.CONFIG
COREDEBUG.Base 0x80001000 0x80003000 0x80005000
0x80007000
For a list of possible components including a short description
see Components and available commands.
... .RESET
Undo the configuration for this component. This does not cause a
physical reset for the component on the chip.
For a list of possible components including a short description
see Components and available commands.
©1989-2014 Lauterbach GmbH
ARM Debugger
67
ARM specific SYStem Commands
... .TraceID <id>
Identifies from which component the trace packet is coming from.
Components which produce trace information (trace sources) for a
common trace stream have a selectable “.TraceID <id>”.
If you miss this SYStem.CONFIG command for a certain trace
source (e.g. ETM) then there is a dedicated command group for
this component where you can select the ID (ETM.TraceID <id>).
The default setting is typically fine because the debugger uses
different default TraceIDs for different components.
For a list of possible components including a short description
see Components and available commands.
CTI.Config <type>
Informs about the interconnection of the core Cross Trigger
Interfaces (CTI). Certain ways of interconnection are common
and these are supported by the debugger e.g. to cause a
synchronous halt of multiple cores.
NONE: The CTI is not used by the debugger.
ARMV1: This mode is used for ARM7/9/11 cores which support
synchronous halt, only.
ARMPostInit: Like ARMV1 but the CTI connection differs from the
ARM recommendation.
OMAP3: This mode is not yet used.
TMS570: Used for a certain CTI connection used on a TMS570
derivative.
CortexV1: The CTI will be configured for synchronous start and
stop via CTI. It assumes the connection of DBGRQ, DBGACK,
DBGRESTART signals to CTI are done as recommended by
ARM. The CTIBASE must be notified. “CortexV1” is the default
value if a Cortex-R/-A core is selected and the CTIBASE is
notified.
QV1: This mode is not yet used.
DTM.Type [None | Generic]
Informs the debugger that a customer proprietary Data Trace
Message (DTM) module is available. This causes the debugger
to consider this source when capturing common trace data.
Trace data from this module will be recorded and can be
accessed later but the unknown DTM module itself will not be
controlled by the debugger.
ETB.Size <size>
Specifies the size of the Embedded Trace Buffer. The ETB size
can normally be read out by the debugger. Therefore this
command is only needed if this can not be done for any reason.
FUNNEL.Name <string>
It is possible that different funnels have the same address for
their control register block. This assumes they are on different
buses and for different cores. In this case it is needed to give the
funnel different names to differentiate them.
©1989-2014 Lauterbach GmbH
ARM Debugger
68
ARM specific SYStem Commands
OCP.Type <type>
Specifies the type of the OCP module. The <type> is just a
number which you need to figure out in the chip documentation.
RTP.PerBase <address>
PERBASE specifies the base address of the core peripheral
registers which accesses shall be traced. PERBASE is needed
for the RAM Trace Port (RTP) which is available on some
derivatives from Texas Instruments. The trace packages include
only relative addresses to PERBASE and RAMBASE.
RTP.RamBase <address>
RAMBASE is the start address of RAM which accesses shall be
traced. RAMBASE is needed for the RAM Trace Port (RTP)
which is available on some derivatives from Texas Instruments.
The trace packages include only relative addresses to PERBASE
and RAMBASE.
STM.Mode [NONE | XTIv2 |
SDTI | STP | STP64 | STPv2]
Selects the protocol type used by the System Trace Module (STM).
STM.Type [None | Generic |
ARM | SDTI | TI]
Selects the type of the System Trace Module (STM). Some types
allow to work with different protocols (see STM.Mode).
Components and available commands
See the description of the commands above. Please note that there is a common description for
... .ATBSource, ... .Base, , ... .RESET, ... .TraceID.
ADTF.Base <address>
ADTF.RESET
AMBA trace bus DSP Trace Formatter (ADTF) - Texas Instruments
Module of a TMS320C5x or TMS320C6x core converting program and data trace information in ARM
CoreSight compliant format.
AET.Base <address>
AET.RESET
Advanced Event Triggering unit (AET) - Texas Instruments
Trace source module of a TMS320C5x or TMS320C6x core delivering program and data trace information.
BMC.Base <address>
BMC.RESET
Performance Monitor Unit (PMU) - ARM debug module, e.g. on Cortex-A/R
Bench-Mark-Counter (BMC) is the TRACE32 term for the same thing.
The module contains counter which can be programmed to count certain events (e.g. cache hits).
CMI.Base <address>
CMI.RESET
CMI.TraceID <id>
Clock Management Instrumentation (CMI) - Texas Instruments
Trace source delivering information about clock status and events to a system trace module.
©1989-2014 Lauterbach GmbH
ARM Debugger
69
ARM specific SYStem Commands
COREDEBUG.Base <address>
COREDEBUG.RESET
Core Debug Register - ARM debug register, e.g. on Cortex-A/R
Some cores do not have a fix location for their debug register used to control the core. In this case it is
essential to specify its location before you can connect by e.g. SYStem.Up.
CTI.Base <address>
CTI.Config [NONE | ARMV1 | ARMPostInit | OMAP3 | TMS570 | CortexV1 | QV1]
CTI.RESET
Cross Trigger Interface (CTI) - ARM CoreSight module
If notified the debugger uses it to synchronously halt (and sometimes also to start) multiple cores.
DRM.Base <address>
DRM.RESET
Debug Resource Manager (DRM) - Texas Instruments
It will be used to prepare chip pins for trace output.
DTM.RESET
DTM.Type [None | Generic]
Data Trace Module (DTM) - generic, CoreSight compliant trace source module
If specified it will be considered in trace recording and trace data can be accessed afterwards.
DTM module itself will not be controlled by the debugger.
DWT.Base <address>
DWT.RESET
Data Watchpoint and Trace unit (DWT) - ARM debug module on Cortex-M cores
Normally fix address at 0xE0001000 (default).
EPM.Base <address>
EPM.RESET
Emulation Pin Manager (EPM) - Texas Instruments
It will be used to prepare chip pins for trace output.
ETB2AXI.Base <address>
ETB2AXI.RESET
ETB to AXI module
Similar to an ETR.
ETB.ATBSource <source>
ETB.Base <address>
ETB.RESET
ETB.Size <size>
Embedded Trace Buffer (ETB) - ARM CoreSight module
Enables trace to be stored in a dedicated SRAM. The trace data will be read out through the debug port after
the capturing has finished.
ETF.ATBSource <source>
ETF.Base <address>
ETF.RESET
Embedded Trace FIFO (ETF) - ARM CoreSight module
On-chip trace buffer used to lower the trace bandwidth peaks.
©1989-2014 Lauterbach GmbH
ARM Debugger
70
ARM specific SYStem Commands
ETM.Base <address>
ETM.RESET
Embedded Trace Macrocell (ETM) - ARM CoreSight module
Program Trace Macrocell (PTM) - ARM CoreSight module
Trace source providing information about program flow and data accesses of a core.
The ETM commands will be used even for PTM.
ETR.ATBSource <source>
ETR.Base <address>
ETR.RESET
Embedded Trace Router (ETR) - ARM CoreSight module
Enables trace to be routed over an AXI bus to system memory or to any other AXI slave.
FUNNEL.ATBSource <sourcelist>
FUNNEL.Base <address>
FUNNEL.Name <string>
FUNNEL.RESET
CoreSight Trace Funnel (CSTF) - ARM CoreSight module
Combines multiple trace sources onto a single trace bus (ATB = AMBA Trace Bus)
HSM.Base <address>
HSM.RESET
Hardware Security Module (HSM) - Infineon
HTM.Base <address>
HTM.RESET
AMBA AHB Trace Macrocell (HTM) - ARM CoreSight module
Trace source delivering trace data of access to an AHB bus.
ICE.Base <address>
ICE.RESET
ICE-Crusher (ICE) - Texas Instruments
ITM.Base <address>
ITM.RESET
Instrumentation Trace Macrocell (ITM) - ARM CoreSight module
Trace source delivering system trace information e.g. sent by software in printf() style.
OCP.Base <address>
OCP.RESET
OCP.TraceID <id>
OCP.Type <type>
Open Core Protocol watchpoint unit (OCP) - Texas Instruments
Trace source module delivering bus trace information to a system trace module.
PMI.Base <address>
PMI.RESET
PMI.TraceID <id>
Power Management Instrumentation (PMI) - Texas Instruments
Trace source reporting power management events to a system trace module.
©1989-2014 Lauterbach GmbH
ARM Debugger
71
ARM specific SYStem Commands
RTP.Base <address>
RTP.PerBase <address>
RTP.RamBase <address>
RTP.RESET
RAM Trace Port (RTP) - Texas Instruments
Trace source delivering trace data about memory interface usage.
SC.Base <address>
SC.RESET
SC.TraceID <id>
Statistic Collector (SC) - Texas Instruments
Trace source delivering statistic data about bus traffic to a system trace module.
STM.Base <address>
STM.Mode [NONE | XTIv2 | SDTI | STP | STP64 | STPv2]
STM.RESET
STM.Type [None | Generic | ARM | SDTI | TI]
System Trace Macrocell (STM) - MIPI, ARM CoreSight, others
Trace source delivering system trace information e.g. sent by software in printf() style.
TPIU.ATBSource <source>
TPIU.Base <address>
TPIU.RESET
Trace Port Interface Unit (TPIU) - ARM CoreSight module
Trace sink sending the trace off-chip on a parallel trace port (chip pins).
©1989-2014 Lauterbach GmbH
ARM Debugger
72
ARM specific SYStem Commands
<parameter> which are “Deprecated”
In the last years the chips and its debug and trace architecture became much more complex. Especially the
CoreSight trace components and their interconnection on a common trace bus required a reform of our
commands. The new commands can deal even with complex structures.
... BASE <address>
This command informs the debugger about the start address of
the register block of the component. And this way it notifies the
existence of the component. An on-chip debug and trace
component typically provides a control register block which
needs to be accessed by the debugger to control this
component.
Example: SYStem.CONFIG ETMBASE APB:0x8011c000
Meaning: The control register block of the Embedded Trace
Macrocell (ETM) starts at address 0x8011c000 and is accessible
via APB bus.
In a SMP (Symmetric MultiProcessing) debug session you can
enter for the components BMC, CORE, CTI, ETB, ETF, ETM, ETR a
list of base addresses to specify one component per core.
Example assuming four cores: “SYStem.CONFIG COREBASE
0x80001000 0x80003000 0x80005000 0x80007000”.
COREBASE (old syntax: DEBUGBASE): Some cores e.g. CortexA or Cortex-R do not have a fix location for their debug register
which are used for example to halt and start the core. In this case it
is essential to specify its location before you can connect by e.g.
SYStem.UP.
PERBASE and RAMBASE are needed for the RAM Trace Port
(RTP) which is available on some derivatives from Texas
Instruments. PERBASE specifies the base address of the core
peripheral registers which accesses shall be traced, RAMBASE
is the start address of RAM which accesses shall be traced. The
trace packages include only relative addresses to PERBASE and
RAMBASE.
For a list of possible components including a short description
see Components and available commands.
©1989-2014 Lauterbach GmbH
ARM Debugger
73
ARM specific SYStem Commands
... PORT <port>
Informs the debugger about which trace source is connected to
which input port of which funnel. A CoreSight trace funnel
provides 8 input ports (port 0-7) to combine the data of various
trace sources to a common trace stream.
Example: SYStem.CONFIG STMFUNNEL2PORT 3
Meaning: The System Trace Module (STM) is connected to input
port #3 on FUNNEL2.
On a SMP debug session some of these commands can have a
list of <port> parameter.
In case there are dedicated funnels for the ETB and the TPIU
their base addresses are specified by ETBFUNNELBASE,
TPIUFUNNELBASE respectively. And the funnel port number for
the ETM are declared by ETMETBFUNNELPORT,
ETMTPIUFUNNELPORT respectively.
TRACE... stands for the ADTF trace source module.
For a list of possible components including a short description
see Components and available commands.
BYPASS <seq>
With this option it is possible to change the JTAG bypass
instruction pattern for other TAPs. It works in a multi-TAP JTAG
chain for the IRPOST pattern, only, and is limited to 64 bit. The
specified pattern (hexadecimal) will be shifted least significant bit
first. If no BYPASS option is used, the default value is “1” for all
bits.
CTICONFIG <type>
Informs about the interconnection of the core Cross Trigger
Interfaces (CTI). Certain ways of interconnection are common
and these are supported by the debugger e.g. to cause a
synchronous halt of multiple cores.
NONE: The CTI is not used by the debugger.
ARMV1: This mode is used for ARM7/9/11 cores which support
synchronous halt, only.
ARMPostInit: Like ARMV1 but the CTI connection differs from the
ARM recommendation.
OMAP3: This mode is not yet used.
TMS570: Used for a certain CTI connection used on a TMS570
derivative.
CortexV1: The CTI will be configured for synchronous start and
stop via CTI. It assumes the connection of DBGRQ, DBGACK,
DBGRESTART signals to CTI are done as recommended by
ARM. The CTIBASE must be notified. “CortexV1” is the default
value if a Cortex-R/-A core is selected and the CTIBASE is
notified.
QV1: This mode is not yet used.
©1989-2014 Lauterbach GmbH
ARM Debugger
74
ARM specific SYStem Commands
DTMCONFIG [ON | OFF]
Informs the debugger that a customer proprietary Data Trace
Message (DTM) module is available. This causes the debugger
to consider this source when capturing common trace data.
Trace data from this module will be recorded and can be
accessed later but the unknown DTM module itself will not be
controlled by the debugger.
FILLDRZERO [ON | OFF]
This changes the bypass data pattern for other TAPs in a multiTAP JTAG chain. It changes the pattern from all “1” to all “0”. This
is a work around for a certain chip problem. It is available on the
ARM9 debugger, only.
TIOCPTYPE <type>
Specifies the type of the OCP module from Texas Instruments
(TI).
view
Opens a window showing most of the SYStem.CONFIG settings
and allows to modify them.
Deprecated versa new command
In the following you find the list of deprecated commands which can still be used for compatibility reasons
and the corresponding new command.
SYStem.CONFIG <parameter>
<parameter>:
(Deprecated)
<parameter>:
(New)
BMCBASE <address>
BMC.Base <address>
BYPASS <seq>
CHIPIRPRE <bits>
CHIPIRLENGTH <bits>
CHIPIRPATTERN.Alternate <pattern>
COREBASE <address>
COREDEBUG.Base <address>
CTIBASE <address>
CTI.Base <address>
CTICONFIG <type>
CTI.Config <type>
DEBUGBASE <address>
COREDEBUG.Base <address>
DTMCONFIG [ON | OFF]
DTM.Type.Generic
DTMETBFUNNELPORT <port>
FUNNEL4.ATBSource DTM <port> (1)
DTMFUNNEL2PORT <port>
FUNNEL2.ATBSource DTM <port> (1)
DTMFUNNELPORT <port>
FUNNEL1.ATBSource DTM <port> (1)
DTMTPIUFUNNELPORT <port>
FUNNEL3.ATBSource DTM <port> (1)
DWTBASE <address>
DWT.Base <address>
ETB2AXIBASE <address>
ETB2AXI.Base <address>
©1989-2014 Lauterbach GmbH
ARM Debugger
75
ARM specific SYStem Commands
ETBBASE <address>
ETB1.Base <address>
ETBFUNNELBASE <address>
FUNNEL4.Base <address>
ETFBASE <address>
ETF1.Base <address>
ETMBASE <address>
ETM.Base <address>
ETMETBFUNNELPORT <port>
FUNNEL4.ATBSource ETM <port> (1)
ETMFUNNEL2PORT <port>
FUNNEL2.ATBSource ETM <port> (1)
ETMFUNNELPORT <port>
FUNNEL1.ATBSource ETM <port> (1)
ETMTPIUFUNNELPORT <port>
FUNNEL3.ATBSource ETM <port> (1)
FILLDRZERO [ON | OFF]
CHIPDRPRE 0
CHIPDRPOST 0
CHIPDRLENGTH <bits_of_complete_DR_path>
CHIPDRPATTERN.Alternate 0
FUNNEL2BASE <address>
FUNNEL2.Base <address>
FUNNELBASE <address>
FUNNEL1.Base <address>
HSMBASE <address>
HSM.Base <address>
HTMBASE <address>
HTM.Base <address>
HTMETBFUNNELPORT <port>
FUNNEL4.ATBSource HTM <port> (1)
HTMFUNNEL2PORT <port>
FUNNEL2.ATBSource HTM <port> (1)
HTMFUNNELPORT <port>
FUNNEL1.ATBSource HTM <port> (1)
HTMTPIUFUNNELPORT <port>
FUNNEL3.ATBSource HTM <port> (1)
ITMBASE <address>
ITM.Base <address>
ITMETBFUNNELPORT <port>
FUNNEL4.ATBSource ITM <port> (1)
ITMFUNNEL2PORT <port>
FUNNEL2.ATBSource ITM <port> (1)
ITMFUNNELPORT <port>
FUNNEL1.ATBSource ITM <port> (1)
ITMTPIUFUNNELPORT <port>
FUNNEL3.ATBSource ITM <port> (1)
PERBASE <address>
RTP.PerBase <address>
RAMBASE <address>
RTP.RamBase <address>
RTPBASE <address>
RTP.Base <address>
SDTIBASE <address>
STM1.Base <address>
STM1.Mode SDTI
STM1.Type SDTI
STMBASE <address>
STM1.Base <address>
STM1.Mode STPV2
STM1.Type ARM
STMETBFUNNELPORT <port>
FUNNEL4.ATBSource STM1 <port> (1)
STMFUNNEL2PORT <port>
FUNNEL2.ATBSource STM1 <port> (1)
STMFUNNELPORT <port>
FUNNEL1.ATBSource STM1 <port> (1)
STMTPIUFUNNELPORT <port>
FUNNEL3.ATBSource STM1 <port> (1)
©1989-2014 Lauterbach GmbH
ARM Debugger
76
ARM specific SYStem Commands
TIADTFBASE <address>
ADTF.Base <address>
TIDRMBASE <address>
DRM.Base <address>
TIEPMBASE <address>
EPM.Base <address>
TIICEBASE <address>
ICE.Base <address>
TIOCPBASE <address>
OCP.Base <address>
TIOCPTYPE <type>
OCP.Type <type>
TIPMIBASE <address>
PMI.Base <address>
TISCBASE <address>
SC.Base <address>
TISTMBASE <address>
STM1.Base <address>
STM1.Mode STP
STM1.Type TI
TPIUBASE <address>
TPIU.Base <address>
TPIUFUNNELBASE <address>
FUNNEL3.Base <address>
TRACEETBFUNNELPORT <port>
FUNNEL4.ATBSource ADTF <port> (1)
TRACEFUNNELPORT <port>
FUNNEL1.ATBSource ADTF <port> (1)
TRACETPIUFUNNELPORT <port>
FUNNEL3.ATBSource ADTF <port> (1)
view
state
(1) Further “<component>.ATBSource <source>” commands might be needed to describe the full trace data
path from trace source to trace sink.
SYStem.CPU
Select the used CPU
Format:
SYStem.CPU <cpu>
<cpu>:
ARM7TDMI | ARM740TD | … (JTAG Debugger ARM7)
ARM9TDMI | ARM920T | ARM940T |… (JTAG Debugger ARM9)
JANUS2 (JTAG Debugger Janus)
ARM1020E | ARM1022E | ARM1026EJ |…(JTAG Debugger ARM10)
ARM1136J | ARM1136JF |… (JTAG Debugger ARM11)
CORTEXA8 | SCORPION |…(JTAG Debugger Cortex-A)
CORTEXM3 |…(JTAG Debugger Cortex-M)
Selects the processor type. If your ASIC is not listed, select the type of the integrated ARM core.
©1989-2014 Lauterbach GmbH
ARM Debugger
77
ARM specific SYStem Commands
Default selection:
•
ARM7TDMI if the JTAG Debugger for ARM7 is used.
•
ARM9TDMI if the JTAG Debugger for ARM9 is used.
•
JANUS2 if the JTAG Debugger for JANUS is used.
•
ARM1020E if the JTAG Debugger for ARM10 is used.
•
ARM1136J if the JTAG Debugger for ARM11 is used.
•
CORTEXA8 if the JTAG Debugger for Cortex-A is used.
•
CORTEXM3 if the JTAG Debugger for Cortex-M is used.
SYStem.CpuAccess
Format:
Run-time memory access (intrusive)
SYStem.CpuAccess Enable | Denied | Nonstop
Default: Denied. For the ARM7 and the ARM9 on-chip breakpoints can always be set while program
execution is running.
Enable
Allow intrusive run-time memory access.
Denied
Lock intrusive run-time memory access.
Nonstop
Lock all features of the debugger that affect the run-time behavior.
If SYStem.CpuAccess Enable is set, it is possible to read from memory, to write to memory and to set
software breakpoints while the CPU is executing the program. To make this possible, the program execution
is shortly stopped by the debugger. Each stop takes 0.1-100 ms depending on the speed of the JTAG port
and the operations that should be performed. A red S in the state line of the TRACE32 screen warns you,
that the program is no longer running in realtime.
If specific windows, that display memory or variables should be updated while the program is running select
the memory class E: or the format option %E.
Data.dump E:0x100
Var.View %E first
©1989-2014 Lauterbach GmbH
ARM Debugger
78
ARM specific SYStem Commands
SYStem.JtagClock
Define JTAG frequency
Format:
SYStem.JtagClock [<frequency> | RTCK | ARTCK <frequency> | CTCK <frequency> | CRTCK <frequency>]
<frequency>
4 kHz…100 MHz
1250000. | 2500000. | 5000000. | 10000000. (on obsolete ICD hardware)
Default frequency: 10 MHz.
Selects the JTAG port frequency (TCK) used by the debugger to communicate with the processor. This
influences e.g. the download speed. It could be required to reduce the JTAG frequency if there are buffers,
additional loads or high capacities on the JTAG lines or if VTREF is very low. A very high frequency will not
work on all systems and will result in an erroneous data transfer. Therefore we recommend to use the default
setting if possible.
<frequency>:
The debugger can not select all frequencies accurately. It chooses the next possible frequency and displays
the real value in the “System Settings” window.
Besides a decimal number like “100000.” also short forms like “10kHz” or “15MHz” can be used. The short
forms implies a decimal value, although no “.” is used.
RTCK: The JTAG clock is controlled by the RTCK signal (Returned TCK).
On some processor derivatives (e.g. ARMxxxE-S) there is the need to synchronize the processor clock and
the JTAG clock. In this case RTCK shall be selected. Synchronization is maintained, because the debugger
does not progress to the next TCK edge until after an RTCK edge is received.
In case you have a processor derivative requiring a synchronization of the processor clock and the JTAG
clock, but your target does not provide a RTCK signal, you need to select a fix JTAG clock below 1/6 of the
processor clock (ARM7, ARM9), below 1/8 of the processor clock (ARM11), respectively.
When RTCK is selected, the frequency depends on the processor clock and on the propagation delays. The
maximum reachable frequency is about 16 MHz.
Example: SYStem.JtagClock RTCK
The clock mode RTCK can not be used if a DEBUG INTERFACE (LA-7701) or
a debug cable with 14-pin flat cable (LA-7740) is used. And it is required that
the target provides a RTCK signal.
©1989-2014 Lauterbach GmbH
ARM Debugger
79
ARM specific SYStem Commands
ARTCK: Accelerated method to control the JTAG clock by the RTCK signal (Accelerated Returned TCK).
RTCK mode allows theoretical frequencies up to 1/6 (ARM7, ARM9) or 1/8 (ARM11) of the processor clock.
For designs using a very low processor clock we offer a different mode (ARTCK) which does not work as
recommended by ARM and might not work on all target systems. In ARTCK mode the debugger uses a
fixed JTAG frequency for TCK, independent of the RTCK signal. This frequency must be specified by the
user and has to be below 1/3 of the processor clock speed. TDI and TMS will be delayed by 1/2 TCK clock
cycle. TDO will be sampled with RTCK
The mode ARTCK can not be used if a DEBUG INTERFACE (LA-7701) or a
debug cable with 14-pin flat cable (LA-7740) is used. And it is required that the
target provides a RTCK signal.
CTCK: With this option higher JTAG speeds can be reached. The TDO signal will be sampled by a signal
which derives from TCK, but which is timely compensated regarding the debugger internal driver
propagation delays (Compensation by TCK). This feature can be used with a debug cable versions 3b or
newer. If it is selected, although the debug cable is not suitable, a fix JTAG clock will be selected instead
(minimum of 10 MHz and selected clock).
The mode CTCK can not be used if a DEBUG INTERFACE (LA-7701) is used.
This feature can be used with a debug cable versions 3 or newer.
CRTCK: With this option higher JTAG speeds can be reached. The TDO signal will be sampled by the
RTCK signal. This compensates the debugger internal driver propagation delays, the delays on the cable
and on the target (Compensation by RTCK). This feature requires that the target provides a RTCK signal.
Other as on RTCK option, the TCK is always output with the selected, fix frequency.
The mode CRTCK can not be used if a DEBUG INTERFACE (LA-7701) or a
debug cable with 14-pin flat cable (LA-7740) is used. And it is required that the
target provides a RTCK signal.
©1989-2014 Lauterbach GmbH
ARM Debugger
80
ARM specific SYStem Commands
SYStem.LOCK
Format:
Tristate the JTAG port
SYStem.LOCK [ON | OFF]
Default: OFF.
If the system is locked no access to the JTAG port will be performed by the debugger. While locked the JTAG
connector of the debugger is tristated. The intention of the lock command is for example to give JTAG
access to another tool. The process can also be automated, see SYStem.CONFIG TriState.
It must be ensured that the state of the ARM core JTAG state machine remains unchanged while the system
is locked. To ensure correct hand over the options SYStem.CONFIG TAPState and SYStem.CONFIG
TCKLevel must be set properly. They define the TAP state and TCK level which is selected when the
debugger switches to tristate mode. Please note: nTRST must have a pull-up resistor on the target,
EDBGRQ must have a pull-down resistor.
©1989-2014 Lauterbach GmbH
ARM Debugger
81
ARM specific SYStem Commands
SYStem.MemAccess
Run-time memory access
Format:
SYStem.MemAccess <mode>
<mode>:
Cerberus
CPU
DAP
NEXUS
TSMON3
TSMON
PTMON3
PTMON
QMON
UDMON3
UDMON
RealMON
TrkMON
GdbMON
Denied
Default: Denied.
If SYStem.MemAccess is not Denied, it is possible to read from memory, to write to memory and to set
software breakpoints while the CPU is executing the program. This requires one of the following monitors.
Cerberus
The memory access is done through an Infineon proprietary Cerberus module.
This memory access is only available and selectable on a few Infineon
processors and only by script or in the command line.
CPU
A run-time memory access is made without CPU intervention while the program
is running. This is only possible on the instruction set simulator.
DAP
A run-time memory access is done via a Memory Access Port (MEM-AP) of the
Debug Access Port (DAP). This is only possible if a DAP is available on the chip
and if the memory bus is connected to it (Cortex, CoreSight). The debugger uses
the AXI MEM-AP specified by SYStem.CONFIG AXIACCESSPORT if available,
the MEM-AP (typically AHB) specified by SYStem.CONFIG
MEMORYACCESSPORT otherwise.
NEXUS
The memory access is done through the Nexus interface which is only available on
MAC7xxx processors.
©1989-2014 Lauterbach GmbH
ARM Debugger
82
ARM specific SYStem Commands
TSMON3
TSMON
TSMON uses a data format which shall not be used anymore. It still works for
compatibility reasons. TSMON3 shall be used.
A run-time memory access is done via a Time Sharing Monitor.
The application is responsible for calling the monitor code periodically. The call
is typically included in a periodic interrupt or in the idle task of the kernel. See
the example in the directory demo/arm/etc/runtime_memory_access.
$%
&'
( )
*
! "#
Besides runtime memory access TSMON3 would allow run mode debugging.
But manual break is not possible with TSMON3 and could only be emulated by
polling the DCC port. Therefore better use UDMON3 (or RealMON, TrkMON,
GdbMON) for this purpose.
©1989-2014 Lauterbach GmbH
ARM Debugger
83
ARM specific SYStem Commands
PTMON3
PTMON
PTMON uses a data format which shall not be used anymore. It still works for
compatibility reasons. PTMON3 shall be used.
A run-time memory access is done via a Pulse Triggered Monitor.
Whenever the debugger wants to perform a memory access while the program
is running, the debugger generates a trigger for the trigger bus. If the trigger bus
is configured appropriate (TrBus), this trigger is output via the TRIGGER
connector of the TRACE32 development tool. The TRIGGER output can be
connected to an external interrupt in order to call a monitor. See the example in
the directory demo/arm/etc/runtime_memory_access.
#$%
&'
( )
*
!" Besides runtime memory access PTMON3 would allow run mode debugging.
But manual break is not possible with PTMON3 and could only be emulated by
polling the DCC port. Therefore better use UDMON3 (or RealMON, TrkMON,
GdbMON) for this purpose.
QMON
Select QNX monitor (pdebug) for Run Mode Debugging of embedded QNX.
Ethernet is used as communication interface. For more information, ”RTOS
Debugger for QNX - Run Mode” (rtos_qnx_run.pdf).
©1989-2014 Lauterbach GmbH
ARM Debugger
84
ARM specific SYStem Commands
UDMON3
UDMON
UDMON uses a data format which shall not be used anymore. It still works for
compatibility reasons. UDMON3 shall be used.
A run-time memory access is done via a Usermode Debug Monitor.
The application is responsible for calling the monitor code periodically. The call
is typically included in a periodic interrupt or in the idle task of the kernel. For
runtime memory access UDMON3 behaves exactly as TSMON3. See the
example in the directory demo/arm/etc/runtime_memory_access and see the
picture at TSMON3.
Besides runtime memory access UDMON3 allows run mode debugging.
Handling of interrupts when the application is stopped is possible when the
background monitor is activated. On-chip breakpoints and manual program
break are only possible when the application runs in user (USR) mode. See
also the example in the directory demo/arm/etc/background_monitor.
RealMON
A run-time memory access is done via the Real Monitor from ARM.
TrkMON
Select TRK for Run Mode Debugging of Symbian OS. DCC is used as
communication interface.
GdbMON
Select T32server (extended gdbserver) for Run Mode Debugging of embedded
Linux. DCC is used as communication interface. For more information refer to
”RTOS Debugger for Linux - Run Mode” (rtos_linux_run.pdf).
Denied
No memory access is possible while the CPU is executing the program.
If specific windows, that display memory or variables should be updated while the program is running select
the memory class E: or the format option %E.
Data.dump E:0x100
Var.View %E first
©1989-2014 Lauterbach GmbH
ARM Debugger
85
ARM specific SYStem Commands
SYStem.Mode
Establish the communication with the target
Format:
SYStem.Mode <mode>
<mode>:
Down
NoDebug
Go
Attach
StandBy
Up
Prepare
Down
Disables the debugger (default). The state of the CPU remains unchanged. The
JTAG port is tristated.
NoDebug
Disables the debugger. The state of the CPU remains unchanged. The JTAG
port is tristated.
Go
Resets the target and enables the debugger and start the program execution.
Program execution can be stopped by the break command or external trigger.
Attach
User program remains running (no reset) and the debug mode is activated.
After this command the user program can be stopped with the break command
or if any break condition occurs.
StandBy
You need to be in DOWN state when switching to this mode. It resets and starts
the program when power is detected. Halt the program execution and set all the
breakpoints and trace conditions you need, then re-start the program. Now you
can even debug a power cycle, because debug register (breakpoints and trace
control) will be restored on power up. This mode is available on ARM7, ARM9
and ARM11 family. On Cortex cores only part of the debug registers will be
restored.
Up
Resets the target, sets the CPU to debug mode and stops the CPU. After the
execution of this command the CPU is stopped and all register are set to the
default level.
Prepare
Resets the target, initializes the JTAG interface, but does not connect to the
ARM core. This debugger startup is used if no ARM core shall be debugged. It
can be used if a user program or proprietary debugger uses the TRACE32 API
(application programming interface) to access the JTAG interface via the
TRACE32 debugger hardware.
©1989-2014 Lauterbach GmbH
ARM Debugger
86
ARM specific SYStem Commands
Example of a CoreSight based System
The pictures give an idea which MultiCore option informs about which part of the system.
©1989-2014 Lauterbach GmbH
ARM Debugger
87
ARM specific SYStem Commands
SYStem.Option ABORTFIX
Format:
Do not access 0x0-0x1f
SYStem.Option ABORTFIX [ON | OFF]
Default: OFF.
Work around for a special customer configuration. It suppresses all debugger accesses to memory area
0x0-0x1f. This feature is only available on ARM7 family.
SYStem.Option AHBHPROT
Format:
Select AHB-AP HPROT bits
SYStem.Option AHBHPROT <value>
Default: 0
This option selects the value used for the HPROT bits in the Control Status Word (CSW) of an AHB Access
Port of a DAP, when using the AHB: memory class.
SYStem.Option AMBA
Format:
Select AMBA bus mode
SYStem.Option AMBA [ON | OFF]
This option is only necessary if a ARM7 Bus Trace is used.
Default: OFF.
This option should be set according to the bus mode of the ASIC.
©1989-2014 Lauterbach GmbH
ARM Debugger
88
ARM specific SYStem Commands
SYStem.Option ASYNCBREAKFIX
Format:
Asynchronous break bugfix
SYStem.Option ASYNCBREAKFIX [ON | OFF]
This option is required for Cortex-A9, Cortex-A9MPCore r0p0, r0p1, r1p0, r1p1.
Default: OFF.
CPSR.T and CPSR.J bits can be corrupted on an asynchronous break. The fix causes the debugger to
replace the asynchronous break by a synchronous break via breakpoint register. Breaks via external
DBGRQ signal e.g. from CTI still fail and may not be used.
SYStem.Option AXIACEEnable
Format:
ACE enable flag of the AXI-AP
SYStem.Option AXIACEEnable [ON | OFF]
Default: OFF
Enable ACE transactions on the DAP AXI-AP, including barriers.
SYStem.Option AXICACHEFLAGS
Format:
Select AXI-AP CACHE bits
SYStem.Option AXICACHEFLAGS <value>
Default: 0
This option selects the value used for the CACHE bits in the Control Status Word (CSW) of an AXI Access
Port of a DAP, when using the AXI: memory class.
SYStem.Option AXIHPROT
Format:
Select AXI-AP HPROT bits
SYStem.Option AXIHPROT <value>
Default: 0
©1989-2014 Lauterbach GmbH
ARM Debugger
89
ARM specific SYStem Commands
This option selects the value used for the HPROT bits in the Control Status Word (CSW) of an AXI Access
Port of a DAP, when using the AXI: memory class.
SYStem.Option BUGFIX
Format:
Breakpoint bug fix
SYStem.Option BUGFIX [ON | OFF]
Default: OFF.
Breakpoint bug fix required on ARM7TDMI-S Rev2:
You need to activate this option when having an ARM7TDMI-S Rev2. The bug is fixed on Rev3 and
following. With this option activated and ARM7TDMIS selected as CPU type, we enable the software
breakpoint work around as described in the ARM errata of ARM7TDMI-S Rev2 (“consecutive breakpoint”
bug). Software breakpoints are set as undefined opcodes that cause the core to enter the undefined opcode
handler. The debugger tries to set a breakpoint at the undef vector (either software or on-chip). When a
breakpoint is reached the core will take the undefined exception and stop at the vector. The debugger
detects this state and displays the correct registers and cpu state. This work around is only suitable where
undefined instruction trap handling is not being used.
Breakpoint bug fix required on ARM946E-S Rev0, Rev1 and ARM966E-S Rev0, Rev1:
(This is a different bug fix as for the ARM7.) This option will automatically be activated by the TRACE32
software, since the core revision will be read out. On the above revisions the breakpoint code normally used
for software breakpoints behave wrong. Having this option active an undefined opcode is used together with
an on-chip comparator instead of the breakpoint code.
This option is available on ARM7 and on ARM9, but it has a different meaning.
SYStem.Option BUGFIXV4
Format:
Asynch. break bug fix for ARM7TDMI-S REV4
SYStem.Option BUGFIXV4 [ON | OFF]
Default: OFF.
This option is available on ARM7. You need to activate this option when having an ARM7TDMI-S Rev4.
With this option activated, we replace an asynchronous break, e.g. caused by the “break” command, by a
break caused by an on-chip breakpoint range. If the bugfix is not activated when using an ARM7TDMI-S
Rev4, the application might be restarted at a wrong address.
©1989-2014 Lauterbach GmbH
ARM Debugger
90
ARM specific SYStem Commands
There is no known work around to secure correct behavior of the external DBGRQ input and a program halt
caused by an ETM trigger condition. Therefore do not use these features on an ARM7TDMI-S Rev4.
SYStem.Option BigEndian
Format:
Define byte order (endianess)
SYStem.Option BigEndian [ON | OFF]
Default: OFF.
This option selects the byte ordering mechanism. For correct operation the following three settings must
correspond:
•
this option
•
the compiler setting (-li or -bi compiler option)
•
the level of the ARM BIGEND input pin (on ARM7x0T and ARM9x0T and JANUS2 the bit in the
CP15 control register)
The endianess is auto-detected for the ARM10 and ARM11.
SYStem.Option BOOTMODE
Format:
Define boot mode
SYStem.Option BOOTMODE <mode>
Default: 0.
This option selects a boot mode for the chip.
The command is only available on a few chips providing this feature.
©1989-2014 Lauterbach GmbH
ARM Debugger
91
ARM specific SYStem Commands
SYStem.Option CINV
Format:
Invalidate the cache after memory modification
SYStem.Option CINV [ON | OFF]
Default: OFF.
If this option is ON the cache is invalidated after memory modifications even when memory is modified by
the EPROM Simulator (ESI). This is necessary to maintain software breakpoint consistency.
SYStem.Option CFLUSH
Format:
FLUSH the cache before step/go
SYStem.Option CFLUSH [ON | OFF]
Default: ON.
If this option is ON the cache is invalidated automatically before each step or go command. This is
necessary to maintain software breakpoint consistency.
SYStem.Option CacheParam
Format:
Define external cache
SYStem.Option CacheParam <range> <size>
Define the <address_range> and the <size> of an external cache.
This option is only available for the ARM7.
©1989-2014 Lauterbach GmbH
ARM Debugger
92
ARM specific SYStem Commands
SYStem.Option DACR
Format:
Debugger ignores DACR access permission settings
SYStem.Option DACR [ON | OFF]
Default: OFF.
Derivatives having a Domain Access Control Registers (DACR) do not allow the debugger to access
memory if the location does not have the appropriate access permission. If this option is activated, the
debugger temporarily modifies the access permission to get access to any memory location.
SYStem.Option DAPNOIRCHECK
Format:
No DAP instruction register check
SYStem.Option DAPNOIRCHECK [ON | OFF]
Default: OFF.
Bug fix for derivatives which do not return the correct pattern on a DAP (ARM CoreSight Debug Access Port)
instruction register (IR) scan. When activated the returned pattern will not be checked by the debugger.
SYStem.Option DAPREMAP
Format:
Rearrange DAP memory map
SYStem.Option DAPREMAP <address_range> <address> ...
The Debug Access Port (DAP) can be used for memory access during runtime. If the mapping on the DAP is
different than the processor view this re-mapping command can be used. Up to 16 <address_range>/
<address> pairs are possible.
SYStem.Option DBGACK
Format:
DBGACK active on debugger memory accesses
SYStem.Option DBGACK [ON | OFF]
Default: ON.
If this option is on the DBGACK signal remains active during memory accesses in debug mode. If the
DBGACK signal is used to freeze timers or to disable other peripherals it is strictly recommended to enable
this option.
©1989-2014 Lauterbach GmbH
ARM Debugger
93
ARM specific SYStem Commands
Disabling of this option may be useful for triggering on memory accesses from debug mode (only useful for
hardware developers).
This option is not available on the ARM10.
SYStem.Option DBGNOPWRDWNDSCR bit 9 will be set when in debug mode
Format:
SYStem.Option DBGNOPWRDWN [ON | OFF]
Default: OFF.
If this option is on DSCR[9] will be set while the core is in debug mode and cleared while the user application
is running. SYStem.Option PWRDWN will be ignored.
This option is normally not useful. It was implemented for a special customer design.
This option is available on the ARM11.
SYStem.Option DBGUNLOCK
Format:
Unlock debug register via OSLAR
SYStem.Option DBGUNLOCK [ON | OFF]
Default: ON.
This option allows the debugger to unlock the debug register by writing to the Operating System Lock
Access Register (OSLAR) when a debug session will be started. If it is switched off the operating system is
expected to unlock the register access, otherwise debugging is not possible.
This option is only available on the Cortex-R and Cortex-A.
SYStem.Option DCDIRTY
Format:
Bugfix for erroneously cleared dirty bits
SYStem.Option DCDIRTY [ON | OFF]
Default: OFF.
©1989-2014 Lauterbach GmbH
ARM Debugger
94
ARM specific SYStem Commands
This is a work around for a chip bug which erroneously clears the dirty bits of a data cache line if there is any
write-through forced by the debugger in this line. When the option is active the debugger does not use writethrough mode in general. It only forces write through on a program memory write.
This option is only available on the ARM1176, Cortex-R, Cortex-A.
SYStem.Option DCFREEZE
Format:
Disable data cache linefill in debug mode
SYStem.Option DCFREEZE [ON | OFF]
Default: ON.
This option disables the data cache linefill while the processor is in debug mode. This avoids that the data
cache contents is altered on memory read accesses performed by the debugger. This is especially required
if you want to inspect the data cache contents. You can disable this option if you want to cause a burst
memory access (e.g. on a data.test command) which only occurs on a cache linefill.
This option is available on ARM11, only.
SYStem.Option DIAG
Format:
Activate more data.log messages
SYStem.Option DIAG [ON | OFF]
Adds more information to the report in the Data.LOG window.
©1989-2014 Lauterbach GmbH
ARM Debugger
95
ARM specific SYStem Commands
SYStem.Option DisMode
Define disassembler mode
Format:
SYStem.Option DisMode <option>
<option>:
AUTO
ACCESS
ARM
THUMB
THUMBEE
Default: AUTO.
This command specifies the selected disassembler.
AUTO
The information provided by the compiler output file is used for the
disassembler selection. If no information is available it has the same behavior
as the option ACCESS.
ACCESS
The selected disassembler depends on the T bit in the CPSR or on the selected
access class. (e.g. Data.List SR:0 for ARM mode or Data.List ST:0 for
THUMB mode).
ARM
Only the ARM disassembler is used (highest priority).
THUMB
Only the THUMB disassembler is used (highest priority).
THUMBEE
Only the THUMB disassembler is used which supports the Thumb-2 Execution
Environment extension (highest priority).
©1989-2014 Lauterbach GmbH
ARM Debugger
96
ARM specific SYStem Commands
SYStem.Option DynVector
Format:
Dynamic trap vector interpretation
SYStem.Option DynVector [ON | OFF]
This option is only available on XScale.
Default: OFF.
If this option is ON and a trap occurs the trap vector is read from memory and the trap vector is executed out
of the memory.
The vector tables have be overloaded by the debugger to place the debug vector instead of the reset vector.
If the application changes the vector during runtime the overloaded vector table in the mini instruction cache
of the debugger remains active and a trap will jump to unintended position. With system option DynVector
trap vector contents are read at runtime and the memory is executed. Executing an application with system
option DynVector ON has disadvantage on runtime, so that it makes sense to switch off the option after the
table has changed and afterwards remains unchanged. We have implemented this by an explicit option to be
non intrusive on normal operation.
SYStem.Option EnReset
Format:
Allow the debugger to drive nRESET/nSRST
SYStem.Option EnReset [ON | OFF]
Default: ON.
If this option is disabled the debugger will never drive the nRESET (ARM7) /nSRST (ARM9, ARM10,
ARM11) line on the JTAG connector. This is necessary if nRESET / nSRST is no open collector or tristate
signal.
From the view of the ARM core it is not necessary that nRESET / nSRST becomes active at the start of a
debug session (SYStem.Up), but there may be other logic on the target which requires a reset.
SYStem.Option ETBFIXMarvell
Format:
Read out on-chip trace data
SYStem.Option ETBFIXMarvell [ON | OFF]
Default: OFF
Bugfix for 88FR111 from Marvell. At least the first core revisions have an issue with the ETB read/write
pointer. ON activates a different method to read out the on-chip trace data.
©1989-2014 Lauterbach GmbH
ARM Debugger
97
ARM specific SYStem Commands
SYStem.Option ETMFIX
Format:
Shift data of ETM scan chain by one
SYStem.Option ETMFIX [ON | OFF]
Default: OFF.
Bug fix for ETM7 implementations showing a wrong shift behavior. The ETM register data will be shifted by
one bit otherwise. This feature is only available on the ARM7 family.
SYStem.Option ETMFIXWO
Format:
Bugfix for write-only ETM register
SYStem.Option ETMFIXWO [ON | OFF]
Default: OFF.
Bug fix for a customer device where ETM registers can not be read. This fix is only useful on this certain
device.
SYStem.Option ETMFIX4
Format:
Use only every fourth ETM data package
SYStem.Option ETMFIX4 [ON | OFF]
Default: OFF.
Bug fix for a customer device where each ETM data package was sent out four times.
SYStem.Option EXEC
Format:
EXEC signal can be used by bustrace
SYStem.Option EXEC [ON | OFF]
Default: OFF.
Defines whether the EXEC line is available to the bustrace or not. The EXEC signal indicates if a fetched
command has been executed. The bustrace can work without EXEC signal, but it is not possible to show the
condition code pass/fail for conditional instructions. The option has no effect when no bustrace is available.
This command has no meaning for the ETM trace.
©1989-2014 Lauterbach GmbH
ARM Debugger
98
ARM specific SYStem Commands
SYStem.Option EXTBYPASS
Format:
Switch off the fake TAP mechanism
SYStem.Option EXTBYPASS [ON | OFF]
Default: ON.
Bugfix for DB8500 V1. It allows you to switch off the fake TAP mechanism of the modem.
SYStem.Option FASTBREAKDETECTION Faster detection if core has halted
Format:
SYStem.Option FASTBREAKDETECTION [ON | OFF]
Default: OFF.
It advises the debugger to do a permanent polling via JTAG to check if the core has halted. This allows a
faster detection and generation of trigger signal for other tools like PowerIntegrator, especially if the
hardware signal DBGACK is not available on the JTAG connector. It causes a high payload on the JTAG
interface which will be a disadvantage e.g. if other debuggers use the same JTAG interface (multicore
debugging).
This option is available on ARM9, only.
SYStem.Option ICEBreakerETMFIXMarvell
Format:
Lock on-chip breakpoints
SYStem.Option ICEBreakerETMFIXMarvell [ON | OFF]
Default: OFF.
Bugfix for 88FR111 from Marvell. ON locks the usage of read-only/write-only on-chip breakpoints. They do
not work on the 88FR111, at least not on the first core revisions.
©1989-2014 Lauterbach GmbH
ARM Debugger
99
ARM specific SYStem Commands
SYStem.Option ICEPICKONLY
Format:
Only ICEPick registers accessible
SYStem.Option ICEPICKONLY [ON | OFF]
Default: OFF.
Obsolete command. Used in TRACE32 versions from September 2004 until May 2005, has no effect
anymore. This option caused the debugger to switch into a mode where certain debug register, which are
only available on certain processor derivatives, had been accessible even when the processor was powered
down. Newer TRACE32 versions allow the access at every time.
This option is available on ARM7 and on ARM11.
SYStem.Option IMASKASM
Format:
Disable interrupts while single stepping
SYStem.Option IMASKASM [ON | OFF]
Default: OFF.
If enabled, the interrupt mask bits of the CPU will be set during assembler single-step operations. The
interrupt routine is not executed during single-step operations. After single step the interrupt mask bits are
restored to the value before the step.
SYStem.Option IMASKHLL
Format:
Disable interrupts while HLL single stepping
SYStem.Option IMASKHLL [ON | OFF]
Default: OFF.
If enabled, the interrupt mask bits of the cpu will be set during HLL single-step operations. The interrupt
routine is not executed during single-step operations. After single step the interrupt mask bits are restored to
the value before the step.
©1989-2014 Lauterbach GmbH
ARM Debugger
100
ARM specific SYStem Commands
SYStem.Option INTDIS
Format:
Disable all interrupts
SYStem.Option INTDIS [ON | OFF]
Default: OFF.
If this option is ON all interrupts to the ARM core are disabled.
This option is not available on the ARM10.
SYStem.Option IRQBREAKFIX
Format:
Break bugfix by using IRQ
SYStem.Option IRQBREAKFIX <address>
The bug shows up on Cortex-A9, Cortex-A9MPCore r0p0, r0p1, r1p0, r1p1.
Default: 0 = OFF.
CPSR.T and CPSR.J bits can be corrupted on an asynchronous break. The bug fix is intended for a SMP
multicore debug session where hardware based synchronous break is required. Instead causing an
asynchronous break via CTI an IRQ is requested via CTI. There needs to be a breakpoint at the end of the
IRQ routine handling this case. The fix causes the debugger to replace the program counter value by the
IRQ link register R14_irq - 4 and the CPSR register by SPSR_irq if the core halts at <address>. Everything
else like initializing the IRQ and CTI needs to be done by a user script.
SYStem.Option IntelSOC
Format:
Debugging of an Intel SOC
SYStem.Option IntelSOC [ON | OFF]
Need to be enabled for some SOCs from Intel.
SYStem.Option KEYCODE
Format:
Define key code to unsecure processor
SYStem.Option KEYCODE <key>
Default: 0, means no key required.
©1989-2014 Lauterbach GmbH
ARM Debugger
101
ARM specific SYStem Commands
Some processors have a security feature and require a key to unsecure the processor in order to allow
debugging. The processor will use the specified key on the next debugger start-up (e.g. SYStem.Up) and
forgets it immediately. For the next start-up the keycode must be specified again.
This option is available on ARM9.
SYStem.Option L2Cache
Format:
L2 cache used
SYStem.Option L2Cache [ON | OFF]
Default: OFF, means no L2 cache is used.
On certain Marvell derivatives the debugger can not detect if an (optional) level 2 cache is available and
used. The information is needed to activate L2 cache coherency operations.
This option is available on ARM9, Cortex-A.
SYStem.Option L2CacheBase
Format:
Define base address of L2 cache register
SYStem.Option L2CacheBase <base address>
Default: 0, means no L2 cache implemented.
In case the L2 cache from ARM (L210 or L220) is available and active on the chip, then the debugger needs
to flush and invalidate the L2 cache when patching the program e.g. when setting a software breakpoint.
Therefore it needs to know the (physical) base address of the L2 register block.
This option is available on ARM9, ARM11, Cortex-R, Cortex-A.
SYStem.Option LOCKRES
Format:
Go to "Test-Logic Reset" when locked
SYStem.Option LOCKRES [ON | OFF]
This command is only available on obsolete ICD hardware. The state machine of the JTAG TAP controller is
switched to Test-Logic Reset state (ON) or to Run-Test/Idle state (OFF) before a SYStem.LOCK ON is
executed.
©1989-2014 Lauterbach GmbH
ARM Debugger
102
ARM specific SYStem Commands
SYStem.Option MEMORYHPROT
Format:
Select memory-AP HPROT bits
SYStem.Option MEMORYHPROT <value>
Default: 0
This option selects the value used for the HPROT bits in the Control Status Word (CSW) of an Memory
Access Port of a DAP, when using the E: memory class.
SYStem.Option MMUSPACES
Format:
Enable multiple address spaces support
SYStem.Option MMUSPACES [ON | OFF]
SYStem.Option MMU [ON | OFF] (deprecated)
Default: OFF.
Enables the usage of the MMU to support multiple address spaces. The command should not be used if
only one translation table is used. Enabling the option will extend the address scheme of the debugger by a
16 bit memory space identifier. You should activate the option first, and then load the symbols.
SYStem.Option MonitorHoldoffTime
Format:
Delay between monitor accesses
SYStem.Option MonitorHoldoffTime <time>
Default: 0.
It specifies the minimum delay between two access to the target debug client in case of run-mode
debugging.
SYStem.Option MPU
Format:
Debugger ignores MPU access permission settings
SYStem.Option MPU [ON | OFF]
Default: OFF.
©1989-2014 Lauterbach GmbH
ARM Debugger
103
ARM specific SYStem Commands
Derivatives having a memory protection unit do not allow the debugger to access memory if the location
does not have the appropriate access permission. If this option is activated, the debugger temporarily
modifies the access permission to get access to the memory location.
SYStem.Option MultiplesFIX
Format:
No multiple loads/stores
SYStem.Option MultiplesFIX [ON | OFF]
Default: OFF.
Bug fix for derivatives (e.g. ARM946 V1.1) which do not handle multiple loads (LDM) and multiple store
(STM) commands properly in debug mode. When activated only single loads/stores are used by the
debugger.
SYStem.Option NODATA
Format:
No data connected to the trace
SYStem.Option NODATA [ON | OFF]
This option is only necessary if a Bus Trace is used.
Default: OFF.
It should be ON, if a trace is connected and data information can not be recorded. Otherwise undefined data
will be displayed in the trace records.
©1989-2014 Lauterbach GmbH
ARM Debugger
104
ARM specific SYStem Commands
SYStem.Option NOIRCHECK
Format:
No JTAG instruction register check
SYStem.Option NOIRCHECK [ON | OFF]
Default: OFF.
Bug fix for derivatives which do not return the correct pattern on a JTAG instruction register (IR) scan. When
activated the returned pattern will not be checked by the debugger. On ARM7 also the check of the return
pattern on a scan chain selection is disabled.
This option is only available on ARM7 and ARM9.
The option is automatically activated when using SYStem.Option TURBO.
SYStem.Option NoPRCRReset
Format:
Do not cause reset by PRCR
SYStem.Option NoPRCRReset [ON | OFF]
Default: OFF.
It causes the debugger not to (additionally) use the soft reset via DBGPRCR register on functions like
SYStem.Up, SYStem.Mode Go, SYStem.RESetOut.
SYStem.Option NoRunCheck
Format:
No check of the running state
SYStem.Option NoRunCheck [ON | OFF]
Default: OFF.
This option advises the debugger not to do any running check. In this case the debugger does not even
recognize that there will be no response from the processor. Therefore there is always the message
“running” independent if the core is in power down or not. This can be used to overcome power saving
modes in case the user knows when this happens and that he can manually de-activate and re-activate the
running check.
©1989-2014 Lauterbach GmbH
ARM Debugger
105
ARM specific SYStem Commands
SYStem.Option NoSecureFix
Format:
Do not switch to secure mode
SYStem.Option NoSecureFix [ON | OFF]
Default: OFF.
This is a bugfix for customer specific devices which do not allow the debugger to temporarily switch to
secure mode while the application is in non-secure mode.
SYStem.Option OVERLAY
Format:
Enable overlay support
SYStem.Option OVERLAY [ON | OFF | WithOVS]
Default: OFF.
ON: Activates the overlay extension and extends the address scheme of the debugger with a 16 bit virtual
OverlayID. Addresses therefore have the format <OverlayID>:<address>. This enables the
debugger to handle overlayed program memory.
OFF: Disables support for code overlays.
WithOVS: Like option ON, but also enables support for software breakpoints. This means that TRACE32
writes software breakpoint opcodes both to the execution area (for active overlays) and to the storage area.
In this way, it is possible to set breakpoints into inactive overlays. Upon activation of the overlay, the target's
runtime mechanisms copies the breakpoint opcodes to execution area. For using this option, the storage
area must be readable and writable for the debugger.
SYStem.Option OVERLAY ON
Data.List 0x2:0x11c4
; Data.List <OverlayID>:<address>
SYStem.Option PALLADIUM
Format:
Extend debugger timeout
SYStem.Option PALLADIUM [ON | OFF]
Default: OFF
©1989-2014 Lauterbach GmbH
ARM Debugger
106
ARM specific SYStem Commands
The debugger uses longer timeouts as might be needed when used on a chip emulation system like the
Palladium from Cadence.
SYStem.Option PC
Format:
Define address for dummy fetches
SYStem.Option PC <addr>
Default address: 0
After each load or store operation from debug mode the ARM core makes some instruction fetches from
memory. These fetches are not necessary for the debugger, but it is not possible to suppress them.
This option allows to specify the base address of these fetches. The fetch address is anywhere within a
64 KByte block that begins at the specified base address. It is necessary to modify this option if these
fetches go to aborted memory locations.
This option is not available/required on the ARM10 and ARM11. There are no dummy-fetches on ARM10
and ARM11.
SYStem.Option PROTECTION
Format:
Sends an unsecure sequence to the core
SYStem.Option PROTECTION <filename>
This option was made for certain ARM9 derivatives having a protected access to the debug features. It
sends the key pattern in the file in a certain way to the core in order to gain the right to debug the core.
This option is available on ARM9.
SYStem.Option PWRCHECK
Format:
Check power and clock
SYStem.Option PWRCHECK [ON | OFF]
Default: ON.
In case of a chip level TAP (SYStem.CONFIG MULTITAP) this option decides if power, clock and secure
state will be checked or not.
This option is only available on ARM11, Cortex-R, Cortex-A.
©1989-2014 Lauterbach GmbH
ARM Debugger
107
ARM specific SYStem Commands
SYStem.Option PWRCHECKFIX
Format:
Check power and clock
SYStem.Option PWRCHECKFIX [ON | OFF]
Default: OFF.
Fix for a certain chip bug: It uses the OSLK bit instead of the SPD bit of the PRSR register to detect power
down.
This option is only available on Cortex-R, Cortex-A.
SYStem.Option PWRDWN
Format:
Allow power-down mode
SYStem.Option PWRDWN [ON | OFF]
Default: OFF.
ARM11: If this option is OFF, the debugger sets the external signal DBGNOPWRDWN high in order to force
the system power controller in emulate mode. Otherwise the communication to the debugger gets lost when
entering power down state.
Some OMAPxxxx derivatives: If this option is OFF, the debugger forces the OMAP to keep clock and keep
power.
Cortex-R, Cortex-A: Controls the PWRDWN bit in device power-down and reset control register (PRCR).
This option is only available on ARM11, Cortex-R, Cortex-A.
SYStem.Option PWRDWNRecover
Format:
Mode to handle special power recovery
SYStem.Option PWRDWNRecover [ON | OFF]
Default: OFF.
Assumes SYStem.JtagClock RTCK is selected.
When the target core is running and RTCK stops working for longer than specified by SYStem.Option
PWRDWNRecoverTimeout it is assumed power is gone. In this case “running (power down)” will be shown.
On power recovery the target logic ensures the core immediately enters debug mode by asserting DBGRQ
signal. The debugger detects the recovery, restores all debug register and restarts the program execution.
©1989-2014 Lauterbach GmbH
ARM Debugger
108
ARM specific SYStem Commands
This option is only available on ARM9.
SYStem.Option PWRDWNRecoverTimeOut
Format:
Timeout for power recovery
SYStem.Option PWRDWNRecoverTimeOut <time>
Specifies a timeout period as a limit to decide if just a sleep mode was entered (stopped RTCK) or a real
power down happened which requires the debug registers to be restored on a power recovery. See
command SYStem.Option PWRDWNRecover.
This option is only available on ARM9.
SYStem.Option PWROVR
Format:
Specifies power override bit
SYStem.Option PWROVR [ON | OFF]
Specifies the power override bit when a certain derivative providing this function is selected.
This option is only available on certain ARM9 and ARM11 derivatives.
SYStem.Option ResBreak
Format:
Halt the core after reset
SYStem.Option ResBreak [ON | OFF]
Default: ON.
This option has to be disabled if the nTRST line is connected to the nRESET / nSRST line on the target. In
this case the CPU executes some cycles while the SYStem.Up command is executed. The reason for this
behavior is the fact that it is necessary to halt the core (enter debug mode) by a JTAG sequence. This
©1989-2014 Lauterbach GmbH
ARM Debugger
109
ARM specific SYStem Commands
sequence is only possible while nTRST is inactive. In the following figure the marked time between the
deassertion of reset and the entry into debug mode is the time of this JTAG sequence plus a time delay
selectable by SYStem.Option WaitReset (default = 3 msec).
nSRST
nTRST
CPU State
reset
running
debug
If nTRST is available and not connected to nRESET/nSRST it is possible to force the CPU directly after
reset (without cycles) into debug mode. This is also possible by pulling nTRST fixed to VCC (inactive), but
then there is the problem that it is normally not ensured that the JTAG port is reset in normal operation. If the
ResBreak option is enabled the debugger first deasserts nTRST, then it executes a JTAG sequence to set
the DBGRQ bit in the ICE breaker control register and then it deasserts nRESET/nSRST.
nSRST
nTRST
reset
CPU State
SYStem.Option ResetDetection
debug
Choose method to detect a target reset
Format:
SYStem.Option ResetDetection <method>
<method>:
nSRST | None
Default: nSRST
Selects the method how an external target reset can be detected by the debugger.
nSRST
Detects a reset if nSRST (nRESET) line on the debug connector is pulled
low.
None
Detection of external resets is disabled.
©1989-2014 Lauterbach GmbH
ARM Debugger
110
ARM specific SYStem Commands
SYStem.Option RESTARTFIX
Format:
Wait after core restart
SYStem.Option RESTARTFIX [ON | OFF]
Default: OFF.
Bug fix for a certain customer derivative. When activated the debugger keeps the JTAG state machine on
every restart for 10 µs in Run-Test/Idle state before the JTAG communication will be continued. This option is
available on ARM7 and will be ignored on other debuggers.
SYStem.Option RisingTDO
Format:
Target outputs TDO on rising edge
SYStem.Option RisingTDO [ON | OFF]
Default: OFF.
Bug fix for chips which output the TDO on the rising edge instead of on the falling.
SYStem.Option ShowError
Format:
Show data abort errors
SYStem.Option ShowError [ON | OFF]
Default: ON.
If the ABORT (if AMBA: BERROR) line becomes active during a system speed access the ARM core can
change to ABORT mode. When this option is on this change of mode is indicated by the warning 'emulator
berr error'.
This option is not available on the ARM10 and ARM11 (always shown).
©1989-2014 Lauterbach GmbH
ARM Debugger
111
ARM specific SYStem Commands
SYStem.Option SOFTLONG
Format:
Use 32-bit access to set breakpoint
SYStem.Option SOFTLONG [ON | OFF]
Default: OFF.
This option instructs the debugger to use 32-bit accesses to patch the software breakpoint code.
SYStem.Option SOFTQUAD
Format:
Use 64-bit access to set breakpoint
SYStem.Option SOFTQUAD [ON | OFF]
Default: OFF.
Activate this option if software breakpoints should be written by 64-bit accesses. This was implemented in
order not to corrupt ECC.
SYStem.Option SOFTWORD
Format:
Use 16-bit access to set breakpoint
SYStem.Option SOFTWORD [ON | OFF]
Default: OFF.
This option instructs the debugger to use 16-bit accesses to patch the software breakpoint code.
SYStem.Option SPLIT
Format:
Access memory depending on CPSR
SYStem.Option SPLIT [ON | OFF]
Default: OFF.
If this option is ON, the debugger does privileged or non-privileged memory access depending on the
current CPU mode (CPSR register). If this option is OFF the debugger accesses the memory in privileged
mode except an other access mode is requested. This feature is only available if a DEBUG INTERFACE
(LA-7701) is used for the ARM7.
©1989-2014 Lauterbach GmbH
ARM Debugger
112
ARM specific SYStem Commands
SYStem.Option StandByTraceDelaytime Delay for activating trace after reset
Format:
SYStem.Option StandByTraceDelaytime <delay_in_us>
Default: 0.
Only when standby mode is active you can specify a time delay where the debugger waits after reset is
deasserted before it activates the trace. This option is available on ARM9 only.
SYStem.Option STEPSOFT
Format:
Use software breakpoints for ASM stepping
SYStem.Option STEPSOFT [ON | OFF]
Default: OFF.
If this option is ON software breakpoints are used for single stepping on assembler level (advanced users
only).
SYStem.Option SYSPWRUPREQ
Format:
Force system power
SYStem.Option SYSPWRUPREQ [ON | OFF]
Default: ON.
This option controls the SYSPWRUPREQ bit of the CTRL/STAT register of the Debug Access Port (DAP). If
the option is ON, system power will be requested by the debugger on a debug session start.
This option is for target processors having a Debug Access Port (DAP) e.g., Cortex-A or Cortex-R.
SYStem.Option TIDBGEN
Format:
Activate initialization for TI derivatives
SYStem.Option TIDBGEN [ON | OFF]
Default: OFF.
©1989-2014 Lauterbach GmbH
ARM Debugger
113
ARM specific SYStem Commands
If this option is active the debugger sends a special initialization sequence, which is required for some
derivatives from Texas Instruments (TI) to enable the on-chip debug support. When a TI CPU type (e.g.
“OMAP1510”) is selected, this option is automatically set.
This option is only available on ARM9.
SYStem.Option TIETMFIX
Format:
Bug fix for customer specific ASIC
SYStem.Option TIETMFIX [ON | OFF]
SYStem.Option TIDEMUXFIX
Format:
Bug fix for customer specific ASIC
SYStem.Option TIDEMUXFIX [ON | OFF]
©1989-2014 Lauterbach GmbH
ARM Debugger
114
ARM specific SYStem Commands
SYStem.Option TraceStrobe
Format:
Obsolete command
SYStem.Option TraceStrobe [CE | OE | CE+OE | STR | STR-]
This command is obsolete.
SYStem.Option TRST
Format:
Allow debugger to drive TRST
SYStem.Option TRST [ON | OFF]
Default: ON.
If this option is disabled the nTRST line is never asserted by the debugger (permanent high). Instead five
consecutive TCK pulses with TMS high are asserted to reset the TAP controller which have the same effect.
SYStem.Option TURBO
Format:
Speed up memory access
SYStem.Option TURBO [ON | OFF]
Default: OFF.
If TURBO is disabled the CPU checks after each system speed memory access in debug mode if the CPU
has finished the corresponding cycle. This check will significantly reduce the down- and upload speed (3040%).
If TURBO is enabled the CPU will make no checks. This may result in unpredictable errors if the memory
interface is slow. Therefore it is recommended to use this option only for a program download and in case
you know that the memory interface is fast enough to take the data with the speed they are provided by the
debugger.
This option is not available on the ARM10.
©1989-2014 Lauterbach GmbH
ARM Debugger
115
ARM specific SYStem Commands
SYStem.Option WaitReset
Format:
Wait with JTAG activities after deasserting reset
SYStem.Option WaitReset [ON | OFF | <time>]
Default: OFF = 3 msec.
If SYStem.Option ResBreak is disabled the debugger waits after the deassertion of nRESET/nSRST and
nTRST before the first JTAG activity starts (see picture below). During this time the ARM core may execute
some code, e.g. to enable the JTAG port. If SYStem.Option ResBreak is enabled the debugger waits after
the deassertion of nTRST before the first JTAG activity starts while nSRST remains active.
ON: 1 sec delay
OFF: 3 msec delay
<time>: selectable time delay, min 50 usec, max 30 sec, use ’us’, ’ms, ’s’ as unit.
nRESET/nSRST
nTRST
CPU State
>1 s (ON)
reset
running
debug
©1989-2014 Lauterbach GmbH
ARM Debugger
116
ARM specific SYStem Commands
SYStem.Option ZoneSPACES
Format:
Enable symbol management for ARM zones
SYStem.Option ZoneSPACES [ON | OFF]
Default: OFF
The SYStem.Option ZoneSPACES command is relevant if an ARM CPU with TrustZone or
VirtualizationExtension is debugged. In these ARM CPUs, the processor has two or more CPU operation
modes called:
•
Nonsecure mode
•
Secure mode
•
Hypervisor mode
Within TRACE32, these CPU operation modes are referred to as zones.
In each CPU operation mode (zone), the CPU uses separate MMU translation tables for memory accesses
and separate register sets. Consequently, in each zone, different code and data can be visible on the same
logical addresses.
To ease debug-scenarios where the CPU operation mode switches between nonsecure, secure or
hypervisor mode, it is helpful to load symbol sets for each used zone.
OFF
(Default)
TRACE32 does not separate symbols by access class. Loading two or more
symbol sets with overlapping address ranges will result in unpredictable
behavior. Loaded symbols are independent of ARM zones.
ON
Separate symbol sets can be loaded for each zone, even with
overlapping address ranges. Loaded symbols are specific to one of the
ARM zones - each symbol carries one of the access classes N:, Z:, or H:
For details and examples, see below.
©1989-2014 Lauterbach GmbH
ARM Debugger
117
ARM specific SYStem Commands
SYStem.Option ZoneSPACES ON
If the ZoneSPACES option is enabled (ON), TRACE32 enforces any memory address specified in a
TRACE32 command to have an access class which clearly indicates to which zone it belongs.
If an address specified in a command is not clearly attributed to N: Z: or H:, the access class of the current
PC context is used to complete the addresses’ access class.
Every loaded symbol is attributed to either nonsecure (N:), secure (Z:) or hypervisor (H:) zone. If a symbol is
referenced by name, the associated access class (N: Z: or H:) will be used automatically, so that the memory
access is done within the correct CPU mode context. This implies that the symbol’s logical address will be
translated to the physical address with the correct MMU translation table.
NOTE:
The loaded symbols and their associated access class can be examined with
command sYmbol.List or sYmbol.Browse or sYmbol.INFO.
Example 1 - Loading Symbols
SYStem.Option ZONESPACES ON
; 1. Load the vmlinux symbols for nonsecure mode (access classes N:, NP:
; and ND: used for the symbols):
Data.LOAD.ELF vmlinux N:0x0 /NoCODE
; 2. Load the sysmon symbols for secure mode (access classes Z:, ZP: and
; ZD: used for the symbols):
Data.LOAD.ELF sysmon Z:0x0 /NoCODE
; 3. Load the xen-syms symbols for hypervisor mode (access classes H:,
; HP: and HD: used for the symbols):
Data.LOAD.ELF xen-syms H:0x0 /NoCODE
; 4. Load the sieve symbols without specification of a target access
; class:
Data.LOAD.ELF sieve /NoCODE
; Assuming that the current CPU mode is nonsecure in this example, the
; symbols of sieve will get the access classes N:, NP: and ND: assigned
; during loading.
©1989-2014 Lauterbach GmbH
ARM Debugger
118
ARM specific SYStem Commands
Example 2 - Symbolic memory access:
; dump the address on symbol swapper_pg_dir which belongs
; to the nonsecure symbol set "vmlinux" we have loaded above:
Data.Dump swapper_pg_dir
; This will automatically use access class N: for the memory access,
; even if the CPU is currently not in nonsecure mode.
Example 3 - Deleting Zone-specific Symbols:
To delete a complete symbol set belonging to a specific zone, e.g. the nonsecure zone, use the following
command to delete all symbols in the specified address range:
sYmbol.Delete N:0x0--0xffffffff
; nonsecure mode (access classes N:)
Zone-specific Debugger Address Translation Setup
If option ZoneSPACES is enabled and the debugger address translation is used (TRANSlation commands),
a strict zone separation of the address translations is enforced. Also, common address ranges will always be
specific for a certain zone (command TRANSlation.COMMON).
This example shows how to define separate translations for zones N: and H:
SYStem.Option ZoneSPACES ON
Data.LOAD.Elf sysmon Z:0 /NOCODE
Data.LOAD.Elf usermode N:0 /NoCODE /NoClear
; set up address translation for secure mode
TRANSlation.Create Z:0xC0000000++0x0fffffff A:0x10000000
; set up address translation for nonsecure mode
TRANSlation.Create N:0xC0000000++0x1fffffff A:0x40000000
; enable address translation and table walk
TRANSlation.ON
; check the complete translation setup
TRANSlation.List
Operation System Support
If the CPU’s virtualization extension is used to virtualize one or more guest systems, the hypervisor always
runs in the CPU’s hypervisor mode (zone H:), and the current guest system (if a ready-to-run guest is
configured at all by the hypervisor) will run in the CPU’s nonsecure mode (zone N:).
Often, an operation system (such as a Linux kernel) runs in the context of the guest system.
©1989-2014 Lauterbach GmbH
ARM Debugger
119
ARM specific SYStem Commands
In such a setup with hypervisor and guest OS, it is possible to load both the hypervisor symbols to H: and all
OS-related symbols to N:
A TRACE32 OS awareness can be loaded in TRACE32 to support the work with the OS in the guest
system. This is done as follows:
1.
2.
Configure the OS awareness as for a non-virtualized system. See:
-
”Training Linux Debugging” (training_rtos_linux.pdf)
-
TASK.CONFIG command
Additionally set the default access class of the OS awareness to the nonsecure zone:
TASK.ACCESS N:
The TRACE32 OS awareness is now configured to find guest OS kernel symbols in the nonsecure
zone.
NOTE:
This debugger setup based on option ZoneSPACES will only allow to view and
work with one guest system simultaneously.
If the hypervisor has configured more than one guest, only the guest that is active in
the nonsecure CPU mode is visible.
To work with another guest, the system must continue running until an inactive
guest becomes the active guest.
Currently, only one OS awareness can be loaded into TRACE32. To debug more than one OS, the OS
awareness must be reloaded after each switch to another OS.
©1989-2014 Lauterbach GmbH
ARM Debugger
120
ARM specific SYStem Commands
Example setup for a guest OS and a hypervisor:
In this example, the hypervisor is configured to run in zone H: and a Linux kernel with OS awareness as
current guest OS in zone N:
SYStem.Option ZoneSPACES ON
; within the OS awareness we need SpaceID to separate address spaces of
; different processes / tasks
SYStem.Option MMUSPACES ON
; here we let the target system boot the hypervisor. The hypervisor will
; set up the guest and boot linux on the guest system.
...
; load the hypervisor symbols
Data.LOAD.Elf xen-syms H:0 /NOCODE
Data.LOAD.Elf usermode N:0 /NOCODE /NOCLEAR
; set up the linux OS awareness
TASK.CONFIG ~~/demo/arm/kernel/linux/linux-3.x/linux3
MENU.ReProgram ~~/demo/arm/kernel/linux/linux-3.x/linux
; instruct the OS awareness to access all OS related symbols with
; access class N:
TASK.ACCESS N:
; set up the debugger address translation for the guest OS
; Note that the default address translation in the following command
; defines a translation of the logical kernel addresses
; N:0xC0000000++0xFFFFFFF to intermediate physical address I:0x40000000
MMU.FORMAT linux swapper_pg_dir N:0xC0000000++0xFFFFFFF I:0x40000000
; define the common address range for the guest kernel symbols
TRANSlation.COMMON N:0xC0000000--0xFFFFFFFF
; enable the address translation and the table walk
TRANSlation.TableWalk ON
TRANSlation.ON
NOTE:
If SYStem.Option MMUspaces ON is used, all addresses for all zones will show
a spaceID extension (such as N:0x024A:0x00320100), even if the OS
awareness runs only in one zone (as defined with command TASK.ACCESS).
TRACE32 will always show a spaceID of 0x0000 for any address belonging to
the other zones.
Any command related to task handling, such as TRANSlation.List.TaskPageTable <taskname>, will
automatically refer to tasks running in the zone where the OS awareness runs in.
©1989-2014 Lauterbach GmbH
ARM Debugger
121
ARM specific SYStem Commands
SYStem.RESetOut
Format:
Assert nRESET/nSRST on JTAG connector
SYStem.RESetOut
If possible (nRESET/nSRST is open collector), this command asserts the nRESET/nSRST line on the JTAG
connector. While the CPU is in debug mode this function will be ignored. Use the SYStem.Up command if
you want to reset the CPU in debug mode.
SYStem.view
Format:
Display SYStem window
SYStem.view
Display the SYStem window for ARM.
©1989-2014 Lauterbach GmbH
ARM Debugger
122
ARM specific SYStem Commands
ARM Specific Benchmarking Commands
The BMC (BenchMark Counter) commands provide control of the on-chip performance monitor unit (PMU).
The PMU consists of a group of counters that can be configured to count certain events in order to get
statistics on the operation of the processor and the memory system.
The counters of Cortex-A/-R cores can be read at run-time. The counters of ARM11 cores can only be read
while the target application is halted. This group of counters is not available for ARM7 to ARM10 cores.
For information about architecture-independent BMC commands, refer to ”BMC” (general_ref_b.pdf).
For information about architecture-specific BMC commands, see command descriptions below.
BMC.EXPORT
Format:
Export benchmarking events from event bus
BMC.EXPORT [ON | OFF]
Enable / disable the export of the benchmarking events from the event bus. If enabled, it allows an external
monitoring tool, such as an ETM to trace the events. For further information please refer to the target
processor manual under the topic performance monitoring.
Default: OFF
The figure below depicts an example configuration comprising the PMU and ETM:
In case ETM1 or ETM2 are selected for event counting, BMC.EXPORT will automatically be switched on.
Furthermore the according extended external input selectors of the ETM will be set accordingly.
©1989-2014 Lauterbach GmbH
ARM Debugger
123
ARM Specific Benchmarking Commands
BMC.MODE
Define the operating mode of the benchmark counter
Format:
BMC.MODE <mode>
<mode>:
OFF
ICACHE
DCACHE
SYSIF
CLOCK
TIME
This command only applies to some ARM9 based derivatives from Texas Instruments.
The Benchmark Counter - short BMC - is a hardware counter. It collects information about the throughput of
the target processor, like instruction or data cache misses. This information may be helpful in finding
bottlenecks and tuning the application.
OFF
Switch off the benchmark counter.
ICACHE
Counts Instructions CACHE misses, in relation to total instruction access.
DCACHE
Counts Data CACHE misses, in relation to total data access.
SYSIF
Counts if SYStem bus InterFace is busy, in relation to total system bus access.
CLOCK
Incremented for each CPU clock.
TIME
TIME is measured by counting CLOCK. The translation to TIME is done by
using the CPU frequency. For this reason, the CPU frequency has to be entered
with the command BMC.CLOCK.
©1989-2014 Lauterbach GmbH
ARM Debugger
124
ARM Specific Benchmarking Commands
BMC.PMNx
Configure the performance monitor
Format:
BMC.PMN0 | PMN1 <mode>
<mode>:
OFF
INST
BINST
BMIS
PC
ICMISS
ITLBMISS
ISTALL
DACCESS
DCACHE
DCMISS
DTBLMISS
DSTALL
DFULL
DCWB
WBDRAIN
TLBMISS
EMEM
ETMEXTOUT0
ETMEXTOUT1
Delta
Echo
CLOCK
TIME
NONE
PMN0/PMN1
PMN1/PMN0
PMN0/PMNC
PMN1/PMNC
The command is available on ARM1136, ARM1176 and Cortex-A8. This description applies to ARM1136.
All available modes are described in detail in the technical reference guide of the ARM cores.
Performance Monitors - short PMN - are implemented as 32 bit hardware counter. They collect information
about the throughput of the target processor and its pipeline stages. They count certain events, like cache
misses or CPU cycles. Further, they deliver information about the efficiency of the instruction or data cache,
the TLBs (translation look aside buffers) and some other performance values. This information may be
helpful in finding bottlenecks and tuning the application.
©1989-2014 Lauterbach GmbH
ARM Debugger
125
ARM Specific Benchmarking Commands
On ARM1136 there are two separate counters PMN0 and PMN1 available. The <mode> parameter of the
BMC.PMNx-command selects the events which should be counted.
OFF
Switch off the performance monitor.
INST
The selected counter counts executed instructions.
BINST
Counts executed branch instructions.
BMIS
Counts branches which were mispredicted by the core (for static) or prefetch
unit (for dynamic) branch prediction. A branch misprediction causes the pipeline
to be flushed, and the correct instruction to be fetched.
PC
Counts changes of the PC by the program e.g. as in a MOV or LDR instruction
with PC as destination.
ICMISS
Counts instruction cache misses which requires a instruction fetch from the
external memory.
ITLBMISS
Counts misses of the instruction MicroTLB.
ISTALL
ISTALL increments the counter by 1 for every cycle the condition is valid. The
CPU is stalled when the instruction buffer cannot deliver an instruction. This
happens as a result of an instruction cache miss or an instruction MicroTLB
miss.
DACCESS
DACCESS is incremented by 1 for every nonsequential data access, regardless
of whether or not the item is cached or not.
DCACHE
DCACHE is incremented for each access to the data cache.
DCMISS
DCMISS counts for missing data in the data cache.
DTBLMISS
Counts misses in the data MicroTLB.
DSTALL
In a data dependency conflict the CPU is stalled. DSTALL increments the
counter by one for every cycle the stall persists.
DFULL
If the pipeline of load store unit is full, the counter will be incremented by one for
each clock the condition is met.
DCWB
Data cache write back occurs for each half line of four words that are written
back from cache to memory.
WBDRAIN
Write buffer drains force all buffered data writes to be written to external
memory. WBDRAIN will count all that drains which are done because of a data
synchronization barrier or strongly ordered operations.
TBLMISS
Counts main TLB misses.
©1989-2014 Lauterbach GmbH
ARM Debugger
126
ARM Specific Benchmarking Commands
EMEM
Incremented for each explicit external data access. That includes cache refills,
non-cachable and write-through access. It does not include instruction cache
fills or data write backs.
ETMEXTOUT
0
The counter is incremented, if the ETMEXTOUT0-signal is asserted for a cycle.
The ETM can be programmed to rise that signal on behalf / as result of certain
events, like a counter overflow or an address compare.
EMTEXTOUT
1
The counter is incremented, if the ETMEXTOUT1-signal is asserted for a cycle.
The ETM can be programmed to rise that signal on behalf of certain events, like
a counter overflow or an address compare.
Delta
Counts hits of the Delta-Marker, if specified.
Echo
Counts hits of the Echo-Marker, if specified.
CLOCK
The counter is incremented for every cpu clock.
TIME
TIME is measured by counting CLOCK. The transaction to TIME is done by
using the cpu frequency. For this reason, the CPU frequency has to be entered
with the command BMC.CLOCK.
INIT
Reset the benchmark counter to zero.
PMN0/PMN1
Calculate the ratio PMN0/PMN1.
PMN1/PMN0
Calculate the ratio PMN1/PMN0.
PMN0/PMNC
Calculate the ratio PMN0/PMNC.
PMN1/PMNC
Calculate the ratio PMN1/PMNC.
©1989-2014 Lauterbach GmbH
ARM Debugger
127
ARM Specific Benchmarking Commands
To count for branches taken, in relation to mispredicted branches, use the following commands:
BMC.RESet
; Reset the BMC settings
BMC.state
; Display the BMC window
BMC.PMN0 BINST
; Set the first (PMN0) performance counter
; to count all taken branches
BMC.PMN1 BMIS
; Set the second (PMN1) performance counter
; to mispredicted branches
BMC.PMN0 PMN1/PMN0
; Calculate the ratio between branches
; taken and branches mispredicted
Go sieve
; Go to the function sieve
BMC.Init
; Initialize the benchmark counter to start
; the measurement of function sieve
Go.Return
; Go to the last instruction of the function
; sieve
To count for data access in relation to data cache misses:
BMC.RESet
; Reset the BMC settings
BMC.state
; Display the BMC window
BMC.PMN0 DCACCESS
; Set the first (PMN0) performance counter
; to count all data accesses
BMC.PMN1 DCMISS
; Set the second (PMN1) performance counter
; to count data cache misses
BMC.PMN0 PMN1/PMN0
; Calculate the ratio between data access
; and cache misses
Go sieve
; Go to the function sieve
BMC.Init
; Initialize the benchmark counter
Go.Return
; Go to the last instruction of the function
; sieve
©1989-2014 Lauterbach GmbH
ARM Debugger
128
ARM Specific Benchmarking Commands
Functions
BMC.COUNTER(<x>)
Reads out the benchmark counter PMNx.
BMC.PRESCALER
Format:
Prescale the measured cycles
BMC.PRESCALER [ON | OFF]
If ON, the cycle counter register, which counts for the cpu cycles which is used to measure the elapsed time,
will be divided (prescaled) by 64. The display of the time will be corrected accordingly.
BMC.TARA
Format:
Calibrate the benchmark counter
BMC.TARA
Due to restricted technical feasibilities the benchmark counter will start counting before the application runs.
To improve the exactness of the result you can perform BMC.Init, single step an assembler command and
execute BMC.TARA. On following measurements the obtained result will be subtracted from the benchmark
counter.
©1989-2014 Lauterbach GmbH
ARM Debugger
129
ARM Specific Benchmarking Commands
ARM Specific TrOnchip Commands
The TrOnchip command provides low level access to the on-chip debug register.
TrOnchip.A
Programming the ICE breaker module
Available for ARM7 and ARM9 family.
TrOnchip.A.Value
Format:
Define data selector
TrOnchip.A.Value <hexmask> | <bitmask>
TrOnchip.B.Value <hexmask> | <bitmask>
Defines the two data selectors of ICE breaker as hex or binary mask (x means don't care). If you want to
trigger on a certain byte or word access you must specify the mask according to the address of the access.
E.g. you make a byte access on address 2 and you want to trigger on the value 33, then the necessary mask
is 0xx33xxxx.
Available for ARM7 and ARM9 family.
TrOnchip.A.Size
Define access size for data selector
Format:
TrOnchip.A.Size <size>
TrOnchip.B.Size <size>
<size>:
OFF
Byte
Word
Long
Defines on which access size when ICE breaker stops the program execution.
Available for ARM7 and ARM9 family.
©1989-2014 Lauterbach GmbH
ARM Debugger
130
ARM Specific TrOnchip Commands
TrOnchip.A.CYcle
Define access type
Format:
TrOnchip.A.CYcle <cycle>
TrOnchip.B.CYcle <cycle>
<cycle>:
OFF
Read
Write
Access
Execute
Defines on which cycle the ICE breaker stops the program execution.
OFF
Cycle type doesn't matter.
Read
Stop the program execution on a read access.
Write
Stop the program execution on a write access.
Access
Stop the program execution on a read or write access.
Execute
Stop the program execution on an instruction is executed.
Available for ARM7 and ARM9 family.
©1989-2014 Lauterbach GmbH
ARM Debugger
131
ARM Specific TrOnchip Commands
TrOnchip.A.Address
Define address selector
Format:
TrOnchip.A.Address <selector>
TrOnchip.B.Address <selector>
<selector>:
OFF
Alpha
Beta
Charly
The address/range for an address selector can not be defined directly. Set an breakpoint of the type Alpha,
Beta or Charly to the address/range.
Break.Set 1000 /Alpha
TrOnchip.A.Address Alpha
; set an Alpha breakpoint to 1000
; use Alpha breakpoint as address
; selector for the unit A
Var.Break.Set flags[3] /Beta
TrOnchip.B.Address Beta
; set a Beta breakpoint to flags[3]
; use Beta breakpoint as address
; selector for the unit B
Available for ARM7 and ARM9 family.
TrOnchip.A.Trans
Define access mode
Format:
TrOnchip.A.Trans <mode>
TrOnchip.B.Trans <mode>
<mode>:
OFF
User
Svc
Defines in which mode ICE breaker should stop the program execution.
OFF
Mode doesn’t matter.
User
Stop the program execution only in user mode.
Svc
Stop the program execution only in supervisor mode.
Available for ARM7 and ARM9 family.
©1989-2014 Lauterbach GmbH
ARM Debugger
132
ARM Specific TrOnchip Commands
TrOnchip.A.Extern
Define the use of EXTERN lines
Format:
TrOnchip.A.Extern <mode>
TrOnchip.B.Extern <mode>
<mode>:
OFF
Low
High
Defines if the EXTERN lines are considered by unit A or unit B.
Available for ARM7 and ARM9 family.
TrOnchip.AddressMask
Format:
Define an address mask
TrOnchip.AddressMask <value> | <bitmask>
TrOnchip.ContextID
Format:
Enable context ID comparison
TrOnchip.ContextID [ON | OFF]
If the ARM debug unit provides breakpoint registers with ContextID comparison capability
TrOnchip.ContextID has to be set to ON in order to set task/process specific breakpoints that work in realtime.
TrOnchip.ContextID ON
Break.Set VectorSwi /Program /Onchip /TASK EKern.exe:Thread1
TrOnchip.CONVert
Format:
Extend the breakpoint range
TrOnchip.CONVert [ON | OFF]
The ICE-breaker does not provide resources to set an on-chip breakpoint to an address range. Only bit
masks can be used to mark a memory range with a breakpoint.
©1989-2014 Lauterbach GmbH
ARM Debugger
133
ARM Specific TrOnchip Commands
If TrOnchip.Convert is set to ON (default) and a breakpoint is set to a range, this range is extended to the
next possible bit mask. The result is, that in most cases a bigger address range is marked by the specified
breakpoint. This can be easily controlled by the Data.View command.
If TrOnchip.Convert is set to OFF, the debugger will only accept breakpoints which exactly fit to the on-chip
breakpoint hardware.
This setting affects all on-chip breakpoints.
TrOnchip.Mode
Configure unit A and B
Format:
TrOnchip.Mode <mode>
<mode>:
AORB
AANDB
BAFTERA
Defines the way in which unit A and B are used together.
AORB
Stop the program execution if unit A or unit B match.
AANDB
Stop the program execution if both units match.
BAFTERA
Stop the program execution if first unit A and then unit B match.
TrOnchip.RESet
Format:
Reset on-chip trigger settings
TrOnchip.RESet
Resets all TrOnchip settings.
©1989-2014 Lauterbach GmbH
ARM Debugger
134
ARM Specific TrOnchip Commands
TrOnchip.Set
Format:
Set bits in the vector catch register
TrOnchip.Set StepVector [ON | OFF]
ARM9, ARM11 also:
[FIQ | IRQ | DABORT | PABORT | SWI | UNDEF | RESET]
Devices having TrustZone (ARM1176, Cortex-A) additionally:
[NFIQ | NIRQ | NDABORT | NPABORT | NSWI | NUNDEF |
SFIQ | SIRQ | SDABORT | SPABORT | SSWI | SUNDEF | SRESET |
MAFIC | MIRQ | MDABORT | MPABORT | MSWI]
Devices having a Hypervisor mode (e.g. Cortex-A7, -A15) additionally:
[HFIQ | HIRQ | HDABORT | HPABORT | HSWI | HUNDEF | HENTRY]
Default: DABORT, PABORT, UNDEF, RESET ON, others OFF.
FIQ, ...
HENTRY
Sets/resets the corresponding bits in the vector catch register of the core. If the
bit of a vector is set and the corresponding exception occurs, the processor
enters debug state as if there had been a breakpoint set on an instruction fetch
from that exception vector.
On devices having TrustZone you can specify for most exceptions if the vector catch shall take effect only in
non-secure (N...), secure (S...) or monitor mode (M...), on devices having a Hypervisor mode also in
hypervisor mode (H...).
If StepVector is activated a breakpoint range will be set on the trap vector table (e.g. 0x00--0x1f) when a
single step is requested. This is helpful to check if a interrupt or trap occurs.
©1989-2014 Lauterbach GmbH
ARM Debugger
135
ARM Specific TrOnchip Commands
TrOnchip.TEnable
Define address selector for bus trace
Format:
TrOnchip.TEnable <mode>
<mode>:
ALL
Alpha
Beta
Charly
Delta
Echo
Define a filter for the trace. The Preprocessor for the ARM7 family (bus trace) provides 1 address
comparator, that is implemented as a comparator (bit mask). Since this comparator is provided by the
TRACE32 development tools, it is listed as a Hardware Breakpoint.
; sample only entries to the function sieve
Break.Set sieve /Charly
TrOnchip.TEnable Charly
TrOnchip.TCYcle Fetch
; sample all read and write accesses to the variable flags[3]
Var.Break.Set flags[3] /Alpha
TrOnchip.TEnable Alpha
TrOnchip.TCYcle Access
©1989-2014 Lauterbach GmbH
ARM Debugger
136
ARM Specific TrOnchip Commands
TrOnchip.TCYcle
Define cycle type for bus trace
Format:
TrOnchip.TCYcle <cycle>
<cycle>:
ANY
Read
Write
Access
Fetch
Soft
Defines the cycle type for the bus trace address selector.
ANY
Cycle type doesn't matter.
Read
Record only read accesses.
Write
Record only write accesses.
Access
Record only data accesses.
Fetch
Record only instruction fetches.
Soft
Not used now.
TrOnchip Example
Assume there is a byte variable called 'flag' and you want to trigger if the value 59 is written to the variable.
Break.Set flag /Alpha
; set an alpha breakpoint to the address
; of the variable flag
TrOnchip.A Address Alpha
; enable alpha break for on-chip trigger
TrOnchip.A Value 0xxxxxx59
;
;
;
;
;
TrOnchip.A Cycle Write
; specify that you want to trigger only on
; a write access
TrOnchip.A Size Byte
; specify that you want to trigger only on
; byte access
specify data pattern; this example
assumes that the address of flags is on
an address dividable by 4 and you have
little endian byte ordering (lowest byte
on data bus)
©1989-2014 Lauterbach GmbH
ARM Debugger
137
ARM Specific TrOnchip Commands
TtrOnchip.VarCONVert
Format:
Convert variable breakpoints
TrOnchip.VarCONVert [ON | OFF]
The ICE-breaker does not provide resources to set an on-chip breakpoint to an address range. Only bit
masks can be used to mark a memory range with a breakpoint.
If TrOnchip.VarCONVert is set to ON and a breakpoint is set to a scalar variable then it is converted into a
single address breakpoint.
If TrOnchip.VarCONVert is set to OFF variable breakpoints will be set to an address range covering the
whole variable.
TrOnchip.view
Format:
Display on-chip trigger window
TrOnchip.view
Open TrOnchip window.
©1989-2014 Lauterbach GmbH
ARM Debugger
138
ARM Specific TrOnchip Commands
CPU specific MMU Commands
MMU.DUMP
Display MMU table
Format:
MMU.DUMP <table> [<range> | <addr> | <range> <root> | <addr> <root>]
MMU.<table>.dump (deprecated)
<table>:
PageTable
KernelPageTable
TaskPageTable <task>
and CPU specific tables
Displays the contents of the CPU specific MMU translation table.
•
If called without parameters, the complete table will be displayed.
•
If the command is called with either an address range or an explicit address, table entries will
only be displayed, if their logical address matches with the given parameter.
The optional <root> argument can be used to specify a page table base address deviating from the default
page table base address. This allows to display a page table located anywhere in memory.
PageTable
Display the current MMU translation table entries of the CPU.
This command reads all tables the CPU currently used for MMU translation
and displays the table entries.
KernelPageTable
Display the MMU translation table of the kernel.
If specified with the MMU.FORMAT command, this command reads the
MMU translation table of the kernel and displays its table entries.
TaskPageTable
Display the MMU translation table entries of the given process.
In MMU based operating systems, each process uses its own MMU
translation table. This command reads the table of the specified process,
and displays its table entries.
See also the appropriate OS awareness manuals: RTOS Debugger for
<x>.
©1989-2014 Lauterbach GmbH
ARM Debugger
139
CPU specific MMU Commands
CPU specific tables:
ITLB
Displays the contents of the Instruction Translation Lookaside Buffer.
DTLB
Displays the contents of the Data Translation Lookaside Buffer.
TLB0
Displays the contents of the Translation Lookaside Buffer 0.
TLB1
Displays the contents of the Translation Lookaside Buffer 1.
NonSecurePageTable
Displays the translation table used if the CPU is in nonsecure mode and in
privilege level PL0 or PL1. This is the table pointed to by MMU registers
TTBR0 and TTBR1 in nonsecure mode. This option is only visible if the CPU
has the TrustZone and/or Virtualization Extension.
SecurePageTable
Displays the translation table used if the CPU is in secure mode. This is the
table pointed to by MMU registers TTBR0 and TTBR1 in secure mode. This
option is only visible if the CPU has the TrustZone Extension.
HypervisorPageTable
Displays the translation table used by the MMU when the CPU is in HYP
mode. This is the table pointed to by MMU register HTTBR.
This table is only available in CPUs with Virtualization Extension.
IntermediatePageTable
Displays the translation table used by the MMU for the second stage
translation of a guest machine. (i.e., intermediate physical address to
physical address). This is the table pointed to by MMU register VTTBR.
This table is only available in CPUs with Virtualization Extension.
©1989-2014 Lauterbach GmbH
ARM Debugger
140
CPU specific MMU Commands
Description of columns in the TLB dump window
Logical
Logical address.
Physical
Physical address.
Vmid
Virtual machine ID.
Asid
Address space ID.
Glb
Global flag.
Sec
Non-secure identifier for physical address.
idx
Index of the TLB entry.
pagesize
Page size.
Hyp
Hypervisor entry flag.
V
Valid flag.
L
Locked flag.
I
Inner shareability flag.
O
Outer shareability flag.
M
Indicates if the line was brought in when MMU was enabled.
D
Domain ID
Attributes
Memory Attributes (check design manual of respective architecture for
the format).
Tablewalk
Table walk information.
©1989-2014 Lauterbach GmbH
ARM Debugger
141
CPU specific MMU Commands
MMU.List
Display MMU table
Format:
MMU.List [<table> [<range> | <address>]]
MMU.<table>.List (deprecated)
<table>:
PageTable
KernelPageTable
TaskPageTable <task>
Lists the address translation of the CPU specific MMU table. If called without address or range parameters,
the complete table will be displayed.
If called without a table specifier, this command shows the debugger internal translation table.
See TRANSlation.List.
If the command is called with either an address range or an explicit address, table entries will only be
displayed, if their logical address matches with the given parameter.
PageTable
List the current MMU translation of the CPU.
This command reads all tables the CPU currently used for MMU
translation and lists the address translation.
KernelPageTable
List the MMU translation table of the kernel.
If specified with the MMU.FORMAT command, this command reads the
MMU translation table of the kernel and lists its address translation.
TaskPageTable
List the MMU translation of the given process.
In MMU based operating systems, each process uses its own MMU
translation table. This command reads the table of the specified process,
and lists its address translation.
See also the appropriate OS awareness manuals: RTOS Debugger for
<x>.
©1989-2014 Lauterbach GmbH
ARM Debugger
142
CPU specific MMU Commands
CPU specific tables:
NonSecurePageTable
Displays the translation table used if the CPU is in nonsecure mode and in
privilege level PL0 or PL1. This is the table pointed to by MMU registers
TTBR0 and TTBR1 in nonsecure mode. This option is only visible if the CPU
has the TrustZone and/or Virtualization Extension.
This option is only enabled if Exception levels EL0 or EL1 use Aarch32
mode.
SecurePageTable
Displays the translation table used if the CPU is in secure mode. This is the
table pointed to by MMU registers TTBR0 and TTBR1 in secure mode. This
option is only visible if the CPU has the TrustZone Extension.
This option is only enabled if the Exception level EL1 uses Aarch32
mode.
HypervisorPageTable
Displays the translation table used by the MMU when the CPU is in HYP
mode. This is the table pointed to by MMU register HTTBR.
This table is only available in CPUs with Virtualization Extension.
IntermediatePageTable
Displays the translation table used by the MMU for the second stage
translation of a guest machine. (i.e., intermediate physical address to
physical address). This is the table pointed to by MMU register VTTBR.
This table is only available in CPUs with Virtualization Extension.
MMU.SCAN
Load MMU table from CPU
Format:
MMU.SCAN <table> [<range> <address>]
MMU.<table>.SCAN (deprecated)
<table>:
PageTable
KernelPageTable
TaskPageTable <task>
ALL
and CPU specific tables
Loads the CPU specific MMU translation table from the CPU to the debugger internal translation table. If
called without parameters the complete page table will be loaded. The loaded address translation can be
viewed with TRANSlation.List.
If the command is called with either an address range or an explicit address, page table entries will only be
loaded if their logical address matches with the given parameter.
©1989-2014 Lauterbach GmbH
ARM Debugger
143
CPU specific MMU Commands
PageTable
Load the current MMU address translation of the CPU.
This command reads all tables the CPU currently used for MMU translation,
and copies the address translation into the debugger internal translation
table.
KernelPageTable
Load the MMU translation table of the kernel.
If specified with the MMU.FORMAT command, this command reads the
table of the kernel and copies its address translation into the debugger
internal translation table.
TaskPageTable
Load the MMU address translation of the given process.
In MMU based operating systems, each process uses its own MMU
translation table. This command reads the table of the specified process,
and copies its address translation into the debugger internal translation
table.
See also the appropriate OS awareness manuals: RTOS Debugger for
<x>.
ALL
Load all known MMU address translations.
This command reads the OS kernel MMU table and the MMU tables of all
processes and copies the complete address translation into the
debugger internal translation table.
See also the appropriate OS awareness manuals: RTOS Debugger for
<x>.
OEMAT
Loads the OEM Address Table from the CPU to the debugger internal
translation table.
HypervisorPageTable
Loads the translation table used by the MMU when the CPU is in HYP mode.
This is the table pointed to by MMU register HTTBR.
This table is only available in CPUs with Virtualization Extension.
IntermediatePageTable
Loads the translation table used by the MMU for the second stage translation
of a guest machine (intermediate physical address to physical address). This
is the table pointed to by MMU register VTTBR.
This table is only available in CPUs with Virtualization Extension.
©1989-2014 Lauterbach GmbH
ARM Debugger
144
CPU specific MMU Commands
Target Adaption
Probe Cables
For debugging two kind of probe cable can be used to connect the debugger to the target:
“Debug Cable” and “CombiProbe”
The CombiProbe is mainly used on Cortex-M derivatives or in case a system trace port is available because
it includes besides the debug interface a 4 bit wide trace port which is sufficient for Cortex-M program trace
or for system trace.
For off-chip program and data trace an additional trace probe cable “Preprocessor” is needed.
Interface Standards JTAG, Serial Wire Debug, cJTAG
Debug Cable and CombiProbe support JTAG (IEEE 1149.1), Serial Wire Debug (CoreSight ARM), and
Compact JTAG (IEEE 1149.7, cJTAG) interface standards. The different modes are supported by the same
connector. Only some signals get a different function. The mode can be selected by debugger commands.
This assumes of course that your target supports this interface standard.
Serial Wire Debug is activated/deactivated by SYStem.CONFIG SWDP [ON | OFF] alternatively by
SYStem.CONFIG DEBUGPORTTYPE [SWD | JTAG]. In a multidrop configuration you need to specify the
address of your debug client by SYStem.CONFIG SWDPTARGETSEL.
cJTAG is activated/deactivated by SYStem.CONFIG DEBUGPORTTYPE [CJTAG | JTAG]. Your system
might need bug fixes which can be activated by SYStem.CONFIG CJTAGFLAGS.
Serial Wire Debug (SWD) and Compact JTAG (cJTAG) require a Debug Cable version V4 or newer
(delivered since 2008) or a CombiProbe (any version) and one of the newer base modules (Power Debug
Interface USB 2.0, Power Debug Ethernet, PowerTrace or Power Debug II).
Connector Type and Pinout
Debug Cable
Adaption for ARM Debug Cable: See http://www.lauterbach.com/adarmdbg.html.
For details on logical functionality, physical connector, alternative connectors, electrical characteristics,
timing behavior and printing circuit design hints refer to ”ARM JTAG Interface Specifications”
(arm_app_jtag.pdf).
©1989-2014 Lauterbach GmbH
ARM Debugger
145
Target Adaption
CombiProbe
Adaption for ARM CombiProbe: See http://www.lauterbach.com/adarmcombi.html.
The CombiProbe will always be delivered with 10-pin, 20-pin, 34-pin connectors. The CombiProbe can not
detect which one is used. If you use the trace of the CombiProbe you need to inform about the used
connector because the trace signals can be at different locations: SYStem.CONFIG CONNECTOR [MIPI34
| MIPI20T].
If you use more than one CombiProbe cable (twin cable is no standard delivery) you need to specify which
one you want to use by SYStem.CONFIG DEBUGPORT [DebugCableA | DebugCableB]. The
CombiProbe can detect the location of the cable if only one is connected.
Preprocessor
Adaption for ARM ETM Preprocessor Mictor: See http://www.lauterbach.com/adetmmictor.html.
Adaption for ARM ETM Preprocessor MIPI-60: See http://www.lauterbach.com/adetmmipi60.html.
Adaption for ARM ETM Preprocessor HSSTP: See http://www.lauterbach.com/adetmhsstp.html.
©1989-2014 Lauterbach GmbH
ARM Debugger
146
Target Adaption
Support
Available Tools
AD6522
AD6526
AD6528
AD6529
AD6532
ADUC7020
ADUC7021
ADUC7022
ADUC7023
ADUC7024
ADUC7025
ADUC7026
ADUC7027
ADUC7028
ADUC7029
ADUC7030
ADUC7032
ADUC7033
ADUC7034
ADUC7036
ADUC7039
ADUC7060
ADUC7061
ADUC7121
ADUC7122
ADUC7124
ADUC7128
ADUC7129
ADUC7229
ARM710T
ARM710T-AMBA
YES
YES
YES
YES
YES
YES
YES
YES
YES
YES
YES
YES
YES
YES
YES
YES
YES
YES
YES
YES
YES
YES
YES
YES
YES
YES
YES
YES
YES
YES
YES YES
YES
YES
YES
YES
YES
YES
YES
YES
YES
YES
YES
YES
YES
YES
YES
YES
YES
YES
YES
YES
YES
YES
YES
YES
YES
YES
YES
YES
YES
YES YES
YES YES
INSTRUCTION
SIMULATOR
POWER
INTEGRATOR
ICD
TRACE
ICD
MONITOR
ICD
DEBUG
FIRE
ICE
CPU
ARM7
YES
YES
YES
YES
YES
YES
YES
YES
YES
YES
YES
YES
YES
YES
YES
YES
YES
YES
YES
YES
YES
YES
YES
YES
YES
YES
YES
YES
YES
YES
YES
©1989-2014 Lauterbach GmbH
ARM Debugger
147
Support
YES
YES
YES
YES
YES
YES
YES
YES
YES
YES
YES
INSTRUCTION
SIMULATOR
YES
YES
YES
YES
YES
YES
YES
YES
YES
YES
YES
YES
YES
YES
YES
YES
YES
YES
YES
YES
YES
YES
YES
YES
YES
YES
YES
YES
YES
YES
YES
YES
YES
YES
YES
YES
YES
YES
YES
YES
YES
POWER
INTEGRATOR
YES
YES
YES
YES
YES
YES
YES
YES
YES
YES
YES
YES
YES
YES
YES
YES
YES
YES
YES
YES
YES
YES
YES
YES
YES
YES
YES
YES
YES
YES
YES
YES
YES
YES
YES
YES
YES
YES
YES
YES
YES
ICD
TRACE
ICD
MONITOR
YES
ICD
DEBUG
FIRE
ICE
CPU
ARM720T
ARM720T-AMBA
ARM740T
ARM740T-AMBA
ARM7DI
ARM7TDMI
ARM7TDMI-AMBA
ARM7TDMI-S
AT75C220
AT75C310
AT75C320
AT76C501
AT76C502
AT76C502A
AT76C503
AT76C503A
AT76C510
AT76C551
AT76C901
AT78C1501
AT91CAP7E
AT91CAP7S250A
AT91CAP7S450A
AT91F40416
AT91F40816
AT91FR40162
AT91FR4042
AT91FR4081
AT91M40100
AT91M40400
AT91M40403
AT91M40800
AT91M40807
AT91M42800A
AT91M43300
AT91M55800A
AT91M63200
AT91R40008
AT91R40807
AT91RM3400
AT91SAM7A1
YES
YES
YES
YES
YES
YES
YES
YES
YES
YES
YES
YES
YES
YES
YES
YES
YES
YES
YES
YES
YES
YES
YES
YES
YES
YES
YES
YES
YES
YES
YES
YES
YES
YES
YES
YES
YES
YES
YES
YES
YES
©1989-2014 Lauterbach GmbH
ARM Debugger
148
Support
INSTRUCTION
SIMULATOR
YES
YES
YES
YES
YES
YES
YES
YES
YES
YES
YES
YES
YES
YES
YES
YES
YES
YES
YES
YES
YES
YES
YES
YES
YES YES
YES YES
YES
YES
YES
YES
YES
YES
YES
YES
YES
YES
YES
YES
YES
YES
YES
POWER
INTEGRATOR
ICD
MONITOR
YES
YES
YES
YES
YES
YES
YES
YES
YES
YES
YES
YES
YES
YES
YES
YES
YES
YES
YES
YES
YES
YES
YES
YES
YES
YES
YES
YES
YES
YES
YES
YES
YES
YES
YES
YES
YES
YES
YES
YES
YES
ICD
TRACE
ICD
DEBUG
FIRE
ICE
CPU
AT91SAM7A2
AT91SAM7A3
AT91SAM7L128
AT91SAM7L64
AT91SAM7S128
AT91SAM7S256
AT91SAM7S32
AT91SAM7S321
AT91SAM7S512
AT91SAM7S64
AT91SAM7SE256
AT91SAM7SE32
AT91SAM7SE512
AT91SAM7X128
AT91SAM7X256
AT91SAM7X512
AT91SAM7XC128
AT91SAM7XC256
AT91SAM7XC512
AT91SC321RC
BC6911
BERYLLIUM
BU7611AKU
CBC32XXA
CDC3207G
CDC3272G
CDC32XXG
CDMAX
CEA32XXA
CL-PS7110
CL-PS7111
CL-PS7500FE
CL-SH8665
CL-SH8668
CLARITY
CS22210
CS22220
CS22230
CS22250
CS22270
CS89712
YES
YES
YES
YES
YES
YES
YES
YES
YES
YES
YES
YES
YES
YES
YES
YES
YES
YES
YES
YES
YES
YES
YES
YES
YES
YES
YES
YES
YES
YES
YES
YES
YES
YES
YES
YES
YES
YES
YES
YES
YES
©1989-2014 Lauterbach GmbH
ARM Debugger
149
Support
INSTRUCTION
SIMULATOR
YES
YES
YES
YES
YES
YES
YES
YES
YES
YES
YES
YES
YES
YES
YES
YES
YES
YES
YES
YES
YES
YES
YES
YES
YES
YES
YES
YES
YES
YES
YES
YES
YES
YES
YES
YES
YES
YES
YES
YES
YES
POWER
INTEGRATOR
ICD
MONITOR
YES
YES
YES
YES
YES
YES
YES
YES
YES
YES
YES
YES
YES
YES
YES
YES
YES
YES
YES
YES
YES
YES
YES
YES
YES
YES
YES
YES
YES
YES
YES
YES
YES
YES
YES
YES
YES
YES
YES
YES
YES
ICD
TRACE
ICD
DEBUG
FIRE
ICE
CPU
CSM5000
CSM5200
CX81210
CX81400
D5205
D5313
D5314
EASYCAN1
EASYCAN2
EASYCAN4
EP7209
EP7211
EP7212
EP7309
EP7311
EP7312
EP7339
EP7407
GMS30C7201
GP4020
HELIUM_100
HELIUM_200
HELIUM_210
HMS30C7202
HMS31C2816
HMS39C70512
HMS39C7092
IXP220
IXP225
KS17C40025
KS17F80013
KS32C61100
KS32P6632
L64324
L7200
L7205
L7210
LH75400
LH75401
LH75410
LH75411
YES
YES
YES
YES
YES
YES
YES
YES
YES
YES
YES
YES
YES
YES
YES
YES
YES
YES
YES
YES
YES
YES
YES
YES
YES
YES
YES
YES
YES
YES
YES
YES
YES
YES
YES
YES
YES
YES
YES
YES
YES
©1989-2014 Lauterbach GmbH
ARM Debugger
150
Support
YES
YES
YES
YES
YES
YES
YES
YES
YES
YES
YES
YES
YES
YES
YES
YES
YES
YES
YES
YES
YES
YES
YES
YES
YES
YES
YES
YES
YES
YES
YES
YES
YES
YES
YES
INSTRUCTION
SIMULATOR
YES
YES
YES
YES
YES
YES
YES
YES
YES
YES
YES
YES
YES
YES
YES
YES
YES
YES
YES
YES
YES
YES
YES
YES
YES
YES
YES
YES
YES
YES
YES
YES
YES
YES
YES
YES
YES
YES
YES
YES
YES
POWER
INTEGRATOR
ICD
MONITOR
YES
YES
YES
YES
YES
YES
YES
YES
YES
YES
YES
YES
YES
YES
YES
YES
YES
YES
YES
YES
YES
YES
YES
YES
YES
YES
YES
YES
YES
YES
YES
YES
YES
YES
YES
YES
YES
YES
YES
YES
YES
ICD
TRACE
ICD
DEBUG
FIRE
ICE
CPU
LH77790
LH79520
LITHIUM
LOGIC_CBP3.0
LOGIC_CBP4.0
LOGIC_L64324
LPC2101
LPC2102
LPC2103
LPC2104
LPC2105
LPC2106
LPC2109
LPC2112
LPC2114
LPC2119
LPC2124
LPC2129
LPC2131
LPC2131/01
LPC2132
LPC2132/01
LPC2134
LPC2134/01
LPC2136
LPC2136/01
LPC2138
LPC2138/01
LPC2141
LPC2142
LPC2144
LPC2146
LPC2148
LPC2194
LPC2210
LPC2212
LPC2214
LPC2220
LPC2290
LPC2292
LPC2294
YES
YES
YES
YES
YES
YES
YES
YES
YES
YES
YES
YES
YES
YES
YES
YES
YES
YES
YES
YES
YES
YES
YES
YES
YES
YES
YES
YES
YES
YES
YES
YES
YES
YES
YES
YES
YES
YES
YES
YES
YES
©1989-2014 Lauterbach GmbH
ARM Debugger
151
Support
YES
YES
YES
YES
YES
YES
YES
YES
YES
YES
YES
YES
YES
YES
YES
YES
INSTRUCTION
SIMULATOR
YES
YES
YES
YES
YES
YES
YES
YES
YES
YES
YES
YES
YES
YES
YES
YES
YES
YES
YES
YES
YES
YES
YES
YES
YES
YES
YES
YES
YES
YES
YES
YES
YES
YES
YES
YES
YES
YES
YES
YES
YES
POWER
INTEGRATOR
ICD
MONITOR
YES
YES
YES
YES
YES
YES
YES
YES
YES
YES
YES
YES
YES
YES
YES
YES
YES
YES
YES
YES
YES
YES
YES
YES
YES
YES
YES
YES
YES
YES
YES
YES
YES
YES
YES
YES
YES
YES
YES
YES
YES
ICD
TRACE
ICD
DEBUG
FIRE
ICE
CPU
LPC2364
LPC2365
LPC2366
LPC2367
LPC2368
LPC2377
LPC2378
LPC2387
LPC2388
LPC2458
LPC2460
LPC2468
LPC2470
LPC2478
LPC2880
LPC2888
M4641
MAC7101
MAC7111
MAC7116
MAC7121
MAC7131
MAC7141
MKY-82A
MKY-85
ML670100
ML671000
ML674000
ML674001
ML674080
ML675001
ML675200
ML675300
ML67Q2300
ML67Q2301
ML67Q4002
ML67Q4003
ML67Q4100
ML67Q5002
ML67Q5003
ML67Q5200
YES
YES
YES
YES
YES
YES
YES
YES
YES
YES
YES
YES
YES
YES
YES
YES
YES
YES
YES
YES
YES
YES
YES
YES
YES
YES
YES
YES
YES
YES
YES
YES
YES
YES
YES
YES
YES
YES
YES
YES
YES
©1989-2014 Lauterbach GmbH
ARM Debugger
152
Support
YES
YES
YES
YES
YES
YES
YES
INSTRUCTION
SIMULATOR
YES
YES
YES
YES
YES
YES
YES
YES
YES
YES
YES
YES
YES
YES
YES
YES
YES
YES
YES
YES
YES
YES
YES
YES
YES
YES
YES
YES
YES
YES
YES
YES
YES
YES
YES
YES
YES
YES
YES
YES
YES
POWER
INTEGRATOR
ICD
MONITOR
YES
YES
YES
YES
YES
YES
YES
YES
YES
YES
YES
YES
YES
YES
YES
YES
YES
YES
YES
YES
YES
YES
YES
YES
YES
YES
YES
YES
YES
YES
YES
YES
YES
YES
YES
YES
YES
YES
YES
YES
YES
ICD
TRACE
ICD
DEBUG
FIRE
ICE
CPU
ML67Q5300
ML70511LA
ML7051LA
MN1A7T0200
MODEM
MSM3000
MSM3100
MSM3300
MSM5000
MSM5100
MSM5105
MSM5200
MSM5500
MSM6000
MSM6050
MSM6200
MSM6600
MSP1000
MT1020A
MT92101
MTC-20276
MTC-20277
MTC-30585
MTK-20141
MTK-20280
MTK-20285
NET+15
NET+20
NET+40
NET+50
NITROGEN
NS7520
OMAPV2230
PBM_990_90
PCC-ISES
PCD80703
PCD80705
PCD80708
PCD80715
PCD80716
PCD80718
YES
YES
YES
YES
YES
YES
YES
YES
YES
YES
YES
YES
YES
YES
YES
YES
YES
YES
YES
YES
YES
YES
YES
YES
YES
YES
YES
YES
YES
YES
YES
YES
YES
YES
YES
YES
YES
YES
YES
YES
YES
©1989-2014 Lauterbach GmbH
ARM Debugger
153
Support
YES
YES
YES
YES
YES
INSTRUCTION
SIMULATOR
YES
YES
YES
YES
YES
YES
YES
YES
YES
YES
YES
YES
YES
YES
YES
YES
YES
YES
YES
YES
YES
YES
YES
YES
YES
YES
YES
YES
YES
YES
YES
YES
YES
YES
YES
YES
YES
YES
YES
YES
YES
POWER
INTEGRATOR
ICD
MONITOR
YES
YES
YES
YES
YES
YES
YES
YES
YES
YES
YES
YES
YES
YES
YES
YES
YES
YES
YES
YES
YES
YES
YES
YES
YES
YES
YES
YES
YES
YES
YES
YES
YES
YES
YES
YES
YES
YES
YES
YES
YES
ICD
TRACE
ICD
DEBUG
FIRE
ICE
CPU
PCD80720
PCD80721
PCD80725
PCD80727
PCD80728
PCF26002
PCF26003
PCF87750
PCI2010
PCI3610
PCI3620
PCI3700
PCI3800
PCI5110
PCI9501
PH21101
PMB7754
PS7500FE
PUC3030A
PUC303XA
S3C3400A
S3C3400X
S3C3410X
S3C44A0A
S3C44B0X
S3C4510B
S3C4520A
S3C4530A
S3C4610D
S3C4620D
S3C4640X
S3C4650D
S3C46C0
S3C46M0X
S3C4909A
S3C49F9X
S3F401F
S3F441FX
S3F460H
S5N8946
S5N8947
YES
YES
YES
YES
YES
YES
YES
YES
YES
YES
YES
YES
YES
YES
YES
YES
YES
YES
YES
YES
YES
YES
YES
YES
YES
YES
YES
YES
YES
YES
YES
YES
YES
YES
YES
YES
YES
YES
YES
YES
YES
©1989-2014 Lauterbach GmbH
ARM Debugger
154
Support
YES
YES
YES
YES
YES
INSTRUCTION
SIMULATOR
YES
YES
YES
YES
YES
YES
YES
YES
YES
YES
YES
YES
YES
YES
YES
YES
YES
YES
YES
YES
YES
YES
YES
YES
YES
YES
YES
YES
YES
YES
YES
YES
YES
YES
YES
YES
YES
YES
YES
YES
YES
POWER
INTEGRATOR
ICD
MONITOR
YES
YES
YES
YES
YES
YES
YES
YES
YES
YES
YES
YES
YES
YES
YES
YES
YES
YES
YES
YES
YES
YES
YES
YES
YES
YES
YES
YES
YES
YES
YES
YES
YES
YES
YES
YES
YES
YES
YES
YES
YES
ICD
TRACE
ICD
DEBUG
FIRE
ICE
CPU
SC100
SC110
SIRFSTARII
SJA2020
SOCLITE+
ST30F7XXA
ST30F7XXC
ST30F7XXZ
STA2051
STR710
STR711
STR712
STR715
STR720
STR730
STR731
STR735
STR736
STR750FV
STR751FR
STR752FR
STR755FR
STR755FV
STW2400
TA7S05
TA7S12
TA7S20
TA7S32
TMS320VC5470
TMS320VC5471
TMS470PVF241
TMS470PVF344
TMS470Q
TMS470R1A128
TMS470R1A256
TMS470R1A288
TMS470R1A384
TMS470R1A64
TMS470R1B1M
TMS470R1B512
TMS470R1B768
YES
YES
YES
YES
YES
YES
YES
YES
YES
YES
YES
YES
YES
YES
YES
YES
YES
YES
YES
YES
YES
YES
YES
YES
YES
YES
YES
YES
YES
YES
YES
YES
YES
YES
YES
YES
YES
YES
YES
YES
YES
©1989-2014 Lauterbach GmbH
ARM Debugger
155
Support
INSTRUCTION
SIMULATOR
YES
YES
YES
YES
YES
YES
YES
YES
YES
YES
YES
YES
YES
YES
YES
YES
YES
YES
YES
YES
YES
YES
YES
YES
YES
YES
YES
YES
YES
YES
YES
YES
YES
YES
YES
YES
YES
YES
YES
YES
YES
POWER
INTEGRATOR
ICD
MONITOR
YES
YES
YES
YES
YES
YES
YES
YES
YES
YES
YES
YES
YES
YES
YES
YES
YES
YES
YES
YES
YES
YES
YES
YES
YES
YES
YES
YES
YES
YES
YES
YES
YES
YES
YES
YES
YES
YES
YES
YES
YES
ICD
TRACE
ICD
DEBUG
FIRE
ICE
CPU
TMS470R1VC336A
TMS470R1VC338
TMS470R1VC346A
TMS470R1VC348
TMS470R1VC688
TMS470R1VF288
TMS470R1VF334A
TMS470R1VF336
TMS470R1VF336A
TMS470R1VF338
TMS470R1VF346
TMS470R1VF346A
TMS470R1VF348
TMS470R1VF356A
TMS470R1VF37A
TMS470R1VF448
TMS470R1VF45A
TMS470R1VF45AA
TMS470R1VF45B
TMS470R1VF45BA
TMS470R1VF478
TMS470R1VF48B
TMS470R1VF48C
TMS470R1VF4B8
TMS470R1VF55B
TMS470R1VF55BA
TMS470R1VF67A
TMS470R1VF688
TMS470R1VF689
TMS470R1VF76B
TMS470R1VF7AC
UPD65977
UPLAT_CORE
VCS94250
VMS747
VWS22100
VWS22110
VWS23112
VWS23201
VWS23202
VWS26001
YES
YES
YES
YES
YES
YES
YES
YES
YES
YES
YES
YES
YES
YES
YES
YES
YES
YES
YES
YES
YES
YES
YES
YES
YES
YES
YES
YES
YES
YES
YES
YES
YES
YES
YES
YES
YES
YES
YES
YES
YES
©1989-2014 Lauterbach GmbH
ARM Debugger
156
Support
YES
YES
YES
YES
INSTRUCTION
SIMULATOR
YES
YES
YES
YES
YES
YES
YES
YES
YES
YES
YES
YES
YES
YES
YES
YES
YES
YES
YES
YES
YES
YES
YES
YES
YES
YES
YES
YES
YES
YES
YES
YES
YES
YES
YES
YES
POWER
INTEGRATOR
ICD
MONITOR
YES
YES
YES
YES
YES
YES
YES
YES
YES
YES
YES
YES
YES
YES
YES
YES
YES
YES
YES
YES
YES
YES
YES
YES
YES
YES
YES
YES
YES
YES
YES
YES
YES
YES
YES
YES
ICD
TRACE
ICD
DEBUG
88AP128
88AP162
88AP166
88AP168
88E6208
88E6218
88F5082
88F5180N
88F5181
88F5181L
88F5182
88F5281
88F6082
88F6180
88F6183
88F6183L
88F6190
88F6192
88F6280
88F6281
88F6282
88F6283
88F6321
88F6322
88F6323
88FR101
88FR102
88FR111
88FR131
88FR301
88FR321
88FR331
88FR521
88FR531
88FR571
88I6745
FIRE
ICE
CPU
ARM9
YES
YES
YES
YES
YES
YES
YES
YES
YES
YES
YES
YES
YES
YES
YES
YES
YES
YES
YES
YES
YES
YES
YES
YES
YES
YES
YES
YES
YES
YES
YES
YES
YES
YES
YES
YES
©1989-2014 Lauterbach GmbH
ARM Debugger
157
Support
YES
YES
YES
YES
YES
YES
YES
YES
YES
YES
YES
YES
YES
YES
YES
INSTRUCTION
SIMULATOR
YES
YES
YES
YES
YES
YES
YES
YES
YES
YES
YES
YES
YES
YES
YES
YES
YES
YES
YES
YES
YES
YES
YES
YES
YES
YES
YES
YES
YES
YES
YES
YES
YES
YES
YES
YES
YES
YES
YES
YES
YES
POWER
INTEGRATOR
ICD
MONITOR
YES
YES
YES
YES
YES
YES
YES
YES
YES
YES
YES
YES
YES
YES
YES
YES
YES
YES
YES
YES
YES
YES
YES
YES
YES
YES
YES
YES
YES
YES
YES
YES
YES
YES
YES
YES
YES
YES
YES
YES
YES
ICD
TRACE
ICD
DEBUG
FIRE
ICE
CPU
AAEC-2000
AM1707
AM1808
AM1810
AM3872
AM3874
AM3892
AM3894
ARM7EJ-S
ARM915T
ARM920T
ARM922T
ARM926EJ-S
ARM940T
ARM946E-S
ARM966E-S
ARM968E-S
ARM9E-S
ARM9EJ-S
ARM9TDMI
AT91CAP9E
AT91CAP9EC
AT91CAP9S250A
AT91CAP9S500A
AT91CAP9SC250A
AT91CAP9SC500A
AT91RM9200
AT91SAM9260
AT91SAM9261
AT91SAM9263
AT91SAM9G10
AT91SAM9G20
AT91SAM9G45
AT91SAM9M10
AT91SAM9R64
AT91SAM9RL64
AT91SAM9XE128
AT91SAM9XE256
AT91SAM9XE512
CN9414
CX22490
YES
YES
YES
YES
YES
YES
YES
YES
YES
YES
YES
YES
YES
YES
YES
YES
YES
YES
YES
YES
YES
YES
YES
YES
YES
YES
YES
YES
YES
YES
YES
YES
YES
YES
YES
YES
YES
YES
YES
YES
YES
©1989-2014 Lauterbach GmbH
ARM Debugger
158
Support
INSTRUCTION
SIMULATOR
YES
YES
YES
YES
YES YES
YES
YES
YES
YES
YES
YES
YES
YES
YES
YES
YES
YES
YES
YES
YES
YES
YES
YES
YES
YES
YES
YES
YES
YES
YES
YES
YES
YES
YES
YES
YES
YES
YES
YES
YES
YES
POWER
INTEGRATOR
ICD
MONITOR
YES
YES
YES
YES
YES
YES
YES
YES
YES
YES
YES
YES
YES
YES
YES
YES
YES
YES
YES
YES
YES
YES
YES
YES
YES
YES
YES
YES
YES
YES
YES
YES
YES
YES
YES
YES
YES
YES
YES
YES
YES
ICD
TRACE
ICD
DEBUG
FIRE
ICE
CPU
CX22491
CX22492
CX22496
CX82100
DB5500
DIGICOLOR-OA980
DRX401
DRX402
DRX403
DRX404
DRX406
DRX407
DRX414
DRX416
DRX440
DRX442
DRX443
DRX444
DRX445
DRX446
DRX447
DRX449
DRX453
DRX457
DRX459
ECONA_CNS1101
ECONA_CNS1102
ECONA_CNS1104
ECONA_CNS1105
ECONA_CNS1109
ECONA_CNS1202
ECONA_CNS1205
ECONA_CNS2131
ECONA_CNS2132
ECONA_CNS2133
ECONA_CNS2181
ECONA_CNS2182X
EP9301
EP9307
EP9312
EP9315
YES
YES
YES
YES
YES
YES
YES
YES
YES
YES
YES
YES
YES
YES
YES
YES
YES
YES
YES
YES
YES
YES
YES
YES
YES
YES
YES
YES
YES
YES
YES
YES
YES
YES
YES
YES
YES
YES
YES
YES
YES
©1989-2014 Lauterbach GmbH
ARM Debugger
159
Support
YES
YES
YES
YES
YES
YES
YES
YES
YES
YES
YES
YES
YES
YES
YES
INSTRUCTION
SIMULATOR
YES
YES
YES
YES
YES
YES
YES
YES
YES
YES
YES
YES
YES
YES
YES
YES
YES
YES
YES
YES
YES
YES
YES
YES
YES
YES
YES
YES
YES
YES
YES
YES
YES
YES
YES
YES
YES
YES
YES
YES
YES
POWER
INTEGRATOR
ICD
MONITOR
YES
YES
YES
YES
YES
YES
YES
YES
YES
YES
YES
YES
YES
YES
YES
YES
YES
YES
YES
YES
YES
YES
YES
YES
YES
YES
YES
YES
YES
YES
YES
YES
YES
YES
YES
YES
YES
YES
YES
YES
YES
ICD
TRACE
ICD
DEBUG
FIRE
ICE
CPU
EPXA1
EPXA10
EPXA4
ERTEC200
ERTEC400
FA526
FA606TE
FA626
FA626TE
HELIUM_500
IMX23
IMX25
IMX27
IMX27L
IMX280
IMX281
IMX283
IMX285
IMX286
IMX287
INFOSTREAM
KIRA100
LH7A400
LH7A404
LH7A405
LPC2915
LPC2917
LPC2917/01
LPC2919
LPC2919/01
LPC2921
LPC2923
LPC2925
LPC2926
LPC2930
LPC2939
LPC3000
LPC3130
LPC3131
LPC3141
LPC3143
YES
YES
YES
YES
YES
YES
YES
YES
YES
YES
YES
YES
YES
YES
YES
YES
YES
YES
YES
YES
YES
YES
YES
YES
YES
YES
YES
YES
YES
YES
YES
YES
YES
YES
YES
YES
YES
YES
YES
YES
YES
©1989-2014 Lauterbach GmbH
ARM Debugger
160
Support
YES
YES
YES
YES
YES
YES
YES
YES
YES
YES
YES
YES
YES
YES
YES
YES
YES
YES
YES
INSTRUCTION
SIMULATOR
YES
YES
YES
YES
YES
YES
YES
YES
YES
YES
YES
YES
YES
YES
YES
YES
YES
YES
YES
YES
YES
YES
YES
YES
YES
YES
YES
YES
YES
YES
YES
YES
YES
YES
YES
YES
YES
YES
YES
YES
YES
POWER
INTEGRATOR
ICD
MONITOR
YES
YES
YES
YES
YES
YES
YES
YES
YES
YES
YES
YES
YES
YES
YES
YES
YES
YES
YES
YES
YES
YES
YES
YES
YES
YES
YES
YES
YES
YES
YES
YES
YES
YES
YES
YES
YES
YES
YES
YES
YES
ICD
TRACE
ICD
DEBUG
FIRE
ICE
CPU
LPC3152
LPC3154
LPC3180
LPC3220
LPC3230
LPC3240
LPC3250
MB86R01
MB86R02
MB86R03
MC9328MX1
MC9328MX21
MC9328MX21S
MC9328MXL
MC9328MXS
ML67Q2003
MSM6100_3G
MSM6250
MSM6300
MSM6500
MSM7xxx
MV76100
MV78100
MV78200
NETX100
NETX50
NETX500
NETX51
NEXPERIA
NS9210
NS9215
NS9360
NS9750
NS9775
OMAP-L137
OMAP-L138
OMAP1510
OMAP1610
OMAP1611
OMAP1612
OMAP1710
YES
YES
YES
YES
YES
YES
YES
YES
YES
YES
YES
YES
YES
YES
YES
YES
YES
YES
YES
YES
YES
YES
YES
YES
YES
YES
YES
YES
YES
YES
YES
YES
YES
YES
YES
YES
YES
YES
YES
YES
YES
©1989-2014 Lauterbach GmbH
ARM Debugger
161
Support
YES
YES
YES
YES
YES
YES
YES
YES
YES
YES
YES
YES
YES
YES
YES
YES
YES
YES
YES
YES
YES
YES
YES
YES
YES
YES
YES
YES
INSTRUCTION
SIMULATOR
YES
YES
YES
YES
YES
YES
YES
YES
YES
YES
YES
YES
YES
YES
YES
YES
YES
YES
YES
YES
YES
YES
YES
YES
YES
YES
YES
YES
YES
YES
YES
YES
YES
YES
YES
YES
YES
YES
YES
YES
YES
POWER
INTEGRATOR
ICD
MONITOR
YES
YES
YES
YES
YES
YES
YES
YES
YES
YES
YES
YES
YES
YES
YES
YES
YES
YES
YES
YES
YES
YES
YES
YES
YES
YES
YES
YES
YES
YES
YES
YES
YES
YES
YES
YES
YES
YES
YES
YES
YES
ICD
TRACE
ICD
DEBUG
FIRE
ICE
CPU
OMAP310
OMAP331
OMAP3430
OMAP3440
OMAP3630
OMAP3640
OMAP4430
OMAP4460
OMAP4470
OMAP5430
OMAP5432
OMAP5910
OMAP5912
OMAP710
OMAP730
OMAP732
OMAP733
OMAP750
OMAP850
OMAPV1030
OMAPV1035
OMAPV2230
PMB8870
PMB8875
PMB8876
PMB8877
PMB8878
PMB8888
PXA910
PXA920
S3C2400X
S3C2410
S3C2410X
S3C2416
S3C2440A
S3C2442B
S3C2443X
S3C2450
S3C2500A
S3C2510
S3C2800X
YES
YES
YES
YES
YES
YES
YES
YES
YES
YES
YES
YES
YES
YES
YES
YES
YES
YES
YES
YES
YES
YES
YES
YES
YES
YES
YES
YES
YES
YES
YES
YES
YES
YES
YES
YES
YES
YES
YES
YES
YES
©1989-2014 Lauterbach GmbH
ARM Debugger
162
Support
YES
YES
YES
YES
YES
YES
YES
YES
YES
YES
YES
YES
YES
YES
YES
YES
YES
YES
YES
YES
YES
YES
YES
YES
YES
YES
YES
YES
YES
INSTRUCTION
SIMULATOR
YES
YES
YES
YES
YES
YES
YES
YES
YES
YES
YES
YES
YES
YES
YES
YES
YES
YES
YES
YES
YES
YES
YES
YES
YES
YES
YES
YES
YES
YES
YES
YES
YES
YES
YES
YES
YES
YES
YES
YES
YES
POWER
INTEGRATOR
ICD
MONITOR
YES
YES
YES
YES
YES
YES
YES
YES
YES
YES
YES
YES
YES
YES
YES
YES
YES
YES
YES
YES
YES
YES
YES
YES
YES
YES
YES
YES
YES
YES
YES
YES
YES
YES
YES
YES
YES
YES
YES
YES
YES
ICD
TRACE
ICD
DEBUG
FIRE
ICE
CPU
SC200
SC210
SCORPIO
SP2503
SP2506
SP2512
SPEAR300
SPEAR310
SPEAR320
SPEAR320S
SPEAR600
STN8810
STN8815
STN8820
STR910FAM32
STR910FAW32
STR910FAZ32
STR911FAM42
STR911FAM44
STR911FAM46
STR911FAM47
STR911FAW42
STR911FAW44
STR911FAW46
STR911FAW47
STR912FAW42
STR912FAW44
STR912FAW46
STR912FAW47
STR912FAZ42
STR912FAZ44
STR912FAZ46
STR912FAZ47
T6TC1XB-0001
T8300
T8302
TMPA900
TMPA901
TMPA910
TMPA911
TMPA912
YES
YES
YES
YES
YES
YES
YES
YES
YES
YES
YES
YES
YES
YES
YES
YES
YES
YES
YES
YES
YES
YES
YES
YES
YES
YES
YES
YES
YES
YES
YES
YES
YES
YES
YES
YES
YES
YES
YES
YES
YES
©1989-2014 Lauterbach GmbH
ARM Debugger
163
Support
INSTRUCTION
SIMULATOR
YES
YES
YES
YES
YES
YES
YES
YES
YES
YES
YES
YES
YES
YES
YES
YES
YES
YES
YES
YES
YES
POWER
INTEGRATOR
ICD
MONITOR
YES
YES
YES
YES
YES
YES
YES
YES
YES
YES
YES
YES
YES
YES
YES
YES
YES
YES
YES
YES
YES
ICD
TRACE
ICD
DEBUG
FIRE
ICE
CPU
TMS320C6A8143
TMS320C6A8147
TMS320C6A8148
TMS320C6A8167
TMS320C6A8168
TMS320DA828
TMS320DA830
TMS320DM335
TMS320DM355
TMS320DM357
TMS320DM365
TMS320DM6441
TMS320DM6443
TMS320DM6446
TMS320DM6467
TMS320DM8147
TMS320DM8148
TMS320DM8165
TMS320DM8166
TMS320DM8167
TMS320DM8168
YES
YES
YES
YES
YES
YES
YES
YES
YES
YES
YES
YES
YES
YES
YES
YES
YES
YES
YES
YES
YES
©1989-2014 Lauterbach GmbH
ARM Debugger
164
Support
ARM1020E
ARM1022E
ARM1026EJ-S
YES YES YES
YES YES YES
YES YES YES
INSTRUCTION
SIMULATOR
POWER
INTEGRATOR
ICD
TRACE
ICD
MONITOR
ICD
DEBUG
FIRE
ICE
CPU
ARM10
YES
YES
YES
YES
YES
YES
YES
YES
YES
YES
YES
YES
YES
YES
YES
YES
YES
YES
INSTRUCTION
SIMULATOR
YES
YES
YES
YES
YES
YES
YES
YES
YES
YES
YES
YES
YES
YES
YES
YES
YES
YES
YES
YES
YES
YES
YES
YES
POWER
INTEGRATOR
ICD
MONITOR
YES
YES
YES
YES
YES
YES
YES
YES
YES
YES
YES
YES
YES
YES
YES
YES
YES
YES
YES
YES
YES
YES
YES
YES
ICD
TRACE
ICD
DEBUG
88SV581X-V6
ARM1136J-S
ARM1136JF-S
ARM1156T2-S
ARM1156T2F-S
ARM1176JZ-S
ARM1176JZF-S
ARM11MPCORE
BCM2835
IMX31
IMX35
IMX351
IMX353
IMX355
IMX356
IMX357
IMX37
MB86H60
MSM7xxx
MV78130V6
MV78160V6
MV78230V6
MV78260V6
MV78460V6
FIRE
ICE
CPU
ARM11
YES
YES
YES
YES
YES
YES
YES
YES
YES
YES
YES
YES
YES
YES
YES
YES
YES
YES
YES
YES
YES
YES
YES
YES
©1989-2014 Lauterbach GmbH
ARM Debugger
165
Support
YES
YES
YES
YES
YES
YES
YES
YES
YES
YES
YES
YES
YES
YES
INSTRUCTION
SIMULATOR
YES
YES
YES
YES
YES
YES
YES
YES
YES
YES
YES
YES
YES
YES
YES
YES
YES
YES
YES
POWER
INTEGRATOR
ICD
MONITOR
YES
YES
YES
YES
YES
YES
YES
YES
YES
YES
YES
YES
YES
YES
YES
YES
YES
YES
YES
ICD
TRACE
ICD
DEBUG
FIRE
ICE
CPU
MXC91231
MXC91321
MXC91323
MXC91331
OMAP2420
OMAP2430
OMAP2431
OMAPV2230
S3C6400
S3C6410
SP2603
SP2606
SP2612
SP2704
SP2716
STA2064
STA2065
STA2164
STA2165
YES
YES
YES
YES
YES
YES
YES
YES
YES
YES
YES
YES
YES
YES
YES
YES
YES
YES
YES
©1989-2014 Lauterbach GmbH
ARM Debugger
166
Support
YES
YES
YES
YES
YES
YES
YES
YES
YES
YES
YES
YES
YES
YES
YES
YES
YES
YES
YES
YES
YES
YES
YES
INSTRUCTION
SIMULATOR
YES
YES
YES
YES
YES
YES
YES
YES
YES
YES
YES
YES
YES
YES
YES
YES
YES
YES
YES
YES
YES
YES
YES
YES
YES
YES
YES
YES
YES
YES
YES
YES
YES
YES
YES
YES
YES
YES
YES
POWER
INTEGRATOR
ICD
MONITOR
YES
YES
YES
YES
YES
YES
YES
YES
YES
YES
YES
YES
YES
YES
YES
YES
YES
YES
YES
YES
YES
YES
YES
YES
YES
YES
YES
YES
YES
YES
YES
YES
YES
YES
YES
YES
YES
YES
YES
ICD
TRACE
ICD
DEBUG
66AK2H06
66AK2H12
A9500
A9540
AM3352
AM3354
AM3356
AM3357
AM3358
AM3359
AM3505
AM3517
AM3703
AM3715
AM3872
AM3874
AM3892
AM3894
ATSAMA5D31
ATSAMA5D33
ATSAMA5D34
ATSAMA5D35
ATSAMA5D36
AXM5516
BCM4708
BCM47081
CORTEX-A12
CORTEX-A12MPCORE
CORTEX-A15
CORTEX-A15MPCORE
CORTEX-A5
CORTEX-A5MPCORE
CORTEX-A7
CORTEX-A7MPCORE
CORTEX-A8
CORTEX-A9
CORTEX-A9MPCORE
CORTEX-R4
CORTEX-R4F
FIRE
ICE
CPU
Cortex-A/-R
YES
YES
YES
YES
YES
YES
YES
YES
YES
YES
YES
YES
YES
YES
YES
YES
YES
YES
YES
YES
YES
YES
YES
YES
YES
YES
YES
YES
YES
YES
YES
YES
YES
YES
YES
YES
YES
YES
YES
©1989-2014 Lauterbach GmbH
ARM Debugger
167
Support
YES
YES
YES
YES
YES
YES
YES
YES
YES
YES
YES
YES
YES
YES
YES
YES
YES
YES
YES
YES
YES
YES
YES
YES
YES
YES
YES
YES
YES
YES
YES
YES
YES
YES
YES
YES
YES
YES
YES
YES
INSTRUCTION
SIMULATOR
YES
YES
YES
YES
YES
YES
YES
YES
YES
YES
YES
YES
YES
YES
YES
YES
YES
YES
YES
YES
YES
YES
YES
YES
YES
YES
YES
YES
YES
YES
YES
YES
YES
YES
YES
YES
YES
YES
YES
YES
YES
POWER
INTEGRATOR
ICD
MONITOR
YES
YES
YES
YES
YES
YES
YES
YES
YES
YES
YES
YES
YES
YES
YES
YES
YES
YES
YES
YES
YES
YES
YES
YES
YES
YES
YES
YES
YES
YES
YES
YES
YES
YES
YES
YES
YES
YES
YES
YES
YES
ICD
TRACE
ICD
DEBUG
FIRE
ICE
CPU
CORTEX-R5
CORTEX-R5F
CORTEX-R5MPCORE
CORTEX-R7
CORTEX-R7F
CORTEX-R7MPCORE
CS7522
CS7542
CYCLONEVSOC
DB5500
DB8500
DB8540
EXYNOS4212
EXYNOS4412
EXYNOS5250
IMX502
IMX503
IMX507
IMX508
IMX512
IMX513
IMX514
IMX515
IMX516
IMX534
IMX535
IMX536
IMX537
IMX538
IMX6DUAL
IMX6QUAD
IMX6SOLO
KRAIT
M7400
MB86R11
MB86R11F
MB86R12
MB9DF125
MB9DF126
MB9EF126
MV78130V7
YES
YES
YES
YES
YES
YES
YES
YES
YES
YES
YES
YES
YES
YES
YES
YES
YES
YES
YES
YES
YES
YES
YES
YES
YES
YES
YES
YES
YES
YES
YES
YES
YES
YES
YES
YES
YES
YES
YES
YES
YES
©1989-2014 Lauterbach GmbH
ARM Debugger
168
Support
YES
YES
YES
YES
YES
YES
YES
YES
YES
YES
YES
YES
YES
YES
YES
YES
YES
YES
YES
YES
YES
YES
YES
YES
INSTRUCTION
SIMULATOR
YES
YES
YES
YES
YES
YES
YES
YES
YES
YES
YES
YES
YES
YES
YES
YES
YES
YES
YES
YES
YES
YES
YES
YES
YES
YES
YES
YES
YES
YES
YES
YES
YES
YES
YES
YES
YES
YES
YES
YES
YES
POWER
INTEGRATOR
ICD
MONITOR
YES
YES
YES
YES
YES
YES
YES
YES
YES
YES
YES
YES
YES
YES
YES
YES
YES
YES
YES
YES
YES
YES
YES
YES
YES
YES
YES
YES
YES
YES
YES
YES
YES
YES
YES
YES
YES
YES
YES
YES
YES
ICD
TRACE
ICD
DEBUG
FIRE
ICE
CPU
MV78160V7
MV78230V7
MV78260V7
MV78460V7
OMAP3410
OMAP3420
OMAP3430
OMAP3440
OMAP3503
OMAP3515
OMAP3525
OMAP3530
OMAP3610
OMAP3620
OMAP3630
OMAP3640
OMAP4430
OMAP4460
OMAP4470
OMAP5430
OMAP5432
QSD8250
QSD8650
R7S721001
R7S721021
R8A77790
R8A7790X
R8A7791
RM42L432
RM46L430-PGE
RM46L430-ZWT
RM46L440-PGE
RM46L440-ZWT
RM46L450-PGE
RM46L450-ZWT
RM46L830-PGE
RM46L830-ZWT
RM46L840-ZWT
RM46L850-PGE
RM46L850-ZWT
RM46L852-PGE
YES
YES
YES
YES
YES
YES
YES
YES
YES
YES
YES
YES
YES
YES
YES
YES
YES
YES
YES
YES
YES
YES
YES
YES
YES
YES
YES
YES
YES
YES
YES
YES
YES
YES
YES
YES
YES
YES
YES
YES
YES
©1989-2014 Lauterbach GmbH
ARM Debugger
169
Support
YES
YES
YES
YES
YES
YES
YES
YES
YES
YES
YES
YES
YES
YES
YES
YES
YES
YES
YES
YES
INSTRUCTION
SIMULATOR
YES
YES
YES
YES
YES
YES
YES
YES
YES
YES
YES
YES
YES
YES
YES
YES
YES
YES
YES
YES
YES
YES
YES
YES
YES
YES
YES
YES
YES
YES
YES
YES
YES
YES
YES
YES
YES
YES
YES
YES
YES
POWER
INTEGRATOR
ICD
MONITOR
YES
YES
YES
YES
YES
YES
YES
YES
YES
YES
YES
YES
YES
YES
YES
YES
YES
YES
YES
YES
YES
YES
YES
YES
YES
YES
YES
YES
YES
YES
YES
YES
YES
YES
YES
YES
YES
YES
YES
YES
YES
ICD
TRACE
ICD
DEBUG
FIRE
ICE
CPU
RM46L852-ZWT
RM48L530-PGE
RM48L530-ZWT
RM48L540-PGE
RM48L540-ZWT
RM48L550-PGE
RM48L550-ZWT
RM48L730-PGE
RM48L730-ZWT
RM48L740-PGE
RM48L740-ZWT
RM48L750-PGE
RM48L750-ZWT
RM48L930-PGE
RM48L930-ZWT
RM48L940-PGE
RM48L940-ZWT
RM48L950-PGE
RM48L950-ZWT
RM48L952-PGE
RM48L952-ZWT
RM57L843-ZWT
S5PV210
S5PV310
SCORPION
SPEAR1300
SPEAR1310
SPEAR1340
TCI6636K2H
TCI6638K2K
TMS320C6A8143
TMS320C6A8147
TMS320C6A8148
TMS320C6A8167
TMS320C6A8168
TMS320DM3725
TMS320DM3730
TMS320DM8147
TMS320DM8148
TMS320DM8165
TMS320DM8166
YES
YES
YES
YES
YES
YES
YES
YES
YES
YES
YES
YES
YES
YES
YES
YES
YES
YES
YES
YES
YES
YES
YES
YES
YES
YES
YES
YES
YES
YES
YES
YES
YES
YES
YES
YES
YES
YES
YES
YES
YES
©1989-2014 Lauterbach GmbH
ARM Debugger
170
Support
YES
YES
YES
YES
YES
YES
YES
YES
YES
YES
YES
YES
YES
YES
YES
YES
YES
YES
YES
YES
INSTRUCTION
SIMULATOR
YES
YES
YES
YES
YES
YES
YES
YES
YES
YES
YES
YES
YES
YES
YES
YES
YES
YES
YES
YES
YES
YES
YES
YES
YES
YES
YES
YES
YES
YES
YES
YES
YES
YES
YES
YES
YES
YES
YES
YES
YES
POWER
INTEGRATOR
ICD
MONITOR
YES
YES
YES
YES
YES
YES
YES
YES
YES
YES
YES
YES
YES
YES
YES
YES
YES
YES
YES
YES
YES
YES
YES
YES
YES
YES
YES
YES
YES
YES
YES
YES
YES
YES
YES
YES
YES
YES
YES
YES
YES
ICD
TRACE
ICD
DEBUG
FIRE
ICE
CPU
TMS320DM8167
TMS320DM8168
TMS570LS0332
TMS570LS0432
TMS570LS10106-PGE
TMS570LS10106-ZWT
TMS570LS10116-PGE
TMS570LS10116-ZWT
TMS570LS10206-PGE
TMS570LS10206-ZWT
TMS570LS10216-PGE
TMS570LS10216-ZWT
TMS570LS1114-PGE
TMS570LS1114-ZWT
TMS570LS1115-PGE
TMS570LS1115-ZWT
TMS570LS1224-PGE
TMS570LS1224-ZWT
TMS570LS1225-PGE
TMS570LS1225-ZWT
TMS570LS1227-ZWT
TMS570LS20206-PGE
TMS570LS20206-ZWT
TMS570LS20216-PGE
TMS570LS20216-ZWT
TMS570LS2124-PGE
TMS570LS2124-ZWT
TMS570LS2125-PGE
TMS570LS2125-ZWT
TMS570LS2134-PGE
TMS570LS2134-ZWT
TMS570LS2135-PGE
TMS570LS2135-ZWT
TMS570LS3134-PGE
TMS570LS3134-ZWT
TMS570LS3135-PGE
TMS570LS3135-ZWT
TMS570LS3137-PGE
TMS570LS3137-ZWT
VF11xR
VF12xR
YES
YES
YES
YES
YES
YES
YES
YES
YES
YES
YES
YES
YES
YES
YES
YES
YES
YES
YES
YES
YES
YES
YES
YES
YES
YES
YES
YES
YES
YES
YES
YES
YES
YES
YES
YES
YES
YES
YES
YES
YES
©1989-2014 Lauterbach GmbH
ARM Debugger
171
Support
ICD
TRACE
YES
YES
YES
YES
YES
YES
YES
YES
YES
YES
YES
YES
YES
YES
YES
YES
YES
YES
YES
YES
INSTRUCTION
SIMULATOR
ICD
MONITOR
YES
YES
YES
YES
YES
YES
YES
YES
YES
YES
POWER
INTEGRATOR
ICD
DEBUG
FIRE
ICE
CPU
VF31xR
VF32xR
VF3xx
VF4xx
VF51xR
VF52xR
VF5xx
VF6xx
VF7xx
ZYNQ-7000
YES
YES
YES
YES
YES
YES
YES
YES
YES
YES
©1989-2014 Lauterbach GmbH
ARM Debugger
172
Support
Compilers
Language
Compiler
C
C
C
C
C
CARM
ARMCC
ARMCC
REALVIEW-MDK
GCCARM
C
C
C
C
C
C
C
C
C++
C++
C++
C++
C++
C++
C++
C++
C/C++
C/C++
Company
ARM Germany GmbH
ARM Ltd.
ARM Ltd.
ARM Ltd.
Free Software
Foundation, Inc.
GCCARM
Free Software
Foundation, Inc.
GREENHILLS-C
Greenhills Software Inc.
ICCARM
IAR Systems AB
ICCV7-ARM
Imagecraft Creations
Inc.
HIGH-C
Synopsys, Inc
TI-C
Texas Instruments
GNU-C
Wind River Systems
D-CC
Wind River Systems
ARM-SDT-2.50
ARM Ltd.
REALVIEW-MDK
ARM Ltd.
GCCARM
Free Software
Foundation, Inc.
GNU
Free Software
Foundation, Inc.
GCCARM
Free Software
Foundation, Inc.
GREENHILLS-C++ Greenhills Software Inc.
MSVC
Microsoft Corporation
HIGH-C++
Synopsys, Inc
XCODE
Apple Inc.
VX-ARM
TASKING
Option
Comment
ELF/DWARF
AIF
ELF/DWARF
ELF/DWARF2
COFF/STABS
ELF/DWARF2
ELF/DWARF2
ELF/DWARF2
ELF/DWARF ARM7
ELF/DWARF
COFF
COFF
ELF
ELF/DWARF2
ELF/DWARF2
COFF/STABS
EXE/STABS
ELF/DWARF2
ELF/DWARF2
EXE/CV5
WindowsCE
ELF/DWARF
Mach-O
ELF/DWARF2
©1989-2014 Lauterbach GmbH
ARM Debugger
173
Support
Realtime Operation Systems
Name
Company
Comment
AMX
Android
ChorusOS
CMX-RTX
ECOS
Elektrobit tresos
embOS
Erika
FAMOS
FreeRTOS
Linux
Linux
Linux
Linux SMP
MQX
MQX
NetBSD
Nucleus PLUS
OS-9
OS21
OSE Basic
OSE Delta
OSE Epsilon
OSEK
PikeOS
prKERNEL
ProOSEK
pSOS+
QNX
QNX SMP
rcX
RealTime Craft
RTEMS
RTX-ARM
RTXC 3.2
RTXC Quadros
Sciopta
SMX
SMX
Symbian OS
Symbian OS
Symbian^3
KadakProducts Ltd.
Oracle Corporation
CMX Systems Inc.
eCosCentric Limited
Elektrobit Automotive GmbH
Segger
Evidence
Spansion Inc.
Freeware I
MontaVista Software, LLC
Timesys Corporation
Freescale Semiconductor, Inc.
Synopsys, Inc
Mentor Graphics Corporation
Radisys Inc.
ST Microelectronics N.V.
Enea OSE Systems
Enea OSE Systems
Enea OSE Systems
Sysgo AG
eSOL Co., Ltd.
Elektrobit Automotive GmbH
Wind River Systems
QNX Software Systems
QNX Software Systems
Hilscher GmbH
GSI tecsi
RTEMS
ARM Germany GmbH
Quadros Systems Inc.
Quadros Systems Inc.
Sciopta
Coressent Technology Inc.
Micro Digital Inc.
Symbian
Symbian
Symbian
Dalvik support in development
1.3, 2.0 and 3.0
via ORTI
3.80
via ORTI
v7
Kernel version 2.4, 2.6, 3.0 to 3.12
3.0, 3.1, 4.0, 5.0
Kernel Version 2.4 and 2.6, 3.0
3.x and 4.x
2.40 and 2.50
(OSARM)
4.x and 5.x
(OSARM), 3.x
via ORTI
via ORTI
2.1 to 2.5, 3.0
6.0 to 6.5.0
6.0 to 6.5.0
implemented by Hilscher
(XECARM)
4.10
3.4 to 4.0
6.x, 7.0s, 8.0a 8.1a
8.0b, 8.1b, 9.x
©1989-2014 Lauterbach GmbH
ARM Debugger
174
Support
Name
Company
Comment
SYS/BIOS
T-Kernel
T-Kernel SMP
ThreadX
ThreadX SMP
uC/OS-II
uC/OS-III
uC3/Compact
uC3/Standard
uCLinux
uITRON
VxWorks
VxWorks SMP
Windows CE
Windows Embedded
Compact 7
Windows Embedded
Compact 7 SMP
Windows Mobile
Windows Phone 7
Texas Instruments
eSOL Co., Ltd.
eSOL Co., Ltd.
Express Logic Inc.
Express Logic Inc.
Micrium Inc.
Micrium Inc.
eForce Co. Ltd.
eForce Co. Ltd.
Freeware II
Wind River Systems
Wind River Systems
Microsoft Corporation
Microsoft Corporation
3.0, 4.0, 5.0
3.0, 4.0, 5.0
2.0 to 2.92
3.0
v2
Kernel Version 2.4 and 2.6, 3.0
HI7000, RX4000, NORTi,PrKernel
5.x and 6.x
5.x and 6.x
4.0 to 6.0
Microsoft Corporation
Microsoft Corporation
Microsoft Corporation
4.0 to 6.0
©1989-2014 Lauterbach GmbH
ARM Debugger
175
Support
3rd Party Tool Integrations
CPU
Tool
Company
ALL
ALL
ALL
ADENEO
X-TOOLS / X32
CODEWRIGHT
ALL
CODE CONFIDENCE
TOOLS
CODE CONFIDENCE
TOOLS
EASYCODE
ECLIPSE
RHAPSODY IN MICROC
RHAPSODY IN C++
LDRA TOOL SUITE
ATTOL TOOLS
VISUAL BASIC
INTERFACE
LABVIEW
Adeneo Embedded
blue river software GmbH
Borland Software
Corporation
Code Confidence Ltd
ALL
ALL
ALL
ALL
ALL
ALL
ALL
ALL
ALL
ALL
ALL
ALL
ALL
ALL
ALL
ALL
CODE::BLOCKS
C++TEST
RAPITIME
DA-C
SIMULINK
VECTORCAST/RSP
WINDOWS CE PLATF.
BUILDER
Host
Windows
Windows
Windows
Code Confidence Ltd
Linux
EASYCODE GmbH
Eclipse Foundation, Inc
IBM Corp.
IBM Corp.
LDRA Technology, Inc.
MicroMax Inc.
Microsoft Corporation
Windows
Windows
Windows
Windows
Windows
Windows
Windows
NATIONAL
INSTRUMENTS
Corporation
Open Source
Parasoft
Rapita Systems Ltd.
RistanCASE
The MathWorks Inc.
Vector Software
Windows
Windows
Windows
Windows
Windows
Windows
Windows
Windows
©1989-2014 Lauterbach GmbH
ARM Debugger
176
Support
Products
Product Information
ARM7
OrderNo Code
Text
LA-7746
JTAG Debugger for ARM7 20 Pin Connector (ICD)
JTAG-ARM7-20
supports ARM7 (0.4 V - 5 V)
supports 5-pin standard JTAG, cJTAG and
Serial Wire Debug Port
includes software for Windows, Linux and MacOSX
requires Power Debug Module
cJTAG and SerialWire Debug require
Power Debug Interface USB 2.0/USB 3.0,
Power Debug Ethernet, PowerTrace or Power Debug II
LA-7746A
JTAG Debugger License for ARM7 Add.
JTAG-ARM7-A
supports ARM7
Extension applicable to the following debug cables
(purchased separately):
for LA-3711 (JTAG Debugger for CEVA-X)
for LA-3712 (JTAG Debugger for ZSP500 DSP)
for LA-3747 (JTAG/SPI Debugger for UBI32)
for LA-3750 (JTAG Debugger for ARC)
for LA-3844 (JTAG Debugger for TeakLite-4)
for LA-7760 (JTAG Debugger for MIPS32)
for LA-7774 (JTAG Debugger for Teak/TeakLite/OAK JAM)
for LA-7789 (JTAG Debugger for TeakLite/OAK SEIB)
for LA-7830 (JTAG Debugger for TMS320C55x)
for LA-7836 (JTAG Debugger for MMDSP)
for LA-7838 (JTAG Debugger for TMS320C6x00)
for LA-7845 (JTAG Debugger for StarCore 20 Pin)
for LA-7847 (JTAG Debugger for TMS320C28X)
please add the serial number of the base debug
cable to your order
Extension also applicable to the CombiProbe LA-450x
LA-7746X
JTAG Debugger Extension for ARM7
JTAG-ARM7-X
supports ARM7
Extension applicable to the following debug cables
(purchased separately):
for LA-7742 (JTAG Debugger for ARM9)
for LA-7744 (JTAG Debugger for ARM10)
for LA-7762 (JTAG Debugger for XScale)
for LA-7765 (JTAG Debugger for ARM11)
for LA-7843 (JTAG Debugger for Cortex-A/-R (ARMv7))
for LA-7844 (JTAG Debugger for Cortex-M)
requires a valid software guarantee or a valid
software license key
please add the serial number of the base debug
cable to your order
LA-7748
Converter ARM-20 to TI-14
JTAG-ARM-CON-20-TI14
Converter to connect a Debug Cable to a TI-14
connector which is used on many targets with
processors from Texas Instruments
LA-3780
Converter ARM-20 to TI-14 or TI-20-Compact
JTAG-ARM-CON-20-TI20
Converter to connect a Debug Cable to a TI-14 or
TI-20-Compact connector which is used on many
targets with processors from Texas Instruments.
©1989-2014 Lauterbach GmbH
ARM Debugger
177
Products
OrderNo Code
Text
LA-3770
ARM Converter ARM-20 to MIPI-10/20/34
CONV-ARM20/MIPI34
Converter to connect a Debug Cable to 10/20/34 pin
connectors specified by MIPI. Converts to CombiProbe
connector
LA-7747
ARM Converter ARM-20 to/from ARM-14
JTAG-ARM-CON-14-20
Converter to connect an ARM Debug Cable V1 (ARM-14)
to ARM-20 or to connect a newer ARM Debug Cable
(ARM-20) to ARM-14 target connector
ARM-14 is an obsolete connector specification,
do not use for new designs
LA-3726
ARM Converter 2x ARM-20 to ARM-20
JTAG-ARM-CON-20-20
Converter to connect two ARM Debug Cable to one
connector on the target.
Old method to handle multicore debugging by using
two debugger hardware modules.
LA-3717
Measuring Adapter JTAG 20
MES-AD-JTAG20
Adapter to measure JTAG signals by a logic analyzer
or
to disconnect single JTAG lines from the target
LA-3862
ARM Conv. ARM-20, MIPI-34 to Mictor-38
CON-ARM/MIPI34-MIC
Converter to connect the ARM Debug Cable or
the CombiProbe to a Mictor connector on the
target. This is needed if you want to debug
without a Preprocessor and if there is only
a Mictor connector on the target.
The trace signals of the CombiProbe are
connected to the lowest four trace signals of
the Mictor (ETMv3 pinout, continuous mode).
But tracing is normally no use case due to
the bandwidth limitations of the CombiProbe.
©1989-2014 Lauterbach GmbH
ARM Debugger
178
Products
ARM9
OrderNo Code
Text
LA-7742
JTAG Debugger for ARM9 (ICD)
JTAG-ARM9
supports ARM9 (0.4 V - 5 V)
supports 5-pin standard JTAG, cJTAG and
Serial Wire Debug Port
includes software for Windows, Linux and MacOSX
requires Power Debug Module
cJTAG and Serial Wire Debug require
Power Debug Interface USB 2.0/USB 3.0,
Power Debug Ethernet, PowerTrace or Power Debug II
LA-7742A
JTAG Debugger License for ARM9 Add.
JTAG-ARM9-A
supports ARM9
Extension applicable to the following debug cables
(purchased separately):
for LA-3711 (JTAG Debugger for CEVA-X)
for LA-3712 (JTAG Debugger for ZSP500 DSP)
for LA-3747 (JTAG/SPI Debugger for UBI32)
for LA-3750 (JTAG Debugger for ARC)
for LA-3844 (JTAG Debugger for TeakLite-4)
for LA-7760 (JTAG Debugger for MIPS32)
for LA-7774 (JTAG Debugger for Teak/TeakLite/OAK JAM)
for LA-7789 (JTAG Debugger for TeakLite/OAK SEIB)
for LA-7830 (JTAG Debugger for TMS320C55x)
for LA-7836 (JTAG Debugger for MMDSP)
for LA-7838 (JTAG Debugger for TMS320C6x00)
for LA-7845 (JTAG Debugger for StarCore 20 Pin)
for LA-7847 (JTAG Debugger for TMS320C28X)
please add the serial number of the base debug
cable to your order
Extension also applicable to the CombiProbe LA-450x
©1989-2014 Lauterbach GmbH
ARM Debugger
179
Products
OrderNo Code
Text
LA-7742X
JTAG Debugger Extension for ARM9
JTAG-ARM9-X
supports ARM9
Extension applicable to the following debug cables
(purchased separately):
for LA-7744 (JTAG Debugger for ARM10)
for LA-7746 (JTAG Debugger for ARM7)
for LA-7762 (JTAG Debugger for XScale)
for LA-7765 (JTAG Debugger for ARM11)
for LA-7843 (JTAG Debugger for Cortex-A/-R (ARMv7))
for LA-7844 (JTAG Debugger for Cortex-M)
requires a valid software guarantee or a valid
software license key
please add the serial number of the base debug
cable to your order
LA-7970X
Trace License for ARM (Debug Cable)
TRACE-LICENSE-ARM
Supports for Embedded Trace Buffer (ETB)
Extension applicable to the following debug cables
(purchased separately):
for LA-3743 (JTAG Debugger for ARMv8-A)
for LA-7742 (JTAG Debugger for ARM9)
for LA-7744 (JTAG Debugger for ARM10)
for LA-7765 (JTAG Debugger for ARM11)
for LA-7746 (JTAG Debugger for ARM7)
for LA-7843 (JTAG Debugger for CORTEX-A/-R)
please add the base serial number of your debug
cable to your order
LA-3722
ARM Converter ARM-20 to Mictor-38
CON-JTAG20-MICTOR
Converter to connect the ARM Debug Cable to a Mictor
connector on the target providing both debug and
trace signals. This is needed if you want to connect
the Debug Cable without a Preprocessor and if there
is only a Mictor on the target. Suitable for MMDSP
as well.
LA-3717
Measuring Adapter JTAG 20
MES-AD-JTAG20
Adapter to measure JTAG signals by a logic analyzer
or
to disconnect single JTAG lines from the target
LA-3862
ARM Conv. ARM-20, MIPI-34 to Mictor-38
CON-ARM/MIPI34-MIC
Converter to connect the ARM Debug Cable or
the CombiProbe to a Mictor connector on the
target. This is needed if you want to debug
without a Preprocessor and if there is only
a Mictor connector on the target.
The trace signals of the CombiProbe are
connected to the lowest four trace signals of
the Mictor (ETMv3 pinout, continuous mode).
But tracing is normally no use case due to
the bandwidth limitations of the CombiProbe.
©1989-2014 Lauterbach GmbH
ARM Debugger
180
Products
ARM10
OrderNo Code
Text
LA-7744
JTAG Debugger for ARM10 (ICD)
JTAG-ARM10
supports ARM10 (0.4 V - 5 V)
supports 5-pin standard JTAG, cJTAG and
Serial Wire Debug Port
includes software for Windows, Linux and MacOSX
requires Power Debug Module
cJTAG and Serial Wire Debug
require Power Debug Interface USB 2.0/USB 3.0,
Power Debug Ethernet, PowerTrace or Power Debug II
LA-7744A
JTAG Debugger License for ARM10 Add.
JTAG-ARM10-A
supports ARM10
Extension applicable to the following debug cables
(purchased separately):
for LA-3711 (JTAG Debugger for CEVA-X)
for LA-3712 (JTAG Debugger for ZSP500 DSP)
for LA-3750 (JTAG Debugger for ARC)
for LA-7774 (JTAG Debugger for Teak/TeakLite/OAK JAM)
for LA-7830 (JTAG Debugger for TMS320C55x)
for LA-7836 (JTAG Debugger for MMDSP)
for LA-7838 (JTAG Debugger for TMS320C6x00)
for LA-7845 (JTAG Debugger for StarCore 20 Pin)
for LA-7847 (JTAG Debugger for TMS320C28X)
please add the serial number of the base debug
cable to your order
LA-7744X
JTAG Debugger Extension for ARM10
JTAG-ARM10-X
supports ARM10
Extension applicable to the following debug cables
(purchased separately):
for LA-7742 (JTAG Debugger for ARM9)
for LA-7746 (JTAG Debugger for ARM7)
for LA-7762 (JTAG Debugger for XScale)
for LA-7765 (JTAG Debugger for ARM11)
for LA-7843 (JTAG Debugger for Cortex-A/-R (ARMv7))
for LA-7844 (JTAG Debugger for Cortex-M)
requires a valid software guarantee or a valid
software license key
please add the serial number of the base debug
cable to your order
©1989-2014 Lauterbach GmbH
ARM Debugger
181
Products
OrderNo Code
Text
LA-7970X
Trace License for ARM (Debug Cable)
TRACE-LICENSE-ARM
Supports for Embedded Trace Buffer (ETB)
Extension applicable to the following debug cables
(purchased separately):
for LA-3743 (JTAG Debugger for ARMv8-A)
for LA-7742 (JTAG Debugger for ARM9)
for LA-7744 (JTAG Debugger for ARM10)
for LA-7765 (JTAG Debugger for ARM11)
for LA-7746 (JTAG Debugger for ARM7)
for LA-7843 (JTAG Debugger for CORTEX-A/-R)
please add the base serial number of your debug
cable to your order
LA-3717
Measuring Adapter JTAG 20
MES-AD-JTAG20
Adapter to measure JTAG signals by a logic analyzer
or
to disconnect single JTAG lines from the target
LA-3862
ARM Conv. ARM-20, MIPI-34 to Mictor-38
CON-ARM/MIPI34-MIC
Converter to connect the ARM Debug Cable or
the CombiProbe to a Mictor connector on the
target. This is needed if you want to debug
without a Preprocessor and if there is only
a Mictor connector on the target.
The trace signals of the CombiProbe are
connected to the lowest four trace signals of
the Mictor (ETMv3 pinout, continuous mode).
But tracing is normally no use case due to
the bandwidth limitations of the CombiProbe.
©1989-2014 Lauterbach GmbH
ARM Debugger
182
Products
ARM11
OrderNo Code
Text
LA-7765
JTAG Debugger for ARM11 (ICD)
JTAG-ARM11
supports ARM11 (0.4 V - 5 V)
supports 5-pin standard JTAG, cJTAG and
Serial Wire Debug Port
includes software for Windows, Linux and MacOSX
requires Power Debug Module
cJTAG and SerialWire Debug require
Power Debug Interface USB 2.0/USB 3.0,
Power Debug Ethernet, PowerTrace or Power Debug II
©1989-2014 Lauterbach GmbH
ARM Debugger
183
Products
OrderNo Code
Text
LA-7765A
JTAG Debugger License for ARM11 Add.
JTAG-ARM11-A
supports ARM11
Extension applicable to the following debug cables
(purchased separately):
1.) 20-pin ARM debug cable
for LA-3711 (JTAG Debugger for CEVA-X)
for LA-3712 (JTAG Debugger for ZSP500 DSP)
for LA-3747 (JTAG/SPI Debugger for UBI32)
for LA-3750 (JTAG Debugger for ARC)
for LA-3844 (JTAG Debugger for TeakLite-4)
for LA-7760 (JTAG Debugger for MIPS32)
for LA-7774 (JTAG Debugger for Teak/TeakLite/OAK JAM)
for LA-7789 (JTAG Debugger for TeakLite/OAK SEIB)
for LA-7830 (JTAG Debugger for TMS320C55x)
for LA-7836 (JTAG Debugger for MMDSP)
for LA-7838 (JTAG Debugger for TMS320C6x00)
for LA-7845 (JTAG Debugger for StarCore 20 Pin)
for LA-7847 (JTAG Debugger for TMS320C28X)
2.) 60-pin XDP debug cable
LA-3776 (JTAG Debugger for Intel® Atom™ and x86)
please add the serial number of the base debug
cable to your order
Extension also applicable to the CombiProbe LA-450x
LA-7765X
JTAG Debugger Extension for ARM11
JTAG-ARM11-X
supports ARM11
Extension applicable to the following debug cables
(purchased separately):
for LA-7742 (JTAG Debugger for ARM9)
for LA-7744 (JTAG Debugger for ARM10)
for LA-7746 (JTAG Debugger for ARM7)
for LA-7762 (JTAG Debugger for XScale)
for LA-7843 (JTAG Debugger for Cortex-A/-R (ARMv7))
for LA-7844 (JTAG Debugger for Cortex-M)
requires a valid software guarantee or a valid
software license key
please add the serial number of the base debug
cable to your order
LA-7970X
Trace License for ARM (Debug Cable)
TRACE-LICENSE-ARM
Supports for Embedded Trace Buffer (ETB)
Extension applicable to the following debug cables
(purchased separately):
for LA-3743 (JTAG Debugger for ARMv8-A)
for LA-7742 (JTAG Debugger for ARM9)
for LA-7744 (JTAG Debugger for ARM10)
for LA-7765 (JTAG Debugger for ARM11)
for LA-7746 (JTAG Debugger for ARM7)
for LA-7843 (JTAG Debugger for CORTEX-A/-R)
please add the base serial number of your debug
cable to your order
LA-3717
Measuring Adapter JTAG 20
MES-AD-JTAG20
Adapter to measure JTAG signals by a logic analyzer
or
to disconnect single JTAG lines from the target
LA-3862
ARM Conv. ARM-20, MIPI-34 to Mictor-38
CON-ARM/MIPI34-MIC
Converter to connect the ARM Debug Cable or
the CombiProbe to a Mictor connector on the
target. This is needed if you want to debug
without a Preprocessor and if there is only
a Mictor connector on the target.
The trace signals of the CombiProbe are
connected to the lowest four trace signals of
the Mictor (ETMv3 pinout, continuous mode).
But tracing is normally no use case due to
the bandwidth limitations of the CombiProbe.
©1989-2014 Lauterbach GmbH
ARM Debugger
184
Products
Cortex-A/-R
OrderNo Code
Text
LA-7843
JTAG Debugger for Cortex-A/-R (ARMv7) (ICD)
JTAG-CORTEX-A/R
supports ARM Cortex-A and Cortex-R (ARMv7, 32-bit)
supports 5-pin standard JTAG, cJTAG and
Serial Wire Debug Port (0.4 V - 5 V)
includes software for Windows, Linux and MacOSX
requires Power Debug Module
cJTAG and Serial Wire Debug require
Power Debug Interface USB 2.0/USB 3.0,
Power Debug Ethernet, PowerTrace or Power Debug II
LA-7843A
JTAG Debugger License for Cortex-A/-R Add.
JTAG-CORTEX-A/R-A
supports ARM Cortex-A and Cortex-R (ARMv7, 32-bit)
Extension applicable to the following debug cables
(purchased separately):
for LA-3711 (JTAG Debugger for CEVA-X)
for LA-3712 (JTAG Debugger for ZSP500 DSP)
for LA-3737 (JTAG Debugger for TriCore Automotive)
for LA-3747 (JTAG/SPI Debugger for UBI32)
for LA-3750 (JTAG Debugger for ARC)
for LA-3756 (JTAG Debugger for AndesStar)
for LA-3762 (JTAG Debugger for Xtensa 20 Pin)
for LA-3776 (JTAG Debugger for Intel® Atom)
for LA-3844 (JTAG Debugger for TeakLite-4)
for LA-7756 (Debugger for TriCore Standard)
for LA-7760 (JTAG Debugger for MIPS32)
for LA-7774 (JTAG Debugger for Teak/TeakLite/OAK JAM)
for LA-7830 (JTAG Debugger for TMS320C55x)
for LA-7836 (JTAG Debugger for MMDSP)
for LA-7837 (Debugger for NIOS-II)
for LA-7838 (JTAG Debugger for TMS320C6x00)
for LA-7845 (JTAG Debugger for StarCore 20 Pin)
for LA-7847 (JTAG Debugger for TMS320C28X)
please add the base serial number of your debug
cable to your order
Extension also applicable to the CombiProbe LA-450x
LA-7843X
JTAG Debugger Extension for Cortex-A/-R
JTAG-CORTEX-A/R-X
supports ARM Cortex-A and Cortex-R (ARMv7, 32-bit)
Extension applicable to the following debug cables
(purchased separately)
for LA-3743 (JTAG Debugger for Cortex-A5x)
for LA-7742 (JTAG Debugger for ARM9)
for LA-7744 (JTAG Debugger for ARM10)
for LA-7746 (JTAG Debugger for ARM7)
for LA-7762 (JTAG Debugger for XScale)
for LA-7765 (JTAG Debugger for ARM11)
for LA-7844 (JTAG Debugger for Cortex-M)
requires a valid software guarantee or a valid
software license key
please add the base serial number of your debug
cable to your order
LA-7970X
Trace License for ARM (Debug Cable)
TRACE-LICENSE-ARM
Supports for Embedded Trace Buffer (ETB)
Extension applicable to the following debug cables
(purchased separately):
for LA-3743 (JTAG Debugger for ARMv8-A)
for LA-7742 (JTAG Debugger for ARM9)
for LA-7744 (JTAG Debugger for ARM10)
for LA-7765 (JTAG Debugger for ARM11)
for LA-7746 (JTAG Debugger for ARM7)
for LA-7843 (JTAG Debugger for CORTEX-A/-R)
please add the base serial number of your debug
cable to your order
©1989-2014 Lauterbach GmbH
ARM Debugger
185
Products
OrderNo Code
Text
LA-3717
Measuring Adapter JTAG 20
MES-AD-JTAG20
Adapter to measure JTAG signals by a logic analyzer
or
to disconnect single JTAG lines from the target
LA-3881
ARM Converter ARM-20 to XILINX-14
CONV-ARM20/XILINX14
Converter to connect an ARM Debug Cable to a 14-pin
JTAG connector found on Xilinx target boards
LA-3862
ARM Conv. ARM-20, MIPI-34 to Mictor-38
CON-ARM/MIPI34-MIC
Converter to connect the ARM Debug Cable or
the CombiProbe to a Mictor connector on the
target. This is needed if you want to debug
without a Preprocessor and if there is only
a Mictor connector on the target.
The trace signals of the CombiProbe are
connected to the lowest four trace signals of
the Mictor (ETMv3 pinout, continuous mode).
But tracing is normally no use case due to
the bandwidth limitations of the CombiProbe.
©1989-2014 Lauterbach GmbH
ARM Debugger
186
Products
Order Information
ARM7
Order No.
Code
Text
LA-7746
LA-7746A
LA-7746X
LA-7748
LA-3780
LA-3770
LA-7747
LA-3726
LA-3717
LA-3862
JTAG-ARM7-20
JTAG-ARM7-A
JTAG-ARM7-X
JTAG-ARM-CON-20-TI14
JTAG-ARM-CON-20-TI20
CONV-ARM20/MIPI34
JTAG-ARM-CON-14-20
JTAG-ARM-CON-20-20
MES-AD-JTAG20
CON-ARM/MIPI34-MIC
JTAG Debugger for ARM7 20 Pin Connector (ICD)
JTAG Debugger License for ARM7 Add.
JTAG Debugger Extension for ARM7
Converter ARM-20 to TI-14
Converter ARM-20 to TI-14 or TI-20-Compact
ARM Converter ARM-20 to MIPI-10/20/34
ARM Converter ARM-20 to/from ARM-14
ARM Converter 2x ARM-20 to ARM-20
Measuring Adapter JTAG 20
ARM Conv. ARM-20, MIPI-34 to Mictor-38
Additional Options
LA-2101
AD-HS-20
LA-3722
CON-JTAG20-MICTOR
LA-3788
DAISY-CHAINER-JTAG20
LA-7760A EJTAG-MIPS32-A
LA-3756A JTAG-ANDES-A
LA-3778A JTAG-APS-A
LA-3750A JTAG-ARC-A
LA-7744X JTAG-ARM10-X
LA-7765X JTAG-ARM11-X
LA-7742X JTAG-ARM9-X
LA-3743X JTAG-ARMV8-A-X
LA-7831A JTAG-C54X-A
LA-7830A JTAG-C55X-A
LA-7838A JTAG-C6XXX-A
LA-3711A JTAG-CEVAX-A
LA-7843X JTAG-CORTEX-A/R-X
LA-7844X JTAG-CORTEX_M-X
LA-7836A JTAG-MMDSP-A
LA-7789A JTAG-OAK-SEIB-A
LA-7817A JTAG-SH4-A-20
LA-7845A JTAG-STARCORE-20-A
LA-7774A JTAG-TEAK-JAM-20-A
LA-3844A JTAG-TEAKLITE-4-A
LA-3774A JTAG-TEAKLITE-III-A
LA-7847A JTAG-TMS320C28X-A
Adapter Half-Size 20 pin
ARM Converter ARM-20 to Mictor-38
Daisy Chainer 4 JTAG 20
EJTAG Debugger License for MIPS32 Add.
JTAG Debugger License for AndeStar Add.
JTAG Debugger License for APS Add.
JTAG Debugger License for ARC Add.
JTAG Debugger Extension for ARM10
JTAG Debugger Extension for ARM11
JTAG Debugger Extension for ARM9
JTAG Debugger Extension for Cortex-A5x
JTAG Debugger License for TMS320C54X Add.
JTAG Debugger License for TMS320C55x Add.
JTAG Debugger License for TMS320C6xxx Add.
JTAG Debugger License for CEVA-X Additional
JTAG Debugger Extension for Cortex-A/-R
JTAG Debugger Extension for Cortex-M
JTAG Debugger License for MMDSP
JTAG Debugger for TeakLite/OAK SEIB (ICD)
JTAG Debugger License for SH2/SH3/SH4 Add.
JTAG Debugger License for StarCore 20 Pin Add
JTAG Debug. for Teak/TeakLite JAM 20 Add.
JTAG Debugger for TeakLite-4 Add. (ICD)
JTAG Debugger for TeakLite III Add. (ICD)
JTAG Debugger License for TMS320C28X Add.
©1989-2014 Lauterbach GmbH
ARM Debugger
187
Products
Order No.
Code
Text
LA-3760A
LA-7832A
LA-3712A
LA-7960X
LA-7970X
JTAG-XTENSA-A
JTAG-ZSP400-A
JTAG-ZSP500-A
MULTICORE-LICENSE
TRACE-LICENSE-ARM
JTAG Debugger License for Xtensa Add.
JTAG Debugger for ZSP400 DSP Core Additional
JTAG Debugger for ZSP500 DSP Core Additional
License for Multicore Debugging
Trace License for ARM (Debug Cable)
Order No.
Code
Text
LA-7742
LA-7742A
LA-7742X
LA-7970X
LA-3722
LA-3717
LA-3862
JTAG-ARM9
JTAG-ARM9-A
JTAG-ARM9-X
TRACE-LICENSE-ARM
CON-JTAG20-MICTOR
MES-AD-JTAG20
CON-ARM/MIPI34-MIC
JTAG Debugger for ARM9 (ICD)
JTAG Debugger License for ARM9 Add.
JTAG Debugger Extension for ARM9
Trace License for ARM (Debug Cable)
ARM Converter ARM-20 to Mictor-38
Measuring Adapter JTAG 20
ARM Conv. ARM-20, MIPI-34 to Mictor-38
ARM9
Additional Options
LA-2101
AD-HS-20
LA-3770
CONV-ARM20/MIPI34
LA-3788
DAISY-CHAINER-JTAG20
LA-7760A EJTAG-MIPS32-A
LA-3742A JTAG-ADRENO-A
LA-3756A JTAG-ANDES-A
LA-3778A JTAG-APS-A
LA-3750A JTAG-ARC-A
LA-7747
JTAG-ARM-CON-14-20
LA-3726
JTAG-ARM-CON-20-20
LA-7748
JTAG-ARM-CON-20-TI14
LA-3780
JTAG-ARM-CON-20-TI20
LA-7744X JTAG-ARM10-X
LA-7765X JTAG-ARM11-X
LA-7746X JTAG-ARM7-X
LA-3743X JTAG-ARMV8-A-X
LA-7831A JTAG-C54X-A
LA-7830A JTAG-C55X-A
LA-7838A JTAG-C6XXX-A
LA-3711A JTAG-CEVAX-A
LA-7843X JTAG-CORTEX-A/R-X
LA-7844X JTAG-CORTEX_M-X
Adapter Half-Size 20 pin
ARM Converter ARM-20 to MIPI-10/20/34
Daisy Chainer 4 JTAG 20
EJTAG Debugger License for MIPS32 Add.
JTAG Debugger License for ADRENO Add.
JTAG Debugger License for AndeStar Add.
JTAG Debugger License for APS Add.
JTAG Debugger License for ARC Add.
ARM Converter ARM-20 to/from ARM-14
ARM Converter 2x ARM-20 to ARM-20
Converter ARM-20 to TI-14
Converter ARM-20 to TI-14 or TI-20-Compact
JTAG Debugger Extension for ARM10
JTAG Debugger Extension for ARM11
JTAG Debugger Extension for ARM7
JTAG Debugger Extension for Cortex-A5x
JTAG Debugger License for TMS320C54X Add.
JTAG Debugger License for TMS320C55x Add.
JTAG Debugger License for TMS320C6xxx Add.
JTAG Debugger License for CEVA-X Additional
JTAG Debugger Extension for Cortex-A/-R
JTAG Debugger Extension for Cortex-M
©1989-2014 Lauterbach GmbH
ARM Debugger
188
Products
Order No.
Code
Text
LA-7836A
LA-7789A
LA-7850A
LA-7817A
LA-7845A
LA-7774A
LA-3844A
LA-3774A
LA-7847A
LA-3760A
LA-7832A
LA-3712A
LA-7960X
JTAG-MMDSP-A
JTAG-OAK-SEIB-A
JTAG-R8051XC-A
JTAG-SH4-A-20
JTAG-STARCORE-20-A
JTAG-TEAK-JAM-20-A
JTAG-TEAKLITE-4-A
JTAG-TEAKLITE-III-A
JTAG-TMS320C28X-A
JTAG-XTENSA-A
JTAG-ZSP400-A
JTAG-ZSP500-A
MULTICORE-LICENSE
JTAG Debugger License for MMDSP
JTAG Debugger for TeakLite/OAK SEIB (ICD)
JTAG Debugger for R8051XC Add.
JTAG Debugger License for SH2/SH3/SH4 Add.
JTAG Debugger License for StarCore 20 Pin Add
JTAG Debug. for Teak/TeakLite JAM 20 Add.
JTAG Debugger for TeakLite-4 Add. (ICD)
JTAG Debugger for TeakLite III Add. (ICD)
JTAG Debugger License for TMS320C28X Add.
JTAG Debugger License for Xtensa Add.
JTAG Debugger for ZSP400 DSP Core Additional
JTAG Debugger for ZSP500 DSP Core Additional
License for Multicore Debugging
©1989-2014 Lauterbach GmbH
ARM Debugger
189
Products
ARM10
Order No.
Code
Text
LA-7744
LA-7744A
LA-7744X
LA-7970X
LA-3717
LA-3862
JTAG-ARM10
JTAG-ARM10-A
JTAG-ARM10-X
TRACE-LICENSE-ARM
MES-AD-JTAG20
CON-ARM/MIPI34-MIC
JTAG Debugger for ARM10 (ICD)
JTAG Debugger License for ARM10 Add.
JTAG Debugger Extension for ARM10
Trace License for ARM (Debug Cable)
Measuring Adapter JTAG 20
ARM Conv. ARM-20, MIPI-34 to Mictor-38
Additional Options
LA-2101
AD-HS-20
LA-3722
CON-JTAG20-MICTOR
LA-3770
CONV-ARM20/MIPI34
LA-3756A JTAG-ANDES-A
LA-3778A JTAG-APS-A
LA-3750A JTAG-ARC-A
LA-7747
JTAG-ARM-CON-14-20
LA-3726
JTAG-ARM-CON-20-20
LA-7748
JTAG-ARM-CON-20-TI14
LA-3780
JTAG-ARM-CON-20-TI20
LA-7765X JTAG-ARM11-X
LA-7746X JTAG-ARM7-X
LA-7742X JTAG-ARM9-X
LA-3743X JTAG-ARMV8-A-X
LA-7831A JTAG-C54X-A
LA-7830A JTAG-C55X-A
LA-7838A JTAG-C6XXX-A
LA-3711A JTAG-CEVAX-A
LA-7843X JTAG-CORTEX-A/R-X
LA-7844X JTAG-CORTEX_M-X
LA-7836A JTAG-MMDSP-A
LA-7817A JTAG-SH4-A-20
LA-7845A JTAG-STARCORE-20-A
LA-7774A JTAG-TEAK-JAM-20-A
LA-3844A JTAG-TEAKLITE-4-A
LA-3774A JTAG-TEAKLITE-III-A
LA-7847A JTAG-TMS320C28X-A
LA-3760A JTAG-XTENSA-A
LA-7832A JTAG-ZSP400-A
LA-3712A JTAG-ZSP500-A
LA-7960X MULTICORE-LICENSE
Adapter Half-Size 20 pin
ARM Converter ARM-20 to Mictor-38
ARM Converter ARM-20 to MIPI-10/20/34
JTAG Debugger License for AndeStar Add.
JTAG Debugger License for APS Add.
JTAG Debugger License for ARC Add.
ARM Converter ARM-20 to/from ARM-14
ARM Converter 2x ARM-20 to ARM-20
Converter ARM-20 to TI-14
Converter ARM-20 to TI-14 or TI-20-Compact
JTAG Debugger Extension for ARM11
JTAG Debugger Extension for ARM7
JTAG Debugger Extension for ARM9
JTAG Debugger Extension for Cortex-A5x
JTAG Debugger License for TMS320C54X Add.
JTAG Debugger License for TMS320C55x Add.
JTAG Debugger License for TMS320C6xxx Add.
JTAG Debugger License for CEVA-X Additional
JTAG Debugger Extension for Cortex-A/-R
JTAG Debugger Extension for Cortex-M
JTAG Debugger License for MMDSP
JTAG Debugger License for SH2/SH3/SH4 Add.
JTAG Debugger License for StarCore 20 Pin Add
JTAG Debug. for Teak/TeakLite JAM 20 Add.
JTAG Debugger for TeakLite-4 Add. (ICD)
JTAG Debugger for TeakLite III Add. (ICD)
JTAG Debugger License for TMS320C28X Add.
JTAG Debugger License for Xtensa Add.
JTAG Debugger for ZSP400 DSP Core Additional
JTAG Debugger for ZSP500 DSP Core Additional
License for Multicore Debugging
©1989-2014 Lauterbach GmbH
ARM Debugger
190
Products
ARM11
Order No.
Code
Text
LA-7765
LA-7765A
LA-7765X
LA-7970X
LA-3717
LA-3862
JTAG-ARM11
JTAG-ARM11-A
JTAG-ARM11-X
TRACE-LICENSE-ARM
MES-AD-JTAG20
CON-ARM/MIPI34-MIC
JTAG Debugger for ARM11 (ICD)
JTAG Debugger License for ARM11 Add.
JTAG Debugger Extension for ARM11
Trace License for ARM (Debug Cable)
Measuring Adapter JTAG 20
ARM Conv. ARM-20, MIPI-34 to Mictor-38
Additional Options
LA-2101
AD-HS-20
LA-3722
CON-JTAG20-MICTOR
LA-3770
CONV-ARM20/MIPI34
LA-3788
DAISY-CHAINER-JTAG20
LA-7760A EJTAG-MIPS32-A
LA-3756A JTAG-ANDES-A
LA-3778A JTAG-APS-A
LA-3750A JTAG-ARC-A
LA-7747
JTAG-ARM-CON-14-20
LA-3726
JTAG-ARM-CON-20-20
LA-7748
JTAG-ARM-CON-20-TI14
LA-3780
JTAG-ARM-CON-20-TI20
LA-7744X JTAG-ARM10-X
LA-7746X JTAG-ARM7-X
LA-7742X JTAG-ARM9-X
LA-3743X JTAG-ARMV8-A-X
LA-7831A JTAG-C54X-A
LA-7830A JTAG-C55X-A
LA-7838A JTAG-C6XXX-A
LA-3711A JTAG-CEVAX-A
LA-7843X JTAG-CORTEX-A/R-X
LA-7844X JTAG-CORTEX_M-X
LA-7836A JTAG-MMDSP-A
LA-7789A JTAG-OAK-SEIB-A
LA-7817A JTAG-SH4-A-20
LA-7845A JTAG-STARCORE-20-A
LA-7774A JTAG-TEAK-JAM-20-A
LA-3844A JTAG-TEAKLITE-4-A
LA-3774A JTAG-TEAKLITE-III-A
LA-7847A JTAG-TMS320C28X-A
LA-3760A JTAG-XTENSA-A
LA-7832A JTAG-ZSP400-A
LA-3712A JTAG-ZSP500-A
Adapter Half-Size 20 pin
ARM Converter ARM-20 to Mictor-38
ARM Converter ARM-20 to MIPI-10/20/34
Daisy Chainer 4 JTAG 20
EJTAG Debugger License for MIPS32 Add.
JTAG Debugger License for AndeStar Add.
JTAG Debugger License for APS Add.
JTAG Debugger License for ARC Add.
ARM Converter ARM-20 to/from ARM-14
ARM Converter 2x ARM-20 to ARM-20
Converter ARM-20 to TI-14
Converter ARM-20 to TI-14 or TI-20-Compact
JTAG Debugger Extension for ARM10
JTAG Debugger Extension for ARM7
JTAG Debugger Extension for ARM9
JTAG Debugger Extension for Cortex-A5x
JTAG Debugger License for TMS320C54X Add.
JTAG Debugger License for TMS320C55x Add.
JTAG Debugger License for TMS320C6xxx Add.
JTAG Debugger License for CEVA-X Additional
JTAG Debugger Extension for Cortex-A/-R
JTAG Debugger Extension for Cortex-M
JTAG Debugger License for MMDSP
JTAG Debugger for TeakLite/OAK SEIB (ICD)
JTAG Debugger License for SH2/SH3/SH4 Add.
JTAG Debugger License for StarCore 20 Pin Add
JTAG Debug. for Teak/TeakLite JAM 20 Add.
JTAG Debugger for TeakLite-4 Add. (ICD)
JTAG Debugger for TeakLite III Add. (ICD)
JTAG Debugger License for TMS320C28X Add.
JTAG Debugger License for Xtensa Add.
JTAG Debugger for ZSP400 DSP Core Additional
JTAG Debugger for ZSP500 DSP Core Additional
©1989-2014 Lauterbach GmbH
ARM Debugger
191
Products
Order No.
Code
Text
LA-7960X
MULTICORE-LICENSE
License for Multicore Debugging
©1989-2014 Lauterbach GmbH
ARM Debugger
192
Products
Cortex-A/-R
Order No.
Code
Text
LA-7843
LA-7843A
LA-7843X
LA-7970X
LA-3717
LA-3881
LA-3862
JTAG-CORTEX-A/R
JTAG-CORTEX-A/R-A
JTAG-CORTEX-A/R-X
TRACE-LICENSE-ARM
MES-AD-JTAG20
CONV-ARM20/XILINX14
CON-ARM/MIPI34-MIC
JTAG Debugger for Cortex-A/-R (ARMv7) (ICD)
JTAG Debugger License for Cortex-A/-R Add.
JTAG Debugger Extension for Cortex-A/-R
Trace License for ARM (Debug Cable)
Measuring Adapter JTAG 20
ARM Converter ARM-20 to XILINX-14
ARM Conv. ARM-20, MIPI-34 to Mictor-38
Additional Options
LA-2101
AD-HS-20
LA-3722
CON-JTAG20-MICTOR
LA-3770
CONV-ARM20/MIPI34
LA-3788
DAISY-CHAINER-JTAG20
LA-7760A EJTAG-MIPS32-A
LA-3756A JTAG-ANDES-A
LA-3778A JTAG-APS-A
LA-3750A JTAG-ARC-A
LA-7747
JTAG-ARM-CON-14-20
LA-3726
JTAG-ARM-CON-20-20
LA-7748
JTAG-ARM-CON-20-TI14
LA-3780
JTAG-ARM-CON-20-TI20
LA-7744X JTAG-ARM10-X
LA-7765X JTAG-ARM11-X
LA-7746X JTAG-ARM7-X
LA-7742X JTAG-ARM9-X
LA-3743X JTAG-ARMV8-A-X
LA-7830A JTAG-C55X-A
LA-7838A JTAG-C6XXX-A
LA-3711A JTAG-CEVAX-A
LA-7844X JTAG-CORTEX_M-X
LA-3730A JTAG-MICROBLAZE-A
LA-7836A JTAG-MMDSP-A
LA-7837A JTAG-NIOS-II-A
LA-7817A JTAG-SH4-A-20
LA-7845A JTAG-STARCORE-20-A
LA-7774A JTAG-TEAK-JAM-20-A
LA-3844A JTAG-TEAKLITE-4-A
LA-3774A JTAG-TEAKLITE-III-A
LA-7847A JTAG-TMS320C28X-A
Adapter Half-Size 20 pin
ARM Converter ARM-20 to Mictor-38
ARM Converter ARM-20 to MIPI-10/20/34
Daisy Chainer 4 JTAG 20
EJTAG Debugger License for MIPS32 Add.
JTAG Debugger License for AndeStar Add.
JTAG Debugger License for APS Add.
JTAG Debugger License for ARC Add.
ARM Converter ARM-20 to/from ARM-14
ARM Converter 2x ARM-20 to ARM-20
Converter ARM-20 to TI-14
Converter ARM-20 to TI-14 or TI-20-Compact
JTAG Debugger Extension for ARM10
JTAG Debugger Extension for ARM11
JTAG Debugger Extension for ARM7
JTAG Debugger Extension for ARM9
JTAG Debugger Extension for Cortex-A5x
JTAG Debugger License for TMS320C55x Add.
JTAG Debugger License for TMS320C6xxx Add.
JTAG Debugger License for CEVA-X Additional
JTAG Debugger Extension for Cortex-M
JTAG Debug. License for MicroBlaze Additonal
JTAG Debugger License for MMDSP
JTAG Debugger License for NIOS-II Add.
JTAG Debugger License for SH2/SH3/SH4 Add.
JTAG Debugger License for StarCore 20 Pin Add
JTAG Debug. for Teak/TeakLite JAM 20 Add.
JTAG Debugger for TeakLite-4 Add. (ICD)
JTAG Debugger for TeakLite III Add. (ICD)
JTAG Debugger License for TMS320C28X Add.
©1989-2014 Lauterbach GmbH
ARM Debugger
193
Products
Order No.
Code
Text
LA-3760A
LA-7832A
LA-3712A
LA-7960X
LA-7756A
JTAG-XTENSA-A
JTAG-ZSP400-A
JTAG-ZSP500-A
MULTICORE-LICENSE
OCDS-TRICORE-A
JTAG Debugger License for Xtensa Add.
JTAG Debugger for ZSP400 DSP Core Additional
JTAG Debugger for ZSP500 DSP Core Additional
License for Multicore Debugging
Debugger for TriCore Standard Additional
©1989-2014 Lauterbach GmbH
ARM Debugger
194
Products