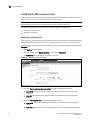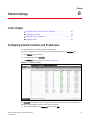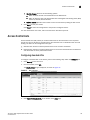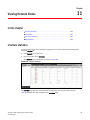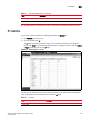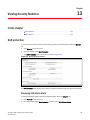
1
53-1002412-01 23 January 2012 ServerIron ADX Graphical User Interface Guide Supporting Brocade ServerIron ADX release 12.4.00 ® © 2012 Brocade Communications Systems, Inc. All Rights Reserved. Brocade, Brocade Assurance, the B-wing symbol, DCX, Fabric OS, MLX, SAN Health, VCS, and VDX are registered trademarks, and AnyIO, Brocade One, CloudPlex, Effortless Networking, ICX, NET Health, OpenScript, and The Effortless Network are trademarks of Brocade Communications Systems, Inc., in the United States and/or in other countries. Other brands, products, or service names mentioned may be trademarks of their respective owners. Notice: This document is for informational purposes only and does not set forth any warranty, expressed or implied, concerning any equipment, equipment feature, or service offered or to be offered by Brocade. Brocade reserves the right to make changes to this document at any time, without notice, and assumes no responsibility for its use. This informational document describes features that may not be currently available. Contact a Brocade sales office for information on feature and product availability. Export of technical data contained in this document may require an export license from the United States government. The authors and Brocade Communications Systems, Inc. shall have no liability or responsibility to any person or entity with respect to any loss, cost, liability, or damages arising from the information contained in this book or the computer programs that accompany it. The product described by this document may contain "open source" software covered by the GNU General Public License or other open source license agreements. To find out which open source software is included in Brocade products, view the licensing terms applicable to the open source software, and obtain a copy of the programming source code, please visit http://www.brocade.com/support/oscd. Brocade Communications Systems, Incorporated Corporate and Latin American Headquarters Brocade Communications Systems, Inc. 130 Holger Way San Jose, CA 95134 Tel: 1-408-333-8000 Fax: 1-408-333-8101 E-mail: [email protected] Asia-Pacific Headquarters Brocade Communications Systems China HK, Ltd. No. 1 Guanghua Road Chao Yang District Units 2718 and 2818 Beijing 100020, China Tel: +8610 6588 8888 Fax: +8610 6588 9999 E-mail: [email protected] European Headquarters Brocade Communications Switzerland Sàrl Centre Swissair Tour B - 4ème étage 29, Route de l'Aéroport Case Postale 105 CH-1215 Genève 15 Switzerland Tel: +41 22 799 5640 Fax: +41 22 799 5641 E-mail: [email protected] Asia-Pacific Headquarters Brocade Communications Systems Co., Ltd. (Shenzhen WFOE) Citic Plaza No. 233 Tian He Road North Unit 1308 – 13th Floor Guangzhou, China Tel: +8620 3891 2000 Fax: +8620 3891 2111 E-mail: [email protected] Document History Title Publication number Summary of changes Date ServerIron ADX Graphical User Interface Guide 53-1002412-01 New document January 2012 Contents About This Document In this chapter . . . . . . . . . . . . . . . . . . . . . . . . . . . . . . . . . . . . . . . . . . . . ix Related documentation . . . . . . . . . . . . . . . . . . . . . . . . . . . . . . . . . . . . ix Objectives . . . . . . . . . . . . . . . . . . . . . . . . . . . . . . . . . . . . . . . . . . . . . . . ix How to use this guide . . . . . . . . . . . . . . . . . . . . . . . . . . . . . . . . . . . . . . ix Document conventions . . . . . . . . . . . . . . . . . . . . . . . . . . . . . . . . . . . . . x Text formatting . . . . . . . . . . . . . . . . . . . . . . . . . . . . . . . . . . . . . . . . x Command syntax conventions . . . . . . . . . . . . . . . . . . . . . . . . . . . x Notes. . . . . . . . . . . . . . . . . . . . . . . . . . . . . . . . . . . . . . . . . . . . . . . . xi Documentation feedback . . . . . . . . . . . . . . . . . . . . . . . . . . . . . . . . . . . xi Requesting technical support . . . . . . . . . . . . . . . . . . . . . . . . . . . . . . . xi Chapter 1 Introduction to the ADX Web Interface In this chapter . . . . . . . . . . . . . . . . . . . . . . . . . . . . . . . . . . . . . . . . . . . . 1 System requirements . . . . . . . . . . . . . . . . . . . . . . . . . . . . . . . . . . . . . . 1 Supported hardware . . . . . . . . . . . . . . . . . . . . . . . . . . . . . . . . . . . 1 Supported software . . . . . . . . . . . . . . . . . . . . . . . . . . . . . . . . . . . . 1 Starting the ADX web interface . . . . . . . . . . . . . . . . . . . . . . . . . . . . . . 2 Configuring basic settings . . . . . . . . . . . . . . . . . . . . . . . . . . . . . . . . . . 2 Configuring management port . . . . . . . . . . . . . . . . . . . . . . . . . . . 2 Enabling the web interface . . . . . . . . . . . . . . . . . . . . . . . . . . . . . . 4 Setting up secure web access . . . . . . . . . . . . . . . . . . . . . . . . . . . . . . . 4 Generating SSL certificates. . . . . . . . . . . . . . . . . . . . . . . . . . . . . . 4 Enabling HTTPS . . . . . . . . . . . . . . . . . . . . . . . . . . . . . . . . . . . . . . . 5 Chapter 2 Navigating the Web Interface In this chapter . . . . . . . . . . . . . . . . . . . . . . . . . . . . . . . . . . . . . . . . . . . . 7 Web interface overview. . . . . . . . . . . . . . . . . . . . . . . . . . . . . . . . . . . . . 7 Layout. . . . . . . . . . . . . . . . . . . . . . . . . . . . . . . . . . . . . . . . . . . . . . . . . . . 8 Navigation . . . . . . . . . . . . . . . . . . . . . . . . . . . . . . . . . . . . . . . . . . . . . . . 9 Getting guidance . . . . . . . . . . . . . . . . . . . . . . . . . . . . . . . . . . . . . . 9 Chapter 3 Navigating the Dashboard In this chapter . . . . . . . . . . . . . . . . . . . . . . . . . . . . . . . . . . . . . . . . . . . 11 Dashboard overview . . . . . . . . . . . . . . . . . . . . . . . . . . . . . . . . . . . . . . 11 ServerIron ADX Graphical User Interface Guide 53-1002412-01 iii System view . . . . . . . . . . . . . . . . . . . . . . . . . . . . . . . . . . . . . . . . . . . . . 12 Traffic view. . . . . . . . . . . . . . . . . . . . . . . . . . . . . . . . . . . . . . . . . . . . . . 13 Section I Chapter 4 Configuring the ADX Configuration Overview In this chapter . . . . . . . . . . . . . . . . . . . . . . . . . . . . . . . . . . . . . . . . . . . 17 Navigating the configuration tab . . . . . . . . . . . . . . . . . . . . . . . . . . . . 17 Saving the configuration. . . . . . . . . . . . . . . . . . . . . . . . . . . . . . . . . . . 18 Chapter 5 System Settings In this chapter . . . . . . . . . . . . . . . . . . . . . . . . . . . . . . . . . . . . . . . . . . . 19 General settings . . . . . . . . . . . . . . . . . . . . . . . . . . . . . . . . . . . . . . . . . 19 Configuring basic system settings . . . . . . . . . . . . . . . . . . . . . . . 19 Changing the system limits . . . . . . . . . . . . . . . . . . . . . . . . . . . . . 20 Viewing and saving the configuration. . . . . . . . . . . . . . . . . . . . . 22 High Availability . . . . . . . . . . . . . . . . . . . . . . . . . . . . . . . . . . . . . . . . . . 22 HA overview . . . . . . . . . . . . . . . . . . . . . . . . . . . . . . . . . . . . . . . . . 23 Configuring the ADX in hot standby mode . . . . . . . . . . . . . . . . . 23 Configuring the ADX in symmetric mode . . . . . . . . . . . . . . . . . . 26 User management. . . . . . . . . . . . . . . . . . . . . . . . . . . . . . . . . . . . . . . . 29 Basic user management . . . . . . . . . . . . . . . . . . . . . . . . . . . . . . . 29 Managing role-based users. . . . . . . . . . . . . . . . . . . . . . . . . . . . . 29 Creating contexts . . . . . . . . . . . . . . . . . . . . . . . . . . . . . . . . . . . . . 32 Creating role templates . . . . . . . . . . . . . . . . . . . . . . . . . . . . . . . . 33 Chapter 6 Network Settings In this chapter . . . . . . . . . . . . . . . . . . . . . . . . . . . . . . . . . . . . . . . . . . . 35 Configuring network interfaces and IP addresses . . . . . . . . . . . . . . 35 Configuring IP addresses for the interface. . . . . . . . . . . . . . . . . 37 Enabling or disabling an interface . . . . . . . . . . . . . . . . . . . . . . . 38 Configuring static routes. . . . . . . . . . . . . . . . . . . . . . . . . . . . . . . . . . . 38 Configuring source IP addresses . . . . . . . . . . . . . . . . . . . . . . . . . . . . 40 Configuring source IP addresses in switch code . . . . . . . . . . . . 40 Configuring source NAT IP addresses on router code . . . . . . . . 42 Configuring VLANs. . . . . . . . . . . . . . . . . . . . . . . . . . . . . . . . . . . . . . . . 43 Chapter 7 Traffic Settings In this chapter . . . . . . . . . . . . . . . . . . . . . . . . . . . . . . . . . . . . . . . . . . . 47 Global traffic settings . . . . . . . . . . . . . . . . . . . . . . . . . . . . . . . . . . . . . 47 iv ServerIron ADX Graphical User Interface Guide 53-1002412-01 Virtual servers . . . . . . . . . . . . . . . . . . . . . . . . . . . . . . . . . . . . . . . . . . . 49 Creating a virtual server . . . . . . . . . . . . . . . . . . . . . . . . . . . . . . . 49 Creating a virtual server port . . . . . . . . . . . . . . . . . . . . . . . . . . . 52 Binding the virtual server port . . . . . . . . . . . . . . . . . . . . . . . . . . 56 Enabling or disabling a virtual server . . . . . . . . . . . . . . . . . . . . . 57 Real servers. . . . . . . . . . . . . . . . . . . . . . . . . . . . . . . . . . . . . . . . . . . . . 58 Creating a basic real server . . . . . . . . . . . . . . . . . . . . . . . . . . . . 58 Setting predictors for real servers . . . . . . . . . . . . . . . . . . . . . . . 60 Creating a real server port . . . . . . . . . . . . . . . . . . . . . . . . . . . . . 62 Configuring health check parameters for a real server port. . . 64 Enabling or disabling a real server . . . . . . . . . . . . . . . . . . . . . . . 65 Creating a real server group . . . . . . . . . . . . . . . . . . . . . . . . . . . . 66 Binding a real server group . . . . . . . . . . . . . . . . . . . . . . . . . . . . . 67 Health checks . . . . . . . . . . . . . . . . . . . . . . . . . . . . . . . . . . . . . . . . . . . 68 Enabling Layer 2 to Layer 4 health checks . . . . . . . . . . . . . . . . 68 Creating a port profile . . . . . . . . . . . . . . . . . . . . . . . . . . . . . . . . . 70 Defining advanced parameters for a port profile . . . . . . . . . . . 72 Creating a port policy. . . . . . . . . . . . . . . . . . . . . . . . . . . . . . . . . . 73 Configuring element health checks . . . . . . . . . . . . . . . . . . . . . . 76 Configuring a match list policy . . . . . . . . . . . . . . . . . . . . . . . . . . 79 Content switching . . . . . . . . . . . . . . . . . . . . . . . . . . . . . . . . . . . . . . . . 81 Creating content switching policies . . . . . . . . . . . . . . . . . . . . . . 81 OpenScript . . . . . . . . . . . . . . . . . . . . . . . . . . . . . . . . . . . . . . . . . . . . . . 98 Creating scripts . . . . . . . . . . . . . . . . . . . . . . . . . . . . . . . . . . . . . . 98 Binding scripts . . . . . . . . . . . . . . . . . . . . . . . . . . . . . . . . . . . . . . . 99 Configuring script profiles . . . . . . . . . . . . . . . . . . . . . . . . . . . . .100 Chapter 8 Security Settings In this chapter . . . . . . . . . . . . . . . . . . . . . . . . . . . . . . . . . . . . . . . . . .103 SSL certificates . . . . . . . . . . . . . . . . . . . . . . . . . . . . . . . . . . . . . . . . .103 Generating private keys. . . . . . . . . . . . . . . . . . . . . . . . . . . . . . .103 Uploading private keys. . . . . . . . . . . . . . . . . . . . . . . . . . . . . . . .105 Generating Certificate Signing Requests . . . . . . . . . . . . . . . . .105 Uploading the existing certificates . . . . . . . . . . . . . . . . . . . . . . 107 Generating self-signed certificates. . . . . . . . . . . . . . . . . . . . . . 107 SSL profiles . . . . . . . . . . . . . . . . . . . . . . . . . . . . . . . . . . . . . . . . . . . .108 Creating SSL profiles . . . . . . . . . . . . . . . . . . . . . . . . . . . . . . . . .108 Managing TCP profile. . . . . . . . . . . . . . . . . . . . . . . . . . . . . . . . .111 Binding the profiles . . . . . . . . . . . . . . . . . . . . . . . . . . . . . . . . . .112 Creating certificate revocation list . . . . . . . . . . . . . . . . . . . . . .114 Access Control Lists . . . . . . . . . . . . . . . . . . . . . . . . . . . . . . . . . . . . .115 Configuring standard ACLs . . . . . . . . . . . . . . . . . . . . . . . . . . . .115 Configuring extended ACLs . . . . . . . . . . . . . . . . . . . . . . . . . . . .116 Configuring IPv6-based ACL . . . . . . . . . . . . . . . . . . . . . . . . . . .119 ServerIron ADX Graphical User Interface Guide 53-1002412-01 v Section II Chapter 9 Monitoring the ADX Monitoring Overview In this chapter . . . . . . . . . . . . . . . . . . . . . . . . . . . . . . . . . . . . . . . . . .125 Navigating the monitoring tab . . . . . . . . . . . . . . . . . . . . . . . . . . . . .125 Chapter 10 Viewing System Information In this chapter . . . . . . . . . . . . . . . . . . . . . . . . . . . . . . . . . . . . . . . . . .127 System summary. . . . . . . . . . . . . . . . . . . . . . . . . . . . . . . . . . . . . . . .127 System log entries. . . . . . . . . . . . . . . . . . . . . . . . . . . . . . . . . . . . . . .132 Chapter 11 Viewing Network Status In this chapter . . . . . . . . . . . . . . . . . . . . . . . . . . . . . . . . . . . . . . . . . .135 Interface statistics . . . . . . . . . . . . . . . . . . . . . . . . . . . . . . . . . . . . . .135 Viewing interface details . . . . . . . . . . . . . . . . . . . . . . . . . . . . . .136 IP statistics . . . . . . . . . . . . . . . . . . . . . . . . . . . . . . . . . . . . . . . . . . . .139 ICMP Statistics . . . . . . . . . . . . . . . . . . . . . . . . . . . . . . . . . . . . . . 141 TCP statistics . . . . . . . . . . . . . . . . . . . . . . . . . . . . . . . . . . . . . . .144 UDP statistics . . . . . . . . . . . . . . . . . . . . . . . . . . . . . . . . . . . . . . .145 ARP cache statistics . . . . . . . . . . . . . . . . . . . . . . . . . . . . . . . . . . . . .146 MAC statistics . . . . . . . . . . . . . . . . . . . . . . . . . . . . . . . . . . . . . . . . . .148 Chapter 12 Viewing Traffic Statistics In this chapter . . . . . . . . . . . . . . . . . . . . . . . . . . . . . . . . . . . . . . . . . .151 Global traffic . . . . . . . . . . . . . . . . . . . . . . . . . . . . . . . . . . . . . . . . . . .151 Virtual servers . . . . . . . . . . . . . . . . . . . . . . . . . . . . . . . . . . . . . . . . . .153 Virtual servers . . . . . . . . . . . . . . . . . . . . . . . . . . . . . . . . . . . . . .153 Virtual server ports . . . . . . . . . . . . . . . . . . . . . . . . . . . . . . . . . .156 Real servers. . . . . . . . . . . . . . . . . . . . . . . . . . . . . . . . . . . . . . . . . . . .159 Real server . . . . . . . . . . . . . . . . . . . . . . . . . . . . . . . . . . . . . . . . .159 Real server ports . . . . . . . . . . . . . . . . . . . . . . . . . . . . . . . . . . . .162 Content switching . . . . . . . . . . . . . . . . . . . . . . . . . . . . . . . . . . . . . . .165 Content switching policies. . . . . . . . . . . . . . . . . . . . . . . . . . . . .165 Basic content switching statistics. . . . . . . . . . . . . . . . . . . . . . .167 Content rewrite statistics. . . . . . . . . . . . . . . . . . . . . . . . . . . . . .169 OpenScript . . . . . . . . . . . . . . . . . . . . . . . . . . . . . . . . . . . . . . . . . . . . .170 Detailed OpenScript statistics. . . . . . . . . . . . . . . . . . . . . . . . . . 171 Session Information . . . . . . . . . . . . . . . . . . . . . . . . . . . . . . . . . . . . .172 Session summary . . . . . . . . . . . . . . . . . . . . . . . . . . . . . . . . . . .173 Filtering the session table . . . . . . . . . . . . . . . . . . . . . . . . . . . . .173 vi ServerIron ADX Graphical User Interface Guide 53-1002412-01 Chapter 13 Viewing Security Statistics In this chapter . . . . . . . . . . . . . . . . . . . . . . . . . . . . . . . . . . . . . . . . . .175 DoS protection. . . . . . . . . . . . . . . . . . . . . . . . . . . . . . . . . . . . . . . . . .175 Displaying SYN attack details . . . . . . . . . . . . . . . . . . . . . . . . . .175 Displaying other DoS attack details . . . . . . . . . . . . . . . . . . . . . 177 SSL statistics . . . . . . . . . . . . . . . . . . . . . . . . . . . . . . . . . . . . . . . . . . .178 SSL alerts . . . . . . . . . . . . . . . . . . . . . . . . . . . . . . . . . . . . . . . . . .180 SSL profiles . . . . . . . . . . . . . . . . . . . . . . . . . . . . . . . . . . . . . . . .182 SSL client details . . . . . . . . . . . . . . . . . . . . . . . . . . . . . . . . . . . .182 Section III Maintenance Chapter 14 Maintenance Overview In this chapter . . . . . . . . . . . . . . . . . . . . . . . . . . . . . . . . . . . . . . . . . .187 Navigating the maintenance tab . . . . . . . . . . . . . . . . . . . . . . . . . . .187 Chapter 15 Managing Software Images In this chapter . . . . . . . . . . . . . . . . . . . . . . . . . . . . . . . . . . . . . . . . . .189 Uploading the software. . . . . . . . . . . . . . . . . . . . . . . . . . . . . . . . . . .189 Chapter 16 Restarting the System In this chapter . . . . . . . . . . . . . . . . . . . . . . . . . . . . . . . . . . . . . . . . . .191 System restart . . . . . . . . . . . . . . . . . . . . . . . . . . . . . . . . . . . . . . . . . .191 Chapter 17 License Management In this chapter . . . . . . . . . . . . . . . . . . . . . . . . . . . . . . . . . . . . . . . . . .193 License. . . . . . . . . . . . . . . . . . . . . . . . . . . . . . . . . . . . . . . . . . . . . . . .193 Adding a license . . . . . . . . . . . . . . . . . . . . . . . . . . . . . . . . . . . . .194 Deleting a license . . . . . . . . . . . . . . . . . . . . . . . . . . . . . . . . . . .194 Chapter 18 Retrieving System Information for Technical Support In this chapter . . . . . . . . . . . . . . . . . . . . . . . . . . . . . . . . . . . . . . . . . .195 Technical support . . . . . . . . . . . . . . . . . . . . . . . . . . . . . . . . . . . . . . .195 Chapter 19 Accessing the CLI In this chapter . . . . . . . . . . . . . . . . . . . . . . . . . . . . . . . . . . . . . . . . . .197 CLI Access . . . . . . . . . . . . . . . . . . . . . . . . . . . . . . . . . . . . . . . . . . . . .197 ServerIron ADX Graphical User Interface Guide 53-1002412-01 vii Appendix A Appendix A Troubleshooting. . . . . . . . . . . . . . . . . . . . . . . . . . . . . . . . . . . . . . . . .199 Unable to open web interface . . . . . . . . . . . . . . . . . . . . . . . . . .199 Web interface does not reflect changes based on the latest image . . . . . . . . . . . . . . . . . . . . . . . . . . . . . . . . . .200 RSL error (#2032 Stream Error) when launching the web interface . . . . . . . . . . . . . . . . . . . . . . . . . . . . . . . . . . . .200 viii ServerIron ADX Graphical User Interface Guide 53-1002412-01 About This Document In this chapter • Related documentation. . . . . . . . . . . . . . . . . . . . . . . . . . . . . . . . . . . . . . . . . . . • Objectives. . . . . . . . . . . . . . . . . . . . . . . . . . . . . . . . . . . . . . . . . . . . . . . . . . . . . . • How to use this guide . . . . . . . . . . . . . . . . . . . . . . . . . . . . . . . . . . . . . . . . . . . . • Document conventions . . . . . . . . . . . . . . . . . . . . . . . . . . . . . . . . . . . . . . . . . . . • Documentation feedback . . . . . . . . . . . . . . . . . . . . . . . . . . . . . . . . . . . . . . . . . • Requesting technical support. . . . . . . . . . . . . . . . . . . . . . . . . . . . . . . . . . . . . . ix ix ix x xi xi Related documentation The following Brocade documents supplement the information in this guide and can be located at http://www.brocade.com/ethernetproducts. • • • • • ServerIron ADX Advanced Server Load Balancing Guide ServerIron ADX Security Guide ServerIron ADX Server Load Balancing Guide ServerIron ADX Switch and Router Guide ServerIron ADX Administration Guide Objectives This guide is intended to provide instructions for configuring, monitoring, and managing ADX device using the web interface. How to use this guide This guide describes the steps to configure, monitor, and manage the ADX device. Each section contains information about a specific segment of your network configuration. Each chapter in the sections consists of the following information, where possible, and when the information is applicable: • A brief description of the topic • Steps related to the topic ServerIron ADX Graphical User Interface Guide 53-1002412-01 ix Document conventions • Configuration notes for the topic Document conventions This section describes text formatting conventions and important notice formats used in this document. Text formatting The narrative-text formatting conventions that are used are as follows: bold text Identifies command names Identifies the names of user-manipulated GUI elements Identifies keywords Identifies text to enter at the GUI or CLI italic text Provides emphasis Identifies variables Identifies document titles code text Identifies CLI output Command syntax conventions Command syntax in this manual follows these conventions: x command Commands are printed in bold. --option, option Command options are printed in bold. -argument, arg Arguments. [] Optional elements appear in brackets. variable Variables are printed in italics. In the help pages, values are underlined or enclosed in angled brackets < >. ... Repeat the previous element, for example “member[;member...]” value Fixed values following arguments are printed in plain font. For example, --show WWN | Boolean. Elements are exclusive. Example: --show -mode egress | ingress ServerIron ADX Graphical User Interface Guide 53-1002412-01 Documentation feedback Notes The following notice statements are used in this manual. NOTE A note provides a tip, guidance, or advice, emphasizes important information, or provides a reference to related information. ATTENTION An Attention statement indicates potential damage to hardware or data. Documentation feedback Quality is our first concern at Brocade and we have made every effort to ensure the accuracy and completeness of this document. However, if you find an error or an omission, or you think that a topic needs further development, we want to hear from you. Forward your feedback to: [email protected] Provide the title and version number of the document and as much detail as possible about your comment, including the topic heading and page number and your suggestions for improvement. Requesting technical support To contact Technical Support, go to http://www.brocade.com/services-support/index.page for the latest e-mail and telephone contact information. ServerIron ADX Graphical User Interface Guide 53-1002412-01 xi Requesting technical support xii ServerIron ADX Graphical User Interface Guide 53-1002412-01 Chapter 1 Introduction to the ADX Web Interface In this chapter • System requirements . . . . . . . . . . . . . . . . . . . . . . . . . . . . . . . . . . . . . . . . . . . . • Starting the ADX web interface. . . . . . . . . . . . . . . . . . . . . . . . . . . . . . . . . . . . . • Configuring basic settings. . . . . . . . . . . . . . . . . . . . . . . . . . . . . . . . . . . . . . . . . • Setting up secure web access . . . . . . . . . . . . . . . . . . . . . . . . . . . . . . . . . . . . . 1 2 2 4 System requirements The ADX web interface is a browser-based interface that allows you to configure, monitor, and maintain an ADX device. The interface can be used for creating a new configuration, modifying an existing configuration, monitoring the traffic on a device, maintaining the logs, managing software images and licenses, retrieving technical support information. Supported hardware The following hardware platforms are supported for this release: • ServerIron ADX 1000 • ServerIron ADX 4000 • ServerIron ADX 10000 Supported software To access the web interface for all the platforms, your device requires the following software: • Supported application—Adobe Flash Player 10.2 or later • Supported browsers: - Internet Explorer 8.0 or later - Google Chrome - Mozilla Firefox NOTE Other browsers that support Adobe Flash Player 10.2 may also work but have not been validated with this system. ServerIron ADX Graphical User Interface Guide 53-1002412-01 1 1 Starting the ADX web interface Starting the ADX web interface The ADX web interface is included in the system image by default. Before you start the web interface, you must configure the basic settings described in “Configuring basic settings” on page 2. After the initial configuration, you can start accessing the web interface using the default username and password. To start the ADX web interface, perform the following steps. 1. Launch a web browser that has Hypertext Transfer Protocol (HTTP) or Hypertext Transfer Protocol Secure (HTTPS) enabled. To use HTTPS, you must enable HTTPS and install a certificate on the device. For more information on enabling HTTPS on the device, refer to “Setting up secure web access” on page 4. 2. Type http://<IP address> in the address bar on the browser. 3. Press Enter. The Login window is displayed. NOTE The default user name is admin and default password is brocade. After logging in, you must change the default password to ensure security. The password must contain alphanumeric characters. 4. Enter the user name and password, and click OK. To change or re-enter the user name or password, click Clear. NOTE You have three attempts to log in to the web interface. If all three login attempts fail, you will be locked out for 30 minutes. During the locked out period, you cannot log in even if you provide the correct password. The home page of the ADX web interface is displayed. To terminate a session at any time, click Logout on the login bar in the top right corner. Configuring basic settings You must configure the basic settings on the ADX device to view the web interface. This involves configuring the management port and enabling access to the web interface. Configuring management port You must configure the management port by assigning the IP address and the route for the device. To configure the management port, perform the following steps. NOTE The management port supports IPv4 addresses only. The IP address configuration procedure is the same for both HTTP and HTTPS. The steps below vary depending on whether you are running switch code or router code on the ADX device. 2 ServerIron ADX Graphical User Interface Guide 53-1002412-01 Configuring basic settings 1 Connecting to the switch 1. Connect your PC to the ADX console connector using the serial cable. 2. Press Enter to bring up the command line prompt on the PC. Assigning IP address and route in switch code If you are using switch code, enter the following commands. 1. Enable configuration mode. ServerIronADX> ServerIronADX> enable No password has been assigned yet... ServerIronADX# ServerIronADX# config terminal 2. Assign an IP address to the management port. ServerIronADX(config)# interface management 1 ServerIronADX(config-if-mgmt-1)# ip address 1.1.1.1 255.255.255.0 3. Configure a static route (the default route cannot point to the management port). ServerIronADX(config-if-mgmt-1)# ip route 10.54.1.0/24 1.1.1.254 4. Write to memory. ServerIronADX# write memory .Write startup-config in progress. .Write startup-config done. ServerIronADX# Assigning IP address and route in router code If you are using router code, enter the following commands. 1. Enable configuration mode. ServerIronADX> ServerIronADX> enable No password has been assigned yet... ServerIronADX# ServerIronADX# config terminal 2. Configure the management interface. ServerIronADX(config)# interface management 1 3. Assign an IP address. ServerIronADX(config-if-mgmt-1)# ip address 1.1.1.1/24 ServerIronADX(config-if-mgmt-1)# exit 4. Configure a static route (the default route cannot point to the management port). ServerIronADX(config)# ip route 10.54.1.0/24 1.1.1.254 5. Write to memory. ServerIronADX# write memory .Write startup-config in progress. .Write startup-config done. ServerIronADX# ServerIron ADX Graphical User Interface Guide 53-1002412-01 3 1 Setting up secure web access For more information about configuring the management port, refer to the ServerIron ADX Administration Guide. Enabling the web interface To access the web interface, the web management, HTTP, and Simple Object Access Protocol (SOAP) services must be enabled in the device. These services are enabled by default. If these services are not enabled, you can connect to the device using the configured IP address in the CLI. To enable the web management, HTTP, and SOAP services in the device, enter the following commands in the CLI using the configuration mode: ServerIronADX# web-management enable ServerIronADX# web-management http ServerIronADX# web-management soap-service Setting up secure web access The ADX device uses the Secure Socket Layer (SSL) protocol to provide secure management through the web interface. You can set up secure web access (HTTPS) with an SSL server certificate. The SSL protocol uses the digital certificate and a public-private key pair to establish a secure connection to the ADX device. The digital certificate serves to prove the identity of participating entities, while the public-private key pair encrypts or decrypts the data that is sent between these participants. When you access the device through HTTPS, the client and server begin their communication with an SSL handshake. This process initiates the creation of an encrypted connection. If the handshake does not match or your certificate has expired, the connection will not be created. A variety of cryptographic algorithms are supported by SSL. During the "handshaking" process, the DSA public-key cryptosystem is used. After the exchange of keys, a number of ciphers are used that include RC4 and triple-DES for data encryption, and the SHA-1 and MD5 digest algorithm for message authentication. To enable secure access on the device, you must generate an SSL certificate and enable HTTPS on the device. You can generate the SSL digital certificates and private key files from the web interface or from the CLI. To generate a self-signed SSL certificates and private key files from the web interface, refer to “Generating self-signed certificates” on page 107. Generating SSL certificates The SSL digital certificate and private key can either be imported from an external device or self-generated by the ADX device. Importing SSL digital certificates and private key files from CLI To import a digital certificate from the Trivial File Transfer Protocol (TFTP) server, enter the following command. ServerIronADX(config)# ip ssl certificate-data-file tftp <ip address> <certificate file-name> 4 ServerIron ADX Graphical User Interface Guide 53-1002412-01 Setting up secure web access 1 To import a private key from TFTP server, enter the following command. ServerIronADX(config)# ip ssl private-key-file tftp <ip address> <key file-name> After you have imported the digital certificate, enter the following command to enable HTTPS access. ServerIronADX(config)# crypto-ssl certificate generate NOTE Imported certificates must be no larger than 4096 bits. NOTE Only the private keys that are unencrypted with the file size of 512 or 1024 bits are supported. Generating a self-signed SSL certificate To generate a self-signed SSL certificate, enter the following command. ServerIronADX(config)# crypto-ssl certificate generate default_cert Enabling HTTPS To enable HTTPS access, use the following command. ServerIronADX# web-management https ServerIronADX# web-management soap-service If you login through HTTPS, the system prompts you for certificate verification. Click Yes to login to the device. To verify that the web access is enabled correctly, use one of the following methods. • For HTTP access, enter http://<IP address> in the address bar of the browser. Example http://1.1.1.1 • For HTTPS access, enter https://<IP address> in the address bar of the browser. Example https://1.1.1.1 ServerIron ADX Graphical User Interface Guide 53-1002412-01 5 1 6 Setting up secure web access ServerIron ADX Graphical User Interface Guide 53-1002412-01 Chapter Navigating the Web Interface 2 In this chapter • Web interface overview . . . . . . . . . . . . . . . . . . . . . . . . . . . . . . . . . . . . . . . . . . . 7 • Layout . . . . . . . . . . . . . . . . . . . . . . . . . . . . . . . . . . . . . . . . . . . . . . . . . . . . . . . . . 8 • Navigation . . . . . . . . . . . . . . . . . . . . . . . . . . . . . . . . . . . . . . . . . . . . . . . . . . . . . 9 Web interface overview The web interface allows you to configure, monitor, and maintain the device using a standard web browser over Hypertext Transfer Protocol (HTTP) or Hypertext Transfer Protocol Secure (HTTPS). Within the web interface you can perform the following primary tasks: • Configuring the system—This includes configuring basic system settings, network, traffic, and security features in the ADX device, and view the current configuration on the device. For more information on configuring tasks, refer to “Configuring the ADX” on page 15. • Monitoring the system—Monitor status and statistics for various features, and maintain logs. For more information on monitoring tasks, refer to “Monitoring the ADX” on page 123. • Maintaining the system—Manage software images and licenses, and allow reboots, CLI access and retrieval of technical support information for the ADX device. For more information on the maintenance tasks, refer to “Maintenance” on page 185. ServerIron ADX Graphical User Interface Guide 53-1002412-01 7 2 Layout Layout The web interface of the ADX device is illustrated, as shown in Figure 1. 1 2 3 4 5 7 6 8 FIGURE 1 ServerIron ADX home page 3 1 Menu bar 5 Page tab 2 Sidebar 6 Login bar 3 Button bar 7 Main page 4 Task bar 8 Control bar • Login bar—-Includes information regarding your login session along with the links to get additional help. The following options are displayed on the login bar: - Hostname—Host name and the model of the device. User—Username that was used to log in to the device. Context—Context corresponding to the username. Role—Role of the user. Help—Link to the Brocade ADX Community website. Log out—Ends the current session and returns to the login page. • Task bar—Includes tabs for each of the primary GUI tasks. The following tabs are displayed on the task bar. 8 - Dashboard—Displays a summary of the system and its state along with the information about the traffic flowing through the device. - Configure—Allows you to configure the ADX features on the device. Monitor—Displays detailed statistics and status information for the device. Maintain—Provides the ability to manage licenses, upload software, reboot the device, and retrieve information for technical support ServerIron ADX Graphical User Interface Guide 53-1002412-01 Navigation 2 • Menu bar—Allows you to navigate to specific subsections within a primary tab. The menu bar is currently displayed when Dashboard, Configure, and Monitor tabs are selected. The following options are available from the menu bar depending on the primary tabs selected. - System—Displays information related to the system status and configurations including system settings, system limits, high availability, and user management. - Network—Displays information related to the network status or configurations including interface and routing information. - Traffic—Displays information related to the traffic status or configurations including virtual servers, real servers, real server groups, and scripts. - Security—Displays information related to the security status or configurations including Access Control Lists (ACLs), Secure Socket Layer (SSL), Distributed Denial of Service (DDoS) protection. • Sidebar—Provides the basic navigation within a given task and subsection allowing you to view or configure the various entities within the selected task. • Main page—Displays the fields associated with the item that you have selected in the sidebar. - Control bar—Displays the buttons associated with the operations permitted on the current page along with status information about the most recent action taken. - Page tab—Is displayed each time an entity is created or modified or additional details must be configured for the current page. To close a page tab, click the Close button in the top corner of the respective tab. - Button bar—Is displayed when additional parameters must be configured for the feature. Click the respective buttons to provide the information. - Red asterisk (*)—Indicates a required field. Navigation From the task bar, select a primary task (tab) you want to perform. Selecting the tab displays the related subsections in the menu bar. When you select a subsection, the related entities are displayed in the sidebar. By default, the system is set to open the first entity in the sidebar and displays its related fields in the main page. Getting guidance The web interface provides help throughout the web interface. To get help in the web interface, move the cursor over the fields for which you want more information. The tooltip displays field-specific information to assist you when entering configuration data. For example, the System Overall Health field tooltip displays “The health of the entire Device called based on various factors including Temperature, Fan Status, Memory and CPU utilization on all BPs and MPs”. ServerIron ADX Graphical User Interface Guide 53-1002412-01 9 2 10 Navigation ServerIron ADX Graphical User Interface Guide 53-1002412-01 Chapter Navigating the Dashboard 3 In this chapter • Dashboard overview . . . . . . . . . . . . . . . . . . . . . . . . . . . . . . . . . . . . . . . . . . . . 11 • System view . . . . . . . . . . . . . . . . . . . . . . . . . . . . . . . . . . . . . . . . . . . . . . . . . . . 12 • Traffic view . . . . . . . . . . . . . . . . . . . . . . . . . . . . . . . . . . . . . . . . . . . . . . . . . . . . 13 Dashboard overview The Dashboard is the first tab in the ADX web interface. You can use the dashboard to monitor the health and performance of the system based on statistical counters specific to the device or to the traffic flowing through the device. From the menu bar, you can click to view either System or Traffic menu. The System dashboard provides a summary of the entire system and includes device information such as CPU utilization, memory utilization, throughput, and system state. The Traffic dashboard provides a summary of the virtual servers (VIPs) and real servers configured on the device and the related traffic information such as connections per second, average response times per service and overall traffic distribution. By default, the ADX web interface displays the System dashboard after you log in. Both the System and Traffic dashboards have six panes that can be viewed, hidden, resized, and reorganized. The information in the dashboard is automatically updated based on the autorefresh interval that you set. By default, the autorefresh interval is set to 30 seconds. You can change the autorefresh time interval by selecting an interval option from the Auto Refresh list. To disable autorefresh, you can select the On Demand option from the list. You can view the counters in the dashboard in either graphical or tabular format based on your preference. To change the format, click the graph or table icon in the top corner of selected pane. NOTE Graphical view is restricted only to some of the panels in the dashboard. For more information on the icons, refer to Chapter 9, “Monitoring Overview”. You can also view more detailed information about the Dashboard counters by clicking the Details link located at the bottom of each pane. This link directs you to the corresponding detailed counters under the Monitor tab. You can customize the dashboard panels using the following methods: • Use the drag and drop operation to reorganize the panels to the desired area on the dashboard. • In graphical view, select or clear the check box next to the corresponding legend to view or hide a line that represent a legend on the graph. ServerIron ADX Graphical User Interface Guide 53-1002412-01 11 3 System view • Click the maximize or minimize button at the top right of the panel to maximize or minimize the panels. • Click the arrow next to the each individual header column to sort the data in ascending or descending order. System view The System dashboard displays various system information including general summary, throughput, log messages, established connections, and sessions. To view the System dashboard, select the Dashboard tab in the task bar and click System on the menu bar. The System dashboard page is displayed, as shown in Figure 2. FIGURE 2 System dashboard The System Dashboard contains six panels: • System Summary—Displays the following system details: - Model - Version - Hostname - System IP - Serial Number - System Health - HA Status - Interfaces - Uptime • Throughput—Allows you to monitor the total number of packets received and transmitted by the device. • • • • 12 Sessions—Allows you to monitor the total number of sessions created with respect to time. System Log—Allows you to monitor the system log messages and errors in the device. MP/BP Resources—Allows you to monitor the memory and CPU utilization in the device. Total Connections—Allows you to monitor the total number of connections established with the device. ServerIron ADX Graphical User Interface Guide 53-1002412-01 Traffic view 3 Traffic view The Traffic dashboard displays network traffic information including traffic distribution, sessions and connections for service, and service response time. To view the Traffic dashboard, select the Dashboard tab in the task bar and click Traffic on the menu bar. The Traffic dashboard page is displayed, as shown in Figure 3. FIGURE 3 Traffic dashboard The Traffic dashboard contains six panels. • Traffic Summary—Allows you to monitor the status of the virtual servers, real servers, and ports configured on the device in a tabular format. You can also monitor the following: - Total count of virtual servers, real servers, and ports. - Number of virtual servers, real servers, and ports that are disabled. Maximum number virtual servers, real servers, and ports that can be configured on the device. • Throughput by Service—Allows you to monitor the transmission and reception of packets in bits per seconds (BPS) over time based on Hypertext Transfer Protocol (HTTP), Hypertext Transfer Protocol secure (HTTPS), Domain Name System (DNS). • Connections by Service—Allows you to monitor the sessions over time based on HTTP, HTTPS, and DNS. • Traffic Distribution—Ipv4 vs IPv6—Allows you to monitor the client traffic based on IPv4 vs IPv6. • Average Response Time by Service—Allows you to monitor response over time based on HTTP, HTTPS, or DNS. • HTTP Traffic—Allows you to view the HTTP traffic request response. ServerIron ADX Graphical User Interface Guide 53-1002412-01 13 3 14 Traffic view ServerIron ADX Graphical User Interface Guide 53-1002412-01 Section Configuring the ADX I This section describes the Configure features, and includes the following chapters: • Configuration Overview . . . . . . . . . . . . . . . . . . . . . . . . . . . . . . . . . . . . . . . . . . 17 • System Settings . . . . . . . . . . . . . . . . . . . . . . . . . . . . . . . . . . . . . . . . . . . . . . . . 19 • Network Settings . . . . . . . . . . . . . . . . . . . . . . . . . . . . . . . . . . . . . . . . . . . . . . . 35 • Traffic Settings . . . . . . . . . . . . . . . . . . . . . . . . . . . . . . . . . . . . . . . . . . . . . . . . . 47 • Security Settings . . . . . . . . . . . . . . . . . . . . . . . . . . . . . . . . . . . . . . . . . . . . . . 103 ServerIron ADX Graphical User Interface Guide 53-1002412-01 15 16 ServerIron ADX Graphical User Interface Guide 53-1002412-01 Chapter 4 Configuration Overview In this chapter • Navigating the configuration tab . . . . . . . . . . . . . . . . . . . . . . . . . . . . . . . . . . 17 • Saving the configuration . . . . . . . . . . . . . . . . . . . . . . . . . . . . . . . . . . . . . . . . . 18 Navigating the configuration tab The Configure tab is the second tab in the ADX web interface. You can use the Configure tab to configure the system, network, traffic, or security settings on an ADX device. When you click the Configure tab, the following menus are displayed in the menu bar. • System—Allows you to configure the features specific to basic system settings and limits, High Availability (HA), and user management. • Network—Allows you to configure the features specific to interfaces, static routes, source Network Address Translation (NAT) IPs, and Virtual Local Area Networks (VLANs). • Traffic— Allows you to configure the features specific to virtual server, real server, health checks, content switching, and OpenScripts. • Security—Allows you to configure the features specific to Secure Socket Layer (SSL), certificate management, and Access control Lists (ACLs). By default, the ADX web interface displays the System menu after you click the Configure tab. Click a menu that represents the primary task that you want to perform from the menu bar, the corresponding entities specific to the menu are displayed in the sidebar. From the sidebar, select an entity that represents a configuration feature. The corresponding Summary page with a list of configured entities specific to the feature in tabular format is displayed in the main page. For example, when you select the Real Servers entity from the sidebar, the main page displays a summary page with the list of real servers configured in the device. The list displays up to 30 configuration entries. You can navigate to view the next or previous set of configuration information by clicking Next or Previous at the bottom of the Summary page. Click First or Last to go to the most recent or least recent entries. Also, you can select the page number from the list, to go to a specific page. The main page displays the buttons that are used to perform configuration actions as described in Table 1. TABLE 1 Configuration actions Button Description New Allows you to create a new instance of the currently selected entity. Edit Allows you to modify the attributes of the currently selected entity. Delete Allows you to delete a configured entity from the ADX device. All nested configurations within the deleted configured entity are also discarded. ServerIron ADX Graphical User Interface Guide 53-1002412-01 17 4 Saving the configuration TABLE 1 Configuration actions Button Description Apply Applies changes to the running configuration. Reset Reverts the configuration to the previous configured values. Common icons The main page displays the common icons on the top right corner for all the configuration tasks. Table 2 describes the icons displayed on the main page. TABLE 2 Configuration icons Icon Description Filter Allows you to filter the data currently displayed in the Summary page. Click the Filter icon and select the criteria from the Filter Criteria list to filter the data. Auto refresh Refreshes the current page based on the most recent changes made to the running configuration. Includes an option to set the interval at which you want the page has to auto refreshed. Save Saves the running configuration to the startup configuration. Saving the configuration When you change the current configuration or add any new configuration, the device stores the configuration data in the running configuration. To permanently save the configuration to the startup configuration of the device, click the Save button at the top right corner of the main page. 18 ServerIron ADX Graphical User Interface Guide 53-1002412-01 Chapter 5 System Settings In this chapter • General settings . . . . . . . . . . . . . . . . . . . . . . . . . . . . . . . . . . . . . . . . . . . . . . . 19 • High Availability . . . . . . . . . . . . . . . . . . . . . . . . . . . . . . . . . . . . . . . . . . . . . . . . 22 • User management . . . . . . . . . . . . . . . . . . . . . . . . . . . . . . . . . . . . . . . . . . . . . . 29 General settings After you login to the web interface, you can configure the basic system information to identify your device in the network and set the system limits to control the memory usage. Configuring basic system settings You can configure the basic system settings including host name, Simple Network Time Protocol (SNTP) server address, and chassis information. To configure the basic system settings on the device, perform the following steps within the Configure tab. 1. Click System on the menu bar. 2. From the sidebar, click General. The System Configuration page is displayed, as shown in Figure 4. FIGURE 4 Configuring the general settings ServerIron ADX Graphical User Interface Guide 53-1002412-01 19 5 General settings 3. Under System, provide the following information: • Hostname: Enter a host name for the device; for example, ADXHost. When you configure a host name, the name replaces the default system name. The name can contain up to 32 alphanumeric characters. • Serial Number: Displays the serial number of the device. The field is non-editable. 4. Under SNTP, provide the following information: • Address: Enter the SNTP server address to configure the device to consult SNTP servers for the current system time and date. You can add up to three SNTP server addresses. • Interval: Enter the SNTP interval in seconds for the device to poll for clock updates from the SNTP server. The range is from 5 through 3600 seconds. The default interval is 5 seconds. 5. Under Chassis, provide the following information: • Name: Enter the chassis name to assign an administrative ID to the device. • Poll Interval: Enter the poll interval in seconds for the software to read the temperature sensor and poll other hardware sensors according to the set value. The range is from 0 through 65535 seconds. The default interval is 5 seconds. 6. Click Apply to save your entries. Click Reset to revert the configuration to the previous configured values. NOTE All the configuration changes performed in the web interface are stored in the running configuration. Click the Save icon to save the running configuration to the startup configuration. For more information on the basic system settings, refer to the ServerIron ADX Switch and Router Guide. You can use the links under Quick Links to helpful Tasks, to navigate to real servers, virtual servers, health checks, and content switching policy configurations. Changing the system limits You can set the system memory consumption limits to control the device. To configure the system limits on the device, perform the following steps within the Configure tab. 1. Click System on the menu bar. 2. From the sidebar, select General, and then select System Limits. 20 ServerIron ADX Graphical User Interface Guide 53-1002412-01 General settings 5 The System Limits page is displayed, as shown in Figure 5. FIGURE 5 Configuring system limits 3. Provide the following information: • VLANs: Enter the maximum number of Virtual Local Area Networks (VLANs) you want to assign to a group. The range is from 1 through 4095. The default value is 64. • L3 VLANs: Enter the maximum number of Layer 3 VLANs you want to configure on the device. The range is from 0 through 256. The default value is 32. • L4 Virtual Servers: Enter the maximum number of Layer 4 virtual servers you want to configure on the device. The range is from 64 through 1024. The default value is 256. • L4 Real Severs: Enter the maximum number of Layer 4 real servers you want to configure on the device. The range is from 64 through 4096. The default value is 1024. • L4 Server Ports: Enter the number of Layer 4 server ports you want to configure on the device. The range is from 256 through 8192. The default value is 2048. • Sessions: Enter the maximum number of active sessions you want to allow on a device. The range is from 1024 through 163840. The default value is 4096. • SSL Profiles: Enter the maximum number of Secure Socket Layer (SSL) profiles you want to create. The range is from 64 through 1024. The default value is 256. • SSL Certificate Size: Enter the maximum size of the SSL certificate. The range is from 2048 through 16384. The default value is 6144. • SSL Connections: Enter the maximum number of concurrent SSL connections you want to establish on the device. The range is from 512 through 16384. The default value is 8192. • SSL v2 Connections: Enter the maximum number of concurrent SSL v2 connections you want to allow on the device for a second. The range is from 16 through 512. The default is 64. 4. Click Apply to save your entries. Click Reset to Defaults to change all the configured values to the default values. Click Reset to revert the configuration to the previous configured values. ServerIron ADX Graphical User Interface Guide 53-1002412-01 21 5 High Availability NOTE Any change to the system limits requires you to reboot the ADX device for these changes to take effect. It is recommended to save the running configuration to the startup configuration to preserve the changes across reboot. For more details on how to reboot the system, refer to “Restarting the System” on page 191. For more information on setting the system limits, refer the ServerIron ADX Switch and Router Guide and ServerIron ADX Security Guide. Viewing and saving the configuration When you edit a configuration, the changes are implemented in the running configuration. You can view the running configuration and save a local copy of the running configuration. To view the running configuration of the device, perform the following steps within the Configure tab. 1. Click System on the menu bar. 2. From the sidebar, select General, and then select Running Configuration. The Running Configuration page is displayed, as shown in Figure 6. FIGURE 6 Viewing the running configuration Click View Configuration to review the configuration that is currently running on the ADX device. To save a local copy of the running configuration to a text file, click Download Configuration. High Availability High Availability (HA) is a system design and service implementation that prevents downtime and ensures uninterrupted service. 22 ServerIron ADX Graphical User Interface Guide 53-1002412-01 High Availability 5 HA overview To configure the HA feature on the ADX device, the setup requires two ADX devices, where one device must be active and the other device must be in the standby mode. The active device accepts connections and manages servers, and the standby device monitors the active device. If the active device fails to accept connections, the standby device takes over the active device functions. The HA for Server Load Balancing (SLB) consists of the following modes: • Hot standby—This mode requires a setup of two ADX devices, where one device is always active and the other device is always in the standby mode. The chassis devices support the hot standby mode. • Symmetric—This mode requires a setup of two ADX devices, where both the devices can receive SLB traffic and both are active for the same VIP (virtual server). NOTE You can enable only one of the HA modes on the device. For more information on high availability, refer to the ServerIron ADX Server Load Balancing Guide. Configuring the ADX in hot standby mode Hot standby allows you to configure two ADX devices to serve as a redundant pair. One device is always active while the other device is always standby. If the active device fails, the idle standby device assumes the active functions and becomes the new active device. Hot standby is the only HA service counting the number of available router and server ports for failover behavior. The device with the highest number of active ports is declared as the active device. A failover is triggered when a system reload or crash triggers, in addition to the port-count loss. NOTE Hot standby is supported only in switch code. To configure hot standby on the device that runs switch code, perform the following steps within the Configure Tab. 1. Click System on the menu bar. 2. From the sidebar, select High Availability. ServerIron ADX Graphical User Interface Guide 53-1002412-01 23 5 High Availability The High Availability page is displayed, as shown in Figure 7. FIGURE 7 High Availability 3. Select Hot Standby. The Hot Standby page is displayed, as shown in Figure 8. FIGURE 8 Configuring hot standby 4. Under the Basic tab, provide the following information: • Sync VLAN: Select a port-specific VLAN from the list. • Sync Port: Select the hot standby port from the list. Placing the hot standby port in its own VLAN prevents unnecessary traffic from going over the directly connected backup link. • Shared MAC: Specify the MAC address of one of the devices. You must use a chassis MAC address of the devices, not the MAC address of the backup ports. • Router Ports: Select the number of router ports from the Available list and click Add to specify the ports for the active device. Click Remove to remove an added router port. Both the devices in the hot standby must use the same router-ports numbers. 24 ServerIron ADX Graphical User Interface Guide 53-1002412-01 High Availability 5 To configure the advanced parameters for the hot standby configuration: 5. Click the Advance tab. The Advance tab is displayed as shown in Figure 9. FIGURE 9 Hot standby advanced configuration 6. Provide the following information: • Backup Preference: Enter the time interval during which the standby device waits for the configured time before taking the active role. The range is from 5 through 30 minutes. The default value is 5 minutes. • Failover Delay Time: Enter the time in seconds for which the device to wait before beginning the failover check in seconds. The range is from 0 through 1200 seconds. The default value is 0 seconds. • Track Active VIP Count: Select the Enable check box to configure the failover based on the router ports and the active VIP counts. • Track Virtual Port Count: Select the Enable check box to allow the device to track the failure of the virtual port. • Track Trunk Port Count: Select the Enable check box to allow the device to track the failure of the individual ports within a trunk. • Backup Timer: Enter the time for the backup device to wait for a Hello message or synchronization data from the active device before assuming the active device is no longer available. The range is from 5 through 100. The default value is 10. • Backup Interval: The backup interval represents the timer count in units of 100 millisecond. • Backup Group: Enter the backup group ID to configure the hot standby pairs within a single Layer 2 broadcast domain for exchanging the backup information. 7. Click Apply to save your entries. Click Reset to revert the configuration to the previous configured values. For more information on hotstandby configuration, refer to the ServerIron ADX Server Load Balancing Guide. ServerIron ADX Graphical User Interface Guide 53-1002412-01 25 5 High Availability Configuring the ADX in symmetric mode In the symmetric mode, both the ADX devices handle SLB traffic, and both the devices are active for the same VIP. This mode is supported only on chassis systems. NOTE Symmetric active-active mode is supported in both switch code and router code. Configuring symmetric mode on the device involves the following configurations: • Setting up a symmetric port • Setting up a VIP group Setting up a symmetric port You can specify a synchronization link (port and VLAN ID) for symmetric SLB to automatically detect the synchronization link failure and revert to the dynamic detection of the communication links. To configure the symmetric active-active mode on a device, perform the following steps within the Configure tab: 1. Click System on the menu bar. 2. From the sidebar, select High Availability, and then select Symmetric. The Symmetric page is displayed, as shown in Figure 10. FIGURE 10 Setting up a symmetric port 3. Under the Synchronization (Symmetric) Port, provide the following information: • Sync VLAN: Select a VLAN from the list to specify the dedicated VLAN for symmetric packets. • Sync Port: Select a port from the list to specify the dedicated port for the symmetric packets. 4. Under the Active-Active Port, provide the following information: • Sync VLAN: Select a VLAN from the list to specify the VLAN used for the active-active traffic. • Sync Port: Select a port from the list to specify the port used for the active-active traffic. 26 ServerIron ADX Graphical User Interface Guide 53-1002412-01 High Availability 5 NOTE The active-active port is used to synchronize NAT, syn-proxy, and other non-SLB related sessions. 5. Under Advanced settings, enter the following information: • Symmetric PDU rate The send interval is pre-set to 200 milliseconds.By default, a device in an Symmetric SLB (SSLB) configuration sends discovery packets at an interval of 200 milliseconds. In the Discover Multiplier field, enter the multiplier for the SSLB send and wait interval. The range is from 1 through 60. The default value is 1. In the Wait Time Multiplier field, enter the number of multiples interval the device waits for an SSLB discovery packet. The range is from 1 through 60. The default value is 20. • Delay Symmetric: Click Enable to set the delay for reactivating a recovered device in an SSLB configuration, and enter the delay in minutes. The range is from 2 through 120 minutes. The default value is 2 minutes. • Group ID: Enter the SSLB group ID. The range is from 1 through 7. The default is 1. 6. Click Apply to save your entries. Click Reset to revert the configuration to the previous configured values. Setting up a VIP group In symmetric configurations with Virtual Router Redundancy Protocol Extended (VRRP-E), when the device switches from active to standby state, you can enable simultaneous VIP failover if the VRRP-E fails over to a standby device. To enable this feature, you must define a VIP group with several VIP addresses and bind the VIP group to a virtual router ID (VRID). To set up a VIP group on the device, perform the following steps with the Configure tab. 1. Click System on the menu bar. 2. From the sidebar, select High Availability, and then select VIP Groups. The Summary page is displayed, as shown in Figure 11. FIGURE 11 Setting up a VIP group ServerIron ADX Graphical User Interface Guide 53-1002412-01 27 5 High Availability The Summary page displays the list of configured VIP groups, 30 entries at a time. Each entry in the list includes the name of the group, configured interface, and the number of VIPs in that group. 3. Click New at the bottom of the VIP Groups page. The VIP Group - new page tab is displayed, as shown in Figure 12. FIGURE 12 Configuring a VIP group 4. Provide the following information: • VIP Group ID: Enter the identifier for the VIP group that includes multiple VIP addresses. The range is from 1 through 100. • Members VIP: Select the VIPs from the Available VIPs list and click Add to add it to the Selected VIPs list. NOTE Click Add All to add all the VIPs entries in the available list to the selected list. Also, you can delete the VIPs from the selected list, by clicking Remove or Remove All. • Interface: Select an interface that you want to include in the VIP group. • Virtual Interface: Enter the number of virtual interfaces. The range is from 1 through 64. The default value is 1. NOTE The device will consider either the interface details or virtual interface details. If you provide the interface details, then the virtual interface will not be considered. • Associate VRRP-E VRID: Enter the VRRP-E VRID number that must be associated with the VIP group. The range is from 1 through 10. The default value is 1. 5. Click Apply to save your entries. Click Reset to revert the configuration to the previous configured values. 28 ServerIron ADX Graphical User Interface Guide 53-1002412-01 User management 5 To modify the configured VIP group entry, in the Summary table, select an entry and click Edit or double-click the entry. Click Delete to delete a VIP group configuration. For more information on the VIP groups, refer to the ServerIron ADX Server Load Balancing Guide. User management User management allows restricting or authorizing system access for the users based on their context. You can view the user name, role and context associated with the logged in user in the login bar, as shown in Figure 13. FIGURE 13 Viewing user management information Basic user management You can configure three types of users in the device: • Super user—A super user has admin access privileges and can view, edit and delete all configurations. Only a super user can create new users. You must have a super-user account to make further administrative changes. • Read-only user—A read-only user has only view permissions and all the configuration buttons including new, edit and delete are disabled. • Role-based user—A role-based user has permissions to perform certain operations based on their roles. Managing role-based users As a role-based user, a user can be assigned with three different roles: • Manager—A user defined under manager role has view, edit, and delete permissions. • Operator—A user defined under operator role has read-only permissions. • Viewer—A user defined under viewer role has read-only permissions. There are two types of configurations in the device. • Global configuration—It refers to Layer 2, Layer 3, and other miscellaneous configurations on the device. • Context-related configurations—It includes real server, virtual server, content switching, openscript, and session. In general, all the traffic-related configurations are related to context. In the role-based configuration, you can assign the user with different combination of roles for global configurations and context-related configurations. For example, you can assign manager role for global configuration and viewer role for context-related configurations. To create a user on the device, perform the following steps with the Configure tab. 1. Click System on the menu bar. 2. From the sidebar, select User Management. ServerIron ADX Graphical User Interface Guide 53-1002412-01 29 5 User management The Users page is displayed, as shown in Figure 14. FIGURE 14 User management summary The Users page displays the list of configured user accounts. Each entry in the list includes the user name, user type, associated role template and context. 3. Click New at the bottom of the Summary page. The User - new page tab is displayed, as shown in Figure 15. FIGURE 15 Creating a user 4. Under the User Information tab, provide the following information: • User Name: Enter a unique name for the local user account. • User Type: Click Super User, Role Based User, or Read Only User based on the privilege level. 30 ServerIron ADX Graphical User Interface Guide 53-1002412-01 User management 5 NOTE The options in the Role Based Settings tab are enabled only when you click Role Based User type. For more information on the configuration of role-based user, refer to “Assigning user role” on page 31. • Change Password: Select the Yes check box to change the password. • Password: Enter the password with a minimum of eight characters. The password is always masked to ensure security. • Confirm Password: Enter the password again for confirmation. • Password Expiry Time (days): Enter the number of days for the password validity. The range is from 1 through 365 days. The default is 90 days. 5. Click Apply to save your entries. Click Reset to revert the configuration to the previous configured values. To modify the configured user information, in the Summary table, select an entry and click Edit or double-click the entry. You can also delete a user by clicking Delete. NOTE You cannot delete the user currently logged in to the device. Assigning user role When you click the user type as role-based, the fields under the Role Based Settings page tab are enabled. The Role Based Settings page tab is displayed, as shown in Figure 16. FIGURE 16 Assigning user role 6. Provide the following information: • Global (non-Context) Config: Click None, Viewer, or Manager to assign a role for the global configuration pages. ServerIron ADX Graphical User Interface Guide 53-1002412-01 31 5 User management • Default Context: Select the context that has to be associated with the user by default. • Role Template: Select the role template that is to be associated with the user. • Under Context/Role Mappings, enter the following information: New Context Name: Select a context name that you want to assign to the user. Role: Select a role that you want to assign to the user. Click Add. The context names along with their respective roles are displayed in the table. NOTE To delete a context-role mapping entry from the table, select an entry from the table and click Delete. Click Delete All to delete all the entries. 7. Click Apply to save your entries. Click Reset to revert the configuration to the previous configured values. For more information on role based users, refer to the ServerIron ADX Administration Guide. Creating contexts After login, the user is automatically associated with the configured context or default context. To edit the context-related configurations, the user must be associated with that context. Within a context, a user can be a manager, operator, or viewer of the context-related configurations. A user can navigate to different contexts by selecting the context name in the login bar. To create a context on the device, perform the following steps within the Configure tab. 1. Click System on the menu bar. 2. From the sidebar, select User Management, and then select Contexts. The Contexts page is displayed, as shown in Figure 17 FIGURE 17 Creating context 3. Enter the context name, for example, Finance in the Context Name field. 4. Click Add. The context name is displayed in the Current Contexts table. 32 ServerIron ADX Graphical User Interface Guide 53-1002412-01 User management 5 To delete a context configuration, select an entry from the Current Contexts table and click Delete. NOTE A context cannot be deleted if it is referenced. For more information on creating the contexts, refer to the ServerIron ADX Administration Guide. Creating role templates For simplicity of the configuration, the super user can create a role template with specific roles assigned for global and context-related configurations. You can assign the role template to the user to grant the privileges in the template. To create a role template on the device, perform the following steps within the Configure tab. 1. Click System on the menu bar. 2. From the sidebar, select User Management, and then select Role Templates. The Role Templates page is displayed, as shown in Figure 18. FIGURE 18 Role templates summary The Role Templates page displays the list of configurated role templates, 30 entries at a time. Each entry includes role template name, role, default context, and its active status. 3. Click New at the bottom of the Role Templates page. ServerIron ADX Graphical User Interface Guide 53-1002412-01 33 5 User management The Role Template - new page tab is displayed, as shown in Figure 19. FIGURE 19 Creating role template 4. Provide the following information: • Role Template Name: Enter the name of the role template. • Default Context: Select the context you want to associate with the user by default. • Global (non-Context) Config: Click None, Viewer, or Manager to assign a role for the global configurations. 5. In the Context/Role Mappings, provide the following information: • New Context Name: Select a context you want to associate with the role template. • Role: Select a role you want to associate with the role template. • Click Add. The context names with their respective roles are displayed in the table. NOTE To delete a context-role mapping from the table, select an entry from the table and click Delete. Click Delete All to delete all the entries. 6. Click Apply to save your entries. Click Reset to revert the configuration to the previous configured values. For more information on role templates, refer to the ServerIron ADX Administration Guide. 34 ServerIron ADX Graphical User Interface Guide 53-1002412-01 Chapter 6 Network Settings In this chapter • Configuring network interfaces and IP addresses . . . . . . . . . . . . . . . . . . . . • Configuring static routes . . . . . . . . . . . . . . . . . . . . . . . . . . . . . . . . . . . . . . . . . • Configuring source IP addresses . . . . . . . . . . . . . . . . . . . . . . . . . . . . . . . . . . • Configuring VLANs . . . . . . . . . . . . . . . . . . . . . . . . . . . . . . . . . . . . . . . . . . . . . . 35 38 40 43 Configuring network interfaces and IP addresses The device allows you to edit the interface configurations. To edit an IP address on the device, perform the following steps within the Configure tab. 1. Click Network on the menu bar. 2. From the sidebar, select Interface. The Summary page is displayed, as shown in Figure 20. FIGURE 20 Interface summary The Summary page displays a list of configured IP interfaces. Each entry in the list includes the interface ID, MAC address, interface name, status, and type. 3. Select an interface from the Summary page and click Edit. ServerIron ADX Graphical User Interface Guide 53-1002412-01 35 6 Configuring network interfaces and IP addresses The IP interface - 1 page tab is displayed, as shown in Figure 21. FIGURE 21 Editing an interface 4. Provide the following information: • Interface ID: Displays the ID assigned to the interface. • MAC Address: Displays the MAC address of the interface. • Interface name: Enter a unique name for the interface. The interface name is represented by the physical and logical parts. • Auto Negotiation: Click the Enable check box to deactivate the auto-negotiation feature. By default, the auto-negotiation feature is enabled to create a link between the master and the backup devices. NOTE The Speed, Duplex, and FlowControl fields are enabled only if you disable the auto-negotiation feature. • Speed: Click 10M, 100M, 1G, or 10G to set the speed for the port. • Duplex: Click Half or Full to set the duplex mode for the port. • FlowControl: Click the Enable check box to deactivate flow control. By default, the flow control is enabled. 5. Click Apply to save your entries. Click Reset to revert the configuration to the previous configured values. For more information on the network interfaces, refer to the ServerIron ADX Switch and Router Guide. 36 ServerIron ADX Graphical User Interface Guide 53-1002412-01 Configuring network interfaces and IP addresses 6 Configuring IP addresses for the interface To configure an IP address for the interface, perform the following steps within the Configure tab. 1. Click Network on the menu bar. 2. From the sidebar, select Interface. 3. From the Summary page, select an interface entry from the list. 4. Click IP addresses. The IP Address page tab is displayed, as shown in Figure 22. FIGURE 22 Configuring an IP address 5. Provide the following information: • • • • Interface ID: Displays the ID assigned to the interface. MAC Address: Displays the MAC address of the interface. IP Address: Enter the IP address of the network interface. Mask: For IPv4, enter the subnet mask in class-based format. For IPv6, select the Use Prefix check box and enter the prefix length. • Click Add to save the configuration. The configured IP address details are displayed in the table. NOTE To delete an IP address entry, select an IP address entry from the table and click Delete. For more information on the IP addresses configuration, refer to the ServerIron ADX Switch and Router Guide. ServerIron ADX Graphical User Interface Guide 53-1002412-01 37 6 Configuring static routes Enabling or disabling an interface You can enable or disable an interface from the Summary page. To enable or disable a virtual server, perform the following steps within the Configure tab. 1. Click Network on the menu bar. 2. From the sidebar, select Interfaces. The list of all the configured interfaces is displayed in the main page as shown in Figure 23. FIGURE 23 Enabling or disabling an interface 3. Select an interface from the table and perform one of the following actions: • Click Enable at the bottom of the Summary page to enable the interface. • Click Disable to disable the interface. For more information on enabling or disabling an interface, refer to the ServerIron ADX Switch and Router Guide. Configuring static routes The device uses static routes, when it does not have a route or cannot determine a route to a destination. You can configure multiple static routes for load balancing and path redundancy. To add a static route on the device, perform the following steps within the Configure tab. 1. Click Network on the menu bar. 2. From the sidebar, select Static Routes. 38 ServerIron ADX Graphical User Interface Guide 53-1002412-01 Configuring static routes 6 The Summary page is displayed, as shown in Figure 24. FIGURE 24 Static routes summary The Summary page displays the list of configured static routes. Each entry in the list includes the destination network, subnet mask, gateway, metric, and distance information. 3. Click New at the bottom of the Summary page. The Static Route - new page tab is displayed, as shown in Figure 25. FIGURE 25 Configuring static route 4. Provide the following information: • IP Version: Click IPv4 or IPv6 to select the version of the IP address. By default, IPv4 is selected. • Destination Network: Enter the IP address of the destination route. • Subnet Mask: Enter the subnet mask in a class-based format. ServerIron ADX Graphical User Interface Guide 53-1002412-01 39 6 Configuring source IP addresses • Gateway: For IPv4, click either the IP Address or Interface field to provide the information. For IPv6, enter the information for both IP Address and Interface. IP Address—The IP address of the gateway. Interface—The interface of the gateway. Metric: Enter the value for comparing two routes for the same destination in the IP route table. The range is from 1 through 16. The default metric is 1. • • Distance: Enter the distance value for comparing a route with routes from other route sources to the same destination before adding the route in the IP route table. The range is from 1 through 255. The default value is 1. 5. Click Apply to save the entries. Click Reset to revert the configuration to the previous configured values. To modify the configured static route information, in the Summary table, select an entry and click Edit or double-click the entry. You can also delete a configuration by clicking Delete. For more information on the static routes, refer to the ServerIron ADX Switch and Router Guide. Configuring source IP addresses You can configure the source IP addresses on the device to allow communication with other devices and real servers in different subnets. The source IP address configuration is different for switch and router codes. Configuring source IP addresses in switch code You can define source IP addresses on the device to add you device in a multinetted environment. You can configure three types of source IP addresses on the switch code. • Source IP—The IP address used as default gateways for real servers. • Source NAT IP—The IP address used as the source for sending packets to real server. • Source standby IP—The shared IP address used as a default gateway for the real servers in hot standby configurations. To configure the source IP addresses on the device, perform the following steps within the Configure tab. 1. Click Network on the menu bar. 2. From the sidebar, select Source IPs. 40 ServerIron ADX Graphical User Interface Guide 53-1002412-01 Configuring source IP addresses 6 The Summary page is displayed, as shown in Figure 26. FIGURE 26 Source IP summary The Summary page displays the list of configured source IP addresses. Each entry in the list includes IP address, subnet, default gateway, and the source port for the real servers. 3. Click New at the bottom of the Summary page. The Source IPs - new page tab is displayed, as shown in Figure 27. FIGURE 27 Configuring source NAT IP 4. Provide the following information: • IP Type: Click Source IP, Source NAT IP, or Source Standby IP to enter respective configurations. • IP Address: Enter the source IP address. • Subnet Mask: Enter the subnet mask or select the Use Prefix check box and enter the prefix length. The range is from 0 through 60. The default is 24. • Default Gateway: Enter the IP address of the default gateway for the device. • Source Port Range: Select Lower Port Range or Higher Port Range to specify the device with port range to indicate higher priority for the source NAT IP. NOTE The Source Port Range field is enabled only when you select the IP type as Source NAT IP ServerIron ADX Graphical User Interface Guide 53-1002412-01 41 6 Configuring source IP addresses • Allocate Source Port per Real Server: Select the check box to if you want to allocate the source port on the real server. 5. Click Apply to save your entries. Click Reset to revert the configuration to the previous configured values. To delete the configured source IP address information, select an entry from the Summary table and click Delete. For more information on the source NAT IP, refer to the ServerIron ADX Security Guide. Configuring source NAT IP addresses on router code To define source IP address on the device, perform the following steps within the Configure tab. 1. Click Network on the menu bar. 2. From the sidebar, select Source NAT IPs. The Summary page is displayed, as shown in Figure 28. FIGURE 28 Source NAT IP summary The Summary page displays the list of configured source NAT IP addresses. Each entry in the list includes IP address, subnet, default gateway, and the source port for the real servers. 3. Click New at the bottom of the Summary page. 42 ServerIron ADX Graphical User Interface Guide 53-1002412-01 Configuring VLANs 6 The Source NAT IPs - new page tab is displayed, as shown in Figure 29. FIGURE 29 Configuring source NAT IP 4. Provide the following information: • IP Address: Enter the source IP address for sending packets to the real server. • Subnet Mask: For IPv4, enter the subnet mask in class-based format. For IPv6, select the Use Prefix check box to enter the prefix length. • Default Gateway: Enter the IP address of the default gateway. • Source Port Range: Click Lower Port Range or Higher Port Range to specify the device with port range to indicate higher priority for the source NAT IP. • Allocate Source Port per Real Server: Select the check box if you want to allocate the source port on the real server. 5. Click Apply to save your entries. Click Reset to revert the configuration to the previous configured values. To delete the configured source NAT IP address information, select an entry from the Summary table and click Delete. For more information on the source IP addresses, refer to the ServerIron ADX Server Load Balancing Guide. Configuring VLANs You can configure two types of Virtual Local Area Networks (VLANs); port-based VLANs and IP subnet VLANs. To configure VLAN on the device, perform the following steps within the Configure tab. 1. Click Network on the menu bar. 2. From the sidebar, select VLAN. ServerIron ADX Graphical User Interface Guide 53-1002412-01 43 6 Configuring VLANs The Summary page is displayed, as shown in Figure 30. FIGURE 30 VLAN summary The Summary page displays a list of configured VLANs. Each entry in the list includes VLAN name, router interface, VLAN ports, and the associated spanning tree status. 3. Click New at the bottom of the Summary page. The VLAN - new page tab is displayed, as shown in Figure 31. FIGURE 31 Configuring a VLAN 4. Provide the following information: • VLAN: Select the VLAN from the list. • VLAN Name: Enter the name of the VLAN. The name can contain 16 alphanumeric characters and you can use blank spaces in the name if you enclose the name in double quotes. 44 ServerIron ADX Graphical User Interface Guide 53-1002412-01 Configuring VLANs 6 • Router Interface: Select the Use check box for the routing interface to locally route the IP packets from an IP subnet VLAN to the port-based VLAN on the same router. The range is from 1 through 64. The default value is 24. • Spanning Tree: Select the Enable check box to enable the spanning tree on the VLAN to detect and eliminate logical loops in the network. 5. Under Port Members, do the following tasks: • Tag: Select the check box only if a port connecting the devices is a member of one or more port-based VLAN. • Select the ports from the Available Ports list and click Add to add the ports to the Selected Ports list. NOTE To remove a port from the Selected Ports list, click Remove. To remove all the ports from the selected list, click Remove All. 6. Click Apply to save your entries. Click Reset to revert the configuration to the previous configured values. To modify the configured VLAN information, in the Summary table, select an entry and click Edit or double-click the entry. You can also delete a configuration by clicking Delete. For more information on the VLAN configuration, refer to the ServerIron ADX Switch and Router Guide. ServerIron ADX Graphical User Interface Guide 53-1002412-01 45 6 46 Configuring VLANs ServerIron ADX Graphical User Interface Guide 53-1002412-01 Chapter 7 Traffic Settings In this chapter • Global traffic settings . . . . . . . . . . . . . . . . . . . . . . . . . . . . . . . . . . . . . . . . . . . • Virtual servers . . . . . . . . . . . . . . . . . . . . . . . . . . . . . . . . . . . . . . . . . . . . . . . . . • Real servers . . . . . . . . . . . . . . . . . . . . . . . . . . . . . . . . . . . . . . . . . . . . . . . . . . . • Health checks . . . . . . . . . . . . . . . . . . . . . . . . . . . . . . . . . . . . . . . . . . . . . . . . . • Content switching . . . . . . . . . . . . . . . . . . . . . . . . . . . . . . . . . . . . . . . . . . . . . . • OpenScript . . . . . . . . . . . . . . . . . . . . . . . . . . . . . . . . . . . . . . . . . . . . . . . . . . . . 47 49 58 68 81 98 Global traffic settings To globally configure the traffic settings in the device, perform the following steps within the Configure tab. 1. Click Traffic on the menu bar. 2. From the sidebar, select Global Settings. The Global Settings page is displayed, as shown in Figure 32. FIGURE 32 Configuring global settings ServerIron ADX Graphical User Interface Guide 53-1002412-01 47 7 Global traffic settings 3. Provide the following information: • Load Balancing Predictor: Select the algorithm to determine the traffic distribution among the real servers. The algorithm can be one of the following: Round Robin—Directs the service requests to the next server if a server fail, and treats all servers equally regardless of the number of connections. Weighted—Distributes the service requests by allocating all the required connections sequentially to the servers with a higher weight value first. Enhanced Weighted—Distributes the service requests by allocating all the required connections sequentially to the servers until each real server has connections equal to its assigned weight. Weighted Round Robin—Schedules a proportional share of the bandwidth when all servers are active, and redistributes bandwidth if the bandwidth have been reserved by an inactive real server. Weighted Round Robin Static—Distributes the service requests based on a configured weight value and system capacity. Dynamic Weighted Direct—Distributes the service requests based on the direct weight from the SNMP response. Dynamic Weighted Reverse—Distributes the service requests based on the difference of the maximum based value and the dynamic SNMP response value. Response Time—Distributes the service requests among real servers based on a dynamic weight value derived from the response time of health check packets. NOTE The OID Entry ID and Max Value options are enabled only when you select the load balancing predictor algorithms as Dynamically weighted Direct and Dynamic Weighted Reverse. • OID Entry ID: Enter the SNMP request entry identification number that represents the weight of the real server. The range is from 1 through 255. • Max Value: Enter the maximum value for the dynamic weighting. The range is from 0 through 4,294,967,295. • Reassign Threshold: Enter the SYN ACK threshold that specifies the number of contiguous unacknowledged SYN ACKs accumulated for a real server, before determining that the real server is inactive.The range is from 6 through 4,000. The default is 20. • TCP Age: Specify the number of minutes the device allows a TCP connection to remain inactive before closing the connection. The range is from 2 through 60 minutes. The default is 30 minutes. • UDP Age: Specify the number of minutes the device allows a UDP connection to remain inactive before closing the connection. The range is from 2 through 60 minutes. The default is 5 minutes. • Sticky Age: Specify the number of minutes a sticky server connection can remain inactive before aging out. The range is from 2 through 60 minutes. The default is 5 minutes. • Clock Scale: Enter a value to adjust the clock scale for configurations that require TCP or UDP timeouts longer than the maximum value. The range is from 1 through 24. The default is 1. For example, when you set the clock scale to 2, then a TCP age of 60 minutes would be equivalent to 120 minutes. • Source NAT: Select to Enable check box to globally enable the source NAT on the real servers. 48 ServerIron ADX Graphical User Interface Guide 53-1002412-01 Virtual servers 7 • Enable TCP Syn NAK Threshold: Select the Enable check box to allow the TCP SYN NAK threshold feature for a real server. • TCP Syn NAK Threshold: Enter the SYN NAK threshold that specifies the number of contiguous unacknowledged SYN NAKs accumulated for a real server, before determining that the server is inactive. The range is from 6 through 4,000. The default value is 20. • Packet Fragmentation: Select the Enable check box to configure a port to fragment the packets that exceeds default size. • VIP Protection: Select the Enable check box to deny traffic that is destined to a VIP port that is not defined under a VIP. • Fast Stateless: Select the Enable check box, so that the device uses the information gathered during setup of the session to identify an optimized processing path and forwards the packets to pass through the stateless ports. 4. Click Apply to save your entries. Click Reset to revert the configuration to the previous configured values. For more information on global settings, refer to the ServerIron ADX Server Load Balancing Guide. Virtual servers A virtual server allows you to manage application server resources by handling the changing traffic requirements without disrupting the service to the end-users. Creating a virtual server A virtual server acts as a front end for the application server for distributing the service requests to the active real servers. When a client sends a TCP or UDP requests to an application port in the virtual server, the device identifies one of the back-end application servers (real servers) based on the configured load balancing method and forwards the client request to the identified server. To configure a basic virtual server on the device, perform the following steps within the Configure tab. 1. Click Traffic on the menu bar. 2. From the sidebar, select Virtual Server. ServerIron ADX Graphical User Interface Guide 53-1002412-01 49 7 Virtual servers The Virtual Server page is displayed, as shown in Figure 33. FIGURE 33 Virtual server The Configure Virtual Servers page displays a list of the virtual servers that are configured in the device. Each entry in the list includes virtual server name, IP address of the virtual server, virtual server port, predictor, and the status. 3. Click New at the bottom of the Configure Virtual Server page. The Configure Virtual Server - new page tab is displayed, as shown in Figure 34. FIGURE 34 Configuring virtual server 4. Click Basic and provide the following information: • Virtual Server Name: Enter the name of the virtual server, which distributes the load at the real server. • IP Address: Enter the IP address of the virtual server to which the requests are sent. You can configure both IPv4 and IPv6 addresses. • Description: Optionally, enter the description for the virtual server. 50 ServerIron ADX Graphical User Interface Guide 53-1002412-01 Virtual servers 7 • Admin State: Click the Enable check box to disable the virtual server. By default, admin state is enabled. • Load Balancing Predictor: Select a load balancing algorithm from the list to determine the load distribution among real servers; for example, Weighted Round Robin. • OID Entry ID: Enter the SNMP object ID value that represents the weight of the real server. • Max Value: Enter the maximum value for the dynamic weighting. The range is from 0 through 4,294,967,295. • Under Symmetric, provide the following information: Priority: Enter the value to set the priority level for the virtual server. The device with higher priority will be the active device while the standby device will have lower priority. The range is from 1 through 255. Dynamic Priority: Enter the value to automatically adjust the priority of the virtual server application to a lower value, if the application fails a health check. The range is from 1 through 255. Symmetric Active: Select the Enable check box to configure a device pair as an true active-active pair in Server Load Balancing (SLB). 5. Click Advanced to configure the advanced parameters on the virtual server. The Advanced tab is displayed, as shown in Figure 35. FIGURE 35 Configuring advanced parameters 6. Provide the following information: • Tracking: Click one of the following options. Track Group—Allows the client to use the same server for applications associated with the grouped ports, as long as all the ports in the group are active. Track Port—Allows the client to use the same server for applications associated with the grouped ports, as long as the primary port is active. None—Allows to disable the tracking option on the real server. Master Port: Select a master port from the list. • • TCP Age: Specify the number of minutes the device allows a TCP connection to remain inactive before closing the connection. The range is from 2 through 60 minutes. The default value is 30 minutes. ServerIron ADX Graphical User Interface Guide 53-1002412-01 51 7 Virtual servers • UDP Age: Specify the number of minutes the device allows a UDP connection to remain inactive before closing the connection. The range is from 2 through 60 minutes. The default value is 5 minutes. • Sticky Age: Specify the number of minutes a sticky server connection can remain inactive before aging out. The range is from 2 through 60 minutes. The default value is 5 minutes. • Under VIP Route Health Injection, provide the following information: 7. Advertise VIP Route: Select the Enable check box to advertise a route in the network containing the virtual server, even if the virtual server is unavailable. Select the Inject always check box for route injection to occur always. Subnet Length: Enter the subnet mask length as an index number. The range is from 1 through 32. Click Apply to save your entries. Click Reset to revert the configuration to the previous configured values. To modify the configured virtual server information, in the summary table, select an entry and click Edit or double-click the entry. Click Delete to delete a virtual server configuration. For more information on configuring virtual servers, refer to the ServerIron ADX Server Load Balancing Guide. Creating a virtual server port After defining the virtual server, you can add TCP or UDP ports to the virtual servers for receiving service requests from the client. To configure a virtual server port on the device, perform the following steps within the Configure tab. 1. Click Traffic on the menu bar. 2. From the sidebar, select Virtual Servers. The Configure Virtual Servers page is displayed. 3. Select a virtual server from the list in Configure Virtual Servers table and click Ports. The Configure Virtual Server Ports page tab is displayed, as shown in Figure 36. FIGURE 36 52 Virtual server ports ServerIron ADX Graphical User Interface Guide 53-1002412-01 Virtual servers 7 The Configure Virtual Server Ports page displayed a list of configured virtual server ports. Each entry in the list includes port name, runtime state, protocol, backup, and heath check status. 4. Click New at the bottom of the Configure Virtual Server Ports page. The Basic tab is displayed, as shown in Figure 37. FIGURE 37 Configuring virtual server ports 5. Under Basic tab, provide the following information: • Virtual Server Name: Enter the name of the virtual server. • Port: Select the port you want to add to the virtual server. • Admin State: Click the Enable check box to disable the virtual server port. By default, admin state is enabled. • TCP/UDP: Click one of the following options: TCP—To enable only the TCP traffic to pass through the real server. UDP—To enable only the UDP traffic to pass through the real server. Both—To enable both the TCP and UDP traffic to pass through the real server. DSR: Select the Enable check box to enable the real server to send the return traffic directly to the client. Select the DSR Fast Delete check box to enable the device to use the sessions in a deletion queue to speed up the deletion process, on receiving the first FIN from a client. • • Stateless: Select the following check boxes based on the requirement. Disable Hashing—To disable the stateless SLB hashing algorithm for the port. TCP Transport—To restrict stateless operation to the TCP protocol. UDP Transport—To restrict stateless operation to the UDP protocol. Custom Health Check: Select a customized health check from the list. • • TCP Age: Specify the number of minutes the device allows a TCP connection to remain inactive before closing the connection. The range is from 2 through 60 minutes. The default value is 30 minutes. ServerIron ADX Graphical User Interface Guide 53-1002412-01 53 7 Virtual servers • UDP Age: Specify the number of minutes the device allows an UDP connection to remain inactive before closing the connection. The range is from 2 through 60 minutes. The default is 5 minutes. Select the UDP Fast Age and UDP Normal Age check boxes based on the requirement. 6. Click the Stickiness tab to enable a sticky connection on the TCP or UDP virtual server port. The Stickiness tab is displayed, as shown in Figure 38. FIGURE 38 7. Configuring stickiness parameters Provide the following information: • Stickiness: Click Enable to enable a sticky connection on the virtual server ports, when a service request by a client mandates a series of sequential TCP or UDP port connections to be served by the same real server. Select the following options based on the requirement. Sticky To Server Group: Select the check box to enable sticky connections to be load balanced among servers in the same group. Group Sticky Failover: Select the check box to send connections to a different reachable group, when the connection with an entire server group is unreachable. Connection Return from Backup to Primary: Select the check box to restore connections from the backup to primary device. Sticky ACL: Select the check box to ensure that subsequent packets from the same client reaches the same real server. ACL ID: Enter the ID of an Access Control List (ACL) that specifies a permit action for the traffic from specified source IP address, before source NAT is performed. The range is from 1 through 65,535. The default value is 1. Persistent Hash: Click Enable to evenly distribute hash assignments and enable a client to direct the request to the same real server. Click one of the following options: • 54 Clear Hash Bucket on Change: Allows to clear the entire persistent hash table, when a new server comes up. Reassign Hash Bucket on Change: Allows to calculate the number of hash entries allocated to each existing server and reassign some of the entries to the new server. ServerIron ADX Graphical User Interface Guide 53-1002412-01 Virtual servers 7 • Sticky Based on Subnet: Click Enable to send all requests originating from a given subnet to the same real server. Subnet Mask: Enter the subnet mask that is used for the stickiness. No Stickness: Click Enable to disable stickiness on the virtual server port. • 8. Click Advanced tab to configure the advanced parameters for the virtual server port. The Advanced tab is displayed, as shown in Figure 39. FIGURE 39 Configuring advanced parameters 9. Provide the following information: • Under Connection Management, enter the following information: TCP Offload: Click Enable to allow a request from one connection on the client side to reuse any established connection on the sever side. Keepalive Age: Specifies how many minutes a connection on the server side can be kept alive. The range is from 2 through 60 minutes. The default value is 2 minutes. Max Transactions: Specifies the maximum number of HTTP transactions that can be completed on a connection on the server side. The range is from 1 through 4,294,967,295. The default value is 1. Client Keepalive: Click Enable to reuse the connection on the client side. None: Click None to disable the TCP offload and client keepalive functionality. ServerIron ADX Graphical User Interface Guide 53-1002412-01 55 7 Virtual servers • Under Other Settings, provide the following information: Enable Spoofing: Select the check box to mark the input interface of the connection. Later any response traffic for the session will be forwarded using this information regardless of any other route configured. Enable Port Translation: Select the check box to translate the application port number requested by the client to the application port number you specify on the virtual server when you bind it to the real server. Send Reset on Port Fail: Select the check box to reset the connection for an unavailable application on a real server in addition to redirecting future requests away from this real server if the port fails. Use Alias Port State: Select the check box to perform SLB based on an alias port state. Concurrent: Select the check box to allow a client to have sessions on different application ports on the same real server at the same time. Enable Server Group Failover: Select the check box to direct the HTTP request to one of the other server groups bound to the virtual servers service, when the servers in that server group are not available. Windows Terminal Server Port: Allows you to reconnect when disconnected from an already established connection to the session directory on the Windows 2003 terminal server. Symmetric Session Synchronization: Select the check box to specify the service for the VIPs that the device was load balancing is assumed by the backup device if the active device becomes unavailable. 10. Click Apply to save your entries. Click Reset to revert the configuration to the previous configured values. To modify the configured virtual server ports, in the summary table, select an entry and click Edit or double-click the entry. Click Delete to delete a virtual server port configuration. For more information on configuring virtual server ports, refer to the ServerIron ADX Server Load Balancing Guide. Binding the virtual server port To bind a virtual server port to a real port on the device, perform the following steps within the Configure tab. 1. Click Traffic on the menu bar. 2. From the sidebar, select Virtual Servers. 3. Select a virtual server from the list in the Configure Virtual Servers page and click Bindings. 56 ServerIron ADX Graphical User Interface Guide 53-1002412-01 Virtual servers 7 The binding page is displayed, as shown in Figure 40. FIGURE 40 Binding virtual server ports 4. Select the VIPs or ports you want to bind from the Available RS-Ports list and click Bind to move them to the Bound RS-Ports list. To unbind the ports, select the ports you want to unbind from the Bound RS-Ports list and click Unbind. To bind or unbind all the ports, click Bind All or Unbind All. For more information on binding virtual server ports, refer to the ServerIron ADX Server Load Balancing Guide. Enabling or disabling a virtual server You can enable or disable a virtual server from the Configure Virtual Servers page. To enable or disable a virtual server on the device, perform the following steps within the Configure tab. 1. Click Traffic on the menu bar. 2. From the sidebar, select Virtual Servers. The list of the virtual servers in the system is displayed on the main page, as shown in Figure 41. FIGURE 41 Enabling a virtual server 3. Select a virtual server from the Configure Virtual Servers page and perform one of the following actions: ServerIron ADX Graphical User Interface Guide 53-1002412-01 57 7 Real servers • Click Enable at the bottom of the Configure Virtual Servers page to enable the virtual server. • Click Disable to disable the virtual server. For more information on enabling or disabling virtual servers, refer to the ServerIron ADX Server Load Balancing Guide. Real servers Real servers are the actual application servers that handles all the client service requests. Creating a basic real server To apply SLB configuration, you must create a basic real server. After you create the basic real server, you must map the real server to the virtual server to distribute the requests from the client among the back-end application servers. To configure a basic real server on the device, perform the following steps within the Configure tab. 1. Click Traffic on the menu bar. 2. From the sidebar, select Real Servers. The Configure Real Servers page is displayed, as shown in Figure 42. FIGURE 42 Real server summary The Configure Real Servers page displays a list of all the configured real servers. Each entry in the list includes the real server name, IP address, port, and status. 3. Click New at the bottom of the Configure Real Servers page. 58 ServerIron ADX Graphical User Interface Guide 53-1002412-01 Real servers 7 The Configure Real Sever - new page tab is displayed. By default, Basic configuration tab is displayed, as shown in Figure 43. FIGURE 43 Configuring real server basic parameters 4. Under Basic tab, enter the following information: • Click Create one Real Server for creating a real server. • Real Server Name: Enter the name of the real server. • IP Address: Enter the IP address of the real server. You can configure both IPv4 and IPv6 addresses. • Description: Optionally, enter a description for the real server. • Alias Name: Optionally, enter the name of the alias. • Admin State: Click the Enable check box to disable the real server. By default, the real server is enabled. • Remote: Select the Enable (only editable at creation time) check box to designate the real server to be a remote server, if the server is attached through one or more router hops. You can configure only during the creation of the real server. • Backup: Select the Enable check box to designate the real server to be a backup server if all the primary servers are unavailable for the requested application. 5. Click Apply to save your entries. Click Reset to revert the configuration to the previous configured values. To modify the configured real server information, in the summary table, select an entry and click Edit or double-click the entry. Click Delete to delete a real server configuration. For more information on configuring real servers, refer to the ServerIron ADX Server Load Balancing Guide. ServerIron ADX Graphical User Interface Guide 53-1002412-01 59 7 Real servers Setting predictors for real servers To configure predictors for real servers on the device, perform the following steps within the Configure tab. 1. Click Traffic on the menu bar. 2. From the sidebar, select Real Servers. 3. Click New at the bottom of the Configure Real Servers page. 4. Click the Predictors tab. The Predictors tab is displayed, as shown in Figure 44. FIGURE 44 Configuring predictors parameters 5. Under Dynamic Weighted, enter the following information: • Port: Enter the SNMP request host port. • Community Name: Enter an SNMP community name to restrict SNMP access to all the real servers. • Entry ID: Enter the SNMP request entry identification in the fields and the corresponding SNMP Object ID (OID) value in the SNMP Request OID fields. 6. Under Enhanced Weight, enter the following information: Least Connection Weight: Enter the weight of the real server relative to other real servers in terms of the number of connections on the server. The weight is based on the number of session table entries for TCP or UDP sessions with the real server. 7. 60 Click the Advanced tab to configure advanced parameters for the real server configuration. ServerIron ADX Graphical User Interface Guide 53-1002412-01 Real servers 7 The Advanced tab is displayed, as shown in Figure 45. FIGURE 45 Configuring advanced parameters 8. Provide the following information: • Ping Health Check: Select the Enable check box to enable Layer 3 health checks to the real server IP addresses. • Source NAT: Select the Enable check box to allow the device to use a source IP address as the source for packets sent to the real server. • Source-NAT ACL: Select the check box to configure the device to apply source NAT for the traffic received from specified source IP addresses, by creating an access control list, which specifies a permit action for the traffic from the source IP address. • ACL ID: Enter the identifier for the access list in the source NAT. The range is from 1 through 99. The default value is 1. • Under Rate Limiting, provide the following information: Maximum Connections: Enter the maximum number of sessions the device will maintain in its session table. The range is from 1 through 2,000,000. Maximum TCP Connection Rate: Enter the maximum number of TCP connections per second. The range is from 1 through 4,294,967,295. Maximum UDP Connection Rate: Enter the maximum number of UDP connections per second. The range is from 1 through 4,294,967,295. 9. Click Apply to save your entries. Click Reset to revert the configuration to the previous configured values. For more information on configuring real servers, refer to the ServerIron ADX Server Load Balancing Guide. ServerIron ADX Graphical User Interface Guide 53-1002412-01 61 7 Real servers Creating a real server port To configure a basic real server port on the device, perform the following steps within the Configure tab. 1. Click Traffic on the menu bar. 2. From the sidebar, select Real Servers. 3. Select the real server from the list in the Configure Real Servers page and click Port. The Configure Real Server Ports page tab is displayed, as shown in Figure 46. FIGURE 46 Real server port summary 4. Click New at the bottom of the Configure Real Server Ports page. 62 ServerIron ADX Graphical User Interface Guide 53-1002412-01 Real servers 7 The Basic configuration tab is displayed, as shown in Figure 47. FIGURE 47 Configuring real server port 5. Under Basic, provide the following information: • Real Server Name: Displays the name of the real server. • Port: Select an application port from the list to add under the real servers. • Admin State: Select the appropriate check boxes to enable the port, set the port as backup, and clear the sessions when the port is up. • Server ID: Enter the ID of the real server to forward the packets matching a specified rule to a specified real server or server group. The range is from 1024 through 5119. The default is 1024. • Group ID: Enter the four group ID range in the corresponding fields to ensure that packets matching the rule go to the same real server within the server group. The range is from 0 through 1023. • Slow Start ID: Select a number from the list to configure the device to handle limited number of connection at first and gradually increase the connections until the maximum is reached. • Under Rate Limiting, provide the following information: Maximum Connections: Enter the maximum number of connections that the client can setup. The range is from 1 through 2,000,000. Maximum TCP Connection Rate: Enter the maximum number of TCP connections per second. The range is from 1 through 4,294,967,295. Maximum UDP Connection Rate: Enter the maximum number of UDP connections per second. The range is from 1 through 4,294,967,295. 6. Click Apply to save your entries. Click Reset to revert the configuration to the previous configured values. ServerIron ADX Graphical User Interface Guide 53-1002412-01 63 7 Real servers To modify the configured real server ports, in the summary table, select an entry and click Edit or double-click the entry. You can also delete a configuration by clicking Delete. For more information on configuring real server ports, refer to the ServerIron ADX Server Load Balancing Guide. Configuring health check parameters for a real server port To configure the health check parameters for a real server port on the device, perform the following steps within the Configure tab. 1. Click Traffic on the menu bar. 2. From the sidebar, select Real Servers. 3. Select the real server from the list in Configure Real Servers page and click Port 4. Click New at the bottom of the Configure Real Servers page. 5. Click Health Check tab. The Health Check page is displayed, as shown in Figure 48. FIGURE 48 Configuring health check parameters 6. Provide the following information: • Periodic Health Check: Select the Enable check box to enable the Layer 3 health check for the local real server. • Select the L4 Only check box to enable a Layer 4 check, if the application port is not one of the applications that is known to the device. • Element Health Check: Select a health check on the device to allow a health check that is customized for a given application server. • Port Policy: Select a port policy from the list to reduce the configuration required for health checks and provide more flexibility while configuring health checks. 64 ServerIron ADX Graphical User Interface Guide 53-1002412-01 Real servers 7 • Bringup Intervals: Enter the Layer 4 and Layer 7 bringup intervals to enable the health check policy during initial bringup of the server in seconds. The range is from 1 through 255 seconds. 7. Under Specific settings to HTTP, enter the following information: • URL: Enter the URL name to specify whether the HTTP health check performs a GET or HEAD request while customizing the Layer 7 information sent with the health check. • Status Codes: Enter the status code for the four groups to change the HTTP status codes that the device accepts as valid responses. The range is from 100 through 999. • Content Match: Select the content match from the list to attach a match list for an HTTP content verification health check to the real server. • Health Check Type: Click one of the following options: Simple—To perform the simple health check. Complete—To perform the complete health check. 8. Click Apply to save your entries. Click Reset to revert the configuration to the previous configured values. To modify the configured real server ports, in the summary table, select an entry and click Edit or double-click the entry. You can also delete a configuration by clicking Delete. For more information on configuring health check on real servers ports, refer to the ServerIron ADX Server Load Balancing Guide. Enabling or disabling a real server You can enable or disable a real server from the Configure Real Servers page. To enable or disable a real server on the device, perform the following steps within the Configure tab. 1. Click Traffic on the menu bar. 2. From the sidebar, select Real Servers. The list of the real servers in the system is displayed on the Configure Real Servers page, as shown in Figure 41. FIGURE 49 Enabling a real server ServerIron ADX Graphical User Interface Guide 53-1002412-01 65 7 Real servers 3. Select a real server from the list and click one of the following buttons at the bottom of the Configure Real Servers page: • Click Enable at the bottom of the Configure Real Servers page to enable the real server. • Click Disable to disable the real server. For more information on enabling or disabling real servers, refer to the ServerIron ADX Server Load Balancing Guide. Creating a real server group A real server group can contain one or more real servers. If there is more than one real server in a server group, requests are load balanced across all the servers in the group. To assign real servers to server groups, you establish the IP address of each real server and specify the server groups to which it belongs. To create a real server group, perform the following steps within the Configure tab. 1. Click Traffic on the menu bar. 2. From the sidebar, select Server Groups. The Server Groups page is displayed as shown in Figure 50. FIGURE 50 Server group summary The Server Groups page displays a list of configured real server groups. Each entry in the list includes name of the group, ports added, bound virtual server and ports, and number of real servers. 3. Click New at the bottom of the Server Groups page. 66 ServerIron ADX Graphical User Interface Guide 53-1002412-01 Real servers 7 The Configure Real Server - new page tab is displayed, as shown in Figure 51. FIGURE 51 Configuring real server 4. Provide the following information: • Server Group Name: Enter the name of the server group. • Add Real Servers: Select the real servers from the Available Servers list and click Add to move the real servers to the Selected Servers list to add server group. 5. Click Apply to save your entries. Click Reset to revert the configuration to the previous configured values. To modify the configured real server groups, in the summary table, select an entry and click Edit or double-click the entry. You can also delete a configuration by clicking Delete. For more information on configuring real server groups, refer to the ServerIron ADX Server Load Balancing Guide. Binding a real server group To bind a real server group with a virtual server port on the device, perform the following steps within the Configure tab. 1. Click Traffic on the menu bar. 2. From the sidebar, select Server Groups. The Server Groups page is displayed. 3. Select a server group entry from the list in the Server Group page and click Bind. The Virtual Server Bindings page is displayed, as shown in Figure 52. ServerIron ADX Graphical User Interface Guide 53-1002412-01 67 7 Health checks FIGURE 52 Binding real server groups 4. Provide the following information: • Server Group Port: Select the port of the server group to bind with the virtual server port. • Virtual Server: Select the virtual server that you want to bind to the server group. • Virtual Port: Select the virtual server port to which you want to bind the server group port. 5. Click OK to bind the virtual server to the real server groups. For more information on binding virtual servers to the server group, refer to the ServerIron ADX Server Load Balancing Guide. Health checks The ADX device uses Layer 3, and Layer 4 or Layer 7 health checks to verify the availability of real servers and the applications on the real servers. Enabling Layer 2 to Layer 4 health checks The device uses Layer 2 health check to verify whether the real server is reachable through the network using the Address Resolution Protocol (ARP) request. The device uses the Layer 3 health check to verify whether the real server is reachable through the network using IP pings. The device performs Layer 4 health check to bring up the application port that binds the real and virtual servers using TCP and UDP health check. To globally enable Layer 2, Layer 3, and Layer 4 health checks on the device, perform the following steps within the Configure tab. 1. Click Traffic on the menu bar. 2. From the sidebar, select Health Checks. 68 ServerIron ADX Graphical User Interface Guide 53-1002412-01 Health checks 7 The Health Checks page is displayed, as shown in Figure 53. FIGURE 53 Health check summary 3. Under Layer 2 ARP Check, provide the following information: • Periodic ARP Check: Select the Enable check box to send layer 2 ARP request to the real server to verify that the device can reach the server through the network. By default, periodic ARP check is enabled. • Interval: Enter the time of interval for Layer 2 ARP check, in seconds. The range is from 10 through 14,400 seconds. The default is 10 seconds. 4. Under Layer 3 Ping Check, provide the following information: • Real Server: Select the Enable check box to enable Layer 3 ping check on the real server. The device uses the IP ping to determine whether the slowed response time indicates loss of the real server If the time between the last packet sent to the real server and the last packet received from the real server increases, • Remote Server: Select the Enable check box to enable Layer 3 ping check on the remote server. The device uses the IP ping to determine whether the slowed response time indicates loss of the remote server if the time between the last packet sent to the remote server and the last packet received from the remote server increases. • Ping Interval: Enter the ping interval for Layer 3 ping check, in seconds. The range is from 1 through 10 seconds. The default is 5 seconds. • Ping Retries: Specifies the number of times that the device will ping a real server before changing the server state to FAILED. Enter the number of ping retries for Layer 3 ping check. The range is from 2 through 10. The default is 4. 5. Under Layer 4 TCP/UDP Check, provide the following information: • Layer 4 Health Check: Select the Enable check box for Layer 4 health check. When you bind a real server to a virtual server, the device performs either a Layer 4 TCP health check, a Layer 4 UDP health check, or a Layer 7 health check to bring up the application port that binds the real and virtual servers. The Layer 4 health check can be a TCP check or a UDP check • Fast Port Bring-up: Select the Enable check box to increase the speed of the bringup process by sending more (up to a maximum of 50) health-checks at one time. ServerIron ADX Graphical User Interface Guide 53-1002412-01 69 7 Health checks 6. Click Apply to save your entries. Click Reset to revert the configuration to the previous configured values. For more information on configuring health checks, refer to the ServerIron ADX Server Load Balancing Guide. Creating a port profile A port profile is a set of attributes that globally defines an application port. Once defined, the port has the same attributes on all the real and virtual servers that use the port. Port profiles are useful if you want to globally change the attributes of a port known to the device or you want to globally define a port that is not known to the device. Define a port profile to globally configure the port parameters and configure the keepalive health check. To create a port profile on the device, perform the following steps within the Configure tab. 1. Click Traffic on the menu bar. 2. From the sidebar, select Port Profiles. The Port Profiles page is displayed, as shown in Figure 54. FIGURE 54 70 Port profile summary ServerIron ADX Graphical User Interface Guide 53-1002412-01 Health checks 7 3. Click New at the bottom of the Port Profiles page. 4. The Port Profile - new page tab is displayed, as shown in Figure 55. FIGURE 55 Creating port profile 5. Under Basic tab, provide the following information: • • • • • Port: Select the well-known port name for the health check from the list. Use Like Protocol: Select the protocol for the health check from the list. Admin State: Select the Enable check box for enable the port profile. Type: Click TCP or UDP to globally define the type for the port. Age: Specifies the number of minutes a TCP or UDP session table entry can remain inactive before the device times out the entry. Edit the age in minutes. The range is from 2 through 60 minutes. The default is 30 minutes. • Multiplier: Enter the multiplier. The range is from 1 through 20. This option is available only for the TCP type. • Periodic Health Check: Select the Enable check box for periodic health check. By default, periodic health check is enabled. • Interval: Enter the interval in seconds. The range is from 1 through 120 seconds. The default is 5 seconds. • Retries: Enter the number of retries. The range is from 1 through 5. The default is 2. NOTE The device assumes that ports for which it does not know the type are UDP ports. • L4 Check Only: Select the Enable check box for Layer 4 checks. • Health Check Protocol: Optionally, select the protocol and the port for health check from the list. • Session Synchronization: Select the Enable check box to enable session synchronization for the port in high availability designs. ServerIron ADX Graphical User Interface Guide 53-1002412-01 71 7 Health checks 6. Click Apply to save your entries. Click Reset to revert the configuration to the previous configured values. For more information on configuring port profiles, refer to the ServerIron ADX Server Load Balancing Guide. Defining advanced parameters for a port profile To define advanced parameters for a port profile on the device, perform the following steps within the Configure tab. 1. Click Traffic on the menu bar. 2. From the sidebar, select Health Checks, and then select Port Profiles. 3. Click New at the bottom of the Port Profiles page. The Port Profile - new page tab is displayed. 4. Click Advanced tab. The Advanced tab is displayed, as shown in Figure 56. FIGURE 56 Configuring advanced parameters 5. Provide the following information: • Use Master Port Health Check: Select the Enable check box for the usage of master port health check. • Fast Port Bringup: Select the Enable check box to increase the speed of the bringup process by sending more health checks at a time. • L4 Interval: Specify the interval at which the device must perform the Layer 4 check. The range is from 1 through 120 seconds. The default is 5 seconds. • L7 Interval: Specify the interval at which the device must perform Layer 7 health check. The range is from 1 through 120 seconds. The default is 5 seconds. 72 ServerIron ADX Graphical User Interface Guide 53-1002412-01 Health checks 7 • Retries: Enter the number of retries. The range is from 1 through 5. The default is 2. 6. Click Apply to save your entries. Click Reset to revert the configuration to the previous configured values. To modify the configured port profiles, in the summary table, select an entry and click Edit or double-click the entry. You can also delete a configuration by clicking Delete. However, you cannot edit or delete port profiles if they are in use. For more information on configuring port profiles, refer to the ServerIron ADX Server Load Balancing Guide. Creating a port policy Server port policies help to reduce the configuration required for health checks and provide more flexibility while configuring health checks. To create a port policy on the device, perform the following steps within the Configure tab. 1. Click Traffic on the menu bar. 2. From the sidebar, select Health Checks, and then select Port Policies. The Port Policies page is displayed, as shown in Figure 57. FIGURE 57 Port policies ServerIron ADX Graphical User Interface Guide 53-1002412-01 73 7 Health checks 3. Click New at the bottom of the Port Policies page. FIGURE 58 Configuring port policies 4. Provide the following information: • Port Policy Name: Enter the name of the port policy. • Health Check Interval: Enter the health check interval in seconds. The range is from 1 through 120 seconds. The default is 5 seconds. For Secure Socket Layer (SSL), the range is from 5 through 120 seconds. • Retries: Specifies the number of times the policy will be tried before the device marks the port as UP or DOWN. Enter the number of health check retries. The range is from 1 through 5. The default value is 2. • L4 Check Only: Select the Enable check box for Layer 4 checks. • Port: Specifies the port that will be checked by the policy. Optionally, select the port from the list. • Content Check Match List: Select the match from the list. • Protocol: Select one of the protocols that must be checked on the traffic that passes through the port. The port value is displayed in the field next to the list. The settings for some of the protocols can be customized. Table 3 describes the settings and your action for those protocols. 74 ServerIron ADX Graphical User Interface Guide 53-1002412-01 Health checks TABLE 3 7 Protocols Protocol Function Your Action DNS Specifies the DNS protocol to be checked on the traffic passes through the port. Under Settings for DNS, provide the following information: • Zone: Enter the name of the Domain Name System (DNS) zone that sends a Source-of-Authority (SOA) request for the zone name. • Address Query: Enter a domain name that a device has to be requested from the real server. HTTP Specifies the HTTP protocol to be checked on the traffic passes through the port. Under Settings for HTTP, provide the following information: • URL: Enter the URL page name to perform a HEAD request. • Status Codes: Enter four HTTP status code ranges for the device to accept as valid responses, if the health check reply contains a code within the specified range. • Content Match List: Select a match list that can be attached for an HTTP content verification health check to the real server. • Health Check Type: Select one of the following: • Simple—To perform the simple health check. • Complete—To perform the complete health check. LDAP Specifies the LDAP protocol to be checked on the traffic passes through the port. RADIUS Specifies the RADIUS protocol to be checked on the traffic passes through the port. Under Settings for RADIUS, provide the following information: • User Name: Enter an authentication user name on the server. • Password: Enter an authentication password on the server • Key: Enter an authentication key on the server. • NAS IP Address: Enter the IP address of the Network Access Server (NAS) that is connected to the RADIUS server. • NAS Port: Enter the port of the NAS. SSL Specifies the SSL protocol to be checked on the traffic passes through the port. Under Settings for SSL, provide the following information: • URL: Enter the URL page name to perform a HEAD request. • Status Codes: Enter up to four SSL status code ranges for the device to accept as valid responses, if the health check reply contains a code within the specified range. • Content Match List: Select a match list that can be attached for an SSL content verification health check to the real server. • Health Check Type: Select one of the following: • Simple—To perform the simple health check. • Complete—To perform the complete health check. Under Settings for LDAP, provide the following information: Version: Click one of the following options: • v2—Specify the Lightweight Directory Access Protocol (LDAP) version as 2. • v3—Specify the LDAP version as 3. • User Name: Enter the user name that must be allowed to query the LDAP server. • Password: Enter the password for the user name. • Base DN: Enter the base distinguished name (unique identifier for each entry) of the LDAP. • 5. Click Apply to save your entries. Click Reset to revert the configuration to the previous configured values. To modify the configured port policies, in the summary table, select an entry and click Edit or double-click the entry. You can also delete a configuration by clicking Delete. However, you cannot edit or delete port policies if they are in use. ServerIron ADX Graphical User Interface Guide 53-1002412-01 75 7 Health checks For more information on configuring port policies, refer to the ServerIron ADX Server Load Balancing Guide. Configuring element health checks The ADX device allows the creation of a health check that is customized for a given application server. Such definition is also known as element health check. You can specify the health check frequency, the number of retrials, and the number of other parameters for server health check. Settings for different element health checks You can use the following health check types to create an element health checks: • TCP • UDP • Internet Control Message Protocol (ICMP) • Boolean To configure an element health check policy on the device, perform the following steps within the Configure tab. 1. Click Traffic on the menu bar. 2. From the sidebar, select Health Checks, and then select Element Health Checks. The Element Health Checks page is displayed, as shown in Figure 59. FIGURE 59 Element health check summary 3. Click New Element Health Check. 76 ServerIron ADX Graphical User Interface Guide 53-1002412-01 Health checks 7 The Element Heath Check - new page is displayed, as shown in Figure 60. FIGURE 60 Configuring element health check. 4. Provide the following information: • Health Check Name: Enter the name for the health check. • Health Check Type: Select one of the following health check types: TCP: The ADX device attempts to engage in a normal three-way TCP handshake with the port on the real server. UDP: The ADX device sends a UDP packet with garbage (meaningless) data to the UDP port. ICMP: The ADX sends an ARP request and an IP ping to the port on the real server to verify that the ADX device can reach the server through the network. Destination IP: Specifies the IP address of the real server. Enter the destination IP address. You can configure both IPv4 and IPv6 addresses. • • Next Hop IP: Specifies the IP address of the next hop. NOTE The Next Hop IP field is displayed only when the health check type is ICMP. • Health Check State: Select the Enable check box to enable health check. By default, the health check is enabled. • Health Check Interval: Specifies the interval at with the ADX device should perform the health check. Enter the health check interval in seconds. The range is from 1 through 120 seconds. The default is 5 seconds. For SSL, the range is from 5 through 120 seconds. • Retries: Specifies the number of retries that the ADX device should perform the health check before concluding that the application has failed the health check. Enter the number of retries. The range is from 1 through 5. The default is 3. • L7 Health Check: Select the check box to allow the ADX device to perform the L7 health check. ServerIron ADX Graphical User Interface Guide 53-1002412-01 77 7 Health checks • Port: Specifies the port name and the application port number. Select a port name from the list. The port value is displayed in the field next to the list. NOTE For the unknown port, select Custom from the list and enter the port number. • Content Check: Allows the ADX device to perform the content verification health checks for ports that do not use one of the well-known port numbers recognized by the ADX device. Select the Content Check check box to enable content verification health checks. • Protocol: Select the protocol from the list. The port value is displayed in the field next to the list. 5. Click Apply to save your entries. Click Reset to revert the configuration to the previous configured values. To modify the configured element health checks, in the summary table, select an entry and click Edit or double-click the entry. You can also delete a configuration by clicking Delete. However, you cannot edit or delete health check policies if they are in use. For more information on configuring element health checks, refer to the ServerIron ADX Server Load Balancing Guide. Configuring boolean health check policy A health check policy consists of one or more element-action expressions. When a logical expression contains multiple element-action expressions, the policy also contains the logical operator AND or OR or NOT. To configure a boolean health check policy on the device, perform the following steps within the Configure tab. 1. Click Traffic on the menu bar. 2. From the sidebar, select Health Checks, and then select Element Health Checks. 3. Click New Boolean Health Check at the bottom of the Element Health Checks page. 78 ServerIron ADX Graphical User Interface Guide 53-1002412-01 Health checks 7 The Boolean Health Check - new page is displayed, as shown in Figure 61. FIGURE 61 Configuring boolean health check 4. Provide the following information: • Boolean Health Check Name: Enter the name for the boolean health check policy. • Health Check 1: Select a health check policy from the list. • Condition: Specifies a logical operator in the health check policy. You can enter two element-action expressions along with the logical operator AND, OR, or NOT. Select a boolean operator from the list. • Health Check 2: Select a health check policy that should be compared with Health Check 1 policy. 5. Click Apply to save your entries. Click Reset to revert the configuration to the previous configured values. To modify the configured boolean health checks, in the summary table, select an entry and click Edit or double-click the entry. You can also delete a configuration by clicking Delete. However, you cannot edit or delete the boolean health check policies if they are in use. For more information on configuring boolean health checks, refer to the ServerIron ADX Server Load Balancing Guide. Configuring a match list policy The ADX currently supports compound and simple content-matching statements under the match-list configuration. This enhancement adds support for "start" and "end" statements in the match-list configuration. You can configure a match list policy to mark the server port up or down when the rule defined in the match list is met. To create a match list policy on the device, perform the following steps within the Configure tab. ServerIron ADX Graphical User Interface Guide 53-1002412-01 79 7 Health checks 1. Click Traffic on the menu bar. 2. From the sidebar, select Health Checks, and then select Match Lists. The Match Lists page is displayed, as shown in Figure 62. FIGURE 62 Match lists summary 3. Click New at the bottom of the Match Lists page. The Match List - new page tab is displayed, as shown in Figure 63. FIGURE 63 Configuring match list 4. Provide the following information: • Name: Enter the name of the match list. • Default State: Specifies the selection criteria in the matching list. Click Up or Down. 5. Under Rule, select one of the following conditions from the Match Condition list to define a rule: • String Starts With: Specifies the string that should match with the beginning string of the response sent by the real server. Select String Starts With and enter the string that in the Start String field. 80 ServerIron ADX Graphical User Interface Guide 53-1002412-01 Content switching 7 • String Ends With: Specifies the string that should match with the string present at the end of response sent by the real server. Select String Ends With, and enter the string in the Ends String field. • Select Simple String Match and enter the following details: Matches: Enter the string. Logging: Select the Enable check box. Select Compound String Match and enter the following details: • Starts With: Enter the string that must match with the beginning string of response sent by the real server. Ends With: Enter the string that must match with the string present at the end text of the of response sent by the real server. Logging: Select the Enable check box to enable logging when the selection criteria is met. 6. Click Add to add a rule. The added rule is displayed in the Added Rules table. You can click Delete to delete the rule from the table. 7. Repeat step 5 to step 6 to define additional match conditions. 8. Click Apply to save your entries. Click Reset to revert the configuration to the previous configured values. The configured match list is displayed in the Match Lists table. Select the match list policy in the table and click Edit or double-click the entry to modify the match list. Also, click Delete to delete the match list from the table. For more information on configuring match lists, refer to the ServerIron ADX Server Load Balancing Guide. Content switching Content switching allows the ADX device to make forwarding decisions about HTTP traffic based on information in a URL, cookie, SSL session ID, or XML content. In addition, Layer 7 content switching allows the device to make forwarding decisions about HTTP traffic by analyzing information contained within the traffic. In addition, the device can perform content rewrite on the server responses. In other words, the device can not only modify requests in the forward direction, but also the responses in reverse direction. The device also provides protection against distributed denial of service attacks such as Domain Name System (DNS) amplification attacks. The device can be configured to forward, drop or rate limit DNS traffic based on DNS query name, DNS query type, and DNS recursion flag. Creating content switching policies Configuring Layer 7 content switching policy includes the following: ServerIron ADX Graphical User Interface Guide 53-1002412-01 81 7 Content switching 1. Create rules—Define a request rule or response rule to identify specific application data within a request or a response. 2. Create policies—Create a request policy or response policy to specify multiple rules and the desired actions to be taken when the traffic matches the rule. 3. Binding policies—Apply the created policy to a virtual server port. To create a content switching policy on the device, perform the following steps within the Configure tab. 1. Click Traffic on the menu bar. 2. From the sidebar, select Content Switching. The steps to provision the Layer 7 Content Switching (CSW) policy page are displayed, as shown in Figure 64. FIGURE 64 Content switching summary The page provides a brief step-by-step instructions for creating a request rule and policy for incoming traffic and response rule and policy for outgoing traffic. Creating rules You can create a request and response rules for the device to process the incoming and outgoing traffic. Creating request rules A request rule specifies the content that the device looks for in the incoming traffic. To create a Layer 7 request rule for incoming traffic on the device, perform the following steps within the Configure tab. 1. Click Traffic on the menu bar. 2. From the sidebar, select Content Switching, and then select Request Rules. 82 ServerIron ADX Graphical User Interface Guide 53-1002412-01 Content switching 7 The Request Rules page is displayed, as shown in Figure 65. FIGURE 65 Request rules summary The Request Rules page displays the list of the configured request rules for incoming traffic. 3. Click New on the bottom of the Request Rules page. The Request Rule - new page tab is displayed, as shown in Figure 66. FIGURE 66 Creating a request rule 4. Provide the following information: • Rule Name: Enter the name of the request rule. The rule name can be up to 80 alphabetic characters in length. • Ignore Case: Select the check box if you want to the rule to be case insensitive. • Rule Type: Select one of the request rule type and set the parameters as described in Table 4. ServerIron ADX Graphical User Interface Guide 53-1002412-01 83 7 Content switching TABLE 4 84 Rule type settings Rule Type Function Your Action URL Allows the device to make a load-balancing decision based on the contents of the URL string in an incoming packet. Under the Settings for URL Rule, provide the following information: • Operator: Select one of the following operators from the list: - Prefix—To match if the URL string begins with the specified prefix. - Suffix—To match if the URL string begins with the specified suffix. - Pattern—To match if the specified pattern exists anywhere within the URL string. - Equals—To match if the URL string is equal to the specified value. - Exists—To match if a URL string exists in the incoming packet. - Search—To match if the URL string contains any one of the specified values. • Value: Enter a value that has to match with the URL string. HTTP Cookie Allows the device to make a load-balancing decision based on the contents of the cookie header field in an incoming packet. Under the Settings for HTTP Cookie Rule, provide the following information: • Operator: Select one of the following operators from the list: - Prefix—To match if the HTTP cookie begins with the specified prefix. - Suffix—To match if the HTTP cookie begins with the specified suffix. - Pattern—To match if the specified pattern exists anywhere within the HTTP cookie. - Equals—To match if the HTTP cookie is equal to the specified value. - Exists—To match if a HTTP cookie exists in the incoming packet. - Search—To match if the HTTP cookie contains any one of the specified values. • Value: Enter a value that has to match with the HTTP cookie. ServerIron ADX Graphical User Interface Guide 53-1002412-01 Content switching TABLE 4 7 Rule type settings (Continued) Rule Type Function Your Action HTTP Header Allows the device to make a load balancing decision based on the contents of an HTTP header field in an incoming packet. Under Settings for HTTP Header Rule, provide the following information: • Header Type: Click one of the following: - Well Known HTTP Header: Select a well known header using which you want the ADX device to make a load balancing decision. - User Defined Header: Specify a header field using which you want the ADX device to make a load balancing decision. • Operator: Select one of the following operators from the list: - Prefix—To match if the HTTP header field begins with the specified prefix. - Suffix—To match if the HTTP header field begins with the specified suffix. - Pattern—To match if the specified pattern exists anywhere within the HTTP header field. - Equals—To match if the HTTP header field is equal to the specified value. - Exists—To match if the HTTP header field exists in the incoming packet. - Search—To match if the HTTP header field contains any one of the specified values. • Value: Enter a value that has to match with the HTTP header field. HTTP Method Allows the device to make a load balancing decision based on the HTTP method in an incoming packet. Under the Settings for HTTP Method Rule, select one of the following HTTP methods from the HTTP Method list. The HTTP method can be: GET,HEAD,POST,OPTIONS,PUT,DELETE,TRACE,PROPFIND,MOVE,CO NNECT,BDELTE,PROPPATCH,COPY,LOCK,UNLOCK,MKCOL,BCOPY,B MOVE,POLL,SUBSCRIBE,SEARCH,BPROPPATH,RPC_OUT_DATA, and RPC_IN_DATA. HTTP Version Allows the ADX to make a load balancing decision based on the HTTP version of an incoming packet. Under the Settings for HTTP Version Rule, Select the version of the HTTP from the HTTP Version list. The version can be: 1.0 or 1.1. ServerIron ADX Graphical User Interface Guide 53-1002412-01 85 7 Content switching TABLE 4 86 Rule type settings (Continued) Rule Type Function Your Action XML TAG Allows the device to make a load balancing decision based on the contents of an XML tag in an incoming packet. Under the Setting for XML Tag Rule, provide the following information: • XML Tag Name: Enter the name of the XML tag. • Operator: Select one of the following operators from the list: - Prefix—To match if the XML tag begins with the specified prefix. - Suffix—To match if the XML tag begins with the specified suffix. - Pattern—To match if the specified pattern exists anywhere within the XML tag. - Equals—To match if the XML tag is equal to the specified value. - Exists—To match if the XML tag exists in the incoming packet. - Search—To match if the XML tag contains any one of the specified values. • Value: Enter a value that has to match with the XML tag. TCP Content Allows the device to make a load balancing decision based on the TCP content in an incoming packet, depending upon the port type. You can define up to 520 unique TCP rules. Under the Settings for TCP Content Rule, provide the following information: • Operator: Select one of the following operators from the list: - Prefix—To match if the TCP content begins with the specified prefix. - Suffix—To match if the TCP content begins with the specified suffix. - Pattern—To match if the specified pattern exists anywhere within the TCP content. - Equals—To match if the TCP content is equal to the specified value. - Exists—To match if the TCP content exists in the incoming packet. - Search—To match if the TCP content contains any one of the specified values. • Value: Enter a value that has to match with the TCP content. • Offset: Enter the value from where to begin scanning. UDP Content Allows the device to make a load balancing decision based on the UDP content in an incoming packet, depending upon the port type. You can define up to 520 unique UDP rules. Under the Settings for UDP Content Rule, provide the following information: • Operator: Select one of the following operators from the list: • Prefix—To match if the UDP content begins with the specified prefix. • Suffix—To match if the UDP content begins with the specified suffix. • Pattern—To match if the specified pattern exists anywhere within the UDP content. • Equals—To match if the UDP content is equal to the specified value. • Exists—To match if the UDP content exists in the incoming packet. • Search—To match if the UDP content contains any one of the specified values. • Value: Enter a value that has to match with the UDP content. • Offset: Enter the value from where to begin scanning. ServerIron ADX Graphical User Interface Guide 53-1002412-01 Content switching TABLE 4 7 Rule type settings (Continued) Rule Type Function Your Action DNS DPI Allows the ADX device to perform a deep packet scan and then classify DNS requests based on the following: query type, query name, RD flag or the DNS security extensions (DNSSEC) OK bit in the EDNS0 header. Under the Settings for DNS DPI Rule, provide the following information: • Query Type: Specifies the DNS query type to match on. • Query Name: specifies the name of the DNS query type to match on. • Recursion Desired (RD): Select the check box to allow the device to classify the DNS requests based on the RD flag set in the packet. • Security (DNSSEC): Select the check box to allow the device to classify DNS requests based on the DNSSEC bit set in the packet. Nested Allows you to combine rules with logical operators to create nested rules. Up to four rules can be combined in single role. Under the Settings for Nested Rule, provide the following information: • Build or directly input the expression: 1 Select a rule from the Rule list 2 Select an operator AND or OR from the Operator list. NOTE: Under the NOT column, select the check box next to the rule that you want to exclude from the nested rules. 3 Repeat the step 1 and step 2 to add more rules to the nested rule. You can also directly enter the expression of the nested rule in the Input Expression field. • Select the master rule from the Master Rule list. NOTE: If a master rule is not specified, the default master in the first rule is the nested rule. 5. Click Apply to save your entries. Click Reset to revert the configuration to the previous configured values. To modify the configured request rules, in the summary table, select an entry and click Edit or double-click the entry. You can also delete a configuration by clicking Delete. Creating response rules The device can perform content rewrite on the server responses. In other words, the device can not only modify requests in the forward direction, but also the responses in reverse direction. The HTTP response is divided into the "header" part and the "body" part. The device can selectively rewrite the header, body, or both. To create a response rule for outgoing traffic on the device, perform the following steps within the Configure tab. 1. Click Traffic on the menu bar. 2. From the sidebar, select Content Switching, and then select Response Rules. ServerIron ADX Graphical User Interface Guide 53-1002412-01 87 7 Content switching The Response Rules page is displayed, as shown in Figure 67. FIGURE 67 Response rules summary 3. Click New at the bottom of Response Rules page. The Response Rule - new page is displayed, as shown in Figure 68. FIGURE 68 Creating a response rule 4. Provide the following information: • Rule Name: Enter the name of the response rule. • Ignore Case: Select the check box if you want to the rule to be case insensitive. • Rule Type: Click one of the following rule types: 88 ServerIron ADX Graphical User Interface Guide 53-1002412-01 Content switching TABLE 5 Rule types settings Rule Type Function Your Action Response Status Code Allows the device to inspect the response based on the code found in the response. Under the Settings for Response Status Code Rule, enter the code range in the Status Code Range to inspect a response only if the code is within the specified range. Response Header Allows the device to inspect the response based on the contents of an HTTP header field in the response. • • • Response Body 7 Allows the device to inspect the response based on the string in the response body. Header Type: Click one of the following: - Well Known HTTP Header: Select a well known header using which you want the ADX device to make a load balancing decision. - User Defined Header: Specify a header field using which you want the device to make a load balancing decision. Operator: Select one of the following operators from the list: - Prefix—To match if the HTTP header field begins with the specified prefix. - Suffix—To match if the HTTP header field begins with the specified suffix. - Pattern—To match if the specified pattern exists anywhere within the HTTP header field. - Equals—To match if the HTTP header field is equal to the specified value. - Exists—To match if the HTTP header field exists in the incoming packet. - Search—To match if the HTTP header field contains any one of the specified values. Value: Enter a value that has to match with the HTTP header field. Under the Settings for Response Body Rule, provide the following information: • Operator: Select one of the following operators from the list: - Prefix—To match if the HTTP response body field begins with the specified prefix. - Suffix—To match if the HTTP response body begins with the specified suffix. - Pattern—To match if the specified pattern exists anywhere within the response body. - Equals—To match if the response body is equal to the specified value. - Exists—To match if the response body exists in the incoming packet. - Search—To match if the response body contains any one of the specified values. • Value: Enter a value that has to match with the response body. 5. Click Apply to save your entries. Click Reset to revert the configuration to the previous configured values. ServerIron ADX Graphical User Interface Guide 53-1002412-01 89 7 Content switching To modify the configured response rules, in the summary table, select an entry and click Edit or double-click the entry. You can also delete a configuration by clicking Delete. For more information on configuring content switching rules, refer to the ServerIron ADX Server Load Balancing Guide. Creating policies You can associate content switching rules to a policy (request or response) that defines how the device process the traffic. Creating request policies A request policy associates request rules with one or more actions that specify how the ADX device handles incoming traffic matching the rule. For more information on creating request rules, refer to “Creating request rules” on page 82. To create a request policy for incoming traffic on the device, perform the following steps within the Configure tab. 1. Click Traffic on the menu bar. 2. From the sidebar, select Content Switching, and then select Request Policies. The Request Policies page is displayed, as shown in Figure 69 FIGURE 69 Request policy summary. 3. Click New at the bottom of the Request Policies page. 90 ServerIron ADX Graphical User Interface Guide 53-1002412-01 Content switching 7 The Request Policy - new page tab is displayed, as shown in Figure 70. FIGURE 70 Creating request policy 4. Provide the following information: • Policy Name: Enter the name of the request policy. • Select a protocol and perform the following actions as described in Table 6. ServerIron ADX Graphical User Interface Guide 53-1002412-01 91 7 Content switching TABLE 6 . 92 Protocols settings Protocol Function Your Action HTTP Allows the device to make load balancing decisions about HTTP traffic based on information in a URL, cookie, or SSL session ID. Under Rule-Action List, select the rule name from the Rule Name list and select one of the following option in the Action list: • Forward: Allows the device to forward packets matching a specified rule to a specified real server or server group. Click one of the following options and provide the following information: - Group ID: Enter the server group ID. The range is from 0 through 1023. - Server ID: Enter the real server ID. The range is from 1024 through 2047. • Persist: Allows the device to send requests with similar content to the same server when the specified rule is matched. Provide the following information: - Offset: Specify the offset in bytes from the end of the matched string. - Length: Enter the length of the persist string in bytes or enter the substring with which the persist string ends in the End Delimiter field. - Persist Method: Select one of the persist methods from the list. The methods are Hash to Bucket, Group ID or Server ID, Hash to Group ID, Server Name, Server Alias Name, and Secondary. • Redirect: Allows the device to redirect a request to an alternate domain, URL, or port when the specified rule is matched. Provide the following information: - Redirect Domain: Enter the domain name to which the ADX device to redirect a request. - Redirect URL: Enter the domain name to which the ADX device to redirect a request. - Redirect Port: Enter the port name to which the ADX device to redirect a request. • Reply-Error: Allows the device to send a 403 error code page back to the client when the specified rule is matched. • Reset-Client: Allows the device to send a TCP reset to the client, which abruptly terminates the connection. • Rewrite: Allows the device to insert a header, client IP address, client certificate, and insert, delete, or replace a string or cookie into the HTTP requests. Select the rewrite option and select an option from the Rewrite Object list: - Cookie: Allows the device to insert a cookie into an HTTP response when a specified rule is matched. - Header: Allows the device to insert a header into the HTTP requests or responses from a virtual server. - Client IP: Allows the device to insert the client IP address into the HTTP requests received on a virtual server that matches a content switching rule you define. - Client Certificate: Allows the device to insert a client certificate into the HTTP requests received on a virtual server that matches a content switching rule you define. - Custom String: Allows the device to delete a string or portion of a string from the incoming client request. ServerIron ADX Graphical User Interface Guide 53-1002412-01 Content switching TABLE 6 7 Protocols settings (Continued) Protocol Function Your Action DNS Allows the ADX device to provide DNS attack protection to VIP traffic. This protection is provided by performing a deep packet scan and then classifying DNS requests based on the query type, query name, RD flag or the DNSSEC “OK” bit in the EDNS0 header. Based on this classification, the following actions can be taken either individually or in combination: forward traffic to a specific server group, drop packets, log events or rate limit DNS traffic from the identified client. Under Rule-Action List, select a rule name from the Rule Name list and click one of the following options for Action. • Redirect: Allows the ADX device to redirect any packets that match the filter to a server or server group. Select one of the following options: - Group ID: Enter the server group ID. The range is from 0 through 1023. - Server ID: Enter the real server ID. The range is from 1024 through 2047. • Rate: Allows the ADX device to direct the rate limit packets that match the filter based on the following values: - Monitor Interval: Enter the monitoring window in 100 ms unit. - Hold-down Period: Enter the length of hold down period in minutes. - Connection Rate: Enter a threshold for the number of global TCP connections per second that are expected on the device. • Drop: Directs the device to drop any packets that match the filter. Other Protocols Allows the device to make a load balancing decision based on the traffic of other protocols. Under the Rule-Action List, select the rule name from the Rule Name list and select one of the options from the Action list: • Begin Delimiter: Specifies to set this rule to be the beginning delimiter. • End Delimiter: Specifies to set this rule to be the ending delimiter. • Forward: Allows the device to forward packets that matches a specified rule to a specified real server or server group. - Group ID: Enter the server group ID. The range is from 0 through 1023. - Server ID: Enter the real server ID. The range is from 1024 through 2047. • Persist: Allows the device to send requests with similar content to the same server when the specified rule is matched. When a rule is matched, the device uses the content that matched the rule to select a server or server group to send the packet. Provide the following information: • Offset: Enter the offset in bytes from the end of the matched string. • Length: Enter the length of the persist string in bytes. • End Delimiter: Enter the substring with which the persist string ends. • Persist Hash to Bucket: Select the check box to hash the persist string to a hashing bucket. • Goto: Allows the matched pattern to be forwarded to another policy as input and an evaluation to be performed. Provide the following information: - Go to this policy: Select the request policy from the list. • Reset-Client: Allows the device to send a TCP reset to the client, which abruptly terminates the connection. • Rewrite: Allows the device to rewrite the matched string with a pattern that you specify. ServerIron ADX Graphical User Interface Guide 53-1002412-01 93 7 Content switching • Select the Log check box to write a message to system log when the specified rule is matched, and specify the log format. • Click Add to create a rule-action list. The rule-actions list is displayed in the table. Select a rule in the table and click Remove to delete the rule and the action from the list. Click the UP or DOWN button to arrange the rule-action list in desired order. 5. Click Apply to save your entries. Click Reset to revert the configuration to the previous configured values. Creating response policies A response policy associates request rules with one or more actions that specify how the ADX device handles outgoing traffic matching the rule. For more information on creating response rules, refer to “Creating response rules” on page 87. To create a Layer 7 response policy for outgoing traffic on the device, perform the following steps within the Configure tab: 1. Click Traffic on the menu bar. 2. From the sidebar, select Content Switching, and then select Response Policies. The Response Policies page is displayed, as shown in Figure 71. FIGURE 71 3. 94 Response policies summary Click New at the bottom of Response Policies page. ServerIron ADX Graphical User Interface Guide 53-1002412-01 Content switching 7 The Response Policy - new page is displayed, as shown in Figure 72. FIGURE 72 Creating response policy 3. Provide the following information: • Policy Name: Enter the name of the response policy. • Rewrite Type: Click one of the rewrite type and set the parameters based on the rewrite type selected as described in Table 7. ServerIron ADX Graphical User Interface Guide 53-1002412-01 95 7 Content switching TABLE 7 rewrite type settings Rewrite Type Function Your Action HTTP Header Allows the feature to be used in an SSL-Offload environment when the real servers send redirect messages to the incoming clients. Provide the following information: • HTTP Response Status Code rules: Select the status code rules from the Available list and click Add to move the rules to the Selected list. The code rule identifies the response packets on which Layer 7 policy should act upon. • HTTP Response Header Name and String Rule: Select a rule from the list to identify an HTTP response header name and the string that needs to be rewritten. • Old String Value: Enter the value that defines the string to be replaced, if the string can be found in the URL defined by the content switching rule. • New String Value: Enter the value with which the old string is to be replaced. • Offset: Enter the offset in bytes from the end of the matched string. • Length: Enter the length of the persist string in bytes. HTTP Body Allows to be used when a web site wants a upgrade to SSL-Offload. Provide the following information: • Where to change the response: Click one of the following options: - HTTP Request Rule: Select a request rule to be acted upon. - HTTP Response Rule: Select a response rule to be acted upon. • HTTP Response Body String Rule: Select the rule that defines string to be matched in the response body. • Old String Value: Enter the value that defines the string to be replaced, if the string can be found in the URL defined by the content switching rule. • New String Value: Enter the value with which the old string is to be replaced. • Offset: Enter the offset in bytes from the end of the matched string. • Length: Enter the length of the persist string. • Ignore Case: Select the check box if you want the policy to be case insensitive. • Click Add to add the rule. The new Layer 7 response policy is added to the policy table. You can click Remove to delete a rule from the policy. 4. Click Apply to save your entries. Click Reset to revert the configuration to the previous configured values. For more information on configuring content switching policies, refer to the ServerIron ADX Server Load Balancing Guide. Binding policies After creating the content switching policies, you must apply the policy to the incoming and outgoing traffic by binding the policy to the virtual server ports. 96 ServerIron ADX Graphical User Interface Guide 53-1002412-01 Content switching 7 Binding request policies After creating a request rule and request policy, you need apply the request policy to the incoming traffic by binding it to virtual ports. To bind the request policy to VIPs, perform the following steps within the Configure tab. 1. Click Traffic on the menu bar. 2. From the sidebar, select Content Switching, and then select Request Policies. The Request Policies page is displayed. 3. Select a policy from the Request Policy table and then click Bindings. The binding page is displayed as shown in Figure 73. FIGURE 73 Binding request policies 4. Select the VIPs to bind with the request policy from the Available VS-Ports list and click Bind to move them to the Bound VS-Ports list. To unbind the VIPs or ports, select the ports you want to unbind from the Bound VS-Ports list and click Unbind. To unbind all the ports, click Unbind All. Binding response policies After creating a request rule and request policy, you need apply the request policy to the incoming traffic by binding it to virtual ports. To bind the request policy to VIPs, perform the following steps within the Configure tab. 1. Click Traffic on the menu bar. 2. From the sidebar, select Content Switching, and then select Response Policies. The Response Policies page is displayed. 3. Select a policy from the Response Policies table and click Bindings. The page is displayed as shown in Figure 74. FIGURE 74 Binding response policies ServerIron ADX Graphical User Interface Guide 53-1002412-01 97 7 OpenScript 4. Select the virtual servers to bind with the request policy from the Available VS-Ports list and click Bind to move them to the Bound VS-Ports list. To unbind the VIPs or ports, select the ports you want to unbind from the Bound VS-Ports list and click Unbind. To unbind all the ports, click Unbind All. For more information on binding content switching policies, refer to the ServerIron ADX Server Load Balancing Guide. OpenScript OpenScript provides a Perl-based scripting environment to create event-driven configurations that can adapt to a real-time network environment. The OpenScript environment allows you to create new configurations using scripts written in Perl to obtain traffic information from the ADX device, and make changes to the device, and then respond through changes in operation. Creating scripts To create an OpenScript on the device, perform the following steps within the Configure tab. 1. Click Traffic on the menu bar. 2. From the sidebar, select OpenScripts. The Configure Scripts page is displayed, as shown in Figure 75. FIGURE 75 Scripts summary 3. Click New at the bottom of the Configure Scripts page. 98 ServerIron ADX Graphical User Interface Guide 53-1002412-01 OpenScript 7 The Script Details - new page is displayed, as shown in Figure 76. FIGURE 76 Configuring script details 4. Provide the following information: • Script name: Enter the name of the script stored in the device. • Script code: Enter the executable code of the script. • Click Compile to compile the script code. You are recommended to compile a new script before binding it to a virtual server port, to make sure that the script compiles successfully and obtain an estimate of script performance. 5. Click Apply to save your entries. Click Reset to revert the configuration to the previous configured values. For more information on configuring scripts, refer to the ServerIron ADX OpenScript Guide. Binding scripts The script binding operation compiles the script unconditionally and enables packet processing on a specified server port or server. To bind a virtual server port to a script profile on the device, perform the following steps within the Configure tab. 1. Click Traffic on the menu bar. 2. From the sidebar, select OpenScripts. 3. Select an entry from the Configure Scripts page and click Bindings. ServerIron ADX Graphical User Interface Guide 53-1002412-01 99 7 OpenScript The page is displayed as shown in Figure 77. FIGURE 77 Binding scripts 4. Provide the following information: • Script Profile: Select the profile from the list to apply the previously configured script profile to the script being bound. • Select the virtual server ports from the Available VS-Ports list and click Bind to move the port that has to be bound to a script. Click Unbind to unbound the virtual server port or services from the script. Click Unbind All to unbound all the server ports or services. For more information on binding scripts to virtual server ports, refer to the ServerIron ADX OpenScript Guide. Configuring script profiles You can create a script profile to configure the scripting parameters in a single profile. You can then be bind the script profile to a script during the port binding. To configure an script profile on the device, perform the following steps within the Configure tab. 1. Click Traffic on the menu bar. 2. From the sidebar, select OpenScripts, and then select OpenScript Profiles. The Configure Script Profiles page is displayed, as shown in Figure 78. FIGURE 78 Script profiles summary 3. Click New at the bottom of the Configure Script Profiles page. 100 ServerIron ADX Graphical User Interface Guide 53-1002412-01 OpenScript 7 The Script Profiles - new page tab is displayed, as shown in Figure 79. FIGURE 79 Configuring script profile 4. Provide the following information: • Profile name: Enter the name of the script profile that you want to create or update. • Memory Limit (bytes): Enter the memory limit for any script that is bound to the script profile. The range is from 1 through 1073741824 bytes. The default value is 1,048,576 bytes. • Memory High Watermark: Enter the script memory high-watermark percentage, so that when the high-water percentage reaches, a system log message is generated and the script resets the new connection on the device. The range is from 1 through 100 percentage. The default value is 90 percentage. • Timeout Seconds: Enter the watchdog time for the script in milliseconds. The range is from 1 through 1000 milliseconds. The default value is 200 milliseconds. • Data Collection Limit: Enter the maximum data collection limit for the script in bytes. The range is from 1 through 4,294,967,296. The default value is 1000000 bytes. • Debug: Select the Enable check box to allow debugging for the script. When you enable the debug flag, the debug information is printed at the console. • Restart Limit: Enter the maximum number of times that the script will restart. • Output Destination: Select one of the following from the list. Console—Sets the script to print its output to the console. By default, console is set to be the output destination. Syslog—Sets the script to print its output to the syslog. None—Disables the script from printing. 5. Click Apply to save your entries. Click Reset to revert the configuration to the previous configured values. For more information on configuring script profiles, refer to the ServerIron ADX OpenScript Guide. ServerIron ADX Graphical User Interface Guide 53-1002412-01 101 7 102 OpenScript ServerIron ADX Graphical User Interface Guide 53-1002412-01 Chapter Security Settings 8 In this chapter • SSL certificates . . . . . . . . . . . . . . . . . . . . . . . . . . . . . . . . . . . . . . . . . . . . . . . 103 • SSL profiles . . . . . . . . . . . . . . . . . . . . . . . . . . . . . . . . . . . . . . . . . . . . . . . . . . 108 • Access Control Lists. . . . . . . . . . . . . . . . . . . . . . . . . . . . . . . . . . . . . . . . . . . . 115 SSL certificates The Secure Sockets Layer (SSL) protocol provides security and privacy between client and server over the Internet. SSL supports server and client certificate verification, and negotiates encryption keys and authenticates the server before data is exchanged by the high-level applications. SSL on the ADX device provides hardware-accelerated encryption and decryption services to the clients. The SSL “handshake” is a key concept in the SSL protocol. The handshake involves server authentication and an optional client certificate verification. In server authentication, the server sends its certificate and the cipher preferences to a client that has made a request. The client then generates a master key, encrypts it with the public key of the server, and returns the encrypted master key to the server. Generating private keys A key pair file specifies the location for retrieving SSL asymmetric key pair during an SSL handshake. You can generate key pair file locally on a device or import a pre-existing key pair. To generate an SSL key, perform the following steps within the Configure tab. 1. Click Security on the menu bar. 2. From the sidebar, select SSL. ServerIron ADX Graphical User Interface Guide 53-1002412-01 103 8 SSL certificates The Setup SSL page is displayed, as shown in Figure 80. FIGURE 80 Setting up SSL 3. Click SSL Keys. The SSL Keys page is displayed, as shown in Figure 81. The summary of configured SSL keys is displayed. FIGURE 81 SSL key summary 4. Click Generate at the bottom of SSL Keys page. The Generate Key page is displayed, as shown in Figure 82. FIGURE 82 Generating SSL key 5. Provide the following information: • Encryption: Displays the encryption type as RSA. • Encryption Password: Enter the password for the SSL certificate. 104 ServerIron ADX Graphical User Interface Guide 53-1002412-01 SSL certificates 8 • Key Length: Click 512, 768, 1024, or 2048 bits to set the length of the SSL key. The default length is 1024. • Save Key As File Name: Enter the filename (without space) that used to store the generated SSL certificate. 6. Click Generate Key File. Click Clear to clear all the entries in the fields. Uploading private keys To upload an existing SSL key to the device, perform the following steps within the Configure tab. 1. Click Security on the menu bar. 2. From the sidebar, select SSL, and then select SSL Keys. 3. Click Upload at the bottom of the SSL Keys page. The Upload Key page is displayed, as shown in Figure 83. FIGURE 83 Uploading SSL key 4. Provide the following information: • Format: Displays the supported format of the server certificates. The supported format is Privacy Enhanced Mail (PEM) only. • Encryption Password: Enter the password if the SSL key is encrypted; otherwise leave the field blank. • Save As File Name: Enter the file name if you want to save the SSL key file on the device with different name. If the field is left blank, the SSL key file is saved with the same name. • Local Key File To Upload: Click Browse the find the SSL key in the local directory to upload the file to the device. 5. Click Upload Key File. Click Clear to clear all the entries in the fields. Generating Certificate Signing Requests You can generate a Certificate Signing Requests (CSR) and have it signed by a known Certificate Authority (CA) to create a certificate and then import it. Before generating a CA signed certificate, you must obtain an RSA key pair. For more information on obtaining an RSA key pair, refer to “Generating private keys” on page 103. All configuration options used with the SSL features of the device require you to obtain a certificate and upload it to the device. There are different methods to create a certificates: • Generating CSRs. ServerIron ADX Graphical User Interface Guide 53-1002412-01 105 8 SSL certificates • Generating self-signed certificates. For more information on self-signed certificates, refer to “Generating self-signed certificates” on page 107. To generate a request for a certificate that will be sent to a CA to be digitally signed, perform the following steps within the Configure tab. 1. Click Security on the menu bar. 2. From the sidebar, select SSL, and then select SSL Certificates. The SSL Certificates page is displayed, as shown in Figure 84. FIGURE 84 SSL certificates 3. Click Generate CSR at the bottom of SSL Certificates page. The Generate CSR page is displayed, as shown in Figure 85. FIGURE 85 Generating a CSR 4. Provide the following information: • • • • • • • • 106 Key File: Select the private keys you generated. Encryption Password: Enter the password for the SSL certificate. Organization: Enter the name of your organization; for example, Brocade. Domain: Enter the name of your domain; for example, www.brocade.com. Department: Enter the name of the department; for example, Web Administration. City: Enter the name of your city; for example, San Jose. Email: Enter the e-mail address; for example, [email protected]. State: Enter the name of your state; for example, California. ServerIron ADX Graphical User Interface Guide 53-1002412-01 SSL certificates 8 • Country: Enter the name of your country; for example, US. Only two characters are allowed. 5. Click Generate Request. Click Clear to clear all the entries in the fields. Uploading the existing certificates You can upload the certificate to the device, after you receive an SSL certificate from the CA. To upload the certificate, perform the following steps within the Configure tab. 1. Click Security on the menu bar. 2. From the sidebar, select SSL, and then select SSL Certificates. 3. Click Upload at the bottom of SSL Certificates page. The Upload page is displayed, as shown in Figure 86. FIGURE 86 Uploading the SSL certificate 4. Provide the following information: • Format: Click PEM or PKCS12 to specify the format of the certificate. The default is PEM. • Encryption Password: Optionally, enter the password for the SSL certificate. • CA Certificate: Select the Yes check box to enable appending of certificate you are uploading to an existing certificate on the device. Select an SSL certificate from the Append to list. • Save As File Name: Optionally, enter the name of the certificate if you want to upload the certificate on the device with a different name. If you leave this field blank, the certificate will be uploaded with the same name. • Certificate File To Upload: Select the server certificate or CA certificate from your local directory to upload to the device. 5. Click Upload Certificate. Click Clear to clear all the entries in the fields. Generating self-signed certificates You can also generate a self-signed certificate on the device and upload it. To generate a self-signed certificate, perform the following steps within the Configure tab. 1. Click Security on the menu bar. 2. From the sidebar, select SSL, and then select SSL Certificates. ServerIron ADX Graphical User Interface Guide 53-1002412-01 107 8 SSL profiles 3. Click Generate Certificate at the bottom of SSL Certificates page. The Generate Certificate page is displayed, as shown in Figure 87. FIGURE 87 Generating SSL certificate 4. Provide the following information: • Certificate Name: Enter the name of the file that is used to stored the self-signed generated certificate. • • • • • • • • • Key File: Select the RSA key pair that is used to build and sign the certificate. Encryption Password: Enter the password that is used to store the certificate. Organization: Enter the name of your organization. Domain: Enter the name of your domain. Department: Enter the name of the department. City: Enter the name of the city. Email: Enter the e-mail address. State: Enter the name of the state. Country: Enter the name of the country. Only two characters are allowed. 5. Click Generate Certificate. Click Clear to clear all the entries in the fields. SSL profiles An SSL profile is a group of settings that allows the device to manage the application-specific SSL traffic. The basic function of an SSL profile is to offload certificate validation and verification tasks. You can create an SSL profile with all the related parameters, and associate the profile to the SSL port on a virtual server. Creating SSL profiles To create an SSL profile, ensure that the SSL key and SSL certificate have been created and uploaded to the device. An SSL profile contains all the SSL-related configuration parameters such as the RSA key pair, cipher suite and the digital certificate for the SSL connection. An SSL profile can be bound to the SSL port on a virtual server. To create an SSL profile, perform the following steps within the Configure tab. 108 ServerIron ADX Graphical User Interface Guide 53-1002412-01 SSL profiles 8 1. Click Security on the menu bar. 2. From the sidebar, select SSL, and then select SSL Profiles. The SSL Profiles page is displayed, as shown in Figure 88. FIGURE 88 SSL profile summary 3. Click New at the bottom of SSL Profiles page. The Configure SSL Profile page tab is displayed, as shown in Figure 89. FIGURE 89 Configuring a profile 4. Under Basic tab, provide the following information: • Profile Name: Enter the name of the SSL profile being defined. • Key File: Select the RSA key pair file that was generated to associate it with the SSL profile. • Certificate File: Select the certificate file that was self generated or imported to associate it with the SSL profile. • Chaining: Select the Enable check box to configure the device to send the entire certificate chain including the root CA certificate and any intermediate CA certificates when presenting the certificate to the client. • SSL 2.0: Select the Enable check box to enable SSL 2.0. By default, the device supports SSL 3.0. ServerIron ADX Graphical User Interface Guide 53-1002412-01 109 8 SSL profiles • Select the cipher suites you want in the Available Ciphers list and click Add to add to the Selected Ciphers list, to control the security strength of the SSL handshakes. 5. Click Certificates tab to specify additional options under the SSL profile. The Certificates page is displayed, as shown in Figure 90. FIGURE 90 Certificates configuration 6. Provide the following information: • Verify Client Certificate: Select the Enable check box to configure the device to verify the signed certificates of the connecting client. By default, client certificate verification is disabled. After enabling the certificate verification, select one of the following options: Per New Connection: To request a client certificate for every new SSL connection. Per SSL Handshake: To request a client certificate for every SSL handshake. Certificate Optional: To indicate the client certificate is optional. Require Certificate for Connection: To indicate the requirement of certificate for the new connection. Disable Certificate checking: Selected the check box to configure the device to not check for the SSL certificate during client connection. This is applicable only in SSL proxy mode. • • CA Certificates for SSL Proxy Mode: Select the CA certificates from the Available list and click Add to move them to the Selected list, which can be used by the device in SSL proxy mode. In SSL proxy mode, the device acts as a client to the real server and requires a valid client certificate to connect to the real server. 7. 110 Click Advanced tab to configure advanced parameters for the SSL profile. ServerIron ADX Graphical User Interface Guide 53-1002412-01 SSL profiles 8 The Advanced tab is displayed, as shown in Figure 91. FIGURE 91 Configuring advanced parameters 8. Provide the following information: • CLOSE-NOTIFY Alert: Select the Enable check box to configure the device to send an alert before closing an SSL session. • SSL Session Cache: Select the Enable check box to configure the device to share the same SSL session for multiple SSL connections. Cache Timeout: Specify how long the SSL sessions can be held in the cache. The range is from 30 through 86400 seconds. Max Entries: Enter the maximum number of cache entries per SSL profile. The range is from 512 through 8192. TCP Profile: Select a profile in the list. To configure a TCP profile for the SSL profile, click Manage TCP profile. To manage the TCP profile, refer to “Managing TCP profile” on page 111. • 9. Click Apply to save your entries. Click Reset to revert the configuration to the previous configured values. For more information on configuring SSL profiles, refer to the ServerIron ADX Security Guide. Managing TCP profile To manage the TCP profile, perform the following steps. 1. Click Manage TCP Profile to create or edit a profile. The TCP Profiles page is displayed, as shown in Figure 92. FIGURE 92 Managing TCP profiles ServerIron ADX Graphical User Interface Guide 53-1002412-01 111 8 SSL profiles 2. Select a profile you want to edit from the list or click New to create a new profile. 3. Provide the following information: • Profile Name: Enter the name of the TCP profile. • Nagle Algorithm: Select the check box to enable Nagle algorithm that is used to address the problem when an application generates several small bytes of data at a time. • Delayed ACK Algorithm: Select the check box to send few acknowledgement (ACKs) per data segment using a TCP delayed ACK mechanism. • PUSH Bit: Select the check box to enable PUSH flag in all the outgoing data packets except when emptying the TCP transmit queue. • Transmit Queue Size: Enter the size of the TCP transmit queue. • Receive Queue Size: Enter the size of the TCP receive queue. 4. Click Apply to create a TCP profile. Click Reset to revert the configuration to the previous configured values. Binding the profiles Before binding the profiles, make sure the following have been created: • Virtual Server. For more information on creating virtual server, refer to “Creating a virtual server” on page 49. • Virtual Server Port. For more information on creating a virtual server port, refer to “Creating a virtual server port” on page 52. • SSL profile. For more information on creating SSL profiles, refer to “SSL profiles” on page 108. After creating the SSL profile, you must bind the profiles with the virtual server ports. The SSL acceleration on the device can be configured to operate in one of the following two modes: • SSL termination mode—An SSL connection is maintained between a client and an ADX device and the connection is not encrypted. • SSL full proxy mode—One SSL connection is maintained between a client and a device and a separate SSL connection between a device and server. To bind the SSL profiles on the device, perform the following steps within the Configure tab. 1. Click Security on the menu bar. 2. From the sidebar, select SSL, and then select SSL Profile Bindings. 112 ServerIron ADX Graphical User Interface Guide 53-1002412-01 SSL profiles 8 The SSL Profile Bindings page is displayed, as shown in Figure 93. FIGURE 93 Binding the profile 3. Click Bind SSL Profiles at the bottom of SSL Profile Bindings page. The Add Profile Bindings page is displayed, as shown in Figure 94. FIGURE 94 Adding profile bindings 4. Under Bind VIP Port to a Profile, select one of the SSL mode: • If you select Terminate, enter the following information: Server Profile: Select an SSL profile from the list. TCP Profile: Select a TCP profile from the list. If you select Proxy, enter the following information: • Client SSL Profile: Select an SSL profile from the list for client certificate verification. Server SSL Profile: Select an SSL profile from the list for server certificate verification. 5. Click Apply to save your entries. Click Reset to revert the configuration to the previous configured values. NOTE Optionally, you can also bind a real server port to a virtual server port. For more information on binding the SSL profiles, refer to the ServerIron ADX Security Guide. ServerIron ADX Graphical User Interface Guide 53-1002412-01 113 8 SSL profiles Creating certificate revocation list The certificate revocation lists (CRL) contain the list of SSL certificates that have been revoked by a CA. The CA revokes an SSL certificate for many reasons. These lists are typically maintained on the CA web site and can be downloaded using Hypertext Transfer Protocol (HTTP). To configure an SSL CRL, perform the following steps within the Configure tab. 1. Click Security on the menu bar. 2. From the sidebar, select SSL, and then select SSL CRL. The SSL CRLs page is displayed, as shown in Figure 95. FIGURE 95 SSL CRL summary 3. Click New at the bottom of SSL CRLs page. The Configure SSL CRL - new page is displayed, as shown in Figure 96. FIGURE 96 Configuring SSL CRL 4. Provide the following information: • CRL Name: Enter the name of the SSL CRL record. • URL: Enter the location where the CRL is located. You can enter an IP address or a domain name. 114 ServerIron ADX Graphical User Interface Guide 53-1002412-01 Access Control Lists 8 • CRL File Format: Click one of the following options: PEM—To direct the CRL to be downloaded in the PEM format. DER—To direct the CRL to be downloaded in the Distinguished Encoding Rules (DER) format. By default, PEM is selected. Refresh Interval: Specifies the number of hours to wait before updating the CRL record. • 5. Click Apply to save your entries. Click Reset to revert the configuration to the previous configured values. For more information on the CRL, refer to the ServerIron ADX Security Guide. Access Control Lists Access Control Lists (ACL) allows you to filter traffic based on the information in the IP packet header. You can use IP ACLs to provide input to other features such as distribution lists and rate limiting. The ACLs can be configured in two types: • Standard ACL—Permits or denies packets based on the source IP addresses. • Extended ACL—Permits or denies packets based on the source and destination IP addresses and also based on the IP protocol information. Configuring standard ACLs To configure a standard ACL on the device, perform the following steps within the Configure tab. 1. Click Security on the menu bar. 2. From the sidebar, select ACL. The ACL Summary page is displayed, as shown in Figure 97. FIGURE 97 ACL summary 3. Click New IPv4 Standard ACL at the bottom of the ACLs page. ServerIron ADX Graphical User Interface Guide 53-1002412-01 115 8 Access Control Lists The ACL IPv4 Standard - new page is displayed, as shown in Figure 98. FIGURE 98 Configuring ACL 4. Provide the following information: • ACL ID / Name: Select one of the following options: ID#: Enter the number to identify a collection of individual ACL entries. By default, ACL ID is enabled. Name: Enter the name of the ACL. Action: Click one of the following options: • Permit—Permits the packets that match the ACL policy. Deny—Denies the packets that match the ACL policy. Log: Select the check box to generate a system log entry for packets that are denied by the ACL entry. This option is enabled when you choose the Deny option. • • Source IP: Enter the source IP address based on which a standard ACL permits or denies the packets. • • • • Any: Select the check box to enable the ACL policy to match on all source IP addresses. Subnet Mask: Enter the subnet mask. Host: Enter the name of the host. Remark: Enter the remark information. 5. Click Apply to save your entries. Click Reset to revert the configuration to the previous configured values. To delete an ACL, select an entry from the list displayed in ACLs page and click Delete. For more information on the standard ACL, refer to the ServerIron ADX Security Guide. Configuring extended ACLs The extended ACLs use additional criteria to permit or deny packets. To configure an extended ACL on the device, perform the following steps within the Configure tab. 1. Click Security on the menu bar. 2. From the sidebar, select ACL. 116 ServerIron ADX Graphical User Interface Guide 53-1002412-01 Access Control Lists 8 3. Click New IPv4 Extended ACL at the bottom of the ACL Summary page. The ACL IPv4 Extended - new page is displayed, as shown in Figure 99. FIGURE 99 Configuring extended ACL 4. Provide the following information: • ACL ID / Name: Select one of the following options: ID#: Enter the number to identify a collection of individual ACL entries. The range is from 100 through 199. By default, ACL ID is enabled. Name: Enter the name of the ACL. Action: Click one of the following options: • Permit—Permits the packets that matches the ACL policy. Deny—Denies the packets that matches the ACL policy. Log: Select the check box to generate a system log entry for packets that are denied by the ACL entry. This option is enabled when you choose Deny action. • • Protocol Match: Select a protocol in the list to provide the type of IP packet you are filtering. • Match established connections: Select the check box to enable the policy only to the established TCP connections, and not to new sessions. • Remark: Enter the remark. 5. Under Source, provide the following information: • Click Source IP or Source Host. • Any: Select the check box for ACL to use any source IP or host. • Source IP: Enter the source IP address based on which a standard ACL permits or denies the packets. NOTE The Source IP field is enabled if you select the Source IP option. • Source Host: Enter the name of the source host. NOTE The Source Host field is enabled if you select the Source Host option. ServerIron ADX Graphical User Interface Guide 53-1002412-01 117 8 Access Control Lists • Source Mask: Enter the subnet mask of the source IP address. • Port Match: Click one of the following options to specify a comparison operator for the TCP or UDP port number. This option is enabled only when you specify TCP or UDP as the IP protocol in Protocol Match. None: The policy does not apply any comparison operator for the TCP or UDP port number. Greater than: The policy applies to TCP or UDP port numbers greater than the port number or name you enter. Less than: The policy applies to TCP or UDP port numbers that are less than the port number or name you enter. Equal: The policy applies to TCP or UDP port name or number you enter. Not equal: The policy applies to all TCP or UDP port numbers except the port number or name you enter. Range: The policy applies to all TCP or UDP port numbers that are between the first and second port number or name you enter. Enter the range in the Port Match field. The range is from 0 through 65,535. 6. Under Destination, provide the following information: • Click Destination IP or Destination Host. • Any: Select the check box for ACL to use any destination IP or host. • Destination IP: Enter the destination IP address based on which a standard ACL permits or denies the packets. NOTE The Destination IP field is enabled if you select the Destination IP option. • Destination Host: Enter the name of the destination host. NOTE The Destination Host field is enabled if you select the Destination Host option. • Destination Mask: Enter the subnet mask of the destination IP address. • Port Match: Click one of the following options to specify a comparison operator for the TCP or UDP port number. This option is enabled only when you specify TCP or UDP as the IP protocol in Protocol Match. 7. 118 None: The policy does not apply any comparison operator for the TCP or UDP port number. Greater than: The policy applies to TCP or UDP port numbers greater than the port number or name you enter. Less than: The policy applies to TCP or UDP port numbers that are less than the port number or name you enter. Equal: The policy applies to TCP or UDP port name or number you enter. Not equal: The policy applies to all TCP or UDP port numbers except the port number or name you enter. Range: The policy applies to all TCP or UDP port numbers that are between the first and second port number or name you enter. Enter the range in the Port Match field. The range is from 0 through 65,535. Click Apply to save your entries. ServerIron ADX Graphical User Interface Guide 53-1002412-01 Access Control Lists 8 Click Reset to revert the configuration to the previous configured values. For more information on the extended ACL, refer to the ServerIron ADX Security Guide. Configuring IPv6-based ACL The device supports IPv6-based ACLs. You can configure an IPv6 ACL on a global basis and then apply to the incoming IPv6 packets on specified interface. To configure an ACL for IPv6 on the device, perform the following steps within the Configure tab. 1. Click Security on the menu bar. 2. From the sidebar, select ACL. 3. Click New IPv6 ACL at the bottom of the ACL Summary page. The ACL IPv6 - new page is displayed, as shown in Figure 100. FIGURE 100 Configuring IPv6-based ACL 4. Provide the following information: • ACL Name: Enter the name of the ACL. • Action: Click one of the following options: Permit—Permits the packets that matches the ACL policy. Deny—Denies the packets that matches the ACL policy. Protocol Match: Select the protocol from the list to provide the type of IP packet you are filtering. • • Match established connections: Select the check box to enable the policy only to the established TCP connections, not to new sessions. 5. Under Source, provide the following information: • Click Source IP or Source Host. • Source IP: Enter the source IP address based on which the ACL permits or denies the packets. NOTE The Source IP field is enabled if you select the Source IP option. • Source Host: Enter the name of the source host. ServerIron ADX Graphical User Interface Guide 53-1002412-01 119 8 Access Control Lists NOTE The Source Host field is enabled if you select the Source Host option. • Source Mask: Enter the subnet mask of the source IP address. • Any: Select the check box to enable the ACL policy to match on all source IP addresses. • Port Match: Click one of the following options to specify a comparison operator for the TCP or UDP port number. This option is enabled only when you specify TCP or UDP as the IP protocol in Protocol Match. None: The policy does not apply any comparison operator for the TCP or UDP port number. Greater than: The policy applies to TCP or UDP port numbers greater than the port number or name you enter. Less than: The policy applies to TCP or UDP port numbers that are less than the port number or name you enter. Equal: The policy applies to TCP or UDP port name or number you enter. Not equal: The policy applies to all TCP or UDP port numbers except the port number or name you enter. Range: The policy applies to all TCP or UDP port numbers that are between the first and second port number or name you enter. Enter the range in the Port Match field. The range is from 0 through 65,535. 6. Under Destination, provide the following information: • Click Destination IP or Destination Host. • Any: Select the check box for ACL to use any destination IP or host. • Destination IP: Enter the destination IP address based on which a standard ACL permits or denies the packets. NOTE The Destination IP field is enabled if you select the Destination IP option. • Destination Host: Enter the name of the destination host. NOTE The Destination Host field is enabled if you select the Destination Host option. • Destination Mask: Enter the subnet mask of the destination IP address. • Any: Select the check box to disable the entries to the destination IP addresses. 120 ServerIron ADX Graphical User Interface Guide 53-1002412-01 Access Control Lists 8 • Port Match: Click one of the following options to specify a comparison operator for the TCP or UDP port number. This option is enabled only when you specify TCP or UDP as the IP protocol in Protocol Match. None: The policy does not apply any comparison operator for the TCP or UDP port number. Greater than: The policy applies to TCP or UDP port numbers greater than the port number or name you enter. Less than: The policy applies to TCP or UDP port numbers that are less than the port number or name you enter. Equal: The policy applies to TCP or UDP port name or number you enter. Not equal: The policy applies to all TCP or UDP port numbers except the port number or name you enter. Range: The policy applies to all TCP or UDP port numbers that are between the first and second port number or name you enter. Enter the range in the Port Match field. The range is from 0 through 65,535. Remark: Enter the remark. • 7. Click Apply to save your entries. Click Reset to revert the configuration to the previous configured values. For more information on the IPv6 ACLs, refer to the ServerIron ADX Security Guide. ServerIron ADX Graphical User Interface Guide 53-1002412-01 121 8 122 Access Control Lists ServerIron ADX Graphical User Interface Guide 53-1002412-01 Section II Monitoring the ADX This section describes the Monitor features, and includes the following chapters: • Monitoring Overview . . . . . . . . . . . . . . . . . . . . . . . . . . . . . . . . . . . . . . . . . . . • Viewing System Information . . . . . . . . . . . . . . . . . . . . . . . . . . . . . . . . . . . . . • Viewing Network Status . . . . . . . . . . . . . . . . . . . . . . . . . . . . . . . . . . . . . . . . • Viewing Traffic Statistics . . . . . . . . . . . . . . . . . . . . . . . . . . . . . . . . . . . . . . . . • Viewing Security Statistics . . . . . . . . . . . . . . . . . . . . . . . . . . . . . . . . . . . . . . ServerIron ADX Graphical User Interface Guide 53-1002412-01 125 127 135 151 175 123 124 ServerIron ADX Graphical User Interface Guide 53-1002412-01 Chapter Monitoring Overview 9 In this chapter • Navigating the monitoring tab . . . . . . . . . . . . . . . . . . . . . . . . . . . . . . . . . . . 125 Navigating the monitoring tab The Monitor tab is the third tab in the ADX web interface. You can use the Monitor tab to monitor the system, network, traffic, or security settings on an ADX device. When you click the Monitor tab, the following menus are displayed in the menu bar. • System—Allows you to view the information specific to system summary and system logs. • Network—Allows you to view the information specific to interfaces, IP statistics, Address Resolution Protocol (ARP), and Media Access Control (MAC). • Traffic— Allows you to view the information specific to virtual server, real server, health checks, content switching, scripts, and sessions. • Security—Allows you to view the information specific to Secure Socket Layer (SSL) and Distributed Denial of Service (DDoS) protection. By default, the ADX web interface displays the System menu after you click the Monitor tab. Click a menu that represents the primary task that you want to perform from the menu bar, the corresponding entities specific to the menu are displayed in the sidebar. From the sidebar, select an entity that represents a configuration feature. The corresponding Summary page with a list of configured entities specific to the feature, in tabular format, is displayed in the main page. For example, when you select the Real Servers entity from the sidebar, the main page displays a summary page with the list of real servers configured on the device. The list displays all the configured entries with 30 entries in each page. You can navigate to view the next or previous set of configuration information by clicking Next or Previous at the bottom of the Summary page. Click First or Last to go to the most recent or least recent entries. Also, you can select the page number from the list, to go to a specific page. To view the detailed statistics of a feature, select an entry from the list and click Details at the bottom of the Summary page. The statistical data can be viewed in graphical or tabular format. You are allowed to switch between tabular and graphical format. To switch the view, click Graph or Details on the top right corner of that page. For example, click the Network menu from the menu bar and select IP from the sidebar to view the IP configuration information statistics as shown in Figure 101. The option to view the statistical data in graphical format is present only to some of the pages. In graphical view, some of the graphs appear by default. To view or hide the graphs based on various networking parameters, select or clear the check boxes corresponding to the graphs that you want to view from the Select Graph list. You can also click the close button that is displayed on the each individual graphs to close the graph. Select the legend check boxes to plot the relevant statistics data on the graph. ServerIron ADX Graphical User Interface Guide 53-1002412-01 125 9 Navigating the monitoring tab FIGURE 101 IP graphical view There are common icons that are displayed on the top right corner of all the main pages within the Monitor tab. Table 8 describes the icons displayed on the main page. TABLE 8 126 Monitoring icons Icon Description Filter Allows you to filter the data in the Summary page. Click the Filter icon and select the criteria from the Filter Criteria list. Auto refresh Refresh the configuration page based on the changes made to the configuration. Select the interval at which the page has to refreshed. ServerIron ADX Graphical User Interface Guide 53-1002412-01 Chapter Viewing System Information 10 In this chapter • System summary . . . . . . . . . . . . . . . . . . . . . . . . . . . . . . . . . . . . . . . . . . . . . . 127 • System log entries . . . . . . . . . . . . . . . . . . . . . . . . . . . . . . . . . . . . . . . . . . . . . 132 System summary You can monitor the percentage of CPU utilization and memory currently used by the device, and other hardware, software, module-related information in the Summary page. To view the system summary information, perform the following steps within the Monitor tab. 1. Click System on the menu bar. 2. From the sidebar, select Summary. The Summary page is displayed, as shown in Figure 102. FIGURE 102 Summary page ServerIron ADX Graphical User Interface Guide 53-1002412-01 127 10 System summary The Summary page contains four panes. The Overview pane is displayed, as shown in Figure 103. FIGURE 103 Viewing the overview pane Table 9 describes the fields available in the Overview pane. TABLE 9 Overview pane Field Description System Overall Health Displays the overall health of the device calculated based on various factors including temperature, fan status, memory, and CPU utilization on all Barrel Processors (BP) and Management Processor (MP). The overall health status can be one of the following: • Critical - Indicates the health status of the device is critical, if the temperature on the processors, fan speed, CPU and memory usage exceeds 90%. • Warning - Indicates the health status of the device is warning, if the temperature on the processors, fan speed, CPU and memory usage are in the warning limit. • Clear - Indicates the health status of the device is clear. CPU Utilization MP Displays the average CPU utilized by the MP in percentage. BP Displays the average CPU utilized by the BPs in percentage. Also, displays the BP with the highest CPU. Memory Utilization MP Displays the average memory utilized by the MP in percentage. BP Displays the average memory utilized by the BPs in percentage. Also, displays the BP with the highest memory. Throughput 128 Pkts In (Bps) Displays the total number of packets received by the device, in bits per second. Pkts Out (Bps) Displays the total number of packets transmitted by the device, in bits per second. ServerIron ADX Graphical User Interface Guide 53-1002412-01 System summary TABLE 9 10 Overview pane (Continued) Field Description Time Clock Displays the current system time. Up Since Displays the time when the system was last booted. HA (Hot Standby) Details HA Status Displays the High Availability status. Peer Status Displays the status of the peer. The Hardware Information pane is displayed, as shown in Figure 104. FIGURE 104 Viewing hardware information Table 10 describes the fields available in the Hardware Information pane. TABLE 10 Hardware Information pane Field Power Supply Description Displays the status of the power supply, which can be one of the following: Not Connected - Indicates the non-availability of the power supply for the unit. OK - Indicates the presence of power supply for the unit. • • Fan ID ServerIron ADX Graphical User Interface Guide 53-1002412-01 Displays the fan identifier. 129 10 System summary TABLE 10 Hardware Information pane (Continued) Field Description Status Displays the status of the fan. The fan status can be one of the following: • OK • Stopped • Stopped PWM100 • PWM Outbound • Failed • Bad Power • Not Present • I2C Access Speed RPM Displays the speed of the fan. The fan operate at the following speeds: Low - Indicates the speed is low (50% of the maximum RPM). Medium - Indicates the speed is medium (75% of the maximum RPM). Medium High - Indicates the speed is medium high (90% of the maximum RPM). High - Indicates the speed is high (100% of the maximum RPM). • • • • Displays the rotations made by the fan, in revolution per minute. Disk Space Disk Space Displays the total disk space on the device. Used Displays the used disk space. Available Displays the available disk space. The Software Information pane is displayed, as shown in Figure 105. FIGURE 105 Viewing software information Table 11 describes the fields available in the Software Information pane. TABLE 11 130 Software Information pane Field Description Image Displays the image types installed on the device. The image types are as follows: • Running - Indicates the current image running on the device. • Primary - Indicates the image that is set as primary. • Secondary - Indicates the image that is set as secondary. • Boot - Displays the boot version of the device. Version Displays the release version of the software running on the device. Image Name Displays the name of the image. ServerIron ADX Graphical User Interface Guide 53-1002412-01 System summary TABLE 11 10 Software Information pane (Continued) Field Description Build Type Displays the type of the build loaded in the device. The build type are as follows: Router - Indicates the type of the build is router. Switch - Indicates the type of the build is switch. • • Build Date Displays the date on which the image is built. The Module Information pane is displayed, as shown in Figure 106. FIGURE 106 Viewing module information Table 12 describes the fields available in the Module Information pane. TABLE 12 Module Information pane Field Description Temperature Module Displays the module name. The module can be one of the following: MP - Indicates the module is a MP. BP - Indicates the module is a BP. • • Current Temperature Displays the current temperature on the respective modules, in degree Celsius. Warning Limit Displays the temperature threshold that has been set as the warning limit. Shutdown Limit Displays the temperature threshold that has been set as the shutdown limit. Modules Slot Displays the slot number. Module Name Displays the name of the module. Status Displays the status of the module. The module status can be one of the following: • ACTIVE • RUNNING # of Ports Displays the total number of ports in the module. Serial Number Displays the serial number for the module. For more information on system summary, refer to the ServerIron ADX Administration Guide. ServerIron ADX Graphical User Interface Guide 53-1002412-01 131 10 System log entries System log entries The device contains a syslog agent that writes log messages to a local buffer and optionally to a third-party syslog server. The local buffer is cleared during a system reload or reboot. To ensure the messages remain available even after a system reload, configure the device to store the messages in the syslog server. For more information on syslog server, refer to the ServerIron ADX Administration Guide. To display the entries in the system log, perform the following steps within the Monitor tab. 1. Click System on the menu bar. 2. From the sidebar, select System Logs. The System Logs page is displayed, as shown in Figure 107. FIGURE 107 Viewing the system log Table 13 describes the fields available in the System Log page. TABLE 13 System log Field Description Timestamp Displays the date and time when the entry was logged. Severity Displays the severity of the event occurring on the device. The severity can be one of the following: • Alert • Critical • Debugging • Emergency • Error • Informational • Notification • Warning Messages Displays the log message. The list displays up to 30 syslog entries. You can navigate to view the next or previous set of syslog entries by clicking Next or Previous at the bottom of the Summary page. To save a local copy of all the system logs on the server, click Download Logs. 132 ServerIron ADX Graphical User Interface Guide 53-1002412-01 System log entries 10 The logs can be filtered based on severity or message and also the logs can be downloaded in a text file. To save the filtered logs, click Download Logs. Click the Filter icon and select the criteria in the Filter Criteria lis to filter the logs. ServerIron ADX Graphical User Interface Guide 53-1002412-01 133 10 134 System log entries ServerIron ADX Graphical User Interface Guide 53-1002412-01 Chapter 11 Viewing Network Status In this chapter • Interface statistics. . . . . . . . . . . . . . . . . . . . . . . . . . . . . . . . . . . . . . . . . . . . . • IP statistics. . . . . . . . . . . . . . . . . . . . . . . . . . . . . . . . . . . . . . . . . . . . . . . . . . . • ARP cache statistics . . . . . . . . . . . . . . . . . . . . . . . . . . . . . . . . . . . . . . . . . . . • MAC statistics . . . . . . . . . . . . . . . . . . . . . . . . . . . . . . . . . . . . . . . . . . . . . . . . 135 139 146 148 Interface statistics To display statistics for all the interfaces configured on the device, perform the following steps within the Monitor tab. 1. Click Network on the menu bar. 2. From the sidebar, select Interface. The Interface page is displayed, as shown in Figure 108. FIGURE 108 Interface statistics The Interface page displays all the interfaces configured on the device in tabular format. Table 14 describes the fields available in the Interface page. ServerIron ADX Graphical User Interface Guide 53-1002412-01 135 11 Interface statistics TABLE 14 Interface fields Field Description Port Displays the name of the port. Status Displays the status of the interface. The interface status can be one of the following: • Up • Down Trunk Displays the trunk group, if the interface is a member of any trunk group. Rx Packets Displays the total number of packets received by the interface. Tx Packets Displays the total number of packets transmitted by the interface. Rx Bytes Displays the total number of bytes received by the interface. Tx Bytes Displays the total number of bytes transmitted by the interface. Collision Displays the number of collisions on the interface. Errors Displays the number of errors on the interface. Viewing interface details To view the detailed statistics of an interface configured on the device, perform the following steps within the Monitor tab. 1. Click Network on the menu bar. 2. From the sidebar, select Interface. 3. Select an interface from the Interfaces table and click Details to view the detailed statistics of that interface. Also, you can double click an interface for which you want to view the detailed statistics. 136 ServerIron ADX Graphical User Interface Guide 53-1002412-01 Interface statistics 11 A new Interface Details page tab with detailed statistics is displayed, as shown in Figure 109. Alternatively, to view the interface details in the graphical format, click Graph. To switch the view between tabular and graphical format, click the Details or Graph on top right corner of the Interface Details page. FIGURE 109 Displaying the interface details Table 15 describes the fields available in the Interface Details page. TABLE 15 Interface Details fields Field Description Attributes Port Displays the port of the selected interface. Name Displays the configured name of the selected interface. Status Displays the status of the selected interface. The interface status can be one of the following: • Up • Down Protocol Status Displays the status of the link protocol for the selected interface. The protocol status can be one of the following: • Up • Down MAC Address Displays the MAC address of the selected interface. ServerIron ADX Graphical User Interface Guide 53-1002412-01 137 11 Interface statistics TABLE 15 Interface Details fields (Continued) Field Description Interface Type Displays the type of the selected interface. STP State Displays the Spanning Tree Protocol (STP) state for the selected interface. IPv6 Displays the status of IPv6 for the selected interface. The IPv6 status can be one of the following: • Enabled • Disabled Speed Displays the current speed on the selected interface. Duplex Type Displays the current type of duplex on the selected interface. Active Trunk Displays the state of active trunk on the selected interface. The active trunk status can be one of the following: • Enabled • Disabled Tag Mode Displays whether the selected interface is tagged or untagged. MTU Displays the Maximum Transmission Unit (MTU) for the selected interface. Statistics Bit Rate Displays the number of bits received and transmitted per load interval on the selected interface. Packet Rate Displays the number of packets received and transmitted per load interval on the selected interface. Utilization% Displays the percentage utilization of the selected interface for receiving and transmitting information. Bytes Displays the number of bytes received and transmitted on the selected interface. Packets Displays the number of packets received and transmitted on the selected interface. Unicast Packets Displays the number of unicast packets received and transmitted on the selected interface. Broadcast Packets Displays the number of broadcast packets received and transmitted on the selected interface. Multicast Packets Displays the number of multicast packets received and transmitted on the selected interface. Errors 138 Errors Received Displays the total number of errors received on the selected interface. Errors Transmitted Displays the total number of errors transmitted by the selected interface. Collisions Received Displays the total number of collisions received on the selected interface. Collisions Transmitted Displays the total number of collisions transmitted by the selected interface. Runt Packets Received Displays the total number of runt packets received on the selected interface. Giant Packets Received Displays the total number of giant packets received on the selected interface. Received Packets Ignored Displays the number of received packets ignored on the selected interface. CRC Errors Received Displays the total number of Cycle Redundancy Check (CRC) errors received on the selected interface. ServerIron ADX Graphical User Interface Guide 53-1002412-01 IP statistics TABLE 15 11 Interface Details fields (Continued) Field Description Frame Errors Received Displays the total number of frame errors received on the selected interface. IP Address(es) Displays the IP address of the interface. For more information on interface details, refer to the ServerIron ADX Switch and Router Guide. IP statistics To view the IP statistics, perform the following steps within the Monitor tab. 1. Click Network on the menu bar. 2. From the sidebar, select IP. The IP page is displayed, as shown in Figure 110. To view the IP statistics in the graphical format, click Graph. To switch the view between tabular and graphical format, click the Details or Graph on top right corner of the IP page. FIGURE 110 Displaying the IP traffic The total and the individual counts of IPv4 and IPv6 packets for the statistic types are displayed. Table 16 describes the fields available in the statistics of IP page. TABLE 16 IP fields Field Description Statistics Type Received ServerIron ADX Graphical User Interface Guide 53-1002412-01 Displays the total number of IP packets received by the device. 139 11 IP statistics TABLE 16 140 IP fields (Continued) Field Description Sent Displays the total number of IP packets originated and sent by the device. Forwarded Displays the total number of IP packets received by the device and forwarded to other devices. Reassembled Displays the total number of fragmented IP packets that the device reassembled. Delivered Displays the total number of IP packets delivered to upper level by the device. Fragmented Displays the total number of IP packets fragmented by the device to accommodate the MTU of this device or another device. Fragments Received Displays the total number of fragments received by the device. Output Fragments Displays the total number of output fragments created by the device. Rawout Displays the total number of raw IP packets generated by the device. Bad Header Displays the total number of IP packets dropped by the device due to bad packet header. Bad Version Displays the total number of IP packets dropped by the device due to wrong IP version. Bad Scope Displays the total number of IP packets dropped by the device due to scope error. Bad Options Displays the total number of IP packets dropped by the device due to error in processing of options. Fragments Dropped Displays the total number of fragments dropped by the device. Fragments Timed Out Displays the total number of fragments timed out. Overflow Fragments Displays the total number of fragments that exceeded the limit. Can Not Fragment Displays the total number of IP packets the device could not fragment. Too Short Displays the total number of too short IP packets dropped by the device. Too Small Displays the total number of dropped packets that did not have enough data. Too Many Header Displays the total number of packets discarded by the device due to too many headers. No Route Displays the total number of packets dropped by the device because of no route to destination. Not Member Displays the total number of packets dropped by the device because the packet was not part of the multicast group. Unknown Protocols Displays the total number of packets dropped by the device because of unrecognized protocol. Other Errors Displays the total number of packets dropped by the device due to other error types. ServerIron ADX Graphical User Interface Guide 53-1002412-01 IP statistics 11 For more information on IP statistics, refer to the ServerIron ADX Switch and Router Guide. ICMP Statistics To view the Internet Control Message Protocol (ICMP) sent and received information, perform the following steps within the Monitor tab. 1. Click Network on the menu bar. 2. From the sidebar, select IP, and then select ICMP. The ICMP page is displayed, as shown in Figure 111. By default, Received Messages tab is displayed in the ICMP page, which provides information on the messages received by the device. Click the Sent Messages or Sent Error Messages tab to view the messages or error messages sent by the device. To view the ICMP statistics in the graphical format, click Graph. To switch the view between tabular and graphical format, click the Details or Graph on top right corner of the ICMP page. The total and the individual counts of IPv4 and IPv6 messages for the statistics types are displayed. FIGURE 111 Displaying the ICMP traffic ServerIron ADX Graphical User Interface Guide 53-1002412-01 141 11 IP statistics Table 17 describes the fields available in the ICMP Received/Sent Messages. TABLE 17 ICMP Received/Sent Messages fields Field Description Received/Sent Displays the total number of ICMP messages received/sent by the device. NOTE: The Received field is displayed in the ICMP Received Message tab, while the Sent field is displayed in the ICMP Sent Message tab. 142 Echo Reply Displays the total number of ICMP echo reply messages received/sent by the device. Destination Unreachable Displays the total number of ICMP destination unreachable messages received/sent by the device. Source Quench Displays the total number of ICMP source quench messages received/sent by the device. Redirect Displays the total number of ICMP redirect messages received/sent by the device. Echo Request Displays the total number of IC MP echo request messages received/sent by the device. IRDP Advertisement Displays the total number of ICMP Internet Router Discovery Protocol (IRDP) advertisement messages received/sent by the device. IRDP Solicitation Displays the total number of ICMP IRDP solicitation messages received/sent by the device. Time Exceeded Displays the total number of ICMP time exceeded messages received/sent by the device. Parameter Problem Displays the total number of ICMP parameter problem messages received/sent by the device. Timestamp Displays the total number of ICMP timestamp messages received/sent by the device. Timestamp Reply Displays the total number of ICMP timestamp reply messages received/sent by the device. Address Mask Request Displays the total number of ICMP address mask request messages received/sent by the device. Address Mask Reply Displays the total number of ICMP address mask reply messages received/sent by the device. Neighbor solicitation Displays the total number of ICMPv6 neighbor solicitation messages received/sent by the device. Neighbor advertisement Displays the total number of ICMPv6 neighbor advertisement messages received/sent by the device. Reflect Displays the total number of ICMPv6 reflect messages received/sent by the device. IGMP Membership Query Displays the total number of Internet Group Management Protocol (IGMP) membership query messages received/sent by the device. IGMP Membership Report Displays the total number of IGMP membership report messages received/sent by the device. ServerIron ADX Graphical User Interface Guide 53-1002412-01 IP statistics TABLE 17 11 ICMP Received/Sent Messages fields (Continued) Field Description IGMP Membership Red Displays the total number of IGMP membership red messages received/sent by the device. Packet Too Big Error Displays the total number of ICMPv6 packet too big error messages received/sent by the device. Packet Too Short Error Displays the total number of ICMPv6 packet too short error messages received/sent by the device. Bad Code Error Displays the total number of ICMPv6 bad code error messages received/sent by the device. Bad Checksum Error Displays the total number of ICMPv6 bad checksum error messages received/sent by the device. Bad Length Error Displays the total number of ICMPv6 bad length error messages received/sent by the device. Bad Hop Count Error Displays the total number of ICMPv6 bad hop count error messages received/sent by the device. ND Too Many Options Error Displays the total number of ICMPv6 neighbor discover too many options error messages received/sent by the device. The ICMP Sent Error Messages tab is displayed, as shown in Figure 112. FIGURE 112 Displaying the ICMP sent error messages Table 18 describes the fields available in the ICMP Sent Error Messages tab. TABLE 18 ICMP Sent Error Message fields Field Description Destination Unreachable Displays the total number of ICMPv6 destination unreachable error messages sent by the device. Beyond Scope Displays the total number of ICMPv6 messages sent by the device which are beyond the scope of source address. ServerIron ADX Graphical User Interface Guide 53-1002412-01 143 11 IP statistics TABLE 18 ICMP Sent Error Message fields (Continued) Field Description Address Unreachable Displays the total number of ICMPv6 messages sent by the device with address unreachable. Port Unreachable Displays the total number of ICMPv6 messages sent by the device with port unreachable. Packet Too Big Displays the total number of ICMPv6 packets too big error messages sent by the device. Time Exceeded Displays the total number of ICMPv6 messages sent by the device which exceeded time in transit. Time Exceed Reassembly Displays the total number of ICMPv6 messages sent by the device for which reassembly time exceeded. Header Field Parameter Problem Displays the total number of ICMPv6 messages sent by the device with erroneous header field. Next Header Parameter Problem Displays the total number of ICMPv6 messages sent by the device with unrecognized next header type. Options Error Displays the total number of ICMPv6 messages sent by the device with options error. Redirect Error Displays the total number of ICMPv6 messages sent by the device with redirect errors. Admin Error Displays the total number of ICMPv6 messages sent by the device with admin errors. Unknown Displays the total number of ICMPv6 messages sent by the device with unknown errors. For more information on IP statistics, refer to the ServerIron ADX Switch and Router Guide. TCP statistics To view the TCP statistics on the device, perform the following steps within the Monitor tab. 1. Click Network on the menu bar. 2. From the sidebar, select IP, and then select TCP. 144 ServerIron ADX Graphical User Interface Guide 53-1002412-01 IP statistics 11 The TCP page is displayed, as shown in Figure 113. The total and the individual counts of IPv4 and IPv6 packets for the statistic types are displayed. To view the TCP statistics in the graphical format, click Graph. To switch the view between tabular and graphical format, click the Details or Graph on top right corner of the TCP page. FIGURE 113 Displaying the TCP traffic Table 19 describes the fields available in the TCP page. TABLE 19 TCP fields Field Description Active Open Connections Displays the number of TCP connections opened by the device by sending a TCP SYN. Passive Open Connections Displays the number of TCP connections opened by the device in response to connection requests received from other devices. Active Reset Connections Displays the number of TCP connections reset occurred on the device at the other end of the connection as a result of sending a TCP reset message to the device. Passive Reset Connections Displays the number of TCP connections reset occurred when the device at the other end of the connection sent a TCP reset message. Received Segments Displays the number of TCP segments received by the device. Sent Segments Displays the number of TCP segments sent by the device. Retransmitted Segments Displays the number of segments that the device retransmitted before the device at the other end of the connection had acknowledged receipt of the segment. For more information on TCP statistics, refer to the ServerIron ADX Switch and Router Guide. UDP statistics To view the UDP statistics on the device, perform the following steps within the Monitor tab. 1. Click Network on the menu bar. 2. From the sidebar, select IP, and then select UDP. ServerIron ADX Graphical User Interface Guide 53-1002412-01 145 11 ARP cache statistics The UDP page is displayed, as shown in Figure 114. The total and the individual counts of IPv4 and IPv6 packets for the statistic types are displayed. To view the UDP statistics in the graphical format, click Graph. To switch the view between tabular and graphical format, click the Details or Graph on top right corner of the UDP page. FIGURE 114 Displaying the UDP traffic Table 20 describes the fields available in the UDP page. TABLE 20 UDP fields Field Description Received Displays the number of UDP packets received. Sent Displays the number of UDP packets sent. Invalid Port Displays the number of UDP packets dropped because of invalid UDP port number. For more information on UDP statistics, refer to the ServerIron ADX Switch and Router Guide. ARP cache statistics To view the Address Resolution Protocol (ARP) cache statistics on the device, perform the following steps within the Monitor tab. 1. Click Network on the menu bar. 2. From the sidebar, select ARP. 146 ServerIron ADX Graphical User Interface Guide 53-1002412-01 ARP cache statistics 11 The ARP page is displayed, as shown in Figure 115. FIGURE 115 Displaying the ARP The ARP page displays both the statistics and cache information. The ARP Cache table shows IP to MAC address association. NOTE The ARP page also displays the management port statistics. Table 21 describes the fields available in the ARP page. TABLE 21 ARP fields Field Description Statistics Requests Received Displays the total number of incoming requests. Replies Sent Displays the total number of replies sent. Packets Received Displays the total number of packets received. Requests Sent Displays the total number of requests sent. Invalid Destination Packets Displays the total number of packets with invalid target protocol address. Invalid Source Packets Displays the total number of packets with invalid sender protocol address. Pending Packets Dropped Displays the total number of pending packets discarded. ARP Cache IP Address Displays the IP address of the device. MAC Address Displays the MAC address of the device. Port/Trunk Displays the port on which the entry was learned. ServerIron ADX Graphical User Interface Guide 53-1002412-01 147 11 MAC statistics TABLE 21 ARP fields (Continued) Field Description Type Displays the type of the ARP entry. The type can be one of the following: • Dynamic - Indicates the device is learned from an incoming packet. • Static - Indicates the device loaded the entry from the static ARP table when the device was connected to other device. Age (sec) Displays the number of seconds the entry has remained unused. If this value reaches the ARP aging period, the entry is removed from the cache The ARP Cache page displays a list of all cache information in table. Each cache includes IP and MAC address, port, type and age of the cache. Click Next or Previous to navigate the list or select First or Last to jump to the most recent or least recent entries respectively. You can filter the information displayed in the ARP cache table using the Filter icon in the top right corner of the main page. Click the icon to view the filtering panel and search the information based on the Filter Criteria. For more information on ARP statistics, refer to the ServerIron ADX Switch and Router Guide. MAC statistics To view all the MAC addresses learned or configured on the device, perform the following steps within the Monitor tab. 1. Click Network on the menu bar. 2. From the sidebar, select MAC. The MAC page is displayed as shown in Figure 116. FIGURE 116 Displaying the MAC statistics The MAC page displays the Layer 2 MAC table information. The table shows the association between a MAC address and a system port. Table 22 describes the fields available in the MAC page. 148 ServerIron ADX Graphical User Interface Guide 53-1002412-01 MAC statistics TABLE 22 11 MAC fields Field Description MAC Address Displays the MAC address of the port. Port Displays the port on which the MAC address is learned or created on. Type Displays the property of the MAC address. The MAC address property can be one of the following: • Dynamic • Static • Lock Address • Secure Mac Age (sec) Displays the number of seconds the entry has remained unused. This is valid only for dynamic MAC addresses. VLAN Displays the port-based Virtual Local Area Network (VLAN) that contains the instance of spanning tree. Click Next or Previous to navigate the list or select First or Last to jump to the most recent or least recent entries respectively. You can filter the information displayed in the MAC table using the Filter icon in the top right corner of the main page. Click the Filter icon and select the criteria from the Filter Criteria list to filter the information. For more information on MAC statistics, refer to the ServerIron ADX Switch and Router Guide. ServerIron ADX Graphical User Interface Guide 53-1002412-01 149 11 150 MAC statistics ServerIron ADX Graphical User Interface Guide 53-1002412-01 Chapter 12 Viewing Traffic Statistics In this chapter • Global traffic . . . . . . . . . . . . . . . . . . . . . . . . . . . . . . . . . . . . . . . . . . . . . . . . . • Virtual servers . . . . . . . . . . . . . . . . . . . . . . . . . . . . . . . . . . . . . . . . . . . . . . . . • Real servers . . . . . . . . . . . . . . . . . . . . . . . . . . . . . . . . . . . . . . . . . . . . . . . . . . • Content switching . . . . . . . . . . . . . . . . . . . . . . . . . . . . . . . . . . . . . . . . . . . . . • OpenScript . . . . . . . . . . . . . . . . . . . . . . . . . . . . . . . . . . . . . . . . . . . . . . . . . . . • Session Information . . . . . . . . . . . . . . . . . . . . . . . . . . . . . . . . . . . . . . . . . . . 151 153 159 165 170 172 Global traffic To display the global traffic statistics on the device, perform the following steps within the Monitor tab. 1. Click Traffic on the menu bar. 2. From the sidebar, select Global Traffic. The Global Traffic page is displayed, as shown in Figure 117. FIGURE 117 Displaying the global traffic ServerIron ADX Graphical User Interface Guide 53-1002412-01 151 12 Global traffic Table 23 describes the fields available in the Global Traffic page. TABLE 23 Global Traffic fields Field Description Session Traffic New Session Syncs Sent Displays the new synchronized packets sent for new sessions. New Session Syncs Received Displays the new synchronized packets received for new sessions. Sessions Removed Displays the number of sessions removed from the delete queue. Sessions in Delete Queue Displays the number of sessions in the delete queue. FWD Sessions Not Found Displays the number of forward sessions that are not found. Sessions Force Deleted Displays the number of sessions that were forcedly deleted. Duplicate Sessions Displays the number of duplicate sessions. Server Traffic Client to Server (Pkts) Displays the number of packets sent from clients to servers. Server to Client (Pkts) Displays the number of packets sent from servers to clients. Aged Sessions Displays the number of TCP and UDP sessions that are closed by the device due to aged out. Old Connections Displays the number of old connections. FWD To Non-Static FID Displays the number of forward to non-static FID. Dropped VIP Pings Displays the number of dropped virtual server (VIP) ping packets. Unsuccessful Connections Displays the number of unsuccessful connections. Server Resets Displays the number of server resets. Dropped Packets Total Drops Displays the number of packets dropped by the device. Disabled Drops Displays the number of packets the device dropped because they were sent by a client to a VIP port that is bound to a real server port that is currently disabled. Forward Drops Displays the number of client-to-server packets dropped by the device. Reverse Drops Displays the number of server-to-client packets dropped by the device. Stale Drops Displays the number of TCP SYN packets dropped by the device because they matched a stale session entry. Exceeded Drops Displays the number of packets dropped by the device because the TCP SYN limit on the real server had been reached. Fast Packets 152 VPort Not Found Displays the number of unsuccessful virtual-port searches using an improved (faster) method. VPort Found Displays the number of successful virtual port searches using an improved (faster) method. Forward FIN Displays the number of client-to-sever FIN packets passing through a non-optimized path. ServerIron ADX Graphical User Interface Guide 53-1002412-01 Virtual servers TABLE 23 12 Global Traffic fields (Continued) Field Description Reverse FIN Displays the number of client-to-server FIN packets sent using an improved (faster) method. SLB SYN Displays the number of SLB SYN packets sent using an improved (faster) method. TCP Traffic SYNs Received Displays the number of SYN packets received. SYNs Dropped Displays the number of SYN packets dropped. SYN ACKs Received Displays the number of SYN ACK packets received. SYN ACKs Dropped Displays the number of SYN ACK packets dropped. Packets Received Displays the number of packets received by the server. Packets Dropped Displays the number of packets dropped by the server. TTL FINs Received Displays the total number of forward packets received in both the forward and reverse directions. TTL RSTs Received Displays the total number of resets received in both the forward and reverse directions. SYN Defs/Proxy RSTs Displays the total number of SYN def or proxy reset packets. Duplicate SYNs Displays the number of SYN packets that are received by the server for a session that is already listed in the session table. Duplicate Stale SYNs Displays the number of stale SYN packets that are received by the server for a session that is already listed in the session table. Duplicate SYNs after FIN Displays the number of stale SYN after FIN packets that are received by the server for a session that is already listed in the session table. Rates (per sec) Current Connection Rate Displays the rate of TCP traffic per second, including TCP SYN DoS attack traffic. Current TCP Attack Rate Displays the rate of TCP DoS attacks per second. Peak Connection Rate Displays the peak rate of TCP traffic per second, encountered on the device. Peak TCP Attack Rate Displays the peak rate of TCP DoS attacks per second, encountered on the device. Virtual servers You can view the summary and detailed statistics of all the configured virtual servers and ports. Virtual servers To view the virtual server statistics on the device, perform the following steps within the Monitor tan. ServerIron ADX Graphical User Interface Guide 53-1002412-01 153 12 Virtual servers 1. Click Traffic on the menu bar. 2. From the sidebar, select Virtual Server. The Virtual Servers page is displayed, as shown in Figure 118. FIGURE 118 Displaying the virtual servers Table 24 describes the fields available in the Virtual Servers page. TABLE 24 Virtual Server fields Field Description Name Displays the name of the virtual servers. IP Address Displays the IP address of the virtual servers. Status Displays the runtime health of the virtual servers. The health status can be one of the following: • Healthy • Not Healthy Admin State Displays the admin state of the virtual server. The admin status can be one of the following: • Enabled • Disabled Current Connections Displays the number of client connections currently on the virtual servers. Rx Packets Displays the number of bytes received by the virtual servers. Tx Packets Displays the number of bytes transmitted by the virtual servers. Virtual server details To view the details of a virtual server configured on the device, perform the following steps within the Monitor tab. 1. Click Traffic on the menu bar. 2. From the sidebar, select Virtual Servers. 154 ServerIron ADX Graphical User Interface Guide 53-1002412-01 Virtual servers 12 3. Select a configuration from the Virtual Servers page and click Details to view the detailed statistics of that virtual server. Also, you can double click a configuration for which you want to view the detailed statistics. A new Virtual Server Details page tab is displayed, as shown in Figure 119. To view the interface details in the graphical format, click Graph. To switch the view between tabular and graphical format, click the Details or Graph on top right corner of the Virtual Server Details page. FIGURE 119 Displaying the virtual server details Table 25 describes the fields available in the Virtual Server Details page. TABLE 25 Virtual Server Details fields Field Description Name Displays the name of the virtual server. IP Address Displays the IP address of the virtual server. Status Displays the runtime health of the virtual server. The status can be one of the following: • Enabled • Disabled • Not Healthy • Healthy • Not Bound Admin State Displays the admin state of the virtual server. The status can be one of the following: • Enabled • Disabled Predictor Displays the load balancing metric that is used to select a given real server among variable options. The predictor can be one of the following: • Round Robin • Weighted Round Robin • Weighted • Enhanced Weighted • Least Local Connections • Least Local Sessions ACL ID Displays the ID of the Access Control List (ACL) policy bound to the virtual server. ServerIron ADX Graphical User Interface Guide 53-1002412-01 155 12 Virtual servers TABLE 25 Virtual Server Details fields (Continued) Field Description Symmetric State Displays the state of the virtual server. The status can be one of the following: • Active - Indicates the virtual server is in active mode. • Standby - Indicates the virtual server is in standby mode. Symmetric Priority Displays the sym-priority that is associated with the virtual server. # of Missed Keepalives Displays the number of missed Layer 4 or MAC PDUs. # of Active Transitions Displays the number of times the device has changed the state from standby mode to active mode. # of Backup Transitions Displays the number of times the device has changed the state from active mode to standby mode. Total Connections Displays the total number of connections on the virtual server. Transmitted Packets Displays the total number of packets transmitted by the virtual server. Received Packets Displays the total number of packets received by the virtual server. VIP RHI Admin State Displays the admin status of the virtual server Route Health Injection (RHI). The admin status can be one of the following: • Enabled • Disabled VIP RHI State Displays the health of the virtual server. The health status can be one of the following: • Healthy - Indicates the virtual server is healthy. • Not healthy - Indicates the virtual server is not healthy. NOTE: If a virtual server port is not bound to any real server port, then its health is not used to determine the health of the virtual server. Virtual server ports To view the virtual server port statistics on the device, perform the following steps within the Monitor tab. 1. Click Traffic on the menu bar. 2. From the sidebar, select Virtual Servers. 3. Click Ports at the bottom of the Virtual Servers page. 156 ServerIron ADX Graphical User Interface Guide 53-1002412-01 Virtual servers 12 A new All Virtual Server Ports page is displayed, as shown in Figure 120 FIGURE 120 Displaying the virtual server ports Table 26 describes the fields available in the Virtual Server Ports page. TABLE 26 Virtual Server Port fields Field Description Name Displays the name of the virtual server port. Status Displays the health of the virtual server ports. The health status can be one of the following: • Up • Down Admin State Displays the admin state of the virtual server ports. The port status can be one of the following: • Enabled • Disabled Current Connections Displays the number of current open connections on the virtual server ports. Virtual server port details To view the details of a virtual server port configured on the device, perform the following steps within the Monitor tab. 1. Click Traffic on the menu bar. 2. From the sidebar, select Virtual Servers. 3. Select a configuration from the Virtual Servers page and click Port. 4. Select a port configuration from the All Virtual Servers Ports page and click Details. ServerIron ADX Graphical User Interface Guide 53-1002412-01 157 12 Virtual servers A new Virtual Server Port Details page tab is displayed, as shown in Figure 119. To view the port details in the graphical format, click Graph. To switch the view between tabular and graphical format, click the Details or Graph on top right corner of the Virtual Server Port Details page. FIGURE 121 Displaying the virtual server port details The Virtual Server Port Details page displays a table that lists the real servers that are bound to the virtual server port. Table 25 describes the fields available in the Virtual Server Port Details page. TABLE 27 158 Virtual Server Port Details fields Field Description Virtual Server Name Displays the name of the virtual server bound to this port. Virtual Server Port Displays the name of the virtual server port. Virtual Server IP Address Displays the IP address of the virtual server bound to this port. Sticky Displays the state of the sticky in the virtual server port. The status can be one of the following: • No • Yes Status Displays the runtime health of the virtual server port. The status can be one of the following: • Enabled • Disabled Admin State Displays the admin state of the virtual server port. The status can be one of the following: • Enabled • Disabled Concurrent Displays the state of the concurrent sessions that are additionally opened. The states can be one of the following: • No • Yes ServerIron ADX Graphical User Interface Guide 53-1002412-01 Real servers TABLE 27 12 Virtual Server Port Details fields (Continued) Field Description DSR Displays the state of the Direct Server Return (DSR) in the virtual server port. The states can be one of the following: • No • Yes Current Connections Displays the current connections open on the virtual server port. Peak Connections Displays the highest number of connections reached by the port over a period of time. Total Connections Displays the total number of connections on this port. Real Servers bound to this Virtual Server Port Name Displays the name of the real server to which the port is bound. Port Displays the name of the real server port. Status Displays the status of the port on the real server. The status can be one of the following: • Enabled • Disabled Admin State Displays the admin state of the real server port. The status can be one of the following: • Enabled • Disabled Current Connections Displays the number of client connections currently on the server. Current Connection Rate Displays the number of client connections rate currently on the virtual server port. Rx Packets Displays the number of packets the device has received from the server. Tx Packets Displays the number of packets the device has sent to the server. For more information on virtual server statistics, refer to the ServerIron ADX Server Load Balancing Guide. Real servers You can view the summary and detailed statistics of all the configured real servers and ports. Real server To display the real server statistics on the device, perform the following steps within the Monitor tab. 1. Click Traffic on the menu bar. 2. From the sidebar, select Real Servers. ServerIron ADX Graphical User Interface Guide 53-1002412-01 159 12 Real servers The Real Servers page is displayed, as shown in Figure 122. FIGURE 122 Displaying the real server The real server page displays the summary of the statistics for the real server. Table 28 describes the fields available in the Real Servers page. TABLE 28 Real Server fields Field Description Name Displays the name of the real servers. IP Address Displays the IP address of the real servers. Status Displays the runtime health of the real servers, based on the Layer 3 health checks. The status can be one of the following: • Enabled • Disabled Admin State Displays the admin state of the real servers. Current Connections Displays the number of current open connections on the real servers. Current Connection Rate Displays the current connection rate on the real servers. Rx Packets Displays the number of packets received by the real servers. Tx Packets Displays the number of packets transmitted by the real servers. Real server details To view the detailed statistics of a real server configured on the device, perform the following steps within the Monitor tab. 1. Click Traffic on the menu bar. 2. From the sidebar, select Real Servers. 3. Click Details at the bottom of the Real Servers page. 160 ServerIron ADX Graphical User Interface Guide 53-1002412-01 Real servers 12 The Real Server Details page is displayed, as shown in Figure 123. To view the real server details in the graphical format, click Graph. To switch the view between tabular and graphical format, click the Details or Graph on top right corner of the Real Server Details page. FIGURE 123 Displaying the real server details Table 29 describes the fields available in the Real Server Details page. TABLE 29 Real Server Detail fields Field Description Real Server Name Displays the name of the real server. IP Address Displays the IP address of the real server. MAC Displays the MAC address of the real server. Weight Displays the weight assigned to the real server relative to other real servers in terms of the number of connections on the server. Status Displays the runtime health of the real server. The status can be one of the following: • Enabled • Disabled Admin State Displays the admin status of the real server. The status can be one of the following: • Enabled - Indicates the real server is enabled on the device. • Disabled - Indicates the real server is disabled on the device. Total Connections Displays the total number of connections on the real server. Peak Connections Displays the highest number of connections reached by the server over a period of time. Received Packets Displays the total number of packets received by the real server. Transmit Packets Displays the total number of packets transmitted by the real server. Current Connections Displays the current open connections on the real server. Current Connection Rate Displays the current connection rate on the real server. Maximum Connections Displays the maximum number of connections allowed on the real server. Maximum Connection Rate Displays the maximum number of connection rate allowed on the real server. Source NAT Enabled Displays whether the source Network Address Translation (NAT) is enabled on the real server. The source NAT status can be one of the following: • No - Indicates source NAT is disabled on the real server. • Yes - Indicates source NAT is enabled on the real server. ServerIron ADX Graphical User Interface Guide 53-1002412-01 161 12 Real servers Real server ports To view the statistics of all the real server ports configured on the device, perform the following steps within the Monitor tab. 1. Click Traffic on the menu bar. 2. From the sidebar, select Real Servers. 3. Select a configuration from the Virtual Servers page and click Port. 4. Select a port configuration from the All Virtual Servers Ports page and click Details. The All Real Server Ports page is displayed, as shown in Figure 124. To view the port details in the graphical format, click Graph. To switch the view between tabular and graphical format, click the Details or Graph on top right corner of the Real Server Port Details page. FIGURE 124 Displaying the real server ports Table 30 describes the fields available in the Real Server Ports page. TABLE 30 Real Server Port fields Field Description Name Displays the name of the real server ports. Status Displays the health of the real server ports. The status can be one of the following: • Enabled • Disabled • Not Healthy • Healthy • Not Bound Admin State Displays the status of the real server ports. Current Connections Displays the number of current open connections on the real server ports. Response Time (ms) 162 ServerIron ADX Graphical User Interface Guide 53-1002412-01 Real servers TABLE 30 12 Real Server Port fields (Continued) Field Description Received Packets Displays the number of packets received by the real server ports. Transmitted Packets Displays the number of packets transmitted by the real server ports. Real server port details To view the detailed statistics of a real server port configured on the device, perform the following steps within the Monitor tab. 1. Click Traffic on the menu bar. 2. From the sidebar, select Real Servers. 3. Click Port and select a configuration from the All Real Servers Ports page. 4. Click Details to view the detailed statistics of that real server port. A new Real Server Port Details page is displayed, as shown in Figure 119. To view the port details in the graphical format, click Graph. To switch the view between tabular and graphical format, click the Details or Graph on top right corner of the Real Server Port Details page FIGURE 125 Displaying the real server port details The Real Server Port Details page displays a table that lists the real servers that are bound to the virtual server port. Table 25 describes the fields available in the Real Server Port Details page. TABLE 31 Real Server Port Details fields Field Description Real Server Port Displays the name of the real server port. Real Server Name Displays the name of the real server bound to this port. Real Server IP Address Displays the IP address of the real server. ServerIron ADX Graphical User Interface Guide 53-1002412-01 163 12 Real servers TABLE 31 Real Server Port Details fields (Continued) Field Description Reassign Count Displays the number of times the device has reassigned the connection to another server in the rotation because the server that is in use has not responded to two contiguous TCP SYNs from the client. Status Displays the runtime health of the virtual server port. The status can be one of the following: • Enabled • Disabled Admin State Displays the admin state of the virtual server port. The status can be one of the following: • Enabled • Disabled Received Packets Displays the total number of packets received on the port. Transmit Packets Displays the total number of packets transmitted by the port. Received Bytes Displays the total number of bytes received on the port. Transmit Bytes Displays the total number of bytes transmitted by the port. Peak Connections Displays the highest number of connections reached by the server over a period of time. Current Connections Displays the number of client connections currently on the real server port. Total Connections Displays the total number of client connections on the server since the device was last booted. Virtual Servers bound to this Real Server Port 164 Name Displays the name of the virtual servers. Port Displays the name of the virtual server ports. Address Display the IP address of the virtual server to which the port is bound. Status Displays the runtime health of the virtual server ports. The status can be one of the following: • Enabled • Disabled Admin State Displays the admin state of the virtual server port. The status can be one of the following: • Enabled • Disabled Current Connections Displays the number of client connections currently on the virtual server. Current Connection Rate Displays the rate of TCP traffic per second for the current connection. Rx Packets Displays the number of packets the device has received from the server. Tx Packets Displays the number of packets the device has sent to the server. ServerIron ADX Graphical User Interface Guide 53-1002412-01 Content switching 12 For more information on real server statistics, refer to the ServerIron ADX Server Load Balancing Guide. Content switching You can view the summary of all the Layer 7 content switching rules and policies configured on the device. Content switching policies To display the statistics of all the content switching policies configured on the device, perform the following steps within the Monitor tab. 1. Click Traffic on the menu bar. 2. From the sidebar, select Content Switching. The Content Switching page displays the summary of the content switching policy and the DNS DPI policy. 3. Click CSW Policy tab to view the statistics of the content switching policies and the rules associated with each policy. Select the policy from the table to view the rules associated with this policy. The CSW Policy tab is displayed, as shown in Figure 126. FIGURE 126 Displaying the policy statistics Table 32 describes the fields available in the CSW Policy tab. ServerIron ADX Graphical User Interface Guide 53-1002412-01 165 12 Content switching TABLE 32 CSW Policy fields Field Description Name Displays the name of the Layer 7 content switching policy. Type Displays the type of the rule assigned for the Layer 7 content switching policy. The types can be one of the following: • HTTP request - Indicates the content switching policy is of Hypertext Transfer Protocol (HTTP) request type for incoming traffic. • HTTP response - Indicates the content switching policy is of HTTP response type for outgoing traffic. Rx Packets Displays the total number of packets received on the port. Created Sessions Displays the total number of created sessions for this policy. Session Drops Displays the total number of dropped sessions for this policy. Mirror Packets Display the total number of mirror packets for this policy. Redirect Packets Displays the total number of redirect packets for this policy. Rules for <policy name> Policy Rule Name Displays the rule name associated with the CSW policy. Action Type Display the action performed by the device based on the incoming packet. Flag Displays the information about the actions of the rule. Hit Count Displays the number of times the rule is matched. 4. Click DNS DPI Policy tab to view the statistics of the DNS DPI policies and the rules associated with each policy. Select the policy from the table to view the rules associated with this policy. 166 ServerIron ADX Graphical User Interface Guide 53-1002412-01 Content switching 12 The DNS DPI Policy tab is displayed, as shown in Figure 127. FIGURE 127 DNS DPI Policy fields Table 33 describes the fields available in the DNS DPI policy tab. TABLE 33 DNS DPI Policy fields Field Description Name Displays the name of the DNS policy. Bind Count Displays the number of DNS policies bound to the virtual server port. Rules for <Policy name> Policy Rule Name Displays the rule name associated with the CSW policy. Action Display the action performed by the device based on the incoming packet. Hit Count Displays the number of times the rule is matched. Rate Limit Displays the number of transactions received from any one IP address. Basic content switching statistics To display the statistics of the basic content switching, perform the following steps within the Monitor tab. 1. Click Traffic on the menu bar. 2. From the sidebar, select Content Switching, and then Basic Statistics. ServerIron ADX Graphical User Interface Guide 53-1002412-01 167 12 Content switching The Basic Statistics page is displayed, as shown in Figure 128. FIGURE 128 Displaying the basic statistics Table 34 describes the fields available in the Basic Statistics page. TABLE 34 Basic Statistics fields Field Description Session Statistics Session Timeouts Displays the number of session timeouts. Sessions Deleted Displays the number of sessions freed by proxy. Packets Freed By Timeout Displays the number of stored packets freed due to session timeout. Packets Freed By Deletion Displays the number of stored packets deleted when session was freed. Packet Statistics Packets Stored Displays the number of packets stored by proxy. Packets Freed Displays the number of packets freed by proxy. Forward Stored Packets Displays the number of stored packets sent to server. Packet Errors Displays the number of error packets. Proxy Statistics 168 Proxies Allocated Displays the number of proxies allocated. Proxies Possible Displays the number of proxies possible. Proxies Finished Displays the number of proxies finished. Proxy Allocation Failures Displays the number of proxy allocation failures. ServerIron ADX Graphical User Interface Guide 53-1002412-01 Content switching TABLE 34 12 Basic Statistics fields (Continued) Field Description Packets Freed Displays the number of packets stored by proxy. Proxy Cleanup Count Displays the number of proxy cleanup count. Max Concurrent Proxies Displays the maximum number of concurrent proxies. Server Statistics Server RST To TCP SYN Displays the number of times the server sent the RST packets to TCP SYN packets. Sent RST To Client Displays the number of times the device sent RST packets to client. URL Not Found Displays the number of times the URL string was not found. URL Not Complete Displays the number of times the URL string was not complete. Cookie Not Found Displays the number of times the cookie header was not found. Cookie Not Complete Displays the number of times the cookie header was not complete. Content rewrite statistics To display the rewrite content switching statistics, perform the following steps within the Monitor tab. 1. Click Traffic on the menu bar. 2. From the sidebar, select Content Switching, and then select Rewrite Statistics. The Rewrite Statistics page is displayed, as shown in Figure 129. FIGURE 129 Displaying the rewrite statistics Table 35 describes the fields available in the Rewrite Statistics page. TABLE 35 Rewrite Statistics fields Field Description HTTP Content Rewrites Summary Total Memory Allocated ServerIron ADX Graphical User Interface Guide 53-1002412-01 Displays the total number of allocation times of memory slots used for content rewrites. 169 12 OpenScript TABLE 35 Rewrite Statistics fields (Continued) Field Description Total Memory Freed Displays the total number of freed times of memory slots used for content rewrites. Memory Allocation Failure Displays the number of failures that occurred while allocating memory for content rewrites. Memory Used Now Displays the number of memory slots that are currently used for content rewrites. Content Rewrites in HTTP Responses Cookies Inserted Displays the total number of cookies inserted in HTTP responses. Cookies Insertion Errors Displays the number of errors that occurred when inserting cookies in HTTP responses. Headers Inserted Displays the total number of headers inserted in HTTP responses. Headers Insertion Errors Displays the number of errors that occurred when inserting headers in HTTP responses. Content Rewrites in HTTP Requests Cookies Deleted Displays the total number of cookies deleted in HTTP requests. Cookies Deletion Errors Displays the number of error that occurred when deleting the cookies in HTTP requests. Cookies Destroyed Displays the number of cookies destroyed during HTTP requests. Cookies Destroyed Errors Displays the number of error that occurred while destroying the cookies in HTTP requests. Client IP Headers Inserted Displays the total number of client IP headers inserted in HTTP requests. Client IP Headers Insertion Errors Displays the number of errors that occurred when inserting client IP headers in HTTP requests. Headers Inserted Displays the total number of headers inserted in HTTP requests. Headers Insertion Errors Displays the number of errors that occurred when inserting headers in HTTP requests. OpenScript To view the OpenScript statistics, perform the following steps within the Monitor tab. 1. Click Traffic on the menu bar. 2. From the sidebar, select OpenScript. 170 ServerIron ADX Graphical User Interface Guide 53-1002412-01 OpenScript 12 The OpenScript page is displayed, as shown in Figure 130. FIGURE 130 Displaying OpenScript traffic Table 36 describes the fields available in the OpenScript page. TABLE 36 OpenScript fields Field Description Name Displays the name of the script. Virtual Server Displays the name of the virtual server. Port Displays the name of the port to which the script is bound. Script Status Displays the status of the script. Memory Threshold Exceeded Displays the number of BPs that have exceeded the memory threshold percentage set in the corresponding script profile. Detailed OpenScript statistics To view the detailed statistics of an OpenScript, perform the following steps within the Monitor tab. 1. Click Traffic on the menu bar. 2. From the sidebar, select OpenScript. 3. Select a script from the table in the OpenScript page and click Details. ServerIron ADX Graphical User Interface Guide 53-1002412-01 171 12 Session Information The Details page is displayed, as shown in Figure 131. FIGURE 131 Displaying OpenScript details Table 37 describes the fields available in the Details page. TABLE 37 OpenScript detail fields Field Description Basic Details Script Bytes Displays the total number of bytes for the script. Last Updated Displays the time at which the last update was performed. Current Connections Displays the current connections open on the server. Current Connection Rate Displays the current connection rate on the server. Total Connections Displays the total number of connections made by the server. Connections Failed Displays the total number of connections failed. Resource Utilization Type Displays the type of the processor. Memory Exceeded Displays whether the total memory is exceeded. Hits Per Event Event Displays the name of the event. Hit Count Displays the hit count for the event. Error Counters Type Displays the type of the errors. Error Count Displays the number of error counts. Session Information You can view the session summary and also filter the summary table based on your criteria. 172 ServerIron ADX Graphical User Interface Guide 53-1002412-01 Session Information 12 Session summary To display the session summary on the device, perform the following steps within the Monitor tab. 1. Click Traffic on the menu bar. 2. From the sidebar, select Sessions. The Sessions page is displayed, as shown in Figure 132. FIGURE 132 Displaying the sessions The Sessions page displays the summary of the server and client connections, session distribution on BP, and real servers session. Table 38 describes the fields available in the Sessions page. TABLE 38 Session fields Field Description Connections Total Client to Server Connections Displays the number of connections initiated by client. Total Server to Client Connections Displays the number of connections initiated by servers. Total Reassigns Displays the number of unacknowledged TCP SYN-ACKS on all the real servers combined. Unsuccessful Connections Displays the number of connection attempts by clients or servers that were unsuccessful. Session Distribution across BP Name Displays the name of the Barrel Processor (BP). Available Sessions Displays the number of sessions available for the BP. Total Sessions Displays the total number of sessions available for the BP. Filtering the session table To filter the sessions, perform the following steps within the Monitor tab. ServerIron ADX Graphical User Interface Guide 53-1002412-01 173 12 Session Information 1. Click Traffic on the menu bar. 2. From the sidebar, select Sessions, and then select Sessions Lookup. The Sessions Lookup page is displayed, as shown in Figure 133 FIGURE 133 Session Lookup The Session Lookup page displays the search criteria with specific fields. Enter your search criteria based on your requirement and click Search. Table 39 describes the fields available in the Sessions Lookup page. TABLE 39 Sessions Lookup fields Field Description Search Criteria Source IP Enter the source IP address. Source Port Select the source port from the list. Destination IP Enter the destination IP address. Destination Port Select the destination port from the list. Protocol Select the protocol that you want from the list. Age Enter the age value. BP ID Enter the ID of the Barrel Processor (BP). When you click Search, the session lookup results is displayed in the table. Click Download Session Details to save the session values. The information in the table are saved in csv format. NOTE You must specify a minimum of five search criteria, if the BP ID is not specified in the search criteria. 174 ServerIron ADX Graphical User Interface Guide 53-1002412-01 Chapter Viewing Security Statistics 13 In this chapter • DoS protection . . . . . . . . . . . . . . . . . . . . . . . . . . . . . . . . . . . . . . . . . . . . . . . . 175 • SSL statistics . . . . . . . . . . . . . . . . . . . . . . . . . . . . . . . . . . . . . . . . . . . . . . . . . 178 DoS protection To view the Denial of Service (DoS) attack details, perform the following steps within the Monitor tab. 1. Click Security on the menu bar. 2. From the sidebar, select DoS Protection. The DoS Protection page is displayed, as shown in Figure 134. FIGURE 134 Displaying the DoS protection The DoS Protection page displays the summary of SYN attack details and other DoS attack details. Displaying SYN attack details To display SYN attack details, perform the following steps within the Monitor tab. 1. Click Security on the menu bar. 2. From the sidebar, select DoS Protection, and then select SYN Attacks Details. ServerIron ADX Graphical User Interface Guide 53-1002412-01 175 13 DoS protection The SYN Attacks Details page is displayed, as shown in Figure 135. FIGURE 135 Monitoring the SYN attack details Table 40 describes the fields available in the SYN Attacks Details page. TABLE 40 SYN Attack Details fields Field Description Current Connection Rate (per sec) Displays the rate of all TCP traffic per second, including TCP SYN DoS attacks. Peak Connection Rate (per sec) Displays the peak rate of TCP traffic encountered per second. Current SYN Attack Rate (per sec) Displays the rate of TCP SYN DoS attacks per second. Peak SYN Attack Rate (per sec) Displays the peak rate of TCP SYN attacks encountered per second. SYN Proxy Software Statistics SYNs Processed Displays the number of SYNs that have the SYN proxy feature enabled, received and processed by the software. SYN ACKs Sent Displays the number of SYN ACKs sent to the client from the software. Valid ACKs Received Displays the number of valid ACKs received from the client, by the software. Invalid ACKs Received Displays the number of invalid ACKs received from the client, by the software. Fragmented Packets Allowed Displays the number of fragmented packets allowed by the software. Fragmented Packets Dropped Displays the number of fragmented packets dropped by the software. ACKs Without Data Drop Displays the number of ACKs received without any data drop. Invalid Vport Packets Displays the number of packets dropped due to invalid port. SYN Proxy Hardware Statistics 176 SYNs Processed Displays the number of SYNs that have the SYN-proxy enabled, received and processed by the hardware. SYN ACKs Sent Displays the number of SYN ACKs sent to the client from the hardware. Valid ACKs Received Displays the number of valid ACKs from the client received by the hardware. ServerIron ADX Graphical User Interface Guide 53-1002412-01 DoS protection TABLE 40 13 SYN Attack Details fields (Continued) Field Description Dynamic SYN Proxy Statistics Status Displays the configuration status of dynamic SYN proxy feature. If the status is enabled the filed will display the current SYN attack rate and the SYN attack threshold. For more information on SYN attack details, refer to the ServerIron ADX Security Guide. Displaying other DoS attack details To view other DoS attack details, perform the following steps within the Monitor tab. 1. Click Security on the menu bar. 2. From the sidebar, select DoS Protection, and then select Other Attacks Details. The Other Attacks Details page is displayed, as shown in Figure 136. FIGURE 136 Displaying the other DoS attack details Table 41 describes the fields available in the Other Attacks Details page. TABLE 41 Other attack details fields Field Description Statistics Attack Packets Dropped Displays the total number of attack packets dropped based on individual attack packet types. Attack Packets Logged Displays the total number of attack packets logged. Attack Types ServerIron ADX Graphical User Interface Guide 53-1002412-01 177 13 SSL statistics TABLE 41 Other attack details fields (Continued) Field Attack Type Description Displays the type of the attack. The types can be one of the following: XMas Tree SYN Fragments SYN And FIN Set Deny All Fragments FIN With No ACK ICMP Fragments Ping Of Death Large ICMP Land Attack IP Unknown Protocol NO TCP Flags • • • • • • • • • • • Attack Drop Count Displays the total number of attack packets dropped based on each individual attack packet types. Attack Log Count Displays the total number of attack packets logged. SSL statistics The Secure Socket Layer (SSL) page has the auto refresh interval option as On Demand. The information in the SSL page is refreshed when you click the Refresh icon. This page is enabled only if you installed the appropriate SSL license. To display the SSL statistics, perform the following steps within the Monitor tab. 1. Click Security on the menu bar. 2. From the sidebar, select SSL. The SSL page is displayed, as shown in Figure 137. FIGURE 137 Displaying the SSL. 178 ServerIron ADX Graphical User Interface Guide 53-1002412-01 SSL statistics 13 Table 42 describes the fields available in the SSL page. TABLE 42 SSL fields Field Description Statistics SSL Current Connections Displays the number of SSL connections currently alive. SSL Attempted Renegotiations Displays the number of SSL renegotiations attempted. SSL Handshakes Completed Displays the number of SSL handshakes completed. SSL Handshake Messages Displays the total number of SSL handshake messages in data transfer. SSL Connections Closed Displays the number of SSL connections closed by the device. TCP Connections Closed Displays the total number of connections closed by the device. SSL V2 Rate Limit Displays the rate limiting for v2 SSL traffic set by the end used. Received SSL Packets Dropped Displays the number of received SSL packets dropped by the device. Key Exchange Statistics RSA Private Decrypt Calls Displays the number of RSA private decrypt calls made by the device. RSA Public Decrypt Calls Displays the number of RSA public decrypt calls made by the device. RSA Private Encrypt Calls Displays the number of RSA private encrypt calls made by the device. RSA Public Encrypt Calls Displays the number of RSA public encrypt calls made by the device. DH Compute Key Calls Displays the number of compute key calls made by the device using the Diffie Hellman (DH) algorithm. DH Generate Key Calls Displays the number of generate key calls made by the device using DH algorithm. DSA Verify Calls Displays the number of verify calls made by the device using the Digital Signature Algorithm (DSA). DSA Sign Calls Displays the number of sign calls made by the device using the DSA. Hash Statistics MD5 Raw Hash Calls Displays the number of calls made by the device using Message Digest (MD5) raw hash algorithm. SHA1 Raw Hash Calls Displays the number of calls made by the device using Secure Hash (SHA1) raw hash algorithm. SSL MAC MD5 Calls Displays the number of SSL calls made by the device using MAC MD5. TLS MAC MD5 Calls Displays the number of TSL calls made by the device using MAC MD5. SSL MAC SHA1 Calls Displays the number of SSL calls made by the device using MAC SHA1. TLS MAC SHA1 Calls Displays the number of TLS calls made by the device using MAC SHA1. Data Encryption Statistics Triple DES Calls Displays the number of triple Data Encryption Standard (DES) calls made by the device. RC4 Calls Displays the number of RC4 calls made by the device. ServerIron ADX Graphical User Interface Guide 53-1002412-01 179 13 SSL statistics SSL alerts To display the SSL alerts statistics, perform the following steps within the Monitor tab. 1. Click Security on the menu bar. 2. From the sidebar, select SSL, and then select SSL Alerts. The SSL Alerts page is displayed, as shown in Figure 138. FIGURE 138 Displaying the SSL alerts The SSL Alerts page displays the decoded status counter of the fatal and warning alerts received and transmitted by the device in tabular format. Table 43 describes the fields available in the SSL Alerts page. TABLE 43 SSL Alerts fields Field Description Level 2 (Fatal) Alerts 180 Total Level 2 Alerts Displays the total number of level 2 (Fatal) alerts received and transmitted by the device. Unexpected Message Displays the total number of unexpected message alerts received and transmitted by the device. Bad Record Mac Displays the total number of bad record MAC alerts received and transmitted by the device. Decryption Failed Displays the number of alerts received and transmitted by the device for failed decryption. Record Overflow Displays the number of alerts received and transmitted by the device for record overflow. ServerIron ADX Graphical User Interface Guide 53-1002412-01 SSL statistics TABLE 43 13 SSL Alerts fields (Continued) Field Description Decompression Failure Displays the number of alerts received and transmitted by the device for decompression failure. Handshake Failure Displays the number of alerts received and transmitted by the device for handshake failure. Illegal Parameter Displays the number of alerts received and transmitted by the device for illegal parameters. Unknown CA Displays the number of unknown Certificate Authority (CA) alerts received and transmitted by the device. Access Denied Displays the total number of access denied messages received and transmitted by the device. Decode Error Displays the number of alerts received and transmitted by the device for decode error. Export Restriction Displays the number of alerts received and transmitted by the device for export restriction. Protocol Version Displays the number of protocol version alerts received and transmitted by the device. Insufficient Security Displays the number of alerts received and transmitted by the device for insufficient security. Internal Error Displays the number of alerts received and transmitted by the device for internal error. User Cancelled Displays the number of user cancelled alerts received and transmitted by the device. Level 1 (Warning) Alerts Total Level 1 Alert Displays the total number of alerts received and transmitted by the device. Close Notify Displays the total number of close notify alerts received and transmitted by the device. No Certificate Displays the number of alerts received and transmitted by the device for no certificates. Bad Certificate Displays the number of alerts received and transmitted by the device for bad certificates. Unsupported Certificate Displays the number of alerts received by the device for unsupported certificates. Certificate Revoked Displays the number of alerts received and transmitted by the device for revoked certificates. Certificate Expired Displays the number of alerts received and transmitted by the device for expired certificates. Certificate Unknown Displays the number of alerts received and transmitted by the device for unknown certificates. Decrypt Error Displays the number of alerts received and transmitted by the device for decryption error. No Renegotiation Displays the number of alerts received and transmitted by the device for no renegotiation. ServerIron ADX Graphical User Interface Guide 53-1002412-01 181 13 SSL statistics SSL profiles To display the SSL profile statistics, perform the following steps within the Monitor tab. 1. Click Security on the menu bar. 2. From the sidebar, select SSL, and then select SSL Profiles. The SSL Profiles page is displayed, as shown in Figure 139. FIGURE 139 Displaying the SSL profiles Table 44 describes the fields available in the SSL Profiles page. TABLE 44 SSL profile fields Field Description Profile name Displays the name of the SSL profile. Session Cache Items Displays the number of session cache items. Session Cache Hits Displays the number of session cache hits. Session Cache Misses Displays the number of session cache missed. Session Cache Timeouts Displays the number of the session cache timeouts. SSL client details To display the SSL client details, perform the following steps within the Monitor tab. 1. Click Security on the menu bar. 2. From the sidebar, select SSL, and then select SSL Client Details. 182 ServerIron ADX Graphical User Interface Guide 53-1002412-01 SSL statistics 13 The SSL Client Details page is displayed, as shown in Figure 140. FIGURE 140 Displaying the SSL client details Table 45 describes the fields available in the SSL Client Details page. TABLE 45 SSL client detail fields Field Description Connection Statistics SSL Connection Attempts Displays the number of attempts tried for SSL connect. SSL Connections Failed Displays the number of attempts failed during SSL connect. Client Authorization Successful Displays the number of sessions authorized by the client. Client Authorization Failed Displays the number of sessions failed during client authorization. SSL Session Reuse Attempts Displays the number of attempts for SSL session reuse. SSL Session Reuse Failed Displays the number of attempts failed for SSL session reuse. SSL Close Count Displays the number of SSL sessions closed. SSL Remote Close Count Displays the number of remote SSL sessions closed. SSL Reset Count Displays the number of SSL sessions reset. SSL Remote Reset Count Displays the number of remote SSL sessions reset. SSL Certificate Verification Statistics Certificate Verification Successful Displays the number of times the certificate verification was successful. Certificate Verification Failed Displays the number of times the certificate verification failed. Unknown User Displays the number of times the user is identified as unknown user. ServerIron ADX Graphical User Interface Guide 53-1002412-01 183 13 SSL statistics TABLE 45 SSL client detail fields (Continued) Field Description Certificate Verification Signature Failed Displays the number of times the certificate verification signature failed. Certificates Expired Displays the number of expired certificates. Certificates Revoked Displays the number of revoked certificates. Certificates Not Yet Valid Displays the number of times the certificate was not yet valid. Certificate Signature Failed Displays the number of times the certificate signature failed. Issuer Public Key Decode Failed Displays the number of times the decode of issuer public key failed. Self Signed Certificates Displays the number of self-signed certificate. Issuer Certificate Not Found Displays the number of times the issuer certificate was not found. Certificate Untrusted Displays the number of untrusted certificates. Certificate Chain Too Long Displays the number of times the certificate chain was too long. Certificate Not Sent By Peer Displays the number of times the certificate was not sent by peer. Certificate Revocation List (CRL) Statistics CRL Load Failed Displays the number of times the CRL load failed. CRL Signature Failed Displays the number of times the CRL signature failed. CRL Not Found Displays the number of times the CRL was not found. CRL Not Yet Valid Displays the number of times the CRL was not yet valid. CRL Expired Displays the number of times the CRL had expired. For more information on SSL statistics, refer to the ServerIron ADX Security Guide. 184 ServerIron ADX Graphical User Interface Guide 53-1002412-01 Section III Maintenance This section describes the Maintain features, and includes the following chapter: • Maintenance Overview . . . . . . . . . . . . . . . . . . . . . . . . . . . . . . . . . . . . . . . . . • Managing Software Images . . . . . . . . . . . . . . . . . . . . . . . . . . . . . . . . . . . . . • License Management . . . . . . . . . . . . . . . . . . . . . . . . . . . . . . . . . . . . . . . . . . • Restarting the System . . . . . . . . . . . . . . . . . . . . . . . . . . . . . . . . . . . . . . . . . . • Retrieving System Information for Technical Support. . . . . . . . . . . . . . . . . • Accessing the CLI. . . . . . . . . . . . . . . . . . . . . . . . . . . . . . . . . . . . . . . . . . . . . . ServerIron ADX Graphical User Interface Guide 53-1002412-01 187 189 193 191 195 197 185 186 ServerIron ADX Graphical User Interface Guide 53-1002412-01 Chapter Maintenance Overview 14 In this chapter • Navigating the maintenance tab . . . . . . . . . . . . . . . . . . . . . . . . . . . . . . . . . 187 Navigating the maintenance tab The Maintain tab is the fourth tab in the ADX web interface. You can use the menus that are available in the Maintain tab to perform the following actions: • Software Upload—Allows you to upload the software on the device from the Trivial File Transfer Protocol (TFTP) Server and reboot from that image. • Reboot—Allows you to reboot the ADX device. • License—Allows you view the existing licenses, add new licenses, and delete licenses. • Technical Support— Allows you to view and download the device information that can help Brocade Technical support team to troubleshoot your system. • CLI Access—Allows you to run CLI commands to configure the features that are not supported in the web interface. By default, the ADX web interface displays the Software Upload page after you click the Monitor tab. ServerIron ADX Graphical User Interface Guide 53-1002412-01 187 14 188 Navigating the maintenance tab ServerIron ADX Graphical User Interface Guide 53-1002412-01 Chapter Managing Software Images 15 In this chapter • Uploading the software . . . . . . . . . . . . . . . . . . . . . . . . . . . . . . . . . . . . . . . . . 189 Uploading the software You can upload a software image on the device from a Trivial File Transfer Protocol (TFTP) server. While uploading the image, make sure that there are no power failures. To upload the software image from the TFTP server, perform the following steps within the Maintain tab. 1. Click Software Upload on the menu bar. The Software Upload page is displayed, as shown in Figure 141. FIGURE 141 Uploading the software 2. Provide the following information: • TFTP Server: Enter the IP address of the TFTP server. • Software Image: Enter the name of the software image. • Image Flash: Click Primary or Secondary image flash in which you want to upload the software image. By default, the primary flash image is selected. • Save Configuration before reboot: Select the check box to save the running configuration before reboot. 3. Click Upload to start uploading the software image from the TFTP server to the selected image flash. ServerIron ADX Graphical User Interface Guide 53-1002382-01 189 15 Uploading the software The system continuously polls for the upload complete status. After upload is complete, the page gets auto refreshed to show the latest information. The system polls for 4 minutes maximum to server to respond and in case of no response from the server, the system prompts you to try again. 4. Click Upload and Reboot to reboot the device after uploading the software image to the device. The system follows the standard upload process. After upload is complete, before rebooting the device, the system checks the version of the uploaded image. If the image version is lower than 12.4, the system displays a warning message that the image does not support current web system and you will lose connectivity to this system after reboot. If the image version is 12.4 or later, the system checks for the image type and displays a warning message that you will have to log in again to the system after reboot, if the current image and the image trying to upload are different. During device reboot, the system continuously polls for the reboot success status. If the reboot is successful, the system is reloaded with the current page. The system polls 3 minutes maximum for the server to respond on the reboot status and in case of no response, will suggest you to log in again to the system to access the latest information. The Software Upload page also displays the information about the software running on the device. Table 46 describes the fields in the Software Information table. TABLE 46 190 Software Information fields Field Description Image Specifies the running image and image flash on the device, which can be one of the following: • Running (P)- Indicates the image is running from primary flash. • Running (S) - Indicates the image is running from secondary flash. • Primary - Indicates the image is stored in the primary flash. • Secondary - Indicates the image is stored in the secondary flash. • Boot - Indicates the boot image is used to bring up the device to load the primary or secondary image. Version Displays the release version of the software image. Image Name Displays the name of the software image. Build Type Displays the type of the build running on the device, which can be one of the following: • Router - Indicates the device is loaded with the router build. • Switch - Indicates the device is loaded with the switch build. Build Date Displays the date on which the image was released. ServerIron ADX Graphical User Interface Guide 53-1002382-01 Chapter Restarting the System 16 In this chapter • System restart . . . . . . . . . . . . . . . . . . . . . . . . . . . . . . . . . . . . . . . . . . . . . . . . 191 System restart To reboot the device, perform the following steps within the Maintain tab. 1. Click Reboot from the menu bar. The Reboot page is displayed, as shown in Figure 142. FIGURE 142 Rebooting the device 2. Select Primary or Secondary for image flash. By default, the system is configured to boot from the primary memory. 3. Select Always reboot using the selected image flash check box to set the selected image flash as the configured boot image. 4. Select Save Configuration check box to specify if the running configuration must be saved before reboot. NOTE If you select the Always reboot using the selected image flash check box, the Save Configuration check box is selected and the running configuration is saved automatically. 5. Click Reboot to reboot the device. ServerIron ADX Graphical User Interface Guide 53-1002382-01 191 16 System restart The application checks for the image version. if the version is lower than 12.4, the application displays a warning message that the image does not support current web application and you will lose connectivity to this application after reboot. The application also checks for the build type. If the build type is different from the current image running on the device, the application displays a warning message that you will have to re-login to the application after reboot. During device reboot, the application continuously polls for the reboot success status for 3 minutes maximum. After reboot is complete, the application is reloaded. If there is no response during polling, you are warned to re-login to the application to access the latest information. 192 ServerIron ADX Graphical User Interface Guide 53-1002382-01 Chapter License Management 17 In this chapter • License . . . . . . . . . . . . . . . . . . . . . . . . . . . . . . . . . . . . . . . . . . . . . . . . . . . . . . 193 License At the time of purchase, an ADX device is configured with a base license pre-installed. You can upgrade the device to increase system capacity by purchasing and applying a new software license. When a license is ordered separately (not pre-installed), an entitlement certificate or e-mail, along with a transaction key, are issued to the customer by Brocade as proof of purchase. The transaction key and LID of the Brocade device are used to generate a license key from the Brocade software licensing portal. The license key is contained within a license file, which can be downloaded to your local computer and then uploaded to the ADX device. The following are the license types supported on the device: • Trial license—A license-controlled feature to run on the device on a temporary basis. A trial license enables demonstration and evaluation of a licensed feature and can be valid for a period of 45 days. A licensed feature operating under a trial license has the same functionality as does a licensed feature operating under a normal license. • Unlimited license—A license-controlled feature to run on the device indefinitely. To view the licenses installed in the device, perform the following steps within the Maintain tab. 1. Click License on the menu bar. The License page is displayed, as shown in Figure 125. FIGURE 143 Using the license The License page displays a summary of the active and expired licenses installed on the device. Table 47 describes the fields in the License page. ServerIron ADX Graphical User Interface Guide 53-1002382-01 193 17 License TABLE 47 License fields Field Description Package Name Displays the name of the license package. License ID Displays the ID of the License. This number is embedded in the Brocade device. License Type License Period Status Displays the type of the license, which can be one of the following: Normal - Indicates that the license is permanent. Trial – Indicates that the license is temporary. • • Displays the period (number of days) for which a license is granted, which can be one of the following: • If the license type is trial (temporary), this field displays the number of days the license is valid. • If the license type is normal, the field displays ‘unlimited’. Displays the status of the license, which can be one of the following: Active – Indicates the license is valid and in effect on the device. Expired – Indicates that the trial license has expired. Invalid – Indicates the license when the license ID does not match the serial number of the device for which the license was purchased. • • • Adding a license To add one or more new licenses on the device, perform the following steps within the Maintain tab. 1. Click License on the menu bar. The License page is displayed. 2. Click Add at the bottom of the License page. A dialog box displays. Select the license file you want to add from the local directory and click Open to add the license key. After the license is added successfully, user is informed that it will be installed when the device is rebooted next time. The installed license is added in the Installed License (s) table Deleting a license To delete a license key from the device, perform the following steps within the Maintain tab. 1. Click License on the menu bar. 2. Select the license from the Installed License (s) table and click Delete to remove a license. After the license is deleted successfully, user is informed that it will be un-installed when the device is rebooted next time. The installed license is removed from the Installed License (s) table. NOTE You can not delete the base license installed on the device. For more information on the licenses, refer to the ServerIron ADX Administration Guide. 194 ServerIron ADX Graphical User Interface Guide 53-1002382-01 Chapter Retrieving System Information for Technical Support 18 In this chapter • Technical support . . . . . . . . . . . . . . . . . . . . . . . . . . . . . . . . . . . . . . . . . . . . . 195 Technical support The ADX device allows you to view and save the device information that can help the Brocade Technical support team to troubleshoot your system. To view the device information, perform the following steps within the Monitor tab. 1. Click Technical Support on the menu bar. The Technical Support page is displayed, as shown in Figure 144. FIGURE 144 Technical support 2. Click View Summary to display the summary of device information that can be used by the technical support team to troubleshoot. You can download detailed technical device configuration information and view or save it locally for assistance in troubleshooting issues when working with technical support. 3. Click Download Details to download the detailed information for technical support. The information can be downloaded in Hypertext Markup Language (HTML) or text format. By default, the information is downloaded in HTML format. After the information is successfully downloaded, you can view the information in a separate window or save the file to your local system. For more information on technical support, refer to the ServerIron ADX Administration Guide. ServerIron ADX Graphical User Interface Guide 53-1002382-01 195 18 196 Technical support ServerIron ADX Graphical User Interface Guide 53-1002382-01 Chapter Accessing the CLI 19 In this chapter • CLI Access . . . . . . . . . . . . . . . . . . . . . . . . . . . . . . . . . . . . . . . . . . . . . . . . . . . 197 CLI Access The ADX web interface enables you to run CLI commands to configure the features that are not supported in the web interface. You can use the CLI access feature available in web interface to run the CLI commands in a batch to request and change the configuration information on ADX device. To run CLI commands using the web interface, perform the following steps within the Maintain tab. 1. Click CLI Access from the menu bar. The CLI Access page is displayed, as shown in Figure 145. FIGURE 145 CLI Access NOTE The users with operator and manager privilege can run the CLI commands from the GUI. If you are a read-only user. You can only view the CLI Access page. 2. Enter the CLI commands in the field under the Enter a batch of up to 10 CLI commands that you would like to send to the ADX. NOTE The maximum number of CLI Commands that you can run from the web interface is 10. However, if any command fails to execute, the device will continue to process the remaining commands and return the response of the commands that are executed. 3. Perform one of the following actions: ServerIron ADX Graphical User Interface Guide 53-1002382-01 197 19 CLI Access • Click Send to run the commands on the ADX device and view the response from the ADX device under Results. • Click Clear to clear the command entries. NOTE The CLI commands will be validated only on the ADX device and not on the client. NOTE You can run show, configuration, and copy or paste commands from the web interface. However, you cannot run the boot and reset commands. 198 ServerIron ADX Graphical User Interface Guide 53-1002382-01 Appendix A Appendix A Troubleshooting You can troubleshoot the problems that occur in ADX device web interface. Unable to open web interface Problem The ADX device web interface does not open. Solution Verify the following items to resolve this problem: • Make sure that the following services are enabled on the device: - Hypertext Transfer Protocol (HTTP) - Simple Object Access Protocol (SOAP) - Secure HTTP (HTTPS) The HTTP and SOAP services are enabled by default. However, to enable HTTPS, ensure that the device supports SSL and then generate a SSL certificate. The SSL protocol uses digital certificate and a private-public key pair to establish a secure connection. To enable SOAP service, run the following command in the CLI. ServerIronADX# web-management soap-service • Make sure that the web-management services are enabled in the device. If not, after entering the privilege mode, run the following command in the CLI to enable the web-management services. ServerIronADX# ServerIronADX# ServerIronADX# ServerIronADX# web-management enable web-management http web-management https crypto-ssl certificate generate default_cert • Make sure that you have installed Flash Player 10.2 or higher in the system. You can download the Flash Player from www.adobe.com. • Make sure that you open the web interface using one of the following web browsers: Google Chrome, Internet Explorer, and Mozilla Firefox web browsers. You can also use other web browsers such as Safari, Opera and so on to open the web interface if they have flash installed in the system. However, the ADX web interface has not been validated with these browsers. ServerIron ADX Graphical User Interface Guide 53-1002412-01 199 A Troubleshooting Web interface does not reflect changes based on the latest image Problem The ADX web interface does not reflect the changes after upgrading a new image. Solution Clear the cache on the web browser and try again. The procedure to clear the browser cache vary based on Web browsers. Therefore, refer to the respective help documentation to clear the cache. RSL error (#2032 Stream Error) when launching the web interface Problem An RSL error "#2032 Stream Error” is encountered when you open the ADX Web interface. The error message indicates that the SWZ or SWF file is not being found. Solution • Download the signed framework RSL from the Adobe web site. • Deploy a local signed framework RSL in case of limited or loss of internet connectivity. 200 ServerIron ADX Graphical User Interface Guide 53-1002412-01