1
®
CyberSWITCH Devices (200 Series and 400)
Management Module Guide
Notice
Cabletron Systems reserves the right to make changes in specifications and other information
contained in this document without prior notice. The reader should in all cases consult Cabletron
Systems to determine whether any such changes have been made.
The hardware, firmware, or software described in this manual is subject to change without notice.
IN NO EVENT SHALL CABLETRON SYSTEMS BE LIABLE FOR ANY INCIDENTAL,
INDIRECT, SPECIAL, OR CONSEQUENTIAL DAMAGES WHATSOEVER (INCLUDING BUT
NOT LIMITED TO LOST PROFITS) ARISING OUT OF OR RELATED TO THIS MANUAL OR
THE INFORMATION CONTAINED IN IT, EVEN IF CABLETRON SYSTEMS HAS BEEN
ADVISED OF, KNOWN, OR SHOULD HAVE KNOWN, THE POSSIBILITY OF SUCH
DAMAGES.
Virus Disclaimer
Cabletron has tested its software with current virus checking technologies. However, because no
anti-virus system is 100% reliable, we strongly caution you to write protect and then verify that
the Licensed Software, prior to installing it, is virus-free with an anti-virus system in which you
have confidence.
Cabletron Systems makes no representations or warranties to the effect that the Licensed
Software is virus-free.
Copyright © February 1998, by Cabletron Systems, Inc. All rights reserved.
Printed in the United States of America.
Order number: 9032231 E1
Cabletron Systems, Inc.
P.O. Box 5005
Rochester, NH 03866-5005
SPECTRUM, the SPECTRUM IMT/VNM logo, DCM, IMT, and VNM are registered
trademarks and SpectroGRAPH, SpectroSERVER, Inductive Modeling Technology,
Device Communications Manager, MMAC-Plus, and Virtual Network Machine are
trademarks of Cabletron Systems, Inc.
Ethernet is a trademark of Xerox Corporation.
9032231 E1
i
Restricted Rights Notice
(Applicable to licenses to the United States Government only.)
1. Use, duplication, or disclosure by the Government is subject to restrictions as set forth in
subparagraph (c) (1) (ii) of the Rights in Technical Data and Computer Software clause at
DFARS 252.227-7013.
Cabletron Systems, Inc., 35 Industrial Way, Rochester, New Hampshire 03867-0505.
2. (a) This computer software is submitted with restricted rights. It may not be used,
reproduced, or disclosed by the Government except as provided in paragraph (b) of this
Notice or as otherwise expressly stated in the contract.
(b) This computer software may be:
(c)
(1)
Used or copied for use in or with the computer or computers for which it was
acquired, including use at any Government installation to which such computer or
computers may be transferred;
(2)
Used or copied for use in a backup computer if any computer for which it was
acquired is inoperative;
(3)
Reproduced for safekeeping (archives) or backup purposes;
(4)
Modified, adapted, or combined with other computer software, provided that the
modified, combined, or adapted portions of the derivative software incorporating
restricted computer software are made subject to the same restricted rights;
(5)
Disclosed to and reproduced for use by support service contractors in accordance with
subparagraphs (b) (1) through (4) of this clause, provided the Government makes
such disclosure or reproduction subject to these restricted rights; and
(6)
Used or copied for use in or transferred to a replacement computer.
Notwithstanding the foregoing, if this computer software is published copyrighted
computer software, it is licensed to the Government, without disclosure prohibitions, with
the minimum rights set forth in paragraph (b) of this clause.
(d) Any other rights or limitations regarding the use, duplication, or disclosure of this
computer software are to be expressly stated in, or incorporated in, the contract.
(e) This Notice shall be marked on any reproduction of this computer software, in whole or in
part.
ii
CyberSWITCH Devices (200 Series and 400)
Management Module Guide
Contents
Preface
What Is in This Guide .......................................................................................................... ix
Conventions ............................................................................................................................x
Related SPECTRUM Documentation....................................................................................x
Other Related Documentation ............................................................................................. xi
Chapter 1
Introduction
What Is in This Chapter..................................................................................................... 1-1
CyberSWITCH Devices ...................................................................................................... 1-1
SPECTRUM Model Types .................................................................................................. 1-2
Accessing SPECTRUM Views ............................................................................................ 1-2
Roadmap of SPECTRUM Views ........................................................................................ 1-4
SPMA Support .................................................................................................................... 1-5
Chapter 2
Device Views
What Is in This Chapter..................................................................................................... 2-1
Chassis Device View ........................................................................................................... 2-1
Device Icon.................................................................................................................... 2-4
Views with Double-Click Access ........................................................................... 2-5
Device Icon Labels........................................................................................................ 2-6
Device Identification Label ................................................................................... 2-6
Device Icon Subviews Menu.................................................................................. 2-6
Application Label................................................................................................... 2-7
Interface Labels ..................................................................................................... 2-8
Port Labels - CSX200 Series only ......................................................................... 2-9
Interface Device View ....................................................................................................... 2-10
Interface Icon.............................................................................................................. 2-11
Interface Icon Labels.................................................................................................. 2-12
Interface Label..................................................................................................... 2-13
Administrative Status Label............................................................................... 2-13
Interface Type Label............................................................................................ 2-14
MAC Address Label ............................................................................................. 2-14
Network Information Label ................................................................................ 2-14
Gauge Label ......................................................................................................... 2-14
Interface Options Panel ............................................................................................. 2-14
Gauge Control Panel .................................................................................................. 2-15
9032231 E1
iii
Chapter 3
Configuration Views
What Is in This Chapter .....................................................................................................3-1
Device Configuration View .................................................................................................3-2
Device Configuration Information ...............................................................................3-2
Interface Configuration Table ......................................................................................3-3
Interface Configuration View .......................................................................................3-4
Port Configuration - CSIIfPort View ..................................................................................3-4
Port Configuration View - for the CSX200 Series only .....................................................3-5
Repeater Configuration View - for the CSX200 Series only .............................................3-5
Chapter 4
Event and Alarm Messages
What Is in This Chapter .....................................................................................................4-1
CyberSWITCH 200 Series and 400 Events and Alarms ...................................................4-1
Chapter 5
Application View
What Is in This Chapter .....................................................................................................5-1
Common Applications .........................................................................................................5-1
Device Application View .....................................................................................................5-2
DownLoad Application........................................................................................................5-5
Ethernet 1 Application - for CSX200 Series only ..............................................................5-5
Index
iv
CyberSWITCH Devices (200 Series and 400)
Management Module Guide
Figures
Chapter 1
Figure 1-1.
Figure 1-2.
Figure 1-3.
Figure 1-4.
Figure 1-5.
Chapter 2
Figure 2-1.
Figure 2-2.
Figure 2-3.
Figure 2-4.
Figure 2-5.
Figure 2-6.
Chapter 5
Figure 5-1.
Figure 5-2.
Introduction
Using Double-Click Zones to Access SPECTRUM Views ................................... 1-2
Accessing Icon Subviews Menus from the Device Icon ....................................... 1-3
Accessing Icon Subviews Menus from Labels ..................................................... 1-3
SPECTRUM Views Roadmap .............................................................................. 1-4
SPMA Applications View ...................................................................................... 1-5
Device Views
Chassis Device View for the CSX200 Series ....................................................... 2-2
Chassis Device View for the CSX400 ................................................................... 2-3
Device Icon ............................................................................................................ 2-4
Interface Device View ......................................................................................... 2-11
Interface Icon ...................................................................................................... 2-12
Gauge Control Panel ........................................................................................... 2-15
Application View
Device Application View (Icon Mode) .................................................................. 5-3
Device Application View (List Mode) ................................................................... 5-4
9032231 E1
v
vi
CyberSWITCH Devices (200 Series and 400)
Management Module Guide
Tables
Chapter 2
Table 2-1.
Table 2-2.
Table 2-3.
Table 2-4.
Table 2-5.
Table 2-6.
Table 2-7.
Table 2-8.
Table 2-10.
Table 2-9.
Table 2-11.
Table 2-12.
Table 2-13.
Chapter 4
Table 4-1.
Chapter 5
Table 5-1.
Device Views
Views with Double-click Access ............................................................................ 2-5
Device Icon Subviews Menu.................................................................................. 2-6
Bridging Application Icon Subviews Menu .......................................................... 2-7
Router Applications Icon Subviews Menu............................................................ 2-8
Interface Status for the Physical or MIB II Application ..................................... 2-9
Interface Status for the Bridging Application ..................................................... 2-9
Interface Status for the Routing Applications ..................................................... 2-9
Port Status and Descriptions ............................................................................. 2-10
Administrative Status for the Bridging Application ......................................... 2-13
Administrative Status for the Physical or MIB II Application ......................... 2-13
Administrative Status for the Routing Applications ......................................... 2-14
Rates Gauge Mode: Attributes and Corresponding Colors ............................... 2-16
Totals Gauge Mode: Attributes and Corresponding Colors .............................. 2-17
Event and Alarm Messages
CyberSWITCH 200 Series and 400 Events and Alarms ..................................... 4-1
Application View
Ethernet 1 Application Icon Subviews Menu....................................................... 5-5
9032231 E1
vii
viii
CyberSWITCH Devices (200 Series and 400)
Management Module Guide
Preface
Use this guide as a reference for the SPECTRUM CyberSWITCH Devices (200
Series and 400) management software. Before using this guide, you should be
familiar with SPECTRUM’s functions and navigational techniques as
described in the Administrator’s Reference and the Operator’s Reference.
Also become familiar with any network management and hardware
requirements described in the CyberSWITCH hardware documentation.
For the purposes of this guide, CyberSWITCH is referred to as “device.”
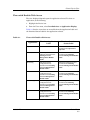
What Is in This Guide
The following chapter descriptions outline the organization of the
CyberSWITCH Devices (200 Series and 400) Management Module
Guide:
Chapter
Description
Chapter 1
Describes the device, the management module
software, and the model types.
Introduction
Chapter 2
Device Views
Chapter 3
Configuration Views
Chapter 4
Event and Alarm Messages
Chapter 5
Application View
Describes the Device views representing the
device.
Describes the Configuration views for the device
and the network information provided by the
views.
Lists and explains the alarm and event messages
generated in the Event Log or Alarm Manager for
the device model type.
Describes the Application view and the
application specific information for the device.
9032231 E1
ix
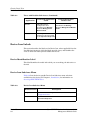
Conventions
Conventions
This guide uses the following conventions:
• Menu selections and buttons referenced in text appear in bold; for
example, Configuration or Detail.
• Button names appear in shadowed boxes when introducing paragraphs
describing their use; for example:
Help
• Menu navigation appears in order of selection; for example, Icon
Subviews -> Utilities -> Application.
• Referenced chapter titles and section headings appear in italics.
• Referenced documents appear in bold italics.
• Hypertext links are in blue for online documents.
• CyberSWITCH is referred to as “device.”
Related SPECTRUM Documentation
When using this guide, you should have a clear understanding of SPECTRUM
functionality and navigation techniques as described in the following
recommended documentation:
Operator’s Reference
Administrator’s Reference
Report Generator User’s Guide
Application View Reference
Getting Started with SPECTRUM 4.0 for Operators
Getting Started with SPECTRUM 4.0 for Administrators
How to Manage Your Network with SPECTRUM
This guide also references the following documents:
SPECTRUM Portable Management Application Tools Guide
Routing Services Management Module Guide
DLM Management Module Guide
Preface
x
CyberSWITCH Devices (200 Series and 400)
Management Module Guide
Other Related Documentation
Other Related Documentation
Refer to the following documentation for more information on managing TCP/
IP-based networks:
Martin, James, Kathleen Kavanagh Chapman, and Joe Leben. Local Area
Networks: Architectures and Implementations, 2d ed. Englewood Cliffs,
NJ: Prentice Hall, 1994.
Michael, Wendy H., William J. Cronin, Jr., and Karl F. Piper. FDDI: An
Introduction to Fiber Distributed Data Interface. Woburn, MA: Digital
Press, 1992.
Rose, Marshall T. The Simple Book: An Introduction to Management of
TCP/IP-based Internets. Englewood Cliffs, NJ: Prentice Hall, 1991.
Stallings, William. Data and Computer Communications, 4th ed. New
York: Macmillan Publishing Company, 1994.
Tanenbaum, Andrew S. Computer Networks, 3d ed. Englewood Cliffs, NJ:
Prentice Hall, 1996.
9032231 E1
Preface
xi
Other Related Documentation
Preface
xii
CyberSWITCH Devices (200 Series and 400)
Management Module Guide
Chapter 1
Introduction
What Is in This Chapter
This chapter introduces the SPECTRUM management modules for the
CyberSWITCH Devices (200 Series and 400). It describes the following:
•
•
•
•
•
CyberSWITCH Devices
SPECTRUM Model Types
Accessing SPECTRUM Views
Roadmap of SPECTRUM Views
SPMA Support
CyberSWITCH Devices
The CyberSWITCH 200 series is a standalone LAN to WAN remote access
solution. Designed as an end node device, it supports one to twelve users with
connectivity to a corporate site or central office through a WAN Leased Line.
The CyberSWITCH 400 is a LAN to WAN remote access switch and gateway
device with Ethernet support. It provides an access node for both the large
regional and corporate office or any other location requiring a “backbone”
dedicated WAN solution. The CyberSWITCH 400 supports a large workgroup
comprised of several types of information-critical employees who require
remote attachment to corporate networks, specifically, corporate hubs or large
branch offices. It also provides the connectivity for PPP and Frame Relay
leased lines, allowing it to support a large number of remote connections for
employees who need quick access to information resources.
9032231 E1
1-1
SPECTRUM Model Types
SPECTRUM Model Types
The model type refers to the management module software package used to
specify attributes, actions, and associations for the physical device using the
Simple Network Management Protocol (SNMP) and Management Information
Bases (MIBs). The model types for the CyberSWITCH are:
• CSX200 for the CyberSWITCH 200 series
• CSX400 for the CyberSWITCH 400
Refer to the Administrator’s Reference for modeling instructions.
Accessing SPECTRUM Views
Icons provide access to SPECTRUM views that display device-specific
information. Access these views through double-click zones (Figure 1-1) and
Icon Subviews menus (Figure 1-2 and Figure 1-3).
Figure 1-1.
Using Double-Click Zones to Access SPECTRUM Views
Accesses the Configuration view; see
Chapter 3, Configuration Views.
Model Name
Accesses the Device Topology view;
refer to the Operator’s Reference.
Accesses a Device view; see
Chapter 2, Device Views.
CSX200
Accesses the Application view; see
Chapter 5, Application View.
Accesses the Configuration view; see
Chapter 3, Configuration Views.
Accesses a Device view; see
Chapter 2, Device Views.
Model Name
Accesses the Performance view;
refer to the Operator’s Reference.
CSX200
Accesses the Device Topology view;
refer to the Operator’s Reference.
Introduction
1-2
Accesses the Application view; see
Chapter 5, Application View.
CyberSWITCH Devices (200 Series and 400)
Management Module Guide
Accessing SPECTRUM Views
To access the Icon Subviews menu as shown in Figure 1-2 and Figure 1-3, do
the following:
1. Highlight the icon or label.
2. From the View menu, select Icon Subviews, or click and hold the
applicable mouse button (middle or right) over the icon or label. Refer to
the Operator’s Reference for information on configuring your mouse.
Figure 1-2.
Accessing Icon Subviews Menus from the Device Icon
Model Name
CSX200
View
Ctrl+b
Go Back
Go Up
Icon Subviews
View Path
New View
Bookmarks
View History
Current View Info...
Notes...
Jump by name...
Zoom
Map Hierarchy
Figure 1-3.
Ctrl+c
Close
Navigate
Alarms
Performance
Notes...
Utilities
Zoom
Device
Logical
DevTop
Interface
Accessing Icon Subviews Menus from Labels
CyberSWITCH– CSX200
IP Routing
1
9032231 E1
NLK
2
NLK
1
3
2
ENA
NLK
4
NLK
ENA
5
NLK
6
NLK
Close
Ctrl + c
Navigate
Alarms
Performance
Notes...
Utilities
Configuration
NLK Information
7Model
8 NLK 9 NLK 10 NLK
Common
Device-Specific
ON
11 NLK 12 ON
Introduction
1-3
Roadmap of SPECTRUM Views
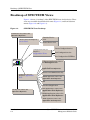
Roadmap of SPECTRUM Views
Figure 1-4 shows a “roadmap” of the SPECTRUM views for this device. These
views are accessible from double-click zones (Figure 1-1) and Icon Subviews
menus (Figure 1-2 and Figure 1-3).
Figure 1-4.
SPECTRUM Views Roadmap
Performance view; refer to the
Operator’s Reference.
Device views; see Chapter 2,
Device Views.
Interface Device
view
Chassis Device view
Device Configurationview
Configuration view; see
Chapter 3,
Port Configuration view
Configuration Views.
Port Configuration-CSIIfPort
Model Name
CtRouter Application; refer to
the Routing Services
CSX200/400
Bridging Application; refer to the
Application View Reference.
Ethernet 1-for CSX200 Series only
Application view; see
Chapter 5, Application
View.
MIB II Application; refer to the
Application View Reference.
DSI
DownLoad Application
DevTop view; refer to the
Operator’s Reference.
PPP Application ; refer to the
Application View Reference.
RS232 Application; refer to the
Application View Reference.
WAN Application; refer to the
Application View Reference.
Introduction
1-4
CyberSWITCH Devices (200 Series and 400)
Management Module Guide
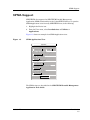
SPMA Support
SPMA Support
SPECTRUM also supports the SPECTRUM Portable Management
Application (SPMA) functionality for the CyberSWITCH devices. To open the
SPMA Applications view from any SPECTRUM view, do the following:
1. Highlight the Device icon.
2. From the View menu, select Icon Subviews -> Utilities ->
Applications.
Figure 1-5 shows an example of an SPMA Applications view.
Figure 1-5.
SPMA Applications View
Applications
Model Name of type CSX200
Trap Table
Community Names
CtRouter of type CtRouterApp
Basic Configuration
Bridging of type CSIBridge
Bridge View
MIB-II of type SNMP2_Agent
Generic SNMP (MIB I II)
Download App of type CtDownLoadApp
TFTP Download
WAN App of type CtWANApp
WAN Configuration
Close
The SPMA views are described in the SPECTRUM Portable Management
Application Tools Guide.
9032231 E1
Introduction
1-5
SPMA Support
Introduction
1-6
CyberSWITCH Devices (200 Series and 400)
Management Module Guide
Chapter 2
Device Views
What Is in This Chapter
This chapter describes the following Device views and subviews available for
the CyberSWITCH Devices:
• Chassis Device View
• Interface Device View
See Chapter 1, Introduction, for information on Accessing SPECTRUM Views.
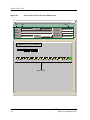
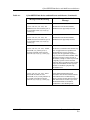
Chassis Device View
This view (accessible from the device icon) is a logical representation of the
physical CyberSWITCH Devices (200 Series and 400). The Chassis Device
view provides menu and double-click zone access to the views that monitor the
devices and their interfaces and ports.
Figure 2-1 shows an example of the Chassis Device view for the
CyberSWITCH 200 Series. Figure 2-2 shows an example of the Chassis Device
view for the CyberSWITCH 400.
9032231 E1
2-1
Chassis Device View
Figure 2-1.
Chassis Device View for the CSX200 Series
Model Name of type CSX200 of Landscape VNMHost: Primary
* File
View
Help?
Net Addr
Model Name
Sys Up Time
Contact
Manufacturer
Description
Device Type
Location
Prime-App
Serial Number
CyberSWITCH– CSX200
IP Routing
1
NLK
2
NLK
1
3
2
ENA
NLK
4
NLK
ENA
5
NLK
6
NLK
7
NLK
8
NLK
9
NLK
ON
10 NLK 11 NLK 12 ON
Device Icon
Device Views
2-2
CyberSWITCH Devices (200 Series and 400)
Management Module Guide
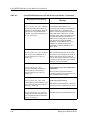
Chassis Device View
Figure 2-2.
Chassis Device View for the CSX400
Model Name of type CSX400 of Landscape VNMHost: Primary
* File
View
Model Name
Help?
Net Addr
Sys Up Time
Contact
Manufacturer
Description
Device Type
Location
Prime-App
Serial Number
CyberSWITCH– CSX400
IP Routing 1 DIS
2 DIS 3 DIS 4 DIS 5 DIS 6 DIS 7 DIS 8 DIS 9 DIS 10 DIS 11 DIS
12 DIS 13 DIS 14 DIS 15 DIS 16 DIS 17 DIS 18 DIS 19 DIS 20 DIS 21 DIS 22 DIS 23 DIS
24 DIS 25 DIS 26 DIS 27 DIS 28 DIS 29 DIS 30 DIS 31 DIS 32 DIS 33 DIS 34 DIS 35 DIS
36 DIS 37 DIS 38 DIS 39 DIS 40 DIS 41 DIS 42 DIS 43 DIS 44 DIS 45 DIS 46 DIS 47 DIS
47 DIS 48 DIS 49 DIS 50 DIS
Device Icon
9032231 E1
Device Views
2-3
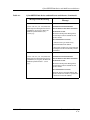
Chassis Device View
Device Icon
Device Icon
This icon is a logical representation of the physical device and its interfaces
and/or ports. This section describes the information available from the Device
icon. Figure 2-3 shows a detailed example of a CSX200 Series Device icon. The
CSX400 Device icon has the Application and Interface Labels but no Port
Labels.
NOTES
The callouts displayed in the illustration below identify the labels and, when
applicable, the views to which they provide double-click access. The views to
which the Application Label and the Interface Status Label have double-click
access depend upon the application selected from the Application Display
choice on the Icon Subviews menu. Table 2-1 lists the accessible views.
The menus displayed in the illustration are the Icon Subviews menus for
those labels on the Device icon.
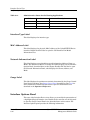
Figure 2-3.
Device Icon
Device Identification
Label
CyberSWITCH– CSX200
Interface Label
Application
Label/ (see
Table 2-1)
IP Routing
1
2
ENA
Interface Status
Label/(see Table 2-1)
ENA
Interface Number
Label
Port Label
Port Number Label/
Ethernet 1 MgtRptr
Port Label View
1
NLK
2
NLK
3
NLK
4
NLK
Port Status Label/ Port
Configuration View
Close
Ctrl + c
Navigate
Alarms
Performance
Notes...
Utilities
Configuration
Model Information
Icon Subviews Menus
Device Views
2-4
Close
Navigate
Alarms
Performance
Notes...
Utilities
Configuration
Model Information
Ctrl + c
5
NLK
6
NLK
7
NLK
8
NLK
9
NLK
10
Close
Ctrl + c
Navigate
Alarms
Performance
Notes...
Utilities
Port Notes
Enable/Disable Port
Close
Navigate
Alarms
Performance
Notes...
Utilities
Configuration
Ctrl + c
CyberSWITCH Devices (200 Series and 400)
Management Module Guide
Chassis Device View
Device Icon
Views with Double-Click Access
The view displayed depends upon the application selected. To select an
application, do the following:
1. Highlight the Device icon.
2. From the View menu, select Icon Subviews -> Application Display.
Table 2-1 lists the views that are accessible from the Application Label and
the Interface Status Label for the application selected.
Table 2-1.
Views with Double-click Access
Application
9032231 E1
View from Application
Label
View from Interface
Status Label
Physical
None
CSIIf Port Performance View
described in the Operator’s
Reference
CtRouter
Router System Table CtRouter described in the
Routing Services
Management Module
Guide
CtRouter Performance View
described in the Routing
Services Management Module
Guide
IP Routing
IP Routing System
Configuration View
described in the Routing
Services Management
Module Guide
IP Routing Performance View
described in the Routing
Services Management Module
Guide
IP RIP
IP RIP Interface
Configuration View
described in the Routing
Services Management
Module Guide
IP RIP Performance View
described in the Routing
Services Management Module
Guide
IPX Routing
IPX Routing System
Configuration View
described in the Routing
Services Management
Module Guide
IPX Routing Performance View
described in the Routing
Services Management Module
Guide
IPX RIP
IPX RIP Interface
Configuration View
described in the Routing
Services Management
Module Guide
IPX RIP Performance View
described in the Routing
Services Management Module
Guide
Device Views
2-5
Chassis Device View
Device Icon Labels
Table 2-1.
Views with Double-click Access (Continued)
Application
View from Application
Label
View from Interface
Status Label
IPX SAP Performance View
described in the Routing
Services Management Module
Guide
IPX SAP
IPX SAP Interface
Configuration View
described in the Routing
Services Management
Module Guide
Bridging
CSI Bridge Interface
None
Performance View described
in the Operator’s Reference
Device Icon Labels
This section describes the labels on the Device Icon, where applicable lists the
Icon Subviews menus to which the labels provide access, and identifies the
views to which the labels provide double-click access.
Device Identification Label
This label identifies the model with which you are working, the 200 series or
the 400.
Device Icon Subviews Menu
Table 2-2 lists the device-specific Device Icon Subviews menu selections
available for this device. See Chapter 1, Introduction, for information on
Accessing SPECTRUM Views.
Table 2-2.
Device Icon Subviews Menu
Menu Selection
Device Views
2-6
Description
Configuration
Opens the Device Configuration view described in Chapter 3,
Configuration Views.
Model Information
Opens the Model Information view described in the
Operator’s Reference.
CyberSWITCH Devices (200 Series and 400)
Management Module Guide
Chassis Device View
Device Icon Labels
Table 2-2.
Device Icon Subviews Menu (Continued)
Module Notes
Opens a dialog box in which you can record notes if you have
write permission for the model.
Application Display
Opens the Application Display submenu, allowing you to
choose Physical (MIB II), Bridging, or one of the following
router applications described in the Routing Services
Management Module Guide: CtRouter, IP Routing, IP RIP,
IPX Routing, IPX RIP, IPX SAP.
Application Label
This label provides access to the Icon Subviews menu for the application
displayed (see Figure 2-3). Double-click the Application label to open the
System Configuration - IP Routing view described in the Routing Services
Management Module Guide. The application selected determines the
information displayed and the menu selections available. To select the
application, highlight the Device icon and from the View menu, select Icon
Subviews -> Application Display.
Table 2-3 lists the device-specific Bridging Application Icon Subviews menu
selections. Table 2-4 lists the Router Application Icon Subviews menu
selections. See Chapter 1, Introduction, for information on Accessing
SPECTRUM Views. The Physical Application has no specific Icon Subviews
menu selections.
Table 2-3.
Bridging Application Icon Subviews Menu
Menu Selection
9032231 E1
Description
Bridge Performance
Opens the Bridge Performance view described in the
Operator’s Reference.
Bridge Detail
Opens the Bridge Detail view described in the
Operator’s Reference.
Bridge Model Information
Opens the Model Information view described in the
Operator’s Reference.
Special Database
Opens the Ethernet Special Database Table with
Filter Information Table.
Spanning Tree Information
Opens the Spanning Tree Information view described
in the Application View Reference.
Static Database Table
Opens the Static Database Table view described in
the Application View Reference.
Transparent Bridge Info
Opens the Transparent Bridge Information view with
Forwarding Database and Port Tables described in
the Application View Reference.
Device Views
2-7
Chassis Device View
Table 2-4.
Router Applications Icon Subviews Menu
Menu Selection
Description
Configuration
Opens a submenu with access to various routing
tables described in the Routing Services
Management Module Guide.
Model Information
Opens the Model Information view described in the
Operator’s Reference.
Basic Configuration
Available only for the CtRouter Application. Opens a
window to allow you to configure the routing services
in your Cabletron device.
Interface Labels
These labels represent the interfaces located on the front panel of the device.
They provide access to an Icon Subviews menu and display two information
labels: an Interface Number Label and an Interface Status Label. The Icon
Subviews menu selection for the Interface label is Configuration. It opens
the Configuration dialog box, which allows you to enable or disable the
selected port. See Chapter 1, Introduction, for information on Accessing
SPECTRUM Views.
Interface Number Label
This label displays the interface number (see Figure 2-3).
Interface Status Label
This label displays the status of the port. See Application Label, described
previously in this chapter, for information on selecting the application to be
displayed.
Double-click this label to open the following views:
• for the Physical Application, the CSIIfPort Performance view. Refer to the
Operator’s Reference for a description of Performance views.
• for the Routing Applications, one of the Routing Performance views. Refer
to the Routing Services Management Module Guide for a description
of these Performance views.
Table 2-5, Table 2-6, and Table 2-7 describe the possible states relative to the
application selected.
Device Views
2-8
CyberSWITCH Devices (200 Series and 400)
Management Module Guide
Chassis Device View
Table 2-5.
Interface Status for the Physical or MIB II Application
Color
Table 2-6.
Status
Green
ON
Port is operational; Operational Status is
up.
Blue
OFF
Port is off; Operational Status is down.
Gold
OFF
Port is off; Operational Status is up.
Yellow
TST
Port is in the test mode; Operational
Status is up.
Red
TST
Port is in the test mode; Operational
Status is down.
Interface Status for the Bridging Application
Color
Table 2-7.
Description
Status
Description
Green
FWD
Bridge port is forwarding.
Blue
DIS
Port is disabled.
Magenta
LST
Bridge is in the listening mode.
Magenta
LRN
Bridge is in the learning mode.
Orange
BLK
Bridge port is in the blocking mode.
Red
BRK
Bridge port is broken.
Blue
UNK
The status is unknown.
Interface Status for the Routing Applications
Color
Status
Description
Green
ENA
Port is enabled.
Gray
DIS
Port is disabled.
Blue
Other
None.
Port Labels - CSX200 Series only
These labels represent the Ethernet repeater ports. They display two
information labels: a Port Number Label and a Port Status Label.
9032231 E1
Device Views
2-9
Interface Device View
Port Number Label
This label displays the port number. Double-click this label to open a dialog
box, the Notes for Ethernet 1 MgtRptrPort View. The Notes view attaches a
message to a model or port. You must have write privileges to a model to enter
notes. Refer to the Operator’s Reference for more information.
Port Status Label
This label displays the status of this port. Double-click this label to open the
Port Configuration View. See Chapter 3, Configuration Views, for more
information on this view. Table 2-8 shows the possible states of the port.
Table 2-8.
Port Status and Descriptions
Color
State
Description
Green
ACT
The module is connected and active.
Blue
OFF
The module is not connected.
Yellow
CON
The module is connecting.
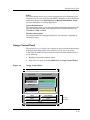
Interface Device View
This section describes the Interface icons displayed in the Interface Device
view (accessible from the device icon) and the Interface Options panel. This
view provides dynamic configuration and performance information for each
interface on this device. If the configuration changes, SPECTRUM modifies
the Device view after the next polling cycle to reflect the new configuration.
This view also provides a Device icon which allows you to monitor the device
operation and access other device-specific views. Figure 2-4 shows an example
of the Interface Device view.
Device Views
2-10
CyberSWITCH Devices (200 Series and 400)
Management Module Guide
Interface Device View
Interface Icon
Figure 2-4.
Interface Device View
Model Name of type CSX200 of Landscape VNM Host: Primary
* File
Help?
View
System Up
Network
Model
Manufacturer
Contact
Device Type
DescripLocation
Primary-Applica-
Serial Num-
Model Name
Filter
CSX200
Physical
Network Information
ADDRESS
Interface Description
Device Icon
Interface Options Panel
0.1 ON
ETHERNET
0:01:1D:2A:69:7F
132.127.118.24
0
0.2 OFF
Interface Icons
PPP
0:0:1D:2A:69:7F
0
Interface Icon
These icons represent the interfaces or ports of the device. The icons identify
the type of interface or port and provide statistical information. Figure 2-5
shows an example of an interface icon, its Icon Subviews menu, and its labels/
double-click zones.
9032231 E1
Device Views
2-11
Interface Device View
Interface Icon Labels
NOTES
The callouts (a through f) displayed in the illustration below identify the
label and the view to which it provides double-click access. Example:
Administrative Status Label/Port Configuration CSIIfPort View displays the
status of this interface and provides double-click access to the Port
Configuration CSIIfPort view.
The Icon Subviews menu displayed in the illustration is specific to the icon
selected.
Figure 2-5.
Interface Icon
(a)
(b)
Icon Subviews Menu:
Close
Navigate
Alarms
Performance
Notes...
Ctrl+c
0.1
ON
ETHERNET
Utilities
Configuration
Protocols
Model Information
(c)
0:0:1D:2A:69:7F
132.127.118.24
(d)
0
(f)
(e)
a. Interface Label
b. Administrative Status Label/Port Configuration - CSIIfPort View
c. Interface Type Label
d. MAC Address Label/CSI Interface Port Model Information View
e. Network Information Label/Network Information Dialog Box
f.
Gauge Label/Performance - CSIIfPort View
Interface Icon Labels
This section describes the labels on the Interface Icon and identifies the views
to which the labels provide double-click access.
Device Views
2-12
CyberSWITCH Devices (200 Series and 400)
Management Module Guide
Interface Device View
Interface Icon Labels
Interface Label
This label displays the interface number.
Administrative Status Label
This label displays the status of this interface. Double-click this label to open
the Port Configuration - CSIIfPort View, described on Page 3-4. To select the
application to be displayed (Physical, Bridging, or one of the Router
applications), click the Filter menu button in the Interface Options Panel. See
the Interface Options Panel described on Page 2-14 for more information on
the Filter menu button. Table 2-9, Table 2-10, and Table 2-11 list the possible
states relative to the application selected.
Table 2-9.
Administrative Status for the Physical or MIB II Application
Color
Table 2-10.
Status
Green
ON
Port is operational; Operational Status is
up.
Blue
OFF
Port is off; Operational Status is down.
Gold
OFF
Port is off; Operational Status is up.
Yellow
TST
Port is in the test mode; Operational
Status is up.
Red
TST
Port is in the test mode; Operational
Status is down.
Administrative Status for the Bridging Application
Color
9032231 E1
Description
Status
Description
Green
FWD
Bridge port is forwarding.
Blue
DIS
Port is disabled.
Magenta
LST
Bridge is in the listening mode.
Magenta
LRN
Bridge is in the learning mode.
Orange
BLK
Bridge port is in the blocking mode.
Red
BRK
Bridge port is broken.
Blue
UNK
The status is unknown.
Device Views
2-13
Interface Device View
Interface Options Panel
Table 2-11.
Administrative Status for the Routing Applications
Color
Status
Description
Green
ENA
Port is enabled.
Gray
DIS
Port is disabled.
Blue
Other
None.
Interface Type Label
This label displays the interface type.
MAC Address Label
This label displays the physical (MAC) address of the CyberSWITCH Device
interface. Double-click this label to open the CSI Interface Port Model
Information View.
Network Information Label
This label displays user-selectable network information (Address, Name, or
Mask). The default is Address. To change this label’s display, use the Interface
Options Panel, described later in this chapter. Double-click the label to open
the Network Information Panel, which displays the Name, Address, and
Mask.
Gauge Label
This label displays the performance statistic determined by the Gauge Control
Panel for this interface. See Gauge Control Panel described on Page 2-15 for
more information. Double-click this label to open the Performance view
described in the Operator’s Reference.
Interface Options Panel
This area of the Interface Device view allows you to modify the presentation of
a highlighted Logical Interface icon. Double-click a non-text area of this panel
to open the Gauge Control Panel view, described later in this section. The
Interface Options panel provides the following information:
Device Views
2-14
CyberSWITCH Devices (200 Series and 400)
Management Module Guide
Interface Device View
Gauge Control Panel
Filter
This menu button allows you to select the application to be displayed by the
interface icons. You can select Physical (MIB II), Bridging, or one of the Router
applications. Refer to the Routing Services Management Module Guide
for more information on routing applications.
Network Information
This menu button allows you to select the kind of information displayed in the
Network Information Label of the highlighted icon. Possible selections are:
ADDRESS, NAME or MASK.
Interface Description
This field describes the highlighted interface. If no interface is highlighted,
this field is empty.
Gauge Control Panel
This panel (Figure 2-6) allows you to change the type of statistical information
displayed on the Gauge label of the Interface icon. To access the Gauge
Control Panel, double-click the background of the Interface Options panel or
do the following:
1. Highlight the Interface Options panel.
2. From the View menu, select Icon Subviews -> Gauge Control Panel.
Figure 2-6.
Gauge Control Panel
Gauge Control Panel
Gauge Mode
Rates
Totals
Percentages
Gauge Type
Numeric
Linear
Selected Attribute
Load
Load In
Load Out
Packet Rate
Packet In Rate
Packet Out Rate
Error Rate
Error In Rate
Apply
Keep Settings
Reset
Close
Gauge
Buttons
Default
9032231 E1
Device Views
2-15
Interface Device View
Gauge Control Panel
The Gauge Control Panel provides the following information:
•
•
•
•
Gauge Mode
Selected Attribute
Gauge Type
Gauge Buttons
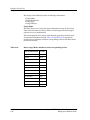
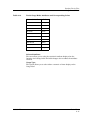
Gauge Mode
This area allows you to select the type of information shown on the Gauge
Label of the Interface icon: Rates, Totals, or Percentages. The Percentages
selection is not yet implemented.
The color displayed on the Gauge Label depends upon the particular mode
and statistical attribute selected. Table 2-12 and Table 2-13 respectively
provide a list of attributes and their corresponding colors for the Rates mode
and the Totals mode.
Table 2-12.
Rates Gauge Mode: Attributes and Corresponding Colors
Selected Attribute
Device Views
2-16
Color
Load
Green
Load In
Green
Load Out
Green
Packet Rate
Blue
In Packet Rate
Blue
Out Packet Rate
Blue
% Discard
Tan
% Filtered
Gray
% Forwarded
Violet
%Host Bound
Yellow
%Error
Orange
% Transmitted
White
CyberSWITCH Devices (200 Series and 400)
Management Module Guide
Interface Device View
Gauge Control Panel
Table 2-13.
Totals Gauge Mode: Attributes and Corresponding Colors
Selected Attribute
Color
Errors
Orange
In Packets
Blue
Out Packets
Blue
In Octets
Green
Out Octets
Green
Discards
Tan
Forwarded
Violet
Host Bound
Yellow
Transmitted
White
Filtered
Gray
Selected Attribute
This area allows you to select the statistical attribute displayed on the
Interface icon’s Gauge label. The label changes color to reflect the attribute
selected.
Gauge Type
This option allows you to select either a numeric or linear display on the
Gauge label.
9032231 E1
Device Views
2-17
Interface Device View
Gauge Buttons
The following describes the Gauge buttons:
Apply
Applies the current settings to the Gauge label temporarily but does not save
the settings.
Reset
Returns the settings to the previously saved values.
Keep Settings
Saves the current settings while SpectroGRAPH is running. The settings
return to default when you restart SpectroGRAPH.
Close
Closes the Gauge Control Panel.
Default
Returns the settings to the SPECTRUM default.
Device Views
2-18
CyberSWITCH Devices (200 Series and 400)
Management Module Guide
Chapter 3
Configuration Views
What Is in This Chapter
This chapter describes the following Configuration views available for the
CyberSWITCH Devices:
•
•
•
•
Device Configuration View
Port Configuration - CSIIfPort View
Port Configuration View - for the CSX200 Series only
Repeater Configuration View - for the CSX200 Series only
These views display network configuration and operating status as well as
network traffic flow and error rates.
See Chapter 1, Introduction, for information on Accessing SPECTRUM Views.
Refer to SPECTRUM Application View Reference for descriptions of the
following Configuration views available for the CyberSWITCH Devices:
•
•
•
•
Point-to-Point Protocol (PPP) Bridge Configuration Table
Internet Protocol (IP) Configuration view
System Configuration view
PPP Link Control Protocol (LCP) Application Configuration view
- PPP Link Status Configuration Table - Local to Remote Configuration
- PPP Link Status Configuration Table - Remote to Local Configuration
• Digital Signaling 1 (DS1) Configuration Table
9032231 E1
3-1
Device Configuration View
To access these views, do the following:
1. Within the Application view, highlight the appropriate icon.
2. From the Icon Subviews menu:
•
•
•
•
•
of the PPP_Bridge icon, select Configuration;
of the System icon, select Configuration;
of the PPP LCP icon, select Configuration;
of the IP icon, select IP Configuration;
of the DS1 icon, select DS1 Configuration Table.
Device Configuration View
This view (accessible from the device icon) provides the following
configuration and operating status of this device.
Device Configuration Information
This section of the Configuration view provides device-specific information.
Contact Status
Indicates the establishment of a connection with the device.
The view also provides the following SPMA view buttons which allow you to
configure this device. Refer to the SPECTRUM Portable Management
Application Tools Guide for details on the views accessible from these
buttons.
Component Table
Opens the Community Name window, which provides information on the
CyberSWITCH Device components.
Download Application
Opens the TFTP Download view, which enables you to upgrade the firmware
for a CyberSWITCH Device from a TFTP Boot or Bootp Server.
Trap Table
Opens the Trap Table, which allows you to set up your workstation to be
notified of traps received and sent by the CyberSWITCH Device.
Configuration Views
3-2
CyberSWITCH Devices (200 Series and 400)
Management Module Guide
Device Configuration View
Interface Configuration Table
Interface Configuration Table
This table within the Device Configuration view provides the following
configuration information for the device and each interface:
Number of Interfaces
Displays the number of interfaces available for this device.
Index
Displays the interface number.
Description
Displays a description of the interface.
Type
Displays the type of hardware interface for the port.
Bandwidth
Displays the estimated bandwidth of the interface measured in bits per
second. For interfaces that do not vary in bandwidth or when no accurate
estimate can be made, displays a nominal bandwidth.
Physical Address
Displays the MAC (physical) address of the port.
Operation Status
Displays the current operational state of this port. Possible values are: On,
Off, Test.
Admin Status
This menu button allows you to enable or disable the port or place it in test
mode. Possible selections are: On (Enable), Off (Disable), Test (Testing mode).
Last Change
Displays the System uptime value when the interface entered its current
operational state.The format is as follows: D + HH:MM:SS. For example, 1 +
20:40:25 indicates that the CyberSWITCH device has been active for one day
and 20 hours, 40 minutes and 25 seconds.
Queue Length
Displays the length of the outbound packet queue, in packets.
Packet Size
Displays the largest packet that can be transmitted or received by the port,
measured in octets.
9032231 E1
Configuration Views
3-3
Port Configuration - CSIIfPort View
Interface Configuration View
Interface Configuration View
Access this view from the Interface Configuration Table by double-clicking on
any of the fields that represents port information. This view reiterates the
information in the table but only for that single port or interface you chose by
double-clicking on a field.
Port Configuration - CSIIfPort View
This view provides port configuration and operating status of the
CyberSWITCH device and allows you to enable or disable the port selected.
To access this view, double-click the Administrative Status Label of the
interface icon within the Interface Device view, or do the following:
1. Within the Interface Device view, highlight the Interface icon.
2. From the Icon Subviews menu, select Configuration.
This view displays the following information:
Interface Index
Displays the numerical value identifying the interface or port.
Interface Type
Displays the type of interface.
Operation Status
Displays the current operating condition of the interface or port. Possible
values are: On, Off, and Test.
Admin Status
This menu button allows you to enable or disable the port or place it in test
mode. Possible selections are: On (Enable), Off (Disable), and Test (Testing
mode).
IF Description
Provides a description of the interface.
Configuration Views
3-4
CyberSWITCH Devices (200 Series and 400)
Management Module Guide
Port Configuration View - for the CSX200 Series only
Port Configuration View - for the CSX200 Series
only
This view provides port management information on the CyberSWITCH
device and allows you to enable or disable the port selected.
To access this view, double-click the Port Status Label in the Chassis Device
view, or do the following:
1. Within the Chassis Device view, highlight the Port icon.
2. From the Icon Subviews menu, select Configuration.
The view displays the following information:
Port Id
Displays the numerical value identifying the port.
Administrative Status
This menu button allows you to enable or disable the port or place it in test
mode. Possible selections are: On (Enable), Off (Disable), Test (Testing mode).
Operational Status
Displays the current operating condition of the port. Possible values are:
Operational or Not-operational.
Segmentation Status
Displays the segmentation status of the port. Possible values are: Segmented
or Not-segmented.
Link Status
Displays the current link status of the port. Possible values are: Linked or
Not-linked.
Repeater Configuration View - for the CSX200
Series only
This view provides repeater management information on the CyberSWITCH
device.
To access this view, do the following:
1. Within the CSX200 Series Application view, highlight the Ethernet 1 icon.
2. From the Icon Subviews menu select Configuration.
9032231 E1
Configuration Views
3-5
Repeater Configuration View - for the CSX200 Series only
The view displays the following information:
Port Count
Displays the number of ports including the internal repeater port.
Ports On
Displays the number of ports on or enabled.
Ports Operational
Displays the number of ports transferring packets.
Configuration Views
3-6
CyberSWITCH Devices (200 Series and 400)
Management Module Guide
Chapter 4
Event and Alarm Messages
What Is in This Chapter
This chapter lists the types of events and alarms generated by the
CyberSWITCH Devices and provides any probable cause messages
corresponding to these alarms.
CyberSWITCH 200 Series and 400 Events and
Alarms
Table 4-1 lists the SPECTRUM database directory paths (in bold) and the
messages displayed for the Event Log and Alarm Manager when applicable.
Table 4-1.
CyberSWITCH 200 Series and 400 Events and Alarms
Message in the Event Log
Alarm Manager Probable Cause
Message
CsEvFormat/ Event00010306
{d “%w- %d %m-, %Y - %T”} - A(n) {t}
device, named {m}, has been cold
started. (event [{e}])
No Probable Cause Message
CsEvFormat/Event00010307
{d “%w- %d %m-, %Y - %T”} A(n) {t}
device, named {m} has been warm
started. (event [{e}])
No Probable Cause Message
9032231 E1
4-1
CyberSWITCH 200 Series and 400 Events and Alarms
Table 4-1.
CyberSWITCH 200 Series and 400 Events and Alarms (Continued)
Alarm Manager Probable Cause
Message
Message in the Event Log
CsEvFormat/Event00010308
CsPCause/Prob00010308
{d “%w- %d %m-, %Y - %T”} A(n) {t}
device, named {m}, has detected a
communication Link Down. (event
[{e}])
Communication link is down.
CsEvFormat/Event00010309
{d “%w- %d %m-, %Y - %T”} A(n) {t}
device, named {m}, has detected a
communication Link Up. (event [{e}])
No Probable Cause Message
CsEvFormat/Event0001030a
CsPCause/Prob0001030a
{d “%w- %d %m-, %Y - %T”} A(n) {t}
device, named {m}, has detected an
Authentication Failure. (event [{e}])
Authorization failure. Other user is trying
to connect to device with an invalid
community string.
CsEvFormat/Event0001030b
CsPCause/Prob0001030b
{d “%w- %d %m-, %Y - %T”} A(n) {t}
device, named {m}, has detected an
EGP Neighbor Loss. EGP Neighbor IP
address is {O 1}. (event [{e}])
Lost contact with EGP neighbor.
CsEvFormat/Event00010810
CsPCause/Prob00010810
{d “%w- %d %m-, %Y - %T”} - RMON
rising threshold trap received from
model {m} of type {t}. AlarmIndex {I
1}, AlarmVariable {O 2},
AlarmSampleType {I 3}, AlarmValue
{I 4} and AlarmRisingThreshold {I 5}.
(event [{e}])
Remote Monitor Rising Alarm Threshold
Exceeded
CsEvFormat/Event00010811
CsPCause/Prob00010811
{d “%w- %d %m-, %Y - %T”} - RMON
falling threshold trap received from
model {m} of type {t}. AlarmIndex {I
1}, AlarmVariable {O 2},
AlarmSampleType {I 3}, AlarmValue
{I 4} and AlarmFallingThreshold {I 5}.
(event [{e}])
Remote Monitor Falling Alarm Threshold
Exceeded
Event and Alarm Messages
4-2
This trap will be generated when the
value of the trap exceeds the rising
threshold for the alarm.
This trap will be generated when the
value of the trap exceeds the falling
threshold for the alarm.
CyberSWITCH Devices (200 Series and 400)
Management Module Guide
CyberSWITCH 200 Series and 400 Events and Alarms
Table 4-1.
CyberSWITCH 200 Series and 400 Events and Alarms (Continued)
Message in the Event Log
9032231 E1
Alarm Manager Probable Cause
Message
CsEvFormat/Event00010812
CsPCause/Prob00010812
{d “%w- %d %m-, %Y - %T”} - RMON
packet match trap received from
model {m} of type {t}. Channel
description: {S 3}. Channel had {I 2}
matches. (event [{e}])
Packet Match Trap
CsEvFormat/Event000d0001
CsPCause/Prob000d0001
{d “%w- %d %m-, %Y - %T”} {m} of
type {t} has reported a root change
(event [{e}]).
This bridge has become the new root of the
Spanning Tree.
CsEvFormat/Event000d0002
CsPCause/Prob000d0002
{d “%w- %d %m-, %Y - %T”} {m} of
type {t} has reported a network
topology change (even
t [{e}]).
A port has transitioned from the Learning
state to the Forwarding state, or from the
Forwarding state to the Blocking state.
CsEvFormat/Event000d0101
CsPCause/Prob000d0101
{d “%w- %d %m-, %Y - %T”} - Port {I 3}
on module in slot {I 1} of {m} ({t}), has
segmented. (event [{e}])
The port has made 32 consecutive
attempts to transmit and which resulted
in a collision each time or the port collision
detector was turned on for longer than 2.4
milliseconds. Either of these collision
occurrences are caused by a cabling
problem of extremely high rates of traffic
on the segment the port is attached to.
CsEvFormat/Event000d0102
CsPCause/Prob000d0102
{d “%w- %d %m-, %Y - %T”} - Port {I 3}
on module in slot {I 1} of {m} ({t}), has
unsegmented. (event [{e}])
The port has transmitted or received a
valid packet. This can occur when a cable
or termination fault has been corrected.
Unsegmenting also can occur on a port
that previously was not in use.
CsEvFormat/Event000d0103
CsPCause/Prob000d0103
{d “%w- %d %m-, %Y - %T”} - Network
configuration change reported by {m}
({t}). Device linked to port {I 3} on
module in slot {I 1}. (event [{e}])
A device supporting link integrity, fiber
optic or twisted pair, has made a valid
connection (link) to this port.
This trap will be generated when a packet
is captured by a channel that is configured
for sending SNMP traps.
Event and Alarm Messages
4-3
CyberSWITCH 200 Series and 400 Events and Alarms
Table 4-1.
CyberSWITCH 200 Series and 400 Events and Alarms (Continued)
Alarm Manager Probable Cause
Message
Message in the Event Log
CsEvFormat/Event000d0104
CsPCause/Prob000d0104
{d “%w- %d %m-, %Y - %T”} - Network
configuration change reported by {m}
({t}). Device previously linked to port
{I 3} on module in slot {I 1} has ceased
to transmit link integrity pulse. (event
[{e}])
A device previously linked with this port
has been removed, powered down, or the
cable segment has a fault.
CsEvFormat/Event000d0105
CsPCause/Prob000d0105
{d “%w- %d %m-, %Y - %T”} - New
source address {X 5}, is detected on
{m} ({t}), port {I 3} of module in slot {I
1}. (event [{e}])
A device, previously linked or not, has
transmitted a packet that was received on
this port. The device is either new or has
been powered up but not transmitted a
packet with the aging time period.
CsEvFormat/Event000d0106
CsPCause/Prob000d0106
{d “%w- %d %m-, %Y - %T”} - Source
address {X 5}, has timed out on port {I
3} of the module in slot {I 1} of {m}
({t}). (event [{e}])
A device linked or not linked to this port
has not transmitted a packet during the
aging time period, and has been removed
from the source address table of the
device.
CsEvFormat/Event000d0107
CsPCause/Prob000d0107
{d “%w- %d %m-, %Y - %T”} - Device
configuration change reported by {m}
({t}). The module in slot {I 1} has been
removed. (event [{e}])
A module within this hub has been
removed or has failed.
CsEvFormat/Event000d0108
CsPCause/Prob000d0108
{d “%w- %d %m-, %Y - %T”} - Device
configuration change reported by {m}
({t}), An (EPIM) has been inserted into
slot {I 1} of the MMAC. (event [{e}])
A module has been inserted into this hub.
CsEvFormat/Event000d010a
CsPCause/Prob000d010a
{d “%w- %d %m-, %Y - %T”} - Network
configuration change reported by {m}
({t}). Port {I 3} in slot {I 1} has now
become active as the result of a
redundancy poll failure. (event [{e}])
The polled device has been communicated
with via a backup port and the port is now
active. The other ports in this redundant
circuit are now designated as backup and
are turned off to prevent data loops on the
network.
Event and Alarm Messages
4-4
CyberSWITCH Devices (200 Series and 400)
Management Module Guide
CyberSWITCH 200 Series and 400 Events and Alarms
Table 4-1.
CyberSWITCH 200 Series and 400 Events and Alarms (Continued)
Message in the Event Log
CsEvFormat/Event000d010b
CsPCause/Prob000d010b
{d “%w- %d %m-, %Y - %T”} Redundancy diagnostics of {m} ({t}),
indicate that the redundant link for
module {I 1}, port {I 3} has failed.
(event [{e}])
The cable segment connected to the port
has a cable fault. This should be checked
for continuity as soon as possible in case
the other ports in this redundant circuit
fail and this port is needed.
CsEvFormat/Event000d010f
CsPCause/Prob000d010f
{d “%w- %d %m-, %Y - %T”} - User
defined traffic threshold - {I 1} packets
within {I 3} seconds, exceeded on
module {I 5} of {m} ({t}). (event [{e}])
The packet rate on this module has
exceeded user defined limits. The device(s)
attached to this module may have an
application which requires a large amount
of network bandwidth. If the application
requires a large amount of bandwidth, a
bridge or router could be used to logically
separate various network segments. Use
port level thresholds to further
troubleshoot to a device level.
CsEvFormat/Event000d0110
CsPCause/Prob000d0110
{d “%w- %d %m-, %Y - %T”} - Error
threshold exceeded. An error
threshold, of {I 1}% of total packets in
{I 5} seconds, exceeded on module in
slot {I 7}. (event [{e}])
9032231 E1
Alarm Manager Probable Cause
Message
This threshold will indicate that a
malfunctioning device is present on this
module or that a cable fault exists. A port
level threshold should be set to further
troubleshoot to the offending node.
CsEvFormat/Event000d0111
CsPCause/Prob000d0111
{d “%w- %d %m-, %Y - %T”} - Collision
threshold exceeded. The number of
collisions per total packets within the
time base of {I 3} seconds has been
exceeded on the module in slot {I 5} of
{m} ({t}). (event [{e}])
Collisions are caused by many nodes
contending for the network or cabling
faults. Use port level thresholds to further
troubleshoot to a device level.
CsEvFormat/Event000d0112
CsPCause/Prob000d0112
{d “%w- %d %m-, %Y - %T”} - Traffic
threshold, {I 1} packets per {I 3}
seconds, exceeded on port {I 7} on
module in slot {I 5} of {m} ({t}). (event
[{e}])
The device(s) attached to this port may
have an application which requires a large
amount of network bandwidth. If the
application requires a large amount of
bandwidth, a bridge or router could be
used to logically separate various network
segments.
Event and Alarm Messages
4-5
CyberSWITCH 200 Series and 400 Events and Alarms
Table 4-1.
CyberSWITCH 200 Series and 400 Events and Alarms (Continued)
Alarm Manager Probable Cause
Message
Message in the Event Log
CsEvFormat/Event000d0113
CsPCause/Prob000d0113
{d “%w- %d %m-, %Y - %T”} - Error
threshold exceeded. An error
threshold, of {I 1}% of total packets in
{I 5} seconds, exceeded on port {I 9} on
module in slot {I 7} of {m} ({t}). (event
[{e}])
The device(s) attached to this port could
have a hardware failure where it
transmits invalid packets, or the cable
segment attached to this port may have a
problem. Check cable for loose connection
or continuity problems.
CsEvFormat/Event000d0114
CsPCause/Prob000d0114
{d “%w- %d %m-, %Y - %T”} - Collision
threshold exceeded. The number of
collisions per total packets within the
time base of {I 3} seconds has been
exceeded on port {I 7} on module in
slot {I 5} of {m} ({t}). (event [{e}])
The device(s) attached to this port may
have an adapter card problem which
causes them to transmit without
regarding network availability, or a cable
problem may exist. Check adapter card
and cable for loose connections,
termination problems, or improper
pinouts.
CsEvFormat/Event000d0115
CsPCause/Prob000d0115
{d “%w- %d %m-, %Y - %T”} - Port
Topology type changed. Port {I 3} of
module in slot {I 1} has changed from
{T PrtTopoStatus 5} port on {m} ({t}).
(event [{e}])
The number of addresses in the source
address table has changed. If three or
more addresses are learned on a port for
one aging time period, the port is
designated as a trunk port. A port
connecting two hubs or a coax segment
with multiple taps are examples of trunk
ports. If a port has one address in the
source address table for one aging time,
the port is designated as a station port. An
example of a station port would be a
twisted pair “home run” to a PC.
CsEvFormat/Event000d0117
CsPCause/Prob000d0117
{d “%w- %d %m-, %Y - %T”} - Port
security violation has occurred, MAC
address {X 5} has been detected on
port {I 3} of module in slot {I 1} of {m}
({t}). (event [{e}])
This event is only generated when the hub
has port locking enabled. When a hub is
locked, the source MAC addresses are
learned on each port. When a port detects
an attached device has changed its
address, the device will note that the new
address is not in the source address table.
This will disable and lock the port, which
then transmits this trap. This trap would
be generated if an adapter were replaced
or if an intruder attempted to access the
network.
Event and Alarm Messages
4-6
CyberSWITCH Devices (200 Series and 400)
Management Module Guide
CyberSWITCH 200 Series and 400 Events and Alarms
Table 4-1.
CyberSWITCH 200 Series and 400 Events and Alarms (Continued)
Message in the Event Log
9032231 E1
Alarm Manager Probable Cause
Message
CsEvFormat/Event000d0118
CsPCause/Prob000d0118
{d “%w- %d %m-, %Y - %T”} - Port
violation reset, port {I 3} of module in
slot {I 1} of {m} ({t}). (event [{e}])
The network administrator has located
the offending device that caused the port
violation, and has re-enabled the port for
use by the original network address for
that port.
CsEvFormat/Event000d0119
CsPCause/Prob000d0119
{d “%w- %d %m-, %Y - %T”} Environment Temperature Warm
condition for module in slot {I 1}
reported by {m} ({t}). (event [{e}])
The module may be defective or a fan has
failed in the chassis. Check the alarm log
for this device for any fan alarms.
CsEvFormat/Event000d011a
CsPCause/Prob000d011a
{d “%w- %d %m-, %Y - %T”} Environment Temperature Hot
condition for module in slot {I 1}
reported by {m} ({t}). (event [{e}])
A module may be defective or a fan has
failed in the chassis. This alarm indicates
a serious heat condition and should be
addressed immediately.
CsEvFormat/Event000d011b
CsPCause/Prob000d011b
{d “%w- %d %m-, %Y - %T”} Environment Voltage Low condition
has been detected by power supply in
slot {I 1} of {m} ({t}). (event [{e}])
The internal voltage of the power supply
module is low. The voltage low condition
indicates that either the supply itself is
defective or an AC power failure has
occurred into the power supply module.
CsEvFormat/Event000d011c
CsPCause/Prob000d011c
{d “%w- %d %m-, %Y - %T”} Environment Temperature Normal
condition for module in slot {I 1}
reported by {m} ({t}). (event [{e}])
A chassis or cooling system problem at
this device’s location has been corrected.
CsEvFormat/Event000d011d
CsPCause/Prob000d011d
{d “%w- %d %m-, %Y - %T”} Environment Voltage Normal
condition has been detected by power
supply in slot {I 1} of {m} ({t}). (event
[{e}])
The problem with the power supply
module or AC power feed has been
corrected and the unit is now functioning
normally.
Event and Alarm Messages
4-7
CyberSWITCH 200 Series and 400 Events and Alarms
Table 4-1.
CyberSWITCH 200 Series and 400 Events and Alarms (Continued)
Alarm Manager Probable Cause
Message
Message in the Event Log
CsEvFormat/Event000d011e
CsPCause/Prob000d011e
{d “%w- %d %m-, %Y - %T”} - A fan in
the system’s chassis has failed or is
operating at an abnormal RPM rate,
has been detected by {m} ({t}). (event
[{e}])
Either one or more fans in the fan tray
assembly have failed, or the fan tray has
been removed. The situation is not critical,
but temperature warm and temperature
hot traps may follow. If the temperature
traps have appeared in the alarm log, the
failure should be addressed before
overheating damages the device.
CsEvFormat/Event000d011f
CsPCause/Prob000d011f
{d “%w- %d %m-, %Y - %T”} - A fan in
the system’s chassis has resumed
normal operation, has been detected
by {m} ({t}). (event [{e}])
The problem previously detected with the
fan assembly has been corrected and the
unit is now functioning normally.
CsEvFormat/Event000d0121
CsPCause/Prob000d0121
{d “%w- %d %m-, %Y - %T”} Broadcast threshold exceeded {I 1}
total packets in {I 3} seconds on the
module in slot {I 5} of {m} ({t}). (event
[{e}]
MODULE BROADCAST THRESHOLD
EXCEEDED
CsEvFormat/Event000d0122
CsPCause/Prob000d0122
{d “%w- %d %m-, %Y - %T”} Broadcast threshold exceeded {I 1}
total packets in {I 3} seconds on port {I
7} on the module in slot {I 5} of {m}
({t}). (event [{e}])
PORT BROADCAST THRESHOLD
EXCEEDED
CsEvFormat/Event000d0125
CsPCause/Prob000d0125
{d “%w- %d %m-, %Y - %T”} - System
Voltage Low condition has been
detected by {m} ({t}). (event [{e}])
The internal 5 volt line of the system is
low. The voltage low condition indicates
that either the power supplies are failing
or there is not enough power available to
the host modules. This is a serious
condition and should be addressed
immediately.
CsEvFormat/Event000d0126
CsPCause/Prob000d0126
{d “%w- %d %m-, %Y - %T”} - System
Voltage Normal condition has been
detected by {m} ({t}). (event [{e}])
The problem with the internal 5 volt line
of the system has been corrected. The
system voltage condition has returned to
normal.
Event and Alarm Messages
4-8
This trap will be generated when the
broadcast (packets per time interval) has
been exceeded for the given module.
This trap will be generated when the
broadcast (packets per time interval) has
been exceeded for the given port.
CyberSWITCH Devices (200 Series and 400)
Management Module Guide
CyberSWITCH 200 Series and 400 Events and Alarms
Table 4-1.
CyberSWITCH 200 Series and 400 Events and Alarms (Continued)
Message in the Event Log
9032231 E1
Alarm Manager Probable Cause
Message
CsEvFormat/Event000d0127
CsPCause/Prob000d0127
{d “%w- %d %m-, %Y - %T”} - An
EPIM has been removed from port {I
3} on module in slot {I 1} of {m} ({t}).
(event [{e}])
An Ethernet Port Interface Module
(EPIM) has been physically removed.
CsEvFormat/Event000d0128
CsPCause/Prob000d0128
{d “%w- %d %m-, %Y - %T”} - An
(EPIM) has been inserted into port {I
3} on module in slot {I 1} of {m} ({t}).
(event [{e}])
An Ethernet Port Interface Module
(EPIM) has been physically inserted.
CsEvFormat/Event000d0129
CsPCause/Prob000d0129
{d “%w- %d %m-, %Y - %T”} - Traffic
threshold, {I 1} packets per {I 3}
seconds, exceeded on the repeater
network {I 5} of {m} ({t}). (event [{e}])
The device(s) attached to this channel may
have an application level problem. The
attached devices may be operating
properly, but the application requires a
large amount of network bandwidth. If the
application requires a large amount of
bandwidth, a bridge or router may be used
to logically separate various network
segments. This trap indicates that module
or port level thresholds on this repeater
channel are needed to pinpoint high
bandwidth users.
CsEvFormat/Event000d0130
CsPCause/Prob000d0130
{d “%w- %d %m-, %Y - %T”} - Error
threshold exceeded. An error
threshold, of {I 1}% total packets in {I
5} seconds, exceeded on repeater
network {I 7} of {m} ({t}). (event [{e}])
A user defined threshold has been
exceeded on this channel. This threshold
could indicate that a malfunctioning
device is present on this channel or that a
cable fault exists. A module or port level
threshold should be set to further
troubleshoot to the offending node.
Event and Alarm Messages
4-9
CyberSWITCH 200 Series and 400 Events and Alarms
Table 4-1.
CyberSWITCH 200 Series and 400 Events and Alarms (Continued)
Alarm Manager Probable Cause
Message
Message in the Event Log
CsEvFormat/Event000d0131
CsPCause/Prob000d0131
{d “%w- %d %m-, %Y - %T”} - Collision
threshold exceeded. The number of
collisions per total packets within the
time base of {I 3} seconds has been
exceeded on repeater network {I 5} of
{m} ({t}). (event [{e}])
A user defined threshold has been
exceeded on this channel. This threshold
could indicate that a malfunctioning
device is present on this channel, or that a
cable fault exists. Collisions are usually
caused by many nodes contending for the
network. As traffic rates increase, the
collision rate usually follows. Therefore, if
this channel has a high bandwidth
utilization, a high collision rate is not
unlikely. Use module and port level
thresholds to further troubleshoot to a
device level.
CsEvFormat/Event000d0132
CsPCause/Prob000d0132
{d “%w- %d %m-, %Y - %T”} - Network
port security is {T LockStatus 1} on
repeater network {I 3} of {m} ({t}).
(event [{e}])
The network administrator has changed
the status of port locking for this repeater
channel. The security feature locks all
ports on this repeater channel so that only
a valid user already in the source address
table can access the network.
CsEvFormat/Event000d0133
CsPCause/Prob000d0133
{d “%w- %d %m-, %Y - %T”} Broadcast threshold exceeded {I 1}
total packets in {I 3} seconds on
repeater network {I 5} of {m} ({t}).
(event [{e}])
REPEATER BROADCAST THRESHOLD
EXCEEDED
CsEvFormat/Event000d0135
CsPCause/Prob000d0135
{d “%w- %d %m-, %Y - %T”} - Port
Security Status is {T LockStatus 3} for
port #{I 2}, located in port group #{I 1}
of {m} ({t}). (event [{e}])
PORT SECURITY STATUS
CsEvFormat/Event000d0136
CsPCause/Prob000d0136
{d “%w- %d %m-, %Y - %T”} - Device
configuration change reported by {m}
({t}). A module has been inserted into
slot {I 1}. (event [{e}])
A module has been inserted into this hub.
Event and Alarm Messages
4-10
This trap will be generated when the
broadcast (packets per time interval) has
been exceeded for the repeater.
This alarm is generated when a change in
the lock status for a particular port occurs.
CyberSWITCH Devices (200 Series and 400)
Management Module Guide
CyberSWITCH 200 Series and 400 Events and Alarms
Table 4-1.
CyberSWITCH 200 Series and 400 Events and Alarms (Continued)
Message in the Event Log
Alarm Manager Probable Cause
Message
CsEvFormat/Event000d0137
CsPCause/Prob000d0137
{d “%w- %d %m-, %Y - %T”} Alternate
Path Repeater Management has been
enabled for {m} of type {t} Network
Address Synchronized to {O 1}. (event [{e}])
ALTERNATE PATH REPEATER
MANAGEMENT HAS BEEN ENABLED
PROBABLE CAUSE:
Alternate Path Repeater Management
functionality has been enabled for this
repeater model.
RECOMMENDED ACTIONS:
1) Check event log to obtain newly
synchronized Network address.
2) If repeater model is not associated with
a routing device this functionality should
be disabled.
CsEvFormat/Event000d0138
CsPCause/Prob000d0138
{d “%w- %d %m-, %Y - %T”} Alternate
Path Repeater Management has been
enabled for {m} of type {t} No Network
Address Synchronization. - (event
[{e}])
ALTERNATE PATH REPEATER
MANAGEMENT HAS BEEN ENABLED
PROBABLE CAUSE:
Alternate Path Repeater Management
functionality has been enabled for this
repeater model.
RECOMMENDED ACTIONS:
Check the device’s network address. The
repeater model was unable to synchronize
to the device’s network address.
9032231 E1
Event and Alarm Messages
4-11
CyberSWITCH 200 Series and 400 Events and Alarms
Table 4-1.
CyberSWITCH 200 Series and 400 Events and Alarms (Continued)
Alarm Manager Probable Cause
Message
Message in the Event Log
CsEvFormat/Event000d0139
CsPCause/Prob000d0139
{d “%w- %d %m-, %Y - %T”} Alternate
Path Repeater Management has been
disabled for {m} of type {t} Network
Address Synchronized to {O 1}. (event [{e}])
ALTERNATE PATH REPEATER
MANAGEMENT HAS BEEN DISABLED
PROBABLE CAUSE:
Alternate Path Repeater Management
functionality has been disabled for this
repeater model.
RECOMMENDED ACTIONS:
1) If associated with a routing device, reenable functionality to provide
management path redundancy.
2) Make sure the newly synchronized
network address is accessible.
CsEvFormat/Event000d013a
CsPCause/Prob000d013a
{d “%w- %d %m-, %Y - %T”} Alternate
Path Repeater Management has been
disabled for {m} of type {t} No Network
Address Synchronization. - (event
[{e}])
ALTERNATE PATH REPEATER
MANAGEMENT HAS BEEN DISABLED
PROBABLE CAUSE:
Alternate Path Repeater Management
functionality has been disabled for this
repeater model.
RECOMMENDED ACTIONS:
1) If associated with a routing device reenable functionality to provide
management path redundancy.
2) No address resynchronization could
take place. Check for existence of original
interface IP address.
Event and Alarm Messages
4-12
CyberSWITCH Devices (200 Series and 400)
Management Module Guide
CyberSWITCH 200 Series and 400 Events and Alarms
Table 4-1.
CyberSWITCH 200 Series and 400 Events and Alarms (Continued)
Message in the Event Log
Alarm Manager Probable Cause
Message
CsEvFormat/Event000d013b
CsPCause/Prob000d013b
{d “%w- %d %m-, %Y - %T”} Alternate
Path Repeater Management has
activated for {m} of type {t} Network
Address changed from {O 1} to {O 2}. (event [{e}])
ALTERNATE PATH REPEATER
MANAGEMENT ACTIVATED
PROBABLE CAUSE:
Router Redundancy for the managing
device model has probably activated.
RECOMMENDED ACTIONS:
1) Refer to event log for current IP address
used for modeling.
2) Check the subnet and address that was
previously being used to model the
associated device.
9032231 E1
CsEvFormat/Event000d1139
CsPCause/Prob000d1139
{d “%w- %d %m-, %Y - %T”} - Port
Security Status is {T SecureState 3}
for port #{I 2}, located in port group
#{I 1} of {m} ({t}). (event [{e}])
Secured State Change
CsEvFormat/Event000d113a
CsPCause/Prob000d113a
{d “%w- %d %m-, %Y - %T”} - Network
Learning Status is {T LearnState 2}
for the network interface #{I 1} of {m}
({t}). (event [{e}])
Network Learn State
CsEvFormat/Event000d113b
CsPCause/Prob000d113b
{d “%w- %d %m-, %Y - %T”} - Port
Group Learning Status is {T
LearnState 2} for the port group #{I 1}
of {m} ({t}). (event [{e}])
Port Group Learn State
This alarm is generated when the status of
the secure state changes for a specific port.
This alarm is generated when network
learning is reset. When learning is reset,
all secure addresses on each port, within
the network, will be deleted and ports will
learn source addresses again.
This alarm is generated when a port
group’s learning is reset. When learning is
reset, all secure addresses on each port,
within a port group, will be deleted and
ports will learn source addresses again.
Event and Alarm Messages
4-13
CyberSWITCH 200 Series and 400 Events and Alarms
Table 4-1.
CyberSWITCH 200 Series and 400 Events and Alarms (Continued)
Alarm Manager Probable Cause
Message
Message in the Event Log
CsEvFormat/Event000d113c
CsPCause/Prob000d113c
{d “%w- %d %m-, %Y - %T”} - Port
Learning Status is {T LearnState 3}
for the port #{I 2}, located in port
group {I 1} of {m} ({t}). (event [{e}])
Port Learn State
CsEvFormat/Event000d113d
CsPCause/Prob000d113d
{d “%w- %d %m-, %Y - %T”} - Network
Learning Mode is {T LearnMode 2} for
the network interface #{I 1} of {m}
({t}). (event [{e}])
Network Learn Mode
CsEvFormat/Event000d113e
CsPCause/Prob000d113e
{d “%w- %d %m-, %Y - %T”} - Port
Group Learning Mode is {T
LearnMode 2} for the port group #{I 1}
of {m} ({t}). (event [{e}])
Port Group Learn Mode
CsEvFormat/Event000d113f
CsPCause/Prob000d113f
{d “%w- %d %m-, %Y - %T”} - Port
Learning Mode is {T LearnMode 3} for
the port #{I 2}, located in port group {I
1} of {m} ({t}). (event [{e}])
Port Learn Mode
This alarm is generated when a port’s
learning is reset. When learning is reset,
all secure addresses on the port will be
deleted and the port will learn source
addresses again.
This alarm is generated when network
learning mode is changed between onetime learn mode and continuous learn
mode.
This alarm is generated when a port
group’s learning mode is changed between
one-time learn mode and continuous learn
mode.
This alarm is generated when a port’s
learning mode is changed between onetime learn mode and continuous learn
mode.
CsEvFormat/Event00830000
{d “%w- %d %m-, %Y - %T”} DLM
LostContact trap for Destination
Address {O 1}, Owner Address {O 2}
from {t} device, named {m}. (event
[{e}])
Event and Alarm Messages
4-14
No Probable Cause Message
CyberSWITCH Devices (200 Series and 400)
Management Module Guide
CyberSWITCH 200 Series and 400 Events and Alarms
Table 4-1.
CyberSWITCH 200 Series and 400 Events and Alarms (Continued)
Message in the Event Log
Alarm Manager Probable Cause
Message
CsEvFormat/Event00830001
{d “%w- %d %m-, %Y - %T”} DLM
Threshold Trap for Destination
Address {O 1}, Owner {O 2}, OID
sequence {I 3}, OID Object {O 4} from
{t} device, named {m}. (event [{e}])
No Probable Cause Message
CsEvFormat/Event00830002
{d “%w- %d %m-, %Y - %T”} DLM
ReestabContact Trap for Destination
Address {O 1}, Owner Address {O 2}
from {t} device, named {m}. (event
[{e}])
9032231 E1
No Probable Cause Message
Event and Alarm Messages
4-15
CyberSWITCH 200 Series and 400 Events and Alarms
Event and Alarm Messages
4-16
CyberSWITCH Devices (200 Series and 400)
Management Module Guide
Chapter 5
Application View
What Is in This Chapter
This chapter describes the following device-specific applications for the
CyberSWITCH Devices (CSX200 Series and CSX400):
• DownLoad Application
• Ethernet 1 Application - for CSX200 Series only
The Application view allows you to access increasingly detailed views of
network information for the applications supported by this device.
Common Applications
These devices support the following common applications which are described
in the Application View Reference:
• Bridging (CSIBridge)
- Enet SDB (Ct_BdgEnet_App)
- PPP_Bridge (PPP_BdgApp1474)
- Spanning Tree (Ct_Stp_App)
- Static (Static_App)
- Transparent (Transparnt_App)
• MIB-II (SNMP2_Agent)
- ICMP (ICMP_App)
- IP (IP2_App)
- System (System2_App)
- UDP (UDP2_App)
• PPP (PPP_LCPApp1471)
9032231 E1
5-1
Device Application View
• RS-232 (CtWANAppRS232)
- RS-232sync (RFC1317sync)
• WAN (CtWANApp)
• DS1 (CtWANAppDS1)
• Frame Relay (rfc1315App)
These devices also support the following major applications which are
described in their management module guides:
• CtRouter (CtRouterApp) described in the Routing Services
Management Module Guide
- IP Routing (CtIP2App)
- IPX Routing (CtIpxApp)
- IP RIP (CtIpRipApp)
- IPX RIP (CtIpxRipApp)
- IPX SAP (CtIpxSapApp)
Device Application View
This view (accessible from the device icon) shows the common and devicespecific applications supported by these devices and provides access to
application-specific information.
See Chapter 1, Introduction, for information on Accessing SPECTRUM Views.
Figure 5-1 shows an example of an Application view in the icon mode.
Figure 5-2 shows an example of an Application view in the list mode.
To change the display mode, from the View menu, select Mode -> List or
Icon.
Application View
5-2
CyberSWITCH Devices (200 Series and 400)
Management Module Guide
Device Application View
Figure 5-1.
Device Application View (Icon Mode)
Model Name of type CSX200 of Landscape VNMHost: Primary
*
File
View
Help?
Net Addr
Model Name
Sys Up Time
Contact
Manufacturer
Description
Device Type
Location
Prime-App
Serial Number
Model Name
CSX200
Bridging
CSIBridge
Enet SDB
Ethernet 1
MIB-II
CsEnetRptrMgt
SNMP2_Agent
CsEnetRptrMgt
SNMP2_Agent
DownLoad App
PPP
CtDownLoad
PPP_LCPApp
CtDownLoad
PPP_LCPApp
ICMP
ICMP_App
CT_BdgEne t_App
ICMP_App
PPP_Bridge
IP
IP2_App
PPP_BdgApp
9032231 E1
IP2_App
Application View
5-3
Device Application View
Figure 5-2.
Device Application View (List Mode)
Model Name of type CSX200 of Landscape VNMHost: Primary
*
File
View
Model Name
Help?
Net Addr
Sys Up Time
Contact
Manufacturer
Description
Device Type
Location
Prime-App
Serial Number
CSX200
CtRouterApp
CtIP2App
CtIpRipApp
CtIpxApp
CtIpxRipApp
CtIpxSapApp
CSIBridge
CT_BdgEnet_App
PPP_BdgApp1474
CT_Stp_App
Static_App
CT_Tp_Appl
CsEnetRptrMgt
SNMP2_Agent
ICMP_App
IP2_App
System2_App
Application View
5-4
CyberSWITCH Devices (200 Series and 400)
Management Module Guide
DownLoad Application
DownLoad Application
This application provides download functionality for these devices. The
application type name for this application is CtDownLoadApp. To access the
Download Application view, do the following:
1. Within the Application view, highlight the CtDownLoadApp icon (icon
mode) or application name (list mode).
2. From the Icon Subviews menu, select Download Application.
The Download Application is an SPMA view which is described in the
SPECTRUM Portable Management Application Tools Guide.
Ethernet 1 Application - for CSX200 Series only
This application provides repeater and management functionality for this
device. The application type name for this application is CsEnetRptrMgt.
Table 5-1 describes each of the Icon Subviews menu selections available
through this application.
Table 5-1.
Ethernet 1 Application Icon Subviews Menu
Menu Selection
9032231 E1
Description
DevTop
Opens the Device Topology view described in the
Operator’s Reference.
Acknowledge
Acknowledges a status change for an icon; stops flashing
color.
Configuration
Opens the Repeater Configuration View - for the CSX200
Series only described on Page 3-5.
Model Information
Opens the Repeater Model Information view described in
the Operator’s Reference.
Application View
5-5
Ethernet 1 Application - for CSX200 Series only
Application View
5-6
CyberSWITCH Devices (200 Series and 400)
Management Module Guide
Index
A
Accessing
device-specific subviews 1-3
Icon Subviews menu 1-3
SPECTRUM views 1-2
views 1-2
Admin Status 3-3, 3-4
disable 3-3, 3-4, 3-5
enable 3-3, 3-4, 3-5
Administrative Status 3-5
Bridging application 2-13
blue 2-13
green 2-13
magenta 2-13
orange 2-13
red 2-13
Physical application 2-13
blue 2-13
gold 2-13
green 2-13
red 2-13
yellow 2-13
Routing applications 2-14
blue 2-14
gray 2-14
green 2-14
Administrative Status Label 2-12, 2-13
Alarm 4-1
Alarm Manager Probable Cause
Messages 4-1
Application
Bridging 5-1
CSIBridge (application type
name) 5-1
Enet SDB 5-1
PPP_Bridge 5-1
Spanning Tree 5-1
Static 5-1
Transparent 5-1
Bridging - Enet SDB
Ct_BdgEnet_App (application type
name) 5-1
Bridging - PPP_Bridge
PPP_BdgApp1474 5-1
Bridging - Spanning Tree
Ct_Stp_App 5-1
Bridging - Static
Static_App 5-1
Bridging - Transparent
Transparnt_App 5-1
CtRouter 5-2
CtRouterApp 5-2
IP RIP 5-2
IP Routing 5-2
IPX RIP 5-2
IPX Routing 5-2
IPX SAP 5-2
CtRouter - IP RIP
CtIpRipApp 5-2
CtRouter - IP Routing
CtIP2App 5-2
CtRouter - IPX RIP
CtIpxRipApp 5-2
CtRouter - IPX Routing
CtIpxApp 5-2
CtRouter - IPX SAP
CtIpxSapApp 5-2
DS1 5-2
CtWANAppDS1 5-2
Frame Relay 5-2
rfc1315App 5-2
MIB-II 5-1
ICMP 5-1
Interface Status 2-9
IP 5-1
SNMP2_Agent (application type
name) 5-1
System 5-1
UDP 5-1
MIB-II - ICMP
ICMP_App 5-1
MIB-II - IP
IP2_App 5-1
MIB-II - System
System2_App 5-1
MIB-II - UDP
9032231 E1
1
UDP2_App 5-1
Physical
Interface Status 2-9
PPP 5-1
PPP_LCPApp1471 5-1
Routing
Interface Status 2-9
RS-232 5-2
CtWANAppRS232 5-2
RS-232sync 5-2
RS-232 - RS-232sync
RFC1317sync 5-2
WAN 5-2
CtWANApp 5-2
Application Label 2-4, 2-7
double-click access to
CSI Bridge Interface
Performance 2-6
CSIIf Port Performance 2-5
CtRouter Performance 2-5
IP RIP Performance 2-5
IP Routing Performance 2-5
IPX RIP Performance 2-5
IPX RIP System Configuration 2-5
IPX Routing Performance 2-5
IPX Routing System
Configuration 2-5
IPX SAP Interface
Configuration 2-6
IPX SAP Performance 2-6
Application type name
CsEnetRptrMgt 5-5
CSIBridge 5-1
Ct_BdgEnet_App 5-1
Ct_Stp_App 5-1
CtDownLoadApp 5-5
CtIP2App 5-2
CtIpRipApp 5-2
CtIpxApp 5-2
CtIpxRipApp 5-2
CtIpxSapApp 5-2
CtRouterApp 5-2
CtWANApp 5-2
CtWANAppDS1 5-2
CtWANAppRS232 5-2
ICMP_App 5-1
IP2_App 5-1
PPP_BdgApp1474 5-1
PPP_LCPApp1471 5-1
rfc1315App 5-2
Index
2
RFC1317sync 5-2
SNMP2_Agent 5-1
Static_App 5-1
System2_App 5-1
Transparnt_App 5-1
UDP2_App 5-1
Application view 5-1
Common Applications 5-1
Device Application view 5-2
Download Application 5-5
Applications 2-5
B
Bandwidth 3-3
Blue. See Colors
Bridge Detail view 2-7
Bridge Performance view 2-7
Bridging 5-1
Enet SDB 5-1
PPP_Bridge 5-1
Spanning Tree 5-1
Static 5-1
Transparent 5-1
Bridging application
Administrative Status 2-13
Interface Status 2-9
Bridging Application Icon Subviews
menu 2-7
menu selections 2-7
Bridge Detail 2-7
Bridge Model Information 2-7
Bridge Performance 2-7
Spanning Tree Information 2-7
Special Database 2-7
Static Database Table 2-7
Transparent Bridge Info 2-7
Button
Apply 2-18
Close 2-18
Component Table 3-2
Default 2-18
Download Application 3-2
Keep Settings 2-18
Reset 2-18
Trap Table 3-2
Buttons x
CyberSWITCH Devices (200 Series and 400)
Management Module Guide
C
Callouts 2-4, 2-12
Chassis Device view 2-1
CSX200 Series 2-2
Device icon 2-4
Application Label 2-4
Device Identification Label 2-4
Interface Label 2-4
Interface Number Label 2-4
Interface Status Label 2-4
Port Label 2-4
Port Number Label 2-4
Port Status Label 2-4
Device Icon labels 2-6
Colors
blue
Administrative Status for Bridging
application 2-13
Administrative Status for Physical
application 2-13
Administrative Status for Routing
applications 2-14
Gauge Mode - Rates 2-16
Gauge Mode - Totals 2-17
Interface Status for Bridging
application 2-9
Interface Status for Physical
application 2-9
Interface Status for Routing
applications 2-9
Port Status 2-10
gold
Administrative Status for Physical
application 2-13
Interface Status for Physical
application 2-9
gray
Administrative Status for Routing
applications 2-14
Gauge Mode - Rates 2-16
Gauge Mode - Totals 2-17
Interface Status for Routing
applications 2-9
green
Administrative Status for Bridging
application 2-13
Administrative Status for Physical
application 2-13
Administrative Status for Routing
9032231 E1
applications 2-14
Gauge Mode - Rates 2-16
Gauge Mode - Totals 2-17
Interface Status for Bridging
application 2-9
Interface Status for Physical
application 2-9
Interface Status for Routing
applications 2-9
Port Status 2-10
magenta
Administrative Status for Bridging
application 2-13
Interface Status for Bridging
application 2-9
orange
Administrative Status for Bridging
application 2-13
Gauge Mode - Rates 2-16
Gauge Mode - Totals 2-17
Interface Status for Bridging
application 2-9
red
Administrative Status for Bridging
application 2-13
Administrative Status for Physical
application 2-13
Interface Status for Bridging
application 2-9
Interface Status for Physical
application 2-9
tan
Gauge Mode - Rates 2-16
Gauge Mode - Totals 2-17
violet
Gauge Mode - Rates 2-16
Gauge Mode - Totals 2-17
white
Gauge Mode - Rates 2-16
Gauge Mode - Totals 2-17
yellow
Administrative Status for Physical
application 2-13
Gauge Mode - Rates 2-16
Gauge Mode - Totals 2-17
Interface Status for Physical
application 2-9
Port Status 2-10
Common Applications 5-1
Configuration view 3-1
Index
3
Device Configuration view 3-2
DS1 Configuration Table
View
DS1 Configuration Table 3-1
IP Configuration view 3-1
Port Configuration - CSIIfPort view 3-4
Port Configuration view 3-5
PPP Bridge Configuration Table 3-1
PPP LCP Application Configuration
view 3-1
Repeater Configuration view 3-5
Contact Status 3-2
Conventions x
CsEnetRptrMgt 5-5
CsEvFormat 4-1 to 4-15
CSI Interface Port Model Information
view 2-12, 2-14
CSIBridge 5-1
CSIIf Port Performance view 2-8
CsPCause 4-2 to 4-14
Ct_BdgEnet_App 5-1
Ct_Stp_App 5-1
CtDownLoadApp 5-5
CtIP2App 5-2
CtIpRipApp 5-2
CtIpxApp 5-2
CtIpxRipApp 5-2
CtIpxSapApp 5-2
CtRouter 5-2
IP RIP 5-2
IP Routing 5-2
IPX RIP 5-2
IPX Routing 5-2
IPX SAP 5-2
CtRouterApp 5-2
CtWANApp 5-2
CtWANAppDS1 5-2
CtWANAppRS232 5-2
CyberSWITCH 200 series 1-1
CyberSWITCH 400 1-1
Chassis Device view 2-3
CyberSWITCH devices 1-1
D
Description 3-3
Device 5-4
Device Application view 5-2
Icon mode 5-3
List mode 5-4
Index
4
Device Configuration Information 3-2
Contact Status 3-2
Device Configuration view 2-6, 3-2
Device Configuration Information 3-2
Contact Status 3-2
Interface Configuration Table 3-3
Off (Disable) 3-3
On (Enable) 3-3
Test (Testing Mode) 3-3
Port Configuration - CSIIFPort view
Off (Disable) 3-4
Port Configuration - CSIIfPort view
On (Enable) 3-4
Test (Testing Mode) 3-4
Port Configuration view
Off (Disable) 3-5
On (Enable) 3-5
Test (Testing Mode) 3-5
Device icon 2-4
Application Label 2-4
Device Identification Label 2-4
Interface Label 2-4
Interface Number Label 2-4
Interface Status Label 2-4
Port Label 2-4
Port Number Label 2-4
Port Status Label 2-4
Device Icon labels 2-6
Application Label 2-7
Device Identification Label 2-6
Interface Label 2-8
Interface Number Label 2-8
Interface Status Label 2-8
Port Label 2-9
Port Number Label 2-10
Port Status Label 2-10
Device Icon Subviews menu 2-6
menu selections 2-6
Application Display 2-7
Configuration 2-6
Model Information 2-6
Module Notes 2-7
Device Identification Label 2-4, 2-6
Device view
Chassis 2-1
Interface 2-10, 2-11
Dialog box 2-7, 2-8
Network Information 2-12
Digital Signaling 1. See DS1
Disable port 2-8, 3-3, 3-4, 3-5
CyberSWITCH Devices (200 Series and 400)
Management Module Guide
Double-click access
from Application Label
CSI Bridge Interface
Performance 2-6
IPX RIP Interface Configuration 2-5
IPX Routing System
Configuration 2-5
IPX SAP Interface
Configuration 2-6
from Interface Status Label
CSIIf Port Performance 2-5
CtRouter Performance 2-5
IP RIP Performance 2-5
IP Routing Performance 2-5
IPX RIP Performance 2-5
IPX Routing Performance 2-5
IPX SAP Performance 2-6
Double-click zones 1-2
Download Application 5-5
DS1 5-2
DS1 Configuration Table 3-1
E
Enable port 2-8, 3-3, 3-4, 3-5
Ethernet 1 MgtRptr Port Label view 2-4
Ethernet 1 MgtRptrPort view 2-10
Ethernet repeater ports 2-9
Ethernet Special Database Table 2-7
Event 4-1
Event Log Messages 4-1
Events and Alarms 4-1
F
Filter 2-15
Filter Information Table 2-7
Frame Relay 5-2
G
Gauge Buttons 2-18
Apply 2-18
Close 2-18
Default 2-18
Keep Settings 2-18
Reset 2-18
Gauge Control Panel 2-15
Gage Mode - Rates
9032231 E1
blue 2-16
gray 2-16
green 2-16
orange 2-16
tan 2-16
violet 2-16
white 2-16
yellow 2-16
Gage Mode - Totals
blue 2-17
gray 2-17
green 2-17
orange 2-17
tan 2-17
violet 2-17
white 2-17
yellow 2-17
Gauge Buttons 2-18
Apply 2-18
Close 2-18
Default 2-18
Keep Settings 2-18
Reset 2-18
Gauge Mode 2-16
Rates Gauge Mode 2-16
Totals Gauge Mode 2-17
Gauge Type 2-17
Selected Attribute 2-17
Gauge Control Panel view 2-14, 2-15
Gauge Label 2-12, 2-14, 2-15
Gauge Mode 2-16
Rates
blue 2-16
gray 2-16
green 2-16
orange 2-16
tan 2-16
violet 2-16
yellow 2-16
Rates Gauge Mode 2-16
Totals
blue 2-17
gray 2-17
green 2-17
orange 2-17
tan 2-17
violet 2-17
white 2-17
yellow 2-17
Totals Gauge Mode 2-17
Index
5
Gauge Type 2-17
Getting Help xi
Gold. See Colors
Gray. See Colors
Green. See Colors
I
ICMP_App 5-1
Icon Subviews menu
accessing 1-3
accessing views 1-3
Bridging Application 2-7
Device icon 2-6
Device icon labels 2-4 to 2-7
Ethernet 1 Application 5-5
Interface icon 2-12
Router Applications 2-8
IF Description 3-4
Index 3-3
Interface
Icon 2-12
Number 2-12
Interface Configuration Table 3-3
Admin Status 3-3
disable 3-3
enable 3-3
Bandwidth 3-3
Description 3-3
Index 3-3
Last Change 3-3
Number of Interfaces 3-3
Off (Disable) 3-3
On (Enable) 3-3
Operation Status 3-3
Packet Size 3-3
Physical Address 3-3
Queue Length 3-3
Test (Testing Mode) 3-3
Type 3-3
Interface Description 2-15
Interface Device view 2-10, 2-11
Interface icon 2-11, 2-12
Administrative Status Label 2-12,
2-13
Gauge Label 2-12, 2-14, 2-15
Interface Label 2-12, 2-13
Interface Type Label 2-12, 2-14
MAC Address Label 2-12, 2-14
Network Information Label 2-14
Index
6
Interface Icon labels 2-12
Interface Options Panel 2-14
Filter 2-15
Gauge Control Panel 2-15
Interface Description 2-15
Network Information 2-15
Network Information Panel 2-14
Interface icon 2-11, 2-12, 2-14
Administrative Status Label 2-12, 2-13
Gauge Label 2-12, 2-14, 2-15
Icon Subviews menu 2-12
Interface Label 2-12, 2-13
Interface Type Label 2-12, 2-14
MAC Address Label 2-12, 2-14
Network Information Label 2-14
Interface Icon labels 2-12
Interface Index 3-4
Interface Label 2-4, 2-8, 2-12, 2-13
disable port 2-8
enable port 2-8
Interface Number Label 2-8
Interface Status Label 2-8
Interface Number Label 2-4, 2-8
Interface Options Panel 2-14
Filter 2-15
Gauge Control Panel 2-15
Gauge Buttons 2-18
Gauge Mode 2-16
Gauge Type 2-17
Selected Attribute 2-17
Interface Description 2-15
Network Information 2-15
Network Information Panel 2-14
Interface Status
Bridging application 2-9
blue 2-9
green 2-9
magenta 2-9
orange 2-9
red 2-9
Physical application 2-9
blue 2-9
gold 2-9
green 2-9
red 2-9
yellow 2-9
Routing applications 2-9
blue 2-9
gray 2-9
green 2-9
CyberSWITCH Devices (200 Series and 400)
Management Module Guide
Interface Status Label 2-4, 2-8
Interface Type 3-4
Interface Type Label 2-12, 2-14
Internet Protocol. See IP
IP Configuration view 3-1
IP2_App 5-1
L
Last Change 3-3
Link Control Protocol. See LCP
Link Status 3-5
Logical Bridging Access Label 2-7
Logical Module
Chassis 1-3
M
MAC Address Label 2-12, 2-14
Magenta. See Colors
Menu navigation x
Messages
Alarm Manager 4-1
Event Log 4-1
MIB II application. See Physical application
MIB-II 5-1
ICMP 5-1
IP 5-1
System 5-1
UDP 5-1
Model Information view 2-6, 2-7, 2-8
Model type name
CSX200 1-2
CSX400 1-2
N
Network Information 2-15
Address 2-15
Mask 2-15
Name 2-15
Network Information Dialog Box 2-12
Network Information Label 2-14
Network Information Panel 2-14
Notice i
Number 3-3
Number of Interfaces 3-3
9032231 E1
O
Off (Disable) 3-3, 3-4, 3-5
On (Enable) 3-3, 3-4, 3-5
Oper Status 3-3
Operation Status 3-3, 3-4
Operational Status 3-5
Orange. See Colors
Order Number i
P
Packet Size 3-3
Performance - CSIIfPort view 2-12
Performance view 2-14
Physical Address 3-3
Physical application
Administrative Status 2-13
Point-to-Point Protocol. See PPP
Port Configuration - CSIIfPort View
Interface Index 3-4
Test (Testing Mode) 3-4
Port Configuration - CSIIfPort view 2-12,
2-13, 3-4
Admin Status 3-4
disable 3-4
enable 3-4
off 3-4
on 3-4
test 3-4
IF Description 3-4
Off (Disable) 3-4
On (Enable) 3-4
Port Configuration /- CSIIfPort view
Interface Type 3-4
Operation Status 3-4
Port Configuration view 2-4, 2-10, 3-5
Admin Status
disable 3-5
enable 3-5
Administrative Status 3-5
Link Status 3-5
Off (Disable) 3-5
On (Enable) 3-5
Operational Status 3-5
Port Id 3-5
Segmentation Status 3-5
Test (Testing Mode) 3-5
Port Count 3-6
Port Id 3-5
Index
7
Port Label 2-4, 2-9
Port Number Label 2-10
Port Status Label 2-10
Port Management
Administrative Status 3-5
Link Status 3-5
Operational Status 3-5
Port Id 3-5
Segmentation Status 3-5
Port Number Label 2-4, 2-10
Port Status 2-10
blue 2-10
green 2-10
yellow 2-10
Port Status Label 2-4, 2-10
Ports On 3-6
Ports Operational 3-6
PPP 5-1
PPP Bridge Configuration Table 3-1
PPP LCP Application Configuration
view 3-1
PPP Link Status Configuration
Table 3-1
PPP Link Status Configuration Table 3-1
local to remote configuration 3-1
remote to local configuration 3-1
PPP_BdgApp1474 5-1
PPP_LCPApp1471 5-1
Probable Cause Messages 4-1
Q
Queue Length 3-3
R
Rates Gauge Mode 2-16
Red. See Colors
Related Reading x, xi
Repeater Configuration view 3-5
Port Count 3-6
Ports On 3-6
Ports Operational 3-6
Restricted Rights Notice ii
rfc1315App 5-2
RFC1317sync 5-2
Roadmap 1-4
SPECTRUM
roadmap of views 1-4
Index
8
Router Applications Icon Subviews
menu 2-8
menu selections 2-8
Basic Configuration 2-8
Configuration 2-8
Model Information 2-8
Routing applications
Administrative Status 2-14
Routing Performance view 2-8
RS/232 5-2
RS-232
RS-232sync 5-2
S
Segmentation Status 3-5
Selected Attribute 2-17
SNMP2_Agent 5-1
Spanning Tree Information view 2-7
SPECTRUM
accessing 1-2
roadmap of views 1-4
support 1-2
views
roadmap 1-4
SPECTRUM Portable Management
Application 1-5
SPMA 1-5
Applications view 1-5
Download Application 5-5
SPMA support 1-5
SPMA view
buttons
Component Table 3-2
Download Application 3-2
Trap Table 3-2
Static Database Table view 2-7
Static_App 5-1
System Configuration - IP Routing view 2-7
System2_App 5-1
T
Table
Ethernet Special Database 2-7
Filter Information 2-7
Tan. See Colors
TCP/IP Based Networks xi
Test (Testing Mode) 3-3, 3-4, 3-5
CyberSWITCH Devices (200 Series and 400)
Management Module Guide
Totals Gauge Mode 2-17
Trademarks i
Transparent Bridge Information view 2-7
Transparnt_App 5-1
Type 3-3
U
UDP2_App 5-1
Using double-click zones 1-2
V
View
accessing
Bridge Detail 2-7
Bridge Performance 2-7
CSI Bridge Interface
Performance 2-6
CSI Interface Port Model
Information 2-12, 2-14
CSIIf Port Performance 2-5, 2-8
CtRouter Performance 2-5
Device Configuration 2-6
Ethernet 1 MgtRptr Port Label 2-4
Gauge Control Panel 2-14, 2-15
IP RIP Performance 2-5
IP Routing Performance 2-5
IPX RIP Interface Configuration 2-5
IPX RIP Performance 2-5
IPX Routing Performance 2-5
IPX Routing System
Configuration 2-5
IPX SAP Interface
Configuration 2-6
IPX SAP Performance 2-6
Model Information 2-6, 2-7, 2-8
Notes for Ethernet 1
MgtRptrPort 2-10
Performance 2-14
Performance - CSIIf Port 2-12
Port Configuration 2-10
Port Configuration - CSIIfPort 2-12,
2-13
Routing Performance 2-8
Spanning Tree Information 2-7
Static Database Table 2-7
System Configuration - IP
Routing 2-7
9032231 E1
Transparent Bridge Information 2-7
Application 5-1
Configuration 3-1
Device Application 5-2
Icon Mode 5-3
List Mode 5-4
Device Configuration 3-2
Download Application 5-5
Ethernet 1 MgtRptr Port Label 2-4
IP Configuration 3-1
Port Configuration 3-5
Port Configuration - CSIIfPort 3-4
PPP Bridge Configuration Table 3-1
PPP LCP Application Configuration 3-1
Repeater Configuration 3-5
SPMA Download Application 5-5
Violet. See Colors
Virus Disclaimer i
W
WAN 5-2
White 2-16
White. See Colors
Y
Yellow. See Colors
Index
9