1
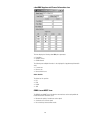
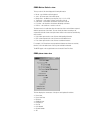
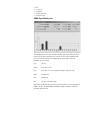
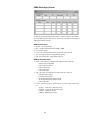
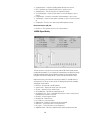
Agilent E6474A
cdmaOne/cdma2000/1xEV-DO
Wireless Network
Optimization Platform
Data Sheet
The Agilent Technologies E6474A Network Optimization Platform is a scalable, integrated,
air interface measurement system. This system is used to support integration and
maintenance of networks, obtaining comprehensive call performance measurements and
quantifying the end-user’s experience for both voice and data. The system includes
extensive cdmaOne, cdma2000 and 1xEV-DO measurements as described in this
document. Depending on the selected hardware options, the E6474A system can make
measurements on various frequency bands including cellular band, PCS band, JCDMA
band, KCDMA band and IMT band. A PC interfaces to a maximum of four mobile devices
and 4 digital receivers for simultaneous data, trace and network independent receiver
measurements. System software controls the phones to make and record user selected
cmda2000 and 1xEV-DO measurements and phone overhead messaging.
The Agilent CDMA digital receiver can be used in conjunction with the E6474A allowing
correlation of RF and phone measurements. A GPS receiver, which is integral to the
Agilent receivers, used to obtain positioning information that is collated with the
measurement results. The system can also be configured for use with a pen tablet
computer for indoor measurements without GPS. Logged data can be exported to
mapping software for analysis.
About this document
This document gives detailed information on features accessible on the E6474A
cdmaOne, cdma2000 and 1xEV-DO drive test system and associated software and
hardware options.
2
cdmaOne, cdma2000 and1xEV-DO Overview
System Software
The E6474A system software is a user-friendly Microsoft Windows-based application
designed to reside on a laptop. Through a selection of licensing options it is possible to
configure the software to provide cdmaOne, cdma2000 and 1xEV-DO phone-based
measurements, CDMA receiver based measurements and wireless data measurements.
With the multiple phone measurements license it is possible for the system to control up
to four test mobile phones simultaneously (two for simultaneous data and trace). It is
possible to expand your system at any time by adding software licenses or hardware to
the base product. Multiple measurements can be made simultaneously. All the
measurements can be displayed in real-time and logged to a database. Indoor
measurement capability, without the need for GPS navigation, can be added by selecting
the indoor measurements software license option. Refer to the E6474A Wireless Network
Optimization Platform configuration guide, literature number 5988-2396EN, for detailed
option information.
3
E6474A Wireless Network Optimization Platform cdmaOne, cdma2000 and 1xEV-DO
options
Option 010: multiple mobile device software license
Option 030: indoor measurement software license
Option 070: TechTool – RF data and GPS logging
Option 071: TechTool – alarming capability
Option 072: Tech Tool – CDMA/cdma2000 CAI messaging
Option 090: E74xx to E6474A software upgrade
Option 100: cdmaOne mobile phone measurement software license
Option 101: cdma2000 mobile phone measurement software license
Option 111: cdma2000 receiver measurement software license
Option 120: combined cdmaOne receiver and mobile phone measurement software
license
Option 121: combined cdma2000 receiver and mobile phone measurement software
license
Option 126: cdmaOne to cdma2000 phone measurement software license upgrade
Option 130: cdmaOne TechTool software license
Option 131: cdma2000 TechTool software license
Option 135: cdma2000 to 1xEV-DO AT measurement software license upgrade
Option 136: cdma2000 to 1xEV-DO receiver measurement software license upgrade
Option 700: cdma2000 data measurement client software license
Option 710: cdma2000 data measurement server software license
Option 740: Wireless Application Measurement Software (WAMS)
NOTE: The cdma2000 Licenses provide access to cdmaOne measurements.
Measurement software
The system software allows phone measurements with a single mobile phone or wireless
PC Card with software license E6474-100, 101, 120 or 121. If multiple phone control is
required, Option 010 adds multiple device capability to Options 100, 101, 120 or 121 for
control of up to four mobiles for multiple user scenarios or for benchmarking of two or
more networks.
Option 126 is a cdmaOne to cdma2000 phone measurement upgrade for those with an
existing Option 100 or 120 CDMA phone measurements software license.
Option 131, the cdma2000 TechTool software license, is a subset of the phone-based
software license that allows the user to view measurements real-time; however, the
TechTool software license does not include alarms, the ability to view layer 3 messaging,
and the ability to record data.
Option 135 is a cdma2000 to 1xEV-DO phone measurement upgrade for those with
existing Option 101 or 121 cdma2000 phone measurement software licenses.
Options 070, 071 and 072 adds logging capabilities, alarming, and Layer 3 messaging,
respectively, to the option 131 TechTool software license.
Options 700 and 710 client server software provides generic data test capability for any
technology. These two software licenses provide the ability to send know data types and
make throughput and BER measurements. Option 740 provides application layer wireless
data test measurement capability that works in coordination with the RF measurements
to give the user insight into both the RF and Core network environments.
4
cdmaOne and cdma2000 Measurement Views
A number of different views are available from the view menu to enable the display of
measured or calculated data. The views should be arranged within the main window
before starting data collection or testing, although they can be opened and closed during
a test. This section gives details of the views associated with:
cmdaOne phone measurements
cdma2000 phone measurements
1xEV-DO phone measurements
cdmaOne/cmda2000/1xEV-DO receiver measurements
Common platform measurement features will be discussed in a subsequent section.
5
Phone Based Measurements
The E6474A software provides phone or PC Card based measurements for cdmaOne,
cdma2000 and 1xEV-DO handsets or wireless PC Cards and is fully backward compatible
with IS-95 handsets. The E6474A phone based measurements options provide 3 primary
elements:
Call setup
Phone measurements
Layer 3 messaging
Call setup
Call setup is divided into two main pieces –dialing setup and log mask setup. The
appropriate control view for the dialing and log mask setup can be accessed by rightclicking on the specific device within the System Setup view. This will bring up the CDMA
Properties view. For cdma20000 the CDMA Properties view has five tabs as follows:
Autodial Setup, Dip Switches, Log Mask, CDMA2000 Log Mask and Enables.
Autodial setup
The dialing setup is divided between the autodial setup tab view and the dip switches tab
view within the CDMA properties view. The autodial setup provides automated control of
the handset. The Autodial Setup view provides the functions listed below.
AutoDial – enables automatic dialing
Call Statistics – logs attempted calls, blocked calls, dropped calls
Automatically Set PC Clock – automatically sets PC clock to GPS timer
Immediate Dial – if a call is dropped, the next call will be placed after waiting for the
specified idle time
Continuous Call – enable this check box to make one continuous call during a test -to end the call, end the test
Call Type pick list
- Default
- EVRC
6
- Loopback (13k)
- Loopback (IS-126)
- Markov (13k)
- Markov (8k)
- Markov (old 8k)
- TDSO
- Voice (13k)
- Voice (IS-96)
- Voice (IS-96A)
Call Duration – length of the call
Idle Time – time between calls
Call Setup – maximum time allowed to make the connection
Number to call – for a digital phone, enter the number to be dialed. For an analog
phone, enter the speed-dial memory location that contains the number to be dialed.
In answer mode, enter the phone number of the phone being called.
MOST Testing – the MOST testing view is designed to automate base station testing
within the Lucent infrastructure
Call Scripting – this lets you input a sequence of different voice calls to be made
FER Averaging
This option allows you to select how many frames are used in the rolling average used in
determining the FER. The range of values is 50 to 500
Dip switches
The following options can be chosen within the dip switches tab :
Turn off slotted mode operator
if checked, continuous monitoring of the paging channel will occur (default)
if unchecked, monitoring in slotted mode occurs
Forward Link Scrambling Disable
if checked, no calls can be placed or received, because the phone does not decode
the paging channel
if unchecked, the phone operates normally
Forward Link Puncturing Disable
7
if checked, the phone’s Tx power will not vary as the BTS transmit power decreases,
because the phone stops decoding the power control bit
if unchecked, the phone operates normally
Sounder Mode
if checked, after the first call is placed and ended, only Sync channel messages will
be received – no further calls can be placed or received
if unchecked, the phone operates normally
Force Reverse Link Voice to Full Rate
if checked, transmit vocoder rates are set to the full rate, regardless of the voice
activity
if unchecked, the phone operates normally
Log mask
The E6474A system extracts measurement data from the mobile handset. Extraction of
the specific measurement type is controlled by a set of check boxes within the log mask
tab, cdma2000 log mask tab and enables tab within the CDMA Properties view for the
mobile phone.
The log mask tab enables the logging of the following items:
AGC Power Control – power control messages
Access Channel Message – all access channel signaling messages sent
Reverse Channel Traffic Message – all reverse Traffic Channel signaling messages
sent
Sync Channel Message – all Sync Channel Messages sent
Paging Channel Message – all Paging Channel signaling messages received
Forward Channel Traffic Message – all Forward Traffic Channel signaling messages
received
Use Extended Log Mask Format check box. This option must be checked in order to
retrieve cdma2000 log mask items. This option also enables the streaming message
option of the phone. Keep this option checked while collecting data with any
cdma2000 phone or PC Card
8
Markov Statistics – Markov rate and error data
Vocoder Error Mask – vocoder rate and data with bit errors detected
Analog Voice Channel – analog mode data – SID, Channel, RSSI, etc.
Access Probe Info – Sequence Number, Probe Number, Receive AGC, Tx Gain Adjust,
etc.
cdma2000 log mask
The cdma2000 log mask tab enables the logging of the following items:
Forward Link Frame Types
Reverse Link Frame Types
Fast Forward Power Control
Reverse Power Control
Searcher And Finger Info
Service Configurations
Active Set And Channel Configurations
RLP Statistics
Quick Paging Channel
IS-802 Reverse Link
RLP Rx Frames
RLP Tx Frames
Important: The Use Extended Log Mask check box must be checked on the Log Mask tab
to have the ability to log cdma2000 data.
9
Enables
The Enables tab allows you to select the data to be collected and displayed in the Pilot
Set and Temporal Analyzer views. Unselected data items will not be collected or stored,
and therefore will not be available for playback or analysis.
Pilot Set Data
Enables collection of pilot set data for display in the Pilot Set view. Log data is not
affected by the setting of this check box.
TA (Temporal Analyzer) Control
Select the Pilot Set Members that you want to log. The pilots that are checked can also
be displayed in the TA Graph view. The choices are: Active, Candidate, Neighbor, and
Remaining set members.
Note: Searcher Information 2 messages are only collected for the Pilot Set Members that
are enabled. If no Set Members are enabled, no Searcher Information 2 messages will be
collected.
Log Record (for QLC Export) when checked logs the Qualcomm© binary files to the
E6474A database for export to post processing tools.
10
cdmaOne/cdma2000 Phone Views
The logged phone measurements made by the E6474A system can be seen within
several phone measurement views. The views that show CDMA/cdma2000 phone
measurements are:
CDMA Frame Error Rate
CDMA IS-95B SCHInfo (supplemental channel info)
CDMA Layer 3 Messages
CDMA Lucent MOST
CDMA Markov Statistics
CDMA Phone Status
CDMA Physical Layer Info
CDMA pilot sets
CDMA Power Control
CDMA Quick Paging channel
CDMA Rx and Tx Vocoder
CDMA RxTx Power
CDMA Signal Quality
CDMA Signal Strength
CDMA Signal Strength
Active PN
CDMA TA Graph
CDMA Tx Gain Adj
cdma2000 PC_PL
cdma2000 RLP Info
cdma2000 RLP Statistics
cdma2000 SCH Info (supplemental channel info)
cdma2000 SCH_FCH
cdma2000 Service Configurations
Call Statistics
CDMA Physical Layer Info
This view displays frame error rate information for the forward and reverse channels. For
the Forward link fundamental channel (FCH), supplementary channel 0 (SCH0), and
11
supplementary channel 1 (SCH1), the following values are listed:
Frames Rcvd – the number of frames received
Frames in Error – the number of frames received for which errors occurred
Error Rate – the percentage of errors calculated as the total number of Frames in
Error divided by the total number of frames received
Frame Rate – The number of frames received per second between each update for
FCH, SCH0, and SCH1
For Reverse link the following values are displayed for the fundamental channel (FCH),
supplemental channel 0 (SCH0) and supplemental channel 1 (SCH1):
Frames Rcvd – the number of frames received
Frame Rate – The number of frames received per second between each update for
FCH, SCH0, and SCH1
CDMA IS-95B supplementary channel info view
This view displays the Walsh code for the fundamental channel and up to seven
supplementary channels. It displays the following:
Number of supplementary channels
Channel Walsh codes
- Fundamental
- Supplemental
12
cdma2000 Supplemental Channel Information view
This view displays the following cdma2000 phone parameters:
Band Class
Number of Pilots
CDMA Channel
The following rate multiplier information is also displayed for Supplementary Channels 0
and 1:
Forward rate
Reverse rate
Reverse Walsh cover
Active Set Info
The Active Set Info provides:
PN
FCH
DCCH
SCH
CDMA Lucent MOST view
The CDMA Lucent MOST view is designed to automate base station testing within the
Lucent infrastructure and allows you to:
Measure the quality of certain base station signals
Automate access to these signals
Record and report measurement results
13
CDMA Markov Statistics view
This top section of this view displays the following information:
Mode – type of Markov call being placed
State – the current state of the mobile phone
Markov Rate – the Markov processing rate (1/8, 1/4, 1/2 or Full)
Total Frames – total number of frames received for each call
Bad Frames – total number of bad frames received for each call
Error Rate – the calculation of bad frames divided by total frames
Bit Error – the total bit error count for each call
The bottom section is a table that shows the actual rate of the received frame compared
with the expected rate of the frame. The rows classify the frames according to the
expected rate and the columns classify the frames based on the actual rate at which they
were received.
Bsig column represents the count of frames with signaling information
Fberr column represents the count of frames received with bit errors
Eras column represents the count of frames received with erasures
For example, if a Full rate frame was expected and a Quarter rate frame was received,
then the count in the third column of the top row would be incremented.
The M-FER graph on the top right hand corner shows the Frame Error Rate.
CDMA phone status view
This view displays the current status of the phone and is updated in real time.
Phone State
Phone State Data
RF Mode
CDMA Rx State
Entry Reason
Pilot PN
Code Channel
Channel Number
SID
14
NID
Location ID
Analog RSSI
Analog Power Index
Analog SAT Code
CDMA Signal Quality view
This view displays the phone state, channel information, power levels, FER and an Ec/Io
graph of the PNs that are detected by the searcher. The Ec/Io value is displayed at the
top of each column. Six-way PNs are displayed if the system supports them. The
following is the color scheme.
Color
Pilot PN
Yellow
Active PN on a call
Cyan
Active PN not in use (for systems that support six-way PNs only)
Green
Candidate PN
Blue
Neighbor PN
Red
PN values over the threshold
Right clicking on the graph lets you set an Ec/Io threshold value for closer examination of
Neighbor Set PNs. The Signal Quality view will then display all neighbor set PNs that
exceed this threshold in red.
15
CDMA Quick Paging Channel
The General TA w/Supplemental Channel check box must be enabled on the Log Mask
tab of the CDMA Properties dialog box. This feature only works with phones that support
supplemental channel messages.
QPCH General Channel
Channel – the channel number
Rate – the Quick Paging Channel Rate (4800 or 9600)
PN – the Pilot number
Power Level – the Quick Paging channel power level, expressed in dB
THI – the erasure threshold for Paging Indicator decision.
THB – the bit threshold for Paging Indicator decision.
QPCH Bit Information Status
Status – status values associated with each indicator bit entry. Values are:
- Indicator Entry Not Applicable
- Indicator Bit Not Detected
- Indicator Bit Detected
- Indicator Bit Erasure
- Indicator Bit Invalid
Type – type values associated with each indicator bit entry. Values are:
- PI (Paging Indicator) Bit #1
- PI (Paging Indicator) Bit #2
- CCI (Configuration Change Indicator) Bit #1
- CCI (Configuration Change Indicator) Bit #2
- Indicator Bit Invalid
Position – indicator bit position. This information is not valid for types of CCI. Values
are:
- SD IEngy – soft decision I channel bit energy
- SD QEngy – soft decision Q channel bit energy
- PI IEngy – I channel pilot energy
- PI QEngy – Q Channel pilot energy
16
CDMA Signal Strength
This view displays the following signal information when a Qualcomm phone is in CDMA
mode.
Rx Power
Tx Power
Tx Gain Adjust
FER – frame erasure rate
Rx Vocoder Rate
Tx Vocoder Rate
Aggregate Ec/Io – the sum of the Ec/Io of the fingers, calculated only when at least
one finger is locked
Handoff State
Finger info – displays the following data for up to three fingers, or for up to four
fingers for newer Qualcomm phones
- PN – the PN number
- Ec/Io – the signal strength of the PN
- Sector – the finger’s sector in Active Set assignment, displayed in hex
- Position – the absolute finger position, displayed in hex
Call Statistics
The Call Stats view shows the call connection, termination classifications and counts, as
well as call progress messages for a system with multiple phones. Each device is
represented by its own column in a spreadsheet view.
17
Technology – technology of the device
Label – shows device label
Total – total calls attempted
Good – number of good calls
Blocked – number of blocked calls
Dropped – number of dropped calls
No Service – number of no service calls (shows the total number of calls that could
not be placed or completed due to the loss of network service)
No Comm – number of no communication calls
Progress – indicates call progress in seconds
cdma2000 Service Configurations
The following information is displayed in this view for a cdma2000 phone:
Service Option – service option for the current call
Fwd Chnl Radio Cnfg – radio configuration for the forward channel, values 1-9
Rev Chnl Radio Cnfg – radio configuration for the reverse channel, values 1-9
FWD_SCH0_RC – radio configuration for the forward supplemental channel 0,
values 1-9
REV_SCH0_RC – radio configuration for the reverse supplemental channel 0, values
1-9
FWD_SCH1_RC – radio configuration for the forward supplemental channel 1,
values 1-9
REV_SCH1_RC radio configuration for the reverse supplemental channel 1, values 19
F_DCCH_RC – radio configuration for the forward dedicated control channel, values
18
1-9
R_DCCH_RC – radio configuration for the reverse dedicated control channel, values
1-9
FCH Frame Size – frame size on FCH: 20, 40 or 80 ms
DCCH Frame Size – frame size on DCCH: 20, 40 or 80 ms
Fwd Traffic Chnl Type – forward channel traffic type
Rev Traffic Chnl Type – reverse channel traffic type
Fwd Mux Option – forward multiplex option
Rev Mux Option – reverse multiplex option
Fwd Chnl Rate – forward fundamental channel transmission rates: Full, 1/2, 1/4, 1/8
Rev Chnl Rate – reverse fundamental channel transmission rates: Full, 1/2, 1/4, 1/8
Num Fwd SCH – number of active forward supplementary channels
Num Rev SCH – number of active reverse supplementary channels
Fwd SCH0 ID – forward supplemental channel 0 identifier
Rev SCH0 ID – reverse supplemental channel 0 identifier
Fwd SCH0 Mux – forward supplemental channel 0 multiplex option
Rev SCH0 – reverse supplemental channel 0
Fwd SCH0 – forward supplemental channel 0
Rev SCH0 Mux – reverse supplemental channel 0 multiplex option
Fwd SCH1 ID – forward supplemental channel 1 identifier
Rev SCH1 ID – reverse supplemental channel 1 identifier
Fwd SCH1 Mux – forward supplemental channel 0 multiplex option
Rev SCH1 Mux – reverse supplemental channel 0 multiplex option
Rev SCH1 – reverse supplemental channel 1
Fwd SCH1 – forward supplemental channel 1
19
cdma2000 RLP statistics
The radio link protocol, RLP, is a negative acknowledgement-based (Nack) protocol. This
greatly reduces transmission errors over error-prone wireless links and therefore allows
TCP protocol to function of wireless links. RLP statistics are key parameters that highlight
the signal quality of the wireless link. These statistics are essential to identify and resolve
data integrity issues within the air interface. The cdma2000 RLP Statistics view gives the
following RLP information:
General info
Service ID – service identification number
Last Round Trip Delay – last round-trip time measurement
Aborts – number of Nack aborts
RLP Block Used:
0 – not received;
1 – specified Nack scheme;
2 – specified RTT (roundtrip time);
3 – specified RTT and Nack scheme
Resets – number of resets
Re Xmits Not Found – number of retransmitted frames not found
Nacks Rcvd – number of negative acknowledgement frames received
Largest Consecutive Erasure – largest block of consecutive erasures
Received Counts
ReXmits Frame – number of received retransmitted frames
Idle Frame – number of received idle frames
20
Fill Frame – number of received fill frames
Blank Frame – number of received blank frames
Null Frame – number of received null frames
New Data Frame – total number of received new data frames
20ms Frame – number of received Fundamental data frames
Total Bytes – total number of received bytes
RLP Erasures – number of radio link protocol erasures received
Mux Erasures – number of multiplexer erasures received
Avg Fwd Throughput – average forward through put in Kbps
Inst Fwd Throughput – instantaneous forward throughput in Kbps
Transmitted Counts
ReXmits Frame – number of transmitted retransmitted frames
Idle Frame – number of transmitted idle frames
New Data Frame – total number of transmitted new data frames
20ms Frame – number of transmitted fundamental data frames
Total Bytes – total number of transmitted bytes
Avg Rev Throughput – average reverse through put in Kbps
Inst Rev Throughput – instantaneous reverse throughput in Kbps
CDMA TA Graph
This view provides a graphic representation of the signals being tracked by the CDMA or
cdma2000 phones and is updated in real time.
CDMA RxTx Power View - Line graph displays
Rx and Tx Power – this view displays the received power and transmitted power over
time. The Rx power trace is displayed in red and the Tx power trace is displayed in
cyan.
Both traces appear on the same graph.
Rx and Tx Vocoder – this view displays the transmit and receive rate of the voice
encoder signal over time. Both traces appear on the same graph. The receive
vocoder rate is displayed in red and the transmit vocoder rate is displayed in cyan.
Tx Gain Adjust – this view displays the Tx gain adjustment power levels during data
collection.
CDMA Frame Erasure Rate – the FER view displays the calculated frame error rate
21
(FER) as a percentage of steady state errors over time. The range is 0 to 5%.
CAI messaging
The E6474A system extracts and decodes over-head messaging from the handset. The
cdma2000 messages are contained in the message groups listed below.
Message groups
Access
Paging
Sync
- Forward traffic
- Reverse traffic
When the message display is paused, the user can double-click on any message group to
show the next level of detail. Individual protocol messages can be selected to be decoded
in a separate message window.
The Properties dialog box allows you to control which common air interface (CAI)
messages are displayed in the CDMA CAI Messages view. This capability enables the
filtering of message groups for specific messages you want displayed. You can also
change the font, size and color of the message text.
To open it, click the Properties… button in the CDMA CAI Messages view. This dialog box
also enables pop-up views or "message boxes" that display all of the messages of one
type.
Note: Messages must be enabled on the Log Mask tab and in the CAI Message Filter
Properties dialog box in order to display them in the CAI Messages view.
22
1xEV-DO High Data Rate Phone Measurements
Software Option 135, an upgrade of existing cdma2000 phone measurements supports
the latest high data rate technology 1xEV-DO. This option requires both cdma2000 and
1xEV-DO software license since the technology supports hybrid mode. Hybrid mode
supports wireless devices that can handoff the data session between the 1xEV-DO and
cdma2000 network elements. Option 135 provides multiple views to monitor the session,
connection, RF and data parameters of the user on both the forward and reverse link.
CDMA Properties for 1xEV-DO Devices
For 1xEV-DO devices, the CDMA Properties view has an addition tab for setting the
1xEVDO Log Mask in addition to the cdma2000 properties.
1xEVDO Access Terminal Info
The Access Terminal Info view provides information on the hardware and firmware in the
Access Terminal (AT).
Version Number
Release Data – date of the formal release of the chipset firmware
AT Station Class Mark – provides a slotted/nonslotted indicator
AT common air interface (CAI) revision
AT Model – manufacturers mobile model number
AT Firmware revision – revision number of the AT’s firmware
Slot Cycle Index – reports the slot cycle index used for paging the AT
23
AT Modem Rev – reports the revision of the mobile station modem of the AT.
Status
CDMA State – current cdma RX process state
ESN – serial number of AT
IMSE – CDMA MIN1 of current NAM
RF Mode – current RF mode
CDMA Channel – current channel number
CDMA Code – code channel prior to handoff direction message
Current PN – PN of current cell
System ID – current system ID
Network ID – current network ID
State Information
AT State – state of access terminal; inactive, acquisition, sync, idle, access or
connected
Session State – current session state; closed, AMP setup, access terminal initiated
negotiation, access node initiated negotiation, open
ALMP State – session layer protocol state
Init Proc State – initialization protocol state
Idle State Connected State
Route Upd Proc State
OH Msg Prot State
HDR Hybrid Mode
TX Power Limited
AT PA State
1xEVDO Active Set SINR Info
Active Set 1 to 6 – PN and filtered SINR for up to 6 Active Set Pilots
24
1xEVDO Fwd Channel CRC Counts
This view displays the good and bad CRC counters for Control and Traffic Channel
packets. It also contains the number of forward link traffic channel and control channel
packets received at various rates.
1xEVDO Fwd Rev Link Performance
Forward Link
Avg Fwd Link Tput – Average throughput on forward link
25
ARQ Eff Rec Rate – Forward link data rate based on ACK and early termination.
RAB Offset - Frame offset for the RAB sent over the forward link
PER(Short) – Packet Error Rate calculated over 1000 slots
PER(Long) – Packet Error Rate calculated over 10000 slots
Req Data Rate(Short) – Averaged over 1000 slots
Req Data Rate(Long) – Average rate over 10000 slots
Pkt Received Flag – Indication if packet received in last 16 slots
Reverse Link
Avg Rev Traffic Tput – Average rate data is sent on reverse link
Act Rev Link Rate –
Curr Rev Link Rate – rate which AT sent last packet
Rev Rate Limit – Rate limit value sent in the overhead message
DRC Channel Gain – Ratio of the power level of the DRC channel to the power level
of the reverse traffic pilot channel
ACK Channel Gain – Ratio of the power level of the ACK channel to the power level
of the reverse traffic pilot channel
AT Req DRC Rate – Represents the DRC Rate requested by the AT
ACK/NACK Status – Denotes if the ACK channel is enabled or disabled
ACK/NACK Value – Identifies if ACK or NACK was transmitted on the reverse link
1xEVDO Reverse Power Control
Rx AGC – received signal strength
Tx Total Limited – total Tx limited power
Tx Adjust – Tx Closed loop adjustment value
Tx Pilot – Tx Pilot power
Max Tx Power RRI – Max RRI recommended value
DRC Lock Period – Indicates number of slots DRC is locked
RPC History Summary – Summary of Reverse power control bits for last 10 frames
DRC Channel Gain – Value reported
ACK Channel Gain – value reported
Data Channel Gain – value reported
Pilot Channel Gain – value reported
DRC / Pilot – Channel to pilot ratio
ACK /Pilot – Channel to pilot ratio
Data /Pilot – Channel to pilot ratio
26
1xEVDO RLP Statistics
General
Service ID - Identifies RLP service
Resets – Total resets that have occurred
Naks Sent – Number of NAK messages sent
Naks Rcvd - Number of NAK’s received in a single message
Reset Time - Timestamp for last statistics reset
RX ACKs from AN – Number of ACK’s received from AN
Re Xmits Not Found – Number of retransmissions not found
Nak Timeout or Aborts – Number of NAK timeouts or aborts
Rx and Tx Data
Phy Chnl Rate (Kbps)
Channel – channel type, traffic or control
No of Packets – Number of partial RLP packets logged
Packet Length – Length of the logged packets
ReXmits (Frames) – Number of retransmitted frames
ReXmit Bytes (Bytes) – Number of bytes retransmitted
Total Bytes (Bytes) – Total number of bytes received
Resets – Number of resets requested by the AT
New Data Frames – Number of new data frames received
Duplicate Frames – Number of received duplicate frames
27
1xEVDO Session Management
Access Attempt (AA) Info
No of Probes – Number of probe sequences sent for this access attempt
Access Results – Results of probe sequence
Access Duration – Time in slots to complete the attempt
Successful AAs – Counter for total number of successful attempts
Failed AAs – Counter for total number of failed attempts per session
Total AAs – Counter for total number of attempts per session
Responding PN – PN of the sector that sends the ACK or the TCA message
Accessed Sector ID – Sector ID on which the Access Probe was sent
Color Code – Color code of the sector on which the Access Probe was sent
Connection Attempt (CA) Info
Conn Result – Details of denied request or success message
Conn Duration – Time (in slots) taken to complete the attempt
Successful Conns – Counter for total number of successful connections
Failed Conns – Counter for total number of connection failures
Total Conn Attempts – Counter for total number of connection attempts since powerup
Allocating PN – The PN of the sector allowing or denying connection
Allocating Sector ID – ID of the sector allowing or denying connection
Allocating Color Code – Color code of the sector allowing or denying connection
Pilot Shuffling – Number of times the active set pilot changed during the connection
attempt
Session Attempt (SA) Info
28
Assignment Status – Indication if UATIAssignment message was received
RATI – Random Access Terminal ID (RATI) used for opening a session
Attempt Duration – Time (in slots) taken to complete the attempt
Successful Attempts – Counter for total number of successful attempts to open a
session
Failed Attempts – Counter for total number of failed attempts to open a session
Total Attempts – Counter for total number of attempts to open a session since powerup
Assigning PN – PN of the sector that sent the UATIAssignment message
Connection Release (CR) Info
CR Reason – This represents the reason for a call termination
1xEVDO Signal Quality
This view provides a composite view of both the Fwd and Rev link RF quality and the
resulting data throughput. You can compare the requested data rate against the average
Fwd link throughput and the effective Fwd link received rate along with the Rev link
throughput. The view also displays the AT’s current RF mode and connection status.
Graphical bar charts on the lower half of the view provided Ec/Io and SINR values as
measured in the AT. The top six active set PNs are displayed along with the candidate
and neighbor set information.
RF Mode – Current mode of the RF hardware
Searcher State – Displays the current state of the searcher
AT State – Summary of access terminal states
AT Reg DRC Rate – The DRC rate requested by the AT
Avg Fwd Link T’put – This is a calculated value based on counters of the good and
bad DRC frames received for each rate
Channel # – Center frequency channel
Channel Code – Walsh ID used
PN – DRC cover of the serving pilot
HO Cell Count – Number of cells involved in the soft handoff
Rx0 Power – Total receive power as seen by antenna 0
Rx1 Power – Total receive power as seen by antenna 1
ARQ Eff Rec Rate – Data rate at which the traffic channel packet was decoded
29
Avg Rev Traffic T’put – Average throughput for the reverse traffic channel as a
function of the number of reverse link traffic packets transmitted at various rates
Tx Power – Total TX power as determined by the entire TX AGC mechanism
PER – Instantaneous Packet Error Rate
Receiver-based software
The Agilent E6474A software option 111 (receiver only license) or 121 (phone and
receiver license) provide the functions described below. The receiver measurement
functions of the Agilent E6474A system is provided by either option 111 and 121. Either
software option, combined with the appropriate receiver hardware option, allows four
primary elements:
CDMA Pilot Channel Analysis
Spectrum Analysis
CW Power
Channel Power
Each element has an associated control view and display view. The software can control
up to four Agilent digital RF receivers. The controls listed below are available for the
receiver measurements:
Measurement interval
- Time
- Distance
Averaging
- Running
- Group
- Max Hold
- At Least (CW and channel power only)
The measurement interval defines the duration between measurements. This can be
specified in terms of time (e.g., execute a measurement every 200 milliseconds) or
distance (e.g., execute a measurement every 10 meters). If the user defines an interval
that the system can not achieve, a busy light indicates this condition.
30
1xEV-DO Pilot Channel Analysis
The Agilent E6474A system measures 1xEV-DO, cdma2000, IS-95 and J-STD-008 CDMA
pilot channels. These measurements are independent of network parameter settings. The
system executes four different types of CDMA pilot channel measurements (listed below).
Any or all of them can be executed simultaneously.
The Agilent “C” revision receiver can measure both 1xEV-DO and cdma2000 carriers with
one receiver by opening two Pilot Analyzer views and properly configuring the
measurement Mode.
Measurement types
All pilots: The system measures the power, both Ec and Ec/Io, of all 512 pilot
channels. The results are displayed as a trace with one point for each of the 512 PN
offsets.
Top N: The system measures all of the pilots in the network and returns the ‘N’
strongest pilot channels received, where ‘N’ is a user definable integer from 1 to 20.
The results are displayed in bar graph format.
Zoomed pilots: The user sets the center and span in terms of chips (or PN offsets).
The results are displayed as a trace.
User list: The user manually inputs a list of up to 40 PN offsets to be measured. The
measurements are displayed in bar graph format – up to 20 bars. If more than 20
channels are in the list, all channels will be measured and recorded, but only 20 will
be displayed.
31
Measurement controls
Carrier frequency
Frequency
Channel
All Pilots
Top N Pilots
Zoomed Pilots
User list of Pilots
PN Increment
Display controls
Power display (Y-axis parameter)
- Ec/Io
- Ec
Show value (bar graphs only)
- Ec/Io (dB)
- Ec (dBm)
- Aggregate Ec/Io (dB)
- Aggregate Ec (dBm)
- Aggregate - Peak (dB)
- Delay Spread (chips)
- Pilot Delay (chips)
Markers (trace displays only)
Multiple markers
Delta markers
To Max function
Drag and drop
Measurement results
Peak Ec/Io
Peak Ec
Io
Aggregate Ec/Io (TopN and user list only)
Aggregate Ec (TopN and user list only)
Aggregate - peak (TopN and user list only)
Delay spread (TopN and user list only)
Pilot delay
Carrier frequency error
Peak pilot power (both Ec and Ec/Io) is computed by selecting the strongest peak of the
correlation for each pilot. Io is the total received power integrated across the entire
1.2288 MHz signal bandwidth.
Aggregate pilot power (both Ec and Ec/Io) is computed for a given pilot by integrating
the power received over the time dispersion of that pilot. Delay spread is the duration of
time over which this power is dispersed. Both aggregate pilot power and delay spread
are determined with respect to an Ec/Io threshold of -17 dB. The system also reports the
difference between the aggregate and peak pilot power (aggregate-peak). This
difference along with the delay spread provides a characterization of the multipath effect
on that pilot. Aggregate pilot power and delay spread are only measured for the TopN
and user list measurement types.
Pilot delay is defined as the difference in time between when a pilot signal is received
and when it should have been transmitted, as defined by GPS timing. For example, a
32
base station transmitting PN offset 0 is expected to start a new short-code pattern
synchronous with the GPS even second clock. If the signal is received 3 chips after the
GPS even second clock, then the pilot delay is said to be 3 chips (1 chip ª 0.8
microseconds). Timing offsets can be due to both propagation delay and base station
timing problems.
Carrier frequency error is defined as the difference between the measured carrier
frequency and the user-specified carrier frequency. The measured carrier frequency is of
the dominant pilot signal. Carrier frequency error can be due to both base station carrier
error and Doppler shift (if moving).
1xEV-DO High Data Rate Receiver Measurements
Access to the 1xEVDO receiver measurements is via the cdma2000 to 1xEVDO Receiver
measurement upgrade software license, E6474A-136. The cdma2000 Receiver
measurement license must already be available on the E6474A platform to enable the
E6474A-136 1xEVDO receiver measurement set.
Existing Agilent CDMA “C” version receiver hardware is used for the 1xEVDO
measurements, however a firmware update may be required. This firmware upgrade is
free of charge and will be prompted for installation by the E6474A platform software on
the initial set-up attempt. Older “B” versio receivers can be upgraded through the Agilent
Service Center to support this option. Contact your field engineer for pricing.
Measurements and display capability are the same as those described in cdma 2000 Pilot
Channel Analysis.
33
The 1xEVDO Receiver will accurately detect and identify PN peaks that have a delay from
-31 to + 74 Chips (105 chip window) or a distance of approximately 11 miles, however
Ec/Io accuracy will degrade with distance:
PN Delay
Ec and Ec/Io Accuracy
-12 to +26 (Approx. 3.5 Miles)
+/- 1dB
-18 to +32 (Approx. 5 Miles)
+/- 2dB
-26 to +40 (Approx. 6 Miles)
+/- 3dB
-31 to +48 (Approx. 7.25 Miles) +/- 4dB
Io and Delay measurements are accurate to ± 1 db and 1Chip respectively for both High
speed/less accurate (0 to -8 db of dynamic range) and Slow/more accurate (0 to -11 db
of dynamic range).
This level of performance is better than commercial 1xEVDO Access Terminals, and this
performance is designed to ensure identification of problems, prior to them becoming
customer affecting.
Spectrum Analysis
The spectrum display provides the controls listed below. Frequencies can be specified in
terms of frequency units or channel number. Note: the spectrum analyzer functionality will
only be supported when using an Agilent E645x receiver.
34
Measurement controls
Frequency, tunable range
Cellular band receiver (E6452C)
824 - 894 MHz [819 – 854]
869 - 894 MHz [864 – 899]
PCS band receiver (E6450C)
1850 - 1910 MHz [1845 – 1915]
1930 - 1990 MHz [1925 – 1995]
IMT 2000 receiver (E6455C)1
1920 - 1980 MHz [1895 – 1990]
2110 - 2170 MHz [2100 – 2180]
Japan cellular band receiver (E6457C)
832 - 870 MHz [827 – 875]
887 - 925 MHz [882 – 920]
Korea PCS band receiver (E6453C)
1710 - 1785 MHz [1705 – 1785]
1805 - 1880 MHz [1800 – 1885]
Frequency, maximum span
Cellular band receiver (E6452C)
25 MHz [35]
PCS band receiver (E6450C)
60 MHz [70]
IMT 2000 band receiver (E6455C)1
60 MHz [70]
Japan Cellular band receiver (E6457C)
38 MHz [48]
Korea PCS band receiver (E6453C)
75 MHz [85]
IF bandwidth2
Cellular Band, PCS Band, and Japan Cellular Band Receivers
30 kHz
1.25 MHz
IMT 2000 Band Receiver
1.25 MHz
5.0 MHz
Korea PCS Band Receiver
200 kHz
1.25 MHz
Resolution bandwidth3
Cellular Band, PCS Band, and Japan Cellular Band Receivers
8.36 kHz to 1 MHz (1.25MHz IF Bandwidth)
246 Hz to 28 kHz (30 kHz IF Bandwidth)
IMT-2000 Band Receiver
8.36 kHz to 1 MHz (1.25 MHz IF Bandwidth)
1.
2.
Korea PCS band receiver and IMT-2000 band receiver does not have kHz IF bandwidth. Korea PCS band
receiver has a 200 kHz and a 1.25 IF bandwidth. IMT-2000 band receiver has a 1.25 MHz and a 5 MHz IF
bandwidth.
Does not imply warranted performance, but rather characteristic performance. Tested with minimum
resolution bandwidth: 246 Hz with 30 kHz IF bandwidth, 8.46 kHz with 1.25 MHz IF bandwidth, 1.68 kHz
with 200 kHz IF bandwidth (Korean receiver), 25.08 kHz with 5.0 MHz IF bandwidth (IMT-2000 band
receiver).
35
25.08 kHz to 2.85 MHz (5MHz IF Bandwidth)
Korea PCS Band Receiver
8.36 kHz to 1 MHz (1.25 MHz IF Bandwidth)
1.68 kHz to 190 kHz (200 kHz IF Bandwidth)
Average Mode
Log Power
Power
Markers
Multiple markers
Delta markers
Marker to max
Marker value to center frequency
Drag and drop
Spectrum noise floor (characteristic) :
Cellular Band, PCS Band, Japan Cellular Band Receiver
Average
Peak
30 kHz IF Bandwidth / 300 kHz span
-139 dBm
-131 dBm
1.25 MHz IF Bandwidth / 300 kHz span
-128 dBm
-119 dBm
30 kHz IF Bandwidth / 25 MHz span
-132 dBm
-129 dBm
1.25 MHz IF Bandwidth / 25 MHz span
-123 dBm
-117 dBm
Average
Peak
1.25 MHz IF Bandwidth / 300 kHz span
-128 dBm
-119 dBm
5.0 MHz IF Bandwidth / 300 kHz span
-124 dBm
-111 dBm
1.25 MHz IF Bandwidth / 25 MHz span
-123 dBm
-117 dBm
5.0 MHz IF Bandwidth / 25 MHz span
-117 dBm
-113 dBm
Average
Peak
200 kHz IF Bandwidth / 300 kHz span
-139 dBm
-130 dBm
1.25 MHz IF Bandwidth / 300 kHz span
-131 dBm
-121 dBm
200 kHz IF Bandwidth / 25 MHz span
-127 dBm
-123 dBm
1.25 MHz IF Bandwidth / 25 MHz span
-123 dBm
-117 dBm
IMT 2000 Band Receiver
Korea PCS Band Receiver
Minimum sweep speed (characteristic) :
30 kHz IF Bandwidth
36
1 MHz / sec
200 kHz IF Bandwidth 10 MHz / sec
1.25 MHz IF Bandwidth 70 MHz / sec
5.0 MHz IF Bandwidth 200 MHz / sec
Spectrum measurement allows tuning ±10 MHz above and below specified frequency
ranges. In addition, the PHS band is also covered (down to 1895MHz). These extended
ranges are shown in brackets – [ ]. The performance is not specified in these extended
ranges.
Characteristic noise floor increase is 2 dB ±10 MHz. At –25MHz with respect to
specified range, the characteristic noise floor increase is 5dB. Characteristic amplitude
accuracy is unchanged with respect to specified range.
Note: Specifications describe warranted performance over the temperature range of 0 to
55 degrees Celsius and include a 30 minute warm-up from ambient conditions. Typical
and characteristic information provides useful but non-warranted performance
parameters. Typical refers to test data at the fiftieth percentile for a 25-degree Celsius
room temperature. Characteristic information describes product information for
parameters that are either not subject to variation, non-measurable, verifiable through
functional pass/fail tests, or routinely not measured.
CW power and channel power
The Agilent E6474A can measure the peak power (CW power) at user-defined
frequencies within a user-defined resolution bandwidth. The systems can also measure
the total power (channel power) within a user-defined bandwidth at a user-defined set of
frequencies. Channel power differs from the CW power measurement in that the total
power is integrated across the specified channel width. The user can define the
frequencies measured in two different ways, indicated below. Note: CW power and
channel power measurements will only be supported when using an Agilent E645x
receiver.
Frequency entry methods
List - Enter an arbitrary list of frequencies.
Trace - Enter a start frequency, step size, and count. The system measures at the start
frequency, at the (start + step) frequency, ... , (start + (count - 1)*step) frequency.
For example, if the start frequency is set to 1900 MHz, the step size is set to 1 MHz,
and the count is set to 4; then measurements are made at 1900 MHz, 1901 MHz,
1902 MHz and 1903MHz.
Frequencies can be specified in terms of frequency units or channel number.
Measurement controls
Frequency
Arbitrary list (list)
Start / step / count (trace)
IF bandwidth1
1.
5.0 MHz (IMT-2000 band (wideband) only)
1.25 MHz
Korea PCS band receiver and IMT-2000 band receiver does not have 30 kHz IF bandwidth. Korea PCS
band receiver has a 200 kHz and a 1.25 MHz IF bandwidth. IMT-2000 band receiver has a 1.25 MHz and
a 5 MHz IF bandwidth.
37
200 kHz (Korea PCS band (narrowband) only)
30 kHz
Resolution bandwidth (CW power only)
Cellular band, PCS band, and Japan cellular band receivers
8.36 kHz to 1 MHz (with 1.25MHz IF bandwidth)
246 Hz to 28 kHz (with 30 kHz IF bandwidth)
IMT-2000 band receiver
8.36 kHz to 1 MHz (with 1.25 MHz IF bandwidth)
25.08 kHz to 2.85 MHz (with 5MHz IF bandwidth)
Korea PCS band receiver
8.36 kHz to 1 MHz (with 1.25 MHz IF bandwidth)
1.68 kHz to 190 kHz (with 200 kHz IF bandwidth)
Channel width (channel power only)
Cellular band receiver (E6452C)
8.36 kHz to 25 MHz with 1.25 MHz IF bandwidth
246 Hz to 25 MHz with 30 kHz IF bandwidth
PCS band receiver (E6450C)
8.36 kHz to 60 MHz with 1.25 MHz IF bandwidth
246 Hz to 60 MHz with 30 kHz IF bandwidth
IMT 2000 receiver (E6455C )
8.36 kHz to 60 MHz (with 1.25 MHz IF bandwidth)
100 kHz to 60 MHz (with 5.0 MHz IF bandwidth)
Japan cellular band receiver (E6457C)
8.36 kHz to 38 MHz (with 1.25 MHz IF bandwidth)
246 Hz to 38 MHz (with 5.0 MHz IF bandwidth)
Korea PCS band receiver (E6453C )
8.36 kHz to 75 MHz (with 1.25 MHz IF bandwidth)
1.68 kHz to 75 MHz (with 200 kHz IF bandwidth)
RF Receiver Hardware
There are five CDMA digital RF receiver options for the Agilent E6474A system:
E6452C - cellular band receiver with internal GPS receiver
E6453C - Korea PCS band receiver with internal GPS receiver
E6455C - 2100 MHz IMT 2000 receiver with internal GPS receiver
E6457C - Japan cellular band receiver with internal GPS receiver
E6450C - PCS band receiver with internal GPS receiver
The Agilent E6474A system with CDMA option 111 or option 121 has the software
function for controlling the receivers. The system supports any combination of receivers,
up to a total of four. Using multiple receiver configurations can greatly improve drive test
efficiency for applications such as monitoring competitive networks. In multiple receiver
configurations the receivers communicate with each other via a high speed serial ring.
Communication with the PC is done via a single RS-232 link to one of the receivers in the
38
ring. Multiple receiver configurations can also be achieved by use of the E6473A direct
connect hub (see E6473A direct connect hub product overview, literature number 59883176EN, for further details).
Each receiver option includes:
RF antenna for the corresponding frequency band
Cable to connect to other receivers
Cable to connect to PC
Kit for mounting receiver in a vehicle
AC/DC power supply
Cigarette lighter power cord
GPS antenna with cable
Agilent digital RF receiver specifications
Agilent E6450C, E6452C, E6453C, E6455C and E6457C
Frequency
Frequency range1
E6452C
824-849 MHz [819 – 854]
869-894 MHz [864 – 899]
E6450C
1850-1910 MHz [1845 – 1915]
1930-1990 MHz [1925 – 1995]
E6455C1
1920-1980 MHz [1895 – 1990]
2110-2170 MHz [2100 – 2180]
E6457C
832-870 MHz [827 – 875]
887-925 MHz [882 – 930]
E6453A 1
710-1785 MHz [1705 – 1790]
1805-1880 MHz [1800 – 1885]
Frequency accuracy
± 1 ppm with GPS time synchronization
± 0.05 ppm characteristic
IF bandwidth2
1.
30 kHz characteristic
200 kHz characteristic (options #390, #391 only)
Spectrum measurement allows tuning ±10 MHz above and below specified frequency ranges. In addition,
for the IMT-2000 band receiver (option #360 and #361), the PHS band is also covered (down to
1895MHz). These extended ranges are shown in brackets – [ ]. The performance is not specified in these
extended ranges. Characteristic noise floor increase is 2 dB ±10 MHz. For the IMT-2000 band receiver, at
–25MHz with respect to specified range, the characteristic noise floor increase is 5dB. Characteristic
amplitude accuracy is unchanged with respect to specified range.
39
1.25 MHz characteristic
5 MHz characteristic (options #360, #361 only)
Aging of TCXO
± 1 ppm/year
Amplitude
Accuracy
Accuracy for cellular band, PCS band, and Japan cellular band receiver
30 kHz IF bandwidth
± 0.5 dB typical from –25dBm to –110 dBm 1.25 MHz IF bandwidth
± 0.5 dB typical from –25dBm to –110 dBm
Noise figure
8 dB typical
Internally generated spurious, input referred
-120 dBm for 30 kHz IF Bandwidth
-120 dBm for 1.25MHz IF Bandwidth
Adjacent channel desensitization4
-25 dBm typical
Adjacent channel rejection5
45 dB typical
• Accuracy for IMT 2000 band receiver
1.25 MHz IF bandwidth
± 0.5 dB typical from –25dBm to –110 dBm
5.0 MHz IF bandwidth
± 0.5 dB typical from –25dBm to –100 dBm
Noise figure
8 dB typical
Internally generated spurious, input referred
1.
2.
3.
4.
-120 dBm for 1.25MHz IF Bandwidth
-115 dBm for 5MHz IF Bandwidth
Spectrum measurement allows tuning ±10 MHz above and below specified frequency ranges. In addition,
for the IMT-2000 band receiver (option #360 and #361), the PHS band is also covered (down to
1895MHz). These extended ranges are shown in brackets – [ ]. The performance is not specified in these
extended ranges. Characteristic noise floor increase is 2 dB ±10 MHz. For the IMT-2000 band receiver, at
–25MHz with respect to specified range, the characteristic noise floor increase is 5dB. Characteristic
amplitude accuracy is unchanged with respect to specified range.
Korea PCS band receiver and IMT-2000 band receiver does not have 30 kHz IF bandwidth. Korea PCS
band receiver has a 200 kHz and a 1.25 MHz IF bandwidth. IMT-2000 band receiver has a 1.25 MHz and
a 5 MHz IF bandwidth.
It is recommended that the input signal level not exceed –40 dBm.
Adjacent channel desensitization applies to the 1.25 MHz IF filter and is defined as the 1 dB compression
of tuned signal with interfering signal +/-1.25 MHz from tuned signal.
40
Adjacent channel desensitization6
-20 dBm typical
Adjacent channel rejection7
25 dB typical
• Accuracy for Korea PCS band receiver
200 kHz IF bandwidth
± 0.5 dB typical from –25dBm to –100 dBm
1.25 MHz IF bandwidth
± 0.5 dB typical from –25dBm to –100 dBm
Noise figure
8 dB typical
Internally generated spurious, input referred
-120 for 200 kHz IF Bandwidth
-120 dBm for 1.25MHz IF Bandwidth
Adjacent channel desensitization4
-25 dBm typical
Adjacent channel rejection8
45 dB typical
Maximum safe input level
+10 dBm, 20V DC characteristic
1 dB compression point3
-15 dBm characteristic
Input/Output
RF input
50W type-N
Connectors
Computer
RS-232 (DB9) Male
GPS
RS-232 (DB9) Male
Power DC power jack 100 mils, positive center
Misc
Operating temperature range
0 to 55 °C
5.
6.
7.
8.
Adjacent channel rejection applies to the 30 kHz IF filter and is defined as the suppression of interfering
signal +/-30 kHz from tuned signal.
Adjacent channel desensitization for IMT-2000 band receiver applies to the 5.0 MHz IF filter and is defined
as the 1 dB compression of tuned signal with interfering signal +/-1.25 MHz from tuned signal.
Adjacent channel rejection for IMT-2000 Band Receiver applies to the 1.25 MHz IF filter and is defined as
the suppression of interfering signal +/- 1.25 MHz from tuned signal.
Adjacent channel rejection for Korea band receiver applies to the 200 kHz IF filter and is defined as the
suppression of interfering signal +/- 200 kHz from tuned signal.
41
Maximum relative humidity
80% for temperatures up to 31 °C, decreasing linearly to 50% relative humidity at 40 °C
Storage temperature range
-40 to 70 °C
Dimensions
6 in x 3 5/8 in x 8 _ in
15.24 cm x 9.21 cm x 20.32 cm
Weight
4.6 lbs. (2.1 kg)
Power
9-34 V DC, 9W with Internal GPS (options #301, #311)
9-34 V DC, 10W Internal GPS
GPS receiver
8 Channel internal GPS receiver
Connector type
SMA
Differential compatible without dead reckoning
Note: Specifications describe warranted performance over the temperature range of 0 to
55 degrees Celsius and include a 30-minute warm-up from ambient conditions. Typical
and characteristic information provides useful information by giving nonwarranted
performance parameters. Typical refers to test data at the fiftieth percentile for a 25
degree Celsius room temperature. Characteristic information describes product
information for parameters that are either not subject to variation, non-measurable,
verifiable through functional pass/fail tests, or as a matter of routine not measured.
E645xC Receivers built-in GPS system
• 8 channel GPS receiver
• Mounted inside Agilent RF receiver enclosure
• SMA antenna connector
• Bulkhead mount antenna with cable
• Magnetic mount antenna with cable
• Differential compatible
• Not dead reckoning compatible
42
Handset compatibility
The E6474A cdma2000 drive-test system supports several cdma2000 phones and is fully
compatible with IS-95. Each phone requires a cable to connect to the PC. Phones are not
available from Agilent. It is recommended that you contact the phone supplier or
manufacturer for phone purchasing information.
For a complete list of the latest supported phones, refer to the supported phones list that
is supplied with the E6474A software or contact your local Agilent representative for
details.
Currently, all Qualcomm chipset phones are supported.
The E6473A phone cabling options are specially designed to work with the Agilent direct
connect USB hub kits (E6474B-015). These cables are available as E6474B-8xx, please
refer to the configuration guide (5988-2396EN) for more information. The USB hub kits
not only provide phone connectivity to the PC but also power to the phone. For users
who do not wish to use the USB hub kits, a special adapter is provided to allow the
phone cable to be directly connected to the PC; however, power is not available for the
phone. The USB hub kits are ordered using the drive-test accessory product.
43
Features common to the E6474A platform
There are a number of features that are common to the E6474A platform software and
that are available in all technologies. These features include the ability to record and
playback data sets, export the data to post-processing software packages, display
parameters on time charts and route maps and define flexible alerts and alarms, based
on user requirements. These features are detailed in this section:
•
•
•
•
•
•
•
•
•
•
•
•
•
View management
Cell naming
Report generator
Call Statistics view
GPS
Data recording and playback
Data export
Link editor
Measurement Parameters view
Custom view
Alarms view
Time charts
Route map view
View Management
A view management tool is available to enable a reduced number of views to be
presented to the drive-test technician. Specific views can be selected or deselected for
display.
Tabbed Worksheets
The E6474A Network Optimization Platform gives full flexibility of workspace
management through the tabbed worksheet feature. Any measurement Views can be
displayed on any worksheet, and indeed can be displayed on multiple worksheets if
desired. This provides the user the flexibility to represent data and information and group
Views to their own preference.
Cell Naming
The phone-based measurements and receiver-based broadcast channel analyzer provide
cell naming features. The cell naming features are dependent on the user providing a text
file database with position and cell configuration information. Where the cell ID is known,
for example in the phone serving cell measurement, this is used to correlate with the cell
name in the database. Where no cell ID is known, for example in neighbor cell
measurements or receiver based measurements, a "best guess" algorithm is
implemented. This algorithm makes use of the geographic location, ARFCN and BSIC to
attempt to determine which cell from the database is the best match. The format of the
cell database is a text file with the following fields:
•
•
•
•
•
•
•
Cell name
Longitude
Serving ARFCN
TCH ARFCN
Latitude
Cell ID
Azimuth
44
A number of Cellsite database formats can be imported, including:- TXT, Agilent
StationInfo files, ICS, AXF, BXF, CDB, MDB, HP
Report generator
The E6474A system provides fast and easy report generation. The Report generator
command is available at any time during logging, Live Update mode, or when replaying a
data file. All of the active views are captured, and an HTML document is created that
contains a screen capture of each active view. Each report includes a header section and
a dialog box prompts the user to enter the header information listed below. Smart
defaults and persistent information are used (marked *), so minimal text entry is required.
There is no limit to the number of reports that can be generated.
Header elements:
•
•
•
•
•
•
•
Report title*
User name
Company
Time*
Date*
Location* – defaults to current GPS fix
Comments – user entered notes
Call Statistics view
Call Statistics are displayed in the Call Stats view. The Call Stats view shows the call
termination classifications and counts, and call progress messages. For a system with
multiple phones, each device is represented by its own column.
•
•
•
•
•
•
•
•
•
Technology (technology of the device)
Label (shows device label)
Total calls
# of good calls
# of blocked calls
# of dropped calls
# of no service calls (shows the total number of calls that could not be placed or
completed due to the loss of network service.)
# of no communication calls
Progress (A message indicating the call progress is displayed in this field)
GPS
The Agilent E6474A system has the ability to work with several types of GPS interfaces.
The system is compatible with the communications protocols listed below. The physical
interface is RS-232 with a DB9 connector. Supported GPS navigators include Agilent
Direct Connect GPS/DR Navigation, Garmin GPS II Plus and Trimble Placer GPS 455DR.
Details of Agilent-supplied navigator hardware is provided in the "Additional Options"
section of this document.
Compatible protocols
•
•
•
TAIP
TSIP
NMEA
The PC clock is synchronised to GPS clock, on selection of Live or Record mode, if a
valid GPS device is configured. This synchronization can be disabled.
45
Data recording
The following commands appear on the Log pull-down menu. The commands are also
available as buttons on the main tool bar.
Command
Replay
Reverse Replay
Slow Replay
Fast Replay
Fast Reverse Replay
Slow Reverse Replay
Start Live Mode
Start Logging
Pause
Stop
Single Step Mode
Single Step
Action
Start replaying a data file.
Play back a data file in reverse (2x to 7x).
Reduce the playback speed. (/2 to /7)
Increase the playback speed.
Increase the reverse playback speed (2x to 7x).
Reduce the reverse playback speed. (/2 to /7)
Start displaying data. Data is not logged.
Initiates a data recording.
Pause data collection or replay.
Stop data collection or replaying a data file.
Pauses replay until Single Step is selected
Enables user to step through the database in
playback mode when Single Step Mode is activated
Note: All parameters enabled on the mobile or receiver at system setup will be recorded
during logging, not only those selected for display.
A summary of additional record and playback features is listed below:
• Pause/resume
• Survey markers and user notes -- Survey markers and user notes can be entered on
the route map during a data collection test.
• Automatically numbered survey markers -- When enabled, the software automatically
adds the following markers when logging:
11 Start of Test
12 Start of Data Collection
13 End of Data Collection
14 End of Test
15 Pause
16 Resume
• Playback of a database does not require a license key
46
Data export
A number of commercially available post-processing tools can directly read the E6474A
SD5 database file. Data can also be exported to comma or TAB delimited ASCII text files.
The export function provides flexible filtering and binning capability that defines the
specific data to be exported and with what lat/long, datum and time formats, including:
Position formats
•
•
•
•
•
Signed decimal degrees
Decimal degrees with direction
Deg: min: sec with direction
Signed deg: min: sec
UTM
GPS datums at export
The following GPS datums are available for use when exporting the data:
•
•
•
•
•
•
•
WGS 84 (World Geodetic System)
AGD 86
AGD 84
European
Hu-Tzu-Shan
NAD 27 (North American)
NAD 83 (North American)
OS36 (GB)
SAD 69 (Brazil)
SAD 69 (Mean)
Tokyo (J6)
Tokyo-Korea
WGS 72 (World Geodetic System)
Ireland 1966
Parameter link editor
This feature allows phone and receiver parameters to be linked to allow common
measurement criteria to be tracked on the display.
Examples:
•
•
•
•
•
Link a phone’s carrier channel to its adjacent channels, provided by the
scanner/receiver. The carrier and adjacent channel signal are displayed graphically in
the Adjacent Channels view.
Note: You can link up to 10 phones with their adjacent channels.
Link scanner/receiver channel measurements to phone channels/bands.
Link CDMA scanner/receiver PN measurements to the phone’s PN increment.
Link PN scanner measurements to GPS lock conditions.
Link phone neighbor lists to scanner/receiver inputs.
Measurement Parameters view
The Measurement Parameter view is an Explorer-style view of the system devices and
their measurement parameters. When a data stream is required for entry into a dialog
box, the Measurement Parameters view opens, enabling the user to select a parameter
and automatically generate the data stream required.
The Measurement Parameters view is initiated by the Alarms view, Time Chart view and
Route Map view, as described in the following three sections:
47
Custom View
Custom view gives the user flexibility to create customized views by selecting parameters
required and displaying them in a tabular format. Up to 40 parameters can be applied per
view and multiple views can be created and saved for reuse.
Alarms view
The Alarms view is used to configure alarms that are triggered by parameters received
during a test that meet user-defined criteria. Parameters collected as integer values or
messages, from connected phones, receivers or GPS navigation hardware, can be used to
initiate alarms; these parameters are selected using the Measurement Parameter view.
The user can choose any one or all of the following actions to occur on an alarm:
•
•
•
•
A .WAV audio file can play
A marker can be written to the database file, and displayed in the Route Map and
Time Chart views
A pop-up message box can be displayed
Measurements can be paused or stopped
Each alarm event is also tabulated on the Alarms view as it occurs. Fifty pictorial survey
markers are available to depict alarm events within the Chart and Route Map views.
Alarms require set-up prior to a database collection in order to enable survey markers
during playback.
The Alarms view enables the user to create simple or complex conditions to trigger an
alarm. The following are examples of how an alarm can be generated:
•
•
•
•
Monitor a single parameter for a single set of criteria. When the criteria are met, an
alarm is generated.
Monitor a single parameter and logically "AND" up to five sets of criteria. When all
sets of criteria are met, an alarm is generated.
Monitor several parameters, each with a single set of criteria. Each parameter can
generate its own sound when the criteria are met.
Monitor several parameters, each with multiple logically "ANDed" sets of criteria.
48
•
•
Each parameter can generate its own sound when the criteria are met.
Monitor a parameter that is collected as a text message and generate an alarm when
the message changes.
Configure multiple instances of the Alarms view. Use one for each device.
Alarm configurations can be shared using export and import commands from the Alarms
view. These alarm configurations are stored as .MSF files. The E6474A software is
supplied with over one hundred predefined .MSF files. By default these are stored at
C:\Program Files\Agilent Technologies\Shared\Alarms.
Chart view
The Chart view is used to display measurements using a graphical display. Once
configured the user can see measurement information displayed relative to time, in both
live and playback modes of operation. Up to 24 user-selected measurements can be
displayed simultaneously, as four groups of six parameters. Multiple chart views can be
displayed.
The user-configurable options are initiated in the Chart view Properties dialog box.
General Chart Properties enable selection of:
Measurement averaging period, measurement update rate, x-axis (time) span,
display/hide markers, display/hide legends and background, border and grid colors.
Specific Chart Properties enable selection of:
Device and measurement series, y-axis max and min per measurement, chart display
49
on/off, y-axis scale display on/off, Draw method, Fill In Method and plot line colors.
Route Map view
The Route Map view shows current position and the route traveled on a map as data is
collected. Several layers of information can be displayed, including signal parameters
(selected via the Measurement Parameter view), survey markers, and notes. Basestation
locations, with site names and sector orientations, can also be plotted on the map when
linked to the appropriate cellsite naming database.
There are two types of route maps
•
•
The Route Map, used with a GPS navigator - included with the E6474A platform
The Indoor Route Map, used without a GPS navigator - supported by E6474A-030
(indoor measurement software license).
The following route map features can be switched on or off: Channel List, Zoom Buttons,
Current Position Buttons, Layer Buttons, Indoor Navigation, Map Scale, Compass, Status
Bar, Button Bar, and Color Scheme.
Layer Menu
The following layers are supported by the route map view, the properties of these layers
are accessed by right-clicking the associated button:
•
•
•
•
Cellsite - This shows the name and properties associated with the cell. A cellsite
database must be selected to show this layer.
Map Picture Layer - This shows the selected .bmp map.
Street Map Layer - This shows the selected .map or .mif map. Note that TAB files are
also supported through conversion to .mif format
User Notes - This shows notes that have been entered.
50
•
•
•
Survey Markers - This shows Survey Markers that have been entered.
Current Position - This shows current lat/long position.
Signal - This shows the color code related to the ‘signal strength’ attribute and the
letter associated with the ‘channel’ attribute as set-up via the Measurement
Parameter view in signal properties. The number of signal buttons available depends
on the technology of the tracking phone, to a maximum of three.
Route Map Properties
This dialog box enables the user to configure a number of route map properties, such as
the units of measure (U.S. or metric), the distance represented by one pixel, the
background color, and the border characteristics of the Route Map view.
51
Additional options
This section is designed to give a brief overview of relevant additional options. Please
refer to the E6474A Wireless Network Optimization Platform configuration guide,
literature number 5988-2396EN, for comprehensive configuration details.
Software
Data measurement software license, E6474A-700
This data measurement capability utilizes a client / server architecture, where the client is
the test mobile and laptop combination and the server is a remote computer connected to
an IP interface within the network. The data control and measurement user interface
resides on the client laptop. The Agilent E6474A system is designed to allow a single
server to support several clients. The data measurement sequence controller allows the
user to construct flexible transmit and receive data geometries with programmable delays
for both UDP and TCP mechanisms. Ping, Trace Route and multiple FTP and http
transactions can also be included in the sequence.
Data measurement functionality on both transmit and receive paths (e.g., application
throughput, IP throughput, IP bit error rate, data fragmentation and delay) will only be
supported with the purchase of both E6474A-700 and -710. E6474A-700 can be used
without the Agilent server software E6474A-710. This will enable the sequencing of
access to public ftp and http sites enabling the measurement of total bytes downloaded,
time to download, and data throughput at the application layer.
Data measurement server software license, E6474A-710
The server is the target for the above data measurement option (E6474A-700). It
calculates transmit path measurement results, as detailed above, and transmits them
together with the requested data pages back to the mobile client for analysis and
characterization. E6474A-710 requires the purchase of at least one data measurement
software license (E6474A-700) and will support several option 700s. The E6474A-710
software resides on the server and, once installed, can operate unmanned.
For detailed information on the data measurement capabilities, refer to the Agilent
Wireless Data Measurement product overview, literature number 5980-2310E and the
Agilent Wireless Data Measurement data sheet, literature number 5988-1507EN.
The Wireless Application Measurement Software (WAMS) license, (E6474A740)
WAMS enables wireless data services testing on, for example, MMS, SMS, email, WAP,
http, voice connectivity, video connectivity and FTP applications. This option provides an
extremely flexible test sequencer engine and user experience measurements that include
TCP throughput, Server Response Time, Authentication Time and Data Download Time on
the real data applications. These measurements provide verification of the wireless data
delivery chain, giving quick identification of data network problem areas and highlighting
whether they are for example RF, backhaul or Internet service provider related.
For further detail refer to the Agilent Data Service Assurance (DSA) Product Overview
(5989-0469EN) and the Wireless Application Measurement Software Data Sheet
(5989-0470EN).
52
Multiple phone control, E6474A-010
The Agilent E6474A-010, in addition to either the phone measurement license or the
phone and receiver combination license, extends the system to support up to four test
mobile phones simultaneously. Use of multiple phones can significantly improve
optimization efficiency. Some applications of multiple phone configurations include:
•
•
•
Simultaneously evaluate performance on multiple frequencies
Execute origination, termination, and dropped call testing simultaneously
Execute measurements on your network and competitive networks simultaneously
Indoor measurement software license, option 030
Agilent E6474A-030 enables the system to operate using a touch tablet PC, without GPS,
to make phone and receiver-based GSM wireless measurements inside of buildings.
While walking through a building, waypoints are recorded on a floor plan of the building.
Measurements are interpolated between waypoints. Indoor measurements require a
BMP format floor plan or sketch of the building to be measured. An essential part of the
indoor measurement system is a pen tablet computer, which allows the user to correlate
measurements with positions on a floor plan. Refer to the E6474A Wireless Network
Optimization Platform configuration guide, literature number 5988-2396EN.
Indoor measurement features
•
•
•
•
•
•
Autoscale
Autopan
Auto legend
Ability to link phone or receiver measurements to plot
Waypoints with interpolation
Moveable waypoints
Analysis Reporter
The Analysis Reporter option is a simple-to-use report tool, which is integral to the
E6474A platform. It works on automatically generated export files, using both phone and
receiver data, and can quickly generate comprehensive network performance overview
and detailed network analysis reports and histograms including, for example,
performance summary reports, call quality analysis reports, details on performance per
call, neighbor and handover summary and drill-down, aggregate Ec/Io vs RxPower and
many more. Analysis Reporter currently supports GSM, GPRS, cdma2000, UMTS and
data measurements on a single E6474A-758 product option.
Actix DV for Agilent
Agilent Technologies offers the Actix DV dedicated post-processing solution for product
numbers E5641A-400 (cdmaOne, cdma2000), E5641A-500 (cdmaOne, cdma2000, 1xEVDO). This tool is designed to enable network engineers to visualize and troubleshoot
network problems with maximum effectiveness. Features such as ‘event navigator’, view
synchronization, protocol stack browsing and drill-down, and chart and map visualisation
enable specific events to be diagnosed in detail, whilst a range of standardized reports
represent measurement summaries. For further information please refer to Actix DV for
Agilent Overview (5988-9147EN).
53
Hardware
Outdoor GPS navigation support
The Agilent E645xC range of receivers include GPS navigation capability. The Agilent
Direct Connect GPS, with dead reckoning is also available as E6473B-030 (with mag
mount antenna) and E6473B-031 (with permanent mount antenna) options.
The E6474A 0ptimization platform supports TAIP, TSIP and NMEA compatible third party
GPS receivers including Trimble Placer GPS 455 receiver with dead reckoning and Garmin
II.
The key features of the Agilent supplied GPS receivers are tabulated below:
•
•
•
•
•
•
•
E645xC receivers
8 channel GPS receiver
Mounted inside Agilent RF
receiver enclosure
SMA antenna connector
Bulkhead mount antenna with cable
Magnetic mount antenna with cable
Differential compatible
Not dead reckoning
compatible
•
•
•
•
•
Agilent E6473B-030 and -031
12 Channel GPS receiver
Dead reckoning
Heading sensor
Interconnect cables to Direct Connect
hub interface
Magnetic or permanent mount
antenna option
Note: With the Agilent E645xC receivers, an external GPS source may be used with the
receiver even though an internal GPS exists within the receiver housing. This is valuable
when differential or dead reckoning measurements may be needed. Only one GPS source
can be used at any given time.
Test mobile phone hardware
The E6474A system software can control up to four test mobile phones. If more than one
test mobile phone needs to be controlled simultaneously, it is necessary to have the
E6474A-010 multiple phone software license.
54
Agilent high speed direct connect hub kits E6473B options 015
and 021 to 024
Agilent offers a high speed direct connect hub (E6473B-015) and associated in-vehicle
kit (E6473B-021), and portable kits (E6473B-022, -023 and -024) for use with the
E6474A system. The Agilent high speed direct connect hub consolidates PC
communication cabling and provides charging/powering for up to two phones and two
receivers/one scanner. The phone ports are dual serial ports and can handle both trace
and data. The maximum achievable data rate from the serial ports is 460 kbps. The
Agilent high speed direct connect hub also provides three downlink USB ports. Multiple
hubs can be cascaded via the USB connections.
Phone specific cables are required for use with the Agilent high speed direct connect
hub.
55
Computer hardware requirements
The Agilent E6474A system requires a PC. The PC requirements differ depending on the
hardware configuration and on which parameters are being selected. Administrator rights
are required.
Recommended minimum PC specifications:
•
•
•
•
•
•
•
•
Windows® 2000 or XP Professional Service Pack 2 onwards (inc XP for Tablet PC)
600MHz PIII, 256MB RAM
RS-232 DB9 serial port
2 USB ports (for software key and device connection)
PCMCIA slot or a connection (for multiple hardware support)
10 GB hard disk
CD-ROM drive recommended for installation
1024 x 768 display resolution minimum
56
Warranty
One-year warranty on hardware components and one year of application support is
included with a purchase of an Agilent E6474A drive test system. Extended warranty may
be purchased through options W3x and W5x. Extended warranty cannot be purchased
for supplied mobile phones from Agilent.
Support options
For the E6474A software licenses the following support options are included for the first
year:
•
•
•
Agilent Call Center phone support, four hour response time or less
Telephone assistance and web training on specific topics
Software updates
On-site training and start-up assistance is not included with the E6474A options, it is
orderable seperately as H7211B-209. WAMS training is also available under H7211B232 and H7211B-233.
The Agilent Advantage Integrated Customer Care Program allows customers to upgrade
to more comprehensive product support options. For the program summary and options,
refer to literature number 5988-4793EN.
57
www.agilent.com/find/E6474A
Additional Agilent literature
Product Overviews
Agilent E6474A Wireless Network
Optimization Platform Product Overview
Agilent Indoor Wireless Measurement
Systems Product Overview
Agilent Wireless Data Measurement
Agilent Direct Connect Hub
DSA Product Overview
Data Sheets
Agilent E6474A Wireless Network
Optimization Platform for GSM and GPRS
Agilent E6474A Wireless Network
Optimization Platform for UMTS
Agilent Wireless Data Measurement
Wireless Application Measurement
Software
E6474A Wireless Network Optimization
Platform Configuration Guide
This information is subject to change without
notice.
© Agilent Technologies, Inc. 2005
Printed in U.K. May 13, 2005
5988-6195EN
5988-3558EN
5968-8691E
5980-2310E
5988-3176EN
5989-0469EN
5988-5904EN
5988-8519EN
5988-1507EN
5989-0470EN
5988-2396EN