1
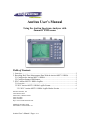
Anritsu User’s Manual
Using the Anritsu Spectrum Analyzer with
Summit® WMScanner
Table of Contents
1. Overview ......................................................................................................................... 2
2. Recording Real-Time Measurement Data With the Anritsu MS2711 HHSA ................ 2
2.1 Configure the Anritsu MS2711 HHSA ..................................................................... 2
2.2 Configure Summit WMScanner................................................................................ 3
3. WVC Anritsu MS2711 HHSA Logfiles ......................................................................... 6
3.1 Overview ................................................................................................................... 6
3.2 WVC Anritsu MS2711 HHSA Logfile Format ........................................................ 6
3.2.1 WVC Anritsu MS2711 HHSA Logfile Header Section .................................... 6
Extreme Networks, Inc.
3585 Monroe Street
Santa Clara, California 95051
(888) 257-3000
(408) 579-2800
http://www.extremenetworks.com
Published: December 2009
Part Number: 100361-00 Rev 01
Anritsu User’s Manual - Page 1 of 13.
1. Overview
This manual explains how to use the Anritsu MS2711 in conjunction with
Summit® WMScanner. The Anritsu MS2711 Hand-Held Spectrum Analyzer (HHSA) is a
battery-powered, field-operable measurement tool with a real-time serial interface. The
Anritsu HHSA is capable of measuring radio signals from 100 kHz to 3 GHz with a
measurement range of –90 dBm to +20 dBm. Additionally, the Anritsu HHSA has a
power monitor mode whereby an RF detector may be attached to measure specific power
levels. Both spectrum analyzer mode and power monitor mode are fully supported within
Summit WMScanner, enabling you to record measurement data in real-time for either
mode.
The serial interface on the Anritsu HHSA makes it easy for Summit WMScanner
to handle all the interaction with the HHSA. All configuration of the HHSA is handled
from within Summit WMScanner as discussed below. Summit WMScanner can acquire
data from the Anritsu HHSA in real-time, using the specified options. Depending on the
sweep configuration, acquiring a single measurement point using the spectrum analyzer
mode can take from 3 seconds (for a 0 Hz sweep) to over 30 seconds (for a full 3 GHz
sweep). When using the Anritsu HHSA in power monitor mode, measurements can be
made much more rapidly, with typical operation permitting over 30 samples a second.
2. Recording Real-Time Measurement Data With the Anritsu
MS2711 HHSA
2.1 Configure the Anritsu MS2711 HHSA
Follow the steps outlined below before beginning any measurement run with
Summit WMScanner using the Anritsu HHSA:
1. Connect all necessary cables, antennas, and any other accessories to the Anritsu
HHSA as desired. For information about such procedures, see the documentation
accompanying the Anritsu HHSA. Additionally, connect a null-modem serial
cable from the Anritsu HHSA to the PC with Summit WMScanner installed.
2. Toggle the Anritsu HHSA power switch to the ON position.
3. When the system boots, verify that the Anritsu HHSA firmware version is 1.35 or
higher. Summit WMScanner does not support Anritsu HHSA models with
firmware versions prior to 1.35.
4. After the system has booted, press the Enter key as prompted on the Anritsu
HHSA display.
5. To ensure that proper communications will occur with the Anritsu HHSA, place
the unit into “Spectrum Analyzer” mode. To do this, press the MODE button
under the LCD display, and use the UP/DOWN arrow keys to select “Spectrum
Analyzer” mode. NOTE: Even if power monitor measurements are being
made, make sure the Anritsu HHSA is running in Spectrum Analyzer mode.
Anritsu User’s Manual - Page 2 of 13.
2.2 Configure Summit WMScanner
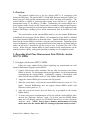
From the Summit WMScanner menu, select “Measurement Survey”, “Record
New Data…”, choose the “Anritsu Site Master / MS2711 / MS2711A / S33XB / S33XC”
item from the “Select Measurement Mode” box located at the bottom of the dialog, and
then click “Next >>”. This will open the Configure Serial Port dialog box shown in
Figure 1.
Figure 1: Configure Serial Port dialog box
Referring to Figure 1, select the appropriate serial port number where the Anritsu
HHSA is attached (e.g., COM1, COM2, etc.) The baud rate should be 9600. The other
settings are grayed out because the HHSA does not support any other modes different
from those shown in the dialog box. After these have been accomplished, click OK and
the Anritsu MS2711 HHSA options dialog box shown in Figure 2 should be presented.
Anritsu User’s Manual - Page 3 of 13.
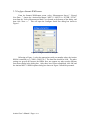
Figure 2: Anritsu MS2711 HHSA Options Dialog Box
Referring to Figure 2, follow the steps given below to configure the desired
options for collecting data:
1. Select the measurement mode: either Spectrum Analyzer, Channel Number, or
Power Monitor.
•
If spectrum analyzer mode was selected, select the desired sweep options.
For more information on how to choose these settings, consult the Anritsu
MS2711 HHSA User’s Guide published by the device manufacturer.
•
Channel Number mode is another way of selecting settings for operating
the Anritsu in Spectrum Analyzer mode. Simply select the channel
standard and the channel number you wish to monitor.
•
If power monitor mode was selected, make sure an RF detector is
Anritsu User’s Manual - Page 4 of 13.
connected to the Anritsu HHSA. If an RF detector is not attached, all
measurements will be recorded as –100 dBm.
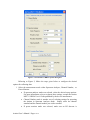
2. Click the “Associate Base Stations” button to associate measurement data with
base stations placed within the current building. Refer to Figure 3 for help in
navigating the base station association dialog.
3. If spectrum analyzer mode was chosen in Step 2 above, now choose the desired
base station association method. Two options are available.
Figure 3: Base Station Associations Dialog
a) Using the first option, the entire sweep of data is averaged linearly and the
average value is associated with a base station.
b) Using the second option, individual markers can be used to associate
unique frequencies with different base stations. NOTE: In the current
version, only one marker may be associated with each base station. If
more than one marker is associated with a single base station other
post-processing will only choose one marker, potentially causing
unforeseen results.
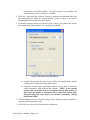
4. If Power Monitor mode was chosen in Step 1 above, then select the base station to
associate measurement data with.
5. Click OK to save the selected base station associations.
Anritsu User’s Manual - Page 5 of 13.
Click “Next” to begin collecting data. Refer to Chapter 3 of the Summit
WMScanner manual for more detailed instructions on collecting data.
3. WVC Anritsu MS2711 HHSA Logfiles
3.1 Overview
Summit WMScanner positions measurement data based upon an X,Y,Z
coordinate system. Since most receiver manufacturers do not support such a data
collection scheme, the WVC logfile format was created. The WVC logfile format
provides a receiver independent method for collecting and storing measurement data.
The WVC logfiles, identifiable by their .wvc file extension, are created by Summit
WMScanner automatically during real-time measurement data acquisition and may be
very easily imported and exported between different drawings. These files are located in
the “measured” subdirectory of the current workspace.
3.2 WVC Anritsu MS2711 HHSA Logfile Format
WVC logfiles created while recording measurements from an Anritsu MS2711
unit are tab-delimited ASCII text files. The logfile consists of two main sections: a
Header section and a Data section. The Header section presents basic information
regarding the measured data, and is necessary for Summit WMScanner to properly
process the logfile when importing the file. The Data section includes the position
coordinates, data values, and other information associated with each measurement data
point.
3.2.1 WVC Anritsu MS2711 HHSA Logfile Header Section
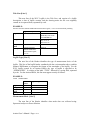
Version Line [Line 0]
The initial line of the WVC Logfile is used to indicate the file format version.
Currently only one version of the file is supported, version 1. On this and all other lines,
the end of line is designated by a standard carriage return/line feed.
EXAMPLE:
VERSION:
1
Version Label
Version number
Type
Range
STRING
1 – 128 characters
Required
Field
Example
Yes
Integer
Only version 1 is
supported
Yes
Version
1
Anritsu User’s Manual - Page 6 of 13.
Title Line [Line 1]
This next line of the WVC Logfile is the Title Line, and consists of a logfile
description, a date of logfile creation, and the drawing name the file was originally
created in or exported from, separated by a tab.
EXAMPLE:
Extreme Networks Summit WMScanner Measurement Logfile, v.12.0.2 10/19/09 Default_Final.dwg
Type
Logfile Description
STRING
Range
1 – 128 characters
Required
Field
Example
Yes
Extreme Networks,
Summit WMScanner
Measurement Logfile,
v.12.0.2
Date of Creation
DATE
Month/Day/Year in the
form MM/DD/YY.
Month: 01 to 12
Day: 01 to 31
Year: 00 to 99
No
10/29/09
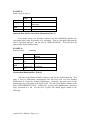
Logfile Type [Line 2]
The next line of the Header identifies the type of measurement device of the
logfile. This line of the logfile header combined with the version number above, enables
Summit WMScanner to recognize the format of the remainder of the logfile. For the
WVC logfile created by an Anritsu HHSA, the type of logfile is specified to be
“SITEMASTER”. It consists of the label “TYPE:” followed by a string field, separated
by a tab. For the Anritsu HHSA, this line must appear exactly as follows:
EXAMPLE:
TYPE: SITEMASTER
Type
Range
Required
Field
Example
Field
Label
STRING
TYPE:
Yes
Type of Logfile
STRING
SITEMASTER
Yes
TYPE:
SITEMASTER
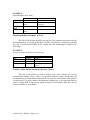
Measurement Mode [Line 3]
The next line of the Header identifies what mode data was collected using:
Spectrum Analyzer or Power Monitor.
Anritsu User’s Manual - Page 7 of 13.
EXAMPLE:
MODE: Spectrum Analyzer
Type
Range
Required
Field
Example
Field
Label
STRING
TYPE:
Collection mode
Yes
STRING
{SPECTRUM ANALYZER, POWER
MONITOR}
Yes
TYPE:
SITEMASTER
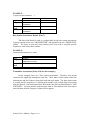
Optional: Base Station Association Information [Line 3]
If the mode chosen was Spectrum Analyzer, this line additionally indicates the
association mode, either by markers or by averaging. There is a tab placed between the
end of “Spectrum Analyzer” and the start of “ASSOCIATIONS”. This field does not
appear under Power Monitor mode.
EXAMPLE:
ASSOCIATIONS:
MARKERS
Field Label
Type
Range
Required
Field
Example
STRING
ASSOCIATIO
NS:
Yes
ASSOCIATIO
NS:
Base Station Association
Method
STRING
{AVERAGING, MARKERS}
Yes
MARKERS
Measurement Run Identifier [Line 4]
This line of the Header identifies a unique name for the measurement run. This
name is used to differentiate measurement runs that have been read into Summit
WMScanner or created by Summit WMScanner. Generally, the name given to the
measurement run is the same as the logfile itself. This line of the Header consists of the
label “MEASUREMENT RUN:” followed by a string field (alphanumeric characters
only), separated by a tab. For the WVC Logfile, this should appear similar to the
following:
Anritsu User’s Manual - Page 8 of 13.
EXAMPLE:
MEASUREMENT RUN: RUN1
Type
Range
Required
Field
Example
Field Label
STRING
MEASUREMENT
RUN:
Yes
Measurement Data Name
STRING
1 to 128 alphanumeric
characters
Yes
MEASUREMENT
RUN:
RUN1
Measurement Data Comments [Line 5]
This line of the Header identifies any notes or user comments associated with the
measurement data. It consists of the label “NOTES:” followed by a string field separated
by a tab. For the Anritsu HHSA WVC Logfile, this line should appear similar to the
following:
EXAMPLE:
NOTES: Transmitter on third floor, southwest corner
Type
Range
Required Field
Example
Field Label
STRING
NOTES:
Yes
NOTES:
Measurement Data Notes
STRING
1 to 128 characters
Yes
Measuring third and fourth
floors
Number of Base Station Association Markers [Line 6]
This line of the Header is used to indicate how many markers are used to
associate base stations, if any. That is, if a spectrum analyzer sweep is being made and
the associations are being made using markers, the sixth line will tell how many markers
are being used. If a power monitor measurement is being made, or if a spectrum analyzer
sweep is being made using average signal strength for associations, then there are no
markers and thus no associations.
Anritsu User’s Manual - Page 9 of 13.
EXAMPLE:
# ASSOCIATION MARKERS:
Type
Range
Required
Field
Example
2
Field Label
STRING
# ASSOCIATION
MARKERS:
Yes
Number of Markers
INTEGER
0 to 32767
# ASSOCIATION
MARKERS:
2
YES
Base Station Associations Header [Line 7]
This line of the Header is used as a column label for the base station associations.
It always consists of the text “TRANSMITTER” and optionally the text “FREQUENCY
(MHz)”. The latter is used only when markers have been used to associate specific
frequencies with various base stations.
EXAMPLE:
TRANSMITTER FREQUENCY (MHz)
Type
Range
Required
Field
Example
Base Station Associations Header
STRING
{TRANSMITTER, TRANSMITTER
FREQUENCY (MHz)}
Yes
TRANSMITTER
FREQUENCY (MHz)
Transmitter Associations [Lines 8-10 (for this example)]
In this example, there are 3 base station associations. Therefore, this section
consists of the eighth line through the tenth line. These lines of data consist of the base
station name and the frequency associated with that base station. The base station name
is a string and the frequency is a floating-point number with a single digit of precision
after the decimal. If no associations have been made, then the base station name is “NOT
ASSIGNED”. If power monitor mode has been used or if no markers have been used to
associate data, then the frequency column will not appear.
Anritsu User’s Manual - Page 10 of 13.
EXAMPLE:
Tx1
Tx2
Tx3
2412.3
2420.1
2407.8
Type
Range
Require
d Field
Units
Exampl
e
BASE STATION
NAME
STRING
Any valid base station
name contained within a
drawing.
Yes
FREQUENCY
REAL
Floating-point number with
precision to 1 decimal place;
units are in MHz
Yes
NONE
Tx1
MHz
2412.3
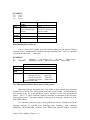
Data Heading Line 1 [Line 11]
Line 11 of the WVC Logfile gives the column headings for the data that follows
The end of line is designated by a standard carriage return/line feed. Line 12 is specified
as a string of underscore ‘_’ characters.
EXAMPLE:
X
BW
Y
Z
VIDEO BW
Type
Range
Required
Field
Example
MARKER
FREQUENCY (Hz)
SPAN (Hz)
RESOLUTION
REFERENCE LEVEL
DB DIV NUM POINTS SWEEP (dBm)
Data Column Headings
STRING
1 – 128 characters
Yes
X
Y
Z
MARKER
FREQUENCY (Hz)
SPAN (Hz)
RESOLUTION BW
VIDEO BW
REFERENCE LEVEL
DB DIV NUM
POINTS SWEEP (dBm)
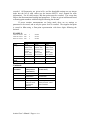
New Measurement Marker Data [Line 13 and greater]
Beginning with the thirteenth line of the logfile in this example and continuing
through the end of the file, actual measurement data will be found. All information in
this section of the file is tab delimited, using a separate row for each measurement
marker. The X, Y, and Z locations within the drawing are indicated as the first three
floating-point values. The marker number is then given as an integer, and the rest of the
data stream follows.
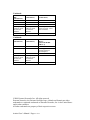
If a spectrum analyzer sweep is being performed, then the settings used on the
spectrum analyzer are recorded next, including center frequency, span, resolution
bandwidth, video bandwidth, reference level, dB/division, and the number of points
Anritsu User’s Manual - Page 11 of 13.
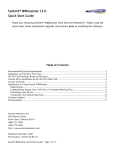
recorded. All frequencies are given in Hz, and the bandwidth settings use an integer
index into the list of valid values (see the Anritsu MS2711 user’s manual for more
information). For all valid sweeps, 400 data points must be recorded. The sweep data
follows the aforementioned settings and parameters. Values are given in dBm and stored
as floating-point numbers with three digits following the decimal.
If power monitor measurements are being made, there are no settings or
parameters to be stored, and so only the power level is recorded. The singular data point
is stored in dBm using a float-point representation with three digits following the
decimal.
EXAMPLE:
1893.29 366.44 1.80
1958.99 338.21 1.80
2035.55 352.32 1.80
Type
Range
Units
Required
Field
Example
1
2
3
-72.444
-71.852
-71.804
X Coordinate
REAL
Floating point
number with
precision to 2
decimal
places; units
are in meters
METERS
Yes
Y Coordinate
REAL
Floating point
number with
precision to 2
decimal
places; units
are in meters
METERS
Yes
Z Coordinate
REAL
Floating point
number with
precision to 2
decimal
places; units
are in meters
METERS
Yes
34.24
-0.74
1.80
Continued:
MARKER
NUMBER
INTEGER
1-32767
Yes
1
CENTER
FREQUENCY
(OPTIONAL)
INTEGER
100000 to
3000000000
Hz
Yes in Spectrum
Analyzer mode.
No in Power
Monitor
900000000
SPAN FREQUENCY
(OPTIONAL)
INTEGER
0 and 5000 to
3000000000
Hz
Yes in Spectrum
Analyzer mode. No in
Power Monitor
5000000
Anritsu User’s Manual - Page 12 of 13.
Continued:
RESOLUTION
BW
(OPTIONAL)
INTEGER
0-3
VIDEO BW
(OPTIONAL)
REFERENCE LEVEL
(OPTIONAL)
INTEGER
0-3
Yes in Spectrum
Analyzer mode.
No in Power
Monitor
1
Yes in Spectrum
Analyzer mode.
No in Power
Monitor
1
INTEGER
-120000 to 20000
Thousandths of dBm
Yes in Spectrum
Analyzer mode. No in
Power Monitor
-50000
Continued:
DB/DIV
(OPTIONAL)
NUM POINTS
(OPTIONAL)
INTEGER
2 to 15
INTEGER
1-32767
Yes in Spectrum
Analyzer mode.
No in Power
Monitor
10
Yes in Spectrum
Analyzer mode.
No in Power
Monitor
400
SWEEP/POWER
DATA
[MAY BE MORE
THAN 1]
REAL
Floating point number
with precision to 3
decimal places
DBm
Yes
-67.234
©2009 Extreme Networks, Inc. All rights reserved.
Extreme Networks, the Extreme Networks logo, Altitude and Summit are either
trademarks or registered trademarks of Extreme Networks, Inc. in the United States
and/or other countries.
All other trademarks are property of their respective owners.
Anritsu User’s Manual - Page 13 of 13.