1
CONRAD IM INTERNET http://www.conrad.de
100 % recycling paper.
Bleached
without
chlorine.
GB
Imprint
These operating instructions are published by Conrad Electronic GmbH, Klaus-Conrad-Str. 1, 92240 Hirschau/Germany
No reproduction (including translation) is permitted in whole or part e.g. photocopy, microfilming or storage in electronic data processing equipment, without the express written consent of the publisher.
The operating instructions reflect the current technical specifications at time of print. We reserve the right to change the
technical or physical specifications.
© Copyright 1998 by Conrad Electronic GmbH. Printed in Germany.
100%
papier
recyclé.
Blanchi
sans chlore.
F
Note de l´éditeur
Cette notice est une publication de la société Conrad Electronic GmbH, Klaus-Conrad-Str. 1, 92240 Hirschau/Allemagne.
Tous droits réservés, y compris traduction. Toute reproduction, quel que soit le type, par exemple photocopies, microfilms
ou saisie dans des traitements de texte electronique est soumise à une autorisation préalable écrite de l`éditeur.
Impression, même partielle, interdite.
Cette notice est conforme à la règlementation en vigueur lors de l´impression. Données techniques et conditionnement
soumis à modifications sans aucun préalable.
© Copyright 1998 par Conrad Electronic GmbH. Imprimé en Allemagne.
D
Impressum
Diese Bedienungsanleitung ist eine Publikation der Conrad Electronic GmbH.
100 %
Recyclingpapier.
Chlorfrei
gebleicht.
Alle Rechte einschließlich Übersetzung vorbehalten. Reproduktionen jeder Art, z. B. Fotokopie, Mikroverfilmung, oder die
Erfassung in elektronischen Datenverarbeitungsanlagen, bedürfen der schriftlichen Genehmigung des Herausgebers.
Nachdruck, auch auszugsweise, verboten.
Diese Bedienungsanleitung entspricht dem technischen Stand bei Drucklegung. Änderung in Technik und Ausstattung
vorbehalten.
© Copyright 1998 by Conrad Electronic GmbH. Printed in Germany.
NL
Impressum
100 %
Recyclingpapier.
Deze gebruiksaanwijzing is een publicatie van Conrad Electronic Ned BV.
Alle rechten, inclusief de vertaling, voorbehouden. Reproducties van welke aard dan ook, fotokopie, microfilm of opgeslagen in een geautomatiseerd gegevensbestand, alleen met schriftelijke toestemming van de uitgever.
Chloorvrij
gebleekt.
Nadruk, ook in uittreksel, verboden.
Deze gebruiksaanwijzing voldoet aan de technische eisen bij het ter perse gaan. Wijzigingen in techniek en uitrusting
voorbehouden.
© Copyright 1998 by Conrad Electronic Ned BV. Printed in Germany.
*09-98/MS
GB
O P ERAT I N G
INSTR UCTIONS
Dual Trace Storage Oscilloscope
OS-3020 D, 20 MHz, Best.-Nr.: 13 12 02
OS-3060 D, 60 MHz, Best.-Nr.: 13 12 10
F
NOT I C E
Page 02 - 40
D ´ E MPLOI
Oscilloscope à mémoire à deux voies
OS-3020 D, 20 MHz, Best.-Nr.: 13 12 02
OS-3060 D, 60 MHz, Best.-Nr.: 13 12 10
D
Page 42 - 80
B E D I EN UN G SANLEITUNG
Zweikanalspeicheroszilloskop
OS-3020 D, 20 MHz, Best.-Nr.: 13 12 02
OS-3060 D, 60 MHz, Best.-Nr.: 13 12 10
NL
Seite 82 - 120
G EBRUI KS A ANWIJZING
Tweekanaaloscilloscoop
OS-3020 D, 20 MHz, Best.-Nr.: 13 12 02
OS-3060 D, 60 MHz, Best.-Nr.: 13 12 10
Pagina 122 - 160
GB
Dual Trace Storage Oscilloscope OS-3020 D/OS-3060 D
Proper use of the storage oscilloscope includes:
Measurement and display of various DC measuring signals up to 20 MHz using the OS-3020 D or up to
60 MHz using the OS-3060 D with a maximum input voltage of 250 V DC or peak alternating voltage
(Vp = Vrms x 1.41; 1.41 = square root of 2). Storage and display of changes in signal waveforms up to
a maximum sampling rate of 20 Ms/s.
Warning! Please read carefully
Please read these operating instructions carefully. Any damage caused by failure to follow these
instructions will not be covered by guarantee. We accept no responsibility for any subsequent damage which may arise as a result.
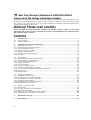
Contents
1.
1.1
1.2
Introduction .........................................................................................................................................3
Technical data ......................................................................................................................................3
Safety instructions ...............................................................................................................................6
2.
2.1
2.1.1
2.1.2
2.1.3
2.1.4
2.1.5
2.1.6
Operating Instructions for Oscilloscope ............................................................................................8
Description of controls ........................................................................................................................8
Display settings and power switch .....................................................................................................9
Vertical amplifier section ....................................................................................................................9
Sweep and trigger section ................................................................................................................10
Readout operator panel....................................................................................................................11
Storage mode operator panel ..........................................................................................................11
General ...............................................................................................................................................12
2.2
2.2.1
2.2.2
2.2.3
2.2.4
2.2.5
2.2.6
2.2.7
2.2.8
2.2.9
2.2.10
Basic settings ......................................................................................................................................12
Default settings of switches and knobs ...........................................................................................12
Cable connections (signal leads).......................................................................................................14
Screen overlays, explanation ............................................................................................................15
Single trace mode..............................................................................................................................17
Dual trace mode ................................................................................................................................18
Optional trigger settings...................................................................................................................18
Addition and subtraction of signals.................................................................................................19
X-Y mode (phase displacement, Lissajous patterns) .......................................................................20
Delay mode ........................................................................................................................................20
Storage mode ....................................................................................................................................21
2.3
2.3.1
2.3.2
2.3.3
2.3.4
2.3.5
2.3.6
Taking measurements........................................................................................................................27
Amplitude measurements .................................................................................................................27
Measurement of time/time-intervals................................................................................................28
Measurement of period, pulse width ..............................................................................................28
Frequency measurements .................................................................................................................28
Measurement of phase displacement ..............................................................................................29
Measurement of rise time.................................................................................................................30
2.4
2.4.1
2.4.2
2.4.3
2.4.4
2.4.5
Digital X-Y plotter output ................................................................................................................31
Specification.......................................................................................................................................31
Interface connection, pin assignment ..............................................................................................36
Setting the DIP switch .......................................................................................................................38
Setting on the oscilloscope (to start plotter)...................................................................................38
Troubleshooting if plotter does not work .......................................................................................39
3.
Maintenance and Care ......................................................................................................................39
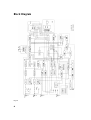
4.
Block Diagram....................................................................................................................................40
2
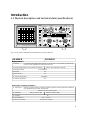
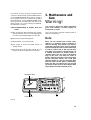
Introduction
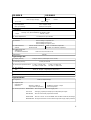
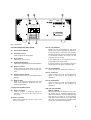
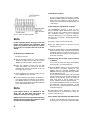
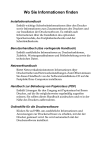
1.1 Physical description and technical data (specifications)
HORIZONTAL
TRACE
ROTATION
B TIME/DIV
2
µs 5
.5
20
.2
ON OFF
x100 WHEN ROLL
READOUT/CURSOR
INTEN
VARIABLE POSITION X
.2. .1 .50 20
.5.
10 µS
ms 1
5
2
2
5
1
10
.5
20
.2
50
.1
.1
.2
S
1
10
POWER
TRIGGER
A TIME/DIV
DLYD POSITION
+
A
A INT
X-Y
HOLD
OFF
MODE
+
CAL
IN
OUT
NORM
SINGLE
SOURCE
AUTO
CH1
NORM
CH2
TV-V
LINE
TV-H
EXT
EXT TRIG IN
MENU
HOLD
SAVE
1 MΩ 25 pF
250 V
MAX
SELECT
PLOT
RECALL
!
STORAGE MODE
STORAGE
B
B TRIG'D
FOCUS
0
-
HORIZ DISP
V. T.1/ T
ON/OFF SELECT
LEVEL
PULL x10 MAG
VERTICAL
VOLTS/DIV
SCALE
.2
AC
GND
DC
.5
10
.5
1 MΩ 25 pF
250 V
MAX
POSITION Y
DUAL
PULL INV
CAL
CH1 X
.1
.5
CH2
ADD
5
VARIABLE
CH1
PULL x 5 MAG
!
VOLTS/DIV
.2
20
.2
,5 Vpp
MODE
50 mV
1
PROBE
ADJUST
POSITION
.1
50 mV
1
20
.2
10
.5
AC
GND
DC
5
CAL
VARIABLE
PULL x 5 MAG
CH2 Y
1 MΩ 25 pF
250 V
MAX
!
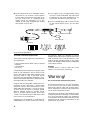
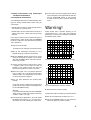
DIGITALE STORAGE OSCILLOSCOPE OS-3060 D 60 MHz
Fig. 1. Front view of OS-3060 D (the OS-3020 D is almost identical)
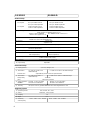
OS-3020 D
OS-3060 D
Display section
1) ) Design:
6" rectangular CRT display with graticule, 8 x 10 div (1 div = 1 cm), marker for determining
rise time, 2 mm graduation on central axes (X and Y).
approx. 10 kV (relative to cathode)
2) Anode voltage approx. 1.9 kV (relative to cathode)
3) Phosphor coating
p 31 (standard)
4) Focusing
Yes
5) Trace rotation
Yes
6) Graticule illumination
Adjustable
Yes
7) Intensity adjustment
Z-axis input = intensity modulation
1) Input signal:
Intensity of electron beam is reduced by applying a positive voltage. Significant modulation
is perceptible beyond a certain voltage level.
Beyond 5 Vpp (pp = peak to peak)
2) Bandwidth
3) Coupling
4) Input resistance
5) Max. input voltage
0(DC) to 2 MHz (-3dB)
0 (DC) to 3,5 MHz (-3dB)
DC
20 KΩ to 30 KΩ
30 V (DC or V AC peak)
3
OS-3020 D
OS-3060 D
Vertical sweep
1) Bandwidth (-3 dB)
DC coupled
DC up to 20 MHz normal
DC up to 7 MHz expanded
DC up to 60 MHz normal
DC up to 10 MHz expanded
AC coupled
10 Hz to 20 MHz normal
10 Hz to 7 MHz expanded
10 Hz to 60 MHz normal
10 Hz to 10 MHz expanded
2) Operating modes
CH 1, CH 2, ADD and DUAL
(CHOP: position of TIME/DIV switch 0.2 s to
approx. 5 ms ALT: TIME/DIV
ALT: TIME/DIV switch 2 ms to 0.1 µs
switch 2 ms to approx. 0.2 µs)
3) Deflection factor
5 mV/div to 5 V/div, X5 expansion in 10 calibrated steps:
1 mV/div to 1 V/div in 10 calibrated steps
normal: ±3%
4) Accuracy
expanded: ±5%
5) Input impedance
6) Input voltage:
approx. 1 MΩ in parallel with 25 pF ±3 pF
250 V max. (DC and V AC peak) directly or, when using a probe, referred to
the latter's specification
7) Input coupling
8) Rise time
AC-DC-GND
17.5 ns or less (50 ns or less
with X5 expansion)
5.8 ns or less (35 ns or less
with X5 expansion)
9) CH 1 output
20 mV/div into 50 Ω: 0 to
10 MHz -3 dB (at rear of unit)
10) Inversion
Only in case of CH 2 (channel 2)
11) Signal delay
Adjustable
Horizontal sweep
1) Display options:
2) Time base A
Hold-off time
3) Time base B
Sweep delay
Jitter
A, A int, B, B trig. D, X-Y
0.2 µs/div to 0.2 s/div in 19
calibrated steps
0.1 µs/div to 0.2 s/div in 20 calibrated steps
Adjustable by means of hold-off potentiometer
0.1 µs/div to 19 µs/div in 7 calibrated steps
0.2 µs/div to 20 µs/div in 7
calibrated steps
1 to 10 div
better than 1:20,000
4) Sweep expansion
Caution:
10 times => up to 20 ns/div)
20 ns/div is not calibrated
10 times => up to 10 ns/div)
10 ns/div is not calibrated
5) Accuracy
±3% (10 ºC to 35 ºC), possible additional error with magnification is ±2%
Triggering system
1) Operating modes
2) Source
auto, normal, TV-V, TV-H
Channels 1, 2, line and ext.
3) Coupling
4) Slope
5) Sensitivity
and frequency
4
AC
+ or 20 Hz – 2 MHz 2 Hz – 20 MHz
20 Hz – 2 MHz 2 Hz – 60 MHz
OS-3020 D
OS-3060 D
AUTO, NORM
INT 0,5 div 1,5 div
EXT 0,2 Vpp 0,8 Vpp
TV-V, TV-H
0,5 div
0,2 mV
1,5 div
0,8 mV
1 div or 1 Vpp
6) External trigger
Input impedance
Max. input voltage
1 MΩ II approx. 30 pF
250 V (DC or AC peak)
X-Y function
1) X input: =
Y-input:
channel 1, up to accuracy and bandwidth
Accuracy: ±5%, DC bandwidth up to 500 kHz (-3 dB)
channel (= CH) 2
2) Phase displacement
3 or less (for DC up to 50 kHz)
Screen overlays
Direct reading of amplitude: ∆V
Direct reading of period: ∆T
Direct reading of frequency: 1/∆T
1) Readouts:
2) Usable switches/
controls
Vertical axis (CH1 and CH2)
Horizontal axis
3) Usable cursor area
starting from
co-ordinate intersection
V/DIV, not calibrated, expanded
Time/DIV, not calibrated, expanded
Vertical ±3 div, horizontal ±4 div
4) Resolution
1/25 div
Digital storage data
1) Display memory
1 Kb per channel (= 1000 bytes = 100 "words")
2) Recording memory
2 x 1 Kb per channel
3) Memory for special functions
5 µs/div - 0.2 s/div; 2 Kb
0.2 µs/div - 2 ms/div: 1 Kb
4) Max. sampling
rate
5 µs/div - 0.2 s/div: 2 Kb
0.1 µs/div - 2 µs/div: 1 Kb
10 MS (106 samples = megasamples = MS)/second
5) Vertical resolution
25 "pixels"/div
6) Horizontal resolution
100 "pixels"/div
Digital bandwidth
1) Single shot
2) Repetitive with
periodic signal
waveform
3) Memory functions
5 MHz (4 samples/sweep)
20 MHz or 7 MHz on
Y input with X5 expansion
60 MHz or 7 MHz on Y input
with X5 expansion
NORM MODE : data of signal are with each trigger pulse
AVG mode
: averaging, 4 passes per sample up to 256 passes per sample
ROLL MODE
: data are continuously acquired and stored
HOLD MODE
: data are "frozen" in case of NORM, AVG and ROLL functions (still image)
SINGLE MODE : the signal waveform is frozen after storage (still image), display functions
5
OS-3020 D
OS-3060 D
SMOOTH:
INTERPOLATION:
the stored signal is displayed either by individual pixels (dots) or
continuously (without interruption)
the stored signal is either displayed by pixels (dots), linearly or as a
"reconstituted"/approximated sine-wave
4) Data security
Up to 2 stored signals can be saved/stored and retrieved/reproduced at any time
5) Pre-trigger:
Plotter:
Display of signals before the trigger event
The stored signal can be printed out on an HP-GL plotter via the RS-232 interface
5) Write speed
at output
1/10th of TIME/DIV setting
6) X-Y function
Sensitivity
Phase error
7) Spot velocity
8) Probe setting
9) Power supply
X-axis = CH1: 1 mV - 5 mV/div ±5%
Y-axis = CH2: 1 mV - 5 mV/div ±5%
3 or less in the DC range up to 50 kHz
Single: 0,2 µs/div to 20s/div (= x 100)
Repetitive: 0,2µs/div to 2 µs/div
„ROLL“-Funktion: 0,5µs/div to 20 s/div
ALT: 0,5 µs/div to 1 ms/div
CHOP: 1 ms/div to 20 s/div
0,1 µs/div to 20s/div
0,1 µs/div to 2 µs/div
0,5 µs/div to 20 s/div
0,5 µs/div to 0,5 ms/div
0,5 ms/div to 20 s/div
approx. 1 kHz, 0.5 V pp (±3%) square-wave pulse, mark-to-space ratio: 50%
Voltage range
100 V(90 to 110) AC
120 V(108 to 132)AC
220 V(198 to 242)AC
240 V(216 to 250)AC
Fuse
2A/250 V
2A/250 V
1A/250 V
1A/250 V
10) Mains frequency
50/60 Hz
11) Power consumption
approx. 65 W
12) Mass
approx. 8 kg
13) Dimensions L x W x H
430 x 320 x 140 mm
Environmental conditions
1) Operating temperature range
2) Storage temperature range
3) Atmospheric humidity
0 ºC (min.) to +40 ºC (max.)
-20 ºC to +70 ºC
35% min., 85% max. (RH)
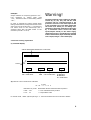
1.2 Safety instructions
Warning!
1.2.1 Selecting the mains input voltage
Setting the voltage selector switch incorrectly
or fitting the wrong fuse can destroy the
measuring appliance.
The input voltage can be adapted to suit all the
usual line voltages encountered in Europe by
means of a built-in voltage selector switch.
Before using the oscilloscope, make certain
that the correct mains voltage has been selected and that the appropriate mains fuse has
been fitted.
6
To set the voltage, make sure that the appliance
has been disconnected from all voltage sources
and measuring circuits. Having isolated it from
the mains supply, prise out the fuse holder
"cover" with the voltage markings and check
that the mains fuse is of the correct type and
appropriate current rating and then replace the
fuse holder "cover" so that the arrow mark
matches the actual mains voltage.
1.2.2
Safety rules when installing and handling
Observe the following rules when setting up the appliance:
1. Do not operate it in extremely cold or hot
locations, in a vehicle in summertime or in the
vicinity of a fan heater.
2. Never switch on the appliance immediately
after it has been moved from a cold into a
warm room. The condensation created may
destroy your appliance. Leave the appliance
switched off until it has reached ambient
temperature.
3. Avoid the following unsuitable environmental conditions:
- Dampness or excessively high atmospheric
humidity
- Dust and flammable gases, vapours or solvents
- Severe vibration
- Strong magnetic fields such as those in the
vicinity of machinery or loudspeakers.
4. Never block the ventilation slots or openings
in the housing because this can cause heat
accumulation and/or damage.
5. Never operate the appliance near hot soldering bits.
6. Never lay the oscilloscope with its controls
side facing down because this can damage
the adjusting knobs.
1.2.3 General safety instructions
1. Oscilloscopes OS-3020 D and OS-3060 D were
manufactured and tested in accordance with
DIN 57411 Part 1/VDE 0411 Part 1, Protective
measures for electronic equipment, and left
our factory in a perfectly safe condition.
To keep them in this condition and to ensure
their safe operation, the user must observe
the safety instructions and warnings contained in these operating instructions.
2. The appliance is a Class I instrument. It is
equipped with a VDE tested power cord with
a protective conductor and must therefore
only be connected to and powered by a 230 V
AC mains supply with protective earthing.
3. Make sure that there is no break in the
(yellow/green) protective conductor in the
power cord, in the appliance or in the mains
supply because this would create a risk of fatal
injury.
4. Measuring appliances must be kept away
from children!
5. On commercial premises, the accident prevention regulations of the Association of
Industrial Professional Associations with respect to electrical systems and operating
equipment must be observed.
6. In schools, training centres and DIY workshops, the operation of measuring appliances
must be supervised by responsible, trained
personnel.
7. Opening covers or removing parts can lead to
live parts being exposed, unless this can be
performed manually. Connection points can
also be live. Before being balanced, serviced
or repaired or having any parts or componentry replaced, if the appliance must be
opened, it must first be isolated from any
sources of voltage or voltage circuits. If, subsequently, it is absolutely necessary to balance,
service or repair the open appliance while
live, this must be carried out by a qualified
technician familiar with the risks involved and
the relevant regulations (VDE 0100).
8. Capacitors inside the appliance may still be
charged even after the appliance has been
isolated from all sources of voltage and voltage
circuits.
9. Make sure that only fuses of the specified
type and specified current rating are used as a
replacement. The use of rewired fuses or
shorting out the fuse holder is not permissible.
7
To replace the fuse safely, isolate the appliance
from all voltage sources (pull out the mains
plug!) and voltage circuits. After isolating the
appliance, use a suitable screwdriver to prise
out the fuse holder together with the faulty
fuse fitted, remove the faulty fuse and replace it by a fuse of the same type.
11. Before each measurement, check your measuring appliance (oscilloscope) and measuring leads (probes, BNC cable) and the
power cord for damage.
12. To avoid any possibility of electric shock,
ensure that you do not come into contact,
even indirectly, with the probe tip(s) and/or
alligator clips in the case of exposed BNC
wiring or the connections being measured
(measuring points).
When inserting the replacement fuse into the
fuse holder, make sure that the arrow mark
corresponds to selecting the correct mains
input voltage.
13. When safe operation is obviously no longer
possible, the appliance must be taken out of
use and secured from being accidentally
switched on.
It can be assumed that safe operation is no
longer possible when:
10. Exercise special care when dealing with
voltages in excess of 25 V alternating current
(AC) or 35 V direct current (DC). Even at
voltages as low as these, it is still possible to
suffer a life-threatening electric shock if
contact is made with conducting parts.
- there is visible damage to the appliance,
- the appliance is no longer working,
- the appliance has been stored for an extended period in unsuitable conditions,
- it has been exposed to adverse transport
conditions.
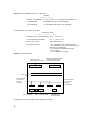
2. Operating Instructions for Oscilloscope
OS-3020 D/OS-3060 D
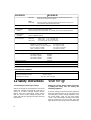
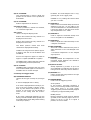
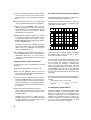
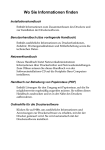
2.1 Description of controls
3
2
1
5
TRACE
ROTATION
+
POWER
22
31
23
21
24
28
25
29
HORIZONTAL
B TIME/DIV
2
µs 5
.5
.2
ON OFF
x100 WHEN ROLL
READOUT/CURSOR
INTEN
VARIABLE POSITION X
.2. .1 .50 20
.5.
10 µS
ms 1
5
2
2
5
1
10
.5
20
.2
50
.1
.1
.2
S
1
10
A
ON/OFF SELECT
X-Y
FOCUS
A INT
LEVEL
0
PULL x10 MAG
HOLD
OFF
-
MODE
+
CAL
IN
OUT
NORM
HORIZ DISP
V. T.1/ T
26
SOURCE
AUTO
CH1
NORM
CH2
TV-V
LINE
TV-H
EXT
EXT TRIG IN
1 MΩ 25 pF
250 V
MAX
STORAGE MODE
STORAGE
B
B TRIG'D
SINGLE
MENU
HOLD
SAVE
SELECT
PLOT
RECALL
SCALE
.2
AC
GND
DC
PROBE
ADJUST
32
MODE
POSITION Y
.2
CH1
50 mV
20
.2
10
DUAL
ADD
5
VARIABLE
.1
.5
CH2
PULL INV
50 mV
1
20
.2
10
.5
VARIABLE
PULL x 5 MAG
CH2 Y
CH1 X
Fig. 2, Front view
8
10
8
14
12
16 18
36
17
11
15
1 MΩ 25 pF
250 V
MAX
!
DIGITALE STORAGE OSCILLOSCOPE OS-3060 D 60 MHz
35
AC
GND
DC
5
CAL
CAL
PULL x 5 MAG
!
VOLTS/DIV
.1
.5
1
.5
1 MΩ 25 pF
250 V
MAX
POSITION
30
!
VERTICAL
VOLTS/DIV
4
27
TRIGGER
A TIME/DIV
DLYD POSITION
20
,5 Vpp
20
13
9
34
19
33
RS-232C
EXT BLANKING
INPUT
CH1
OUTPUT
CONTROL
CONNECTOR
WARNING
DISCONNECT SUPPLY
BEFORE CHANGING RANGE
220
100
120
240
LINE VOLTAGE (50/60 Hz) FUSE
AC 100 V
AC 90~110 V
AC 120 V
AC 108~132 V
AC 220 V
AC 198~242 V
AC 240 V
AC 216~250 V
6
2A
S/N
XXX XXXXX XX XXXXXXX
XXXX XXXXX
1A
7
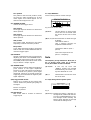
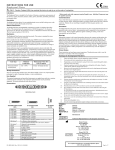
Fig. 3, Rear view
2.1.1 CRT settings and power switch
(1)
Power switch ON/OFF
(2)
Inten(sity) control:
Used to adjust the brightness
(3)
Focus control:
Adjusts the "trace focus"
(10) CH 1 AC/GND/DC
Switch for type of coupling for the input
signal to the vertical amplifier of channel 1.
In the AC position, a capacitor that "blocks"
the DC component of the measuring signal
is connected between the input of the
amplifier and the socket.
In the GND position, the amplifier input is
connected to the frame earth
(4)
Graticule illumination:
Adjusts the variable background illumination
(5)
Rotation control:
Used to adjust the trace system to the horizontal and vertical lines on the screen graticule
(11) CH 2 AC/GND/DC:
Switch for type of coupling for channel 2
(6)
Voltage selector switch:
Allows correct setting of appropriate mains
voltage
(12) CH 1 volts/div:
Used to match the level of the measuring
signal to the input of the amplifier of
channel 1
(7)
Mains socket:
Used to connect the supplied power cord
(cord with protective conductor for nonheating appliances)
2.1.2 Vertical amplifier section
(8)
CH-1 or X-socket:
Used to connect a measuring signal for
channel 1 or for the X-axis in the case of
X-Y mode
(9) CH-2 or Y-socket:
Used to drive channel 2 or the Y-axis in the
case of X-Y mode
In the DC position, the measuring signal is
fed directly to the signal amplifier input.
(13) CH 2 VOLTS/DIV:
Used to match the level of the measuring
signal to the input of the amplifier of
channel 2
(14) and (15) Variable
PULL X 5 MAG:
When these knobs are pulled out, the vertical sweep can be steplessly adjusted between the latched-in levels of switches (13)
and (14) up to a ratio of 1:5 (not calibrated). When these knobs are not used, make
sure that they are turned to the right as far
as the stop, latched and pushed in.
9
(16) CH 1 POSITION:
This potentiometer is used to adjust the
position of the channel 1 trace upwards or
downwards
(17) CH 2 POSITION:
Position adjustment for channel 2
(17a) PULL CH 2 INV:
If (17a) is pulled out, channel 2 is inverted,
i.e. rotated through 180º
(18) V mode:
Used to modify the display mode.
Position CH1 means that only channel 1 is
displayed on the screen.
Position CH2 means that only channel 2 is
displayed on the screen.
The DUAL position means that both
channels are displayed alternately.
CHOP for the range from 0.2 s/div to approx.
5 ms/div in the case of the OS-3020 D and
OS-3060 D.
ALT for the range from approx. 2 ms/div to
approx. 0.2 µs/div (OS-3060 D: 0.1 µs/div).
The ADD position means that both channels
are algebraically summed (CH1+CH2).
(19) CH 1 OUTPUT:
This BNC socket is located at the rear of the
unit: the attenuated signal from channel 1 is
available here for further analysis.
2.1.3 Sweep and trigger section
(20) HORIZONTAL DISPLAY:
Used to set the type of sweep: A, B, B trig D
etc.
A: Trace is displayed with no delay.
A int:Trace is displayed with no delay. A portion of the trace (signal) is shown "amplified" by time base B. The position of this
portion on the screen can be altered by
means of the "Delay Time Pos control"
knob.
B: The trace is displayed depending on the
setting of the B Time/Div switch (speed), the
A Time/Div switch (time delay) and the Delay
Time Pos pot (knob).
10
B TRIG'D: The time-delayed trace is triggered by the "first" trigger pulse.
OS-3060 D X-Y: pressing this button takes
you into X-Y mode.
(21) TIME/DIV A:
Used to set the time-base sweep (horizontal
deflection) from 0.2 s to 0.2 µs/div in the
case of the OS-3020 D in 19 calibrated steps;
turning the switch to the right as far as the
stop is equivalent to X-Y mode.
(21) TIME/DIV A:
Used to adjust the time-base sweep from
0.2 s to 0.1 µs/div on the OS-3060 D
(22) TIME/DIV B:
Used to adjust the time-base sweep of the
"delayed" B time base
(23) DLY'D POSITION
This knob is used to determine the point at
which deflection of the non-delayed trace
starts.
= Horizontal adjustment of the delayed
signal portion.
(24) VARIABLE:
Infinitely-variable fine adjustment of the
time-base sweep between the latched-in
positions of switch (22).
(24a) PULL X 10 MAG:
Sweep expansion by a factor of up to 10
(not calibrated). To calibrate, turn the pot to
the right as far as the stop until it latches in.
(25) POSITION <=>:
Used to change the trace position from right
to left and vice versa
(26) TRIGGER MODE:
Used to set the triggering mode:
AUTO position
In this position, automatic triggering is
active, a trace is always visible on the screen
even when there is no input signal.
Triggering takes place automatically beyond
a frequency of approximately 25 Hz.
NORM position
Manual triggering mode must be selected
(pressed) if the incoming signal has a frequency of 25 Hz or less. If no signal is
present, no trace is visible.
TV-V position
This position and the next position (TV-H)
are used for easier triggering by TV and
video signals. TV-V below approx. 0.1 ms
and TV-H above approx. 0.1 ms.
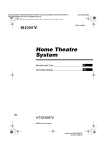
2.1.4 (31) READOUT:
Cursor control panel for screen overlays
READOUT/CURSOR
V. T.1/ T
(27) TRIGGER SOURCE:
Used to set the trigger source
CH1 position
The trigger signal of channel 1 is used in this
switch position.
CH2 position
The trigger signal of channel 2 is used in this
switch position.
LINE position
The trigger signal derived from the mains
frequency is used in this switch position.
ON/OFF SELECT
Fig. 4 Cursor Control Panel
(a) Select
(b) ∆V, ∆T, 1/∆T Use this button to select the type
of display:
∆V stands for delta V
(volt = voltage), primarily for
amplitude measurements
EXT position
If you select this switch position, the signals
that are fed into the EXT TRIG IN socket are
used as a trigger signal.
(28) HOLDOFF:
Certain complex signals can be triggered by
adjusting this knob. The HOLDOFF time is
increased by turning the knob to the right.
The NORM position (turned left as far as the
stop) is used for "simple" signals.
(29) TRIGGER LEVEL:
This pot can be used to select the triggering
point relative to the signal amplitude.
Turning it to the right moves the triggering
point towards the positive peak signal
amplitude, turning it to the left moves the
triggering point towards the negative peak
signal amplitude.
(29a) Trigger SLOPE switch:
Pulling out or pushing in the trigger level
control selects the positive-going edge of
the signal
Use this button to select which
cursor line is to be moved (note
the arrows at the start of each
line)
∆T stands for delta T (time =
period)
1/∆T is the reciprocal of the
period --> frequency
Note
The frequency is only indicated in "MHz, kHz or
Hz" in storage mode: when not in storage
mode, the number of DIVs is indicated.
(c) ON/OFF
If the "∆V, ∆T, 1/∆T" and
"SELECT" buttons are pressed
simultaneously, the screen overlays are switched on or off.
(d) >,<
These buttons are used to move
the cursor lines
2.1.5 (32) Storage mode operator panel
STORAGE MODE
STORAGE
SINGLE
Pulled => negative
Pushed => positive
(30) EXT TRIG IN:
BNC socket used to connect an external
trigger signal
MENU
HOLD
SAVE
SELECT
PLOT
RECALL
Fig. 5
(a) storage Pressing this button "switches on"
storage mode; a LED under the button cap is lit/flashes/flickers to confirm storage mode. Pressing the
button again switches off storage
mode and the LED goes out.
11
(b) MENU
This button is used to select the
various storage modes:
PROBEx1, x10 - SMTH (Smooth)
ON, OFF - AVG (Average) 4, 16,
64, 256 and NORM - ROLL ON,
OFF.
gering, the LED goes out. When
the sampling process has been
completed, a new signal waveform is shown on the screen.
The SINGLE sequence is terminated, the screen signal is paused
(HOLD) and the LED under Hold
goes out.
- ITPL (interpolation) OFF, LIN,
SIN-AMAG (= ALT MAG) ON, OFF
- G-NG (Go-NoGo) XH, OH NORM. After each button press,
a LED under the button cap is
lit.
(c) HOLD
(d) SAVE
(e) RECALL
(f) PLOT
(g) SELECT
(h) SINGLE
12
When this button is pressed, the
sampling process is paused/stopped and the last signal waveform displayed is frozen. When
the button is pressed again, a
LED under the button cap is lit.
Pressing this button again
restarts the sampling process
and the LED goes out.
This button is used to store the
instantaneously displayed signal
waveform in the "recording"
memory as soon as the Hold
button is pressed. A LED under
the button cap is briefly lit.
This button is used to reproduce
the recorded signal. Two memory contents can be retrieved.
After this button is pressed, a
LED under the button cap is lit.
The previously set input sensitivity in V/div, the horizontal
deflection in Time/div and the
signals in memory A (=1) or B
(=2), S A or S B are displayed in
the lower third of the screen
overlay.
This button initiates transfer of
the signal from the screen to an
X-Y plotter. The Hold button
must be pressed beforehand to
achieve this.
This button can be used to
select/set/change the operating
modes under MENU.
The red LED under the button
cap is lit to show that a trace is
displayed as soon as the trigger
signal is obtained. After trig-
2.1.6 General
(33) DIP switch and RS-232 interface:
DIP switch
RS-232
connection
The DIP switch is used to adapt
the interface to any plotter or
computer that is connected to
the oscilloscope.
The connecting cable between
the oscilloscope and the plotter/computer is connected to this
'D' sub-miniature socket.
(34) EXT BLANKING INPUT:
If a positive signal is applied to this BNC socket
at the rear of the unit, this darkens the trace; a
negative signal makes the trace brighter
(unblanking/blanking/modulation).
(35) CAL:
On this pin there is a rectangular-pulse signal
that is used exclusively to calibrate a test probe
(0.5 Vpp/1 kHz)
(36) Earth connection:
This earth connection provides a ground
reference for separate earth conductors.
2.2 Basic settings
2.2.1 Default settings of switches and knobs
(controls)
a) Before switching on the appliance, all the
switches and knobs must be set to their basic
positions:
b) Connect the power cord to the mains socket
(7). It is crucial to make sure that the cord is
properly plugged in and that the voltage selector switch has been correctly set (jumper
plug: note the direction of arrow and the
chart alongside it).
POWER switch
(1) :
OFF (not depressed)
INTEN
(2) :
set to left-hand stop
FOCUS
(3) :
set to middle position
AC/GND/DC switch
(10)+(11) :
set toAC
VOLTS/DIV switch
(12)+(13) :
set to 20 mV position
POSITION
16)+(17) :
VARIABLE
(14)+(15) :
middle position, depressed
set to right-hand stop, depressed
vertical mode switch
(18) :
set to CH 1 position
TIME/DIV switch
(20) :
set to 0,5 ms
VARIABLE knob
(24) :
set to right-hand stop, depressed
Horizontal POSITION
(25) :
set to middle position
Trigger MODE switch
(26) :
set to AUTO
Trigger SOURCE switch
(27) :
set to CH 1
Trigger LEVEL
(29) :
set to middle position
HOLDOFF knob
(28) :
set to NORM position = left-hand stop
Then connect the earthing-type plug to a
socket-outlet with an earthing contact and protective earthing.
Warning!
There must be no break in the protective conductor/earth connection inside the appliance, in
the power cord or in the socket-outlet because
any discontinuity in the protective conductor
would create a risk of fatal injury.
c) Actuate the power ON/OFF switch (1). After
roughly 30 s, slowly turn the INTEN knob (2) to
the right until the trace becomes visible on the
screen. Then set the desired brightness level.
NOTE:
Do not leave the brightness set to maximum for
any length of time in the absence of a signal.
Above all, note that no spot is visible on the
screen (= no horizontal sweep) immediately
after powering-up. Otherwise the electron
beam or spot will burn the CRT's internal
coating, thus damaging it.
d) Use the FOCUS knob (3) to adjust the trace
focus.
e) Then use the CH-1 POSITION knob (16) to
move the trace so that it coincides with the
horizontal centre line.
f) If the trace does not coincide exactly with the
centre line, adjust it by using a suitable
screwdriver to operate the ROTATION control
(5).
g) Use the POSITION knob (25) to align the trace
horizontally and centrally.
13
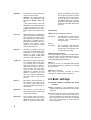
h) Set any probe that has a selectable attenuation ratio to 1:10, connect it to the channel
1 input (CH-1) and connect the probe tip to
the CAL output (35). A rectangular-pulse
signal, having an amplitude of 0.5 Vpp
divided by 10 (=Volt peak/peak=ss), should
then appear on the screen.
i) If the edges of the rectangular-pulse signal
are over or under modulated, the probe must
be matched to the input capacitance of the
oscilloscope. See figure on the next page.
j) Set the V-MODE switch (18) to channel 2 (CH
2) and repeat steps h) and i) for the other
probe.
Shielding
Tip
Compensation trimmer
Earth terminal
Probe body
Optimum
compensation
Capacitance
too low
Capacitance
too high
Fig. 6. Probe compensation
2.2.2 Cable connections (signal leads)
Three types of signal leads can be connected to
the oscilloscope:
- a single measurement ribbon cable, insulated
conductor
- a coaxial cable
- or a probe.
A single lead may be sufficient for higher signal
levels of low impedance, such as those of TTL
circuits. This type of signal feed, however, is not
used very often in case of low-level signals
because of the unacceptable distortion it introduces. Unacceptable distortion is caused because
the single lead is not screened.
If signal sources having BNC outputs are to be
connected to the oscilloscope, a coaxial cable
should be used for such connections as a rule.
These cables are screened, i.e. the inner conductor that carries the signal is screened against
spurious external signals by braided copper
wires or braided tinned copper wires. This
"screen" is connected to the frame earth of the
power source or the oscilloscope.
If signals are to be measured on components or
subassemblies of circuits, probes are used for
14
this purpose. These are available in various
designs. Some probes have a switch that can be
used to change over to 1:10 attenuation (= calibration setting). Roughly 1/10th of the amplitude of the available measuring signal is displayed
in this switch position.
Example:
Indicated values = 5 mV pp, probe set to 1:10
position ==> actual value = 50 mV pp.
Warning!
Do not exceed the maximum input values.
If the source resistance or the line capacitance
are not known in the case of direct connection
between the device under test and the oscilloscope, especially at relatively high frequencies,
use a 1:10 low-capacitance probe.
One method of minimising the measuring error
at high frequencies in the case of coaxial cables
is to use a terminating resistor. The impedance
of this resistor which is connected directly to the
oscilloscope must match the impedance of the
signal source or the lead.
Example:
Output resistance of a frequency generator = 50 Ω.
Line resistance of coaxial cable used
= 50 Ω. Resistance value of terminating resistor
= 50 Ω.
In order to minimise the ripple voltage when
taking measurements, always connect the frame
earth of the circuit under test ("-" or housing) to
the frame earth of the oscilloscope (via a
screened cable with the BNC socket of the
relevant input CH 1 or CH 2).
Warning!
The frame terminals of the oscilloscope, the BNC
sockets (8), (9), (19), (30), (34) and the earth
connection (36) are connected directly to the
protective conductor of the mains input socket
or the connected power cord. Make certain that
the circuit in/on which you are making measurements is electrically isolated from the mains
by a transformer. Never connect the (BNC)
inputs/outputs directly to the mains supply,
chassis that are live or circuits that are operated
without transformers (input electrically isolated
from output). Danger - risk of fatal injury.
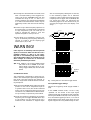
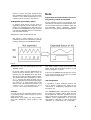
2.2.3 Screen overlays, explanation
(1) "Real-time display"
Values determined between the cursor lines
Cursor
CH 1 scale factor
ADD
CH 2 scale factor
A deflection
B deflection
X-Y scale factor
(a) Channel 1 and 2 scale-factor indication
V / DIV
P1 0X > 1 0 m V
Indication for probe
P 10X : 1:10
P 1X : 1:1
Blank field denotes calibrated switch position
> = non calibrated switch position
* = expanded 5 times
In vertical mode, "ADD" (18) the plus sign "+" is shown between the two scale-factor details.
15
(b) Display for the deflection factor of A, B and X-Y
Time/div
> 0. 5
m
s
“Blank“: X1 calibrated
*: X10 expanded
1.) In X-Y mode, "X-Y" is displayed: the "values" for
the Time/div setting of A or B disappear
>: not calibrated
2.) In delayed mode, the B time is displayed.
c) "Measurements" using the cursor lines
d
V
"Measured" value
+ 3 0 . 0
V
∆ (=delta) V: CH1, CH2, ADD, DUAL ∆V: +, -, mV, V, div
∆ T: time difference between
∆T: +, -, µs, ms, s, div
the two cursor lines
1/∆T: MHz, KHz, Hz...
1/∆T: reciprocal of ∆T
"div" is displayed in the following cases:
- the measured value of the previously set
channel is not calibrated
- in the case of time-delayed B sweep
- In X-Y mode
- In non calibrated "A mode"
(2) Display for storage mode
Measured value
between the cursor lines
Average, interpolation, SM for
"smoothing" (vertical line),
various operating modes
Cursor
Data "recorded"
by recording
memory
A (save A)
CH 1 scale factor
Data "recorded"
by recording
memory
B (SAVE B)
ADD
CH 2 scale factor
A deflection and
X-Y scale factor
(a) Channel 1 and channel 2 scale factor indication, see (1)(a)
16
(b) Display for the deflection factor of A, B and X-Y, see also (1)(b)
Time / Div
>
0.
5
m
s
„Blank“ :
:
:
:
X1, calibrated (not expanded)
No interpolation ______
Sinus (sin) interpolation
Linear (Lin) interpolation-
In X-Y mode, the usual*
details dissappear ans “X-Y” appears instead
X 10 expansion
(c) Measurements using the cursor lines, see (1)(c)
2.2.4 Single-trace mode
Single-trace mode using the single time base
and internal triggering is a frequently used operating mode. Use this mode if you only want to
observe one signal.
Because this oscilloscope is a dual-trace unit,
there are two particular ways of obtaining
single-trace operation.
a) If you want to read off the frequency on a
frequency counter at the same time as observing the signal, select channel 1 (CH 1) as
the signal feed. The signal applied to channel
1 can be picked off on a BNC socket at the rear
of the oscilloscope for further use, but at
reduced amplitude.
b) Channel 2 (CH 2) offers the facility to invert
the signal by means of the POSITION knob
(17), i.e. the signal is rotated through 180°.
Basic settings for single trace mode
1. Set up the oscilloscope for single trace mode as described below. Make sure that the trigger
SOURCE switch (27) and the channel that is used actually match (signal feed in channel 1 => switch
(27) set to CH 1)
Power switch
(1)
: set to ON
AC/GND/DC switch
(10) or (11)
: set tof AC
Vertical POSITION
(16) or (17)
: middle position and depressed
VARIABLE
(14) or (15)
: right-hand stop and depressed
Vertical MODE switch
(18)
: set to CH 1 or CH 2
Trigger MODE switch
(26)
: set to AUTO
Trigger SOURCE switch (24)
: set to CH 1 or CH 2
Trigger LEVEL
(29)
: set to middle position
HOLDOFF knob
(28)
: set to NORM position = left-hand stop
2. Use the POSITION knob (16) or (17) to bring
the trace into the centre of the screen
3. Connect the signal lead carrying the signal to
be fed in to the channel you previously selected. Set the VOLTS/DIV switch so that the
signal amplitude takes up the entire height of
the screen.
Warning!
Do not exceed the maximum input values.
Never connect voltages in excess of 300 V DC or
212 V AC rms.
4) To stop the signal moving, adjust the trigger
level knob (29) if necessary.
17
5. If the signal to be measured is too small, even
with a 5 mV/div setting, to be triggered correctly, pull out the VARIABLE knob (14). This
increases the range to 1:5, i.e. sets it to 1
mV/div. However, this reduces the bandwidth
to 7 MHz and measurement results may be
falsified by noise in the case of such small signals.
such as a rectangular-pulse signal. In contrast,
if the measuring signals are of different
frequency, use the channel that has the lower
frequency as the trigger source (SOURCE). Do
not forget that when you disconnect the
measuring signal from the channel that you
are using as a trigger source, the display "runs
away".
6. If there is only a dense frequency spectrum on
the screen with a 0.2 µs/div setting, especially
at high frequencies, pull out knob (21) in
order to expand the range to 1:10, this
expands 0.2 µs/div to 0.02 µs = 20 ns.
7. If the signal to be measured is a direct voltage or an extremely low-frequency alternating
voltage, it is best to set the coupling type
switch (10) or (11) to DC.
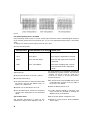
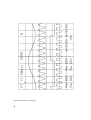
Video-signal
Synchronizing
signal pulse
(SYNC pulse)
1H
(Horizontal)
1 V (Vertical)
(a) Complete video signal
WARNING!
If the signal is an extremely low-level periodic
signal, it is crucial to make sure that it is not a
pulsating voltage, i.e. that it is not superimposed on an extremely high direct voltage
such as the ripple voltage of a loaded source of
direct voltage. It is crucial not to exceed the
maximum permitted input values.
(b) TV-V vertical video-signal coupling
(Re. 7.) In addition, the trigger MODE switch
(26) must be set to NORM if the measuring signal is less than 25 Hz. If necessary, trigger LEVEL (29) must be readjusted.
(c) TV-H horizontal video-signal coupling
Negative
polarity
2.2.5 Dual trace mode
The oscilloscope is designed for dual-trace operation. The oscilloscope is generally operated in
this mode. The basic settings are identical to
those for single-trace mode but with the following exceptions:
1. Set the vertical MODE switch (18) to the DUAL
position. In the case of frequencies equal to
or greater than 0.2 ms, ALT mode is selected
and in case of frequencies having a period of
less than 0.5 ms, CHOP mode is selected without you having to operate any other switch.
2. If both the measuring signals are of the same
frequency, set the trigger SOURCE switch (27)
to the position for the channel that has a
waveform that resembles a stepped shape
18
(d) Sync polarity
Fig. 7 Using the TV-V and TV-H trigger switch
2.2.6 Optional trigger settings
Choose the triggering mode (trigger MODE =
(26)).
In the NORM manual mode, a trace is only
"painted" on the screen if the input signal
reaches a level that corresponds to that previously
set using the LEVEL knob (26). In the AUTO position, automatic triggering is active, i.e. a trace is
always visible on the screen even when no input
signal is applied. The only disadvantage of auto-
matic triggering is that signals below 25 Hz and
complex signals may not trigger the time base
reliably enough. In this case, immediately switch
to NORM mode in order to obtain a "stable"
image again.
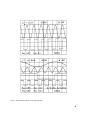
8-B
b)
Square-wave pulse
(-) Start
with fall
Stable positive
edge (+)
In the TV-V and TV-H switch positions, the trigger signals are routed via a filter in the trigger
circuit (see also Figure 7). The polarity of the TV
sync signals must be negative to obtain the best
possible results.
(+) Start with
positive edge
Choosing the point at which triggering starts
Use the SLOPE switch (26) located on the shaft of
the LEVEL knob to decide the point at which
triggering starts: on the positive-going or negative-going transition of the trigger signal, see
also Figure 8-C.
Setting the trigger LEVEL
Use the trigger LEVEL knob to stabilise the signal
so that it can be observed more accurately. The
effect of adjusting the trigger level is shown in
Figure 8. The "-", "0" and "+" markers are referred to the zero crossing of the signal waveform
or the negative and positive area. If the trigger
signal rises or falls extremely steeply, as in the
case of rectangular-pulse or digital signals, no
clear reversal of the displayed trace will be apparent until the LEVEL knob has reached its most
negative or most positive point by turning it to
the left or right, at which point the display runs
away (in the AUTO position) or disappears entirely (NORM position).
8-A
a)
Sawtooth pulse
(+) Start
with rise
(positive) (+)
rise
(-) (negative)
fall
(-) Start
with fall
Negative edge
with jitter (-)
8-C
Trigger level (LEVEL)
c)
0
0
Negative edge
Positive edge
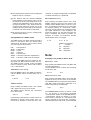
2.2.7 Addition and subtraction of signals
In this operating mode of a dual-trace oscilloscope, the signals that are applied are "combined" with each other and displayed as a trace.
Addition gives the algebraic sum of CH 1 and CH
2 and subtraction gives the algebraic difference
of the two channels.
Set up the oscilloscope as follows in order to use
these functions:
1. Perform the basic settings as described under
heading 2.2.5.
2. Make sure that both the VOLTS/DIV switches
are set to the same position and that both the
VARIABLE knobs (14) and (15) are set to the
right-hand stop (cal. = calibrated) and are
pushed in. If the difference in the amplitude of the two applied signals is too large,
adjust the two VOLTS/DIV controls so that
both amplitudes take up the entire height of
the screen.
3. Use the channel that has the higher amplitude as the trigger source.
4. Set the MODE switch (18) to the ADD position.
The result is the algebraic sum of both the
signals in CH 1 and CH 2.
19
Note:
If the two applied signals are in phase, they can
both be added algebraically, e.g. 4.2 div + 1.2
div = 5.4 div. If the two applied signals are in
phase opposition (180º), the two signals are
subtracted from each other, e.g. 4.2 div - 1.2 div
= 3 div.
For algebraic subtraction, follow the same procedure as that described for ADD and pull out
the POSITION knob (17). In-phase signals are
then displayed as a difference and signals in
phase opposition are displayed as a sum.
2.2.8 X-Y mode
In this mode both channels are switched as the
X and Y input, CH 1 for the X-axis and CH 2 for
the Y-axis with both axes having a time base.
The MODE switch (18), the entire trigger section
and all the knobs and sockets associated with it
are inoperative in X-Y mode.
The basic settings for X-Y mode are as follows:
1. Turn the time-base switch (20) to the right as
far as the stop.
Note:
Reduce the intensity (2), otherwise the spot in
the centre of the screen (if no signals are
present) will destroy the screen's phosphor
coating.
2. Then connect the horizontal signal to channel
2 and the vertical signal to channel 1. You can
readjust the brightness as soon as a display
becomes visible.
3. Use the VOLTS/DIV knob for CH2 to adjust the
height of the display and use the VOLTS/DIV
knob for CH1 to adjust the display width. It
may also be useful to use the expansion
switches (14) and (15).
4. The position of the trace can be moved
upwards and downwards by control (17) and
to the left and right by control (22). The
position knob (16) is inoperative in X-Y mode.
5. The signal for the Y-axis can be inverted by
pulling out knob (17).
20
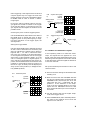
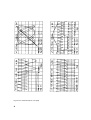
2.2.9 Delay mode = delayed sweep
Oscilloscopes OS-3020 and OS-3060 have two
time bases, one for the "real-time display" of a
signal (time base A) and one for delayed sweep
(time base B). This makes it possible to
delay/stretch/expand a selected portion of a
signal or a pulse, e.g. a TTL signal, at the same
time as displaying the original signal. Delayed
sweep can be used both in single-trace and in
dual-trace mode.
1. Set the Vertical mode switch (18) to the desired position.
2. Make sure that the B TRIG'D pushbutton in
the HORIZONTAL DISPLAY panel (20) is
pressed.
3. Press the A INT button in the HORIZONTAL
DISPLAY panel (21). A portion of the signal is
displayed "thicker".
Note:
If the portion of the signal displayed is very
small (dot), the settings of the knobs for time
base A and time base B are too different.
4. Adjust the knob for time base B until the selected portion of the signal is sufficiently
large/wide to produce a "clean image". See
also Figure 9b.
5. Adjust the DELAY'D knob (23) in order to
place/position the "trace unblanking" over
the selected portion of the signal.
6. Then press button B in the HORIZONTAL DISPLAY panel (20). The selected portion of the
signal is then displayed over the entire width
of the screen. See also Figure 9c.
7. The displayed signal form can be expanded
more by a factor of 10 by pulling out the
VARIABLE knob (24).
Triggering of time base B
If the ratio of the switch position of the knob for
time base A to that for time base B exceeds
100:1, the B trace may be affected by jitter, i.e. it
is unstable and triggering is not "clean".
To prevent this phenomenon, press the B TRIG'D
button in the HORIZONTAL DISPLAY panel (20)
and use the TRIGGER LEVEL knob (29) to readjust.
d) If the Time/div switch is set to between 0.2
µs/div (in single-trace mode 5 µs/div) and 0.2
s/div (OS-3060 D: 0.1 µs/div to 0.2 s/div),
successive signal waveforms can be continuously stored.
90
e) The "HOLD" button can be used to pause the
display, i.e. the signal is frozen in NORM
mode.
10
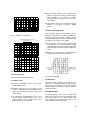
(2) EQUIV mode (equivalent)
Fig. 9a, Display of time base A
Overbright "thicker" portion
of signal A trace
If the Time/div switch for time base A is set to
between 0.2 µs/div and 2 µs/div (OS-3060: between 0.1 µs/div and 2 µs/div), "EQUIV" (stands
for Equivalent) appears instead of NORM at the
top edge of the screen in the middle.
a) In this mode it is not possible to display the
left-hand end of the signal waveform (rising
or falling edge); the second cycle of the signal
must therefore be used for measurement purposes.
90
b) Roughly 5 s elapse before a signal having a
frequency of less than 1 kHz is stored.
DELAY TIME
90
10
Fig. 9c Display of time base B
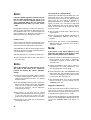
2.2.10 Storage mode
Storage mode functions as follows:
Fig. 10, EQUIV-MODE
(3) ROLL mode
(1) "NORM" mode
a) Press the "STORAGE" button in the "STORAGE MODE" panel.
b) "NORM" appears at the top edge of the
screen in the middle and the displayed signal
that is to be stored is then shown in the "realtime" display.
c) All subsequent sweeps/displays are in slow
motion. If the Time/div switch is set to 0.1
µs/div, roughly 2 to 3 s elapses until a new
trace is painted and triggered.
The spot is slowly ”painted” from left to right.
This mode is especially suitable for signal waveforms having a frequency of less than roughly
100 Hz. Just press the "HOLD" button in order to
pause Roll mode.
ROLL MODE display
The signal display "rolls" from the right-hand
edge of the screen to the left. Sampling takes
place from right to left, i.e. signal changes are
first apparent at the right-hand edge of the
screen. Note the following figure.
21
(5) HOLD (ALL) function
If you press the HOLD (ALL) button in ROLL,
EQUIV or NORM mode, the sampling process
stops and the measuring signal stored in
memory in 1-second fractions is displayed as a
"still image".
(6) Recording and reproduction of signals
Fig. 11, “Roll” operating mode
Note
In ROLL operating mode, the trigger level and
trigger source functions are inoperative. ROLL
mode is not possible in the range from 2 ms/div
to 0.2 µs/div or 0.1 µs/div in the case of the OS3060 D.
(4) Single mode in NORM mode
Proceed as follows:
a) Set the Time/div switch to a switch position
between 5 µs/div and 0.2 s/div. This selects
NORM operating mode in storage mode.
b) Press the "SINGLE" button. The red LED
under the button cap is briefly lit and this
indicates that a trace is displayed as soon as
the trigger signal occurs.
c) After triggering, the red LED under the cap
of the SINGLE button goes out.
d) Once the sampling process has completed, a
new signal waveform is shown on the screen.
The SINGLE sequence is terminated, the onscreen signal is paused and the LED under the
cap of the HOLD button is lit.
Note
If the trigger signal is not indicated in SGL
mode, the red LED under the button cap
remains lit until there is a trigger signal.
The SAVE/RECALL function is ideal for comparing a specific signal waveform to other signals. To do this, the "paused" signal is placed in
the "clipboard memory" until it is retrieved
using the Recall key or it is cleared. "Save A"
(SA) saves CH 1 = channel 1, SAVE B (SB) saves CH
2 = channel 2.
To record a signal, proceed as follows:
a) Use the HOLD button to stop the current
sampling process.
b) Press the SAVE button in the STORAGE MODE
panel. Once the signal has been stored in the
recording memory, the LED under the cap of
the SAVE button is briefly lit. The signal has
then been recorded.
(7) Reproducing the recorded signal waveform
(= RECALL)
If you want to check the signal immediately
after storing it, proceed as follows:
a) Press the RECALL button once; the signal that
was stored in recording memory A (SA)
appears with the recorded VOLTS/DIV and
TIME/DIV settings, regardless how the VERTICAL MODE switch is set.
If you press this button again, the recorded
signal waveform from recording memory B
appears. If the RECALL button is pressed a
third time, both A and B appear on the
screen, together with the stored settings.
If you press the RECALL button a fourth time,
this clears the "clipboard memories" (A and
B) and both the signal waveforms with their
respective settings.
b) Reproduced signal waveforms cannot be
moved upwards or downwards by using the
Position knob (16 or 17).
(8) X-Y plotter output (RS-232) with PLOT button
SINGLE mode does not work with the following
functions: Average (AVG), ROLL, EQUIV or when
the time base is expanded (MAG).
22
A signal is only available on the plotter interface for printout if you first pressed the HOLD
button to freeze the signal waveform and
then pressed the PLOT key to print the screen
content. A more detailed description of this
interface can be found in a later section.
Note
Signals that have been stored in the recording memory cannot be expanded.
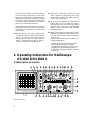
(9)Magnified signal display (MAG)
In storage mode there are two ways of
expanding a specific signal waveform or displaying it in expanded form. The first way is
to pull out the VARIABLE knob (24), the other
is to use the TIME/DIV switch in conjunction
with the HOLD function.
If both channels (1 and 2) are operating, both
channels (CH 1 and CH 2) are expanded by a factor of 10. When the knob is pushed in again, the
non-expanded signal waveform appears
again.eint erneut der ungedehnte Signalverlauf.
a) Expansion using Variable switch (24)
The signal or signal spectrum can be expanded by a factor of 10 ("stretched") in storage
mode by pulling out the VARIABLE knob (24).
Fig. 12
b) Expansion using the HOLD button and the
TIME/DIV switch
In storage mode, press the HOLD button to
freeze the screen content that is to be expanded. Turn the TIME/DIV knob (21) clockwise (to the right) one switch position further.
This displays the signal magnified by a factor
of "2". Turning the switch another step to
the right stretches the expanded signal again
by a factor of "2". Each further turn of the
switch to the right expands the waveform by
a factor of "2.5", i.e. a total factor of "10" (2
x 2 x 2.5 = 10) => three switch positions.
Example:
You can read off the individual division factors
by watching the dT screen overlay at the top
edge of the screen.
Basic setting: 10.72 µs/div, one switch position
(the first), subsequent switch position: 5.36
µs/div.
One switch position further (the second): 2.68
µs/div. Finally, the third switch position to the
right: 1.072 µs/div --> 1/10th.
If you turn the TIME/DIV switch further or turn it
in the wrong direction (to the left), no further
sweep expansion takes place.
(10) Interpolation
If expanding a signal waveform distorts the
way in which it displays, the signal can be
"smoothed" or modified by interpolation (see
also Figure 14).
The "INTERPOLATION" sub-function is selected
by pressing the "MENU" button. Keep this button pressed until "ITPL OFF" appears at the top
edge of the screen in the middle. Then use the
"SELECT" button (underneath it) to set linear
interpolation "ITPL LIN" or sine interpolation
"ITPL SIN " or "interpolation off" ("ITPL OFF").
23
Fig. 13
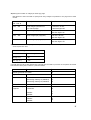
(11) AMAG operating mode = ALT MAG
In this operating mode, both the "normal" stored signal waveform and the expanded signal waveform
of the relevant channel that was previously set, e.g. CH 1, are displayed simultaneously or alternately
= ALT.
To display CH 2, Vertical switch (18) must first be set to CH 2.
Note the following Table:
Switch position
Normal indication (not storage) AMAG mode
CH 1
CH 1-signal
CH 1 signal + expanded CH 1 signal
CH 2
CH 2-signal
CH 2 signal + expanded CH 2 signal
DUAL
CH1- and CH2-Signal
CH1 and CH2 signal, both channels
expanded
ADD
CH1- + CH2-Signal
The result of adding CH1 + CH2 at
the same time as the "expanded"
result.
Typical settings:
a) Set the Vertical switch to the CH 1 position
b) Press the HOLD button
c) Use the Menu button to select the AMAG OFF
sub-function and use the SELECT button to
switch it on ( AMAG ON.
d) Expand once as described in 9a or 9b.
e) The expanded signal waveform is displayed
roughly 3 div underneath the non-expanded
signal.
the signal waveform is "extended" upwards and
downwards by a specific amount. The following
"lengths" can be set: +/-0.4 div, +/-0.8 div or
+/-1.2 div. To select or set this sub-function,
proceed as follows:
a) In storage mode, press the MENU button until
"G-NG XH=>OH" appears at the top edge of
the screen in the middle.
b) Press the RECALL button once.
c) "0.4 div" appears instead of "XH=>OH". This
value can then be modified by pressing the
SELECT button (under MENU).
(12) Go-NoGo mode
d) Then set the desired "assessment area".
The Go-NoGo sub-function is useful for the
assessment of signals. Each displayed "pixel" of
e) Finally, to run the function, press the RECALL
button again.
24
f) The original signal waveform is then displayed
together with an "envelope".
crossings" of a signal are displayed, it is advisable
to switch smoothing on ( SMTH ON.
g) "XH" denotes that the relevant POSITION
knob (depends on the channel, 16 or 17) can
be used to move the original signal out of the
envelope (the assessment area) to allow better signal comparison. "OH" denotes that the
original signal cannot be moved out of the
envelope. As soon as the edge of the envelope
is reached, the Hold function is activated.
13.3 AVERAGING (AVG)
h) To reset this function or quit it, simply briefly
press the HOLD button.
(13) Explanation for "MENU" button
The MENU button has been mentioned several
times in connection with the sub-functions
stated above. This button can be used to select
any of the sub-functions below:
ITPL
SMTH
PROB
AVG
ROLL
AMAG
G-NG
=
=
=
=
=
=
=
Interpolation
Smoothing
Probe
Average
Roll function
ALT MAG, alternate magnification
Go-NoGo, used to set an envelope.
Keep pressing the MENU button until "AVG
NORM" appears at the top of the screen in the
middle. Use the SELECT button to set the "number" of averaging calculations to be performed.
For example, setting "4" means that a meanvalue will be generated from 4 samples before
the signal waveform is next displayed. The
higher this setting, e.g. 256, the slower the display is refreshed. This makes it possible, for
example, to acquire non-continuous periodic
signals where there is no trigger.
AVG
N O
R
M
NORM: no averaging
4
: 4 passes
16 : 16 passes
64 : 64 passes
256 : 256 passes
Note:
Averaging is not possible in "ROLL" mode
As soon as the MENU button is pressed in storage mode, the LED under the button cap is lit.
The SELECT button located under the MENU
button is a kind of "Help" button and is used to
"set" a sub-function.
13.1 PROBE "probe setting"
Press the MENU button until PROB X1 appears.
Use the "SELECT" button to select either "X1" or
"X10".
PROB
X10
13.2 SMOOTHING
Keep pressing the MENU button until "SMTH
OFF" appears at the top of the screen.
The SELECT button switches the "smoothing
filter" ON or OFF.
SMTH
OFF
If smoothing is switched off, a series of dots are
displayed in storage mode rather than continuous lines. However, if more than five "zero
13.4 "ROLL" mode
Keep pressing the MENU button until ROLL OFF
(or ROLL ON) appears.
Use the SELECT button to switch this operating
mode ON or OFF.
ROLL
ON
13.5 Interpolation (ITPL)
Keep pressing the MENU button until ITPL OFF
appears at the top of the screen in the middle.
Use the SELECT button to select sine interpolation
(ITPL SIN), linear interpolation (ITPL LIN) or to
switch interpolation off (ITPL OFF).
ITPL
OFF
The INTERPOLATION function is used to "clean
up" the display of horizontally expanded
"reconstituted" signals. In the ITPL SIN position,
"reconstituted" signals are similar to a sinusoidal function. However, if a rectangular-pulse
signal is applied to the input and "reconstituted"/distorted in storage mode, and the ITPL SIN
25
position is then selected, it is possible that the
input signal may no longer match the display. In
this case (square-wave signals), linear interpolation (ITPL LIN) is ideal for display purposes.
If one of these two functions (XH or OH) was selected, the basic value = 0.4 div must be set by
pressing the RECALL button once. If a higher
value is required, keep the SELECT button pressed until the desired value is reached.
13.6 AMAG = ALT MAG mode
G-NG
Keep pressing the MENU button until "AMAG
OFF" (or AMAG ON) appears at the top edge of
the screen in the middle. In this mode the
SELECT button can only be used to make a setting if the Hold key has previously been pressed.
AMAG
0.4div
0.4 div: the assessment area covers ±0.4 div
0.8 div: the assessment area covers ±0.8 div
1.2 div: the assessment area covers ±1.2 div
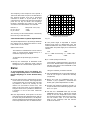
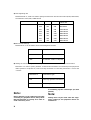
13.8 Header text line at top edge of screen without MENU button
OFF
13.7 Go-NoGo mode (signal assessment)
Keep pressing the MENU button until "G-NG =>
XH OH" appears at the top of the screen in the
middle. With this function, the SELECT button
can be used to toggle between XH= Comparison
and OH = Hold.
Assuming that all the necessary settings have
been made and the MENU button is no longer
required, keep this button pressed until the LED
under the button cap goes out. The header text
line at the top edge of the screen (right-hand
half) might look as follows:
G - N G => X H O H
N
O
R
M
A
V
1
6
S
A
S
M
If this field contains "SM",
smoothing is switched on,
if it is blank, SM is off
SA = recording memory A
SB = recording memory B
If this line is blank, averaging is switched off;
in this case AV 16 = 16 passes for one display
EQUIV in the range from 0.2 µs/div (OS-3060 D: 0.1 µs/div) to 2 µs/div
NORM in the range from 5 µs/div to 2 ms/div
ROLL in the range from 1 ms/div to 0.2 s/div or 20 s/div (in X100 roll mode)
The procedure to make the settings for the X-Y
function in storage mode is as follows:
c) turn the Time/div switch to the right-hand
stop in the case of the OS-3020 D or press the
X-Y button in the "HORIZ DISP" panel on the
OS-3060 D.
a) Set the Vertical switch to the DUAL position
Note:
(14) X-Y mode
b) Press the HOLD button in order to pause sampling. Both input signals (X = CH1 and Y =
CH2) continue to be displayed.
26
If the brightness is too high, reduce the intensity because otherwise this will damage the
sensitive internal coating of the CRT screen and
the signal could be permanently burnt into the
coating.
2.3 Taking measurements using Oscilloscopes
OS-3020 D and OS-3060 D
2.3.1 Amplitude measurements
A fundamental distinction is made between two
types of voltage measurements when using an
oscilloscope:
g) In the case of sine-wave signals below 100 Hz
and rectangular-pulse signals below 1000 Hz,
set the AC/DC/GND switch of the relevant
channel to DC in order to prevent measuring
errors.
- Measurement of peak-to-peak voltage without
any reference to polarity, and
Warning!
- Measurement of the instantaneous values of a
voltage referred to a basic reference (polarity
related).
Make certain that a periodic quantity is not
superimposed on a very high zero-frequency
quantity. It is crucial not to exceed the maximum
permissible input values.
If you want to perform one of these two types of
measurement, make certain that the VARIABLE
knobs are pushed in and calibrated (right-hand
stop, latched-in).
4 DIV
1. Peak-to-peak voltages
To measure such voltages, proceed as follows:
a) Set up the oscilloscope according to 2.2.1
(default settings of switches and knobs)
b) Set the TIME/DIV switch so that two to three
cycles of the signal are visible on the screen
with the VOLTS/DIV switch turned to the lefthand stop (5 V/div).
c) Use the Vertical position switch (25) to move
a negative peak of the signal as close as
possible to the vertical centre line (the line
with the fine graduation marks = 0.2 DIV).
d) Move the signal onto a horizontal graticule
line by using one of the Horizontal position
switches (16) or (17) depending on the input
to which the signal is applied.
e) You can then determine the peak-to-peak
voltage:
Count the "boxes" between the negative and
positive peak of the signal and multiply them
by the VOLTS/DIV setting.
Example:
If you counted 4.2 divisions and the VOLTS/DIV
switch is set to 1 V/DIV, the voltage is therefore
4.2 DIV x 1 V/div = 4.2 V pp.
Fig. 14. Determination of peak-to-peak voltage
100
2
V
10
0%
Reference line (base)
Deflection
Fig. 15. Measurement of direct voltage
2. Measurement of direct voltage
To determine a direct voltage, proceed as follows:
a) Set up the oscilloscope according to 2.2.1.
f) If X5 expansion is switched on, you must divide
the determined value by 5, if a 1:10 probe is
connected, you must multiply the result by 10.
b) Set the AC/GND/DC switch of the channel in
which the signal is present to GND.
27
c) Use the appropriate Position switch (16) or
(17) to move the trace to the centre of the
screen graticule (= the horizontal centre scale
line).
2.3.3 Measurement of period, pulse width etc.
d) The POS switch must not be moved again
until the measurement has been completed.
The period of a square-wave pulse or any other
waveform is the time taken to complete a full
cycle (360º) (see also figure).
e) Then set the AC/GND/DC switch to DC,
making absolutely sure that the maximum
input values are not exceeded. All signals
above the centre line are positive and all
those below it are negative.
This measurement is performed in a similar way
to that described under heading 2.3.2.
A
B
C
90
f) Determine the interval between the positive
or negative line and the centre line by counting the scale marks or the "boxes" = DIVISIONS and multiply this number by the setting
of the VOLTS/DIV switch.
Example: The interval is 2.8 DIVs (= 2 boxes
and 4 scale marks x 0.2 cm). The VOLTS/DIV
switch is set to 2 VOLTS/DIV. This gives 2.8
DIVs x 2 VOLTS/DIV = 5.6 V.
g) If X5 expansion has been set (by pulling out
the VARIABLE knob), you must divide the
determined value by 5, if a 1:10 probe is
connected, you must multiply the determined
value by 10.
2.3.2 Measurement of time, time intervals
To perform this type of measurement, proceed
as follows:
1. Set up the oscilloscope according to 2.2.4.
2. Then set the TIME/DIV switch so that the
signal image (a half-wave) is displayed on the
screen as large as possible.
3. Use the Vertical and Horizontal position
switches [POSITION (16) or (17) and (25)] to
move the image so that the start of the time
interval coincides with a vertical graticule line
and its end is on the horizontal centre line of
the graticule.
10
0%
Fig. 16
In this figure, the time-base sweep is 10 ms/DIV;
the measurement is made between A and C,
thus giving a period of 70 ms.
The pulse width is the distance between A and
B, i.e. roughly 1.5 div which is equivalent to 15
ms. The larger the waveform displayed, the
more accurate the reading or measurement
result. To achieve this, either select the next
smallest time-base sweep (to the left) or pull out
the VARIABLE knob (24), but in the calibrated
position (right-hand stop). The X position knob
(25) can then be used to position the signal more
accurately.
Once the pulse width and the period are known,
the mark-to-space ratio can be determined as
follows:
Pulse width x 100 15 ms x 100
= ——————— = ————— = 21,4 %
Period
70 ms
2.3.4 Frequency measurements
4. The time is then determined as follows:
Time = interval between start point and end
point of half-wave in DIVs x setting of the
TIME/DIV switch.
Example: The interval is 5.4 DIVs and the
TIME/DIV switch is set to 5 µs/DIV. This gives
5.4 DIV x 5 µs/DIV = 27 µs. The time is 27 µs
(microseconds = 10-6 seconds).
28
Wherever possible, a frequency counter should
be used to obtain an accurate frequency indication. The counter can be connected to the
channel 1 output at the rear of the oscilloscope.
However, the oscilloscope can be used to determine a frequency if a counter is not available
or in the case of modulated signals or noise
where the counter does not respond.
The frequency is the reciprocal of the period =
1/dT. First determine the period as described in
the previous chapter, then use a hand-held
calculator to divide "1" by the period. If your
calculator has a 1/x key, just enter the period and
press the 1/x key to obtain the frequency.
However, remember the powers of ten, these
are listed in the Table below as a reminder.
Period in s
In ms = 10-3 s
In µs = 10-6 s
P1
P1l
P2
Reciprocal = Hz (= 1/s)
= kHz
= MHz
The accuracy of this measurement is limited by
the accuracy of the time base.
2.3.5 Measurement of phase displacement
The phase displacement or phase angle between
two signals can be determined either in dualtrace mode or in X-Y mode.
a) Dual trace mode
This method of measurement can be used to
work on various signal waveforms up to a
maximum frequency of 40 MHz.
To measure the phase angle, proceed as
follows:
1. Set up the oscilloscope as described under
heading 2.2.4 for dual-trace mode. Connect
one signal to CH 1 and the other signal to CH 2.
Note:
To avoid measuring errors, use identical, accurately compensated probes or coaxial cables of
identical length/type to ensure identical delay
times.
2. You will then see two in-phase points on both
curve traces on the screen. If the signals have
a sine-wave shape, find a point that is as close
as possible or, best of all, actually on the
datum line (horizontal centre line). The
slope of the curve trace is at its steepest at
this point and here it is possible to determine
a position on the X-axis with maximum
accuracy.
3. In the figure below, these points of the two
sine-wave signals are identified as P1 and P2.
To obtain the phase difference, the displacement is measured as the distance P1-P2 which
is then expressed as a ratio to distance P1-P1’.
Example of phase measurement
Fig. 17
4. The phase angle is expressed in angular
degrees and must be determined from the
measured distances. One period corresponds to
exactly 360º. The phase angle phi is obtained as
follows:
1-P2
1 DIV
Phi = — x 360° from the fig. = — x 360° = 60°
P1-P1’
6 DIV
b) X-Y mode (Lissajous method)
This method is used exclusively in the case of
sine curves. Measurements are possible up to
500 kHz max. which is the bandwidth of the
horizontal amplifier.
Using this method, proceed as follows:
1. Set the TIME/DIV knob to the right-hand stop
and do not forget to reduce the intensity
(brightness).
2. Make sure that the POSITION knob for
channel 2 (17) is pushed in, otherwise this
would give a phase displacement of 180º.
3. Connect one measuring signal to the CH 1 or
X input and the other measuring signal to the
CH 2 or Y input.
4. Use the CH 2 POSITION knob (17) and the
VOLTS/DIV knob (13) to adjust the vertical
sweep so that the amplitude covers 6 DIVs
and is above the 100% marker line (horizontal; the number "100" is on the left-hand
edge of the graticule) and the bottom
touches the 0% line.
29
5. Then set the CH 1 VOLTS/DIV knob (12) to
obtain the largest possible image.
6. Use the X position knob (25) to set the horizontal sweep so that the image is centred.
7. Count the DIVs along the vertical centre line
(dimension "A" in the figure on the next
page).
8. The phase displacement (phase angle phi)
between the two signals equals the arc sin of
A divided by B --> PHI = sin-1 x A/B.
Example: In the figure, the counted DIVs =
2.0, divided by 6 DIV this gives 0.334, the arc
sin of this gives a phase angle phi = 19.5.
9. The simple formula in para. 8 only applies up
to a phase angle of 90º. For an angle > 90º
(left-sloping ellipse), add 90º to the calculated
angle. The figure below shows a few Lissajous
patterns having various phase angles. Use
these patterns for guidance when deciding
whether or not to add 90º.
2.3.6 Measurement of rise time
The rise time is the time which the amplifier
needs in order to track the amplitude of an ideal
square-wave step change from 10% to 90%. The
fall time is the time the amplifier needs to track
the amplitude from 90% to 10%.
To determine the rise time or fall time, proceed
as follows:
1. Connect the measuring signal to CH 1 and set
the AC/GND/DC switch to AC.
2. Set the time-base sweep (TIME/DIV) so that
two cycles of the signal can be viewed on the
screen. Make sure that the VARIABLE knob
(24) is at the right-hand stop and pushed in.
3. Adjust the Volts/Div knob and the CH 1 POSITION knob so that the top of the signal
touches the 100% marker line and the bottom touches the 0% line. If this adjustment
cannot be obtained using only the VOLTS/DIV
knob, turn the VARIABLE knob (14) to the left.
4. Use the X position knob (25) to adjust the
rising edge of the signal so that it passes
through the point where the 10% line intersects the vertical centre line (see figure on
next page).
A
B
PHASE ANGLE
A
ϕ (PHI) = sin -1 __
B
a. Determination of phase angle
0°
45°
90°
135°
b. Various phase angles
Fig. 18
5. If the rising edge is very steep and a short rise
time can be expected, the image can be
expanded by a factor of 10 by pulling out
the VARIABLE knob (24). Then repeat the procedure described under heading 4.
6. Count the DIVs between the 10% intersection
and the point at which the rising edge intersects the 90% marker line.
180°
7. Multiply the number of DIVs by the setting of
the TIME/DIV knob. If the PULL x 10 knob was
pulled out to expand the signal, divide the
result by 10.
Example: In the bottom figure (next page),
the 3.6 DIVs read off multiplied by a TIME/DIV
setting of 1 µs (= 100 ns) divided by 10 give a
rise time of 360 ns.
8. To measure the fall time, adopt the same procedure as when determining the rise time, but
with the difference that the falling edge of
the signal passes through the point where the
10% line intersects the vertical centre line.
30
2.4.1 Specification
RISE TIME
a) Markers and cursor lines
100
90
All markers and cursor lines that are part of
the screen content are printed out.
b) Signal data
All signal data (screen overlays) are also
printed.
10
c) Screen grid, graticule and scales
0
a. Display, not expanded
The screen graticule and graduated horizontal and vertical centre line are also printed
out (plotted).
RISE TIME
d) Screen scale/adjustment
The DIP switch located alongside the interface can be used to modify the overall size of
the screen content so that several images fit
on a single A4 page. Chapter 4.4 describes
how to set this DIP switch. Also note the
following figures.
b. Expanded display
Fig. 19
2.4 Digital X-Y plotter
output (interface)
All displayed signals and signal waveforms that
can be viewed in storage mode can be printed
out via the plotter output.
This chapter describes how to connect the
plotter, what the data format is and the pin
assignment of the interface.
31
Fig. 20. Screen dump on one page
32
Fig. 21. Two screen dumps on one page (portrait)
33
Fig. 22. Four screen dumps on one page
34
Fig. 23. Two screen dumps on one page (landscape version)
35
2.4.2 Interface connection, pin assignment
Example 1:
An RS-232 interface cable must be used to
connect the plotter and the oscilloscope. The
cable is connected to the oscilloscope on the 25pin 'D' sub-miniature socket at the rear of the
unit.
Connecting an HP-7475A plotter (baud rate:
9600)
Set the DIP switch as follows:
1
2
3
4
5
6
1
1
0
0
0
0
The following figure shows the connector/socket
pin assignment.
FG
TXD
RXD
RTS
CTS
DSR
DTR
1
2
3
4
5
6
20
1
2
3
4
5
6
20
SG
7
7
9
S2
8
S1
0
7
Y
6
US
5
A3
4
B4
3
B3
2
B2
1
B1
0
0
0
(Plotterside)
0
1
0
1
0
Example 2:
Connecting a HITACHI 681-XA plotter (baud
rate: 9600 bauds)
This switch configuration is used to adapt the
oscilloscope to the connected peripheral devices
(printer, computer, etc.).
1
1
2
1
3
0
1
OFF
0
3
4
5
6
7
8
Images per A4 page,
format
Pen change yes/no
Baud rate = data signalling rate
Data format
Connection type
36
4
0
5
0
6
0
7
1
8
1
(Oscilloscope side)
1
0
2
1
3
1
4
0
(Plotterside)
ON
2
8
1
(on oscilloscope side)
2.4.3 Setting the DIP switch (alongside the interface)
1
7
1
5
1
6
1
7
0
8
1
9
0
0
0
A) Setting the number of images per hard copy page
DIP switches 7 and 8 are used to specify how many images are plotted on one page and in what
format.
DIP switch
No. 7 No. 8
Description
Size/format of image(s)
ON
ON
One image is printed out
on one A4 page
170 mm x 70 mm
See also Figure 20
OFF
ON
Two images per page (A4)
120,8 x 120,8 mm
See also Figure 21
ON
OFF
Four images per page (A4)
85 mm x 85 mm
See also Figure 22
ON
OFF
Two images per page (A4)
85 mm x 85 mm/afb
See also Figure 23
B) DIP switch "6" is used to specify whether printout on the plotter uses one pen or whether different
coloured pens are used.
DIP switch setting
DIP switch No. 6
Pen change?
ON (up ”1”)
No
OFF (up ”0”)
Yes
f the DIP switch is set to OFF, six different-coloured pens are used for printout on the plotter. The table
below shows which pen is used for a particular detail.
Detail
Pen No.
Screen graticule and scales
1
Signal waveform
Channel 1
3
Channel 2
4
Recording memory A (=SAVE A)
Recording memory B (=SAVE B)
5
2
Cursor lines
Screen overlays/
legends
Time-base sweep
6
VOLTS/DIV channel 1
Channel 2
3
4
SAVE A
SAVE B
5
6
SWEEP
SAVE A
SAVE B
1
5
6
37
C) Data signalling rate
DIP switches No. 3, 4 and 5 are used to specify the baud rate. The minimum value (slow) is 300 bauds,
the maximum value (fast) is 9600 bauds.
DIP switch No.
3
4
5
Baud rate
ON
ON
ON
300 BAUD
OFF
ON
ON
600 BAUD
ON
OFF
ON
1200 BAUD
OFF
OFF
ON
2400 BAUD
ON
ON
OFF
4800 BAUD
OFF
ON
OFF
9600 BAUD
ON
OFF
OFF
9600 BAUD
OFF
OFF
OFF
9600 BAUD
D) Data format settings
DIP switch No. 2 can be used to set the following data formats:
DIP switch 2
Data format
ON
1 start-bit + 8 bit + 1 stop-bit
OFF
1 start-bit + 8 bit + 2 stop-bit
E) Setting the connection type, "send" only or "send" and "receive" = two-way communication
DIP switch 1 is used to specify whether communication between the oscilloscope and peripheral
device (plotter or computer etc.) uses a one-way connection or a two-way connection = "send" and
"receive".
DIP switch 1
Connection type
ON
One-way (plotter connection)
OFF
Both-way (connection to a PC)
Note:
Before switching on the oscilloscope and after
connecting any peripheral device, always check
that the DIP switch is correctly set in order to
avoid unnecessary errors.
38
2.4.4 Setting up the oscilloscope (to start
plotter)
Note:
Settings must only be made when the equipment, oscilloscope and peripheral devices are
switched off.
If you want to print out (plot) a specific screen
content in storage mode, press the HOLD button
in the STORAGE MODE panel. Plotter output is
then possible. Printout is initiated by pressing
the PLOT button in the STORAGE MODE panel.
During printout, the LED under the cap of the
PLOT button is lit. Once printing has finished,
the LED goes out again.
2.4.5 Troubleshooting if plotter does not
work:
3. Maintenance and
Care
Warning!
It is crucial to observe the safety instructions
given under heading 1.2 when carrying out
maintenance or repair.
a) The connecting cable between the oscilloscope and plotter was not connected/plugged
in or was connected/plugged in incorrectly.
Use a dry, lint-free, antistatic cleaning cloth to
clean the oscilloscope.
b) The plotter may be switched off.
Note
c) DIP switch No. 1 is incorrectly set.
Never use any solvents that contain hydrocarbons, e.g. petroleum spirit or thinners to
clean the housing. They release toxic vapours,
create risk of explosion in the event of sparking
and will damage the surface of the oscilloscope.
In order to remove dust or dirt from the antiglare filter or the surface of the CRT screen, use
a suitable screwdriver for slotted screws to
carefully remove the two pins in the bottom
edge of the front cover (they are made of
plastic), carefully swivel the cover forward from
the top (see figure below). Use a mild glass
cleaning solution to clean the anti-glare filter
and the screen surface. Before reassembling,
make sure that your fingers have not touched
the surface of the screen or the anti-glare filter
(finger marks) and that everything is dry.
d) You forgot to press the HOLD button in
storage mode.
e) The baud rate and the data format do not
match the plotter manufacturer's settings.
Anti-glare filter
Front cover
Fig. 24
39
Block Diagram
Fig. 13
40
41
C
ZUSATZINFORMATION
ZUR
BEDIENUNGSANLEITUNG
UPGRADE
Stand: 05/2000
Zweikanalspeicheroszilloskop
OS-3020D / OS-3060 D
Best.-Nr. 13 12 02 und 13 12 10
C
Durch eine Umstellung in der Produktion ergeben sich folgende Änderungen am Produkt und in der
beiliegenden Bedienungsanleitung
Sehr geehrter Kunde,
leider hat sich der Druckfehlerteufel eingeschlichen. Bei den ausgelieferten Geräten wurden die
DIP-Schalter (neben der Schnittstelle) geändert. Aus diesem Grund müssen auch die nachfolgenden
Tabellen wie folgt korrigiert werden.
Zu 2.4.3
0
1
ON
1
2
3
4
5
6
7
8
Beispiel 1:
Beispiel 2:
Einstellung der DIP-Schalter wie folgt
1
0
2
1
3
1
4
1
5
1
6
1
7
0
8
0
1
0
(Oszilloskopseite)
2
0
3
1
4
1
(Oszilloskopseite)
Zu A) Einstellungen der Abbildungen pro Papierseite
Beschreibung
Größe / Format der Abbildung(en)
OFF
Eine Abbildung wird auf einer
DIN-A-4 Seite ausgedruckt
175 mm x 140 mm
siehe auch Abbildung 20
ON
OFF
Zwei Abbildungen pro Seite
(DIN-A-4)
118 mm x 95,8 mm / Abb.
siehe auch Abbildung 21
OFF
ON
Vier Abbildungen pro Seite
(DIN-A-4)
87 mm x 70 mm / Abb.
siehe auch Abbildung 22
ON
ON
Zwei Abbildungen pro Seite
(DIN-A-4)
87 mm x 70 mm / Abb.
siehe auch Abbildung 23
Dipschalter
Nr.7
Nr.8
OFF
1
5
1
6
1
7
0
8
0
Zu B) Einstellungen für Stiftauswahl
DIP-Schaltereinstellung
Dipschalter Nr. 6
“Stifte” auswechseln ?
OFF (auf “0”)
nein
ON
ja
(auf “1”)
Zu C) Übertragungsgeschwindigkeit
DIP-SchalterNummer
3
OFF
OFF
ON
ON
OFF
OFF
ON
ON
4
5
OFF
OFF
ON
ON
OFF
OFF
ON
ON
OFF
OFF
ON
ON
OFF
OFF
ON
ON
Zu D) Datenformateinstellung
Dipschalter Nr. 2
OFF
1 Start-bit + 8 bit + 1 Stop-bit
ON
1 Start-bit + 8 bit + 2 Stop-bit
Zu E) Einstellung der Verbindungsart
Dipschalter Nr. 1
OFF
einseitig (Plotteranschluß)
ON
wechselseitig (Anschluß erfolgt(e)
an einem PC)
Mit freundlichen Grüßen
Conrad Electronic
2
Geschwindigkeit
300 BAUD
600 BAUD
1200 BAUD
2400 BAUD
4800 BAUD
9600 BAUD
9600 BAUD
9600 BAUD