1
C H A P T E R
2
Monitoring the System
This chapter explains how to monitor the Cisco ICS 7750. The chapter is
organized as follows:
•
Alarms, page 2-2
•
Logging, page 2-3
•
SNMP Basics, page 2-10
•
Monitoring with ICS System Manager, page 2-16
•
Monitoring with CiscoWorks2000, page 2-17
•
Monitoring with Cisco IOS Software, page 2-18
•
Monitoring a UPS, page 2-21
Cisco ICS 7750 Administration and Troubleshooting Guide
78-10169-02 Rev. B0
2-1
Chapter 2
Monitoring the System
Alarms
Alarms
This section describes alarms, which indicate problems on the Cisco ICS 7750 or
on systems with which it is communicating.
Alarms are associated with the following:
•
Events—Physical problems, such as system overheating or loss of power,
detected by the SAP card and reported to the ICS System Manager software.
Events are associated with the following system components:
– Chassis/backplane
– Fans
– Power supply modules
•
Note
Traps—Problems, such as a trunk outage, that are detected by MRP cards and
transmitted in the form of a Simple Network Management Protocol (SNMP)
message.
For more information about SNMP messages, see “SNMP Basics” on
page 2-10. To find out how to identify and solve system problems, see
Chapter 4, “System Troubleshooting Guidelines,” and Appendix A, “Error
Message Summary.”
Alarm Notification
The system issues notifications of alarms in any of the following ways:
•
ICS System Manager is notified of an event and takes the appropriate action;
for example, it changes the state of one or more LEDs on the system and
generates an error message, which you then see.
•
An SNMP agent generates a trap that is collected by ICS ICS System
Manager or another SNMP management application, which processes the
trap and takes the appropriate action.
•
You have an open communications session with the Cisco ICS 7750 and
retrieve log messages associated with any alarms.
Cisco ICS 7750 Administration and Troubleshooting Guide
2-2
78-10169-02 Rev. B0
Chapter 2
Monitoring the System
Logging
Alarm Levels
The system has the following two alarm levels:
•
Major alarm (amber LED)—Any state that indicates a system malfunction
that can immediately result in a service outage or that indicates a system
problem that can seriously degrade service. Examples include:
– System overheating because of high ambient air temperature, an air
intake or exhaust blockage, or fan failure
– A power supply module outage
– SPE memory parity or disk read/write errors
– Loss of an Ethernet interface because of an equipment or Ethernet facility
failure
– Loss of signal or errors on a T1 or higher trunk because of a local or
remote equipment failure
•
Minor alarm (yellow LED)—Any state that indicates a system abnormality
that does not seriously degrade service, but that may affect the network or
equipment, such as a port that is disabled or otherwise out of service.
Logging
This section provides the following information about logging:
•
How to Access Log Messages
•
How to Read Log Messages
•
How to Change the Log Configuration
How to Access Log Messages
You can access log messages in any of the following ways:
•
Handling Log Messages with ICS System Manager
•
Saving Log Messages to a Syslog Server
Cisco ICS 7750 Administration and Troubleshooting Guide
78-10169-02 Rev. B0
2-3
Chapter 2
Monitoring the System
Logging
Handling Log Messages with ICS System Manager
ICS System Manager provides several options for handling the log messages
directed to it. By default, the system sends log messages to the SPE, where they
are stored on disk.
ICS System Manager includes an Event Manager that enables you to view system
events (messages) and define policies (a set of rules) that specify how you want
the system to respond to a particular type of message. For example, for certain
types of log messages, you might want to configure the system to automatically
generate an e-mail message or send a page.
For additional information about using ICS System Manager for event handling,
refer to the ICS System Manager online help.
Saving Log Messages to a Syslog Server
The system saves syslog messages to an internal buffer. You can configure the
system to read messages from the buffer and send them to a specified syslog
server.
Note
For instructions on how to view and change the log configuration, see “How
to Change the Log Configuration” on page 2-7.
How to Read Log Messages
When viewed on a log server, the mandatory portion of a log message begins with
a percent sign (%) and can contain up to 80 characters. The message fields that
precede the percent sign (received and sent dates and times) are optional.
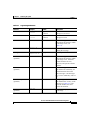
Table 2-1 describes the elements of log messages as displayed in Event Manager.
Cisco ICS 7750 Administration and Troubleshooting Guide
2-4
78-10169-02 Rev. B0
Chapter 2
Monitoring the System
Logging
Table 2-1
Log Message Elements
Element
Example
Format
Description
Received date and time
1999 Nov 21
11:55:00
yyyy mmm dd
hh:mm:ss
The date and time when the
message was received.
Sent date and time
1999 Nov 21
11:55:00
yyyy mmm dd
hh:mm:ss
The date and time when the
message was sent.
FACILITY
%LPR
STRING
Two or more uppercase letters
that indicate the facility to which
the message refers (see
Table 2-2).
From
192.31.7.19
n.n.n.n
The IP address of the device
sending the message.
Message
System
temperature OK
string
A description of the event.
CISCO FACILITY
(optional)
CDP
STRING
Two or more uppercase letters
that indicate the facility to which
the message refers. Facilities
include hardware devices,
protocols, and system software
modules.
CISCO SUBFACILITY
(optional)
CIP
STRING
Two or more uppercase letters
that indicate the subfacility for
Channel Interface Processor
(CIP) messages. CIP messages
have a Cisco subfacility code of
CIP.
Cisco Severity
(optional)
1
0–7
A single-digit code from 0 to 7
that indicates the severity of the
message (see Table 2-3). The
lower the number, the more
serious the situation.
CISCO MNEMONIC
(optional)
XMIT_ERR
STRING
A code that uniquely identifies
the message.
Cisco ICS 7750 Administration and Troubleshooting Guide
78-10169-02 Rev. B0
2-5
Chapter 2
Monitoring the System
Logging
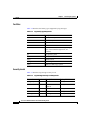
Facilities
Table 2-2 describes the facility types supported by log messages.
Table 2-2
Log Facility Type Keywords
Keyword
Description
auth
Authorization system
cron
Cron facility
daemon
System daemon
kern
Kernel
local0-7
Reserved for user-defined messages (eight
types, from local0 through local7, are
available)
lpr
Line printer system
mail
Mail system
news
USENET news
syslog
System log
uucp
UNIX-to-UNIX copy system
Severity Levels
Table 2-3 describes log message severity levels.
Table 2-3
Log Message Severity Level Keywords
Keyword
Level
Description
Syslog Definition
emergency
0
System unusable
LOG_EMERG
alert
1
Immediate action
required
LOG_ALERT
critical
2
Critical condition
LOG_CRIT
error
3
Error condition
LOG_ERR
warning
4
Warning condition
LOG_WARNING
Cisco ICS 7750 Administration and Troubleshooting Guide
2-6
78-10169-02 Rev. B0
Chapter 2
Monitoring the System
Logging
Table 2-3
Note
Log Message Severity Level Keywords (continued)
Keyword
Level
Description
Syslog Definition
notification
5
Normal but significant LOG_NOTICE
condition
informational
6
Information—no
action required
LOG_INFO
debugging
7
Debugging message
LOG_DEBUG
Not all messages indicate problems. Some messages are informational. Others
may help diagnose problems with communications lines, internal hardware, or
system software. To find out how to use system messages to identify and solve
problems, see Chapter 4, “System Troubleshooting Guidelines,” and
Appendix A, “Error Message Summary.”
How to Change the Log Configuration
The system sends log messages to ICS System Manager by default. You can
redirect these messages to other destinations such as buffers and UNIX hosts
running a syslog server.
This section provides the following information about log configurations:
•
Default Log Configuration
•
Configuring the Syslog Daemon on UNIX Syslog Servers
•
Changing Syslog Server Logging
Cisco ICS 7750 Administration and Troubleshooting Guide
78-10169-02 Rev. B0
2-7
Chapter 2
Monitoring the System
Logging
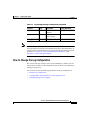
Default Log Configuration
System IOS components (ASI cards, MRP cards, and the SSP card) ship with the
default logging configuration shown in Table 2-4.
Table 2-4
Tip
Default Logging Configuration
Configuration Parameters
Default Setting
System message logging to the console
Disabled
System message logging to Telnet sessions
Disabled
Log server
Disabled
Syslog server IP address
None configured
Server facility
LOCAL7
Server severity
Warnings (4)
Logging buffer size
500
Logging history size
1
Timestamp option
Disabled
To view the state of syslog error and event logging, including host addresses
and whether console logging is enabled, enter the IOS show logging
command.
Configuring the Syslog Daemon on UNIX Syslog Servers
Before you can send log messages to a UNIX syslog server, you must configure
the syslog daemon on the UNIX server. To configure the syslog daemon, log in as
root and include a line such as the following in the file syslog.conf:
facility.level /syslog path/myfile.log
where
•
facility is the log facility keyword (see Table 2-2)
•
level is the severity level (see Table 2-3)
Cisco ICS 7750 Administration and Troubleshooting Guide
2-8
78-10169-02 Rev. B0
Chapter 2
Monitoring the System
Logging
•
syslog path is the path to syslog.conf
•
myfile.log is the name of your log file
The syslog daemon (syslogd) sends messages at the level specified in syslog.conf,
provided that the file exists, and provided that syslogd has permission to write to
it.
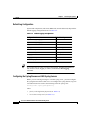
Changing Syslog Server Logging
To change syslog server logging behavior, use the global configuration commands
shown in Table 2-5.
Table 2-5
Syslog Server Logging Behavior Commands
Task
Command
Configure an IOS device to log messages to a syslog
logging host
server, where host is the name or IP address of the target
syslog server.
Remove a host from the list of syslog servers.
no logging host
logging trap level
Configure an IOS device to limit the log messages it
sends to the syslog server(s) based on the severity level,
where level is one of the log message severity keywords
listed in Table 2-3.
Disable logging to the syslog server(s).
Note
no logging trap
For more information about IOS commands related to logging, refer to the
Configuration Fundamentals Command Reference publication.
Cisco ICS 7750 Administration and Troubleshooting Guide
78-10169-02 Rev. B0
2-9
Chapter 2
Monitoring the System
SNMP Basics
SNMP Basics
The Simple Network Management Protocol (SNMP) facilitates the exchange of
management information among network devices. SNMP is part of the
Transmission Control Protocol/Internet Protocol (TCP/IP) protocol suite. SNMP
enables you to manage network performance, find and solve network problems,
and plan for network growth.
SNMP Components
An SNMP-managed network consists of three key components: managed devices,
agents, and network management systems (NMSs).
•
A managed device is a network node that contains an SNMP agent and resides
on a managed network. Managed devices collect and store management
information and make it available using SNMP. The Cisco ICS 7750 includes
the following managed devices:
– System processing engine (SPE) cards
– Analog station interface (ASI) cards
– Multiservice route processor (MRP) cards
– System switch processor (SSP) card
– Catalyst 3524-PWR XL switches
•
An agent is network-management software that resides on a managed device.
An agent has local knowledge of management information and translates it
into a form compatible with SNMP. The agent on the Cisco ICS 7750 is
located on the SPE running System Manager.
Cisco ICS 7750 Administration and Troubleshooting Guide
2-10
78-10169-02 Rev. B0
Chapter 2
Monitoring the System
SNMP Basics
•
An SNMP management application, together with the computer it runs on, is
called a network management system (NMS). An NMS executes applications
that monitor and control managed devices. NMSs provide the bulk of the
processing and memory resources required for network management. The
Cisco ICS 7750 is compatible with the following NMSs:
– ICS System Manager
– CiscoWorks2000
– HP OpenView
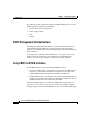
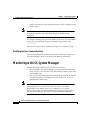
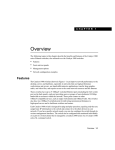
Figure 2-1 shows the relationships between the managed devices and agents, and
the NMS.
Figure 2-1
Major Components of SNMP-Managed Networks
Management
Entity
Agent
Agent
Agent
Management
Database
Management
Database
Management
Database
Managed Devices
24200
NMS
Cisco ICS 7750 Administration and Troubleshooting Guide
78-10169-02 Rev. B0
2-11
Chapter 2
Monitoring the System
SNMP Basics
The following system components, though not SNMP-managed devices, receive
SNMP support through ICS System Manager:
•
System alarm processor (SAP) card
•
Power supply modules
•
Fans
•
Chassis
SNMP Management Information Base
A Management Information Base (MIB) is a collection of information that is
organized hierarchically. MIBs are accessed using a network management
protocol such as SNMP. They comprise managed objects, which are identified by
object identifiers.
A managed object (sometimes called a MIB object or an object) is one of any
number of specific characteristics of a managed device. Managed objects
comprise one or more object instances, which are essentially variables.
Using SNMP with MIB Variables
System MIB variables are accessible through SNMP as follows:
•
Accessing a MIB variable—This function is initiated by the SNMP agent in
response to a request from the NMS. The agent retrieves the value of the
requested MIB variable and responds to the NMS with that value.
•
Setting a MIB variable—This function is also initiated by the SNMP agent in
response to a message from the NMS. The SNMP agent changes the value of
the MIB variable to the value requested by the NMS.
Instead of defining a large set of commands, SNMP places all operations in a
get-request, get-next-request, and set-request format. For example, an SNMP
manager can get a value from an SNMP agent or store a value in that SNMP agent.
Cisco ICS 7750 Administration and Troubleshooting Guide
2-12
78-10169-02 Rev. B0
Chapter 2
Monitoring the System
SNMP Basics
On the Cisco ICS 7750, the ICS System Manager software (the NMS) typically
sends SNMP requests to a single IP address to access the SNMP MIBs of any
system component. The SNMP agent can then respond to MIB-related queries
being sent by the NMS. Similarly, if CiscoWorks2000 is the NMS, it uses the MIB
variables to set device variables and poll devices on the network. You can then
display the data that CiscoWorks2000 collects as a graph and analyze it to
enhance network performance, to monitor traffic loads, or to troubleshoot
problems. (See “Monitoring with CiscoWorks2000” on page 2-17.)
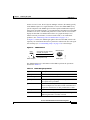
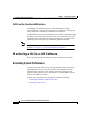
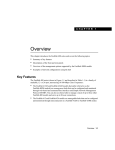
As Figure 2-2 shows, the SNMP agent gathers data from the MIB, which is the
repository for information about device parameters and network data. The agent
can send traps (see “Understanding Traps” on page 2-14) to the manager.
SNMP Network
Get-request, Get-next-request,
Get-bulk, Set-request
NMS
Get-response, traps
SNMP Manager
Network device
MIB
SNMP Agent
S1203a
Figure 2-2
The SNMP manager uses information in the MIB to perform the operations
described in Table 2-6.
Table 2-6
SNMP Manager Operations
Operation
Description
get-request
Retrieves a value from a specific variable.
get-next-request
Retrieves a value from a variable within a table.
get-response
The reply to a get-request, get-next-request, and
set-request sent by an NMS.
get-bulk
(SNMP version 2 only.) Retrieve large blocks of data,
such as multiple rows in a table, which would otherwise
require the transmission of many small blocks of data.
set-request
Stores a value in a specific variable.
trap
An unsolicited message sent by an SNMP manager
indicating that some event has occurred.
Cisco ICS 7750 Administration and Troubleshooting Guide
78-10169-02 Rev. B0
2-13
Chapter 2
Monitoring the System
SNMP Basics
Supported MIBs
The Cisco ICS 7750 supports the following MIBs:
•
CISCO-C2900-MIB—Supports the SSP card.
•
CISCO-CCM-MIB—Enables the system to get provisioning and statistical
information about Cisco CallManager, devices associated with
Cisco CallManager (such as Cisco IP phones and gateways), and the
Cisco CallManager configuration.
•
CISCO-CDP-MIB—Enables Cisco CallManager to advertise itself to other
Cisco devices on the network, allowing discovery of other
Cisco CallManager installations on the network.
•
CISCO-ICSUDSU-MIB—Supports integrated CSU/DSU interfaces in the
MRP.
•
CISCO-VOICE-IF-MIB—Supports ISDN and analog interfaces in the MRP.
•
CISCO-ENTITY-FRU-CONTROL-MIB—Supports field replaceable units
(FRUs), such as cards, power supply modules, and the fan tray.
•
ENTITY-MIB—Supports the chassis.
•
MIB II (RFC1213)—Represents Ethernet and other types of addresses.
•
DS1 MIB (RFC1406)—Represents DS1 interfaces in the MRP.
Understanding Traps
An agent can send traps to the manager that identify important system events. The
following are examples of conditions where an agent might send an SNMP trap
message to an NMS specified as a trap receiver:
•
An interface or card starts or stops running.
•
Spanning-tree topology changes are made.
•
Authentication failures occur.
When an agent detects an alarm condition, it reacts by logging information about
the time, type, and severity of the condition and generates a trap—or notification
message—that is sent to certain IP addresses.
Cisco ICS 7750 Administration and Troubleshooting Guide
2-14
78-10169-02 Rev. B0
Chapter 2
Monitoring the System
SNMP Basics
Cisco ICS 7750 Traps
Cisco ICS 7750 ASI cards, MRP cards, and the SSP card can generate traps such
as the following:
•
coldStart—Indicates power-up reset of a card.
•
warmStart—Indicates that software running on a card has been upgraded or
that the card has been reset.
•
linkDown—Indicates that a port changed to a suspended or disabled state due
to a secure address violation (mismatch or duplication), network connection
error (such as a loss of Link Beat or a jabber error), or an explicit management
disable action.
•
linkUp—Indicates that a port has changed from a suspended or disabled state
to the enabled state.
•
authenticationFailure—Indicates that an SNMP message has been received
that is not properly authenticated; that is, the message is not accompanied by
a valid community string.
•
addressViolation—Indicates that an address violation has been detected on a
secured port.
•
broadcastStorm—Indicates that the number of broadcast packets received in
a second from a port is higher than the broadcast threshold.
Understanding Community Strings
SNMP community strings authenticate access to MIB objects and function as
embedded passwords.
The Cisco ICS 7750 uses a base community string, to which the string
@SLOTnumber can be appended to form a composite community string:
base community string@SLOTnumber
where
•
Base community string represents the get or set community string. For get
(read-only) requests, the community string, or password, has a default ASCII
value of public. For set (read-write) requests, the community string has a
default value of changeme.
Cisco ICS 7750 Administration and Troubleshooting Guide
78-10169-02 Rev. B0
2-15
Chapter 2
Monitoring the System
Monitoring with ICS System Manager
•
Note
Number represents the target physical slot number (slots 1 through 8) of the
SNMP request.
All SNMP requests with a composite community string of @SLOT9 or higher
are directed to the SSP, which determines the proper SNMP message
destination.
For example, assuming that a particular SNMP request needs to reach an MRP
card in slot 3, the following composite community string could be used:
ICS7750@SLOT3
where ICS7750 represents the standard system get or set community string.
Modifying the Base Community String
You can modify the default read-only and read-write community strings with
ICS System Manager. (Refer to the ICS System Manager online help.)
Monitoring with ICS System Manager
ICS System Manager monitors the Cisco ICS 7750 as follows:
Note
•
ASIs and MRPs—ICS System Manager provides information about trunk
errors, interface errors, memory usage, buffer failures, buffer creation, and
ASI and MRP usage.
•
SSP—ICS System Manager provides information about SNMP, IP, Internet
Control Message Protocol (ICMP), TCP errors, UDP errors, as well as
information about SSP usage.
For information about monitoring individual Cisco IP Phones or the lines
connecting those devices to the Cisco ICS 7750, refer to the “Admin
Serviceability Tool” chapter in the Cisco CallManager Serviceability
Administration Guide. For additional information on monitoring the system
with ICS System Manager, refer to the ICS System Manager online help.
Cisco ICS 7750 Administration and Troubleshooting Guide
2-16
78-10169-02 Rev. B0
Chapter 2
Monitoring the System
Monitoring with CiscoWorks2000
Monitoring with CiscoWorks2000
CiscoWorks2000 uses SNMP to monitor and control system devices. You can
integrate CiscoWorks2000 applications with other NMSs, such as HP OpenView.
CiscoWorks2000 Applications
CiscoWorks2000 applications extend industry-standard network management
systems to facilitate checking the status of Cisco devices, maintaining device
configurations and inventories, and troubleshooting device problems.
CiscoWorks2000 applications for monitoring the SNMP devices on your network
include:
•
Path Tool—Graphically displays a route of a path from a source device to a
destination device.
•
Real-Time Graphs—Monitors the behavior of device interfaces or other
network elements that might be operating in a degraded mode and displays
them in a graph.
•
Show Commands—Displays data similar to output from IOS show
commands.
•
Health Monitor—Provides device status and access to several
CiscoWorks2000 applications in one window (including Show Commands
and Real-Time Graphs) to monitor SNMP device activity.
•
Contacts—Provides quick access to the emergency contact person for a
particular device.
•
Log Manager—Enables you to store, query, and delete messages gathered
from CiscoWorks2000 applications and Cisco devices on the network.
Using CiscoWorks2000 for Network Management
CiscoWorks2000 runs an AutoDiscovery mechanism to discover the entire
network, of which Cisco CallManager may be one component. Since
Cisco CallManager supports Cisco Discovery Protocol (CDP), CiscoWorks2000
can also identify the SPE on which Cisco CallManager is running as a
Cisco CallManager device.
Cisco ICS 7750 Administration and Troubleshooting Guide
78-10169-02 Rev. B0
2-17
Chapter 2
Monitoring the System
Monitoring with Cisco IOS Software
SNMP and the CiscoWorks2000 Interface
Using SNMP, CiscoWorks2000 retrieves CDP information by polling
Cisco CallManager. After the discovery process is completed, a topology map
reveals all the Cisco CallManager installations in the network.
CiscoWorks2000 also polls other MIB tables in the CISCO-CCM-MIB to gather
information required by other components, such as User Tracking (refer to the
CiscoWorks2000 Campus Manager online documentation). CiscoWorks2000
periodically polls these agents to get additional updated information.
Note
For examples of how to use CiscoWorks2000 to troubleshoot network
problems, see Chapter 4, “System Troubleshooting Guidelines.”
Monitoring with Cisco IOS Software
This section describes proven strategies to help you monitor your network.
Evaluating System Performance
Collecting, analyzing, and archiving system performance data is important in
understanding how well your system is meeting your organization’s needs.
Important things to monitor are the behavior of network applications and
protocols and the response time of individual devices such as MRP cards and
Catalyst 3524-PWR XL switches.
Common ways to monitor system performance include the following:
•
Evaluating Reachability and Response Times
•
Evaluating Traffic Loads
Cisco ICS 7750 Administration and Troubleshooting Guide
2-18
78-10169-02 Rev. B0
Chapter 2
Monitoring the System
Monitoring with Cisco IOS Software
Evaluating Reachability and Response Times
Polling remote parts of the network enables you to test reachability and measure
response times. Response-time measurements consist of sending a ping (packet
internet groper) packet and measuring the round-trip time (RTT) that it takes to
send the packet and receive a response. The ping packet is sent and received as an
ICMP echo packet.
Note
Caution
For information about ping command usage, see Chapter 4, “System
Troubleshooting Guidelines,” and Chapter 7, “Solving Serial Connection
Problems.”
Polling activity can result in a significant increase in network traffic.
Therefore it is important to carefully assess what level of monitoring is
appropriate for your organization.
Evaluating Traffic Loads
You can use protocol analyzers or SNMP tools to record traffic loads between
important sources and destinations. (See Chapter 4, “System Troubleshooting
Guidelines,” for additional information about protocol analyzers and other
monitoring and troubleshooting tools.) The objective is to document how much
data can pass between pairs of autonomous systems, networks, hosts, or
applications. Source and destination traffic-load documentation is useful for
capacity planning and troubleshooting. Source and destination traffic-load data is
also useful if you have a service-level agreement that includes throughput
requirements.
In-Band Versus Out-of-Band Monitoring
Another important factor affecting how and when you perform network
monitoring is the degree to which monitoring either does or does not consume
system bandwidth. Depending on how your network is structured, you can use
in-band monitoring, out-of-band monitoring, or a combination of the two.
Cisco ICS 7750 Administration and Troubleshooting Guide
78-10169-02 Rev. B0
2-19
Chapter 2
Monitoring the System
Monitoring with Cisco IOS Software
With in-band monitoring, network management data is sent over the same paths
as user traffic. This means that any problems on the network will be more difficult
to solve because collecting troubleshooting data will take longer. Using
management tools is beneficial even when the internetwork is congested, failing,
or under a security attack.
With out-of-band monitoring, network management data travels on different paths
than user data. NMSs and agents are linked by circuits that are separate from the
internetwork. The circuits can use dial-up, ISDN, or other technologies. The
separate circuits can be used all the time or they can be used as backup only when
the primary internetwork path is broken.
Using show Commands
You can use IOS show commands to perform a variety of tasks:
•
Monitor behavior during installation
•
Monitor normal network operation
•
Isolate problem interfaces, nodes, media, or applications
•
Determine when a network is congested
•
Determine the status of servers, clients, or other neighbors
Common show Commands
Commands that you are likely to use include the following:
•
show interfaces displays statistics for network interfaces. (For example,
show interfaces serial and show interfaces ethernet.)
•
show buffers displays statistics for the buffer pools on the target device.
•
show memory shows statistics about the device’s memory.
•
show processes displays information about the active processes on the
device.
•
show stacks displays information about the stack utilization of processes and
interrupt routines, as well as the reason for the last system reboot.
•
show version displays the configuration of the system hardware, the software
version, the names and sources of configuration files, and the boot images.
Cisco ICS 7750 Administration and Troubleshooting Guide
2-20
78-10169-02 Rev. B0
Chapter 2
Monitoring the System
Monitoring a UPS
Searching and Filtering Output of show Commands
In Cisco IOS software Release 12.0(1)T or later, you can search and filter the
output for show commands. This functionality is useful when you need to sort
through large amounts of output, or if you want to exclude output that you do not
need to see.
To use this functionality, enter a show command followed by the “pipe”
character (|), one of the keywords begin, include, or exclude, and an expression
that you want to search or filter on:
command | {begin | include | exclude} regular-expression
The following is an example of a show interface command that provides
information only about lines where the word “protocol” appears:
Cisco ICS 7750# show interface | include protocol
FastEthernet0/0 is up, line protocol is up
Serial4/0 is up, line protocol is up
Serial4/1 is up, line protocol is up
Serial4/2 is administratively down, line protocol is down
Serial4/3 is administratively down, line protocol is down
For more information on search and filter functionality, refer to the “Basic
Command-Line Interface Commands” section in the “Cisco IOS User Interfaces
Commands” chapter in the Cisco IOS Configuration Fundamentals Configuration
Guide.
Monitoring a UPS
This section explains how to monitor an APC Smart-UPS.
Connecting and Powering Up the UPS Components
Complete the following steps to set up the components:
Step 1
Connect the UPS to the SAP card COM1 port or to an Ethernet switch that is
connected to the Cisco ICS 7750. Refer to the “SAP Card COM Ports” section in
the “Installing the Cisco ICS 7750” chapter of the Cisco ICS 7750 Hardware
Installation Guide.
Cisco ICS 7750 Administration and Troubleshooting Guide
78-10169-02 Rev. B0
2-21
Chapter 2
Monitoring the System
Monitoring a UPS
Step 2
Step 3
If any of the following devices are not turned on, power them on as follows:
•
UPS—Press the Test button on the UPS front panel.
•
Cisco ICS 7750—Press the power supply switches (on the right side of the
chassis) to on ( | ).
•
Catalyst switches—Connect one end of the AC power cord to the AC power
connector on the switch; then connect the other end of the power cord to an
AC power outlet.
Complete the procedure that is appropriate for the type of UPS connection that
you made in Step 1:
•
SAP Card COM1 Port—Go to “Configuring the System to Monitor the UPS
Through a Serial Connection” on page 2-22.
•
Ethernet switch—Go to “Configuring the System to Monitor a UPS Through
an Ethernet Connection” on page 2-23.
Configuring the System to Monitor the UPS Through a Serial
Connection
If the UPS serial port is connected to the SAP card COM1 port on the
Cisco ICS 7750, complete the following steps to configure the UPS so that the
Cisco ICS 7750 can monitor UPS status:
Step 1
On the PC, choose Start > Run.
Step 2
Open a Telnet session with the SPE running System Manager:
telnet IP address 5000
Step 3
Log in as an administrator (userID administrator), and enter your password (the
default is changeme).
Step 4
Enter the following command to stop the FMMServer on the SPE:
net stop FmmServer
Step 5
Change to the FMM directory:
cd Program Files\Cisco Systems\ics\FMM
Cisco ICS 7750 Administration and Troubleshooting Guide
2-22
78-10169-02 Rev. B0
Chapter 2
Monitoring the System
Monitoring a UPS
Step 6
Install the UPS:
installups
Step 7
Start FmmServer:
net start FmmServer
Step 8
Go to “Verifying That the Cisco ICS 7750 Can Communicate with the UPS” on
page 2-26.
Configuring the System to Monitor a UPS Through an Ethernet
Connection
If the UPS is connected to an Ethernet switch that is connected to the SSP card on
the Cisco ICS 7750, complete the following steps to configure the UPS so that the
Cisco ICS 7750 can monitor UPS status:
Step 1
Ensure that you have the following information available:
•
The IP address that you intend to use for the UPS.
•
The IP address of the SPE running System Manager. (If you do not know this
IP address, see “Determining the IP Address of an SPE” in Chapter 1,
“Operating the System.”)
•
The subnet mask that you used when you configured the Cisco ICS 7750.
Step 2
Insert the Web/SNMP Management CD-ROM that came with your APC
Smart-UPS into your PC CD-ROM drive.
Step 3
Follow the on-screen prompts to install the SNMP/Web Management Utility.
Note
If the SNMP/Web Card Management Wizard does not automatically
run after the software installation is complete, click
Start > Programs > APC Card Management Wizard.
Cisco ICS 7750 Administration and Troubleshooting Guide
78-10169-02 Rev. B0
2-23
Chapter 2
Monitoring the System
Monitoring a UPS
While the system is attempting to communicate with the UPS, the first screen of
the SNMP/Web Card Management Wizard continues to be displayed (this process
might take several minutes). When the system is ready for you to continue with
configuring the UPS, the Found An Unconfigured Management Card dialog box
displays.
Step 4
Step 5
Enter the following information in the Found An Unconfigured Management Card
dialog box:
•
In the System IP Address field, enter the UPS IP address.
•
In the Subnet Mask field, enter the Cisco ICS 7750 subnet mask.
•
In the Default Gateway field, enter the IP address of the SPE running
System Manager.
•
Check the Start a Web browser when finished check box.
Click Finish.
A dialog box displays, informing you that your default Web browser will start and
that your User Name and password for UPS configuration will be apc.
Step 6
Click OK.
Step 7
Click Next.
Step 8
In the Installation Options dialog box, choose Express.
Step 9
Click Next.
Step 10
Choose the type of connection (LAN) that you are using to communicate with the
UPS.
Step 11
Click Next.
Step 12
Click Close.
Step 13
Click OK.
Step 14
If a Web browser (Netscape Communicator or Microsoft Internet Explorer, for
example) is not already running, open it. Enter your UPS IP address in the
Location or Address field of the browser.
The Username and Password Required dialog box displays.
Step 15
In the User Name and Password fields, enter apc.
Step 16
Click OK.
The APC Status Summary page appears in your browser.
Cisco ICS 7750 Administration and Troubleshooting Guide
2-24
78-10169-02 Rev. B0
Chapter 2
Monitoring the System
Monitoring a UPS
Step 17
In the left pane of the browser window, choose Smart-UPS 1400 RM XL >
PowerChute.
Step 18
In the Add Client IP Address field, enter the IP address of the SPE running
System Manager.
Step 19
Click Add.
The IP address that you entered in Step 18 and Step 19 will appear in the
Configured Client IP Addresses pane.
Step 20
In the left pane of the browser window, choose Network > SNMP.
Step 21
In the SNMP table, verify that the Access field is set to enabled.
Step 22
Click Apply.
Step 23
In the Trap Receiver table, enter the UPS IP address in the Public field.
Step 24
Click Apply.
Step 25
In the Access Control table, enter the UPS IP address in the Private and Public
fields.
Step 26
Click Apply.
Step 27
In the left pane of the browser window, choose Event Log.
The UPS reports its status in the Event column. Text similar to the following will
be displayed:
Management Card: Web User apc logged in from <IP address>
Step 28
Unplug the UPS power cord.
The UPS emits an audio tone.
Step 29
Plug the UPS power cord in again.
In the Event column of the Event Log, text similar to the following will be
displayed:
UPS: Switched to battery backup power, utility power failure.
UPS: Returned from battery backup power, utility power restored.
Step 30
Choose Start > Run.
Step 31
Open a Telnet session with the SPE running System Manager:
telnet IP address 5000
Cisco ICS 7750 Administration and Troubleshooting Guide
78-10169-02 Rev. B0
2-25
Chapter 2
Monitoring the System
Monitoring a UPS
Step 32
Log in as an administrator (userID administrator), and enter your password (the
default is changeme).
Step 33
Enter the following command to stop the FMMServer on the SPE:
net stop FmmServer
Step 34
Change to the FMM directory:
cd Program Files\Cisco Systems\ics\FMM
Step 35
Install the UPS:
installups
Step 36
Start FmmServer:
net start FmmServer
Step 37
Set the host name of the UPS, where Name is the UPS IP address:
SetUPSHostName -HostName Name
Step 38
Continue with “Verifying That the Cisco ICS 7750 Can Communicate with the
UPS” on page 2-26.
Verifying That the Cisco ICS 7750 Can Communicate with the UPS
Complete the following steps to verify that the Cisco ICS 7750 can communicate
with the UPS:
Step 1
On the PC, choose Start > Run.
Step 2
Open a Telnet session with the SPE running System Manager:
telnet IP address 5000
Step 3
Log in as an administrator (userID administrator), and enter your password (the
default is changeme).
Step 4
Change to the FMM directory:
cd Program Files\Cisco Systems\ics\FMM
Cisco ICS 7750 Administration and Troubleshooting Guide
2-26
78-10169-02 Rev. B0
Chapter 2
Monitoring the System
Monitoring a UPS
Step 5
Verify that the Cisco ICS 7750 can communicate with the UPS:
fmmcli getchassisinfo | more
Information similar to the following will be displayed:
UPS status = AC
Battery Level = <non-zero value>
Batt. Span = <non-zero value>
Note
Step 6
If UPS status = UpsNotAvailable is displayed, verify that
your system components are properly connected and powered on.
Then try this procedure again.
Unplug the UPS power cord.
The UPS emits an audio tone, and the ALARM LED on the SAP turns on (amber).
Step 7
Using the Telnet session that you opened at Step 2, enter the following command
to verify that the system has detected the change in power status:
fmmcli getchassisinfo | more
Information similar to the following will be displayed:
UPS status = DC
Battery Level = <non-zero value>
Batt. Span = <non-zero value>
Step 8
Open an ICS System Manager session (see “Accessing ICS System Manager” on
page 1-9).
Step 9
Click the Event Manager tab on the ICS System Manager home page.
Step 10
At the bottom of the Live Viewer page, click Start Events.
Information similar to the following will be displayed:
AC power is off, using DC
Cisco ICS 7750 Administration and Troubleshooting Guide
78-10169-02 Rev. B0
2-27
Chapter 2
Monitoring the System
Monitoring a UPS
Cisco ICS 7750 Administration and Troubleshooting Guide
2-28
78-10169-02 Rev. B0