1
®
SynOptics Series 5000
Management Module Guide
Notice
Cabletron Systems reserves the right to make changes in specifications and other information
contained in this document without prior notice. The reader should in all cases consult Cabletron
Systems to determine whether any such changes have been made.
The hardware, firmware, or software described in this manual is subject to change without notice.
IN NO EVENT SHALL CABLETRON SYSTEMS BE LIABLE FOR ANY INCIDENTAL,
INDIRECT, SPECIAL, OR CONSEQUENTIAL DAMAGES WHATSOEVER (INCLUDING BUT
NOT LIMITED TO LOST PROFITS) ARISING OUT OF OR RELATED TO THIS MANUAL OR
THE INFORMATION CONTAINED IN IT, EVEN IF CABLETRON SYSTEMS HAS BEEN
ADVISED OF, KNOWN, OR SHOULD HAVE KNOWN, THE POSSIBILITY OF SUCH
DAMAGES.
Virus Disclaimer
Cabletron has tested its software with current virus checking technologies. However, because no
anti-virus system is 100% reliable, we strongly caution you to write protect and then verify that
the Licensed Software, prior to installing it, is virus-free with an anti-virus system in which you
have confidence.
Cabletron Systems makes no representations or warranties to the effect that the Licensed
Software is virus-free.
Copyright © October, 1997, by Cabletron Systems, Inc. All rights reserved.
Printed in the United States of America.
Order Number: 9031398 E3
Cabletron Systems, Inc.
P.O. Box 5005
Rochester, NH 03866-5005
SPECTRUM, the SPECTRUM IMT/VNM logo, DCM, IMT and VNM are registered
trademarks, and SpectroGRAPH, SpectroSERVER, Device Communications Manager,
Inductive Modeling Technology, and Virtual Network Machine, are trademarks of
Cabletron Systems, Inc.
Ethernet is a trademark of Xerox Corporation.
SynOptics and Bay are trademarks of Bay Networks, Inc.
Novell is a registered trademark, and IPX is a trademark of Novell, Inc.
9031398 E3
i
Restricted Rights Notice
(Applicable to licenses to the United States Government only.)
1. Use, duplication, or disclosure by the Government is subject to restrictions as set forth in
subparagraph (c) (1) (ii) of the Rights in Technical Data and Computer Software clause at
DFARS 252.227-7013.
Cabletron Systems, Inc., 35 Industrial Way, Rochester, New Hampshire 03866-5005.
2. (a) This computer software is submitted with restricted rights. It may not be used,
reproduced, or disclosed by the Government except as provided in paragraph (b) of this
Notice or as otherwise expressly stated in the contract.
(b) This computer software may be:
(c)
(1)
Used or copied for use in or with the computer or computers for which it was
acquired, including use at any Government installation to which such computer or
computers may be transferred;
(2)
Used or copied for use in a backup computer if any computer for which it was
acquired is inoperative;
(3)
Reproduced for safekeeping (archives) or backup purposes;
(4)
Modified, adapted, or combined with other computer software, provided that the
modified, combined, or adapted portions of the derivative software incorporating
restricted computer software are made subject to the same restricted rights;
(5)
Disclosed to and reproduced for use by support service contractors in accordance with
subparagraphs (b) (1) through (4) of this clause, provided the Government makes
such disclosure or reproduction subject to these restricted rights; and
(6)
Used or copied for use in or transferred to a replacement computer.
Notwithstanding the foregoing, if this computer software is published copyrighted
computer software, it is licensed to the Government, without disclosure prohibitions, with
the minimum rights set forth in paragraph (b) of this clause.
(d) Any other rights or limitations regarding the use, duplication, or disclosure of this
computer software are to be expressly stated in, or incorporated in, the contract.
(e) This Notice shall be marked on any reproduction of this computer software, in whole or in
part.
ii
SynOptics Series 5000
Management Module Guide
Contents
Preface
What Is in This Guide ........................................................................................................ xiii
Conventions ........................................................................................................................ xiv
Related SPECTRUM Documentation..................................................................................xv
SynOptics Series 5000 Hardware Documentation .............................................................xv
Other Related Documentation ........................................................................................... xvi
Chapter 1
Introduction
What Is in This Chapter..................................................................................................... 1-1
SynOptics Series 5000 Hub................................................................................................ 1-2
SPECTRUM Support.......................................................................................................... 1-4
Full Support/Limited Support ..................................................................................... 1-4
SPECTRUM and the SynOptics Distributed 5000 Series................................................ 1-7
Chassis Types ............................................................................................................... 1-7
Modules......................................................................................................................... 1-8
Device View .................................................................................................................. 1-9
NMM Modules ............................................................................................................ 1-10
Modeling the SynOptics Series 5000 Hub ....................................................................... 1-10
SynOptics Series 5000 Icons...................................................................................... 1-10
Device Icons ......................................................................................................... 1-11
Small Device Icons ........................................................................................ 1-11
Large Device Icons ........................................................................................ 1-11
Creating a Device Icon .................................................................................. 1-11
Other Icons........................................................................................................... 1-12
NMM Agent Icons ......................................................................................... 1-12
DCE Icons ...................................................................................................... 1-13
Application View Icons.................................................................................. 1-13
Setting Up the Network Topology ............................................................................. 1-13
Accessing SPECTRUM Views from the Device Icon ................................................ 1-15
Chapter 2
Device Views
What Is in This Chapter..................................................................................................... 2-1
Physical Module Representation ....................................................................................... 2-2
Logical Module Representation ......................................................................................... 2-2
The Backplane Module ................................................................................................ 2-2
Backplane Segment Color Schemes...................................................................... 2-3
Backplane Menu Selections .................................................................................. 2-4
Redundancy Table ................................................................................................. 2-4
9031398 E3
iii
Chapter 2
Device Views (continued)
Split/Join Backplane Rings....................................................................................2-7
Ring In/Ring Out Extension Table ........................................................................2-7
Ethernet Modules .........................................................................................................2-9
Ethernet Performance Views.................................................................................2-9
Ethernet Backplane Segment Statistics View....................................................2-10
Ethernet Segment Performance View.................................................................2-12
Token Ring Modules ...................................................................................................2-12
Token Ring Statistics ...........................................................................................2-13
FDDI Modules.............................................................................................................2-15
FDDI SMT Configuration View...........................................................................2-15
FDDI SMT Parameters View...............................................................................2-17
FDDI SMT LER Thresholds Table ......................................................................2-19
FDDI MAC Configuration View ..........................................................................2-20
FDDI MAC Parameters View ..............................................................................2-21
FDDI MAC Detail View .......................................................................................2-22
FDDI MAC Performance View ............................................................................2-24
FDDI MAC Stations View....................................................................................2-24
Chapter 3
Chassis Management Views
What Is in This Chapter .....................................................................................................3-1
Chassis Modeling Information View ..................................................................................3-1
Chassis Configuration View ...............................................................................................3-4
Agent Interface View..............................................................................................3-5
Chassis Group View ............................................................................................................3-6
Chassis Group Components view ................................................................................3-7
Component Store view ...........................................................................................3-8
Chapter 4
NMM Management Views
What Is in This Chapter .....................................................................................................4-1
Accessing the NMM Management Views...........................................................................4-1
NMM Agent Configuration View........................................................................................4-2
NMM Trap Receiver View...................................................................................................4-6
Trap Receiver Table ......................................................................................................4-7
Token Ring NMM Management Views ..............................................................................4-8
TR NMM Show Nodes Table ........................................................................................4-8
TR NMM Find Nodes Table .........................................................................................4-9
Token Ring NMM Topology Table View.....................................................................4-10
Token Ring NMM Ring Topology Table View ............................................................4-11
FDDI NMM Management Views......................................................................................4-12
Agent Download View ................................................................................................4-13
FDDI Show Nodes Table ............................................................................................4-14
FDDI Find Nodes Table..............................................................................................4-15
Paths Table .................................................................................................................4-15
Ring Status View ........................................................................................................4-18
iv
SynOptics Series 5000
Management Module Guide
Chapter 4
NMM Management Views (continued)
Worst Error Table View ............................................................................................. 4-18
Station Status Report (SRF) Event Counters View ................................................. 4-19
Station Status Report (SRF) Condition View ........................................................... 4-20
Ring Topology view..................................................................................................... 4-21
Physical Topology Trunk View................................................................................... 4-21
Physical Topology Node View .................................................................................... 4-22
Optical Bypass Switch Table ..................................................................................... 4-23
Chapter 5
DCE Management Views
What Is in This Chapter..................................................................................................... 5-1
Accessing the DCE Management Views............................................................................ 5-1
DCE Configuration View .................................................................................................... 5-2
DCE Agent Configuration View ......................................................................................... 5-3
Token Ring DCE Management Views................................................................................ 5-5
Token Ring DCE Ring Information View .................................................................... 5-5
Ring ........................................................................................................................ 5-5
Last Beacon............................................................................................................ 5-7
Active Monitor ....................................................................................................... 5-8
Station Table .......................................................................................................... 5-8
Token Ring DCE Performance View ........................................................................... 5-9
Token Ring DCE Ring Statistics View................................................................ 5-10
Token Ring DCE Ring Detail View ..................................................................... 5-11
Token Ring DCE Station Table.................................................................................. 5-13
DCE Station Table ............................................................................................... 5-14
DCE Station Isolating Errors Table View .......................................................... 5-15
DCE Station Non-Isolating Errors Table View .................................................. 5-16
Token Ring Station Detail View.......................................................................... 5-18
Token Ring Staton Control View......................................................................... 5-20
Chapter 6
Event and Alarm Messages
What Is in This Chapter..................................................................................................... 6-1
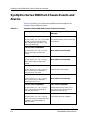
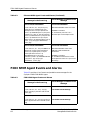
SynOptics Series 5000 Hub Chassis Events and Alarms................................................. 6-2
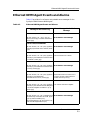
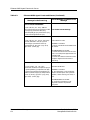
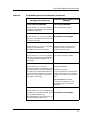
Ethernet NMM Agent Events and Alarms ....................................................................... 6-3
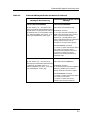
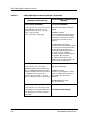
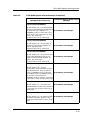
FDDI NMM Agent Events and Alarms ............................................................................. 6-6
Token Ring NMM Agent Events and Alarms.................................................................. 6-15
Appendix A
Ethernet Modules
What Is in This Appendix ..................................................................................................A-1
Ethernet Module Icon.........................................................................................................A-2
Module Identification Labels.......................................................................................A-3
Ethernet Module Icon Subviews Menu Selections .....................................................A-4
Module Configuration View ..................................................................................A-4
9031398 E3
v
Appendix A
Ethernet Modules (continued)
Module Attachment Table .............................................................................. A-6
Attachment or Cluster Configuration View......................................................... A-6
Local Channel, and Cluster Performance Views ................................................. A-7
Local Channel Detail View............................................................................. A-8
Logical Port Icons ...................................................................................................... A-10
Logical Port Identification Labels ...................................................................... A-10
Logical Port Icon Subviews Menu Selections .................................................... A-11
Port Configuration View ..................................................................................... A-12
Port Performance View ....................................................................................... A-13
Port Detail View............................................................................................ A-14
Enable/Disable Port (5378-F, 5308) ............................................................. A-14
Local Channel Icon (5308P, 5378-F, 5304P) ............................................................. A-15
Logical Port Icon Subviews Menu Selections .................................................... A-15
Appendix B
Token Ring Modules
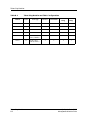
What Is in This Appendix.................................................................................................. B-1
Token Ring Modules........................................................................................................... B-1
Token Ring Module Icon .............................................................................................. B-4
Token Ring Module Icon Subviews Menu ............................................................ B-4
Port Icons ..................................................................................................................... B-4
Configuration Views........................................................................................................... B-6
Module Configuration View ........................................................................................ B-6
Module Attachment Table .................................................................................... B-7
Attachment Configuration View ................................................................................. B-8
Station Port Configuration View ................................................................................ B-9
Appendix C
FDDI Modules
What Is in This Appendix.................................................................................................. C-1
FDDI Modules and Their Configurations ......................................................................... C-2
FDDI Module Icon ....................................................................................................... C-3
FDDI Module Icon Subviews Menu Selections.................................................... C-4
Port Icons ..................................................................................................................... C-4
Port Label Icon Subviews Menu Selections ......................................................... C-5
Configuration Views........................................................................................................... C-5
Module Configuration View ........................................................................................ C-6
Module Attachment Table .................................................................................... C-7
Attachment Configuration View ................................................................................. C-7
Port Profile View ................................................................................................................ C-8
Port Configuration View .................................................................................................... C-9
Connection Capabilities ............................................................................... C-10
Port Parameters View ...................................................................................................... C-10
Port LER Thresholds View .............................................................................................. C-12
Index
vi
SynOptics Series 5000
Management Module Guide
Figures
Chapter 1
Figure 1-1.
Figure 1-2.
Figure 1-3.
Figure 1-4.
Figure 1-5.
Figure 1-6.
Introduction
SynOptics Series 5000 Chassis Backplanes ........................................................ 1-3
SynOptics Series D5000 Chassis Backplanes ..................................................... 1-8
D5000 Logical Device View ................................................................................ 1-10
Modeling the SynOptics Series 5000 Repeaters ............................................... 1-15
Using Double-Click Zones to Access SPECTRUM Views ................................. 1-16
Using the Icon Subviews Menu to Access SPECTRUM Views ........................ 1-17
Appendix A
Figure A-1.
Figure A-2.
Figure A-3.
Ethernet Module Icon ...........................................................................................A-3
Logical Port Icon .................................................................................................A-10
Local Channel Icon .............................................................................................A-15
Appendix B
Figure B-1.
Token Ring Modules
Logical Representation of a Token Ring Module .................................................B-3
Appendix C
Figure C-1.
Ethernet Modules
FDDI Modules
FDDI Module Icon ................................................................................................C-3
9031398 E1
vii
viii
SynOptics Series 5000
Management Module Guide
Tables
Chapter 1
Table 1-1.
Table 1-2.
Table 1-3.
Chapter 2
Table 2-1.
Table 2-2.
Table 2-3.
Table 2-4.
Table 2-5.
Table 2-6.
Table 2-7.
Table 2-8.
Table 2-9.
Table 2-10.
Chapter 3
Table 3-1.
Table 3-2.
Table 3-3.
Chapter 4
Table 4-1.
Table 4-2.
Table 4-3.
Table 4-4.
Table 4-5.
Table 4-6.
Table 4-7.
Table 4-8.
Table 4-9.
Table 4-10.
Table 4-11.
Table 4-12.
Table 4-13.
Introduction
Supported SynOptics Series 5000 Modules.......................................................... 1-4
SynOptics Series 5000 Module Naming Scheme ................................................. 1-6
Supported Model D5000 Series Modules.............................................................. 1-8
Device Views
Status Definitions.................................................................................................. 2-3
Redundant-capability Values................................................................................ 2-5
Redundancy Mode Values ..................................................................................... 2-5
Values That Change Redundancy Mode .............................................................. 2-5
Redundancy Status Values ................................................................................... 2-6
Phantom Status Values......................................................................................... 2-8
Ring In Wrap Status Values ................................................................................. 2-9
Token Ring Performance Statistics .................................................................... 2-14
Configuration Capabilities .................................................................................. 2-17
Station Action Values .......................................................................................... 2-18
Chassis Management Views
Admin State Values............................................................................................... 3-7
Oper State Values.................................................................................................. 3-8
Component Store Table Fields.............................................................................. 3-9
NMM Management Views
Initial Boot Info Source Entries............................................................................ 4-2
Configuration Load Source Values ....................................................................... 4-3
Current Protocol Status Values ............................................................................ 4-3
Next Boot Protocol Values..................................................................................... 4-4
Last Boot Image Save Status Values ................................................................... 4-4
Next Boot Image Load Source Values .................................................................. 4-4
Next Boot Image Save Mode Values..................................................................... 4-5
Write Configuration Settings to NVRAM ............................................................ 4-6
Reboot Agent Values ............................................................................................. 4-6
Receiver Status ...................................................................................................... 4-7
Operational Status of MAC Address .................................................................... 4-9
Valid Flag Status Values .................................................................................... 4-13
FDDI Write Configuration Settings to NVRAM Status Values........................ 4-14
9031398 E1
ix
Chapter 5
Table 5-1.
Table 5-2.
Table 5-3.
Table 5-4.
Table 5-5.
Table 5-6.
Table 5-7.
Table 5-8.
Table 5-9.
Table 5-10.
Table 5-11.
DCE Management Views
Valid Flag Values ...................................................................................................5-4
Write Configuration Settings to NVRAM .............................................................5-4
Ring Status Definitions .........................................................................................5-6
Beacon Type Definitions ........................................................................................5-7
Total Frames Breakdown Pie Chart Definitions................................................5-11
MAC and LLC Frame Breakdown Pie Chart Definitions ..................................5-11
Other Frames Breakdown Pie Chart Definitions...............................................5-11
Isolating Errors Breakdown Pie Chart Definitions............................................5-12
Non-Isolating Errors Breakdown Pie Chart Definitions ...................................5-13
Isolating Errors Breakdown Definitions.............................................................5-18
Non-Isolating Errors Breakdown Definitions.....................................................5-18
Chapter 6
Table 6-1.
Table 6-2.
Table 6-3.
Table 6-4.
Event and Alarm Messages
SynOptics Series 5000 Hub Chassis Events and Alarms ....................................6-2
Ethernet NMM Agent Events and Alarms ...........................................................6-3
FDDI NMM Agent Events and Alarms.................................................................6-6
Token Ring NMM Agent Events and Alarms.....................................................6-15
Appendix A
Table A-1.
Table A-2.
Table A-3.
Table A-4.
Table A-5.
Table A-6.
Table A-7.
Table A-8.
Table A-9.
Table A-10.
Table A-11.
Table A-12.
Table A-13.
Table A-14.
Ethernet Modules and Their Configurations ..................................................... A-1
Ethernet Module Icon Subviews Menu Selections ............................................. A-4
Configuration Source Values ............................................................................... A-5
Frame Breakdown Pie Chart Definitions ........................................................... A-8
Error Breakdown Pie Chart Definitions ............................................................. A-8
Additional Frame Breakdown Pie Chart Definitions......................................... A-9
Additional Statistics Pie Chart Definitions ........................................................ A-9
Ethernet Port Status.......................................................................................... A-11
Redundant Ports Operating in Redundant Pairs............................................. A-11
Logical Port Label Icon Subviews Menu Selections ......................................... A-12
Partition Status Values ..................................................................................... A-12
Link Status Values ............................................................................................ A-13
Jabber Status ..................................................................................................... A-13
Logical Local Channel Icon Subviews Menu Selections .................................. A-15
Appendix B
Table B-1.
Table B-2.
Table B-3.
Table B-4.
Table B-5.
Table B-6.
Table B-7.
Table B-8.
Table B-9.
x
Ethernet Modules
Token Ring Modules
Token Ring Modules and Their Configurations ................................................. B-2
Token Ring Module Icon Subviews Menu Selections ......................................... B-4
Attachment Segment Identifier........................................................................... B-5
Port Link Status Values ...................................................................................... B-5
Logical Port Icon Subviews Menu Selections ..................................................... B-6
Configuration Source Values ............................................................................... B-7
Class Values ......................................................................................................... B-9
Port Connector Types......................................................................................... B-10
Port Media Type Values..................................................................................... B-10
SynOptics Series 5000
Management Module Guide
Appendix B
Table B-10.
Table B-11.
Table B-12.
Table B-13.
Wrap Status Selections ...................................................................................... B-10
Strap Settings ..................................................................................................... B-11
Phantom Status Values...................................................................................... B-11
Insert Status Values........................................................................................... B-12
Appendix C
Table C-1.
Table C-2.
Table C-3.
Table C-4.
Table C-5.
Table C-6.
Token Ring Modules (continued)
FDDI Modules
FDDI Modules and Their Configurations ........................................................... C-2
Logical Module Icon Subviews Menu Selections................................................. C-4
Port Link Status Values....................................................................................... C-5
Logical Port Icon Subviews Menu Selections...................................................... C-5
Configuration Source Values ............................................................................... C-6
Action Values ...................................................................................................... C-11
9031398 E1
xi
xii
SynOptics Series 5000
Management Module Guide
Preface
Use this guide as a reference for the SynOptics Series 5000 management
module and to configure and manage the Ethernet, Token Ring, or FDDI
modules within that management module through SPECTRUM. Before
reading this guide, become familiar with SPECTRUM’s functions. Also,
become familiar with any network management and hardware requirements
described in the SynOptics Series 5000 Hub documentation.
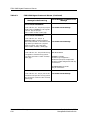
What Is in This Guide
This Guide contains some differences from most SPECTRUM Management
Module Guides. There are no Configuration or Application view chapters. All
Application views are available through the Device or Chassis Management
views. The Configuration views are discussed in the appendices which are
organized by module type, or in chapters organized by DCE and NMM
Management. The following chapter and appendix descriptions outline the
organization of the SynOptics Series 5000 Management Module Guide:
Chapter
Description
Chapter 1
Introduction
Describes the device, the management module and
model types. This chapter also provides
information on accessing device-specific views.
Chapter 2
Device Views
Describes the Device views for the SynOptics
Series 5000 hub.
Chapter 3
Chassis Management Views
Describes the Chassis Management views that are
used to manage the SynOptics Series 5000 hub.
The views dscribed in this chapter are also
accessible through the Application view.
Chapter 4
NMM Management Views
Describes the Network Management Module
(NMM) management views that are used to
manage the SynOptics Series 5000 hub.
Chapter 5
DCE Management Views
Describes the Data Collection Engine (DCE)
management views that are used to manage the
SynOptics Series 5000 hub.
Chapter 6
Event and Alarm Messages
Lists and explains the event and alarm messages
generated in the Event Log or Alarm Manager for
the SynOptics Series 5000 hub chassis and NMM
Agents.
9031398 E3
xiii
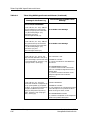
Conventions
Chapter
Description
Appendix A
Ethernet Modules
Describes the generic views available from the
Device view for the SynOptics Series 5000
Ethernet modules.
Appendix B
Token Ring Modules
Describes the generic views available from the
Device view for the SynOptics Series 5000 Token
Ring modules.
Appendix C
FDDI Modules
Describes the generic views available from the
Device view for the SynOptics Series 5000 FDDI
modules.
Conventions
This guide uses the following conventions:
• Command names appear in bold; for example, Clear or Save & Close.
• Menu selections and buttons appear in bold; for example, Configuration
or Detail.
• Buttons appear as shadowed boxeswhen introducing paragraphs
describing their use; for example,
Help
• Referenced chapter titles and section headings appear in italics.
• Referenced documents appear in bold italics.
• Menu navigation appears in order of selection; for example, Icon
Subviews -> Utilities -> Application.
xiv
SynOptics Series 5000
Management Module Guide
Related SPECTRUM Documentation
Related SPECTRUM Documentation
Refer to the following documentation for more information on using
SPECTRUM:
Report Generator User’s Guide
Getting Started with SPECTRUM for Operators
Getting Started with SPECTRUM for Administrators
How to Manage Your Network with SPECTRUM
AutoDiscovery User’s Guide
SynOptics Series 5000 Hardware
Documentation
Refer to the following documentation for more information on the SynOptics
Series 5000 chassis and module hardware. These documents are available
from Bay Networks, Inc.
Installation and Reference for the Model 5000 Chassis
Using the Model 5304P Ethernet Host Module
Using the Model 5307 Ethernet Host Module
Using the Model 5307P Ethernet Host Module
Using the Model 5308 Ethernet Host Module
Using the Model 5308A Ethernet Host Module
Using the Model 5308-AF Ethernet Host Module
Using the Model 5308P Ethernet Host Module
Using the Model 5310 Ethernet Network Management Module
Using the Model 5378-F Ethernet Host Module
Using the Model 5390 Ethernet Host Module
Using the Model 5502 Token Ring Host Module
Using the Model 5505 Token Ring Host Module
Using the Model 5505P Token Ring Host Module
Using the Model 5510 Token Ring Network Management Module
Using the Model 5575-F Token Ring Host Module
9031398 E3
xv
Other Related Documentation
Using the Model 5575-C Token Ring Host Module
Using the Model 5910-S FDDI Network Management Module
Using the Model 5905 FDDI Host Module
Other Related Documentation
Refer to the following documentation for more information on managing TCP/
IP-based networks:
Martin, James, Kathleen Kavanagh Chapman, Joe Leben. Local Area
Networks: Architectures and Implementations, 2d ed. Englewood Cliffs,
NJ: Prentice Hall, 1994.
Michael, Wendy H., William J. Cronin, Jr., Karl F. Piper. FDDI: An
Introduction to Fiber Distributed Data Interface. Woburn, MA: Digital
Press, 1992.
Rose, Marshall T. The Simple Book: An Introduction to Management of
TCP/IP-based Internets. Englewood Cliffs, NJ: Prentice Hall, 1991.
Tanenbaum, Andrew S. Computer Networks, 3d ed. Englewood Cliffs, NJ:
Prentice Hall, 1996.
xvi
SynOptics Series 5000
Management Module Guide
Chapter 1
Introduction
What Is in This Chapter
This chapter introduces the SPECTRUM management module for the
SynOptics Series 5000 hub, (i.e., chassis and modules). This chapter describes
the following information:
•
•
•
•
What Is in This Chapter
The SynOptics Series 5000 Hub
SPECTRUM and the SynOptics Series 5000
SPECTRUM and the SynOptics Distributed 5000 Series
- Chassis Types
- Modules
- Device View
- NMM Modules
• SPECTRUM Support
- Accessing SPECTRUM Views From the Device Icon
- Accessing Device-Specific Subviews
9031398 E3
Introduction
1-1
SynOptics Series 5000 Hub
SynOptics Series 5000 Hub
This section provides an overview of the SynOptics Series 5000 hardware
including the hub chassis and boards that can be installed in the chassis.
Chassis
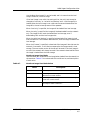
The SynOptics Series 5000 hub is a 14-slot chassis that has Ethernet, Token
Ring, and FDDI backplanes. The chassis supports the following network
configurations:
• Up to 12 Ethernet Segments accessible from any slot. Ethernet backplane
segments are grouped into two banks of six segments. Board attachment
points can be configured through switches, local management, or network
management stations to access any of the six segments in the bank.
• Up to five Token Ring networks accessible from any slot. Four of the five
Token Ring segments can be split into two rings. This configuration
provides two groups of four rings and one common ring for a total of nine
rings.
• Up to five FDDI networks accessible from any slot. Each FDDI network
contains three paths; primary, secondary, and local.
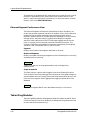
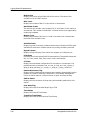
Figure 1-1 shows examples of the chassis backplanes.
Introduction
1-2
SynOptics Series 5000
Management Module Guide
SynOptics Series 5000 Hub
Figure 1-1.
SynOptics Series 5000 Chassis Backplanes
FDDI 1-5
Common Management Bus
Bank 1 (1-6)
Ethernet 1-12
Bank 2 (7-12)
Token Ring 1-5
Modules
Various modules can be inserted in a SynOptics Series 5000 chassis. These
modules are divided into the following types:
• Network Management Modules (NMMs), which use the common
management bus to communicate with other modules installed in the
chassis and to manage the network configurations. Ethernet and Token
Ring NMMs have Data Collection Engines (DCEs), which are network
interfaces used to collect data and statistics from the backplanes.
• Host Modules, which only provide connectivity and can be controlled by
any NMM across the common management bus.
• Intelligent Host Modules, which provide connectivity and collect network
statistics that can be retrieved by any NMM.
9031398 E3
Introduction
1-3
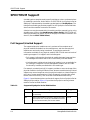
SPECTRUM Support
SPECTRUM Support
A model type is a template used to specify attributes, actions, and associations
for modeling a particular kind of device. In SPECTRUM, the SynOptics Series
5000 hub is represented by the model type designation of HubSyn5xxx. The
HubSyn5xxx model type provides support for the SynOptics Series 5000 hub
chassis and the modules inserted in the chassis.
A device icon may be created with this model type either manually or by using
AutoDiscovery (refer to the AutoDiscovery User’s Guide). SPECTRUM will
identify and model the chassis and all of the physical modules inserted in the
chassis. (See the SPECTRUM Views.)
Full Support/Limited Support
The supported physical modules are only a subset of the complete set of
physical modules available from the manufacturer, and that new physical
modules are continually being introduced. To provide the maximum
information available on any physical module, SPECTRUM uses two levels of
model type support: Full support and Limited support.
• Full support indicates that the physical module has been integrated into
the management module and all of its functionality has been tested.
• Limited support indicates that the physical module is not yet available for
full testing or integration into the management module, but all known
functionality has been provided within the model type.
For example, a module having Full support provides an accurate image of the
physical module in the Physical Device view, whereas a module having Limited
support may use an image from a similar physical module, or a blank image (no
port, tab, or screw representations). Blank images still provide right mouse
button menu functionality, such as access to the Module Notes facility.
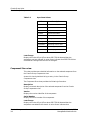
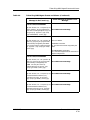
Figure 1-1 provides descriptions and levels of support for the SynOptics Series
5000 physical modules. Figure 1-2 provides the SynOptics naming scheme
used for the Series 5000 modules.
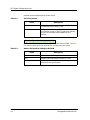
Table 1-1.
Supported SynOptics Series 5000 Modules
Model
Introduction
1-4
Description
Support
5304P
Ethernet Host Module: 10 10BASE-F ports with perport switching.
Full
5307
Ethernet Host Module: Two 50-Pin Telco D connectors Limited
with 12 ports each. One RJ-45, switchable from Telco
port 24. One attachment point for the module.
SynOptics Series 5000
Management Module Guide
SPECTRUM Support
Full Support/Limited Support
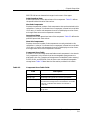
Table 1-1.
Supported SynOptics Series 5000 Modules (Continued)
Description
9031398 E3
Support
5307P
Ethernet Host Module: Two 50-Pin Telco D connectors Full
with 12 ports each. One RJ-45, switchable from Telco
port 24. One attachment point per port.
5308
Ethernet Host Module: 24 RJ-45 ports. One
attachment point for the module.
Full
5308A
Ethernet Host Module: 24 port UTP. One attachment
point for the module.
Limited
5308-AF
Ethernet Host Module: 16 port UTP containing
one AUI and one 10BASE-F. One attachment
point for the module.
Full
5308P
Ethernet Host Module: 24 RJ-45 ports. One
attachment point per port.
Full
5310
Ethernet Network Management Module (NMM).
Full
5310A
Ethernet Network Management Module (NMM).
Limited
5310SA
5310A/SA
Ethernet Network Management Module (NMM).
Limited
5378-F
5378-C
Ethernet Host Module: Four clusters containing one
10BASE-F and 4 UTP ports. Each cluster has an
attachment point for the module.
Full
5390
Xylogics Terminal Server.
Limited
5502
Token Ring Host Module: 24 RJ-45 Passive UTP ports, Limited
5 module rings, and 1 local ring. One attachment point
for the module.
5505
Token Ring Host Module: 24 RJ-45 Active UTP/STP
ports, 5 module rings, and 1 local ring. One
attachment point for the module.
Limited
5505P
Token Ring Host Module: 20 RJ-45 Active UTP/STP
ports, 5 module rings, and 1 local ring. One
attachment point for the module.
Full
5510
Token Ring Network Management Module (NMM).
Full
5575-F
Token Ring Host Module: 3 clusters. Cluster 1 has one Full
UTP/STP RJ-45 station port, Clusters 2 & 3 each have
2 dual-fiber Ring In/Ring Out ports and 3 UTP/STP RJ45 station ports. This module provides 5 module rings,
and 1 local ring. One attachment point per cluster.
5575-C
Token Ring Host Module: 3 clusters. Cluster 1 has one Full
UTP/STP RJ-45 station port, Clusters 2 & 3 each have
2 DB-9 Ring In/Ring Out ports and 3 UTP/STP RJ-45
station ports. This module provides 5 module rings, and
1 local ring. One attachment point per cluster.
Introduction
1-5
SPECTRUM Support
Full Support/Limited Support
Table 1-1.
Supported SynOptics Series 5000 Modules (Continued)
Description
5910S
Support
FDDI Network Management Module (NMM).
Full
5905, 5902, FDDI Host Module: 6 FDDI UTP ports. One
5904
attachment point.
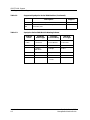
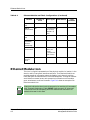
Table 1-2.
SynOptics Series 5000 Module Naming Scheme
Ist Digit
Series
5 = 5000
Introduction
1-6
Full
2nd Digit
Media Type
3rd Digit
Functionality
4th Digit
Port Type
3 = Ethernet
0 = Host Module
1 = Thin Net
5 = Token Ring
1 = NMM Module
2 = DB-9 (STP)
9 = FDDI/
FDDI Stack
2 = Bridge
3 = AUI
3 = Repeater
4 = Fiber
7 = Cluster
5 = UTP
9 = Terminal
Server
8 = 10BASE-T
SynOptics Series 5000
Management Module Guide
SPECTRUM and the SynOptics Distributed 5000 Series
SPECTRUM and the SynOptics Distributed 5000
Series
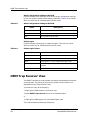
The SynOptics Distributed 5000 (D5000) cascading chassis has some
significant differences with the 5000 series. Other than the differences noted
in this chapter, the D5000 contains the same functionality as the 5000. The
D5000 series supports Ethernet only.
In SPECTRUM, the SynOptics Distributed 5000 hub is represented by the
model type name is HubSyn5DNxxx.
Chassis Types
The Distributed 5000 Series supports two types of chassis:
• 5DN003 which contains 3 host module slots and 1 NMM slot
• 5DN002 which contains 2 host module slots.
Up to 8 Chassis can be cascaded together, providing up to 27 segments. Each
of the 8 chassis can accomodate 3 local segments (24 segments) and 3 cascaded
segments to which any attachment can be made.
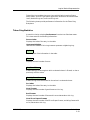
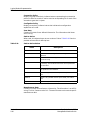
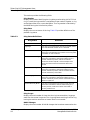
Figure 1-2 shows an example of the chassis’ backplane.
9031398 E3
Introduction
1-7
SPECTRUM and the SynOptics Distributed 5000 Series
Modules
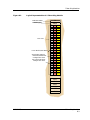
Figure 1-2.
SynOptics Series D5000 Chassis Backplanes
Common Management Bus
Bank 1 (1-3)
Ethernet
Modules
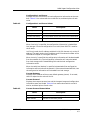
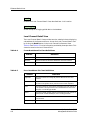
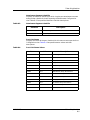
Six modules are supported by the Distributed 5000 series. Table 1-3 provides
descriptions and levels of support for the SynOptics Series D5000 physical
modules.
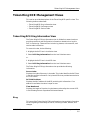
Table 1-3.
Supported Model D5000 Series Modules
Model
Introduction
1-8
Description
5DN304P
3 Port Host Module Full
(10BASE-FL)
5DN307P
1 PortHost Module Full
(10Base-T Telco)
5DN308P
12 Port Host
Full
Module (10Base-T)
5DN308PS
Full
12 Port Host
Module (10Base-T)
with Bay Secure
Lan Access
Support
SynOptics Series 5000
Management Module Guide
SPECTRUM and the SynOptics Distributed 5000 Series
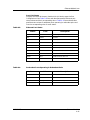
Table 1-3.
Supported Model D5000 Series Modules (Continued)
Model
NOTE
Description
Support
5DN378P-F
8 Port Host Module Full
(Mixed Media)
5DN310
Network
Management
Module
Full
If you model the HubSynDN5xxx through AutoDiscovery, the model will be
placed in Lost & Found because the IP Address is associated with the NMM
Agent.
Device View
Some differences in the D5000 Device view should be noted:
• Multiple cascaded chassis containing boards are displayed instead of just
one chassis' board.
• NMM boards always are in the x4 slot (where x is the first digit of the
chassis number ). The instance on the chassis and boards will change
depending on how they are added to the stack.
• For the 5000, ports can be isolated or attached to a segment local to the
individual board or to a backplane segment. For the D5000, ports can be
isolated, attached to a segment local to the chassis (any port on any board
in that chassis can be on the same local segment) or to a cascaded segment
that any port from any chassis in the stack can be on.
• If more than one NMM is on a repeater stack, the NMM in the chassis
with the lowest number will be active and any others will be in standby
mode. Standby NMMs are used for redundancy purposes.
NOTE
9031398 E3
Up to three (3) Data Collection Modules ((DCMs) called N11s) can be added to
the NMM to monitor the different cascaded segments.
Introduction
1-9
Modeling the SynOptics Series 5000 Hub
NMM Modules
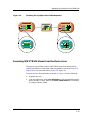
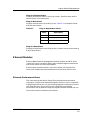
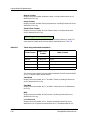
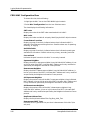
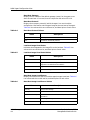
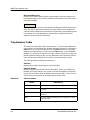
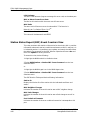
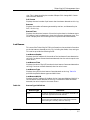
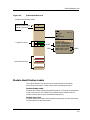
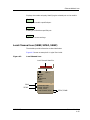
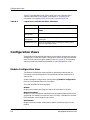
Figure 1-3 shows an example of a D5000 Logical Device view.
Figure 1-3.
D5000 Logical Device View
ENET
10
SEG 1
5DN003
LC - 1
LC - 2
LC - 3
14
11
1 S1
LINK
LINK
7 S1
NLNK
9 S1
NLNK
11 S1
LINK
2 S1
4 S1
6 S1
8 S1
10 S1
12 S1
NLNK
LINK
LINK
LINK
LINK
NLNK
3 S1
5 S1
LINK
<1% <1% <1%
12
1 S1
LINK
LINK
7 S1
NLNK LINK
5DN308P
2 S1
4 S1
6 S1
8 S1
10 S1
12 S1
NLNK
NLNK
NLNK
LINK
LINK
NLNK
3 S1
SEG 3
SEG1 SEG2 SEG3
5DN310
5DN308P
SEG 2
5 S1
9 S1
NLNK
11 S1
NLNK
The D5000 Logical Device view contains the same functionality described in
Chapter 2, except as previously noted.
NMM Modules
One NMM module provides management for up to 8 cascaded chassis. Only
one NMM is active at a time. If there is more than one NMM in the cascaded
unit, the NMM located in the lowest numbered unit is active. the other NMM
modules are in warm standby. The single NMM module provides access to the
NMM Agent views.
Modeling the SynOptics Series 5000 Hub
This section describes the SpectroGRAPH icons that will be used to model and
manage a SynOptics Series 5000 hub in SPECTRUM. It also provides an
example of setting up a Series 5000 modeling hierarchy in a SPECTRUM
Topology view.
SynOptics Series 5000 Icons
The SynOptics Series 5000 management module provides icons that represent
the physical hub device model, its interfaces, the NMM agent model, and
supported application models. The following sections provide a description of
these icons.
Introduction
1-10
SynOptics Series 5000
Management Module Guide
Modeling the SynOptics Series 5000 Hub
SynOptics Series 5000 Icons
Device Icons
The physical hub device model is represented by both small and large device
icons. These icons are created with the HubSyn5xxx model type. Once the
device icon is created, icons representing the device’s interfaces, NMM agent,
and application models are created automatically.
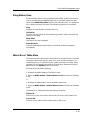
Small Device Icons
The small device icon represents the physical hub device within a Topology
view. Small device icons provide “at a glance” network information through two
condition labels and also provide double-click zones which open more detailed
SPECTRUM views. An example of a small device icon is shown below.
Large Device Icons
The large device icon represents the physical hub device within a Location or
Find view. It is used to show the physical location of the device. Large device
icons provide “at a glance” network information through two condition labels
and provide double-click zones which open more detailed SPECTRUM views.
An example of a large device icon is shown below.
Creating a Device Icon
Three methods exist for creating a SynOptics device icon in SPECTRUM:
• Set individual icon parameters through the Edit -> New Model... option.
9031398 E3
Introduction
1-11
Modeling the SynOptics Series 5000 Hub
SynOptics Series 5000 Icons
• The Edit -> New Model By IP... option which uses SPECTRUM default
icon parameters.
• A device icon can also be created using AutoDiscovery (see the
AutoDiscovery User’s Guide).
In order for SPECTRUM to properly model the SynOptics Series 5000 hub, it
must locate, identify, and model all active NMM Agents. For this to be
accomplished, provide SPECTRUM with the community names for all of the
active NMM Agents.
• When creating a device icon with the Edit -> New Model... method, you
can provide the community name corresponding to an IP address of the
device icon being created and the additional community names for all the
active NMM Agents at the time of creation. If you do not provide the NMM
Agent community names when creating the device icon with this method,
you can add them later with the Chassis Modeling Information view.
• When creating a device icon with the Edit -> New Model By IP...
method, you can only provide the community name corresponding to an IP
address of the device icon being created. You must add the additional
community names for all of the NMM Agents active on the device through
the Chassis Modeling Information view.
• When creating a device icon with AutoDiscovery, add the additional
community names for all of the NMM Agents active on the device through
the Chassis Modeling Information view.
See Chapter 3, Chassis Management Views, for information on using the
Chassis Modeling Information view to add additional community names.
Other Icons
This section describes the additional icons that are created automatically
when you create a SynOptics Series 5000 device icon. These icons represent
the NMM Agent models, Data Collection Engine (DCE) models, and other
supported applications such as repeating and SynOptics common
applications.
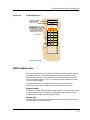
NMM Agent Icons
SPECTRUM creates this icon to represent the agent on an NMM module in the
SynOptics Series 5000 chassis. Network management stations can access
information and manage the chassis through the NMM Agents. The NMM
Agent models “Manage” application models, such as MIB-II. An example of an
NMM Agent icon is shown below.
Introduction
1-12
SynOptics Series 5000
Management Module Guide
Modeling the SynOptics Series 5000 Hub
Setting Up the Network Topology
NMM
Agent
DCE Icons
For Ethernet and Token Ring NMM models, there are corresponding Data
Collection Engine (DCE) models which represent network interfaces that are
used to collect data and statistics from the backplanes. An example of a DCE
icon, as seen in the Logical Device view, is shown below.
1
S-5
0
Application View Icons
Application View icons represent applications supported by the SynOptics
Series 5000 hub. This would include SynOptics proprietary, repeater, or
common applications. Examples of application icons are shown below.
FDDI
SynFDDIMac
Setting Up the Network Topology
After creating the HubSyn5xxx model, setting up a network topology for the
SynOptics Series 5000 hub involves copying and pasting repeater models from
9031398 E3
Introduction
1-13
Modeling the SynOptics Series 5000 Hub
the Application view into their respective LAN_802_3, LAN_802_5, or FDDI
network models.
To set up a network topology for the SynOptics Series 5000 hub, do the
following:
1. Highlight the large or small device icon and select Application from the
Icon Subviews menu, or double-click the icon’s model type label.
2. Edit/Copy the Syn5EnetRptr, Syn5FDDIMac, or Syn5TRRptr icon
associated with the network model to be monitored.
3. Access the LAN_802_3, LAN_802_5, or FDDI network model’s Topology
view by highlighting the network icon and select Topology from the Icon
Subviews menu, or double-click the icon’s down arrow.
4. Edit/Paste the Syn5EnetRptr, Syn5FDDIMac, or Syn5TRRptr icon
associated with that network model into the network model’s Topology
view.
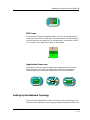
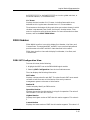
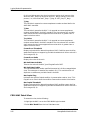
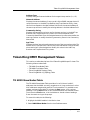
Figure 1-4 shows an example of a FDDI and LAN_802_3 network model
connected by a router with SynOptics FDDI and Ethernet repeaters models
pasted into the network models.
Cabletron recommends creation of the HubSyn5xxx device model in the
Location View. The model represents the chassis and is not topologically
significant. There is no Device Topology (DevTop) View available for the model
as it may represent several repeater elements, each having its own
connectivity.
Introduction
1-14
SynOptics Series 5000
Management Module Guide
Modeling the SynOptics Series 5000 Hub
Accessing SPECTRUM Views from the Device Icon
Figure 1-4.
Modeling the SynOptics Series 5000 Repeaters
FDDI
LAN_803_3
SynFDDIMac
Accessing SPECTRUM Views from the Device Icon
The Device icon provides access to SPECTRUM views that display devicespecific information. Access these views using double-click zones (Figure 1-5,
page 1-16) or Icon Subviews menus (Figure 1-6, page 1-17).
To access the Icon Subviews menu as shown in Figure 1-6, do the following:
1. Highlight the icon.
2. From the View menu, select Icon Subviews or click the applicable mouse
button (middle or right). Refer to the SPECTRUM Views for information
on configuring your mouse.
9031398 E3
Introduction
1-15
Modeling the SynOptics Series 5000 Hub
Figure 1-5.
Using Double-Click Zones to Access SPECTRUM Views
Accesses the Device Topology view;
refer to the SPECTRUM Views.
Model Name
Accesses the Device view; see
Chapter 2, Device Views.
HubSyn5000
Accesses the Performance view;
refer to the SPECTRUM Views.
Accesses the Device view; see
Chapter 2, Device Views.
Model Name
Accesses the Performance view;
refer to the SPECTRUM Views.
HubSyn5000
Accesses the Device Topology view;
refer to the SPECTRUM Views.
Introduction
1-16
SynOptics Series 5000
Management Module Guide
Modeling the SynOptics Series 5000 Hub
Figure 1-6.
Using the Icon Subviews Menu to Access SPECTRUM Views
Model Name
HubSyn5000
Primary Landscape 0x00400000 - VNM Host - LAN of type Landscape
*
File
View
Go Back
Go Up
Icon Subviews
View Path
New View
Jump to View
View History...
Current View Information...
Notes
Jump by Name...
Zoom
Map Hierarchy
9031398 E3
Help?
Close
Ctrl+c
Navigate
Alarms
Performance
Notes...
Utilities
Zoom
Device
Acknowledge
Flash Green Enabled
Application
Model Information
NMM Agent View
Acknowledge
Chassis Modeling Info
Chassis Configuration
Chassis Group
Primary Application
Logical
Physical
Introduction
1-17
Modeling the SynOptics Series 5000 Hub
Introduction
1-18
SynOptics Series 5000
Management Module Guide
Chapter 2
Device Views
What Is in This Chapter
This chapter describes the following Device views and subviews available for
the SynOptics Series 5000 Hub:
• Logical Device View
- Backplane Module Icon
- Ethernet Module Icons
- Token Ring Module Icons
- FDDI Module Icons
The Device views provide actual representation of the SynOptics Series 5000
hub configuration. If the configuration changes (for example, a module is
pulled from or added to the hub), SPECTRUM modifies the Device view after
the next polling cycle to reflect the changes.
9031398 E3
Device Views
2-1
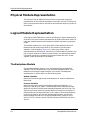
Physical Module Representation
Physical Module Representation
The SynOptics Series 5000 Hub Physical Device view shows a physical
representation of the hub and the modules installed in the hub. The Physical
Device view provides access to information and subviews pertaining to each of
the modules.
Logical Module Representation
A SynOptics Series 5000 Device view can also display a logical representation
of the hub. The logical module representation provides information about the
individual modules and the hub’s backplane instead of presenting a physical
image.
The leftmost module icon in the Logical Device view represents the hub’s
backplane and provides information on the connectivity of backplane
segments, rings, and paths (Figure 1-1). Other slots contain logical
representations of the Ethernet, Token Ring, or FDDI modules installed in the
hub. A logical module is divided into several areas, one representing module
information and others representing information about each port, cluster,
segment, and/or attachment on the module.
The Backplane Module
The backplane module contains icons representing Ethernet backplane
segments, Token Ring backplane rings, and FDDI backplane paths. Each
backplane icon displays usage through a color scheme. The backplane
representation is broken down into the following areas:
Module Identifier
Identifies the module type and provides double-click access the Backplane
Notes view.
Protocol Identifier
Identifies the protocol type of the backplane segments following it, (i.e.,
Ethernet, Token Ring, or FDDI). The Ethernet Protocol Identifier provides
double-click access to the Ethernet Backplane Segment Statistics view. The
Token Ring Protocol Identifier provides double-click access to the Split/Join
Backplane Rings view described later in this chapter. Token Ring backplane
rings can be joined or split through the backplane module. You can view
Ethernet backplane statistics, an Ethernet Redundancy Table for entire
chassis, TR FPU statistics and an TR RI/RO Extension Table for the entire
chassis.
Device Views
2-2
SynOptics Series 5000
Management Module Guide
Logical Module Representation
The Backplane Module
Segment, Ring, or Path Identifier
Identifies which segment this model represents, (i.e., Ethernet, Token Ring,
and FDDI). The Ethernet Segment Models provide double-click access to the
Segment Performance view. The Token Ring or FDDI Path Models have no
double-click zone. All segment, ring, and path models also change color to
represent their status. Table 2-1 lists each possible status and its
corresponding color:
Table 2-1.
Status Definitions
Status
Description
Highlighted
Orange
Normal State
Off-White
Inactive
Dark Gray
Token Ring Segment Identifiers also display current Ring Speed if the
backplane ring has an attachment.
Backplane Segment Color Schemes
The Logical Device view includes a color scheme that allows quick
determination of which attachments (clusters, single module, or port
attachments) are connected to a particular backplane segment, ring, or path.
After clicking the desired backplane segment, ring, or path identifier to select
it, the identifier changes color, along with all associated attachments on all
the modules installed in the hub. To deselect the segment, ring, or path and its
corresponding attachments, click the identifier again. It is not possible to
deselect an attachment by clicking it if it has been highlighted through a
backplane segment, ring, or path identifier.
Click a previously highlighted attachment to select it, and the attachment
changes color along with the corresponding backplane segment, ring, or path
identifier. No other attachments connected to the segment, ring, or path will
change color unless the segment, ring, or path identifier itself is selected. To
deselect the attachment and the corresponding segment identifier, click the
attachment again.
If a segment, ring, or path identifier has been highlighted by selecting one or
more attachments and the identifier is clicked, control of the color scheme is
given over to the identifier. All associated attachments that are not already
highlighted change color, and cannot revert to normal until the segment is
clicked again.
9031398 E3
Device Views
2-3
Logical Module Representation
The Backplane Module
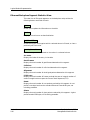
Backplane Menu Selections
Positioning the cursor on the Module Identifier, Protocol Identifier, or on a
Segment Identifier, and pressing the right mouse button accesses the Icon
Subviews menu for the selected area of the logical module. Another way to
access the Icon Subviews menu is by clicking the Module Identifier, Protocol
Identifier, or a segment, which highlights the model, and then selecting Icon
Subviews from the view menu.
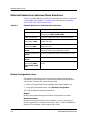
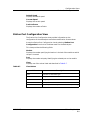
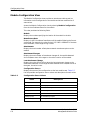
Redundancy Table
The Redundancy Table provides redundancy status and control for each
redundancy-capable port in the Series 5000 chassis. Only the following types
of redundancy-capable ports appear in the table:
• Ports with remote fault signaling capability
• Ports without remote fault signaling capability which depend on link
status to provide redundancy
To access the Redundancy Table, do the following:
1. Within the Logical Device view, highlight the “ENET” icon.
2. From the Icon Subviews menu, select Redundancy Table.
or:
1. Within the Application view, highlight the Syn5EnetApp Icon.
2. From the Icon Subviews menu, and select Redundancy Table .
The Redundancy Table provides the following information:
Last Change
Displays the “sysUpTime” value when the last change to any Redundancy
Table entry was detected.
Module
Displays the slot in the hub containing the board on which the port is located.
Port
Displays the number of the port on the board.
Capability
Device Views
2-4
SynOptics Series 5000
Management Module Guide
Logical Module Representation
The Backplane Module
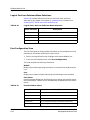
Displays the redundant-capability of the port. Table 2-2 lists the possible
values and their descriptions:
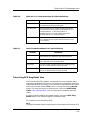
Table 2-2.
Redundant-capability Values
Value
Description
hwRedOnly
hardware redundancy only
swRedOnly
software redundancy only
hwAndswRed
both hardware and software redundancy
A value of “hwRedOnly” and “hwAndswRed” indicates that the port is capable
of being configured into a hardware-redundant pair. A value of “swRedOnly”
or “hwAndswRed” indicates that the port is capable of being configured into a
software-redundant pair.
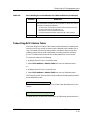
Redundancy Mode
Displays the redundancy mode of the port. Table 2-3 lists possible values and
their descriptions:
Table 2-3.
Redundancy Mode Values
Value
Description
standalone
The port is not in any redundant pair.
hwActive
The port is the active companion in a hardware-redundant
pair.
hwStandby
The port is the standby companion in a hardwareredundant pair.
swActive
The port is the active companion in a software-redundant
pair.
swStandy
The port is the standby companion in a software-redundant
pair.
Table 2-4 lists and describes values that can be written to the device to change
redundancy mode:
Table 2-4.
Values That Change Redundancy Mode
Value
9031398 E3
Description
standalone
Causes the redundant pair to be broken up.
hwActive
If the previous value was “hwStandby”, this value causes
the port to become the active port in the hardwareredundant pair, resulting in a switchover.
Device Views
2-5
Logical Module Representation
The Backplane Module
Table 2-4.
Values That Change Redundancy Mode (Continued)
Value
Description
hwStandby
If the previous value was “hwActive”, this value causes the
port to become the standby port in the hardware-redundant
pair, resulting in a switchover.
swActive
If the previous value was “swStandby”, this value causes
the port to become the active port in the softwareredundant pair, resulting in a switchover.
swStandy
If the previous value was “swActive”, this value causes the
port to become the standby port in the hardware-redundant
pair, resulting in a switchover.
Changing this field to “hwActive” or “hwStandby”, creates a hardwareredundant pair. Changing this field to “swActive” or “swStandby”, creates a
software-redundant pair.
Operational Status
Displays the redundancy status of the port. Table 2-5 lists possible values and
their descriptions:
Table 2-5.
Redundancy Status Values
Value
Description
other
none of the following
ok
no faults detected
localFault
The local port has sensed a fault condition.
remoteFault
The remote port has sensed a fault condition.
Either a “localFault” or “remoteFault” condition causes a redundant port pair
to switchover. If the port does not belong to a redundant pair, a value of
“other” is displayed.
If the redundant link consists of ports without remote fault capability, the
value “remoteFault” is not reported and the value “localFault” implies that
the link is off.
Faults
Displays the number of local or remote faults on this port. This counter
increments whenever there is a transition between a fault and no-fault state.
Companion Module
Identifies the slot in the hub containing the board having the other port in the
redundant pair. If this port is hardware-redundant capable, this field displays
the slot number of the potential redundant companion even if it is in
Device Views
2-6
SynOptics Series 5000
Management Module Guide
Logical Module Representation
The Backplane Module
standalone mode. This allows a network administrator to determine the
location of the potential redundant companion as it is fixed by the board’s
hardware.
Companion Port
Identifies the number of the other port in the redundant pair. If this port is
hardware-redundant capable, this field displays the slot number of the
potential redundant companion even if it is in standalone mode. This allows a
network administrator to determine the location of the potential redundant
companion as it is fixed by the board’s hardware.
Double-click any entry in the Redundancy Table to access the Port
Redundancy View. This view contains the following information:
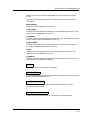
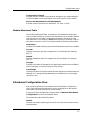
Split/Join Backplane Rings
This view allows splitting of five Token Ring backplane segments into nine
rings or join the nine Token Ring backplane segments into five rings.
To access this view, do the following:
1. Within the Logical Device view, highlight the Token Ring Module Icon.
2. From the Icon Subviews menu, select Split/Join Backplane Rings.
To split the five Token Ring backplane segments into nine rings, click the split
button and then click the Apply button.
To join the nine Token Ring backplane segments into five rings, click the join
button and then click the Apply button.
Ring In/Ring Out Extension Table
This table provides information about each Ring In/Ring Out pair on a board.
The number of entries is determined by the number of existing Ring In/Ring
Out pairs. Boards without Ring In/Ring Out pairs do not have entries in the
table.
To access this table, do the following:
1. Within the Logical Device view, highlight the Token Ring Module Icon.
2. From the Icon Subviews menu, select RI/RO Extension Info Table.
The Ring In/Ring Out Extension Table provides the following information:
Current Number of Entries
Displays the current number of entries in the Ring In/Ring Out Extension
Table.
9031398 E3
Device Views
2-7
Logical Module Representation
The Backplane Module
Last Change
Displays the “sysUpTime” value when the last change to any Ring Extension
Table entry was detected.
Double-click an entry in the table to access a Ring In/Ring Out pair-specific
information view which provides the following information:
Module
Displays the slot in the hub chassis containing the board on which the Ring
In/Ring Out pair is located.
Ring
Displays the logical number of the ring to which the Ring In/Ring Out pair
connects.
Cluster
Displays the cluster number where the Ring In/Ring Out pair is located on the
board.
Secondary Upstream Neighbor
Displays the secondary upstream neighbor address as read by the Frame
Processing Unit that is located between the Ring In/Ring Out ports.
RI/RO Extension Pair
Displays the index of the Ring In/Ring Out extension pair on the board. The
value is between “1” and the number of Ring In/Ring Out pairs on the board.
Ring In Port Number
Displays the port number of the Ring In port.
Ring Out Port Number
Displays the port number of the Ring Out port.
Ring In Upstream Neighbor Address
Displays the upstream neighbor address for this Ring In port.
Ring Out Upstream Neighbor Address
Displays the upstream neighbor address for this Ring Out port.
Ring In Phantom Status
Displays the phantom status of the Ring In port. Table 2-6 lists possible
values and their descriptions:
Table 2-6.
Phantom Status Values
Value
Device Views
2-8
Description
other
status unknown
noPhantom
no phantom signal
phantom
Phantom is on.
SynOptics Series 5000
Management Module Guide
Logical Module Representation
Ethernet Modules
Ring Out Phantom Status
Displays the phantom status of the Ring Out port. Possible values are the
same as Ring In Phantom Status.
Ring In Wrap Status
Displays the wrap status of the Ring In port. Table 2-7 lists possible values
and their descriptions:
Table 2-7.
Ring In Wrap Status Values
Value
Description
other
wrap status unknown
wrap
Port is wrapped.
connect
Port is unwrapped.
Ring Out Wrap Status
Displays the wrap status of the Ring Out port. Possible values are the same as
Ring In Wrap Status.
Ethernet Modules
Ethernet NMM (Network Management Module) modules have DCE (Data
Collection Engine) icons which display their backplane segment attachment
and current load on the monitored segment.
Ethernet Host modules have port icons which display link and partition
status. Host modules also have attachment icons and local channel icons.
Ethernet Performance Views
Two views are available which display Ethernet backplane performance
information. The Ethernet Backplane Segment Statistics view is accessed by
highlighting the Enet port icon and selecting Segment Performance from the
Icon Subviews menu. Access the SynOptics 5000 Ethernet Segment
Performance view by double-clicking any segment beneath the Enet port icon.
These views contain the following information:
9031398 E3
Device Views
2-9
Logical Module Representation
Ethernet Backplane Segment Statistics View
This view lists all Ethernet segments on the backplane and provides the
following buttons and fields for each:
Update
Allows you to update the information on the table.
Totals
Displays the total errors as described below.
Set/Clear Filter
Allows setting of a value against which a selected column is filtered, or clear a
previously set filter value.
Sort Up/Down/Unsort
Allows sorting of the table, based on the values in a selected column.
Src Index
Displays the index of the entry in the table.
Good Frames
Displays the total number of good frames detected on this segment.
Collisions
Displays the total number of collisions detected on this segment.
Alignment
Displays the total number of misaligned packets detected on this segment.
FCS Errors
Displays the total number of frames received that are an integral number of
octets in length but do not pass the Frame Check Sequence (FCS).
Runts
Displays the total number of runt packets received by this segment. A runt
packet is one byte less than the standard Ethernet frame of 64 bytes, not
including preamble.
Giants
Displays the total number of giant packets received by this segment. A giant
packet exceeds 1518 bytes, not including preamble.
Device Views
2-10
SynOptics Series 5000
Management Module Guide
Logical Module Representation
OOW Collisions
Displays the total number of Out Of Window (OOW) collisions detected on this
segment.
Segment Detail
Opens the Segment Detail view. The Segment Detail view contains all the
information listed above as well as a button for Additional Statistics. The
Additional Statistics and the Segment Additional Detail button both
display the following information:
Bcast Frames
Displays the total number of broadcast frames detected on this segment.
Mcast Frames
Displays the total number of multicast frames detected on this segment.
TotalFragments
Displays the total number of fragmented frames detected on this segment.
Long Events
Displays the number of times that MAU jabber lockup protection (MJLP) was
detected due to transmission of data that exceeded 5 msec in duration (Octet
count greater than MaxFrame size). This information can be useful in
identifying faulty stations.
Short Events
Displays the number of fragments detected with Activity Duration less than
Short Event MaxTime. Short Event MaxTime is greater than 74 bit times and
less than 82 bit times.
Rate Mismatches
Displays the number of occurrences of out of spec rate bits. This indicates the
number of times the FIFO buffer over-runs or under-runs due to transmission
rate errors.
Backoff Fails
Displays the number of times a frame was received on this port with collision
and port activity time of a value greater than 552 to 560 bit time.
Auto Partitions
Displays the number of times that this segment was auto-partitioned by the
hardware. This condition occurs when 32 consecutive collisions are detected
on the port.
Short IPGs
Displays the number of occurrences of too short Inter-Packet Gaps (IPGs)
before good packets detected.
Null Frames
Displays the total number of empty frames detected on this segment.
9031398 E3
Device Views
2-11
Logical Module Representation
Three buttons at the bottom of this graph allow you to select the way in which
the data is represented (Total, Delta, and Accum). Another button, Clear,
works in conjunction with the Accum button. For more information on these
buttons, refer to the SPECTRUM Views.
Ethernet Segment Performance View
The Ethernet Segment Performance view displays a Multi-Attribute Line
Graph that provides a general indication of network activity for the Ethernet
backplane. The attributes displayed are pre-selected and use colors to
represent different statistics. The attributes are displayed as current values,
average values, and peak values. The peak values display the highest
statistical value reached since SPECTRUM began logging and the current
time, or the time at which the peak value was reached if one exists. The
SynOptics 5000 Ethernet Segment Performance view displays the foregoing
values for Load, Frame Rate, %Error, and %Collision.
Segment
Displays the number of the segment described in the view.
Monitored Segment
Displays a number indicating the segment to which the backplane is currently
connected and is monitoring.
Lin/Log
Toggles the right axis of the graph between linear and logarithmic
representation.
Graph Properties
This field contains a button which toggles to the three following functions:
Scroll to Date-Time allows setting of the viewing area of the graph to begin at
a specified date and time. Change Time Scale allows specification of the Y axis
time scale for the graph. Data Logging allows logging of polled data in the
database.
Detail
Accesses the Segment Detail view, described previously in this section.
Token Ring Modules
Token Ring NMM (Network Management Module) modules have DCE (Data
Collection Engine) icons which display their Backplane Ring attachment and
current load on the monitored ring.
Device Views
2-12
SynOptics Series 5000
Management Module Guide
Logical Module Representation
Token Ring Host modules have port icons which display Insertion Status,
Wrap Status, and Port Type (where applicable). Hosts also have Attachment
Icons, Module Ring Icons, and Local Ring icons.
The following views provide performance information for the Token Ring
Backplane:
Token Ring Statistics
Access this view by selecting Performance from the Icon Subviews menu.
This view contains the following information:
Source Index
Displays the index of the entry in the table.
Upstream Neighbor
Indicates the number of this ring’s nearest upstream neighboring ring.
Update
Allows update of the information in the table.
Totals
Displays the total number of errors.
Set/Clear Filter
Allows setting of a value against which a selected column is filtered, or clear a
previously set filter value.
Sort Up/Down/Unsort
Allows sorting of the table based on the values in a selected column.
Src Index
Displays the index of the entry in the table.
Good Frames
Displays the total number of good frames on this ring.
Bad Frames
Displays the total number of frames with errors detected on this ring.
Good Error Report Frames
Displays the total number of Soft Error Report frames, excluding frames with
errors, detected on this ring.
9031398 E3
Device Views
2-13
Logical Module Representation
Beacon Frames
Displays the total number of beacon frames, including frames with errors,
detected on this ring.
Purge Frames
Displays the total number of Ring Purge frames, including frames with errors,
detected on this ring.
Claim Token Frames
Displays the total number of Claim Token frames, including frames with
errors, detected on this ring.
Token Ring Performance Statistics
Accesses the SynOptics 5000 Token Ring Performance Statistics view. This
view contains a graph with the information detailed below in Table 2-8.
Table 2-8.
Token Ring Performance Statistics
Total Frames
MAC & LLC
Frames
Other Frames
Total Good
MAC
Good Error Report
Total Bad
LLC NonUcast
Beacon
Total
LLC Ucast
Ring Purge
-------------------------- Total
Claim Token
-------------------------- -------------------------- Total
The entries under Other Frames are described above. Total Frames and MAC
& LLC Frames are described as follows:
Total Good
Displays the total number of LLC and MAC frames, excluding frames with
errors, detected on this ring.
Total Bad
Displays the total number of LLC and MAC frames with errors detected on
this ring.
MAC
Displays the total number of MAC frames, including frames with errors,
detected on this ring.
LLC NonUcast
Displays the total number of LLC frames, including frames with errors,
detected on this ring that were directed to an LLC broadcast address (i.e.,
Device Views
2-14
SynOptics Series 5000
Management Module Guide
Logical Module Representation
FDDI Modules
0xFFFFFFFFFFFF or 0xC000FFFFFFFF) or a local or global multicast, or
functional address (i.e., 0xC000xxxxxxxx).
LLC Ucast
Displays the total number of LLC frames, including frames with errors,
detected on this ring that were directed to an LLC unicast address.
Three buttons at the bottom of this graph allow you to select the way in which
the data is represented (Total, Delta, and Accum). Another button, Clear,
works in conjunction with the Accum button. For more information on these
buttons, refer to the SPECTRUM Views.
FDDI Modules
FDDI NMMs have Port icons which display Port Number, Line State, and
Connect State. The associated SMT and MAC icons are also displayed and
provide access to the SMT and MAC views described in this section.
FDDI Hosts have Port icons which display Port Number, Line State, and
Connect State.
FDDI SMT Configuration View
To access this view, do the following:
1. Highlight the SMT icon on the FDDI NMM logical module.
2. Selecting SMT Configuration from the Icon Subviews menu.
The view displays the following information:
SMT Index
Displays a unique value for each SMT. The value for each SMT must remain
constant at least from one re-initialization of the entity’s network
management system to the next re-initialization.
Station ID
Used to uniquely identify an FDDI station.
Operation Version
Displays the version that this station is using for its operation. The value of
this variable is 2 for this SMT revision.
Highest Version
Displays the highest version of SMT that this station supports. This value is
2.
Lowest Version
Displays the lowest version of SMT that this station supports. This value is 2.
9031398 E3
Device Views
2-15
Logical Module Representation
FDDI Modules
MIB Version
Displays the version of the FDDI MIB of this station. The value of this
variable is 1 for this SMT revision.
MAC Count
Displays the number of MACs in this station or concentrator.
Non-Master Count
The value of this variable is the number of A, B, and S ports in this station or
concentrator. This number includes MAC instances that are not supported by
underlying hardware.
Master Count
Displays the number of M Ports in a node. If the node is not a concentrator,
the value of the variable is zero.
Available Paths
Displays a group of read-only indicator buttons that indicate the PATH types
available for the station. Possible values are; primary, secondary, and local.
Bypass Present
Displays a flag indicating if the station has a bypass on its AB port pair.
ECM State
Indicates the current state of the ECM state machine. The possible values are;
Out, In, Trace, Leave, Path_Test, Insert, Check, and Deinsert.
CF State
Displays the attachment configuration for the station or concentrator. The
possible values are; Isolated, Local_a, Local_b, Local_ab, Local_s, Wrap_a,
Wrap_b, Wrap_ab, Wrap_s, C_wrap_a, C_wrap_b, C_wrap_s, and Thru.
Remote Disconnect Flag
Displays a flag indicating that the station was remotely disconnected from the
network as a result of receiving a disconnect in a Parameter Management
Frame. A station requires a Connect Action to rejoin and clear the flag.
Station Status
Displays the current status of the primary and secondary paths within this
station.
Peer Wrap Flag
Displays the value of the Peer Wrap Flag in CFM.
Time Stamp
Displays the value of Time Stamp.
Transition Time Stamp
Displays the value of the Transition Time Stamp.
Device Views
2-16
SynOptics Series 5000
Management Module Guide
Logical Module Representation
FDDI Modules
Set Count
Displays a count incremented in response to a Set operation on the MIB. The
transition timestamp is not included.
Last Set Station ID
Displays the ID of the station which performed the last set.
Configuration Capabilities
Displays a group of read-only indicator buttons that indicate the configuration
capabilities of a node. Table 2-9 lists possible values and their descriptions.
Table 2-9.
Configuration Capabilities
Value
Description
holdAvailable
Indicates the support of the optional Hold function.
cf-wrap-ab
Indicates that the station has the capability of performing a
wrap_ab.
FDDI SMT Parameters View
To access this view, do the following:
1. Highlight the SMT icon on the FDDI NMM logical module.
2. Select SMT Parameters from the Icon Subviews menu.
The view displays the following information:
Intelligent Insertion Policy
Displays the Intelligent Insertion policy used by the SMT on this concentrator.
Possible values are “on” and “off”. The default is “on”.
Intelligent Insertion Mask
Displays the Intelligent Insertion Policy Bit Mask.
Trace_Max Expiration
The reference Trace_Max.
Status Report Policy
If true, indicates that the node will generate Status Reporting Frames for its
implemented events and conditions. It has an initial value of “true”.This
variable determines the value of the SR_Enable Flag.
Notify Timer
Displays the timer, expressed in seconds, used in the Neighbor Notification
protocol. It has a range of 2 seconds to 30 seconds, and its default value is 30
seconds.
9031398 E3
Device Views
2-17
Logical Module Representation
FDDI Modules
Connection Policy
Displays a group of read-only indicator buttons representing the connection
policies in effect on a node. A station sets the corresponding bit for each of the
connection types that it rejects.
Configation Policy
Displays a read-only indicator button that indicates the configuration
capabilities of a node.
User Data
Contains 32 octets of user defined information. The information shall be an
ASCII string.
Station Action
When read, this object always returns a value of “other”. Table 2-10 lists the
possible values and their descriptions.
Table 2-10.
Station Action Values
Value
Description
other
Results in an error.
connect
Generates a connect signal to ECM to begin a connection
sequence.
disconnect
Generates a disconnect signal to ECM and sets the Remote
Disconnect Flag.
path-test
Initiates a station Path_Test. The Path_Test variable is set
to “Testing”. The results of this action are not specified in
this standard.
self-test
Initiates a station Self_Test. The results of this action are
not specified in this standard.
disable-a
Causes a PC_Disable on the A port if the A port mode is
peer.
disable-b
Causes a PC_Disable on the B port if the B port mode is
peer.
disable-m
Causes a PC_Disable on all M ports.
Manufacturer Data
Contains 32 octets of manufacturer information. The information is an ASCII
string. The first 3 octets are the OUI. The next 29 octets are the actual specific
manufacturer data.
Device Views
2-18
SynOptics Series 5000
Management Module Guide
Logical Module Representation
FDDI Modules
FDDI SMT LER Thresholds Table
To access this view, do the following:
1. Highlight the SMT icon on the FDDI NMM logical module.
2. Select SMT LER Thresholds from the Icon Subviews menu. (Double-click
any entry to access the Port LER Thresholds view.)
The view displays the following information:
SMT Index
Displays the value of the SMT index associated with this port.
Port Index
Displays a unique value for each port within a given SMT. The value for each
port must remain constant at least from one re-initialization of the entity’s
network management system to the next re-initialization.
LCT Failure Count
Displays the count of the consecutive times the link confidence test (LCT) has
failed during connection management.
LER Estimate
Displays a long term average link error rate. It ranges from 10**-4 to 10**-15
and is reported as the absolute value of the base 10 logarithm.
LEM Reject Count
Displays a link error monitoring count of the times that a link has been
rejected.
LEM Error Count
Displays the aggregate link error monitor error count, set to zero only on
station initialization.
LER Cutoff
Displays the link error rate estimate at which a link connection will be
broken. It ranges from 10**-4 to 10**-15 and is reported as the absolute value
of the base 10 logarithm. The default is 7.
LER Alarm
Displays the link error rate estimate at which a link connection will generate
an alarm. It ranges from 10**-4 to 10**-15 and is reported as the absolute
value of the base 10 logarithm of the estimate. The default is 8.
LER Condition
Displays the LER Condition (reported with the Status Report Frames (SRF)).
9031398 E3
Device Views
2-19
Logical Module Representation
FDDI Modules
FDDI MAC Configuration View
To access this view, do the following:
1. Highlight the MAC icon on the FDDI NMM logical module.
2. Select MAC Configuration from the Icon Subviews menu.
The view displays the following information:
SMT Index
Displays the value of the SMT index associated with this MAC.
MAC Index
Displays the index variable for uniquely identifying the MAC object instances.
Frame Status Functions
Displays a group of read-only indicator buttons that indicate the MAC’s
optional Frame Status processing functions. Possible values are; fs-repeating,
fs-setting, or copying.
Available Paths
Displays a group of read-only indicator buttons that indicate the path types
available for the station. Possible values are; primary, secondary, and local.
Current Path
Indicates the path into which this MAC is currently inserted.
Upstream Neighbor
Displays the MAC’s upstream neighbor’s long individual MAC address. It has
an initial value of the SMT- Unknown-MAC Address and is only modified as
specified by the Neighbor Information Frame protocol.
Downstream Neighbor
Displays the MAC’s downstream neighbor’s long individual MAC address. It
has an initial value of the SMT- Unknown-MAC Address and is only modified
as specified by the Neighbor Information Frame protocol.
Old Upstream Neighbor
Displays the previous value of the MAC’s upstream neighbor’s long individual
MAC address. It has an initial value of the SMT-Unknown- MAC Address and
is only modified as specified by the Neighbor Information Frame protocol.
Old Downstream Neighbor
Displays the previous value of the MAC’s downstream neighbor’s long
individual MAC address. It has an initial value of the SMT- Unknown-MAC
Address and is only modified as specified by the Neighbor Information Frame
protocol.
Duplicate Address Test
Displays the Duplicate Address Test flag, Dup_Addr_Test.
Downstream PORT Type
Indicates the PC-Type of the first port that is downstream of this MAC (the
exit port).
Device Views
2-20
SynOptics Series 5000
Management Module Guide
Logical Module Representation
FDDI Modules
SMT Address
Displays the 48-bit individual address of the MAC used for SMT frames.
RMT State
Indicates the current state of the RMT State Machine. The possible values
are; isolated, non_op, ring_op, detect, non_op_dup, ring_op_dup, directed, and
trace.
Duplicate Address Flag
Displays the RMT flag Duplicate Address.
UNA Duplicate Address Flag
Displays a flag which is set when the upstream neighbor reports a duplicate
address condition. It is cleared when the condition clears.
Frame Condition
When set, this field indicates that the MAC Frame Error Condition is present.
It is cleared when the condition clears and on station initialization.
Hardware Present
Indicates the presence of underlying hardware support for this MAC object.
FDDI MAC Parameters View
To access this view, do the following:
1. Highlight the MAC icon on the FDDI NMM logical module
2. Select MAC Parameters from the Icon Subviews menu.
The view displays the following information:
SMT Index
Displays the value of the SMT index associated with this MAC.
MAC Index
Displays the index variable for uniquely identifying the MAC object instance.
SMT Address
Displays the 48-bit individual address of the MAC used for SMT frames.
T_Max Capability
Indicates the maximum time value that this MAC can support.
TVX Capability
Indicates the maximum time value that this MAC can support.
T_Req
This variable is the T_Req_value passed to the MAC. It is reported as a twoscomplement number as described in the MAC standard. Without having
detected a duplicate, the time value of this variable shall assume the
maximum supported time value which is less than or equal to the time value.
When a MAC has an address detected as a duplicate, it may use a time value
9031398 E3
Device Views
2-21
Logical Module Representation
FDDI Modules
for this variable greater than the time value. A station shall cause a claim
when the new T_Req may cause the value of T_Neg to change in the claim
process, (i.e., time value new T_Req < T_Neg, or old T_Req = T_Neg).
T_Neg
This variable is reported as a twos-complement number as described in the
ANSI MAC standard.
T_Max
This variable is passed to the MAC. It is reported as a twos-complement
number as described in the MAC standard. The time value of this variable
shall assume the minimum supported time value which is greater than or
equal to the time value.
Tvx_Value
This variable is passed to the MAC. It is reported as a twos-complement
number as described in the MAC standard. The time value of this variable
shall assume the minimum supported time value which is greater than or
equal to the time value.
Frame Error Threshold
Displays a threshold for determining when a MAC Condition report shall be
generated. Stations not supporting variable thresholds shall have a value of 0
and a range of (0..0).
Frame Error Ratio
Displays the value of the ratio.
MA Unit Data Available
Takes on the value of the MAC_Avail flag defined in RMT.
MA Unit Data Enable
This variable defines a vendor-specified characteristic of this managed object
class. This extension is based on the vendor’s OUI. This variable shall not
duplicate or redefine any variable listed in the MIB.
Not Copied Flag
Indicates that the Not Copied condition is present when read as “true”. This
flag will set to “false” when the condition clears and on station initialization.
Not Copied Threshold
Displays a threshold for determining when a MAC condition report shall be
generated. Stations not supporting variable thresholds shall have a value of 0
and a range of (0..0).
FDDI MAC Detail View
To access this view, do the following:
1. Highlight the MAC icon on the FDDI NMM logical module.
2. Select MAC Detail from the Icon Subviews menu.
Device Views
2-22
SynOptics Series 5000
Management Module Guide
Logical Module Representation
FDDI Modules
The view contains the following information:
SMT Index
Displays the value of the SMT index associated with this MAC.
MAC Index
Provides an index variable for uniquely identifying the MAC object instances.
Token Count
Displays a count that should as closely as possible match the number of times
the station has received a token (total of non- restricted and restricted) on this
MAC. This count is valuable for determination of network load.
Tvx Expired Count
Displays a count that should as closely as possible match the number of times
that TVX has expired.
Late Count
Displays a count that should as closely as possible match the number of TRT
expirations since this MAC was reset or a token was received.
Ring Optional Count
Displays the count of the number of times the ring has entered the
“Ring_Operational” state from the “Ring_Not_Operational” state. This count
is updated when a change in the “Ring_Operational” status occurs. Because of
implementation considerations, this count may be less than the actual
“RingOp_Ct”. It is not a requirement that this count be exact.
Frame Count
Displays a count of the number of frames received by this MAC.
Transmit Count
Displays a count that should as closely as possible match the number of
frames transmitted by this MAC. This count does not include MAC frames.
Error Count
Displays a count of the number of frames that were detected in error by this
MAC that had not been detected in error by another MAC.
Lost Count
Displays a count of the number of instances that this MAC detected a format
error during frame reception such that the frame was stripped.
Frames Copied
Indicates the number of frames addressed to this MAC and which were copied
into its receiving buffers.
Frames Not Copied
Displays a count that should as closely as possible match the number of
frames that were addressed to this MAC but were not copied into its receive
buffers. For example, this might occur due to local buffer congestion. Because
of implementation considerations, this count may not match the actual
number of frames not copied. It is not a requirement that this count be exact.
This count does not include MAC frames.
9031398 E3
Device Views
2-23
Logical Module Representation
FDDI Modules
Frames Not Copied Ratio
This variable is the value of the ratio:
NonRestrictTokens
Displays the number of non-restricted tokens sent by the MAC.
SMT Frames
Displays the number of SMT frames sent and received by the MAC.
LLC Frames
Displays the number of LLC frames sent and received by the MAC.
Beacon Count
Displays the number of beacons received by the MAC.
FDDI MAC Performance View
To access this view, do the following:
1. Highlight the MAC icon on the FDDI NMM logical module.
2. Select MAC Performance from the Icon Subviews menu.
The view displays the following information:
Ring Utilization
Displays the ring utilization calculated using the MAC token count and ring
latency on that path.
Error Ratio
This variable is the value of the ratio.
Frame Rate
Displays a count of the number of frames received by this MAC. The number
of frames is divided by the delta polling time to calculate the Frame Rate.
Error Rate
Displays a count of the number of frames that were detected in error by this
MAC which were not detected in error by another MAC. The number of
frames is divided by the delta polling time to calculate the rate.
Ring Status
Indicates the current state of the RMT State Machine.
FDDI MAC Stations View
To access this view, do the following:
1. Highlight the MAC icon on the FDDI NMM logical module.
2. Select MAC Stations from the Icon Subviews menu.
Device Views
2-24
SynOptics Series 5000
Management Module Guide
Logical Module Representation
FDDI Modules
The view displays the following information:
Ring
Displays whether the node is on the Primary, Secondary, or Local ring.
MAC Address
Displays the MAC address of the node associated with this entry.
Station ID
Displays the station ID of the node associated with this entry.
Node Class
Displays the type of node, either “Station” or “Concentrator”.
MAC Count
Contains the number of MACs in this node.
Non-Master Ports
Contains the number of non master ports (A,B, or S ports) in the node.
Master Ports
Contains the number of master (M ports) in the node.
9031398 E3
Device Views
2-25
Logical Module Representation
FDDI Modules
Device Views
2-26
SynOptics Series 5000
Management Module Guide
Chapter 3
Chassis Management Views
What Is in This Chapter
This chapter provides descriptions of the chassis management views available
to manage the SynOptics Series 5000 hub. These views allow you to access
chassis configuration, component, and model information, for the SynOptics
Series 5000 hub. The following chassis management views are available for
the SynOptics Series 5000 Chassis.
• Chassis Modeling Information view
• Chassis Configuration view
• Chassis Group view
NOTE
Be familiar with the device before using the chassis management views to
configure and manage.
Chassis Modeling Information View
The Chassis Modeling Information view contains information on the
configuration of the NMM Agents and Community Names for the SynOptics
Series 5000 hub model. This view is the only place to update or add community
names for the NMM Agents in the chassis once the chassis model has been
created.
9031398 E3
Chassis Management Views
3-1
Chassis Modeling Information View
To access the Chassis Modeling information view, do the following:
1. Within the Location view, highlight the Device icon.
2. From the Icon Subviews menu, select Chassis Modeling
Information.
NMM Agents
This table displays the NMM agents loaded in the chassis, providing
information on each agent’s module, interface, and network address. This table
also has three buttons, allowing you to sort the table by a statistic type, search
the table for a certain value, or update the information contained in the table.
To sort the table based on the values in a selected column, click a column
heading to select the value type to sort the table by, then click Sort to initiate
the process. To update the information contained in the table, click Update.
Community Names
This area of the Modeling Information view displays a list of the community
names currently entered as valid names associated with the NMM agents in
the chassis. NMM agents with community names other than those contained
in this window are undiscoverable by the chassis. If the community name of an
agent is changed, or a new agent with a new community name is added, enter
the new name in Community Names area, as follows:
1. Enter the community names for the other active NMM Agents in the
chassis into the Community Names window in this view. Be sure to add a
<return> after every entry.
2. Single-click the Reconfigure Chassis Agents button. A pop-up dialog box
appears, indicating the success of the action. Click OK.
3. Exit this view.
NMM Agent Models
Displays a list of the NMM agent models currently entered in the SPECTRUM
database, and associated with this chassis model. This area provides the name,
slot number, and community name for each NMM agent model displayed.
Chassis Management Views
3-2
SynOptics Series 5000
Management Module Guide
Chassis Modeling Information View
Contact Source Information
Displays the number of contact sources (entities in the chassis that have an IP
address and community name through which the chassis can be managed and
gather statistical information), the number of contact sources that have been
lost, and the contact status color of the chassis. The greater the number of
contact sources, the more flexibility in managing the chassis. Table 3-1
provides definitions of the contact status colors.
Reconfigure Chassis Models
Reconfigures the models associated with this chassis. During reconfiguration,
SPECTRUM rediscovers the chassis models and their attributes.
Reconfigure Chassis Agents
Reconfigures the NMM agents associated with this chassis. During
reconfiguration, SPECTRUM rediscovers the NMM agent models using the
provided community names.
Reconfigure Repeater Models
Reconfigures the repeater models associated with this chassis. During
reconfiguration, SPECTRUM rediscovers the repeater models and their
attributes.
9031398 E3
Chassis Management Views
3-3
Chassis Configuration View
Chassis Configuration View
The Chassis Configuration view contains more detailed network configuration
information for the SynOptics Series 5000 chassis. It provides configuration
information on the device model in the VNM database and the device’s
firmware configuration. The values of some fields in this view can be modified.
To access this view, do the following:
1. Highlight the Device icon.
2. Select Chassis Configuration from the Icon Subviews menu.
or:
1. Highlight the Device icon highlight the Syn5CommonApp icon in the
Application view.
2. Select Chassis Configuration from the Icon Subviews menu.
This view provides the following information:
Chassis Version
Displays the current version of the chassis.
Chassis Serial Number
Displays the serial number of the chassis. A value of zero indicates the serial
number is unknown or unavailable.
Chassis Type
Displays a textual description of the chassis type.
Chassis Contact
Displays and allows you to enter or modify the contact information for the
person responsible for the chassis.
Chassis Description
Displays a textual description of the chassis.
Chassis Location
Displays and allows you to enter or modify a textual description of the
physical location of the chassis (e.g., fourth floor wiring closet).
Total Physical Changes
Displays the total number of physical changes (i.e., an addition or removal of a
component or sub-component) that have been detected in the chassis since the
start of the agent.
Last Physical Change
Displays the value of the sysUpTime variable when the last physical change
(i.e., addition or removal of a module) was detected in the chassis.
Total Attachment Changes
Displays the total number of attachment changes across all modules in the
chassis that have been detected since start of the agent.
Chassis Management Views
3-4
SynOptics Series 5000
Management Module Guide
Chassis Configuration View
Last Attachment Change
Displays the value of the sysUpTime variable when the last attachment
change on any module in the chassis was detected.
Total Configuration Changes
Displays the total number of configuration changes (other than attachment
changes or physical additions or removals) across all modules in the chassis
that have been detected since start of the agent.
Last Configuration Change
Displays the value of the sysUpTime variable when the last configuration
change (other than attachment changes or physical additions or removals) on
any module in the chassis was detected.
Agent Interface
Accesses the Agent Interface view, described later in this chapter.
Agent Interface View
This view contains the Agent IF Table, which provides information about each
interface for each agent in the chassis. The number of entries in the table is
determined by the number of agents in the chassis and their configuration.
Access this view by clicking the Agent Interface button in the Chassis
Configuration view.
The Agent IF Table provides the following information:
Component Index
Displays the index identifying the slot of the module containing the agent.
Interface Index
Displays the index of the interface.
IP Address
Displays the IP address of the interface. A value of 0.0.0.0. indicates the IP
address is unknown or unused.
9031398 E3
Chassis Management Views
3-5
Chassis Group View
Chassis Group View
The Chassis Group view displays the Chassis Group Table, which contains
information about each chassis level component and sub-component. Doubleclicking a table entry accesses the Chassis Group Components view for the
selected group type. The Chassis Group Components view is described later in
this section.
To access this view , do the following:
1. Highlight the Device icon.
2. Select Chassis Group from the Icon Subviews menu.
or:
1. Highlighting the Syn5CommonApp icon in the Application view.
2. Select Chassis Group from the Icon Subviews menu.
This table provides the following information:
Index
Displays the index of each group in the chassis, identifying each group type
with a number.
Description
Displays a textual description of each group in the chassis.
Max Comps
Displays the maximum number of components that each group type can
contain within the chassis.
Num Comps
Displays the total number of components belonging to each group type
currently installed in the chassis.
Phys Changes
Displays the total number of physical changes that have taken place to
components within each group type.
Last Change
Displays the value of SysUpTime when the last physical change in each
chassis group was detected. If none have been detected for a chassis group
since cold/warm start of the agent, the value is zero.
Chassis Management Views
3-6
SynOptics Series 5000
Management Module Guide
Chassis Group View
Chassis Group Components view
Chassis Group Components view
The Chassis Group Components view allows observation of information on
each component within the selected chassis group. Double-click a chassis group
table entry to access the Component Store view , which is described later in this
chapter. This view provides the following information:
Group
Displays the type of chassis group to which the components in this view belong.
Index
Displays the index of the component in the group. For example, for modules in
the board group, this index indicates the slot number in the chassis.
Sub Index
Displays the index of the sub-component. If this entry is a component, not a
sub-component, the value is zero.
Description
Displays a textual description of each component in the selected chassis group
type.
Admin State
Displays the desired state of the component. Values can be read-only or readwrite. The values that are read-only include Other (currently in some other
state) or notAvail (actual value is not available). Table 3-1 provides
descriptions of the read-write values.
Table 3-1.
Admin State Values
Value
Description
Disable
Disable operation.
Enable
Enable operation.
Reset
Reset component.
Test
Start self test of component with the result to be normal, warning,
nonFatalErr or fatalErr.
Oper State
Displays the current operational state of the component. Table 3-2 provides
descriptions of the possible values.
9031398 E3
Chassis Management Views
3-7
Chassis Group View
Chassis Group Components view
Table 3-2.
Oper State Values
Values
Descriptions
Other
Some other state.
NotAvail
State not available.
Removed
Component removed.
Disabled
Operation disabled.
Normal
Normal operation.
Testing
Doing a self test.
Warning
Operating at warning level.
NonFatalErr
Operating at error level.
FatalErr
Error stopped operation.
Reset InProg
Reset in progress.
Last Change
Displays the value of SysUpTime when SPECTRUM detected that the
component was last changed. A value of zero indicates that SPECTRUM has
not detected a change since the start of the agent.
Component Store view
This view provides more detailed information on the selected component from
the Chassis Group Components view.
Access this view by double-clicking an entry in the Chassis Group
Components view.
The Component Store view provides the following information:
Description
Displays a textual description of the selected component from the Chassis
Group Components view.
Version
Displays the version identifier of the component.
Serial Number
Displays the serial number of the component.
Last Change
Displays the value of SysUpTime when SPECTRUM detected that the
component was added to the chassis. A value of zero indicates that
Chassis Management Views
3-8
SynOptics Series 5000
Management Module Guide
Chassis Group View
Chassis Group Components view
SPECTRUM has not detected a change since the start of the agent.
Administration State
Allows modification of the desired state of the component. Table 3-1 defines
the possible Administrative State values.
Max Sub-Components
Displays the potential number of sub-components that can be attached to this
component. A value of -1 indicates that no component information is available.
If this entry is itself a sub-component then this field displays a value of zero,
as though there were no sub-components attached.
Operational State
Displays the current operational state of the component. Table 3-2 defines the
possible Operational State values.
Num Sub-Components
Displays the actual number of sub-components currently attached to this
component. A value of -1 indicates that no component information is available.
If this entry is itself a sub-component then this field displays a value of zero,
as though there were no sub-components attached.
Component Store Table
Provides a list of the storage areas available on each component in the chassis.
Only components in the chassis that have manageable storage areas are
displayed in this list. Examples of storage areas include RAM (main memory),
FLASH, ROM, and EEPROM. Disk drives are not considered manageable
storage areas. Table 3-3 describes the information provided in this table.
Table 3-3.
Component Store Table Fields
Field
Description
Storage
The index of the storage area on the component.
Storage Type
The storage area type on the containing component.
Current Size (bytes) The current size of the storage area in bytes. A value of
zero means the storage area is not installed or not usable.
A value of -1 indicates that the size is unknown or
unavailable.
Content Version
9031398 E3
The version of the contents (i.e., the code or data) of the
storage area.
Chassis Management Views
3-9
Chassis Group View
Chassis Group Components view
Chassis Management Views
3-10
SynOptics Series 5000
Management Module Guide
Chapter 4
NMM Management Views
What Is in This Chapter
This chapter provides descriptions of the NMM (Network Management
Module) management views that are available to manage the SynOptics Series
5000 hub. Be familiar with the device before using the NMM management
views to configure and manage. The NMM management views provide
information on the Network Management Module’s configuration, traps,
nodes, and topology.
The NMM Agent Configuration and NMM Trap Receiver views are common to
all Ethernet, Token Ring, and FDDI NMMs. Token Ring and FDDI NMMspecific views are discussed separately.
Accessing the NMM Management Views
There are two methods of accessing the NMM management views.
1. Highlight the NMM module in the Logical or Physical Device view and
select the desired view from the Icon Subviews menu.
2. Highlight the SynOptics Series 5000 device icon and select NMM Agent
View from the Icon Subviews menu. In the NMM Agent view, highlight
the Ethernet, Token Ring, or FDDI NMM Agent icon and select the
appropriate Icon Subviews menu selection.
9031398 E3
NMM Management Views
4-1
NMM Agent Configuration View
NMM Agent Configuration View
The NMM Agent Configuration view displays and provides detailed
information on the configuration of the agent, including the initial boot
information.
To access this view, do the following:
1. Highlight the NMM module in the Device view.
2. Select NMM Agent Configuration from the Icon Subviews menu.
or:
1. Highlight the NMM Agent icon in the NMM Agent view.
2. Select NMM Agent Configuration from the Icon Subviews menu.
This view provides the following information:
RAM Version
Displays the version of the agent. This is an alias for the RAM of the module
containing the agent.
Initial Boot Info Source
Displays the source for initial protocol configuration information at next boot.
For IP, a setting of “net using bootp” means that BOOTP will be used to get
the agent’s IP address(es), load server address, and configuration file name.
For IPX, a setting of “net using bootp” means SAP will be used to get the
agent’s Novell network number(s), and the configuration filename will be
loaded from local storage.
Table 4-1 lists values which are valid entries, and descriptions of each value.
Table 4-1.
Initial Boot Info Source Entries
Value
Description
local
Do not use the network.
net using bootp
Try using the network, and if that fails then use protocol
configuration information from local storage.
other
Not applicable, or some other case.
The load server address is not configurable and is not available in this MIB
object on a Novell network.
Local Storage Version
Displays the version of the agent saved in local storage (such as flash memory)
in the form “major.minor.maintenance.” If not known or not available, then
the value is a zero length string.
NMM Management Views
4-2
SynOptics Series 5000
Management Module Guide
NMM Agent Configuration View
Configuration Load Source
Displays the source from which to load configuration information at the next
boot. Table 4-2 lists values which are valid entries, and descriptions of each
value.
Table 4-2.
Configuration Load Source Values
Value
Description
local only
get from local storage
net only
load from the network
net with local backup
try using network and if it fails then use local information
other
not applicable or some other case
When “local only” is specified, the configuration information is loaded from
local storage. If the local configuration is not valid, then BOOTP is used for
the IP stack.
In IPX only mode, the IP address could be 0.0.0.0; IPX does not rely on the IP
address. The agent checks the IPX address, and if the network number of the
IPX address is equal to 0 the agent uses SAP.
When “net only” is specified, the configuration information will be downloaded
from the network only. The configuration information will never be loaded
from local storage, even if downloading fails and the local configuration
information exists.
When “net with local backup” is specified, a download of the configuration
information will be tried over the network. If the network download fails, then
the configuration information will be loaded from local storage.
Current Gateway
Displays the IP address of the current default gateway (router). If not used,
then this object has the value of 0.0.0.0.
Current Protocol
Displays the transport protocol over which the agent image and configuration
information were last loaded. Table 4-4 lists status values which are valid
entries, and descriptions of each value.
Table 4-3.
Current Protocol Status Values
Value
9031398 E3
Description
ip
gotten from the network using a load protocol over IP
other reserved
unknown or some other protocol
NMM Management Views
4-3
NMM Agent Configuration View
Next Boot Gateway
Displays the IP address of the default gateway (router) for the agent to use
after the next boot. If not used, then this object has the value of 0.0.0.0.
Next Boot Protocol
Displays the transport protocol(s) which the agent is to use to load the
configuration information and the agent image at the next boot of the agent.
Table 4-4 lists values which are valid entries, and descriptions of each value.
Table 4-4.
Next Boot Protocol Values
Value
Description
ipOnly
use load protocol over IP
other
unknown or some other protocol
Last Boot Image Save Status
Indicates what happened to the image file on the last boot. Table 4-5 lists
values which are valid entries, and descriptions of each value.
Table 4-5.
Last Boot Image Save Status Values
Value
Description
notAvail
the save operation is not available
noSave
image not saved since image was not asked to be saved, or
image was not loaded from the network
saved
image saved
saveFailed
tried to save image, but failed
Next Boot Image Load Source
Displays the source from which to load the agent image at next boot. Table 4-6
lists values which are valid entries, and descriptions of each value.
Table 4-6.
Next Boot Image Load Source Values
Value
Description
local only
get from local storage
net only
load from the network
net with local backup
load from the network and if that fails, use local
information
net if newer
try loading the image over the net
other
not applicable or some other case
NMM Management Views
4-4
SynOptics Series 5000
Management Module Guide
NMM Agent Configuration View
Use the Next Boot Image if it can be loaded, and it is newer than the local
image. Otherwise, use local image.
If the local image is not valid, the setting will be “net only” and cannot be
changed to “local only” or “net with local backup” until a valid image file is
loaded. When the local image is not valid and the network download of the
image fails, the entire boot process will be repeated.
When “local only” is specified, the image will be loaded from local storage.
When “net only” is specified, the image will be downloaded from the network
only. The image file will never be loaded from local storage, even if
downloading fails and the local image exists.
When “net with local backup” is specified, a download of the image is tried
over the network. If the network download fails, then the image is loaded from
local storage.
When “net if newer” is specified, a download of the image will be tried over the
network. If successful, it will then be compared to the image stored in local
storage. The most recent version of the two will be used. If the local image is
not valid, the network will always be used. If the network download fails then
the image is loaded from the local storage.
Next Boot Image Save Mode
Indicates what will be done with the image (when loaded from the network) on
the next boot. Table 4-7 lists values which are valid entries, and descriptions
of each value.
Table 4-7.
Next Boot Image Save Mode Values
Value
9031398 E3
Description
not available
the save operation is not available
write if different
save image to local storage at the next boot if the image is
different from saved contents
write if newer
save image to local storage at the next boot if the image is
newer than saved contents
no write
do not save image to local storage at the next boot, even if
the image is newer or different
NMM Management Views
4-5
NMM Trap Receiver View
Write Configuration Settings to NVRAM
Provides a button that allows you to write the current configuration settings
to local non-volatile random access memory (NVRAM). Table 4-8 lists values
which are valid entries, and descriptions of each value.
Table 4-8.
Write Configuration Settings to NVRAM
Value
Description
valid
contents valid
write
write configuration settings to local storage
other
some unknown or other state
Reboot Agent
Provides a button allowing you to reboot the agent. Table 4-9 lists values
which are valid entries, and descriptions of each value.
Table 4-9.
Reboot Agent Values
Value
Description
other
agent in unknown or other state
running
agent running
restart
restart agent (i.e., jump to beginning of agent code)
reboot
start boot sequence for agent (i.e., jump to beginning of boot
firmware
reset
do a hardware reset
NMM Trap Receiver View
The NMM Trap Receiver view provides information and addresses for devices
receiving traps. The maximum and current number of trap receivers are
displayed with the Trap Receiver Table.
To access this view, do the following:
1. Highlight an NMM module in the Device view.
2. Select NMM Trap Receiver from the Icon Subviews menu.
or:
1. Highlight an NMM Agent icon in the NMM Agent view.
This view provides the following information:
NMM Management Views
4-6
SynOptics Series 5000
Management Module Guide
NMM Trap Receiver View
Maximum Entries
Displays the maximum number of rows allowed in the trap receiver table.
Current Entries
Displays the current number of rows in the trap receiver table.
9031398 E3
NMM Management Views
4-7
NMM Trap Receiver View
Trap Receiver Table
Next Available Entry
Displays the number identifying the next available row to be created in the
trap receiver table. A value of zero indicates that the table is full and no more
rows may be added.
Add Receiver
Allows addition of a receiver to the table by accessing the Add Trap Receiver
view. The Add Trap Receiver view has the same fields as the Trap Receiver
Table, but allows addition of information for the new entry. When adding a new
trap receiver, the value displayed in the Next Entry Index field must be
entered into the Use Entry Index field.
Trap Receiver Table
This table lists information about trap receivers. It also lists the addresses of
trap receivers.It is possible to sort, update, and search the table. To activate the
Sort button, click a column heading. Click the Sort button to sort the table
based on the selected column. To activate the Find button, click the Network
Address or Community String column heading. Enter the search string at the
prompt. Double-clicking an entry in this table opens the Trap Receiver Entry
View, which allows modification of values for the selected trap receiver.
This table provides the following information:
Receiver
Displays the number identifying the row in the table.
Receiver Status
Displays the status of the row in the Trap Receiver Table. In the Add Trap
Receiver and Trap Receiver Entry views, this field corresponds to the Status
button, which allows creation or deletion entries for the table. Table 4-10 lists
values which are valid entries, and descriptions of each value.
Table 4-10.
Receiver Status
Value
Description
Valid
Read-only status indicating the row exists and is valid.
Delete
Writeable value that deletes the row ( Trap Receiver Entry
view only).
Create
Writeable value that creates a new row (Add Trap Receiver
view only).
Other
Read-only status indicating the row is unknown, or some
other case exists.
NMM Management Views
4-8
SynOptics Series 5000
Management Module Guide
Token Ring NMM Management Views
Address Type
Displays the type of network address for the agent’s trap receiver (i.e., IP).
Network Address
Displays the network address (in entry order) of the SNMP manager that will
receive the traps. In the Add Trap Receiver and Trap Receiver Entry views,
this field corresponds to the Net Address field. Enter the network address of
the new trap receiver or modify the existing address in the Net Address field.
Community String
Displays the community string to use for the trap receiver. In the Add Trap
Receiver and Trap Receiver Entry views, this field corresponds to the
Community Name field. Enter the assigned community name to be used for the
new trap receiver or modify the existing community name in the Community
Name field.
Age Time
Displays the time interval used to age entries out of the trap receiver table. The
default value, if not specified, is zero. A zero value indicates an infinite timeout,
where entries will never be aged out. Modify this value in the Add Trap
Receiver and Trap Receiver Entry views.
Token Ring NMM Management Views
This section provides descriptions of the Token Ring NMM-specific views. The
following views are described:
•
•
•
•
TR NMM Show Nodes Table
TR NMM Find Nodes Table
Token Ring NMM Topology Table
Token Ring NMM ring Topology Table
TR NMM Show Nodes Table
The TR NMM Show Nodes Table provides a list of all the active MAC
addresses that the NMM currently recognizes on all rings, and also all active
MAC addresses recognized by each DCE on the module. It is possible to sort,
update, and search the table. To activate the Sort button, click a column
heading. Click the Sort button to sort the table based on the selected column.
To activate the Find button, click the Address or Vendor column headings.
Enter the search string at the prompt.
To access this table, do the following:
1. Highlight the NMM module in the Device view.
2. Select NMM Show Nodes from the Icon Subviews menu.
9031398 E3
NMM Management Views
4-9
Token Ring NMM Management Views
TR NMM Find Nodes Table
or:
1. Highlight the NMM Agent icon in the NMM Agent view.
2. Select NMM Show Nodes from the Icon Subviews menu.
This view provides the following information:
Interface
Displays the number identifying the source that detected the active node.
Values greater than zero represent the index of the agent’s interface in the
NMM. A value of zero indicates that the agent detected the node information
through the best available method.
Module
Displays the number identifying the position of this module in the chassis.
Port
Displays the number identifying the position of this port on the module.
Mac Address
Displays the physical (MAC) address for the station.
Vendor
Displays the manufacturer of the device connected to that port. This is
determined from the MAC address.
Status
Displays the operational status of the MAC address for the station. Table 4-11
lists status values which are valid entries, and descriptions of each value.
Table 4-11.
Operational Status of MAC Address
Value
Description
Active (2)
Read-only status indicating the station has sent a frame
within the required time period, or for Token Ring or FDDI,
that the station is in the ring poll.
Inactive (3)
Read-only status indicating the station is idle, having sent
no frames within the required time period.
Other (1)
Read-only status indicating the address is unknown or in
some other state.
TR NMM Find Nodes Table
The TR NMM Find Nodes Table provides a list of all the active MAC
addresses that the NMM currently recognizes on all segments, and also all
active MAC addresses recognized by each DCE on the module. It is possible to
sort, update, and search the table. To activate the Sort button, click a column
heading. Click the Sort button to sort the table based on the selected column.
NMM Management Views
4-10
SynOptics Series 5000
Management Module Guide
Token Ring NMM Management Views
Token Ring NMM Topology Table View
To activate the Find button click the Mac Address or Vendor column heading.
Enter the search string at the prompt.
To access this table, do the following:
1. Highlight the NMM module in the Device view.
2. Select NMM Find Nodes from the Icon Subviews menu.
or:
1. Highlight the NMM Agent icon in the NMM Agent view.
2. Select NMM Find Nodes from the Icon Subviews menu.
The TR NMM Find Nodes Table provides the following information:
Interface
Displays the number identifying the source that detected the active node.
Values greater than zero represent the index of the agent’s interface in the
NMM. A value of zero indicates that the agent detected the node information
through the best available method.
MAC Address
Displays the physical (MAC) address of the station.
Vendor
Displays the manufacturer of the device connected to that port. This is
determined from the MAC address.
Module
Displays the number identifying the position of this module in the chassis.
Port
Displays the number identifying the position of this port on the module.
Token Ring NMM Topology Table View
The Token Ring NMM Topology Table view provides a table of topology
information from each NMM with a token ring interface on the same flat
network as the reporting NMM. The number of entries is determined by the
number of detected and active NMMs. Entries in the table are created by
reception of a topology message from a “new” NMM. An entry is automatically
removed from the table after no messages are received from the NMM in the
required time interval. It is possible to sort, update, and search the table. To
activate the Sort button, click on a column heading. Click the Sort button to
sort the table based on the selected column. To activate the Find button, click
the MAC Address column heading. Enter the search string at the prompt.
To a ccess this table, do the following:
1. Highlight the NMM module in the Device view.
9031398 E3
NMM Management Views
4-11
Token Ring NMM Management Views
Token Ring NMM Ring Topology Table View
2. Select NMM Topology from the Icon Subviews menu.
or:
1. Highlight the NMM Agent icon in the NMM Agent view.
2. Select NMM Topology from the Icon Subviews menu.
The Token Ring NMM Topology Table view provides the following information:
Interface Address
Displays the IP address of the interface on which the topology message was
received.
IP Address
Displays the IP address of an NMM contained in a topology message.
Ring Number
Displays the number identifying the ring on which an NMM from a topology
message is located.
Ring Master
Displays the classification of an NMM from a topology message. Possible
values are: Normal (not a master NMM) and Master (a master NMM).
Ring Speed
Displays the speed of the ring (in units of Mbits) on which an NMM from a
topology message is located. Possible values are: 4 Mbps and 16 Mbps.
Token Ring NMM Ring Topology Table View
The Token Ring NMM Ring Topology Table view provides a listing of all the
NMMs with a token ring interface on the same ring as the reporting NMM.
The number of entries is determined by the number of detected and active
NMMs. Entries in the table are created by reception of a topology message
from a “new” NMM. An entry is automatically removed from the table after no
messages are received from the NMM in the required time interval. It is
possible to sort, update, and search the table. To activate the Sort button,
click a column heading. Click the Sort button to sort the table based on the
selected column. To activate the Find button click the MAC Address column
heading. Enter the search string at the prompt.
To access this table, do the following:
1. Highlight the NMM module in the Device view.
2. Select NMM Ring Topology from the Icon Subviews menu.
or:
1. Highlight the NMM Agent icon in the NMM Agent view.
2. Select NMM Ring Topology from the Icon Subviews menu.
NMM Management Views
4-12
SynOptics Series 5000
Management Module Guide
FDDI NMM Management Views
The Token Ring NMM Ring Topology Table view provides the following
information:
Interface Address
Displays the IP address of the interface on which the topology message was
received.
IP Address
Displays the IP address of the NMM that sent the topology message.
MAC Address
Displays the MAC address of the NMM that sent the topology message.
Chassis Type
Displays the type of chassis containing the NMM that sent the topology
message.
Backplane Type
Displays the type of backplane in the chassis containing the NMM that sent the
topology message.
Slot
Displays the number identifying the slot containing the NMM that sent the
topology message.
UNA
Displays the IP Address of the next upstream NMM of the NMM that sent the
topology message.
FDDI NMM Management Views
This section provides descriptions of the FDDI NMM-specific views. The
following views are described:
•
•
•
•
•
•
•
•
•
•
•
•
9031398 E3
Agent Download view
FDDI Show Nodes Table
FDDI Find Nodes Table
Paths Table
Ring Status view
Worst Error Table
Station Status Report (SRF) Event Counters view
Station Status Report (SRF) Condition view
Ring Topology view
Physical Topology Trunk view
Physical Topology Node view
Optical Bypass Switch Table
NMM Management Views
4-13
FDDI NMM Management Views
Agent Download View
Agent Download View
To access this view, do the following:
1. Highlight the NMM module in the Device view.
2. Select NMM Agent Download from the Icon Subviews menu.
or:
1. Highlight the NMM Agent icon in the NMM Agent view.
2. Select NMM Agent Download from the Icon Subviews menu.
The Agent Download view provides the following information:
Next Boot IP Addr
Displays the IP address of the interface that will be used for the next boot. If
no IP address is used, then the value is 0.0.0.0. The current IP address for the
interface is found in the IP Address Table.
Next Boot Net Mask
Displays the subnet mask for the interface that will be used for the next boot.
If no subnet mask is used, then the value is 0.0.0.0. The current subnet mask
for the interface is found in the IP Address Table.
Load Server Addr
Displays the IP address of the load server for the configuration file and/or the
image file. If the IP address is not used, then the value is 0.0.0.0"
Valid Flag
Indicates if the configuration and/or image file(s) were downloaded from this
interface and if the file names have not been changed. Table 4-12 lists valid
status values and their descriptions.
Table 4-12.
Valid Flag Status Values
Value
Description
valid
Configuration and/or image file(s) downloaded from this
interface are currently in use.
invalid
Configuration and/or image files downloaded from this
interface are not in use (this may also mean that there are
no files downloaded from this interface).
Config File Name
Displays the name of the configuration file currently associated with the
interface. When not used, the value is a zero length string.
Image File Name
Displays the name of the image file(s) currently associated with the interface.
Some agents in special situations may support a value which contains
NMM Management Views
4-14
SynOptics Series 5000
Management Module Guide
FDDI NMM Management Views
FDDI Show Nodes Table
multiple file names instead of a single file name. Multiple names are specified
as a list of file names separated by semicolons (;). When this object is not used,
the value is a zero length string.
Write Configuration Settings to NVRAM
Provides a button that allows you to write the configuration settings to nonvolatile random access memory (NVRAM). This causes the current
configuration settings to be written to local non-volatile storage. Table 4-13
lists status values which are valid entries, and descriptions of each value.
Table 4-13.
FDDI Write Configuration Settings to NVRAM Status Values
Value
Description
valid
contents valid
write
write configuration settings to local storage (such as
NVRAM)
other
some unknown or other state
FDDI Show Nodes Table
This table lists the active nodes connected through the concentrator. It is
possible to sort, update, and search the table.
To access this table, do the following:
1. Highlight the NMM module in the Device view.
2. Selecting NMM Nodes -> Show Nodes from the Icon Subviews menu.
or:
1. Highlight the NMM Agent icon in the NMM Agent view.
2. Selecting NMM Nodes -> Show Nodes from the Icon Subviews menu.
The Show Nodes Table view provides the following information:
Slot
Displays the board number the node is on.
Port
Displays the port number the node is on.
MAC Address
Displays the physical (MAC) address of the node.
Station ID
Displays the unique FDDI station identifier associated with this entry.
9031398 E3
NMM Management Views
4-15
FDDI NMM Management Views
FDDI Find Nodes Table
MAC Count
Displays the number of MACs in this station or concentrator.
Master Ports
Displays the number of master ports (M ports) in the node.
Non-Master Ports
Displays the number of non master ports (A,B, or S ports).
Type
Displays the Station Type of Node, either station (node with no M ports), or
concentrator (node with M ports).
FDDI Find Nodes Table
This table contains a list of all of the active nodes that are currently connected
to the network through this concentrator. It is possible to sort, update, and
search the table. The Show Nodes and Find Nodes tables differ in their
indexing.
To access this table, do the following:
1. Highlight the NMM module in the Device view.
2. Select NMM Nodes -> Find Nodes from the Icon Subviews menu.
or:
1. Highlight the NMM Agent icon in the NMM Agent view.
2. Select NMM Nodes -> Find Nodes from the Icon Subviews menu.
The FDDI Find Nodes Table view provides the following information:
MAC Address
Displays the physical (MAC) address of the node of this entry.
Slot
Displays the slot number of the board with which the node is associated.
Port
Displays the port to which the node is connected.
Paths Table
Access the Paths Table view by highlighting the NMM module in the Device
view or by highlighting the NMM Agent icon in the NMM Agent view and
selecting the NMM Paths from the Icon Subviews menu. It is possible to sort,
NMM Management Views
4-16
SynOptics Series 5000
Management Module Guide
FDDI NMM Management Views
update, and search the table. Double-click an entry to open the Path
Parameters view.
Path
Parameters
Opens the Path Parameters view. The Path Parameters view provides the
following information:
SMT Index
Displays the value of the SMT index associated with this PATH.
Path Index
Displays the index variable for uniquely identifying the primary, secondary
and local PATH object instances. Local PATH object instances are represented
with integer values from 3 to 255."
TVX Lower Bound
Specifies the minimum time used by any MAC that is configured in this path.
TMax Lower Bound
Specifies the minimum time used by any MAC that is configured in this path.
Max Time Required
Specifies the maximum time used by any MAC that is configured in this path.
SBA Available
Displays the maximum Synchronous Bandwidth Allocation available for a
path in bytes per second.
SBA Payload
Displays the payload portion of the Synchronous Bandwidth Allocation for
this path. This value represents the maximum number of bytes of data
allocated for transmission per 125 microseconds.
9031398 E3
NMM Management Views
4-17
FDDI NMM Management Views
SBA Overhead
Displays the overhead portion of the Synchronous Bandwidth Allocation for
this path. This value represents the maximum number of bytes of overhead
(token capture, frame header, etc.) used per negotiated Target Token Rotation
Time (T_Neg).
Ring Latency
Gives the total accumulated latency of the ring associated with this path. May
be measured directly by the station or may be calculated by a management
station.
Trace Status
Indicates the current trace status of the path.
Path Configuration
Opens the Path Configuration view. The Path Configuration view provides
the following information:
SMT Index
Displays the value of the SMT index associated with this configuration entry.
Path Index
Displays the value of the path resource index associated with their
configuration entry.
Token Order
Displays an object associated with the token order for this entry. If the token
passes resources a, b, c, and d, in that order, then the value of this object for
those resources would be 1, 2 ,3 , and 4, respectively.
Resource Type
Displays the type of resource associated with this configuration entry.
Resource Index
Displays the value of the SMT resource index used to refger to this MAC or
port resource.
Current Path
Displays the current insertion status for this resource on this path. Possible
statuses are; isolated, local, secondary, primary, concatenated, or thru.
NMM Management Views
4-18
SynOptics Series 5000
Management Module Guide
FDDI NMM Management Views
Ring Status View
Ring Status View
Access the Ring Status view by highlighting the NMM module in the Device
view or by highlighting the NMM Agent icon in the NMM Agent view and
selecting the NMM Ring Table from the Icon Subviews menu. It is possible to
sort, update, and search the table. The following information is provided:
Ring
Displays a unique number to identify the ring.
Utilization
Displays the ring utilization calculated using the MAC token count and ring
latency on that path.
Wrap State
Indicates if the ring is wrapped.
State Duration
Indicates how long the ring has been in the above condition (wrapped or
unwrapped).
Worst Error Table View
This table provides LAN statistics information for the whole LAN. It provides
information about each station’s worst error rates on MACs and ports. It is
indexed by station. It is possible to sort, update, and search the table. When
the table is first accessed, set the Worst Error Monitor Operational State to
On and then click Update to see any statistics.
To access this view, do the following:
1. Highlight the NMM module in the Device view.
2. Select the NMM Station -> Station Worst Errors from the Icon Subviews
menu.
or:
1. Highlight the NMM Agent icon in the NMM Agent view.
2. Select the NMM Station -> Station Worst Errors from the Icon Subviews
menu.
The Worst Error Table provides the following information:
Station ID
Station ID (in hex) of the station with worst LER errors and Frame Errors.
Port w/LER
The port on this station with the worst rate of LER errors.
9031398 E3
NMM Management Views
4-19
FDDI NMM Management Views
Station Status Report (SRF) Event Counters View
LER Estimate
The worst LER estimate (long term average link error rate) on the above port.
MAC w/ Worst Frame Error Rate
The Mac on this station with the worst rate of frame errors.
MAC Ratio
The worst ratio of frame errors on the above MAC. The formula is:
Delta of Lost Ct + Delta of Error Ctx 216
Delta of Frame Ct + Delta of Lost Ct
This value will be between 0 and 65535.
Station Status Report (SRF) Event Counters View
This view provides LAN statistics information for the whole LAN. It provides
information about each station’s conditions and events on MAC’s and port’s. It
is indexed by station. It is possible to sort, update, and search the table. When
the table is first accessed, set the SRF Monitor Operational State to On and
then click Update to see any statistics.
To access this view, do the following:
1. Highlight the NMM module in the Device view.
2. Select NMM Station -> Station SRF Event Counters from the Icon
Subviews menu.
or:
1. Highlight the NMM Agent icon in the NMM Agent view.
2. Select NMM Station -> Station SRF Event Counters from the Icon
Subviews menu.
The SRF Monitor Table provides the following information:
Station ID
Displays the Station ID of the station with the indicated conditions and
events.
MAC Neighbor Changes
Indicates the number of times this station sees a MAC neighbor change.
MAC Path Changes
Indicates the number of times this station sees a Path change on one of its
MAC’s.
Port Undesired Connects
Indicates the number of times an undesired connection is attempted on this
port.
NMM Management Views
4-20
SynOptics Series 5000
Management Module Guide
FDDI NMM Management Views
Station Status Report (SRF) Condition View
Port Path Changes
Indicates the number of times this port changes path.
Station Status Report (SRF) Condition View
This view provides LAN statistics information for the whole LAN. It provides
information about each station’s conditions and events on MAC’s and port’s. It
is indexed by station. When the table is first accessed, set the SRF Monitor
Operational State to On and then click Update to see any statistics.
To access this view, do the following:
1. Highlight the NMM module in the Device view.
2. Selecting NMM Station -> Station SRF Condition from the Icon
Subviews menu.
or:
1. Highlight the NMM Agent icon in the NMM Agent view.
2. Selecting NMM Station -> Station SRF Condition from the Icon
Subviews menu.
This view provides the following information for a single entry in the SRF
Monitor Table:
Station ID
Displays the Station ID (in hex) of the station with the indicated conditions
and events.
Peer Wrap State
Indicates if an SMT peer wrap condition has occurred.
MAC Dup Address
Indicates if a MAC address condition has been detected.
MAC Frame Err
Indicates if a MAC frame error condition has occurred.
MAC Not Copied
Indicates if a MAC not copied condition has occurred.
Port LER
Indicates if a Port Link Error condition has occurred.
Port EBE
Indicates if a port elastic buffer error condition has occurred.
9031398 E3
NMM Management Views
4-21
FDDI NMM Management Views
Ring Topology view
Ring Topology view
This view is a table of the NMMs in a logical ring presented by the Network
Manager as a flat network of NMM’s. It is possible to sort, update, and search
the table.
To access this view, do the following:
1. Highlight the NMM module in the Device view.
2. Selecting NMM Topology -> Ring Topology from the Icon Subviews
menu.
or:
1. Highlight the NMM Agent icon in the NMM Agent view.
2. Selecting NMM Topology -> Ring Topology from the Icon Subviews
menu.
The NMM Table provides the following information:
Interface IP
Displays the IP address of the interface. This refers to the interface of the
polling NMM.
Network #
Displays the flat network number of which the NMM is a part.
IP Address
Displays the IP address of this NMM entry. This refers to the NMM being
polled.
Chassis Type
Indicates the chassis type that contains the NMM.
MAC Address
Displays the MAC address of this entry.
Backplane Type
Indicates the backplane type into which the NMM is inserted.
Upstream Neighbor
Displays the canonical or MAC address of the last node to receive the token
before this node.
Physical Topology Trunk View
Access the Physical Topology Trunk view by highlighting the NMM module in
the Device view or by highlighting the NMM Agent icon in the NMM Agent
view and selecting NMM Topology -> Physical Topology Trunk from the
Icon Subviews menu. When the view is first accessed, set the Physical Toplogy
NMM Management Views
4-22
SynOptics Series 5000
Management Module Guide
FDDI NMM Management Views
Physical Topology Node View
Operational State to On and then click Update to see any statistics. This
view provides the following information:
Station ID
Displays the station address (in hex) of the node associated with this entry.
IP Address
Displays the IP address of the node associated with this entry.
NMM Slot
Indicates the SynOptics slot number where the local NMM A/B/S port(s)
reside(s).
Station State
Displays the state of the ring. Options are Through, Wrap_A, Wrap_B,
Wrap_AB, or Wrap_S.
Station Type
Displays the Station Type of Node. Options are Station-with-no-M-port,
Concentrator-with-no-child, or Concentrator-with-children.
Station Type Mask
Provides a series of read-only indicator buttons showing what Station Type
Mask is being used. Options are DAS, SAS, DAC, SAC, or Root Node on trunk
ring.
Slot
Displays the SynOptics slot number where the local NMM A/B/S port(s)
reside(s).
Physical Topology Node View
Access the Physical Topology Node view by highlighting the NMM module in
the Device view or by highlighting the NMM Agent icon in the NMM Agent
view ands electing NMM Topology -> Physical Topology Node from the
Icon Subviews menu. It is possible to sort, update, and search the table. When
the view is first accessed, set the Physical Toplogy Operational State to On
and then click Update to see any statistics.
The Physical Topology Node view provides the following information:
Station Address
Displays the station address (in hex) of the node associated with this entry.
IP Address
Displays the IP Address of the node associated with this entry.
Station Type Mask
Provides a series of read-only indicator buttons showing what Station Type
Mask is being used. Options are DAS, SAS, DAC, SAC, or Root Node on trunk
ring.
9031398 E3
NMM Management Views
4-23
FDDI NMM Management Views
Optical Bypass Switch Table
Num Parents
Displays the number of parent stations of this concentrator/station.
Num Children
Contains the number of parent stations of this child concentrator or station (a
maximum of 100 ports for FDDI Phase II).
Optical Bypass Switch Table
Access the Optical Bypass Switch Table by highlighting the NMM module in
the Device view or by highlighting the NMM Agent icon in the NMM Agent
view and selecting the NMM Optical Bypass Switch from the Icon
Subviews menu. It is possible to sort, update, and search the table for specific
information. Double-click an item in any column to open the Optical Bypass
Switch view, which provides the same information, and allows you to modify
the Partition Status and Partition Timer.
The Optical Bypass Switch Table provides the following information:
SMT Index
Displays the value of the SMT index associated with this Attachment.
Optical Bypass Switch Index
Displays a unique value for each optical bypass switch.
Partition Status
Indicates the optical bypass switch partition status. Options are “onpartitioned” or “off-enabled”.
Partition Timer
Displays the Optical Bypass Switch partition timer.
Bypass Present
Indicates if an optical bypass switch is inserted. Options are True or False.
NMM Management Views
4-24
SynOptics Series 5000
Management Module Guide
Chapter 5
DCE Management Views
What Is in This Chapter
This chapter provides descriptions of the DCE management views that are
available to manage the SynOptics Series 5000 hub. Be familiar with your
device before using the DCE management views to configure and manage it.
Ethernet and Token Ring NMMs have Data Collection Engine (DCE) icons
which represent network interfaces. DCEs are used to collect data and network
statistics off of the hub backplanes.
The DCE Configuration and DCE Agent Configuration views are common to all
Ethernet and Token Ring NMMs. Token Ring DCE-specific views are discussed
separately. FDDI NMMs do not support DCE functionality.
Accessing the DCE Management Views
There are two methods of accessing the DCE management views.
1. Highlight the Ethernet or Token Ring DCE icon in the Logical Device view
and select the appropriate Icon Subviews menu selection.
2. Highlight the Ethernet or Token Ring NMM module in the Logical or
Physical Device view device icon and select DCE View from the Icon
Subviews menu. In the DCE view, highlight the DCE icon and select the
appropriate Icon Subviews menu selection.
9031398 E3
DCE Management Views
5-1
DCE Configuration View
DCE Configuration View
The DCE Configuration view provides information on the configuration of the
DCE and allows modification of some values.
To access this view, do the following:
1. Highlight the DCE icon in the Device view.
2. Select DCE Configuration from the Icon Subviews menu.
or:
1. Highlight the DCE icon in the DCE view.
2. Select DCE Configuration from the Icon Subviews menu.
This view provides the following information:
Model Name
Displays the type and identity of the DCE in the following format:
DCE_1.1_5310 (where DCE describes the device, 1.1 indicates the position of
the module in the hub and the number of the DCE on the module, and 5310
indicates the type of module containing the DCE).
Network Address
Displays the IP address of the DCE.
Module
Displays the number specifying the location of the module containing the DCE
in the hub.
DCE
Displays the number uniquely identifying the DCE on the module.
Current Attachment
Provides a button displaying, and allowing you to change, the identifier (i.e.,
SEG-1 indicates Segment 1) indicating which segment the DCE is currently
connected to. By changing this identifier, the DCE is changed to a different
segment, or isolated from all segments.
Last Change
Displays the value of SysUpTime when the last attachment change on the DCE
was detected. If none have been detected since cold/warm start of the agent, the
value is zero.
DCE Management Views
5-2
SynOptics Series 5000
Management Module Guide
DCE Agent Configuration View
DCE Agent Configuration View
The DCE Agent Configuration view provides information on the configuration
of the DCE agent and allows modification of some values.
To access this view, do the following:
1. Highlight the DCE icon in the Device view.
2. Select DCE Agent Configuration from the Icon Subviews menu.
or:
1. Highlight the DCE icon in the DCE view.
2. Select DCE Agent Configuration from the Icon Subviews menu.
This view provides the following fields:
NOTE
Each time one or more of the fields are changed, write the new changes out to
the device by updating the view. Once the changes have been written out to the
device, save these changes to Non-Volatile RAM (NVRAM) by setting the Write
Configuration Settings to NVRAM and updating the view. Any changes made
that are not saved to NVRAM will be lost when the NMM is reset.
Next Boot IP Addr
Displays the IP address of the interface for the next boot. If not used, the value
is 0.0.0.0.
Load Server Addr
Displays the IP address of the load server for the configuration and/or image
file. If not used, the value is 0.0.0.0.
Config File Name
Displays the name of the configuration file currently associated with the
interface. If not used, the value is a zero-length string.
Image File Name
Displays the name of the image file(s) currently associated with the interface.
Some agents in special situations may support a value that contains multiple
file names instead of a single file name. Multiple names are specified as a list
of file names separated by semicolons. If the object is not used, the value is a
zero-length string.
Next Boot Net Mask
Displays the subnet mask of the interface for the next boot. If not used, the
value is 0.0.0.0.
Valid Flag
Indicates whether the configuration and/or image files were downloaded from
this interface and if the file names have not been changed. Table 5-1 list the
9031398 E3
DCE Management Views
5-3
DCE Agent Configuration View
possible values and descriptions of each value.
Table 5-1.
Valid Flag Values
Value
Description
valid
Configuration and/or image files downloaded from
this interface are currently in use.
invalid
Configuration and/or image files downloaded from
this interface are not in use. This may also indicate
that no files have been downloaded from this
interface.
Write Configuration Settings to NVRAM
Writes the current configuration settings to local Non-Volatile RAM. Table 5-2
lists status values which are valid entries, and describes each value.
Table 5-2.
Write Configuration Settings to NVRAM
Value
Description
other
Read-only status indicating some unknown or other state.
valid
Read-only status indicating the contents are valid.
write
Writeable value initiating the process of writing the current
configuration settings to NVRAM.
DCE Management Views
5-4
SynOptics Series 5000
Management Module Guide
Token Ring DCE Management Views
Token Ring DCE Management Views
This section provides descriptions of the Token Ring DCE-specific views. The
following views are described:
• Token Ring DCE Ring Information view
• Token Ring DCE Performance view
• Token Ring DCE Station Table
Token Ring DCE Ring Information View
The Token Ring DCE Ring Information view is divided into several sections
providing statistical and configuration information related to the ring this
DCE is monitoring. These sections include ring, beacon, active monitor, and
station table information.
To access this view, do the following:
1. Highlight the DCE icon in the Device view.
2. Select DCE Ring Information from the Icon Subviews menu.
or:
1. Highlight the DCE icon in the DCE view.
2. Select DCE Ring Information from the Icon Subviews menu.
The Token Ring DCE Ring Information view provides the following
information:
Source Index
Displays the index of the entry in the table. This index identifies the DCE that
is the source of the information. Only those DCEs that provide these statistics
are in this table.
DCE MAC Address
Displays the MAC address of the DCE providing this information. If no
address is available, the value is equal to zero.
Time Monitored
Displays the length of time the ring has been monitored by the current DCE,
in the following format: Days+Hours:Minutes:Seconds.
Ring
This area of the Token Ring DCE Ring Information view provides information
on the ring being monitored by this DCE, including its state, beacons, and
changes.
9031398 E3
DCE Management Views
5-5
Token Ring DCE Management Views
Token Ring DCE Ring Information View
This section provides the following fields:
Ring Number
Displays the number identifying the ring being monitored by this DCE. Each
ring in a multiple ring network is assigned a unique number. Together, a ring
and bridge number form a route designator. The ring number is obtained by
the NMM during the initialization process.
Ring State
Displays the current status of the ring. Table 5-3 provides definitions of the
possible ring states.
Table 5-3.
Ring Status Definitions
Ring Status
Definition
NormalOperation
The ring is operating without any interruptions.
RingPurge
The ring is in its purge state. The active monitor enters
this state whenever a token error is detected.
MonitorContention
The ring is in the monitor contention state. The ring
enters this state whenever the stations on the ring need
to establish an active monitor.
BeaconFrameStreaming
The ring is in the beacon frame streaming state. The ring
enters this state when a station participating in the
monitor contention process, and has its monitor
contention timeout expired, receives multiple claim
tokens and cannot solve the contention within one
second.
BeaconBitStreaming
The ring is in the beacon bit streaming state. The ring
enters this state when a station participating in the
monitor contention process, and has ‘monitor timeout,’
has not received any claim token.
BeaconRingSignalLoss
The ring is in the beacon ring signal loss state. The ring
enters this state when a station participating in the
monitor contention process, and has ‘contention timeout,’
detects a signal loss.
BeaconSetRecoveryMode
The ring is in the beacon set recovery mode. The ring
enters this state when a station, before acting as a
recovery station, sends out a beacon frame with a
recovery mode bit set.
Ring Purges
Displays the total number of times that the ring has entered the ring purge
state from the normal ring state. The ring purge state resulting from the ring
leaving the monitor contention or beacon state is not counted.
NAUN Changes
Displays the total number of NAUN changes that have been measured on the
DCE Management Views
5-6
SynOptics Series 5000
Management Module Guide
Token Ring DCE Management Views
Token Ring DCE Ring Information View
ring. This is determined by the number of Report SUA change MAC frames
that have been detected.
Poll Events
Displays the total number of poll events that have been detected on this ring.
Beacons
Displays the number of beacons generated by stations, and detected by the
DCE, on this ring.
Beacon Time
Displays the value total amount of time the ring has been in the beacon state.
This beacon time is updated every time the ring enters the beacon state. The
value is displayed in the following format: Days+Hours:Minutes:Seconds.
Last Beacon
This area of the Token Ring DCE Ring Information view provides information
on the last beacons detected on this ring, including the sender, time, and type.
This section provides the following fields:
Last Beacon Sender
Displays the MAC address of the sender of the last beacon frame detected on
the ring. If no beacon frames have been detected, then the value is equal to six
octets of zero.
Last Beacon Time
Displays the value of SysUpTime when the last beacon frame was detected on
the ring. If one has not been detected, then the value is zero.
Last Beacon Type
Displays the type of the last beacon frame detected on the ring. Table 5-4
provides the possible beacon types and definitions.
Last Beacon NAUN
Displays the MAC address of the Next Active Upstream Neighbor (NAUN) in
the last beacon frame detected on the ring. If no beacon frames have been
detected, the value is equal to six octets of zero.
Table 5-4.
Beacon Type Definitions
Beacon Type
9031398 E3
Definition
Other
No beacon detected on the ring, or the beacon detected is of
some other type than the known beacons.
Recovery
The last beacon frame detected on the ring had the recovery
bit set. This type of beacon frame is sent out by a station
before acting as a recovery station on the ring.
DCE Management Views
5-7
Token Ring DCE Management Views
Token Ring DCE Ring Information View
Table 5-4.
Beacon Type Definitions (Continued)
Beacon Type
Definition
SignalLoss
The last beacon frame detected on the ring was a signal loss
beacon. This type of beacon frame is sent out by a station
which has ‘contention timeout’ and is participating in the
monitor contention process when it detects a signal loss.
BitStreaming
The last beacon frame detected on the ring was a bit
streaming beacon. This type of beacon frame is sent out by a
station which has ‘monitor timeout’ and is participating in
the monitor contention process but does not receive any
claim token.
ContentionStreaming
The last beacon frame detected on the ring was a contention
streaming beacon. This type of beacon frame is sent out by a
station which has monitor contention timeout expired, is
participating in the monitor contention process, and receives
multiple claim tokens and cannot solve the contention within
one second.
Active Monitor
This area of the Token Ring DCE Ring Information view provides information
on the active monitor for this ring. This section provides the following fields:
Active Monitor
Displays the MAC address of the active monitor on this ring. If this address is
unknown, then the value is equal to six octets of zero.
Monitor Contentions
Displays the number of times the ring has entered the monitor contention
state from the normal ring state, or ring purge state. The monitor contention
state resulting from the ring leaving the beacon state is not counted.
Station Table
This area of the Token Ring DCE Ring Information view provides information
on the station table for this ring, including the maximum number, number of
active stations, and table changes. This section provides the following fields:
Max Stations
Displays the operational size of the station information table. This size is the
maximum number of stations for which information can be collected. A ring is
limited to a maximum number of 256 active stations. The station table can
also contain entries for inactive stations, resulting in a combination of active
and inactive stations. Any combination of inactive and active stations is
allowable, with the exception that the active stations must be fewer than the
DCE Management Views
5-8
SynOptics Series 5000
Management Module Guide
Token Ring DCE Management Views
Token Ring DCE Performance View
maximum of 256, up to the current value of this field. For example, if the
value of this field is 112, the station table could contain entries for 100
inactive stations, and 12 active stations.
Active Stations
Displays the number of active stations in this ring. This reflects the number of
active stations in the station information table.
Station Changes
Displays the number of add and delete events in the station information table
associated with this ring. If no changes have occurred, the value is zero.
Station Deletes
Displays the number of times stations were removed from the station
information table due to either aging out or a table overflow.
Last Deleted
Displays the value of SysUpTime when the last station was removed from the
station information table. If no stations have been removed, the value is zero.
Age Interval
Displays the amount of time used to age stations from the station information
table. If a station has had a status of inactive in the last time interval, it may
be removed from the station information table. A value of zero indicates that
no aging will occur.
Token Ring DCE Performance View
The Token Ring DCE Performance views display a Multi-Attribute Line Graph
that provides a general indication of network activity for the DCE. The
attributes displayed are pre-selected and use colors to represent different
statistics. The attributes are displayed as current values, average values, and
peak values. The peak values display the highest statistical value reached
since SPECTRUM began logging and the current time, or the time at which the
peak value was reached if one exists.
To access this view, do the following:
1. Highlight the DCE icon in the Device view.
2. Selecting DCE Performance from the Icon Subviews menu.
or:
1. Highlight the DCE icon in the DCE view.
2. Selecting DCE Performance from the Icon Subviews menu.
This view also has the following fields:
DCE
Displays the numbers identifying the position of the module and the exact DCE
9031398 E3
DCE Management Views
5-9
Token Ring DCE Management Views
for which this performance information applies. The numbers are displayed in
the following format: Module.DCE (i.e., 6.1 means DCE 1 on module 6).
Module Ring
Displays a number indicating which token ring the DCE is currently connected
to and monitoring.
DCE Ring Statistics
Accesses the Token Ring DCE Ring Statistics view, described later in this
section.
DCE Ring Detail
Accesses the Token Ring DCE Ring Detail view, described later in this section.
Token Ring DCE Ring Statistics View
The Token Ring DCE Ring Statistics view provides three color-coded pie
charts displaying a breakdown of the frames. Table 5-5 through Table 5-7 list
the information provided by these pie charts. Three buttons at the bottom of
each pie chart allow selection of the way in which the data is represented
(Total, Delta, and Accum). Another button, Clear, works in conjunction with
the Accum button. For more information on these buttons, refer to the
SPECTRUM Views.
Access the Token Ring DCE Ring Statistics view by clicking the DCE Ring
Statistics button in the Token Ring DCE Performance view.
This view also has the following fields:
DCE
Displays the numbers identifying the position of the module and the exact DCE
for which this performance information applies. The numbers are displayed in
the following format: Module.DCE (i.e., 6.1 means DCE 1 on module 6).
NAUN
Displays the MAC address of the last known Next Active Upstream Neighbor
(NAUN) for this station.
Table 5-5.
Total Frames Breakdown Pie Chart Definitions
Statistic
Definition
Total Good
The total number of LLC and MAC frames, excluding
frames with errors, detected on the ring by this DCE.
Total Bad
The total number of LLC and MAC frames with errors
detected on the ring by this DCE.
DCE Management Views
5-10
SynOptics Series 5000
Management Module Guide
Token Ring DCE Management Views
Table 5-6.
MAC and LLC Frame Breakdown Pie Chart Definitions
Statistic
Table 5-7.
Definition
MAC
The total number of MAC frames, including frames with
errors detected on the ring by this DCE.
LLC NonUcast
The total number of LLC frames, including frames with
errors detected on the ring that were directed to an LLC
broadcast address (i.e., 0xFFFFFFFFFFFF or
0xC000FFFFFFFF) or a local or global multicast or
functional address (i.e., 0xC000xxxxxxxx)..
LLC Ucast
The total number of LLC frames, including frames with
errors, detected on the ring that were directed to an LLC
unicast address.
Other Frames Breakdown Pie Chart Definitions
Statistic
Definition
Good Error Report
The total number of Soft Error Report frames, excluding
frames with errors, detected on the ring by this DCE.
Beacon
The total number of Beacon frames, including frames with
errors, detected on the ring by this DCE.
Ring Purge
The total number of Ring Purge frames, including frames
with errors, detected on the ring by this DCE.
Claim Token
The total number of Claim Token frames, including frames
with errors, detected on the ring by this DCE.
Token Ring DCE Ring Detail View
The Token Ring DCE Ring Detail view provides two color-coded pie charts
displaying a breakdown of the errors. Three buttons at the bottom of each pie
chart allow selection of the way in which the data is represented (Total, Delta,
and Accum). Another button, Clear, works in conjunction with the Accum
button. For more information on these buttons, refer to the SPECTRUM
Views. Table 5-8 and Table 5-9 list the information provided by these pie
charts.
Access the Token Ring DCE Ring Detail view by clicking the DCE Ring
Detail button in the Token Ring DCE Performance view.
This view also has the following fields:
DCE
Displays the numbers identifying the position of the module and the exact DCE
9031398 E3
DCE Management Views
5-11
Token Ring DCE Management Views
for which this performance information applies. The numbers are displayed in
the following format: Module.DCE (i.e., 6.1 means DCE 1 on module 6).
Soft Error Frames
Displays the total number of Soft Error Report frames detected on the ring.
Every time a soft error occurs (i.e., Line, AC, Lost Frame) the station that
detects the error will transmit a Soft Error Report frame. A high presence of
Soft Error Report frames indicates a large number of errors reported by
stations on the ring.
Table 5-8.
Isolating Errors Breakdown Pie Chart Definitions
Statistic
Table 5-9.
Definition
Line
The total number of corrupted frames detected on this DCE. This
indicates an intermittent cable or hardware error. A line error can be
caused by the following conditions:
• A frame was repeated or duplicated.
• A code violation existed between the starting delimiter (SDEL)
and the ending delimiter (EDEL).
• A code violation existed within a token.
• An FCS error existed.
• Any of the above conditions existed and the Error Detection
Indicator (EDI) was zero.
Burst
The total number of signals detected on this DCE that were not
accepted by a station port on the ring, which indicates a bit encoding
error (the absence of transitions for five half-bit times between the
SDEL and the EDEL).
AC
The total number of AC errors detected on this DCE.
Abort
The total number of abort delimiter transmitters detected on this DCE.
Internal
The total number of internal errors detected on this DCE.
Non-Isolating Errors Breakdown Pie Chart Definitions
Statistic
Definition
Lost Frame
The total number of frames that were transmitted on the ring but did
not return to the transmitting station. The frame was lost somewhere
in the ring, but there is no way to pinpoint where. This can be caused
by stations entering or leaving the ring.
Congestion
The total number of receive congestion errors detected on this DCE.
Frame Copied The total number of frames addressed to a specific station, with the
Frame Status A bits already set to 1, indicating a possible line
disturbance or duplicate address on the ring.
DCE Management Views
5-12
SynOptics Series 5000
Management Module Guide
Token Ring DCE Management Views
Token Ring DCE Station Table
Table 5-9.
Non-Isolating Errors Breakdown Pie Chart Definitions (Continued)
Statistic
Definition
Token
The total number of times the DCE has detected an error on the ring
that required the transmission of a new token. A token error can be
caused by the following conditions:
• A token with non-zero priority and a monitor count bit set to 1.
• A frame and monitor count bit set to 1.
• No token or frame received within 10ms.
• The starting delimiter/token sequence had a code violation.
Frequency
The total number of frequency errors detected on this DCE.
Token Ring DCE Station Table
The Token Ring DCE Station Table view provides information related to the
stations on the ring, as well as access to more detailed views. Double-click a
row in the table to access the Station Detail view which contains two colorcoded pie charts that provide a breakdown of Isolating and Non-Isolating
Errors. The definitions of these errors are described later in this section.
To access this table, do the following:
1. Highlight the DCE icon in the Device view.
2. Select DCE Stations -> Station Table from the Icon Subviews menu.
or:
1. Highlight the DCE icon in the DCE view.
2. Select DCE Stations -> Station Table from the Icon Subviews menu.
The Token Ring DCE Station Table view provides the following buttons which
access additional views:
DCE Station Isolating Errors
Accesses the DCE Station Isolating Errors Table view, described later in this
section.
DCE Station Non-Isolating Errors
Accesses the DCE Station Non-Isolating Errors Table view, described later in
9031398 E3
DCE Management Views
5-13
Token Ring DCE Management Views
this section.
Station Detail
Accesses the Token Ring Station Detail view, described later in this section.
Station Control
Accesses the Token Ring Station Control view, described later in this section.
DCE Station Table
The DCE Station Table provides a listing of all the stations the DCE detects
on the ring. This listing includes information on the status and errors for each
station. Double-click a table item to open the Token Ring Station Detail view,
described later in this section. This table also has several buttons allowing
change of the presentation of information and sorting through the stations.
The DCE Station Table provides the following information:
MAC Address
Displays the MAC Address of the station.
Station Status
Displays the current state of the station. Possible values are Active,
NotInRingPoll, Inactive, or ForcedRemoval.
Duplicate Addr Errors
Displays the number of times the station experienced a duplicate address
error. This error is reported by a station via a Report Monitor Error MAC
frame.
In Beacon Errors
Displays the beacon frames sent by the station and detected on the ring.
Out Beacon Errors
Displays the number of beacon frames detected on the ring that name the
station as the NAUN.
DCE Management Views
5-14
SynOptics Series 5000
Management Module Guide
Token Ring DCE Management Views
Insertions
Displays the number of times that the station was detected inserting into the
ring.
Update
Allows update of the information in the table.
MAC/Canonical
Allows toggling between a MAC and Canonical representation of the station’s
address in the MAC Address field.
Set Filter/Clear Filter
Allows setting of a value to filter a selected column against, or clearing a
previously set filter value.
Sort Up/Sort Down/Unsort
Allows sorting of the table based on the values in a selected column.
DCE Station Isolating Errors Table View
The DCE Station Isolating Errors Table view provides a listing of all the
stations the DCE detects on the ring, and provides a breakdown of the
Isolating Errors for each. This table also has several buttons allowing change
of the presentation of information and sorting through the stations. Doubleclick a row in the table to access the Station Detail view which contains two
color-coded pie charts that provide a breakdown of Isolating and Non-Isolating
Errors.
The DCE Station Isolating Errors Table view provides the following
information:
MAC Address
Displays the MAC Address of the station.
In Line
Displays the total number of line errors reported by the station in error report
frames, and detected on the ring.
Out Line
Displays the total number of line errors reported by the nearest active
downstream neighbor of the station in error report frames, and detected on
the ring.
In Burst
Displays the total number of burst errors reported by the station in error
9031398 E3
DCE Management Views
5-15
Token Ring DCE Management Views
report frames, and detected on the ring.
Out Burst
Displays the total number of burst errors reported by the nearest active
downstream neighbor of the station in error report frames, and detected on
the ring.
In AC
Displays the total number of Address Copied (AC) errors reported by the
station in error report frames, and detected on the ring.
Out AC
Displays the total number of AC errors reported by the nearest active
downstream neighbor of the station in error report frames, and detected on
the ring.
Abort
Displays the total number of abort delimiter transmitted errors reported by
the station in error report frames, and detected on the ring.
Internal
Displays the total number of adapter internal errors reported by the station in
error report frames, and detected on the ring.
Update
Allows update of the information in the table.
MAC/Canonical
Allows toggling between a MAC and Canonical representation of the station’s
address in the MAC Address field.
Set Filter/Clear Filter
Allows setting of a value to filter a selected column against, or clear a
previously set filter value.
Sort Up/Sort Down/Unsort
Allows sorting of the table based on the values in a selected column.
DCE Station Non-Isolating Errors Table View
The DCE Station Non-Isolating Errors Table view provides a listing of all the
stations the DCE detects on the ring, and provides a breakdown of the NonIsolating Errors for each. This table also has several buttons allowing change
of the presentation of information and sort through the stations. Double-click
a row in the table to access the Station Detail view which contains two color-
DCE Management Views
5-16
SynOptics Series 5000
Management Module Guide
Token Ring DCE Management Views
coded pie charts that provide a breakdown of Isolating and Non-Isolating
Errors.
The DCE Station Non-Isolating Errors Table view provides the following
information:
MAC Address
Displays the MAC Address of the station.
Lost Frames
Displays the total number of frames lost errors reported by the station in error
report frames, and detected on the ring.
Congestion
Displays the total number of receive congestion errors reported by the station
in error report frames, and detected on the ring.
Frame Copied
Displays the total number of frame copied errors reported by the station in
error report frames, and detected on the ring.
Token
Displays the total number of token errors reported by the station in error
report frames, and detected on the ring.
Frequency
Displays the total number of frequency errors reported by the station in error
report frames, and detected on the ring.
Update
Allows update of the information in the table.
MAC/Canonical
Allows toggling between a MAC and Canonical representation of the station’s
address in the MAC Address field.
Set Filter/Clear Filter
Allows setting of a value to filter a selected column against, or clear a
previously set filter value.
Sort Up/Sort Down/Unsort
Allows sorting of the table based on the values in a selected column.
9031398 E3
DCE Management Views
5-17
Token Ring DCE Management Views
Token Ring Station Detail View
The Token Ring Station Detail view provides a detailed view of the selected
station from the DCE Station Table. This detailed view includes two colorcoded pie charts breaking down Isolating and Non-Isolating errors on the
station, as well as information on the status for each station. Table 5-10 and
Table 5-11 provide information on the pie charts.
Table 5-10.
Isolating Errors Breakdown Definitions
Statistic
Table 5-11.
Definition
In Line
Displays the total number of line errors reported by the station in
error report frames, and detected on the ring.
Out Line
Displays the total number of line errors reported by the nearest active
downstream neighbor of the station in error report frames, and
detected on the ring.
In Burst
Displays the total number of burst errors reported by the station in
error report frames, and detected on the ring.
Out Burst
Displays the total number of burst errors reported by the nearest
active downstream neighbor of the station in error report frames, and
detected on the ring.
In AC
Displays the total number of Address Copied (AC) errors reported by
the station in error report frames, and detected on the ring.
Out AC
Displays the total number of AC errors reported by the nearest active
downstream neighbor of the station in error report frames, and
detected on the ring.
Abort
Displays the total number of abort delimiter transmitted errors
reported by the station in error report frames, and detected on the
ring.
Internal
Displays the total number of adapter internal errors reported by the
station in error report frames, and detected on the ring.
Non-Isolating Errors Breakdown Definitions
Statistic
Definition
Lost Frames
Displays the total number of frames lost errors reported by the
station in error report frames, and detected on the ring.
Congestion
Displays the total number of receive congestion errors reported by the
station in error report frames, and detected on the ring.
Frame Copied Displays the total number of frame copied errors reported by the
station in error report frames, and detected on the ring.
DCE Management Views
5-18
SynOptics Series 5000
Management Module Guide
Token Ring DCE Management Views
Table 5-11.
Non-Isolating Errors Breakdown Definitions (Continued)
Statistic
Definition
Token
Displays the total number of token errors reported by the station in
error report frames, and detected on the ring.
Frequency
Displays the total number of frequency errors reported by the station
in error report frames, and detected on the ring.
Source Index
Displays the index of the entry in the table. This index identifies the DCE that
is the source of the information. Only those DCEs that provide these statistics
are in this table.
MAC Address
Displays the MAC Address of the station.
Last NAUN
Displays the MAC address of the last known Next Active Upstream Neighbor
(NAUN) for this station.
Station Status
Displays the current state of the station. Possible values are; Active,
NotInRingPoll, Inactive, or ForcedRemoval.
First Entered
Displays the value of SysUpTime at the time the station first entered the ring.
If the time is unknown, the value is zero.
Last Entered
Displays the value of SysUpTime at the time the station last entered the ring.
If the time is unknown, the value is zero.
Last Exited
Displays the value of SysUpTime at the time the station last exited the ring. If
the time is unknown, the value is zero.
Duplicate Addr Errors
Displays the number of times the station experienced a duplicate address
error. This error is reported by a station via a Report Monitor Error MAC
frame.
In Beacon Errors
Displays the beacon frames sent by the station and detected on the ring.
Out Beacon Errors
Displays the number of beacon frames detected on the ring that name the
station as the NAUN.
Insertions
Displays the number of times that the station was detected inserting into the
ring.
9031398 E3
DCE Management Views
5-19
Token Ring DCE Management Views
Token Ring Staton Control View
The Token Ring Station Control view provides detailed information on the
configuration of the selected station from the DCE Station Table. This view
allows you to update the configuration of the station using the fields provided.
The Token Ring Station Control view provides the following information:
Source Index
Displays the index of the entry in the table. This index identifies the DCE that
is the source of the information. Only those DCEs that provide the previously
described statistics are in this view.
MAC Address
Displays the MAC Address of the station.
Physical Location
Displays the physical location of the station on the ring. If unknown, the value
is four octets of zero.
Remove Station
This field provides a button, allowing you to send a Remove Station MAC
frame to the station.
Functional Address
Displays the functional address used by the station. If unknown, the value is
four octets of zero.
Update Station
Provides a button which updates the configuration information for the station.
Functional Classes
Displays the functional classes that are allowed to be active on the station. If
unknown, the value is two octets of zero.
Last Updated
Displays the value of SysUpTime when the station configuration information
was last updated completely. If the information has never been retrieved, the
value is zero. The station configuration information is updated whenever a
station is first detected on the ring.
Group Address
Displays the group address for the station. If unknown, or unassigned, the
value is zero.
Product ID
Displays a brief string describing the product specified by the vendor. If
unavailable, the value is a zero length string.
Maximum Priority
Displays the maximum priority this station is allowed to use. If unknown, the
value is two octets of zero.
DCE Management Views
5-20
SynOptics Series 5000
Management Module Guide
Token Ring DCE Management Views
Node Version
Displays a string representing the version of the station software. If
unavailable, the value is a zero length string.
Station ID
Displays a string used to uniquely identify the station. This value may be
equal to the station’s MAC address. If unknown, the value is six octets of zero.
9031398 E3
DCE Management Views
5-21
Token Ring DCE Management Views
DCE Management Views
5-22
SynOptics Series 5000
Management Module Guide
Chapter 6
Event and Alarm Messages
What Is in This Chapter
This chapter describes the events and alarms generated by the SynOptics
Series 5000 management modules and provides any probable cause messages
corresponding to these events.
Events and alarms originate as generic SNMP traps sent from the physical
device. These traps, or unsolicited messages, translate as SPECTRUM events
and display in the Event Log. For more information, refer to the MIB
documentation for the specific device.
For each event/alarm, the following information is provided:
•
•
•
•
The event code
The event/alarm message
Any probable cause message for the mapped alarm
Any recommended actions
Brackets ({}) indicate variable data inserted in a message.
9031398 E3
Event and Alarm Messages
6-1
SynOptics Series 5000 Hub Chassis Events and Alarms
SynOptics Series 5000 Hub Chassis Events and
Alarms
Table 6-1 provides a list of events and probable cause messages for the
SynOptics Series 5000 hub chassis.
Table 6-1.
SynOptics Series 5000 Hub Chassis Events and Alarms
Message in the Event Log
Alarm Manager Probable Cause
Message
CsEvFormat/Event00010203
CsPCause/Prob00010203
{d "%w- %d %m-, %Y - %T"} - The model
created is not the same type as the
device. Model type = {t}, Name = {m},
User = {u}. (event [{e}])
The model created is not the same type
as the device.
CsEvFormat/Event00010306
{d "%w- %d %m-, %Y - %T"} - A(n) {t}
device, named {m}, has been cold
started.
No Probable Cause Message
CsEvFormat/Event00010307
{d "%w- %d %m-, %Y - %T"} - A(n) {t}
device, named {m}, has been warm
started.
No Probable Cause Message
CsEvFormat/Event00010308
CsPCause/Prob00010308
{d "%w- %d %m-, %Y - %T"} - A(n) {t}
device, named {m}, has detected a
communication Link Down.
Communication link is down.
CsEvFormat/Event00010309
{d "%w- %d %m-, %Y - %T"} - A(n) {t}
device, named {m}, has detected a
communication Link Up.
No Probable Cause Message
CsEvFormat/Event0001030a
CsPCause/Prob0001030a
{d "%w- %d %m-, %Y - %T"} - A(n) {t}
device, named {m}, has detected an
Authentication Failure.
Authorization failure. Other user is
trying to connect to device with an
invalid community string.
CsEvFormat/Event0001030b
CsPCause/Prob0001030b
{d "%w- %d %m-, %Y - %T"} - A(n) {t}
device, named {m}, has detected an EGP
Neighbor Loss. EGP Neighbor IP
address is {0 1}.
Lost contact with EGP neighbor.
Event and Alarm Messages
6-2
SynOptics Series 5000
Management Module Guide
Ethernet NMM Agent Events and Alarms
Ethernet NMM Agent Events and Alarms
Table 6-2 provides a list of events and probable cause messages for the
SynOptics 5000 Ethernet NMM Agent.
Table 6-2.
Ethernet NMM Agent Events and Alarms
Message in the Event Log
Alarm Manager Probable Cause
Message
CsEvFormat/Event00010306
{d “%w- %d %m-, %Y - %T”} - A(n) {t}
device, named {m}, has been cold started.
(event [{e}])
No Probable Cause Message
CsEvFormat/Event00010307
{d “%w- %d %m-, %Y - %T”} A(n) {t} device, No Probable Cause Message
named {m} has been warm started. (event
[{e}])
CsEvFormat/Event00010308
CsPCause/Prob00010308
{d “%w- %d %m-, %Y - %T”} A(n) {t} device, Communication link is down.
named {m}, has detected a communication
Link Down. (event [{e}])
CsEvFormat/Event00010309
{d “%w- %d %m-, %Y - %T”} A(n) {t} device, No Probable Cause Message
named {m}, has detected a communication
Link Up. (event [{e}])
CsEvFormat/Event0001030a
CsPCause/Prob0001030a
{d “%w- %d %m-, %Y - %T”} A(n) {t} device, Authorization failure. Other user is
named {m}, has detected an
trying to connect to device with an
Authentication Failure. (event [{e}])
invalid community string.
CsEvFormat/Event0001030b
CsPCause/Prob0001030b
{d “%w- %d %m-, %Y - %T”} A(n) {t} device, Lost contact with EGP neighbor.
named {m}, has detected an EGP Neighbor
Loss. EGP Neighbor IP address is {O 1}.
(event [{e}])
CsEvFormat/Event00010810
{d “%w- %d %m-, %Y - %T”} - RMON rising No Probable Cause Message
threshold trap received from model {m} of
type {t}. AlarmVariable {O 2},
AlarmSampleType {I 3}, AlarmValue {I 4},
and AlarmRisingThreshold {I 5}.
9031398 E3
Event and Alarm Messages
6-3
Ethernet NMM Agent Events and Alarms
Table 6-2.
Ethernet NMM Agent Events and Alarms (Continued)
Message in the Event Log
Alarm Manager Probable Cause
Message
CsEvFormat/Event00010811
{d “%w- %d %m-, %Y - %T”} - RMON
falling threshold trap received from model No Probable Cause Message
{m} of type {t}. AlarmVariable {O 2},
AlarmSampleType {I 3}, AlarmValue {I 4},
and AlarmFallingThreshold {I 5}.
CsEvFormat/Event01020001
CsPCause/Prob01020001
{d “%w- %d %m-, %Y - %T”} A “hot swap”
has been detected in slot {O 2} (slot is
second digit). Operational state is {T
Syn5OpTable 3}. {t} (name - {m}). (Trap
type: 0x01) - (event [{e}]
DCE CONTACT LOST
PROBABLE CAUSES:
1) One or more DCEs on the NMM have
lost contact.
RECOMMENDED ACTIONS:
1) Check the Device View to ensure the
DCE is on a backplane segment that has
a network feed.
2) Check the network connection to the
backplane segment that the DCE is
monitoring.
CsEvFormat/Event01020002
CsPCause/Prob01020002
{d “ %w- %d %m-, %Y - %T”} The
operational condition of component {O 2} is
{T Syn5OpTable 3}. [component first digit (1) Supervisory Module (2) Backplane (3)
Module (4) Power Supply (5) Tempt Sensor
(6) Fan (7) Clock]. {t} (name - {m}). (Trap
type: 0x02) - (event [{e}])
CHASSIS PROBLEM
PROBABLE CAUSES:
1) The component or sub-component
listed in the description has a problem
condition, either warning, non-fatal, or
fatal.
RECOMMENDED ACTIONS:
1) Check the component or subcomponent listed in the problem
description.
Event and Alarm Messages
6-4
SynOptics Series 5000
Management Module Guide
Ethernet NMM Agent Events and Alarms
Table 6-2.
Ethernet NMM Agent Events and Alarms (Continued)
Message in the Event Log
Alarm Manager Probable Cause
Message
CsEvFormat/Event01020012
CsPCause/Prob01020012
{d “%w- %d %m-, %Y - %T”} A port autopartition condition has been detected on {O
2} (board.port). The port partition status is
{T S5EPortPartS 1}. The port jabber status
is {T S5EPortJabberS 3}. {t} (name - {m}).
(Trap type: 0x01020012) - (event [{e}])
ENET PORT AUTO PARTITION
PROBABLE CAUSES:
1) The port has been isolated by the
NMM from the network due to a faulty
device, excessive collisions, DTE
jabbering, or a wiring problem. This
could include bad connections, topological
loops or protocol issues, such as
broadcast or multicast echo requests.
RECOMMENDED ACTIONS:
1) Check or replace the network device
or the device’s transceiver that is
connected to the autopartitioned port.
2) Check or replace any wiring
problems such as bad connections or
topological loops.
CsEvFormat/Event01020013
CsPCause/Prob01020013
{d “%w- %d %m-, %Y - %T”} Port {O 2}
ENET PORT DTE JABBERING
(board.port) has detected an Ethernet DTE
is jabbering. The jabber status is {T
PROBABLE CAUSES:
S5EPortJabberS 1}. {t} (name - {m}). (Trap 1) An Ethernet port has been flagged as
type: 0x01020013) - (event [{e}])
jabbering. Jabbering occurs when a
station continues to transmit a signal.
RECOMMENDED ACTIONS:
1) Check or replace the network device
or the device’s transceiver.
2) Check or replace any wiring
problems such as bad connections.
9031398 E3
Event and Alarm Messages
6-5
FDDI NMM Agent Events and Alarms
Table 6-2.
Ethernet NMM Agent Events and Alarms (Continued)
Message in the Event Log
CsEvFormat/Event01020014
Alarm Manager Probable Cause
Message
CsPCauseProb01020014
{d “%w- %d %m-, %Y - %T”} Port {O 2}
ENET REDUNDANT PORT FAILURE
(board.port) in a redundant pair has
developed a fault. The port operational
PROBABLE CAUSES:
status is {T S5ERedPtOperS 1}. The port’s 1) An Ethernet port that is in a
companion is {I 3}.{I 5}. The port partition redundant pair has developed a fault.
status is {T S5EPortPartS 7}. The port link
status is {T S5EPortLinkS 9}. The port
jabber status is {T S5EPortJabberS 11}. {t}
(name - {m}). (Trap type: 0x01020014) (event [{e}])
CsEvFormat/Event01020015
CsPCause/Prob01020015
{d “%w- %d %m-, %Y - %T”} The NMM has
detected an invalid remote operational
status on {O 2} (board.port). The port
remote operational status is {T
S5ERedRemOperS 1}. The port
redundancy mode is {T S5ERedPtRedunM
3}. {t} (name - {m}). (Trap type:
0x01020015) - (event [{e}])
ENET REDUNDANT PORT BAD
REMOTE CONFIGURATION
DETECTED
PROBABLE CAUSES:
1) An NMM has detected an invalid
remote operation status on a port set for
redundancy.
FDDI NMM Agent Events and Alarms
Table 6-3 provides a list of events and probable cause messages for the
SynOptics 5000 FDDI NMM Agent.
Table 6-3.
FDDI NMM Agent Events and Alarms
Message in the Event Log
Alarm Manager Probable Cause
Message
CsEvFormat/Event00010306
{d “%w- %d %m-, %Y - %T”} - A(n) {t}
device, named {m}, has been cold started.
(event [{e}])
No Probable Cause Message
CsEvFormat/Event00010307
{d “%w- %d %m-, %Y - %T”} A(n) {t} device, No Probable Cause Message
named {m} has been warm started. (event
[{e}])
Event and Alarm Messages
6-6
SynOptics Series 5000
Management Module Guide
FDDI NMM Agent Events and Alarms
Table 6-3.
FDDI NMM Agent Events and Alarms (Continued)
Message in the Event Log
CsEvFormat/Event00010308
Alarm Manager Probable Cause
Message
CsPCause/Prob00010308
{d “%w- %d %m-, %Y - %T”} A(n) {t} device, Communication link is down.
named {m}, has detected a communication
Link Down. (event [{e}])
CsEvFormat/Event00010309
{d “%w- %d %m-, %Y - %T”} A(n) {t} device, No Probable Cause Message
named {m}, has detected a communication
Link Up. (event [{e}])
CsEvFormat/Event0001030a
CsPCause/Prob0001030a
{d “%w- %d %m-, %Y - %T”} A(n) {t} device, Authorization failure. Other user is
named {m}, has detected an
trying to connect to device with an
Authentication Failure. (event [{e}])
invalid community string.
CsEvFormat/Event0001030b
CsPCause/Prob0001030b
{d “%w- %d %m-, %Y - %T”} A(n) {t} device, Lost contact with EGP neighbor.
named {m}, has detected an EGP Neighbor
Loss. EGP Neighbor IP address is {O 1}.
(event [{e}])
CsEvFormat/Event01020002
CsPCause/Prob01020002
{d “%w- %d %m-, %Y - %T”} The
operational condition of component {O 2} is
{T Syn5OpTable 3}. [component first digit (1) Supervisory Module (2) Backplane (3)
Module (4) Power Supply (5) Temp Sensor
(6) Fan (7) Clock]. {t} (name - {m}). (Trap
type: 0x02) - (event [{e}])
CHASSIS PROBLEM
PROBABLE CAUSES:
1) The component or sub-component
listed in the description has a problem
condition, either warning, non-fatal, or
fatal.
RECOMMENDED ACTIONS:
1) Check the component or subcomponent listed in the problem
description.
CsEvFormat/Event00010810
{d “%w- %d %m-, %Y - %T”} - RMON rising
threshold trap received from model {m} of No Probable Cause Message
type {t}. AlarmVariable {O 2},
AlarmSampleType {I 3}, AlarmValue {I 4},
and AlarmRisingThreshold {I 5}.
9031398 E3
Event and Alarm Messages
6-7
FDDI NMM Agent Events and Alarms
Table 6-3.
FDDI NMM Agent Events and Alarms (Continued)
Message in the Event Log
Alarm Manager Probable Cause
Message
CsEvFormat/Event00010811
{d “%w- %d %m-, %Y - %T”} - RMON
falling threshold trap received from model No Probable Cause Message
{m} of type {t}. AlarmVariable {O 2},
AlarmSampleType {I 3}, AlarmValue {I 4},
and AlarmFallingThreshold {I 5}.
CsEvFormat/Event01020001
CsPCause/Prob01020001
{d “%w- %d %m-, %Y - %T”} A “hot swap”
has been detected in slot {O 2} (slot is
second digit). Operational state is {T
Syn5OpTable 3}. {t} (name - {m}). (Trap
type: 0x01) - (event [{e}])
DCE CONTACT LOST
PROBABLE CAUSES:
1) One or more DCE’s on the NMM
have lost contact.
RECOMMENDED ACTIONS:
1) Check the Device View to ensure the
DCE is on a backplane segment that has
a network feed.
2) Check the network connection to
the backplane segment that the DCE is
monitoring.
CsEvFormat/Event36000100
{d “%w- %d %m-, %Y - %T”} A failure has
been detected in either the primary power
supply, the secondary power supply or
No Probable Cause Message
both. The power supply status is {T
ChasPSStatus 1}. {t} (name - {m}). (Trap
type: 1.3.6.1.4.1.45.3.2.1.6.0,
1.3.6.1.4.1.45.3.2.2.6.0,
1.3.6.1.4.1.45.3.2.3.6.0) - (event [{e}])
CsEvFormat/Event36000101
CsPCause/Prob36000101
{d “%w- %d %m-, %Y - %T”} One or more
fans are either non-operational or have an
unknown operating status. The reported
fan status is {T ChasFanStatus 1}. {t}
(name - {m}). (Trap type:
1.3.6.1.4.1.45.3.2.1.6.1,
1.3.6.1.4.1.45.3.2.2.6.1,
1.3.6.1.4.1.45.3.2.3.6.1) - (event [{e}])
CONCENTRATOR FAN FAILURE
Event and Alarm Messages
6-8
One or more fans are either nonoperational or have an unknown
operating status.
Replace the fan or fan assembly.
SynOptics Series 5000
Management Module Guide
FDDI NMM Agent Events and Alarms
Table 6-3.
FDDI NMM Agent Events and Alarms (Continued)
Message in the Event Log
CsEvFormat/Event3600010b
Alarm Manager Probable Cause
Message
CsPCause/Prob3600010b
{d “%w- %d %m-, %Y - %T”} A board power MODULE POWER SUPPLY FAILURE
supply failure has been detected. The slot
is {I 2}. The power supply status is {T
A module’s power supply has failed.
BdPSStatus 1}. {t} (name - {m}). (Trap type:
1.3.6.1.4.1.45.3.2.1.6.27,
Replace the power supply.
1.3.6.1.4.1.45.3.2.2.6.27,
1.3.6.1.4.1.45.3.12.1.6.27) - (event [{e}])
CsEvFormat/Event36000110
CsPCause/Prob36000110
{d “%w- %d %m-, %Y - %T”} The module in
slot {O 2} has the status LED off. The
module status is {T BoardStatus 1}. {t}
(name - {m}). (Trap type:
1.3.6.1.4.1.45.3.2.1.6.11,
1.3.6.1.4.1.45.3.2.2.6.11,
1.3.6.1.4.1.45.3.12.1.6.11) - (event [{e}])
BOARD LED FAILURE
Verify the module’s operational status.
Power down the concentrator and reseat
the module. If the situation continues,
replace the module.
CsEvFormat/Event36000115
{d “%w- %d %m-, %Y - %T”} FDDI logical
topology change notification. The number
of Primary ring changes is {I 1}, Secondary No Probable Cause Message
ring is {I 2}. The number of logical path
topology changes is {I 3}. {t} (name - {m}).
(Trap type: 1.3.6.1.4.1.45.6.36) - (event
[{e}])
9031398 E3
CsEvFormat/Event36000116
CsPCause/Prob36000116
{d “%w- %d %m-, %Y - %T”} The link error
monitor has observed a link error rate
cutoff or alarm threshold condition on port
{O 2}. The long term average link error
rate is {I 5}. The estimate greater than or
equal alarm condition is {T
T36000116_LCon 1}. Cutoff is {I 3}. Alarm
Threshold is {I 4}. {t} (name - {m}). (Trap
type: 1.3.6.1.4.1.45.6.37) - (event [{e}])
FDDI PORT LINK ERROR CONDITION
PROBABLE CAUSE:
The link error monitor has observed a
port with a link error rate beyond either
the link error rate cutoff or the alarm
threshold.
RECOMMENDED ACTION:
Check the device transceiver and/or the
wiring connections.
Event and Alarm Messages
6-9
FDDI NMM Agent Events and Alarms
Table 6-3.
FDDI NMM Agent Events and Alarms (Continued)
Message in the Event Log
Alarm Manager Probable Cause
Message
CsEvFormat/Event36000117
CsPCause/Prob36000117
{d “%w- %d %m-, %Y - %T”} An
undesirable or illegal connection attempt
was detected on port {O 2}. The connection
was {T T36000117_ACPT 6}. The port PC
type is {T T36000117_PCTy 1}. The port’s
connect state is {T T36000117_PCSt 4}.
The neighbor port PC type is {T
T36000117_PCTy 3}. {t} (name - {m}). (Trap
type: 1.3.6.1.4.1.45.6.38) - (event [{e}])
FDDI PORT UNDESIRABLE
CONNECTION
CsEvFormat/Event36000118
CsPCause/Prob36000118
{d “%w- %d %m-, %Y - %T”} Two or more
stations with the same MAC address have
been detected on the network. The RMT
Duplicate Address Flag is {T
T36000118_DAFl 1}. The SMT address is
{S 3}. The Upstream Neighbor Address is
{S 5} with a Duplicate Address Flag of {T
T36000118_DAFl 4}. {t} (name - {m}). (Trap
type: 1.3.6.1.4.1.45.6.39) - (event [{e}])
FDDI DUPLICATE MAC ADDRESS
Event and Alarm Messages
6-10
PROBABLE CAUSE:
An undesirable or illegal connection
attempt was detected on a port.
RECOMMENDED ACTIONS:
1) Check the type of the neighbor port
reporting the problem. Connections that
are A-to-A or B-to-B can cause a twisted
ring.
2) Check that there are no M-to-M
connections or other violations of local
connection policy.
PROBABLE CAUSE:
Two or more stations with the same MAC
address were detected on the network.
RECOMMENDED ACTION:
MAC addresses must be unique on the
network. Locate the offending stations
and swap the adaptor cards.
SynOptics Series 5000
Management Module Guide
FDDI NMM Agent Events and Alarms
Table 6-3.
FDDI NMM Agent Events and Alarms (Continued)
Message in the Event Log
Alarm Manager Probable Cause
Message
CsEvFormat//Event36000119
CsPCause/Prob36000119
{d “%w- %d %m-, %Y - %T”} The bad FDDI
MAC frames threshold was exceeded for {X
2}. The frame error condition is {T
T36000119_FCon 1}. Frame count is {I 3}.
Error count is {I 4}. Lost count is {I 5}. {t}
(name - {m}). (Trap type:
1.3.6.1.4.1.45.6.40) - (event [{e}])
FDDI MAC FRAME ERROR
PROBABLE CAUSE:
The bad FDDI MAC frames threshold
was exceeded or an errored frame was
detected by this station. There may be a
problem between this station and its
upstream neighbor. The upstream
neighbor may be transmitting errors or
leaving the ring.
RECOMMENDED ACTIONS:
Identify the source of bad frames and
correct the problem.
1) Check link error monitor counts for
stations and ports immediately
upstream.
2) Look at Ring_Op counts, Lost
Frames and Error frame counts of
devices on the network to check for ring
instability or to see if another device is
reporting chronic problems.
CsEvFormat/Event3600011a
CsPCause//Prob3600011a
{d “%w- %d %m-, %Y - %T”} Station {X 2} is
experiencing local buffer congestion. The
Not Copied Condition is {T
T3600011a_CCon 1}. The Not Copied count
is {I 3}. The {O 5} frames successfully
received count is {I 4}. {t} (name - {m}).
(Trap type: 1.3.6.1.4.1.45.6.41) - (event
[{e}])
FDDI MAC NOT COPIED
PROBABLE CAUSE:
A station is experiencing local buffer
congestion.
RECOMMENDED ACTION:
Identify the source of buffer congestion
and correct it.
CsEvFormat/Event3600011b
{d “%w- %d %m-, %Y - %T”} A change was
detected in upstream or downstream
neighbors for station {X 2}. The Upstream No Probable Cause Message
Neighbor is now {S 1}, it was {S 3}. The
Downstream Neighbor is now {S 4}, it was
{S 6}. {t} (name - {m}). (Trap type:
1.3.6.1.4.1.45.6.42) - (event [{e}])
9031398 E3
Event and Alarm Messages
6-11
FDDI NMM Agent Events and Alarms
Table 6-3.
FDDI NMM Agent Events and Alarms (Continued)
Message in the Event Log
Alarm Manager Probable Cause
Message
CsEvFormat/Event3600011c
CsPCause/Prob3600011c
{d “%w- %d %m-, %Y - %T”} Port {O 2} has
exhibited elasticity buffer errors. The
elasticity buffer error count is {I 1}. {t}
(name - {m}). (Trap type:
1.3.6.1.4.1.45.6.43) - (event [{e}])
FDDI PORT ELASTICITY BUFFER
ERROR
PROBABLE CAUSE:
A port has exhibited elasticity buffer
errors. A station may be transmitting
frames that are too long. Or a station
may be using a clock that is out of
tolerance.
RECOMMENDED ACTIONS:
1) Make sure the latest software drivers
are running on the station attached to
the port reporting the problem or
immediately upstream of the problem.
2) Check for faulty hardware.
3) Monitor the port to determine that
the condition does not persist.
4) Check for other signs of ring
instability such as high Ring_Op, Lost
Frame, or Error Frame counts.
CsEvFormat/Event3600011d
CsPCause/Prob3600011d
{d “%w- %d %m-, %Y - %T”} The {T
T3600011d_RING 3} dual ring peer wrap
flag is {T T3600011d_PEER 4} at a station.
Attachment configuration for the station is
{T T3600011d_TCFS 1}. SMT entry
number is {O 2}. {t} (name - {m}). (Trap
type: 1.3.6.1.4.1.45.2.7.0.6.1) - (event [{e}])
FDDI SMT PEER WRAP
PROBABLE CAUSE:
The dual ring is wrapped at a station
(wrapA or wrapB). Note that this is a
legal configuration and may be
intentional.
RECOMMENDED ACTION:
Verify all connections.
CsEvFormat/Event3600011e
{d “%w- %d %m-, %Y - %T”} Two or more
stations with the same MAC address have No Probable Cause Message
been detected on the network. {t} (name {m}). (Trap type: 1.3.6.1.4.1.45.2.7.0.6.2) (event [{e}])
Event and Alarm Messages
6-12
SynOptics Series 5000
Management Module Guide
FDDI NMM Agent Events and Alarms
Table 6-3.
FDDI NMM Agent Events and Alarms (Continued)
Message in the Event Log
Alarm Manager Probable Cause
Message
CsEvFormat/Event3600011f
{d “%w- %d %m-, %Y - %T”} The bad FDDI
MAC frames threshold was exceeded for {0
2}. The frame error condition is {T
No Probable Cause Message
T3600011f_FCon 1}. Frame count is {I 3}.
Error count is {I 4}. Lost count is {I 5}. {t}
(name - {m}). (Trap type:
1.3.6.1.4.1.45.2.7.0.6.3) - (event [{e}])
CsEvFormat/Event36000120
{d “%w- %d %m-, %Y - %T”} A station is
experiencing local buffer congestion. {t}
(name - {m}). (Trap type:
1.3.6.1.4.1.45.2.7.0.6.4) - (event [{e}].
No Probable Cause Message
CsEvFormat/Event36000121
{d “%w- %d %m-, %Y - %T”} The link error
monitor has observed a link error rate
No Probable Cause Message
cutoff or alarm threshold condition. {t}
(name - {m}). (Trap type:
1.3.6.1.4.1.45.2.7.0.6.5) - (event [{e}])
CsEvFormat/Event36000122
{d “%w- %d %m-, %Y - %T”} An
undesirable or illegal connection attempt
was detected on port {O 2}. The port PC
type is {T T36000117_PCTy 1}. The port
No Probable Cause Message
PC neighbor type is {T T36000117_PCTy
3}. The port’s connect state is {T
T36000117_PCSt 4}. {t} (name - {m}). (Trap
type: 1.3.6.1.4.1.45.2.7.0.6.6) - (event [{e}])
CsEvFormat/Event36000123
{d “%w- %d %m-, %Y - %T”} A port has
No Probable Cause Message
exhibited elasticity buffer errors. {t} (name
- {m}). (Trap type: 1.3.6.1.4.1.45.2.7.0.6.7) (event [{e}])
CsEvFormat/Event36000124
{d “%w- %d %m-, %Y - %T”} MAC has been No Probable Cause Message
inserted into the path. {t} (name - {m}).
(Trap type: 1.3.6.1.4.1.45.2.7.0.6.8) - (event
[{e}])
9031398 E3
Event and Alarm Messages
6-13
FDDI NMM Agent Events and Alarms
Table 6-3.
FDDI NMM Agent Events and Alarms (Continued)
Message in the Event Log
Alarm Manager Probable Cause
Message
CsEvFormat/Event36000125
{d “%w- %d %m-, %Y - %T”} Port {O 2} has No Probable Cause Message
moved to the {T T36000125_CurP 1} path.
{t} (name - {m}). (Trap type:
1.3.6.1.4.1.45.2.7.0.6.9) - (event [{e}])
CsEvFormat/Event36000126
{d “%w- %d %m-, %Y - %T”} A {T
T3600011d_RING 1} station has either
been moved, inserted, or removed from the No Probable Cause Message
ring, either by a software or a physical
change. {t} (name - {m}). (Trap type:
1.3.6.1.4.1.45.1.3.4.0.6.1) - (event [{e}])
CsEvFormat/Event36000127
CsPCause/Prob36000127
{d “%w- %d %m-, %Y - %T”} The dual ring FDDI RING WRAP
is wrapped at a concentrator. {t} (name {m}). (Trap type: 1.3.6.1.4.1.45.1.3.4.0.6.2) - PROBABLE CAUSE:
(event [{e}])
The dual ring is wrapped at a
concentrator (wrapA or wrapB). Note
that this is a legal configuration and may
be intentional.
RECOMMENDED ACTION:
Verify all connections.
CsEvFormat/Event36000128
{d “%w- %d %m-, %Y - %T”} A port on this No Probable Cause Message
concentrator was part of a trace. {t} (name
- {m}). (Trap type: 1.3.6.1.4.1.45.1.3.4.0.6.3)
- (event [{e}])
Event and Alarm Messages
6-14
SynOptics Series 5000
Management Module Guide
Token Ring NMM Agent Events and Alarms
Token Ring NMM Agent Events and Alarms
Table 6-4 provides a list of events and probable cause messages for the
SynOptics 5000 Token Ring NMM Agent.
Table 6-4.
Token Ring NMM Agent Events and Alarms
Message in the Event Log
Alarm Manager Probable Cause
Message
CsEvFormat/Event00010306
{d “%w- %d %m-, %Y - %T”} - A(n) {t}
device, named {m}, has been cold
started. (event [{e}])
No Probable Cause Message
CsEvFormat//Event00010307
{d “%w- %d %m-, %Y - %T”} A(n) {t}
device, named {m} has been warm
started. (event [{e}])
No Probable Cause Message
CsEvFormat/Event00010308
CsPCause/Prob00010308
{d “%w- %d %m-, %Y - %T”} A(n) {t}
device, named {m}, has detected a
communication Link Down. (event
[{e}])
Communication link is down.
CsEvFormat/Event00010309
{d “%w- %d %m-, %Y - %T”} A(n) {t}
device, named {m}, has detected a
communication Link Up. (event [{e}])
No Probable Cause Message
CsEvFormat/Event0001030a
CsPCause/Prob0001030a
{d “%w- %d %m-, %Y - %T”} A(n) {t}
device, named {m}, has detected an
Authentication Failure. (event [{e}])
Authorization failure. Other user is trying to
connect to device with an invalid community
string.
CsEvFormat/Event0001030b
CsPCause/Prob0001030b
{d “%w- %d %m-, %Y - %T”} A(n) {t}
Lost contact with EGP neighbor.
device, named {m}, has detected an
EGP Neighbor Loss. EGP Neighbor IP
address is {O 1}. (event [{e}])
9031398 E3
Event and Alarm Messages
6-15
Token Ring NMM Agent Events and Alarms
Table 6-4.
Token Ring NMM Agent Events and Alarms (Continued)
Message in the Event Log
Alarm Manager Probable Cause
Message
CsEvFormat/Event00010810
{d “%w- %d %m-, %Y - %T”} - RMON
rising threshold trap received from
model {m} of type {t}. AlarmVariable
{O 2}, AlarmSampleType {I 3},
AlarmValue {I 4}, and
AlarmRisingThreshold {I 5}.
No Probable Cause Message
CsEvFormat/Event00010811
{d “%w- %d %m-, %Y - %T”} - RMON
falling threshold trap received from
model {m} of type {t}. AlarmVariable
{O 2}, AlarmSampleType {I 3},
AlarmValue {I 4}, and
AlarmFallingThreshold {I 5}.
CsEvFormat/Event01020001
No Probable Cause Message
CsPCause/Prob01020001
{d “%w- %d %m-, %Y - %T”} A “hot
DCE CONTACT LOST
swap” has been detected in slot {O 2}
(slot is second digit). Operational state PROBABLE CAUSES:
is {T Syn5OpTable 3}. {t} (name - {m}). 1) One or more DCE’s on the NMM have
(Trap type: 0x01) - (event [{e}]
lost contact.
RECOMMENDED ACTIONS:
1) Check the Device View to ensure the
DCE is on a backplane segment that has a
network feed.
2) Check the network connection to the
backplane segment that the DCE is
monitoring.
CsEvFormat/Event01020002
CsPCause/Prob01020002
{d “%w- %d %m-, %Y - %T”} The
operational condition of component {O
2} is {T Syn5OpTable 3}. [component
first digit - (1) Supervisory Module (2)
Backplane (3) Module (4) Power
Supply (5) Temp Sensor (6) Fan (7)
Clock]. {t} (name - {m}). (Trap type:
0x02) - (event [{e}])
CHASSIS PROBLEM
Event and Alarm Messages
6-16
PROBABLE CAUSES:
1) The component or sub-component listed
in the description has a problem condition,
either warning, non-fatal, or fatal.
RECOMMENDED ACTIONS:
1) Check the component or sub-component
listed in the problem description.
SynOptics Series 5000
Management Module Guide
Token Ring NMM Agent Events and Alarms
Table 6-4.
Token Ring NMM Agent Events and Alarms (Continued)
Message in the Event Log
Alarm Manager Probable Cause
Message
CsEvFormat/Event01020003
CsPCause/Prob01020003
{d “%w- %d %m-, %Y - %T”} DCE {O 4}
on ring {I 3} (ring ID {I 1}) whose last
NAUN is {X 5} has detected a
beaconing station. The beacon type is
{T S5TRBeaconType 7}. {t} (name {m}). (Trap type: 0x01020003) - (event
[{e}])
TR STATION BEACONING
PROBABLE CAUSES:
1) The beacon type indicates the reason for
the beacon. If reconfiguration, the ring will
recover. If signal loss, the beaconing station
is no longer receiving a valid signal. If
bitstreaming, the beaconing station is no
longer receiving a valid token or frame but is
receiving a valid signal. If contention
streaming, the station is indicating that
monitor contention could not be resolved
within one second.
RECOMMENDED ACTIONS:
1) For signal loss and bit streaming, locate
and inspect the cabling between the
reporting station and its upstream neighbor,
including any stations which may have
recently inserted.
2) If monitor contention, isolate the
problem by removing all concentrators in the
ring until the ring recovers. Then remove
stations one by one on the suspect
concentrator.
CsEvFormat/Event01020004
CsPCause/Prob01020004
{d “%w- %d %m-, %Y - %T”} DCE {O 4} TR SPLITTER DETECTED
has detected a splitter on ring {I 3}
(ring ID {I 1}). {t} (name - {m}). (Trap
PROBABLE CAUSE:
type: 0x08) - (event [{e}])
1) A Splitter has been detected on the ring.
9031398 E3
Event and Alarm Messages
6-17
Token Ring NMM Agent Events and Alarms
Table 6-4.
Token Ring NMM Agent Events and Alarms (Continued)
Message in the Event Log
Alarm Manager Probable Cause
Message
CsEvFormat/Event01020005
CsPCause/Prob01020005
{d “%w- %d %m-, %Y - %T”} DCE {O 4}
has detected a new active monitor
(MAC address - {X 7}) on ring {I 1}. The
last Nearest Upstream Neighbor
Address (NAUN) is {X 5}. {t} (name {m}). (Trap type: 0x08) - (event [{e}])
DUPLICATE CHASSIS MODEL EXISTS
PROBABLE CAUSES:
1) This model was created with a Network
Address that is contained in a SynOptics
5000 chassis that has already been modeled.
RECOMMENDED ACTIONS:
1) Destroy this HubSyn5xxx chassis model.
2) Use the Find View to locate a model with
the same Network Address used to create
this model. Then use Navigate to go up the
modeling hierarchy to the HubSyn5xxx
chassis model.
CsEvFormat/Event01020006
CsPCause/Prob01020006
{d “%w- %d %m-, %Y - %T”} DCE {O 4} NMM MODULE REMOVED FROM THE
(MAC Address - {X 5}) has detected a CHASSIS
bridge deinserting from ring {I 3} (ring
ID {I 1}). {t} (name - {m}). (Trap type:
PROBABLE CAUSES:
0x01020006) - (event [{e}])
1) The NMM that this NMM Agent model
is associated with has been removed from the
chassis.
2) The NMM is rebooting during a
reconfiguration of the chassis model. The
NMM module will not appear in the chassis’
module list when the NMM is rebooting and
the chassis model intelligence considers the
module as pulled.
RECOMMENDED ACTIONS:
1) Check the chassis to see if this was done
intentionally.
2) Open the HubSyn5xxx’s Chassis Group
view and double click the Board Group entry.
Check to see if the module’s entry is in the
table. Open the Chassis Modeling
Information View off the HubSyn5xxx press
the Reconfigure Chassis Models button.
Event and Alarm Messages
6-18
SynOptics Series 5000
Management Module Guide
Token Ring NMM Agent Events and Alarms
Table 6-4.
Token Ring NMM Agent Events and Alarms (Continued)
Message in the Event Log
Alarm Manager Probable Cause
Message
CsEvFormat/Event01020007
{d “%w- %d %m-, %Y - %T”} DCE {O 4}
(MAC Address - {X 5}) has detected a No Probable Cause Message
new source routing bridge on ring {I 3}
(ring ID {I 1}). {t} (name - {m}). (Trap
type: 0x01020007) - (event [{e}])
CsEvFormat/Event01020008
CsPCause/Prob01020008
{d “%w- %d %m-, %Y - %T”} Station {O TR AUTO WRAP
4}on ring {I 3} (ring ID {I 1}) has been
automatically wrapped by the NMM. PROBABLE CAUSES:
Current port state is {T S5TPortStatus 1) The element has been wrapped by the
5}. {t} (name - {m}). (Trap type: 0x08) - NMM.
(event [{e}])
RECOMMENDED ACTIONS:
1) Locate the wrapped station and check its
adaptor configuration.
CsEvFormat/Event01020009
{d “%w- %d %m-, %Y - %T”} Station {O
4}on ring {I 3} (ring ID {I 1}) has been No Probable Cause Message
automatically unwrapped by the
NMM. Current port state is {T
S5TPortStatus 5}. {t} (name - {m}).
(Trap type: 0x08) - (event [{e}])
CsEvFormat/Event01020010
{d “%w- %d %m-, %Y - %T”} DCE {O 4} No Probable Cause Message
has detected MAC address {X 5}
inserting into ring {I 1}. {t} (name {m}). (Trap type: 0x08) - (event [{e}])
CsEvFormat/Event01020011
{d “%w- %d %m-, %Y - %T”} DCE {O 4} No Probable Cause Message
has detected MAC address {X 5}
deinserting from Ring {I 1}. {t} (name {m}). (Trap type: 0x08) - (event [{e}])
9031398 E3
Event and Alarm Messages
6-19
Token Ring NMM Agent Events and Alarms
Event and Alarm Messages
6-20
SynOptics Series 5000
Management Module Guide
SynOptics Model 5000 Ethernet Modules
Appendix A
Ethernet Modules
What Is in This Appendix
This appendix describes the views available from the Ethernet Module icon in
the Logical Device view. The views allow access to network configuration
information as well as traffic flow, error data, and statistics for the Ethernet
modules installed in the SynOptics Series 5000 hub.
Ethernet modules provide flexible connectivity and improved functionality to
the SynOptics Series 5000 hub backplane. Table A-1 shows the supported
Ethernet hardware modules and their configurations.
Table A-1.
Ethernet Modules and Their Configurations
Number of
Ports
Module
Port Types
5304P Ethernet 10 (with per-port 10BASE-F
Host
switching)
Fiber Optic
Local
Channels
Attachments
10 (1 per port)
3
50-Pin Telco D 1
(2 total; 12
ports each); RJ45 (1 total;
switchable from
Telco port 24)
1
5307P Ethernet 24
Host
50-Pin Telco D 24 (1 per port)
(2 total; 12
ports each); RJ45 (1 total;
switchable from
Telco port 24)
3
5308 Ethernet
Host
RJ-45
0
5307 Ethernet
Host
24
24
1
9031398 E3
A-1
Ethernet Module Icon
Table A-1.
Ethernet Modules and Their Configurations (Continued)
Number of
Ports
Module
Port Types
Local
Channels
Attachments
5308A Ethernet 24
Host
RJ-45
1
1
5308-AF
Ethernet Host
RJ-45 (16 total); 1
AUI (1 total);
10BASE-F (1
total)
0
RJ-45
24 (1 per port)
3
1 to 3
0
18
5308P Ethernet 24
Host
5310, 5310A,
and 5310SA
Ethernet
Network Mgt.
0
N/A
5378-F
Ethernet Host
20
4 (1 per cluster) 2
10BASE-F (4
total; 1 per
cluster)
RJ-45 (16 total;
4 per cluster)
5390 Xylogics
Terminal
Server
24
RJ-45
1
0
Ethernet Module Icon
This icon is a logical representation of the physical module, its location in the
chassis, and its front panel interfaces and ports. The Ethernet Module icon
provides graphical information about the module, local channels, and the
individual ports and attachments to the hub’s backplane. The logical modules
are divided into several areas, each presenting information on the module,
ports, attachments, and local channels. Figure A-1 shows an example of an
Ethernet module icon.
NOTE
Ethernet Modules
A-2
Views and information that is exclusive to particular modules will be noted as
such. Example: Redundancy Table (5378-F) (refer to page A-5). Views and
information which do not specify particular modules are available in all
modules discussed in this book.
SynOptics Series 5000
Management Module Guide
Ethernet Module Icon
Module Identification Labels
Figure A-1.
Ethernet Module Icon
Module Identification Labels
6
Module Number Label
Module Type Label
Logical Port Icons
Module Type
7
6
LINK
S1
LINK
5378-F
5308
Close
Ctrl + c
Navigate
Alarms
Performance
Notes...
Utilities
Module Notes
Module Configuration
Cluster X Configuration
Cluster X Performance
Local Channel X Perf.
Attachment 1 Config.
Attachment 1 Perf.
5308P
B-S2
Local Channel Icons
S1
LC-1
Module Identification Labels
The Logical Module Icon consists of two areas providing information
pertaining to the module. These areas have the following functions:
Module Number Label
Displays the number identifying module’s position in the hub, and provides a
menu access zone for the module Icon Subviews menu. Double-click the
module number label to open the Module Notes facility.
Module Type Label
Displays the type of module being modeled and provides a menu access zone
for the module Icon Subviews menu.
9031398 E3
Ethernet Modules
A-3
Ethernet Module Icon
Ethernet Module Icon Subviews Menu Selections
Ethernet Module Icon Subviews Menu Selections
Table A-2 provides definitions of the Icon Subviews menu selections, described
in this chapter. See Chapter 1, Introduction for information on Accessing
SPECTRUM Views from the Device Icon.
Table A-2.
Ethernet Module Icon Subviews Menu Selections
Menu Selection
Definition
Module Notes
Opens the SPECTRUM Notes facility for the module,
described in the SPECTRUM Views .
Module Configuration
Opens the Configuration View for the selected module.
Attachment 1
Configuration (5308)
Opens the SynOptics 5000 Ethernet Attachment
Configuration View.
Attachment 1
Performance (5308)
Opens the SynOptics 5000 Ethernet Attachment
Performance View.
Redundancy Table
(5378-F)
Opens the SynOptics 5000 Ethernet Module Redundancy
Table which contains the Redundant Port Table.
Cluster X Configuration Opens the Configuration View for the selected (X) cluster.
(5378-F)
Cluster X Performance
(5378-F)
Opens the Performance View for the selected (X) cluster.
Local Channel X
Performance (5308P,
5378-F, 5308A, 5304P,
5307)
Opens the Performance View for the selected (X) local
channel.
Module Configuration View
The Module Configuration View provides an attachment table as well as
information on the configuration of the module, and allows modification of
some values. To access this view do the following:
1. Within the Logical Device view, highlight the Ethernet Module icon.
2. From the Icon Subviews menu, select Module Configuration.
This view provides the following information:
Module
Displays the number specifying the location of the module in the hub.
Manufacture Date
Displays the date of manufacture of the module, in ASCII, following the
format: yyyymmdd. For example, the value for April 13, 1993 is 19930413. If
the date is not available, a zero length string is used.
Ethernet Modules
A-4
SynOptics Series 5000
Management Module Guide
Ethernet Module Icon
Ethernet Module Icon Subviews Menu Selections
Attachments
Displays the total number of backplane network attachment points on the
module.
Attachment Changes
Displays the total number of attachment changes for the module that have
been detected since cold/warm start of the agent or since the module was
inserted.
Last Attachment Change
Displays the value of SysUpTime when the last attachment change on the
module was detected. If none have been detected since cold/warm start of the
agent, the value is zero.
Configuration Source
Displays the source of the configuration at the last module reset. Table A-3
lists and describes the possible configuration source values.
Table A-3.
Configuration Source Values
Value
Description
Other (1)
Unknown or some other value
DfltJmpr (2)
Default jumpers
PrmMem (3)
Permanent memory on the module
BrdCfg (4)
Saved configuration on the module
Sm (5)
Supervisor Module
SmDfltJmpr (6)
SM and default jumpers
SmPrmMem (7)
SM and permanent memory on the module
Configuration Changes
Displays the total number of configuration changes for the module that have
been detected since the cold/warm start of the agent or since the module was
inserted.
Set Current Attachment for All Attachments
Provides a button displaying, and allowing you to change, the current setting
for all of the the attachment points. The position of the module within the hub,
the setting of the backplane divider switch(es), and the mode setting all affect
which backplane networks are valid. Also, some modules may put limitations
on which backplane network(s) or local channel(s) may be used. Possible
readings are ISOL, SEG-#, and LOC-#.
9031398 E3
Ethernet Modules
A-5
Ethernet Module Icon
Ethernet Module Icon Subviews Menu Selections
Module Attachment Table
The Module Attachment Table, at the bottom of the Module Configuration
View provides information on each of the attachments on the module. Doubleclick any entry in this table to access the Attachment Configuration View,
described later in this chapter. A Print button allows output of a copy of this
table to a printer or a file. This table provides the following information:
Attachment
Displays the number identifying the network attachment point on the module.
Current
Displays the current channel or segment for this attachment (e.g., Seg_1).
Default
Displays the default channel or segment for this attachment (e.g., Seg_1).
Changes
Displays the number of changes for the attachment that have been detected
since cold/warm start of the agent or since the module was inserted.
Last Change
Displays the value of SysUpTime when the last change on the attachment was
detected. If none have been detected since cold/warm start of the agent, the
value is zero.
Attachment or Cluster Configuration View
An Attachment or Cluster Configuration View is provided for each of the
attachments or clusters on the module. These views provide information on
the configuration of each specific attachment or cluster, and allow
modification of some values.
1. Within the Logical Device view, highlight the Ethernet Module icon.
2. From the Icon Subviews menu, select Attachment X Configuration or
Cluster Configuration .
This view provides the following information:
Module
Displays the number specifying the location in the hub of the module the
attachment is on.
Attachment (5308P)
Displays the number specifying the location of the attachment on the module.
Cluster (5378-F)
Displays a letter uniquely identifying the selected cluster on the module.
Ethernet Modules
A-6
SynOptics Series 5000
Management Module Guide
Ethernet Module Icon
Current Attachment
Provides a button displaying, and allowing you to change, the current setting
for the attachment point. The position of the module within the hub, the
setting of the backplane divider switch(es), and the mode setting all affect
which backplane networks are valid. Also, some modules may put limitations
on which backplane network(s) or local channel(s) may be used.
Last Change
Displays the value of SysUpTime when the last attachment change for the
attachment point was detected. If none have been detected since cold/warm
start of the agent, the value is zero.
Local Channel, and Cluster Performance Views
This view is provided for each of the local channels on the module. The
performance views display a Multi-Attribute Line Graph that provides a
general indication of network activity for the local channel. The attributes
displayed are pre-selected and use colors to represent different statistics. The
attributes are displayed as current values, average values, and peak values.
The peak values display the highest statistical value reached since
SPECTRUM began logging and the current time, or the time at which the
peak value was reached if one exists. These views also have the following field:
1. Within the Logical Device view, highlight the Ethernet Module icon.
2. From the Icon Subviews menu, select Local Channel X Performance,
or Cluster Performance.
This view provides the following information:
Local Channel (5308, 5308P, 5390) or Cluster (5378-F)
Displays the numbers identifying the position of the module and the exact
local channel or cluster for which this performance information applies. The
numbers are displayed in the following format: Module.Local_Channel (i.e.,
6.1 means local channel 1 or cluster 1 on module 6).
Lin/Log
Toggles the right axis of the graph between linear and logarithmic
representation.
Scroll to Date-Time
Allows setting of the viewing area of the graph to begin at a specified date and
time.
Change Time Scale
Allows specification of the Y axis time scale for the graph.
9031398 E3
Ethernet Modules
A-7
Ethernet Module Icon
Detail
Accesses the Local Channel Detail View, described later in this section.
Data Logging
Allows the option of logging polled data in the database.
Local Channel Detail View
The Local Channel Detail View provides two color-coded pie charts displaying
a breakdown of the frames and errors. Access the Local Channel Detail View
by clicking the Detail button in the Local Channel Performance View.
Table A-4 and Table A-5 list the information provided by these pie charts. This
view also contains the Local Channel field.
Table A-4.
Frame Breakdown Pie Chart Definitions
Statistic
Table A-5.
Definition
Good Frames
The total number of good frames detected on this local channel.
Collisions
The total number of collisions detected on this local channel.
Total (5378-F)
Total frames in cluster.
Error Breakdown Pie Chart Definitions
Statistic
Ethernet Modules
A-8
Definition
Alignment
The total number of misaligned packets detected on this local
channel.
FCS Errors
The total number of frames received that are an integral number
of octets in length but do not pass the Frame Check Sequence.
Runts
The total number of runt packets received by this local channel. A
runt packet is one byte less than the standard Ethernet frame of
64 bytes, not including preamble.
Giants
The total number of giant packets received by this local channel. A
giant packet exceeds 1518 bytes, not including preamble.
OOW Collisions
The total number of Out Of Window collisions detected on this
local channel.
Total (5378-F)
Total errors
SynOptics Series 5000
Management Module Guide
Ethernet Module Icon
Additional Statistics
Accesses two more color-coded pie charts displaying additional statistics,
including a breakdown of frames. Three buttons at the bottom of each graph
allow selection of the way in which data is represented (Total, Delta, and
Accum). Another button, Clear, works in conjunction with the Accum button.
For more information on these buttons, refer to the SPECTRUM Views.
Table A-6 and Table A-7 list the information provided by these pie charts. This
view also has the Local Channel field, as described above.
Table A-6.
Additional Frame Breakdown Pie Chart Definitions
Statistic
Table A-7.
Bcast Frames
The total number of broadcast frames detected on this local
channel.
Mcast Frames
The total number of multicast frames detected on this local channel.
Total (5378-F)
Total frames in this cluster.
Additional Statistics Pie Chart Definitions
Statistic
9031398 E3
Definition
Definition
Fragments
The total number of fragmented frames detected on this local
channel.
Long Events
The number of times that MAU jabber lockup protection (MJLP)
was detected due to transmission of data that exceeded 5 msec in
duration (Octet count greater than MaxFrame size). This
information can be useful in identifying faulty stations.
Short Events
The number of fragments detected with ActivityDuration less
than ShortEventMaxTime. ShortEventMaxTime is greater than
74 bit times and less than 82 bit times.
Rate Mismatches
The number of occurrences of out of spec rate bits. This indicates
the number of times the FIFO buffer over-runs or under-runs due
to transmission rate errors.
Backoff Fails
The number of times a frame was received on this port with
collision and port activity time of a value greater than 552 to 560
bit time.
Auto Partitions
The number of times that this local channel was auto-partitioned
by the hardware. This condition occurs when 32 consecutive
collisions are detected on the port.
Short IPGs
The number of occurrences of too short IPGs (Inter-Packet Gaps
before good packets) detected.
Ethernet Modules
A-9
Ethernet Module Icon
Logical Port Icons
Table A-7.
Additional Statistics Pie Chart Definitions (Continued)
Statistic
Definition
Null Frames
The total number of empty frames detected on this local channel.
Total (5378-F)
Total additional statistics.
Logical Port Icons
These icons provide access to the views described below. The ports contain two
labels, which are also described below.
Figure A-2 shows an example of a Logical Port Label.
Figure A-2.
Logical Port Icon
Port Identifier
5378-F, 5308
7
LINK
Close Ctrl + c
Navigate
Alarms
Performance
Notes...
Utilities
Port Notes
PortConfig.
PortPerf.
Enable/Disable
Port
Port Link Status
5390
Logical Port Identification Labels
These labels provide the following information:
Port Identifier
Displays the number uniquely identifying this port on the module. Doubleclick this label to open the Port Notes facility.
Ethernet Modules
A-10
SynOptics Series 5000
Management Module Guide
Ethernet Module Icon
Logical Port Icons
Port Link Status
Displays the status of the port. Double-click this label to open the Port
Configuration View. Table A-8 lists and describes possible Ethernet port
status values and their corresponding colors. Table A-9 lists and describes
possible status values of redundant ports operating in redundant pairs and
lists the corresponding color for each status.
Table A-8.
Ethernet Port Status
Status
Table A-9.
Color
INIT
Blue
Initializing
AUI
Yellow
AUI Port
LINK
Green
Enabled, Link
NLNK
Yellow
Enabled, No Link
PART
Blue
Partitioned, No Link
PART
Red
Partitioned, Link
APAR
Blue
Auto Partitioned, No Link
APAR
Red
Auto Partitioned, Link
TPAR
Blue
Timed Partition, No Link
TRAP
Red
Timed Partition, Link
Redundant Ports Operating in Redundant Pairs
Status
9031398 E3
Description
Color
Description
LFLT
Red
Local Fault
RACT
Green
Redundant Active
RSTB
Orange
Redundant Standby
RFLT
Red
Remote Fault
Ethernet Modules
A-11
Ethernet Module Icon
Logical Port Icons
Logical Port Icon Subviews Menu Selections
Table A-10 provides definitions of the Icon Subviews menu selections,
described in this chapter. See Chapter 1, Introduction for information on
Accessing SPECTRUM Views from the Device Icon.
Table A-10.
Logical Port Label Icon Subviews Menu Selections
Menu Selection
Description
Port Notes
Opens the Port Notes Facility.
Port Configuration
Opens the Configuration View for the selected port.
Port Performance
Opens the Performance View for the selected port.
Enable/Disable Port
Opens the Enable/Disable Port View.
Port Configuration View
The Port Configuration view provides information on the configuration of the
selected port and allows modification of some values.
1. Within the Logical Device view, highlight the Ethernet Module icon.
2. From the Icon Subviews menu, select Port Configuration.
This view provides the following information:
Module
Displays the number specifying the location in the hub of the module the port
is on.
Port
Displays the number uniquely identifying the selected port on the module.
Part Status
Provides a button displaying, and allowing you to change, the partition status
of the selected port. Table A-11 lists and describes the possible partition status
values.
Table A-11.
Partition Status Values
Status
Ethernet Modules
A-12
Description
Other
Partition status is unknown (Read Only)
Enabled
Port is enabled (Read-Write)
Partition
Port is partitioned (Read-Write)
AutoPartition
Port is auto-partitioned by the hardware (Read Only)
TimedPartition
Port is configured for timed partitioning (Read-Write)
SynOptics Series 5000
Management Module Guide
Ethernet Module Icon
Logical Port Icons
Part Time (secs)
Displays the length of time to keep the port partitioned when a timed
partition is done to the port. This value can only be written in the same
request that sets the status of the port to TimedPartition. Afterwards, it
indicates the amount of time left before the timed partition is completed, at
which time the port status is changed to Enabled. This value is zero if the port
is not timed partitioned or the amount of time is not available.
Link Status
Displays whether the port is receiving link status. Table A-12 lists and
describes the possible link status values.
Table A-12.
Link Status Values
Value
Description
Other
Returned for AUI
Off
Link is not connected
On
Link is connected
On/Off apply to 10BASE-T and Fiber ports only.
Jabber Status
Displays the jabber status of the DTE(s) connected to the port. Table A-13 lists
and describes the possible jabber status values.
Table A-13.
Jabber Status
Value
Description
Other
Unknown or other condition
Jabbering
Port is receiving jabber.
Ok
Port is not detecting any jabber.
Port Performance View
The Port Performance view is similar to the Local Channel Performance view,
but contains statistics that apply only to the selected port. The Port
Performance view also has the following field and button:
Port
Displays the numbers identifying the position of the module and the exact
port for which this performance information applies. The numbers are
9031398 E3
Ethernet Modules
A-13
Ethernet Module Icon
displayed in the following format: Module.Port (i.e., 6.1 means port 1 on
module 6).
Detail
This button accesses the Port Detail View, described later in this section.
Port Detail View
The Port Detail View provides two color-coded pie charts displaying a
breakdown of the frames and errors. Access the Port Detail View by clicking
the Detail button in the Port Performance View. Table A-4 andTable A-5 list
the information provided by these pie charts. This view also contains the Port
field.
Additional Statistics
Accesses two more color-coded pie charts displaying additional statistics,
including a breakdown of frames. Three buttons at the bottom of each graph
allow selection of the way in which data is represented (Total, Delta, and
Accum). Another button, Clear, works in conjunction with the Accum button.
For more information on these buttons, refer to the SPECTRUM Views.
Table A-6 and Table A-7 list the information provided by these pie charts. This
view also has the Port field, as described above.
Enable/Disable Port (5378-F, 5308)
Use to enable or disable a particular port. The port state is displayed along
with the following information:
Module
Displays the number specifying the location of the hub of the module
containing the port.
Port
Ethernet Modules
A-14
SynOptics Series 5000
Management Module Guide
Ethernet Module Icon
Displays the number uniquely identifying the selected port on the module.
Enable
Allows you to enable a specified port.
Disable
Allows you to disable a specified port.
Apply
Applies the current settings.
Local Channel Icon (5308P, 5378-F, 5304P)
These labels provide information as described below.
Figure A-3 shows an example of a Logical Port Label.
Figure A-3.
Local Channel Icon
Local Channel Identifier
B-S2
5308
5378-F
9031398 E3
Close
Ctrl + c
Navigate
Alarms
Performance
Notes...
Utilities
Attachment1Config.
Attachment1Perf.
Cluster X Config.
Cluster X Perf.
Local Channel X Perf
5378-F, 5308P
Ethernet Modules
A-15
Ethernet Module Icon
Local Channel Icon (5308P, 5378-F, 5304P)
Local Channel Identifier
Displays the number uniquely identifying the local channel on the module and
provides a menu access zone for the local channel Icon Subviews menu.
Double-click the identifier to open the Local Channel Performance View.
Logical Port Icon Subviews Menu Selections
Table A-14 provides definitions of the Icon Subviews menu selections,
described in this chapter. See Chapter 1, Introduction for information on
Accessing Device-Specific Subviews.
Table A-14.
Logical Local Channel Icon Subviews Menu Selections
Menu Selection
Description
Attachment 1
Opens the SynOptics 5000 Ethernet Attachment Configuration
Configuration (5308) View.
Attachment 1
Performance (5308)
Opens the SynOptics 5000 Ethernet Attachment Performance
View.
Cluster X
Opens the Configuration View for the selected (X) cluster.
Configuration (5378F)
Cluster X
Performance (5378F)
Opens the Performance View for the selected (X) cluster.
Local Channel X
Opens the Performance View for the selected (X) local channel.
Performance (5308P,
5378-F, 5304P)
Ethernet Modules
A-16
SynOptics Series 5000
Management Module Guide
Appendix B
Token Ring Modules
What Is in This Appendix
This appendix describes the generic views available from the Device view for
the SynOptics Series 5000 Token Ring modules. These views allow access to
network configuration information as well as traffic flow, error data, and
statistics for the token ring modules installed in the SynOptics Series 5000
hub. This appendix focuses on the logical representations of the token ring
modules.
This appendix describes the following:
•
•
•
•
Token Ring modules and their configurations
Logical module representations
Logical port representations
Configuration views
Token Ring Modules
SynOptics 5000 provides six Token Ring modules: 5510, the intelligent module
discussed earlier in the document, 5502, 5505, 5505P, 5575-F, and 5575-C. The
Token Ring modules provide connectivity to the SynOptics 5000 hub
backplane. Table B-1 shows the configurations for the available Token Ring
modules.
9031398 E3
B-1
Token Ring Modules
Table B-1.
Token Ring Modules and Their Configurations
Module
Ports
Port Type
Clusters
5510
Attachment
Module
Rings
Local
Rings
1-2
5502
24
RJ-45 Passive
1
5
5505
24
RJ-45 Active
1
5
1
5505P
20
RJ-45 Active
20
5
1
5575-F
11
RJ-45 (7 Stn)/
Fiber (4 RI/RO)
3
3
5
1
5575-C
11
RJ-45 (7Stn)/
DB-9(4 RI/RO)
3
3
5
1
Token Ring Modules
B-2
SynOptics Series 5000
Management Module Guide
Token Ring Modules
Figure B-1.
Logical Representation of a Token Ring Module
Module Number/
Module Notes
Module Type
Port Icons
Port Identifier/Port Notes
Attachment Segment
Identifier/Attachment
Configuration View
Port Link Status/Port
Configuration View
14
5505P
SEG
Pkts
1470
ENB
LR1Pkts
11
1 ON
20
LNK
Pkts
1470
ENB
MR5Pkts
11
2 ON
19
LNK
Pkts
1470
ENB
MR5Pkts
3 ON
11
18
LNK
Pkts
1470
ENB
4 ON
MR5Pkts
11
17
SEG
Pkts
1470
5 ON
ENB
MR5Pkts
11
16
ON
Pkts
487
6 ON
147
ENB
MR5Pkts
11
15
LNK
Pkts
7 ON
1470
ENB
MR5Pkts
11
14
LNK
Pkts
8 ON
1470
ENB
MR5Pkts
11
13
SEG
Pkts
9 ON
Pkts
1470
ENB
MR5
11
12
SEG
Pkts
10
1470
ENB
MR5Pkts
11
11ON
147
ENB
MR5Pkts
11
10ON
LR1Pkts 147
11
20ON
SEG
Pkts
0
12
147
ENB
MR5Pkts
119 ON
147
ENB
MR5Pkts
118 ON
147
ENB
MR5Pkts
117 ON
147
ENB
LR1Pkts
116 ON
147
ENB
LR1Pkts
115 ON
147
ENB
LR1Pkts
114 ON
147
ENB
LR1Pkts
113 ON
147
ENB
LR1Pkts
112 ON
147
WRAP
LR1Pkts
111 ON
MR1
MR2
MR3
MR4
MR5
LR1-5
9031398 E3
Token Ring Modules
B-3
Token Ring Modules
Token Ring Module Icon
Token Ring Module Icon
The logical representation of SynOptics modules provides graphical
information about the module, local rings, module rings, clusters, and the
individual ports and attachments to the hub’s backplane. This appendix
describes the various views and information available from each area of the
logical module. Figure B-1 displays a logical representation of a SynOptics
module.
The Logical Module Icon consists of two areas providing information
pertaining to the module. These areas have the following functions:
Module Number
Displays the number identifying the module’s position in the hub and provides
a menu access zone for the module Icon Subviews menu. Double-click the
module number to open the Module Notes facility.
Module Type
Displays the type of module being modeled and provides a menu access zone
for the module Icon Subviews menu.
Token Ring Module Icon Subviews Menu
Table B-2 provides definitions of the Logical Module Icon Subviews menu
selections described in this chapter. See Chapter 1, Introduction for
information on Accessing SPECTRUM Views from the Device Icon.
Table B-2.
Token Ring Module Icon Subviews Menu Selections
Menu Selection
Description
Module Notes
Opens the SPECTRUM Notes facility for the module,
described in the SPECTRUM Views.
Module Configuration
Opens the Configuration View for the selected module.
MR X Backplane
Connection
Opens the Backplane Connection view for module ring
number X where X represents the number identifying the
ring (1-5).
Port Icons
The Port Icons each consist of three areas providing information pertaining to
the port. These areas have the following functions:
Port Identifier
Displays the number uniquely identifying this port on the module. Doubleclick this number to open the Port Notes facility.
Token Ring Modules
B-4
SynOptics Series 5000
Management Module Guide
Token Ring Modules
Port Icons
Attachment Segment Identifier
Displays an identifier indicating to which ring the port attachment connects
and provides a double-click zone accessing the Attachment Configuration
view. Table B-3 lists possible identifiers and their descriptions.
Table B-3.
Attachment Segment Identifier
Identifier
Description
MR
Module Ring
LR
Local Ring
Port Link Status
Displays the status of the port. Double-click this status area to open the Port
Configuration view. Table B-4 lists possible status values and their
descriptions.
Table B-4.
Port Link Status Values
Status
9031398 E3
Color
Description
INIT
Gray
Initializing
ENB
Yellow
Enabled, No Phantom
WRAP
Blue
Wrapped, No Phantom
WRAP
Red
Wrapped, Phantom
TWRP
Blue
Timed Wrap, No Phantom
TWRP
Red
Timed Wrap, Phantom
NWRP
Blue
NMM Beacon Wrap, No Phantom
NWRP
Red
NMM Beacon Wrap, Phantom
SWRP
Blue
Wrong Speed Wrap, No Phantom
SWRP
Red
Wrong Speed Wrap, Phantom
PWRP
Blue
Permanent Wrap, No Phantom
PWRP
Red
Permanent Wrap, Phantom
INS
Green
Enabled, Phantom
Token Ring Modules
B-5
Configuration Views
Table B-5 provides definitions of the Logical Port Icon Subviews menu
selections described in this chapter. See Chapter 1, Introduction for
information on Accessing SPECTRUM Views from the Device Icon.
Table B-5.
Logical Port Icon Subviews Menu Selections
Menu Selection
Port Notes
Description
Opens the Port Notes Facility, described in the SPECTRUM
Views.
Attachment
Configuration
Opens the Configuration view for the selected port.
Station Port
Configuration
Opens the Station Port Configuration view for the selected
station port.
Enable/Disable Port
Opens the Enable/Disable Port dialog box allowing you to
read or change the port state.
Configuration Views
These views provide detailed information on the module, attachment, and port
configuration. Access each specific configuration view from the Icon Subviews
menu for that area of the logical module (refer to Figure B-1). The following
sections provide more detailed information on each configuration view.
Module Configuration View
The Module Configuration view provides an attachment table as well as
information on the configuration of the module and allows modification of
some values.
Access the Module Configuration view by selecting Module Configuration
from the Icon Subviews menu for the module.
This view provides the following fields:
Module
Displays the number specifying the location of the module in the hub.
Manufacture Date
Displays in ASCII the date of manufacture of the module following the format:
yyyymmdd. For example, the value for April 13, 1993, is 19930413. If the date
is not available, a zero length string is used.
Attachments
Displays the total number of backplane network attachment points on the
module.
Token Ring Modules
B-6
SynOptics Series 5000
Management Module Guide
Configuration Views
Module Configuration View
Attachment Changes
Displays the total number of attachment changes for the module detected
since cold/warm start of the agent or since the insertion of the module.
Last Attachment Change
Displays the value of SysUpTime when the last attachment change on the
module was detected. If no change has been detected since cold/warm start of
the agent, the value is zero.
Configuration Source
Displays the source of the configuration at the last module reset. Table B-6
lists the possible values and their descriptions.
Table B-6.
Configuration Source Values
Value
Description
Other
Unknown or some other value
DfltJmpr (2)
Default jumpers
PrmMem (3)
Permanent memory on the module
BrdCfg (4)
Saved configuration on the module
Sm (5)
Supervisor
SmDfltJmpr (6)
SM and default jumpers
SmPrmMem (7)
SM and permanent memory on the module
Configuration Changes
Displays the total number of configuration changes for the module detected
since the cold/warm start of the agent or since the insertion of the module.
Module Attachment Table
The Module Attachment Table, at the bottom of the Module Configuration
View, provides information on each of the attachments on the module. Doubleclick any entry in this table to access the Attachment Configuration view,
described later in this chapter. A Print button allows you to output a copy of
this table to a printer or a file. This table provides the following information:
Attachment
Displays the number identifying the network attachment point on the module.
Current
Displays the current channel or segment for this attachment (for example,
Loc_1).
9031398 E3
Token Ring Modules
B-7
Configuration Views
Attachment Configuration View
Default
Displays the default channel or segment for this attachment (for example.,
MR_1).
Changes
Displays the number of changes for the attachment detected since cold/warm
start of the agent or since the insertion of the module.
Last Change
Displays the value of SysUpTime when the last change on the attachment was
detected. If no change has been detected since cold/warm start of the agent,
the value is zero.
Default Speed
Displays the default speed.
Current Speed
Displays the current speed.
Attachment Configuration View
Each of the attachments on the module has an Attachment Configuration
view. These views provide information on the configuration of each specific
attachment and allow modification of some values.
Access one of these configuration views by selecting Attachment
Configuration from the Icon Subviews menu for the desired port
representation.
These views provide the following fields:
Module
Displays the number specifying the location in the hub of the module having
the attachment.
Attachment
Displays the number specifying the location of the attachment on the module.
Current Attachment
Provides a button displaying (and allowing change of) the current setting for
the attachment point. The position of the module within the hub, the setting
of the backplane divider switch(es), and the mode setting all affect which
backplane networks are valid. Some modules may limit the use of certain
backplane network(s) or local channel(s).
Last Change
Displays the value of SysUpTime when the last attachment change for the
attachment point was detected. If no change has been detected since cold/
warm start of the agent, the value is zero.
Token Ring Modules
B-8
SynOptics Series 5000
Management Module Guide
Configuration Views
Station Port Configuration View
Default Speed
Displays the default speed.
Current Speed
Displays the current speed.
Fault Indicator
Displays the number of faults.
Station Port Configuration View
The Station Port Configuration view provides information on the
configuration of the selected port and allows modification of some values.
Access the Station Port Configuration view by selecting Station Port
Configuration from the Icon Subviews menu for the desired port.
This view provides the following fields:
Module
Displays the number specifying the location in the hub of the module on which
the port is located.
Port
Displays the number uniquely identifying the selected port on the module.
Class
Displays one of the values listed and described in Table B-7.
Table B-7.
Class Values
Value
9031398 E3
Description
other
unknown or some other type
ri
Ring In port
ro
Ring Out port
lobe
Lobe port
internal
Internal port which may be connected to a backplane ring.
Token Ring Modules
B-9
Configuration Views
Station Port Configuration View
Connector
Displays one of the port connector types listed in Table B-8.
Table B-8.
Port Connector Types
Value
Description
other
unknown or some other type
internal
no external connector
db9
DB9
rj45
RJ-45
fiberST
fiber ST
Media
Displays one of the values describing the port media type listed and described
in Table B-9.
Table B-9.
Port Media Type Values
Value
Description
other
unknown or some other type
synFiber
SynOptics Fiber
stdFiber
Standard Fiber
copperActive
active copper
copperPassive
passive copper
mac
internal MAC
specialProc
internal special processor
Wrap Status
Provides a button with the choices listed and described in Table B-10.
Table B-10.
Wrap Status Selections
Status
Description
other
wrap status unknown
wrap
port wrapped
connect
port not wrapped
timedWrap
port timed wrapped
nmmBeaconWrap
beaconing station automatically removed by a network
management module (NMM)
Token Ring Modules
B-10
SynOptics Series 5000
Management Module Guide
Configuration Views
Station Port Configuration View
Table B-10.
Wrap Status Selections (Continued)
Status
Description
wrongSpeed Wrap
station with wrong speed automatically removed
permBeaconWrap
station permanently removed by an NMM since it
attempted to deinsert and insert in the ring at a high rate
while it beacons the ring
Wrap Time
Displays the length of time to keep the port wrapped when a timed wrap is
done to the board or indicates the amount of time left before the timed wrap is
completed. Shows a value of zero if the port is not timed wrapped and also if
the amount of time is not available.
Strap Setting
Displays a value describing the strap (hardware jumper) setting for the RI/RO
port trunk validation method. Table B-11 lists possible values and their
descriptions.
Table B-11.
Strap Settings
Status
Definition
notSupported
a fiber port or not a RI/RO port
synoptics
use SynOptics method
none
no validation done
Validation Method
Provides a button with the following choices: notSupported, synoptics, none.
Phantom Changes
Counts the changes from noPhantom to phantom.
Phantom Status
Displays one of the values described in Table B-12.
Table B-12.
Phantom Status Values
Value
9031398 E3
Description
other
status unknown
noPhantom
no phantom signal
phantom
phantom signal on
Token Ring Modules
B-11
Configuration Views
Station Port Configuration View
NOTE
For RI/RO ports, this signal is driven by the ‘lowlight’ detector. For RI/RO
ports that have the value of none, this value will always be phantom.
Insert Status
Displays one of the values described in Table B-13.
Table B-13.
Insert Status Values
Value
Description
other
status unknown
notInserted
port not inserted
inserted
port inserted into the ring
Token Ring Modules
B-12
SynOptics Series 5000
Management Module Guide
Appendix C
FDDI Modules
What Is in This Appendix
This appendix describes the generic views available from the Device view for
SynOptics FDDI modules. These views allow access to network configuration
information and traffic flow, error data, and statistics for FDDI modules
installed in the SynOptics Series 5000 hub. This appendix describes the
following:
•
•
•
•
•
•
•
FDDI modules and their configurations
Logical module representations
Configuration views
Port Profile view
Port Configuration view
Port Parameters view
Port LER Thresholds view
9031398 E3
C-1
FDDI Modules and Their Configurations
FDDI Modules and Their Configurations
SynOptics 5000 provides four FDDI modules: 5910S, the intelligent module
discussed earlier in the document, and the 5905, 5902, and 5904 modules. The
FDDI modules provide connectivity to the SynOptics 5000 hub backplane.
Table C-1 shows the configurations for the available FDDI modules.
Table C-1.
FDDI Modules and Their Configurations
Number of
Ports
Port Type
Attachments
5910S FDDI
Network
Management
Module
2
N/A
1
5905, 5902, 5904
FDDI Host Modules
6
FDDI UTP
1
Module
The logical representation of SynOptics modules provides information about
the module, the ports, and the attachments to the hub’s backplane. This
appendix describes the various views and information available from each
area of the logical module. Figure C-1 displays a logical representation of a
SynOptics FDDI module.
FDDI Modules
C-2
SynOptics Series 5000
Management Module Guide
FDDI Modules and Their Configurations
FDDI Module Icon
Figure C-1.
FDDI Module Icon
Module Number/
Module Notes
Module Type
Backplane
Connection/
Port
Identifier/Port
Notes
Attachment
Attachment
Segment
Configuration View
Identifier/Attachment
Configuration View
Port Icons
10
5905
N2
LNK
Pkts
1470
CON
M Pkts
38 ON
11
LNK
Pkts
1470
CON
47 ON
M Pkts
11
SEG
Pkts
56 ON
1470
CON
M Pkts
11
ON
Pkts
487
65 ON
147
CON
M Pkts
11
LNK
Pkts
74 ON
1470
CON
M Pkts
11
LNK
Pkts
83 ON
1470
CON
M Pkts
11
Configuration View
FDDI Module Icon
The logical representation of SynOptics modules provides information about
the module, the ports, and the attachments to the hub’s backplane. This
appendix describes the various views and information available from each
area of the logical module. Figure C-1 displays a logical representation of a
SynOptics FDDI module.
The Logical Module icon consists of two areas providing information
pertaining to the module. These areas have the following functions:
Module Number
Displays the number identifying the module’s position in the hub and provides
a menu access zone for the module Icon Subviews menu. Double-click the
module number to open the Module Notes facility.
Module Type
Displays the type of module being modeled and provides a menu access zone
for the module Icon Subviews menu.
9031398 E3
FDDI Modules
C-3
FDDI Modules and Their Configurations
Port Icons
FDDI Module Icon Subviews Menu Selections
Table C-2 provides definitions of the Logical Module Icon Subviews menu
selections described in this chapter. See Chapter 1, Introduction for
information on Accessing SPECTRUM Views from the Device Icon.
Table C-2.
Logical Module Icon Subviews Menu Selections
Menu Selection
Description
Module Notes
Opens the SPECTRUM Notes facility for the module,
described in the SPECTRUM Views.
Module Configuration
Opens the Module Configuration View for the selected
module.
Network Attachment
Configuration
Opens the Attachment Configuration View for the selected
module.
Port Icons
The Port Icons each consist of three areas providing information pertaining to
the port. These areas have the following functions:
Port Identifier
Displays the number uniquely identifying this port on the module. Doubleclick this number to open the Port Notes facility.
FDDI Modules
C-4
SynOptics Series 5000
Management Module Guide
Configuration Views
Attachment Segment Identifier
Displays an identifier indicating relationship. Possible identifiers are as
follows: “M” (Master) or “S” (Slave).
Port Link Status
Displays the status of the port. Double-click this status area to open the Port
Configuration view. Table C-3 lists possible status values, their corresponding
colors, and descriptions of each value.
Table C-3.
Port Link Status Values
Status
Color
Description
DIS
Red
Disabled, Port is Active
DIS
Blue
Disabled, Port is Inactive
CON
Yellow
Enabled, Port is Inactive
SBY
Red
Standby
ACT
Green
Enabled, Port is Active
Port Label Icon Subviews Menu Selections
Tabel C-4 provides definitions of the Logical Port Icon Subviews menu
selections described in this chapter. See Chapter 1, Introduction for
information on Accessing SPECTRUM Views from the Device Icon.
Table C-4.
Logical Port Icon Subviews Menu Selections
Menu Selection
Port Notes
Description
Opens the Port Notes Facility, described in the SPECTRUM
Views.
Port Profile
Opens the Port Profile view for the selected port.
Port Configuration
Opens the Port Configuration view for the selected port.
Port Parameters
Opens the Port Parameters view for the selected port.
Port LER Threshold
Opens the Port LER Threshold view for the selected port.
Configuration Views
These views provide detailed information on the module, attachment, and port
configuration. Access each specific configuration view from the Icon Subviews
menu for that area of the logical module (refer to Figure C-1). The following
sections provide more detailed information on each configuration view.
9031398 E3
FDDI Modules
C-5
Configuration Views
Module Configuration View
Module Configuration View
The Module Configuration view provides an attachment table as well as
information on the configuration of the module and allows modification of
some values.
Access the Module Configuration view by selecting Module Configuration
from the Icon Subviews menu for the module.
This view provides the following fields:
Module
Displays the number specifying the location of the module in the hub.
Manufacture Date
Displays in ASCII the date of manufacture of the module following the format:
yyyymmdd. For example, the value for April 13, 1993 is 19930413. If the date
is not available, a zero length string is used.
Attachments
Displays the total number of backplane network attachment points on the
module.
Attachment Changes
Displays the total number of attachment changes for the module detected
since cold/warm start of the agent or since the insertion of the module.
Last Attachment Change
Displays the value of SysUpTime when the last attachment change on the
module was detected. If no change has been detected since cold/warm start of
the agent, the value is zero.
Configuration Source
Displays the source of the configuration at the last module reset. Table C-5
lists the possible configuration source values and descriptions for each value.
Table C-5.
Configuration Source Values
Value
FDDI Modules
C-6
Description
Other (1)
Unknown or some other value
DfltJmpr (2)
Default jumpers
PrmMem (3)
Permanent memory on the module
BrdCfg (4)
Saved configuration on the module
Sm (5)
Supervisor
SmDfltJmpr (6)
SM and default jumpers
SmPrmMem (7)
SM and permanent memory on the module
SynOptics Series 5000
Management Module Guide
Configuration Views
Attachment Configuration View
Configuration Changes
Displays the total number of configuration changes for the module detected
since the cold/warm start of the agent or since the insertion of the module.
Set Current Attachment For All Attachments
Provides a button with which to choose NET 1-5, other, or ISOL.
Module Attachment Table
The Module Attachment Table, at the bottom of the Module Configuration
view, provides information on each of the attachments on the module. Doubleclick any entry in this table to access the Attachment Configuration view,
described later in this chapter. A Print button allows you to output a copy of
this table to a printer or a file. This table provides the following information:
Attachment
Displays the number identifying the network attachment point on the module.
Current
Displays the current channel or segment for this attachment (for example,
NET_2).
Default
Displays the default channel or segment for this attachment (for example.,
NET_1).
Changes
Displays the number of changes for the attachment detected since cold/warm
start of the agent or since the insertion of the module.
Last Change
Displays the value of SysUpTime when the last change on the attachment was
detected. If no change has been detected since cold/warm start of the agent,
the value is zero.
Attachment Configuration View
Each of the attachments on the module has an Attachment Configuration
view. These views provide information on the configuration of each specific
attachment and allow modification of some values.
Access one of these configuration views by selecting Network Attachment
Configuration from the Icon Subviews menu.
These views provide the following fields:
Module
Displays the number specifying the location in the hub of the module having
the attachment.
9031398 E3
FDDI Modules
C-7
Port Profile View
Attachment
Displays the number specifying the location of the attachment on the module.
Current Attachment
Provides a button displaying (and allowing change of) the current setting for
the attachment point. The position of the module within the hub, the setting
of the backplane divider switch(es), and the mode setting all affect which
backplane networks are valid. Some modules may limit the use of certain
backplane network(s) or local channel(s).
Last Change
Displays the value of SysUpTime when the last attachment change for the
attachment point was detected. If no change has been detected since cold/
warm start of the agent, the value is zero.
Port Profile View
The SynOptics FDDI Port Profile view contains information specific to each
port for the SynOptics FDDI 5000 series. This view provides the following
information:
Board
Displays the unique value for each board that contains FDDI ports.
Port
Displays the unique value for each port. This value ranges between 1 and n.
Partition Status
Displays the partition status of the port. The Partition value partitions the
port from ring. The Enable value allows the port to connect to the ring. If a
timed partition is desired, timedpart is written to this object at the same time
a time value is supplied.
Partition Time
Displays the duration of the port partition period.
PC Line State
Indicates the line state received by the port. Possible states are
Quiet_line_state, Idle_line_state, Master_line_state, Halt_line_state,
Active_line_state, Line_state_unknown, and Noisy_line_state.
Active Time
Displays how long this port has been active.
PCM Break Count
Displays the number of times the port enters the pcm break state.
PCM Active Count
Displays the number of times the port enters the pcm active state.
FDDI Modules
C-8
SynOptics Series 5000
Management Module Guide
Port Configuration View
PCM Trace Receive Count
Displays the number of times this port receives a trace signal.
PCM Trace Propagation Count
Displays the number of times the Nmm propagates a trace signal through this
port.
PCM Last Trace
Displays the number of time ticks since the last trace occurs.
Port Configuration View
The SynOptics FDDI Port Configuration view displays network configuration
information for the SynOptics FDDI 5000 Series. This view provides the
following information:
SMT Index
Displays the value of the SMT index associated with this port.
Port Index
Displays a unique value for each port within a given SMT.
Hardware Present
Indicates the presence of underlying hardware support for this MAC object.
Possible states are Present and NotPresent.
Connect State
Displays a value representing the port’s connection policies desired in the
node.
PCM State
Displays the state of this Port’s PCM state machine. The values are Off,
Break, Trace, Connect, Next, Signal, Join, Verify, Active, and Maint.
PC Type
Displays the value of the port’s PC_Type.
PC Neighbor
Displays the type of the remote port as determined in PCM. This variable has
an initial value of none, and other values of A, B, S, and M.
PC Withhold
Displays the value of PC_Withhold. The values are None, M-M,
otherincompatible, and Pathnotavailable.
PC Line State
Indicates the Path(s) into which this port is currently inserted. The possible
values are Idle_Line_State, Isolated, Local, Secondary, Primary,
Concatenated, and Thru.
9031398 E3
FDDI Modules
C-9
Port Parameters View
MAC Placement
Indicates the MAC, if any, whose transmit path exits the station via this port.
The value is zero if there is no MAC associated with the port. Otherwise, the
MACIndex of the MAC is the value of the variable.
Remote MAC Indicated
Displays the indications in PC-Signalling of the intent to place a MAC in the
output token path to a port.
PMD Class
Indicates the type of PMD entity associated with this port. Values are
Multimode, Single-mode1, Single-mode2, Sonet, Low-cost-fiber, Twisted-pair,
Unknown, and Unspecified.
BS Flag
Assumes the value of the BS_Flag; values are True and False.
EB Error Count
Displays a count that should as closely as possible match the times an
Elasticity Buffer Error has occurred while in active line state.
Connection Capabilities
pc-mac-lct
Displays a flag internal to the Physical Connection Management (PCM) that
indicates that a MAC can be used for the Link Confidence Test.
pc-mac-loop
Displays a flag internal to the PCM that indicates that a MAC Local Loop can
be used for the Link Confidence Test before the connection is made active.
Port Parameters View
The SynOptics FDDI Port Parameters view contains port parameter
information for the SynOptics FDDI 5000 Series. This view provides the
following information:
SMT Index
Displays the number of SMT implementations (regardless of their current
state) on this network management application entity. The value for this
variable must remain constant at least from one re-initialization of the
entity’s network management system to the next re-initialization.
FDDI Modules
C-10
SynOptics Series 5000
Management Module Guide
Port Parameters View
Action
Returns a default value of other. Table C-6 gives a description of each action
variable.
Table C-6.
Action Values
Action Variable
Description
Other
Results in a badValue error.
Connect
Generates a Connect signal to ECM to begin a connection
sequence.
Disconnect
Generates a Disconnect signal to ECM.
Path_Test
Initiates a station Path_Test.
Self_Test
Initiates a station Self_Test.
Disable_A
Causes a PC_Disable on the A port if the A port mode is
peer.
Disable_B
Causes a PC_Disable on the B port if the B port mode is
peer.
Disable_M
Causes a PC_Disable on all M ports.
Port Index
Displays a unique value for each port. Each value ranges between 1 and n.
CE State
Displays the current status of the primary and secondary paths within this
station. The values are Concatenated, Separated, and Thru.
Maintenance Line State
Displays the current port line state of the MAC. Possible values associated
with the node are Quiet_line_state, Idle_line_state, Master_line_state,
Halt_line_state, Active_line_state, Line_state_unknown, and
Noisy_line_state.
Available Paths
Displays the path types available in the station. Choices are primary,
secondary, and local.
Connection Policies
Displays the connection capabilities in effect in a node. Choices are pc-mac-lct
and pc-mac-loop. Pc-mac-lct represents a flag internal to the Physical
Connection Management (PCM) that indicates that a MAC can be used for the
Link Confidence Test. Pc-mac-loop represents a flag internal to the PCM that
indicates that a MAC Local Loop can be used for the Link Confidence Test
before the connection is made active.
Set Requested Paths
Indicates the paths requested for this MAC. Possible values are Primary,
Secondary, Primary+secondary, and ???.
9031398 E3
FDDI Modules
C-11
Port LER Thresholds View
Requested Paths
Displays a list of permitted Paths which specifies the Path(s) into which the
MAC may be inserted Possible values are Local, Secondary-alternate,
Primary-alternate, concatenated-alternate, secondary-preferred, Primarypreferred, Concatenated-preferred, and Thru.
Port LER Thresholds View
The SynOptics FDDI Port LER Thresholds view contains Line Error Rate
information for the SynOptics FDDI 5000 Series. This view provides the
following information:
SMT Index
Displays a unique value for each port.
Port Index
Displays a unique value for each port within a given SMT.
LEM Reject Count
Displays a link error monitoring count of the times a link has been rejected.
LEM Error Count
Displays the aggregate link error monitor error count, set to zero only on
station initialization.
LCT Failure Count
Displays the count of the consecutive times the link confidence test (LCT) has
failed during connection management.
LER Cutoff
Displays the link error rate estimate at which a link connection will be
broken. It ranges from 10**-4 to 10**-15 and is reported as the absolute value
of the base 10 logarithm. The default is 7.
LER Alarm
Displays the link error rate estimate at which a link connection will generate
an alarm. It ranges from 10**-4 to 10**-15 and is reported as the absolute
value of the base 10 logarithm of the estimate. The default is 8.
LER Estimate
Displays a long term average link error rate. It ranges from 10**-4 to 10**-15
and is reported as the absolute value of the base 10 logarithm.
LER Condition
Displays the condition becomes active when the value of
fddiPORTLerEstimate is less than or equal to fddiPORTLerAlarm. This will
be reported with the Status Report Frames (SRF).
FDDI Modules
C-12
SynOptics Series 5000
Management Module Guide
Index
Symbols
# MACs 4-15
AUI A-13
Auto Partitions A-9
AutoDiscovery 1-4, 1-12
AutoPartition A-12
A
Abort 5-12, 5-16, 5-18
AC 5-12, 5-16, 5-18
Accessing SPECTRUM Views 1-15
Accessing the
Component View 3-6
Actions 1-4
Active 4-9
Stations 5-9
Active Monitor 5-5, 5-8
Add Receiver 4-7
Additional Statistics Button A-9, A-14
Address 4-9
Type 4-8
Address Copied 5-16, 5-18
Admin State 3-7
Values 3-7
Administration
State 3-9
Age
Time 4-8
Age Interval 5-9
Agent
IF Table 3-5
Interface
Button 3-5
View 3-5
Alignment A-8
Associations 1-4
Attach Index 4-23
Attachment A-6, B-7, B-8, C-7, C-8
Changes A-5, B-7, C-6
Configuration B-8, C-7
View A-12, B-8
Attachment 1 Configuration A-4, A-15
Attachment 1 Performance A-4, A-16
Attachments A-5, B-6, C-6
Attribute 1-4
B
Backoff Fails A-9
Backplane Type 4-12, 4-21
Bcast Frames A-9
Beacon 5-5, 5-11
Time 5-7
Type Definitions 5-7
BeaconBitStreaming 5-6
BeaconFrameStreaming 5-6
BeaconRingSignalLoss 5-6
Beacons 5-7
BeaconSetRecoveryMode 5-6
BitStreaming 5-8
BrdCfg A-5, B-7, C-6
Burst 5-12
Bypass
Present 4-23
C
Canonical 4-21, 5-15, 5-16, 5-17
Change Time Scale Button A-7
Changes A-6, B-8, C-7
Chassis
Configuration View 3-4
Contact 3-4
Description 3-4
Group
Components View 3-7
Table 3-6
View 3-6
Location 3-4
Modeling Information View 3-1
Serial Number 3-4
Type 3-4, 4-21
Version 3-4
Chassis Type 4-12
9031398 E3
1
C (continued)
Claim Token 5-11
Clear Filter 5-15, 5-16, 5-17
Cluster X Configuration A-4, A-16
Cluster X Performance A-4, A-16
Collisions A-8
Community
String 4-8
Community Names 3-2
Component
Index 3-5
Store
Table 3-9
Fields 3-9
View 3-8
Config File Name 5-3
Configuration
Changes A-5, B-7, C-7
Load Source 4-3
Views B-6
Congestion 5-13, 5-17, 5-18
Contact Source Information 3-3
Content Version 3-9
ContentionStreaming 5-8
Create 4-7
Current A-6, B-7, C-7
Attachment 5-2, A-7, B-8, C-8
Entries 4-6
Gateway 4-3
Protocol 4-3
Current Size (bytes) 3-9
D
Dark Gray 2-3
DCE 5-2, 5-9, 5-10, 5-12
Agent Configuration
View 5-3
MAC Address 5-5
Ring
Detail 5-10, 5-12
Statistics 5-10
Station
Isolating Errors 5-13
Isolating Errors Table View 5-15
Non-Isolating Errors 5-14
Non-Isolating Errors Table View
5-16
Table 5-14
Index
2
Default A-6, B-8, C-7
Jumpers A-5, B-7, C-6
Delete 4-7
Description 3-6, 3-7, 3-8
Detail 2-12, A-8, A-14
Button A-8, A-13
Device
Models 1-11
View 2-1
Configuration 2-2
DfltJmpr A-5, B-7, C-6
Disable 3-7
Disabled 3-8
Duplicate
Addr Errors 5-14, 5-19
E
Enable 3-7
Enable/Disable Port A-12
Enabled A-12
F
FatalErr 3-8
FCS Errors A-8
Find Button 4-7, 4-8, 4-10, 4-11
Firmware
Configuration 3-4
First
Entered 5-19
Fragments A-9
Frame
Copied 5-17, 5-18
Frame Copied 5-13
Frequency 5-13, 5-17, 5-19
Functional
Address 5-20
Funtional
Classes 5-20
G
Getting Help xvi
Giants A-8
Good
Error Report 5-11
Good Frames A-8
Group 3-7
SynOptics Series 5000
Management Module Guide
G (continued)
Group Address 5-20
H
Highlighted 2-3
HubSyn5xxx 1-4
I
Image File Name 5-3
In 5-14
AC 5-16, 5-18
Beacon Errors 5-14, 5-19
Burst 5-15, 5-18
Line 5-15, 5-18
Inactive 2-3
Index 3-6, 3-7
Initial Boot Info Source 4-2
Insertions 5-15, 5-19
Interface 4-9, 4-10
Address 4-11, 4-12
Index 3-5
IP 4-21
Internal 5-12, 5-16, 5-18
Invalid 5-4
IP
Address 3-5, 4-11, 4-12, 4-21, 4-22
Isolating
Errors
Breakdown Definitions 5-18
Isolating Errors
Breakdown Pie Chart Definitions 5-12
J
Jabber Status A-13
L
Last
Attachment Change 3-5, A-5, B-7, C-6
Beacon 5-7
Time 5-7
Change 3-6, 3-8, 5-2, A-6, A-7, B-8, C-7,
C-8
Configuration Change 3-5
Deleted 5-9
9031398 E3
Entered 5-19
Exited 5-19
NAUN 5-19
Physical Change 3-4
Updated 5-20
Last Beacon
NAUN 5-7
Sender 5-7
Type 5-7
Last Boot
Image Save Status 4-4
LER Estimate 4-19
Lin Button A-7
Line 5-12
Linear Representation 2-12, A-7
Link Status A-13
LLC
NonUcast 5-11
Ucast 5-11
Load
Server Addr 5-3
Local
Channel A-7
Detail View A-8
Identifier A-15
Performance View A-7
X Performance A-7, A-16
Local Channel X Performance A-4
Local Storage Version 4-2
Log
Button A-7
Logarithmic Representation 2-12, A-7
Logical
Local Channel Icon B-6
Components B-6
Module
Icon A-2, B-4, C-3
Components A-3
Module Representation 2-2
Port Representation A-10, B-4
Representation 2-2, B-4, C-2, C-3
Long Events A-9
Lost
Frames 5-18
Lost Frame 5-13
Lost Frames 5-17
M
MAC 5-11, 5-15, 5-16, 5-17
Index
3
M (continued)
Address 4-14, 4-15, 4-21
Duplicate Address 4-20
Frame Error State 4-20
Not Copied State 4-20
Ratio 4-19
w/ Frame Errors 4-19
MAC Address 4-10, 4-12, 5-14, 5-15, 5-17,
5-19, 5-20
MAC And LLC Frame Breakdown Pie Chart
Definitions 5-11
Management
View 3-1
Manufacture Date A-4, B-6, C-6
Max
Comps 3-6
Stations 5-8
Sub-Components 3-9
Maximum
Priority 5-20
Maximum Entries 4-6
Mcast Frames A-9
Model
Name 5-2
Type 1-4
Name 1-4
Module 4-9, 4-10, 5-2, A-4, A-6, A-12, B-6,
B-8, B-9, C-6, C-7
Attachment Table A-6, B-7, C-7
Configuration A-4, B-4, B-6, C-4, C-6
View A-4, B-6, C-6
Notes A-4, B-4, C-4
Number A-3, B-4, C-3
Type A-3, B-4, C-3
Module Identifier 2-2
Module Ring 5-10
Monitor Contentions 5-8
MonitorContention 5-6
Monitored Segment 2-12
Mstr Ports 4-15
N
NAUN 5-7, 5-10, 5-19
NAUN Changes 5-6
Neighbor
Changes 4-19
Network C-4
# 4-21
Index
4
Address 4-8, 5-2
Next
Available Entry 4-7
Boot
IP Addr 5-3
Net Mask 5-3
Next Boot
Gateway 4-4
Image
Load Source 4-4
Save Mode 4-5
Protocol 4-4
NMM
Agent
Models 3-2
Agent Configuration 4-2
View 4-2
Agent Models 1-12
Agents 3-2
Find Nodes 4-10
Ring Topology 4-11, 4-12
Show Nodes 4-8, 4-9
Slot 4-22
Topology 4-11
Trap Receiver 4-6
View 4-6
Node Version 5-21
NonFatalErr 3-8
Non-Isolating
Errors
Breakdown Definitions 5-18
Non-Isolating Errors
Breakdown Pie Chart Definitions 5-13
Non-Mstr 4-15
Non-Volatile RAM 5-4
Normal 3-8
Normal State 2-3
NormalOperation 5-6
NotAvail 3-8
Notice i
Null Frames A-10
Num
Children 4-23
Comps 3-6
Parents 4-23
Sub-Components 3-9
O
Off A-13
SynOptics Series 5000
Management Module Guide
O (continued)
White 2-3
Ok A-13
On A-13
OOW Collisions A-8
Oper State 3-7
Values 3-8
Operational State 3-9
Orange 2-3
Other 3-8, 4-7, 4-9, 5-4, 5-7, A-5, A-12, A-13,
B-7, C-6
Other Frames Breakdown Pie Chart
Definitions 5-11
Out
AC 5-16, 5-18
Beacon Errors 5-14, 5-19
Burst 5-16, 5-18
Line 5-15, 5-18
P
Part
Status A-12
Time A-12
Partition A-12
Timer 4-23
Partition Status 4-23
Path
Changes 4-19
Peer Wrap 4-20
State 4-20
Permanent Memory A-5, B-7, C-6
Phy Changes 3-6
Physical
Location 5-20
Module Representation 2-2
Topology Process C-9, C-12
Topology Trunk Ring View 4-21
Poll
Events 5-7
Port 4-9, 4-10, 4-14, 4-15, A-12, A-13, B-9,
C-5
Configuration A-12, B-6, B-9, C-5
View A-12, B-9
Detail View A-14
Elastic Buffer Error State 4-20
Link Error State 4-20
Notes A-12, B-6, C-5
Facility B-4, C-4
9031398 E3
Number A-10, B-4, C-4
Performance A-12
View A-13
Status A-11, B-5, C-5
w/LER 4-18
PrmMem A-5, B-7, C-6
Product ID 5-20
Protocol
Identifier 2-2
R
RAM Version 4-2
Rate Mismatches A-9
Reboot Agent 4-6
Receiver 4-7
Status 4-7
Reconfigure Chassis
Agents 3-3
Models
Button 3-3
Recovery 5-7
Redundancy Table A-4
Related Reading xv, xvi
Remove Station 5-20
Removed 3-8
Reset 3-7
Reset InProg 3-8
Restricted Rights Notice ii
Ring 4-18, 5-5
Master 4-11
Number 4-11, 5-6
Purges 5-6
Speed 4-11
State 5-6
Status Definitions 5-6
Ring Purge 5-11
RingPurge 5-6
Runts A-8
S
Scroll to Date-Time Button A-7
SEG-1 5-2
Segment
Identifier 2-3
Serial Number 3-8
Set Filter 5-15, 5-16, 5-17
Index
5
S (continued)
Short
Events A-9
IPGs A-9
SignalLoss 5-8
Slot 4-12, 4-14, 4-15
Sm A-5, B-7, C-6
SmDfltJmpr A-5, B-7, C-6
SmPrmMem A-5, B-7, C-6
SMT
Index 4-23
Soft Error Frames 5-12
Sort
Down 5-15, 5-16, 5-17
Up 5-15, 5-16, 5-17
Sort Button 4-7, 4-8, 4-9, 4-10, 4-11
Source
Index 5-5, 5-19, 5-20
State 4-22
Station
Address 4-22
Changes 5-9
Control 5-14
Deletes 5-9
Detail 5-14
ID 4-14, 4-18, 4-19, 4-20, 5-21
Status 5-14, 5-19
Table 5-8
Station Table 5-5
Status 4-9, 4-23
Storage 3-9
Type 3-9
Sub Index 3-7
Supervisor A-5, B-7, C-6
SynOptics
FDDI Configuration View C-9
SynOptics Hardware Documentation xv
SynOptics Hub Models 1-10
T
TCP/IP Based Networks xvi
Terminology xiv
Test 3-7
Testing 3-8
Time
Monitored 5-5
TimedPartition A-12
Token 5-13, 5-17, 5-19
Index
6
Ring
Station
Control View 5-20
Detail View 5-18
Token Ring
DCE
Ring Detail View 5-11
Ring Statistics View 5-10
NMM
Ring Topology Table View 4-11
Topology
Table View 4-10
Total
Attachment Changes 3-4
Bad 5-11
Configuration Changes 3-5
Good 5-11
Physical Changes 3-4
Total Frames Breakdown Pie Chart
Definitions 5-11
TR
NMM
Find Nodes
Table 4-9
Show Nodes
Table 4-8
Trademarks i
Trap Receiver Table 4-7
Type 4-15, 4-22
Mask 4-22
U
UNA 4-12
Undesired Connects 4-19
Unknown A-5, A-12, A-13, B-7, C-6
Unsort 5-15, 5-16, 5-17
Update 5-15, 5-16, 5-17
Station 5-20
Upstream Neighbor 4-21
Utilization 4-18
V
Valid 4-7, 5-4
Flag 5-3
Vendor 4-9, 4-10
Version 3-8
Virus Disclaimer i
SynOptics Series 5000
Management Module Guide
V (continued)
VNM 3-4
W
Warning 3-8
Wrap
Duration 4-18
State 4-18
Write 5-4
Configuration Settings to NVRAM 5-4
Write Configuration Settings to NVRAM
4-5, 4-14
9031398 E3
Index
7
Index
8
SynOptics Series 5000
Management Module Guide