1
LIMP
Program for Loudspeaker Impedance Measurement
User Manual
Version 1.7.0.
Ivo Mateljan
Electroacoustics Laboratory
Faculty of electrical engineering
R. Boskovica bb.
21000 Split, Croatia
December, 2010.
Copyright © Ivo Mateljan, 2005 - 2010. All rights reserved.
LIMP User Manual
Content
1 WHAT IS LIMP? ............................................................................................................................................... 3
2 IMPEDANCE MEASUREMENT THEORY .................................................................................................. 4
2.1 BASIC CIRCUIT FOR IMPEDANCE MEASUREMENT ............................................................................................ 4
2.2 STEPPED SINE AND PINK PERIODIC NOISE GENERATOR ................................................................................... 4
2.3 SIMPLE MEASUREMENT PROCEDURE .............................................................................................................. 5
2.4 MEASUREMENT IN A NOISY ENVIRONMENT.................................................................................................... 6
2.4.1 Lowering measurement noise in stepped sine mode .............................................................................. 7
2.4.2 Lowering measurement noise in FFT mode with periodic noise excitation .......................................... 7
3. HARDWARE SETUP ....................................................................................................................................... 8
4 WORKING WITH LIMP .................................................................................................................................. 9
4.1 LIMP MENUS .............................................................................................................................................. 12
4.2 SOUNDCARD SETUP ..................................................................................................................................... 14
4.2.1 Windows 2000 / XP WDM driver setup ............................................................................................... 14
4.2.2 Vista / Windows 7 WDM driver setup ................................................................................................ 16
4.2.3 ASIO driver setup ................................................................................................................................ 18
4.3 GENERATOR SETUP...................................................................................................................................... 19
4.4 MEASUREMENT SETUP ................................................................................................................................ 20
4.5 MEASUREMENT PROCEDURES...................................................................................................................... 21
4.6 GRAPH SETUP AND BROWSING .................................................................................................................... 22
4.9 CALIBRATED MEASUREMENTS .................................................................................................................... 24
4.8 FILE MANIPULATIONS.................................................................................................................................. 25
5 LOUDSPEAKER PARAMETERS ................................................................................................................ 27
5.1 DEFINITION OF PHYSICAL AND DYNAMICAL LOUDSPEAKER PARAMETERS ................................................... 27
5.2 ESTIMATION OF THIELE-SMALL PARAMETERS ............................................................................................. 29
5.3 ESTIMATION OF PHYSICAL LOUDSPEAKER PARAMETERS .............................................................................. 30
5.4 AUTOMATIC ESTIMATION OF PHYSICAL AND DYNAMICAL LOUDSPEAKER PARAMETERS .............................. 31
6 RLC MEASUREMENT .................................................................................................................................. 35
6.1 IMPORTANCE OF CALIBRATION .................................................................................................................... 36
LITERATURE .................................................................................................................................................... 37
2
LIMP User Manual
1 What is LIMP?
The LIMP is a program for the measurement of the loudspeaker impedance and estimation of
loudspeaker physical and dynamical parameters (also called Thiele-Small parameters). It is also a
general purpose program for measuring impedance in the range from 1 to 200 ohms.
Requirements to use the LIMP are:
o
o
o
o
Operating systems: Windows 2000 / XP / Vista / 7 – 32 bit
Processor class Pentium, clock frequency 600 MHz or higher, memory 256M for Windows
2000/XP or 2MB for Vista/Windows 7
Full duplex soundcard with synchronous clock for AD and DA converters
WDM or ASIO soundcard driver (ASIO is trademark and software of Steinberg Media
Technologies GmbH).
The LIMP has been used successfully with the following soundcards:
o
o
o
o
o
o
o
o
o
o
RME Fireface 800, RME Fireface 400, RME DIGI96, RME HDSP
Duran Audio D-Audio, EMU 1616m, EMU 0404 USB
Terratec EWX 24/96, Firewire FW X24, YAMAHA GO46,
M-audio Audiophile 2496, USB Transit, Delta 44,
Digigram VxPocket 440 - a notebook PCMCIA card
Echo Layla 24
TASCAM US-122 - USB audio
ESI Quatafire 610, U24 USB and Waveterminal,
Soundblaster Live 24 and Extigy-USB (but only at 48kHz sampling frequency),
Turtle Beach Pinnacle and Fuji cards,
The LIMP may be used with slightly degraded performance with following soundcards:
o
o
Soundblaster MP3+ USB (notice: don't install SB driver, use a Windows XP default driver),
Soundcards and on-board audio with AC97 codecs (problem with high noise in FTT mode).
The installation of program is through common setup program for the ARTA Software.
All Windows registry data for LIMP will be automatically saved at first program execution, and files
with extension ".LIM" will be registered to be opened with a program LIMP.
Results of measurement can also be saved as ASCII formatted files in .ZMA format.
The LIMP does not dump graphs to the printer, instead of this all graphs can be copied to the Windows
Clipboard and pasted to other Windows applications.
3
LIMP User Manual
2 Impedance measurement theory
2.1 Basic circuit for impedance measurement
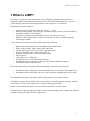
The measurement of the loudspeaker impedance is based on the system shown in Fig. 2.1. The
referential resistor R is connected between the signal generator and a loudspeaker impedance Z.
Figure 2.1 A circuit for loudspeaker impedance measurement
Impedance is defined in the frequency domain - Z (f ). If we measure voltages U1 (f ) and U2 (f ), at
both end of the referential resistor, we estimate the loudspeaker impedance as:
Z( f )
U2 ( f )
R
U1 ( f ) U 2 ( f )
(1)
2.2 Stepped sine and Pink periodic noise generator
The LIMP has two modes of impedance measurement:
1) Stepped sine mode
2) FFT mode with pink periodic noise excitation (Pink PN)
In the stepped sine mode LIMP generate burst of pure sinusoidal signal, frequency by frequency with
1/6, 1/12, 1/24 or 1/48 octave increment, and measures response to sinusoidal signal by filtering
out noise and distortion components in sinusoidal response.
FFT mode is faster method for impedance measurement, but with much lower measurement S/N ratio
than stepped sine mode. In this mode the LIMP simultaneously measures values of the impedance in
the whole audio range of frequencies by using the signal generator with a wideband periodic pink
noise excitation (pink PN).
The wideband pink PN excitation is realized as periodic random phase multisine signals. It is a zero
dc, periodic signal that contains M sine components, each with a random phase:
M
g (t ) Ak cos(2kf0t k ), k random 0,2
(2)
k 1
4
LIMP User Manual
This pink multisine has Ak =√2A2k and its spectral magnitudes roll-off 3dB/oct (after some cut-off
frequency). In the LIMP, a variable low frequency cut-off frequency can be changed in the 'Signal
Generator Setup' dialog box. The pink noise is usually used with a cut-off frequency set close to the
frequency where loudspeaker has an impedance maximum (20-100Hz). The pink periodic noise has
the statistical distribution close to the normal distribution, and in LIMP it is generated with a crest
factor lower than 12 dB.
2.3 Simple measurement procedure
In Stepped sine mode, a simple measurement procedure is as follows:
1. The LIMP generates burst of sine signal with frequency f. We assume that this signal drives the
generator shown in Fig. 2.1.
2. After an arbitrary transient time, that is necessary to reach the steady state, voltages at both end of
the referential resistor are measured as discrete time series u1 and u2 of length N.
3. The magnitude and phase of signal u1 and u2 at frequency f are estimated by finding fundamental
sinusoidal components U1 and U2 at generator frequency f. It is done by directly solving Fourier
integral in integration time T. These fundamental harmonics are used in the equation (1) to
calculate the impedance Z.
4. After some arbitrary time, we call it intra burst pause, that is necessary for measured system to
release reactive energy, a frequency is incremented for 1/24 octave (or 1/48 octave) and the
process is being repeated form step 1) until the predefined stop frequency is reached.
In FFT mode, a simple measurement procedure is as follows:
1. The LIMP generates the Pink PN as a discrete periodic sequence with a period equal to N. We
assume that this sequence drives the generator shown in Fig. 2.1.
2. After one preaveraging cycle, which is necessary to reach the steady state, voltages at both end of
the referential resistor are measured as discrete time series u1 and u2 of length N.
3. The DFT is applied to time series u1 and u2 to get spectral components U1 (f) and U2(f). They are
used in the equation (1) to calculate the impedance Z(f).
Important note:
The signal generation in the stepped sine mode gives sinusoidal components with at least 30dB higher
level than it is possible in FFT mode. That is why, in FFT mode the measurement results can be
greatly affected by the noise that can be generated by the measured loudspeaker.
5
LIMP User Manual
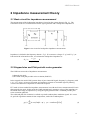
2.4 Measurement in a noisy environment
The main source of the measurement noise is a loudspeaker that acts as a microphone for the
environmental noise and vibrations. Fig. 2.2 shows modified circuit for the loudspeaker impedance
measurement, with included the noise generator En.
Figure 2.2 A circuit for the loudspeaker impedance measurement, with the noise generator En
If we apply equations for impedance measurement (1) to this circuit, we get the estimated impedance
value:
Z estimated R
R Z Rg
U2
Z
U1 U 2
1 E g / En
(3)
What this equation shows is that estimated impedance differs from the true impedance Z by
the term that is dependant on the S/N ratio (Eg/En) and values of resistors R, Rg and the
impedance Z. We can conclude:
1. The signal generator must supply a high voltage, to assure high S/N. In practice, we need a
generator with at least 1V of a peak output voltage. This can easily be achieved with stepped
sine excitation.
2. When we use FFT method the measurement results are highly affected with noise. The
loudspeaker act as a microphone with a highest sensitivity in the region of the membrane
resonance. It means the highest level of the noise at low frequencies, so we must generate the
signal with highest level at low frequencies, i.e. the pink noise.
3. Values of resistors R and Rg must be small, an optimum being a value close to the magnitude
of the measured impedance. Practically, we can use R = 10-27 ohm to get a very good
impedance estimation, but then we need a power amplifier to supply large current. If we use
the soundcard phone output as a signal generator, then we can use R = 47-100 ohms. If we use
the soundcard line output as a signal generator, due to the limited current capability, we must
use R>600 ohms. In that case we can't get a good estimation with FFT method, but still we can
use stepped sine method.
6
LIMP User Manual
2.4.1 Lowering measurement noise in stepped sine mode
In stepped sine mode LIMP uses "heterodyned" principle to filter all spectral components that are out
of the passband which is centered at the measured frequency. The bandwidth of the filter is equal to
1/T where T is integration time of the Fourier integral. For example, if we use integration time 200ms,
then the width of the passband of the "heterodyne" filter is 5Hz.
2.4.2 Lowering measurement noise in FFT mode with periodic noise
excitation
The noise can be partly lowered by using the averaging technique in the estimation of U1 and
U2. The LIMP averages the auto-spectrum of U1 and the cross-spectrum of U1 and U2, giving
the following estimated impedance:
Z esitimated
R
U1U1*
U 2U1*
(4)
1
Note: brackets <> denotes averaged values and star denotes the conjugate complex value.
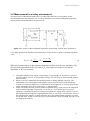
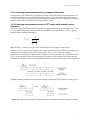
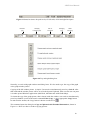
Two type of the averaging can be applied in the LIMP. In a "time domain synchronous averaging" the
LIMP generates multiple periods of one noise sequence (Fig. 2.3). In a "frequency domain
asynchronous averaging" the LIMP generates a different noise sequence for every acquired FFT block
(Fig. 2.4). The Frequency Domain Asynchronous Averaging can give slightly better results than the
synchronous averaging in systems with nonlinear distortion, but it needs longer time for measurements.
Figure 2.3 Signal generation and acquisition during the synchronous time domain averaging process
Figure 2.4 Signal generation and acquisition during the asynchronous frequency domain averaging
7
LIMP User Manual
3. Hardware Setup
The simplest measurement configuration is shown in Fig. 3.1. The soundcard phone-out (or
loudspeaker out) is used as a signal generator output. The soundcard left line-input is used for
recording the voltage U and the soundcard right line-input is used for recording the voltage U .
1
2
Note: If the soundcard has no phone-out or loudspeaker-out, then we have to use the line-out and a
external power amplifier, as shown in Fig. 3.2.
Figure 3.1 Measurement setup
for loudspeaker impedance
measurements, using the phone
output
Figure 3.2 General
measurement setup for
loudspeaker impedance
measurements
To protect the soundcard input form large voltage that is generated at a power amplifier output, it is
recommended to use the voltage probe circuit with Zener diodes, as shown on Fig. 1.3. Values of
resistors R1 and R2 have to be chosen for arbitrary attenuation (i.e. R1=8200 and R2=910 ohms gives
probe with -20.7dB (0.0923) attenuation if the soundcard has usual input impedance - 10kΩ). In a
single channel mode this probe is not connected.
Figure 3.3 Voltage probe with
the soundcard input channel
overload protection
8
LIMP User Manual
4 Working with LIMP
When you start the LIMP you get the program window shown in Fig. 4.1. There are: menu bar, toolbar
and a dialog bar at a top of the window and a status bar on the bottom of the window. The central part
of the window will show the magnitude and the phase plot.
Figure 4.1 Main program window
Figure 4.2 Toolbar icons
9
LIMP User Manual
Figure 4.3 Status bar shows the peak level (ref. full scale) of left and right line inputs
Generator
type
Sampling
Frequency (Hz)
Size of
FFT block
Averaging
type
Reset
averaging
Figure 4.4 Top and right dialog bars
Normally, we work with graph windows and dialog boxes. We also need to get the copy of the graph
or the graph window picture.
Copying of the full window picture is simple. User needs to simultaneously press keys Ctrl+P. After
that command the window picture will be saved in the System Clipboard, from were the user can paste
it in other opened Windows applications (MS Word, MS Paint and Adobe Paint Shop).
To obtain the copy of the graph picture, that is shown inside the window, user needs to simultaneously
press keys Ctrl+C or activate the menu command 'Edit->Copy', or press appropriate 'Copy' button.
In main window toolbar, the 'Copy' button is shown as toolbar icon
.
This command opens the dialog box 'Copy to Clipboard with Extended Information', shown in
Figure 1.16. Here user has to set three copying options:
10
LIMP User Manual
1) In the Edit box user optionally enters the text that will be appended at the bottom of
the graph.
2) Check box 'Add filename and date' enables adding text to the graph that shows file
name, date and time.
3) Check box ' Save text' enables saving entered text for the next copy operation.
4) Bitmap size is chosen by selecting one of following combo box items:
Current screen size
- variable width and height option
Smallest (400 pts)
- fixed graph width 400 points
Small (512 pts)
- fixed graph width 512 points
Medium (600 pts)
- fixed graph width 600 points
Large (800 pts)
- fixed graph width 800 points
Largest (1024 pts)
- fixed graph width 1024 points
The options with fixed width gives graph copy with the aspect ratio 3:2.
Pressing the button 'OK' copies the graph to the system clipboard.
Pressing the button 'Cancel' cancels the copy operation.
Figure 4.5 Dialog box 'Copy to Clipboard with Extended Information',
11
LIMP User Manual
4.1 LIMP Menus
Here is a brief explanation of LIMP menus:
File
New - initializes a new file content
Open... - opens an existing impedance file (*.LIM)
Save - saves the file with a current name
Save As... - saves the file under a new name
Info. - shows information about current file
Export ASCII - exports the file content in a textual - ASCII file
Commented .TXT file - exports textual file with comment and rows containing frequency,
impedance magnitude and phase
Plain .ZMA file - exports textual file with rows containing values of frequency, impedance
magnitude and phase
CSV (Excel) file - exports CSV file containing frequency, impedance magnitude and phase
Recent File - opens a recently opened file
Exit - exits the program
Overlay
Set as overlay- sets the current impedance curve as an overlay
Delete - deletes overlay
Load - loads an overlay from an impedance file
Edit
Copy - copies the plot as a bitmap to the clipboard
Setup colors and grid style - sets graph colors and grid style
B/W Color - changes the background color to black or white
Use thick pen - uses thick pen for plotting curves
View
Toolbar - shows or hides the Toolbar
Status Bar - shows or hides the Status bar
Fit graph range - changes graph top margin to show full impedance curve
Magnitude - shows only impedance magnitude curve
Magnitude+phase - shows impedance magnitude and phase curves
Record
Start - starts recording (measurement)
Stop - stops recording (measurement)
Calibrate - opens the dialog box for calibration of line input channels
Setup
12
LIMP User Manual
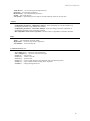
Audio devices - sets current input and output devices
Generator - sets generator parameters
Measurement - sets measurement parameters
Graph - sets graph margins
CSV format - opens dialog box for setup of decimal separator character in CSV files
Analyze
Loudspeaker parameters - Added mass method - shows the dialog box for the estimation of
loudspeaker parameters using Added mass method
Loudspeaker parameters - Closed box method - shows the dialog box for the estimation of
loudspeaker parameters using Closed box method
RLC impedance values at cursor position - estimate values of impedance serial RLC elements
Help
About - gets information about the LIMP
Registration - shows the user license registration
User Manual - shows the help file
Useful shorcut keys are:
Up and Down keys - change the top graph margin
Left and Right keys - move the cursor left and right
Ctrl+S key - saves the file
Ctrl+N key - makes a new file
Ctrl+O key - opens the file
Ctrl+C key - copies a graph bitmap to the clipboard (with user defined options )
Ctrl+P key - copies a whole window bitmap to the clipboard
Ctrl+B key - changes background color
13
LIMP User Manual
4.2 Soundcard Setup
Activate the menu Setup->AudioDevices. You will get the 'Soundcard Setup' dialog box shown in
Fig. 4.6. In this dialog box you choose which soundcard will be used as an input or output device.
Generally, choose the same card as an input and output device.
Figure 4.6 Soundcard setup
The 'Audio Device Setup' dialog box has following controls:
Soundcard driver - chooses the type of soundcard driver (WDM – windows multimedia driver or one of
installed ASIO drivers).
Input channels - chooses the soundcard input stereo channels. ASIO driver can have large number of
channels.
Output Device - chooses the soundcard output stereo channels.
Generally, user chooses input and output channels of the same soundcard (mandatory in ASIO driver
mode).
Control panel button – if WDM driver is chosen, it opens sound mixer on Windows 2000/XP or Sound
control panel in Vista/Win7. If ASIO driver is chosen, it opens ASIO control panel.
Wave format – on Windows 2000/XP chooses Windows wave format: 16 bit, 24 bit, 32 bit or Float. Float
means IEEE floating point single precision 32-bit format. It is recommended to use 24-bit or 32-bit modes
when using a high quality soundcard (many soundcards are declared as 24-bit, but their real bit-resolution
is less than 16-bits). For Windows Vista / Windows 7 it is recommended to choose resolution type Float.
This control has no effect in the ASIO mode, where a bit resolution has to be setup in the ASIO control
panel.
Important notice: Please mute the line and microphone channels at the output mixer of
the soundcard; otherwise you might have a positive feedback during measurements. If
you use a professional audio soundcard, switch off the direct or zero-latency monitoring
of the line inputs.
4.2.1 Windows 2000 / XP WDM driver setup
After selection of the soundcard user has to disable (mute) line-in and microphone inputs in output
mixer. Also user has to select which input will be used for recording: Line In or Microphone (Mic).
For a standard PC soundcards the procedure is as follows:
14
LIMP User Manual
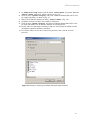
5) In ‘Audio device setup’ dialog click the button ‘Control panel’ to open the Windows
‘Master Volume’ dialog box, which is shown on Fig. 4.8.
6) Click on menu ‘Options->Property’ and select soundcard channel that will be used
for output (playback), as shown in Fig. 4.7.
7) Mute Line In and Mic channels in dialog ‘Master Volume’ (Fig. 4.8)
8) Set Master Volume and Wave Out volume to maximum.
9) Click on menu ‘Option->Property’ and select soundcard channel that will be used
for input and enable Line In and Mic channels in recording mixer.
10) Choose Line In or Mic Input. Normally, Limp uses Line In input on which external
microphone amplifier should be connected.
11) Set volume control of Line In to some lower position. Later it will be set more
precisely.
Figure 4.7 Dialog for choosing soundcard and input/output channels
15
LIMP User Manual
Figure 4.8 Typical setup of a soundcard output mixer in Windows XP
Note: Most professional audio soundcards have their own program for adjustment of input and
output channel, or have hardware control of input monitoring, and input and output volume
controls.
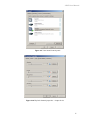
4.2.2 Vista / Windows 7 WDM driver setup
Microsoft has changed their approach in control of sound devices in Vista / Win7. Now operating
system (also, sometimes in conjunction with control programs of professional soundcards) is
responsible for setting soundcard native sampling rate and bit resolution. Operating system changes
native resolution to floating point format for high quality mixing and eventually for the sample rate
conversion.
For LIMP, this means that it is strongly recommended to use ‘Float’ resolution and sets the sampling
rate to the native format. Access to these values is in ‘Windows sound control panel’, which user
gets by clicking on the button ‘Control Panel’ in ‘Audio Device Setup’ dialog.
Fig. 4.9 shows Vista/7 control panel, that has four property pages.
As first step, user has to adjust 'Playback page' and later repeat the same procedure for 'Recording
page'. Adjustment steps are:
1) Click on channel info to choose a playback channel. It is not recommended to use the
measurement channel as a default audio channel.
2) Click on button ‘Properties’ to opens channel ‘Sound properties’ dialog.
3) Click on the tab ‘Levels’ to open the output mixer (as in Fig. 4.10). Then mute Line In and
Mic channels, if exist.
4) Click on the tab ‘Advanced' to set the channel resolution and a sample rate (as in Fig. 4.11)
5) Repeat previous procedure 1) to 4) for recoding channel, and choose the same sampling rate as
in the playback channel.
16
LIMP User Manual
Figure 4.9 Vista Sound Control panel
Figure 4.10 Playback channel properties – Output levels
17
LIMP User Manual
Figure 4.11 Setting the native bit resolution and sampling rate in Vista
Note: There are a lot of drivers that do not work stable under Windows 7. In that case please use ASIO
driver if it is available for your soundcard.
4.2.3 ASIO driver setup
ASIO drivers are decoupled from the operating system control. They have their own control panel to
adjust native resolution and memory buffer size. The buffer is used for the transfer sampled data from
the driver to the user program. User opens the ASIO control panel by clicking button ‘Control Panel’
in the ‘Audio Device Setup’ dialog. Fig. 4.12 shows an example of ASIO control panel.
Figure 4.12 E-MU Tracker Pre ASIO Control panel for setting bit-resolution and buffer size
In music applications user usually sets buffer size as small as it is possible for the stable work. That
gives the lowest input/output latency (system introduced delay).
18
LIMP User Manual
In Limp, the latency is not problem, as it is encountered in software, but it is not recommended to use
buffer with size larger than 2048 samples, or smaller than 256 samples. Some ASIO control panels
express the buffer size in samples, while other express the buffer size in time [ms]. In that case we can
calculate the size in samples using following expression:
buffer_size [samples] = buffer_size[ms] *samplerate[kHz] / number_of_channels.
Some ASIO drivers allow setup of buffer size (in samples) that is a power of number 2 (256, 512,
1024, …). In that case Limp adjusts buffer size automatically.
Limp always work with two input channels, and two output channels, treating them as a stereo left and
right channels. As ASIO support multichannel devices, user has to choose in a dialog box ‘Audio
Device Setup’’ which pair of channels will be used (1/2, 3/4, …).
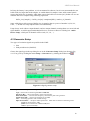
4.3 Generator Setup
Two types of excitation signals are possible in the LIMP:
Sine
Pink periodic noise (Pink PN).
Choose the signal type in the top dialog bar or in the 'Generator Setup' dialog box shown in Fig.
4.13. You get it by clicking the menu Setup -> Generator or by clicking the toolbar icon
.
Figure 4.13 Signal generator setup
The dialog Generator Setup has following controls:
Type - chooses the excitation signal: Sine or Pink PN.
Sine freq. (Hz) - enter test frequency of the sine generator.
Pink cut-off (Hz) - enters the low-frequency cut-off of the pink noise generator.
Output level (dB) - chooses the output level (0-15dB).
Test - starts/stops generator with current settings.
Input level monitor - the input volume peak meter. Meter bars are shown in following colors:
green (for levels bellow -3dB),
yellow (for levels between -3dB and 0dB) and
red (for input overloaded).
19
LIMP User Manual
Recommendation:
For most reliable results use sine generator, but don't push loudspeaker into large
displacement (the largest displacement is at frequencies below the loudspeaker resonance
frequency).
For measurements of bass or mid-bass loudspeakers set the Pink cut-off frequency close to
the loudspeaker resonance frequency (20-100 Hz).
Press the button Test to monitor input/output levels. If peak meter bars are in red color input
channels are overloaded, then lower the output volume until bars go to yellow or green color.
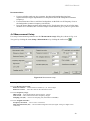
4.4 Measurement Setup
For setup of measurement parameters use the 'Measurement setup' dialog box, shown in Fig. 4.14.
You get it by clicking the menu Setup->Measurement or by clicking the toolbar icon
.
Figure 4.14 Measurement setup
The dialog ' Measurement setup ' has following controls:
In section Measurement config:
Reference channel - sets the reference channel (U1) to: Left or Right.
Reference resistor - enters the value for the referential resistor.
In section Frequency range:
High cut-off - enters measurement upper frequency margin.
Low cut-off - enters measurement lower frequency margin.
Sampling rate (Hz) - chooses the sampling rate (from 8000 to 96000Hz).
In section Stepped sine mode:
Frequency increment - sets to 1/24 or 1/48 octave
Min. integration time (ms) - enters minimal integration time (the higher value gives higher noise
reduction).
20
LIMP User Manual
Transient time (ms) - enters transient time to allow the system to get to the steady state (before starting
the integration).
Intra burst pause (ms) - enters time needed for system to release the energy from reactive components.
In section FFT mode (pink noise excitation):
FFT size - chooses the length of the FFT block ( 32768 or 65536).
Type - chooses: None, Linear or Exponential averaging.
Max. Averages - enters the maximum number of averaging for the 'Linear' mode.
Asynchronous averaging - check box to use the asynchronous averaging.
4.5 Measurement Procedures
After you have done the audio device setup, the generator setup and the measurement setup you are
ready for measurements.
a) Procedure in FFT mode
Connect loudspeaker in test fixture (Fig. 3.1 or 3.2) and click the menu Record->Start or click the
toolbar icon
. Measurements will be periodically repeated and results shown as an impedance
plot. You will get the graph like one shown in Fig. 4.15. You can stop the measurements by clicking
the menu Record->Stop or by clicking the toolbar icon
.
You can copy the graph bitmap by clicking the menu Edit->Copy or by clicking the toolbar icon
.
Figure 4.15 Impedance measurement without averaging – a noisy measurement
If you set averaging to Linear, measurements will be repeated and averaged until the number of
averaging reach the predefined value for Max averages in the 'Measurement setup' dialog box. You
can stop the averaging at any time by clicking the menu Record->Stop or by clicking the toolbar icon
. You will get the graph like one shown in Fig. 4.16.
You can also choose the exponential averaging. It differs from linear averaging in a way that it gives
more weight to results from last five measurements.
21
LIMP User Manual
Figure 4.16 Impedance measurements with averaging
a) Procedure in Stepped sine mode
Measurement procedures for stepped sine mode are almost the same as in FFT mode. The only
difference is that in FFT mode user will see the impedance plot for full measured frequency range
almost instantly, while in stepped sine mode procedure will be repeated for many frequencies. Cursor
will show current progress in measurements, and that process will be very slow.
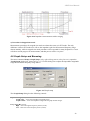
4.6 Graph Setup and Browsing
The menu command Setup->Graph Setup (or by right-clicking mouse in the plot area), opens the
'Graph Setup' dialog box, shown in Fig. 4.17. Use this dialog box to adjust the impedance magnitude
range shown and the frequency range shown.
Figure 4.17 Graph setup
The 'Graph Setup' dialog box has following controls:
Impedance range (ohm) section:
Graph range – enters the impedance magnitude range.
Graph bottom – enters the impedance magnitude for graph bottom margin.
Freq. range (Hz) section:
High – enters the highest frequency shown (in Hz).
Low – enters the lowest frequency shown (in Hz).
22
LIMP User Manual
View All – enables the view of all DFTspectrum components that are used in impedance estimation.
View Phase – enables a phase plot.
Update – updates the graph with a new setup.
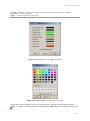
Figure 4.18 Dialog boxes for a graph colors setup
Figure 4.19 Standard Windows dialog for color setup
Graph colors can be changed in two ways. The first one is to change the background color from
"Black" to "White" by clicking the menu command View->B/W color or by clicking the toolbar icon
.
23
LIMP User Manual
The second way to change graph colors is a "user mode". User sets an arbitrary color for every graph
element using the 'Color Setup' dialog box, shown in Fig. 4.18. This dialog can be activated by
clicking the menu Edit->Colors.
Clicking the left mouse button on colored rectangle opens the standard Windows dialog box 'Color'
(Fig. 4.19). Button 'Default' restores default colors.
A check box 'Use dotted graph grid' enables drawing of grid with dotted line style.
We can browse the graph by moving the cursor. At the bottom of the graph the label 'Cursor:' denotes
values of the magnitude and the phase, at the cursor position.
4.9 Calibrated Measurements
In previously described measurements we have assumed that both soundcard input channels have the
same sensitivity, but usually it is not the true. If the difference in sensitivity of the input channels is
larger than 0.2 dB, we have to make a calibration.
The LIMP has a built in calibration procedure. It has to be done for a particular generator sequence
length and a sampling rate.
In the calibration procedure, both input channels have to be connected to the generator output.
By clicking the menu Record->Calibrate, or by clicking the toolbar icon CAL, we get the 'Calibrate
Input Channels' dialog box, shown in Fig. 4.20.
Figure 4.20 Dialog for calibration of input channel sensitivity
In section Generate we set the output volume for Pink PN signal of known sampling rate and
sequence length. Pressing the button ‘Generate’ activates the signal generation and monitoring of
input levels on the Input Level Meter. If necessary, we can adjust the output volume by using the
combo box 'Output volume'.
24
LIMP User Manual
Finally, in section Calibrate we enter the Number of averages (recommended value is 1, as we
measure high level signals) and press the button ‘Calibrate’. After a second, we have the calibrated
system.
Attention: If we change the sequence length or a sampling rate, we have to repeat the calibration
procedure.
The last section shows a report of the calibration procedure. The most important is information is
Channel difference in dB. If the Channel difference is larger than 2 dB LIMP gives a warning as in
figure 4.21, and calibration is rejected.
Figure 4.21 Report when channel difference is larger than 2dB.
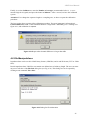
4.8 File Manipulations
Impedance data can be saved in LIMP binary format (.LIM files) and in ASCII format (.TXT or .ZMA
files).
Beside impedance data .LIM files can contain user defined text of arbitrary length. The user can enter
any text in edit box of the File Info dialog box (see Fig. 4.22). This dialog box can be opened by
clicking menu command 'File->Info'.
Figure 4.22 Dialog for file information
25
LIMP User Manual
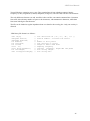
Textual files have extension .txt or .zma. They contain lines of text with three numeric literals:
frequency (in Hz), magnitude (in ohms) and phase (in degrees). The line ends with new line character.
The only difference between .txt and .zma files is that .txt files can contain comment lines. Comment
lines start, after arbitrary number of space or tab characters, with nonnumeric characters, while data
lines start with digit or dot character.
The file can be loaded as regular impedance data or as data for the overlay plot . Only one overlay is
allowed.
.LIM binary file format is as follows:
char id[4];
unsigned version;
unsigned reserved;
int numdata;
int cursorpos;
int fftlen;
float fs;
float data[3*numdata]
int infolength;
char string[infolength];
//
//
//
//
//
//
//
//
//
//
four characters id {'L', 'I', 'M', '\0' };
version number - started from 0x0101
0
number of data points
last position of cursor
length of FFT in FFT mode
sampling frequency
contains frequency, magnitude and phase
info string length
info string data
26
LIMP User Manual
5 Loudspeaker parameters
This chapter gives some definitions and measurement procedures for the estimation of loudspeaker
parameters.
5.1 Definition of physical and dynamical loudspeaker parameters
An electrodynamic loudspeaker that is mounted in the infinite baffle is usually ([10], [11])
characterized by the following physical parameters:
Electromagnetic parameters:
RE
- voice coil DC resistance ()
LE
- voice coil self-inductance (H)
L2
- inductance due to inductive coupling of eddy currents (H)
R2
- resistance due to eddy currents ()
Bl
- force factor (Tm)
Mechanical parameters:
S
- effective area of membrane (m2)
CMS - membrane mechanical compliance (m/N)
MMS - mechanical mass of membrane plus mass of air load on membrane (kg)
RMS
- mechanical resistance plus membrane radiation resistance (kg/s)
(Note: The piston area S is normally obtained from a cone diameter measurement that includes the 1/3
of the surround.)
Fig. 5.1 shows wideband and low-frequency equivalent circuits of an electrodynamic loudspeaker that
is mounted in a infinite baffle. The circuit for definition of low-frequency input impedance uses
following elements:
LCES Bl CMS , RES Bl / RMS , CMES M MS / Bl
2
2
2
Figure 5.1 a) Wideband analogous electrical circuit of an electrodynamic loudspeaker that is mounted
in the infinite baffle, and b) circuit for the estimation of the low- frequency input impedance
27
LIMP User Manual
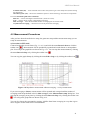
Using these analogous circuit elements, Thiele and Small [6, 7] introduced dynamical loudspeaker
parameters. They are defined in the Table 5.1.
1
,
2 M MS CMS
s
1
Resonant frequency in free air (Hz)
fs
Mechanical Q-factor
QMS
Electrical Q-factor
QES
Total Q-factor
QTS S CMES
Power available efficiency (%)
0
Sensitivity (1W/1m) in dB
c
L p 1W / 1m 10log 0 0 20log pref 112,1 10log0
2
Equivalent acoustical volume (m3)
VAS 0 c 2 S 2CMS
S M MS
RMS
M MS CMS
1
S CMS RMS
S M MS RE
Bl 2
RE RES
Q Q
MS ES
RE RES QMS QES
0 S 2 Bl 2
2 c RE M MS 2
Table 5.1 Thiele-Small dynamical loudspeaker parameters
( 0 = 1.18kg/m3, c = 345m/s, pref = 20Pa)
Thiele and Small have shown that by using these parameters it is easy to express the response of
closed box as 2nd order high-pass filter and response of bas-reflex box as 4th order high-pass filter.
Today, almost every loudspeaker manufacturer gives physical and Thiele-Small parameters in their
loudspeaker data sheets.
Note on electrical inductance:
An industry standard is to measure voice coil inductance at 1 kHz. In the LIMP, an inductive
impedance component (as well capacitive one) can be measured at any frequency, as shown in chapter
4.6.
The truth is that we cannot specify the exact value of the voice coil inductance LE, because it is a
circuit element that depends on frequency. The voice coil inductance can be better described as a
primary coil of the "transformer" whose secondary winding is the pole piece. Eddy currents in the pole
piece give rise to primary circuit resistance. The simplest model [8] for a primary input impedance is
K + jK, where K is some constant. The impedance increases with rather than .
This model is not practical as engineers in many numerical simulations use some form of an
analogous electrical circuit that closely matches measurement data. The most commonly used circuit
for the electrical voice coil impedance is serial connection of resistor RE, inductor LE and parallel
connection of resistor R2 and inductor L2, as shown in Fig. 5.1. It has been proven as useful model in
many simulations. LIMP estimate value of LE, R2 and L2 as values that give the least sum of squared
differences of the model impedance and a measured impedance over all frequencies.
The voice coil resistance RE should be measured with a DC ohmmeter.
28
LIMP User Manual
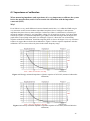
5.2 Estimation of Thiele-Small parameters
It is easy to estimate Thiele-Small parameters if we have measured data for the loudspeaker impedance.
At low frequencies the influence of a voice coil inductance and eddy currents is small and an
expression for the loudspeaker input impedance has the following form:
Bl
2
Z RE
RMS
sS
2
QMS
1 sTS / QT s 2Ts
RE
2
s
1 sTS / QMS s 2Ts
S2 S s 2
QMS
where s = j, Ts = 1/s.
The impedance has maximum value at the resonance frequency:
Z max Z S RE QES / QT RE RES
because QES>QT.
Figure 5.2 Typical impedance curve of a loudspeaker that is mounted in a free air
At frequencies f1 and f2, (where f1<fS<f2,
f1 f2 = fS2) impedance values are of equal magnitude;
Z j1 Z j2 r1RE , if
12 S 2
If we substitute this expression in the impedance equation, we get
Z j1, 2 r1 RE RE
2
2
2
r0 QMS 1 2 / S
.
2
1 QMS 1 2 / S
2
2
2
From this equation we get the mechanical Q-factor:
29
LIMP User Manual
QMS
fs
f 2 f1
r0 r1
2
r1 1
2
2
Now we can define a step-by-step procedure for the measurement of Q factors:
1. Measure a voice coil resistance RE with a dc ohm-meter
2. From impedance curve find fS and Zmax . Define ro=Zmax/RE.
3. Choose some impedance magnitude RE<|Z1|<Zmax and find both frequencies (f1 and f2) where
Z = Z1. Define r1=Z1/RE.
4. Calculate QMS (from the above equation),
5. Calculate QES using the equation QES=QMS / (ro-1).
6. Calculate QT using the equation QT=QESQMS / (QES+QMS).
5.3 Estimation of physical loudspeaker parameters
Two methods are used [7] for the estimation of physical loudspeaker parameters (MMS, CMS and RMS);
1. Added mass method,
2. Closed box method.
Both methods are implemented in the LIMP.
5.3.1 Added Mass Method
In this method, we first measure the impedance curve and estimate Thiele-Small parameters fS, QMS
and QES, for the loudspeaker mounted in a free air. Then we put an additional mass (Madded) on the
membrane, measure impedance curve and estimate the shifted resonance frequency fM and electrical
Q-factor QEM. From equations for QEM and QES we get:
M MS
M added
f S QEM
1
f M QES
When we know MMS and fS, it is easy to get the mechanical compliance CMS, resistance RMS and force
factor Bl. By using equations that are defined in Table 5.1 we get
CMS
1
M MSS
2
,
VAS 0 c 2 S 2CMS ,
Bl
S M MS RE
QES
,
RMS
S M MS
QMS
30
LIMP User Manual
5.3.2 Closed Box Method
In this method we first measure the impedance curve and estimate Thiele-Small parameters fS, QMS
and QES, for the loudspeaker mounted in a free air. Then we mount the loudspeaker in a closed box, of
known volume VB, measure impedance curve and estimate Thiele-Small parameters fC, QMC, QEC .
From these we find
VAS VB (
f C QEC
1)
f S QES
Then, by using equations that are defined in Table 5.1, we get
CMS
S M MS RE
1
VAS
M
, M MS
, Bl
, RMS S MS
2
2 2
QES
QMS
0c S
CMSS
5.4 Automatic estimation of physical and dynamical loudspeaker
parameters
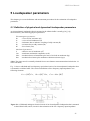
LIMP procedures for the estimation of loudspeaker parameters are as follows.
To estimate Q-factors of a loudspeaker we need:
1. measured impedance data,
2. measured voice coil dc resistance (in ohms),
3. estimated membrane diameter in cm (cone diameter measurement that includes 1/3 of the
surround).
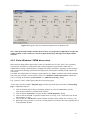
By clicking the menu Analyze->Loudspeaker parameters – Added mass method, we get the
'Loudspeaker Parameters - Added Mass Method ' dialog box, shown in Fig. 5.2.
In this dialog box, we enter values for Voice coil resistance and Membrane diameter. Press on
button ‘Calculate’ gets the report shown in the left edit box. This report can be pasted to the clipboard
by pressing the button ‘Copy’.
31
LIMP User Manual
Figure 5.2 Dialog box for the estimation of loudspeaker Q-factors
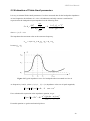
5.4.1 Added Mass Method
To estimate all physical and dynamical loudspeaker parameters we must make two impedance
measurements of the loudspeaker in a free air. In one of the two measurements, the membrane must
be loaded with an additional mass. That is what we need:
1.
2.
3.
4.
5.
6.
measured impedance data,
impedance data measured with an additional mass on the membrane (as in Fig. 5.3),
one of curves (1 or 2) must be set as an overlay graph,
measured additional mass - in grams,
measured the voice coil dc resistance - in ohms,
diameter of the membrane - in cm (cone diameter that includes 1/3 of the surround),
Figure 5.3 Impedance curves (the one with lower resonance frequency is obtained by adding mass to
the membrane)
32
LIMP User Manual
Then we activate the menu Analyze->Loudspeaker parameters – Added mass method to get the
'Loudspeaker Parameters' dialog box, shown in Fig. 5.4.
Figure 5.4 Dialog box for the estimation of loudspeaker parameters
Finally, we enter values for Voice coil resistance, Membrane diameter and Added mass. Press on
the button 'Calculate' gets the report shown in the left edit box. This report can be pasted to the
clipboard by pressing the button 'Copy'.
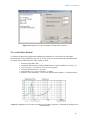
5.4.2 Closed Box Method
To estimate all loudspeaker parameters we must have two impedance measurements. In one of
measurements the loudspeaker must be mounted in a closed box of known volume. That is what we
need:
1.
2.
3.
4.
5.
6.
measured impedance data,
impedance data measured with loudspeaker mounted in a closed box,
one of curves (1 or 2) must be set as an overlay graph (as in Fig. 5.5),
estimated value of box volume - in liters,
measured the voice coil dc resistance - in ohms,
diameter of the membrane - in cm (cone diameter that includes 1/3 of the surround),
33
LIMP User Manual
Figure 5.5 Impedance curve (the one with higher resonance frequency is obtained by mounting the
loudspeaker in a closed box)
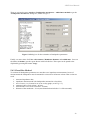
Then we activate the menu Analyze->Loudspeaker parameters – Closed box method to get the
'Loudspeaker parameters – Closed Box Method' dialog box, shown in Fig. 5.6.
Figure 5.6 Dialog for the estimation of loudspeaker parameters using Closed Box Method
Finally, we enter values for Voice coil resistance, Membrane diameter and Closed box
volume. Press on the button 'Calculate' gets the report shown in the left edit box. This report can be
pasted to the clipboard by pressing the button 'Copy'.
34
LIMP User Manual
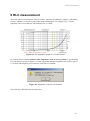
6 RLC measurement
The LIMP can be used to measure value of resistors, capacitors and inductors, simply by calculating
resistive, inductive or capacitive parts of the measured impedance. For example, Fig. 6.1 shows
impedance curves of an inductor with nominal value of 1.5mH.
Figure 6.1 The impedance graph of a 1.5mH inductor
By clicking menu command Analysis->RLC Impedance value at cursor position we get the dialog
box with report as shown on Figure 6.2. LIMP reports that measured impedance has resistive part of
0.776 ohms and imaginary part is inductive with value of 1.589mH.
Figure 6.2 Impedance of an air core inductor
The same way LIMP measures the capacitance.
35
LIMP User Manual
6.1 Importance of calibration
When measuring impedance and capacitance it is very important to calibrate the system
before the measurement, and it is best to make the calibration with the impedance
connected (DUT).
Why?
Even if there is a very small difference between channel sensitivities (i.e. 0.1dB) the LIMP can give
very erroneous result, because inductor impedance has phase close to 90 degree, and capacitor
impedance has phase close to minus 90 degree. In that case if there is a difference in sensitivity of
measured generator voltage V1 and impedance voltage V2 (if sensitivity of probe V2 is larger than
sensitivity of probe V1) estimated impedance gives phase values that are larger than 90 degree and
graph shows warped jump in the phase for 180 degree. Figure 6.3 shows the case of measuring
capacitor without the calibration. In half the range the phase is close to 90 degree. It is very erroneous
results as it suggest that we deal with an inductance. Figure 6.4 shows capacitor impedance after the
calibration. We see correct values for phase in the whole frequency range.
Figure 6.3 Wrongly estimated impedance of plastic capacitor 4.7uF/250V (measured without the
calibration)
Figure 6.4 Correctly estimated impedance of plastic capacitor 4.7uF/250V (measured after the
calibration)
36
LIMP User Manual
Not all LIMP users will have this problem. As explained before, the problem exists when probe for
impedance voltage V2 has higher sensitivity than it is the sensitivity of probe for generator voltage V1.
To circumvent this condition we can change probes sensitivity or we can simply exchange input
channels and also change the reference channel in the LIMP measurement setup.
Note:
To get good estimation of capacitance or inductance it is recommended to put cursor on frequency
where impedance magnitude is lower than 100 ohms. It assures measurement of impedance with 1%
tolerance. Why? The answer lies in fact that measured impedance is bypassed with probe or soundcard
input impedance that usually has value of 10k ohms.
A lot of professional audio sound systems (like RME Fireface, EMU 0404USB, Yamaha G046) have
unbalanced instrumentation inputs with input impedance in the range 470-1000kΩ. Using these
systems, a much better accuracy is possible.
Literature
[1]
Mateljan, I., "Signal Selection for the Room Acoustics Measurement", Proc. 1999 IEEE Workshop on
Applications of Signal Processing to Audio and Acoustics, New Paltz, New York, 1999.
[2]
Mateljan, I., Ugrinović K. ""The Comparison of Room Impulse Response Measuring Systems", Proc. AAA
2003, Portoroz, Slovenia, 2003.
[3]
Rife, D.D., Vanderkooy, J., "Transfer Function Measurement with Maximum-Length Sequences”, J. Audio
Eng. Soc., vol. 37, June 1989.
[4]
Bendat, J. S., and Piersol, A. G., "Engineering applications of Correlation and Spectral Analysis", Wiley,
New York, 1980.
[5] L.L. Beranek, Acoustics, 1986 Edition, Published for the Acoustical Society of America by the American
Institute of Physics.
[6] R.H. Small, "Direct-Radiator Loudspeaker System Analysis" JAES, Vol. 20, No. 5, pp 383-395, 1972 June.
[7] A.N. Thiele, "The Thiele-Small Parameters for Measuring, Specifying and Designing Loudspeakers",
PALA International Conference, Singapore, 2004.
[8] J. Vanderkooy, "A Model of Loudspeaker Driver Impedance Incorporating Eddy Currents in the Pole
Structure" JAES, Vol. 37, No. 3, pp 119-128, 1989 March.
[9] W. M. Leach, "Loudspeakers Voice Coil Inductance Losses: Circuit Models, Parameter Estimation and
Effect on Frequency Response", Journal of the Audio Engineering Society (JAES), vol. 50, June 2002.
[10] MLSSA SPO – Speaker Parameters Option – Reference Manual ver. 4WI, DRA Laboratories, Sarasota,
USA, 2001.
[11] Klippel Analyzer System – Linear Parameters Measurement, Klippel Gmbh, Dresden, Germany, 2003.
37