1
Shark User Guide
(Legacy)
Contents
Introduction 13
Overview 13
Philosophy 13
Organization of This Document 14
Getting Started with Shark 17
Main Window 17
Mini Configuration Editors 19
Perform Sampling 19
Session Windows and Files 20
Session Files 21
Session Information Sheet 22
Session Report 23
Advanced Settings Drawer 23
Shark Preferences 24
Time Profiling 29
Statistical Sampling 29
Taking a Time Profile 31
Profile Browser 32
Heavy View 36
Tree View 36
Profile Display Preferences 38
Chart View 40
Advanced Chart View Settings 43
Code Browser 45
Assembly Browser 48
Advanced Code Browser Settings 50
ISA Reference Window 54
Tips and Tricks 56
Example: Optimizing MPEG-2 using Time Profiles 58
Base 58
Vectorization 60
Retired Document | 2012-07-23 | Copyright © 2012 Apple Inc. All Rights Reserved.
2
Contents
System Tracing 63
Tracing Methodology 63
Basic Usage 64
Interpreting Sessions 66
Summary View In-depth 67
Trace View In-depth 73
Timeline View In-depth 77
Sign Posts 90
Tips and Tricks 93
Other Profiling and Tracing Techniques 97
Time Profile (All Thread States) 97
Malloc Trace 101
Using a Malloc Trace 102
Advanced Display Options 105
Static Analysis 107
Using Shark with Java Programs 108
Java Tracing Techniques 109
Linking Shark with the Java Virtual Machine 110
Event Counting and Profiling Overview 111
Timed Counters: The Performance Counter Spreadsheet 111
Event-Driven Counters: Correlating Events with Your Code 119
Advanced Profiling Control 122
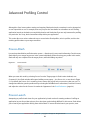
Process Attach 122
Process Launch 122
Batch Mode 125
Windowed Time Facility (WTF) 125
WTF with System Trace 127
Unresponsive Application Measurements 128
Command Line Shark 129
Basic Methodology 130
Common Options 131
Target Selection 132
Reports 133
Custom Configurations 133
More Information 134
Interprocess Remote Control 134
Programmatic Control 134
Command Line Remote Control 137
Retired Document | 2012-07-23 | Copyright © 2012 Apple Inc. All Rights Reserved.
3
Contents
Network/iPhone Profiling 138
Using Shared Profiling Mode 141
Mac OS X Firewall Considerations 143
Advanced Session Management and Data Mining 145
Automatic Symbolication Troubleshooting 145
Symbol Lookup 145
Debugging Information 146
Manual Session Symbolication 146
Managing Sessions 150
Comparing Sessions 150
Merging Sessions 151
Data Mining 151
Callstack Data Mining 152
Perf Count Data Mining 157
Example: Using Data Mining with a Time Profile 158
A Performance Problem... 158
Taking Samples 160
High Level Analysis 162
Analysis Via Source Navigation 163
Introduction To Focusing 168
Dig Deeper by Charging Costs 173
Example: Graphical Analysis using Chart View with a Malloc Trace 176
Taking Samples 176
Graphical Analysis of a Malloc Trace 179
Custom Configurations 183
The Config Editor 184
Simple Timed Samples and Counters Config Editor 186
Malloc Data Source PlugIn Editor 189
Static Analysis Data Source PlugIn Editor 190
Java Trace Data Source PlugIn Editor 191
Sampler Data Source PlugIn Editor 192
System Trace Data Source PlugIn Editor 193
All Thread States Data Source PlugIn Editor 194
Analysis and Viewer PlugIn Summary 195
Counter Spreadsheet Analysis PlugIn Editor 196
Using the Editor 196
Spreadsheet Configuration Example 199
Retired Document | 2012-07-23 | Copyright © 2012 Apple Inc. All Rights Reserved.
4
Contents
Hardware Counter Configuration 202
Configuring the Sampling Technique: The Sampling Tab 202
Common Elements in Performance Counter Configuration Tabs 206
Counter Control 206
Privilege Level Filtering 207
Process Marking 207
MacOS X OS-Level Counters Configuration 208
Intel CPU Performance Counter Configuration 209
PowerPC G3/G4/G4+ CPU Performance Counter Configuration 211
PowerPC G5 (970) Performance Counter Configuration 213
PowerPC North Bridge Counter Configuration 221
U1.5/U2 North Bridges 222
U3 North Bridge 223
U4 (Kodiak) North Bridge 226
ARM11 CPU Performance Counter Configuration 229
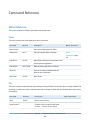
Command Reference 230
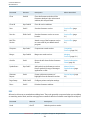
Menu Reference 230
Shark 230
File 230
Edit 231
Format 233
Config 233
Sampling 234
Data Mining 235
Window 236
Help 236
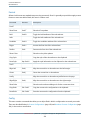
Alphabetical Reference 236
Miscellaneous Topics 242
Code Analysis with the G5 (PPC970) Model 242
Supervisor Space Sampling Guidelines 243
Intel Core Performance Counter Event List 246
Intel Core 2 Performance Counter Event List 252
PPC 750 (G3) Performance Counter Event List 263
PPC 7400 (G4) Performance Counter Event List 265
Retired Document | 2012-07-23 | Copyright © 2012 Apple Inc. All Rights Reserved.
5
Contents
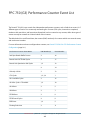
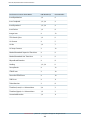
PPC 7450 (G4+) Performance Counter Event List 271
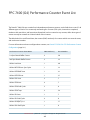
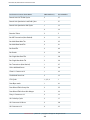
PPC 970 (G5) Performance Counter Event List 282
UniNorth-2 (U1.5/2) Performance Counter Event List 316
UniNorth-3 (U3) Performance Counter Event List 319
Kodiak (U4) Performance Counter Event List 323
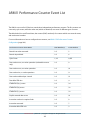
ARM11 Performance Counter Event List 327
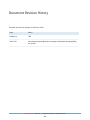
Document Revision History 329
Swift 12
Retired Document | 2012-07-23 | Copyright © 2012 Apple Inc. All Rights Reserved.
6
Figures, Tables, and Listings
Getting Started with Shark 17
Figure 1-1
Figure 1-2
Figure 1-3
Figure 1-4
Figure 1-5
Figure 1-6
Figure 1-7
Figure 1-8
Figure 1-9
Main Window 17
Process Target 18
Mini Configuration Editor 19
Session Inspector Panel 22
Sample Window with Advanced Settings Drawer visible at right 24
Shark Preferences — Appearance 25
Shark Preferences — Sampling 26
Shark Preferences — Sessions 27
Shark Preferences — Search Paths 28
Time Profiling 29
Figure 2-1
Figure 2-2
Figure 2-3
Figure 2-4
Figure 2-5
Figure 2-6
Figure 2-7
Figure 2-8
Figure 2-9
Figure 2-10
Figure 2-11
Figure 2-12
Figure 2-13
Figure 2-14
Figure 2-15
Figure 2-16
Figure 2-17
Figure 2-18
Figure 2-19
Figure 2-20
Figure 2-21
Table 2-1
Execution Before Sampling 30
Sampling Results 30
Time Profile mini-configuration editor 32
The Profile Browser 33
Tuning Advice 34
Callstack Table 35
Heavy Profile View Detail 36
Tree Profile View 37
Profile Analysis Preferences 38
Chart View 40
Advanced Settings for the Chart View 44
Code Browser 45
Hot Spot Scrollbar 47
Assembly Browser 50
Advanced Settings for the Code Browser 53
x86 Asm Browser Advanced Settings 54
ARM Asm Browser Advanced Settings 54
ISA Reference Window 55
Original Time Profile, with Tuning Advice 59
Code Browser with Vectorization Hint 61
Time Profile after Vectorizing IDCT 61
MPEG-2 Performance Improvement 61
Retired Document | 2012-07-23 | Copyright © 2012 Apple Inc. All Rights Reserved.
7
Figures, Tables, and Listings
System Tracing 63
Figure 3-1
Figure 3-2
Figure 3-3
Figure 3-4
Figure 3-5
Figure 3-6
Figure 3-7
Figure 3-8
Figure 3-9
Figure 3-10
Figure 3-11
Figure 3-12
Figure 3-13
Figure 3-14
Figure 3-15
Figure 3-16
Figure 3-17
Figure 3-18
Figure 3-19
Figure 3-20
Listing 3-1
Listing 3-2
Listing 3-3
Time Profile vs. System Trace Comparison 64
System Trace Mini Config Editor 65
Summary View 67
Summary View: Scheduler 68
Summary View: System Calls 69
Summary View: VM Faults 71
Summary View Advanced Settings Drawer 72
Trace View: Scheduler 74
Trace View: System Calls 75
Trace View: VM Faults 77
Timeline View 78
Timeline View: Thread Run Intervals 79
Thread Run Interval Inspector 79
Timeline View: System Calls 81
System Call Inspector 82
Timeline View: VM Faults 83
VM Fault Inspector 84
Interrupt Inspector 85
Sign Post Inspector 86
Timeline View Advanced Settings Drawer 89
~/Library/Application Support/Shark/KDebugCodes/myFirstSignPosts 90
signPostExample.c 92
testKernelSignPost.c 92
Other Profiling and Tracing Techniques 97
Figure 4-1
Figure 4-2
Figure 4-3
Figure 4-4
Figure 4-5
Figure 4-6
Figure 4-7
Figure 4-8
Figure 4-9
Figure 4-10
Figure 4-11
Figure 4-12
Figure 4-13
Time Profile (All Thread States) mini configuration editor 98
Time Profile (All Thread States) session, heavy view 99
Time Profile (All Thread States) session, tree view 100
Malloc Trace mini configuration editor 102
Malloc Trace session, profile browser 103
Malloc Trace session, chart view 104
Enabling Malloc Trace Advanced Options 105
Additional Malloc Trace Charts 106
Static Analysis mini configuration editor 108
How Shark-for-Java differs from regular Shark configurations 109
Performance Counter Spreadsheet 114
Counters Menu 115
Performance Counter Spreadsheet: Advanced Settings 116
Retired Document | 2012-07-23 | Copyright © 2012 Apple Inc. All Rights Reserved.
8
Figures, Tables, and Listings
Figure 4-14
Chart View with additional timed counter graphs 121
Advanced Profiling Control 122
Figure 5-1
Figure 5-2
Figure 5-3
Figure 5-4
Figure 5-5
Figure 5-6
Figure 5-7
Figure 5-8
Figure 5-9
Figure 5-10
Figure 5-11
Figure 5-12
Listing 5-1
Listing 5-2
Process Attach 122
Launch Process Panel 123
Batch Mode 125
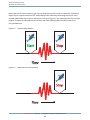
Normal Profiling Workflow 126
Windowed Time Facility Workflow 126
The Windowed Time Facility Timeline 128
Unresponsive Application Triggering 129
Samples Taken for Towers of Hanoi N=10..20 137
Network/iPhone Manager 139
Command Line Shark in Network Profiling Mode 142
Sharing Firewall Warning Dialog 143
Firewall Sharing Preferences, while adding a new port range for Shark 144
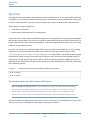
Towers of Hanoi Source Code 135
Instrumented Towers of Hanoi 135
Advanced Session Management and Data Mining 145
Figure 6-1
Figure 6-2
Figure 6-3
Figure 6-4
Figure 6-5
Figure 6-6
Figure 6-7
Figure 6-8
Figure 6-9
Figure 6-10
Figure 6-11
Figure 6-12
Figure 6-13
Figure 6-14
Figure 6-15
Figure 6-16
Figure 6-17
Figure 6-18
Figure 6-19
Figure 6-20
Figure 6-21
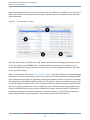
Session Inspector: Symbols 147
Symbolication Dialog 148
Before Symbolication 149
After Symbolication 150
Example Callstacks 153
Heavy View 153
Tree View 154
Data Mining Advanced Settings 155
Contextual Data Mining Menu 157
Perf Count Data Mining Palette 158
Example Shapes 159
Example Shapes, Replicated 160
Sampling a Specific Process 161
Default Profile View 161
Navigation Via the Call-Stack Pane 163
Navigation Via the Call-Stack Pane with Tree View 163
Source View: SKTGraphicView selectAll 164
Source View: NSObject 165
Source View: SKTGraphicView selectGraphic 166
Source View: SKTGraphicView invalidateGraphic 167
Tree view before focusing 168
Retired Document | 2012-07-23 | Copyright © 2012 Apple Inc. All Rights Reserved.
9
Figures, Tables, and Listings
Figure 6-22
Figure 6-23
Figure 6-24
Figure 6-25
Figure 6-26
Figure 6-27
Figure 6-28
Figure 6-29
Figure 6-30
Figure 6-31
Figure 6-32
Figure 6-33
Figure 6-34
Figure 6-35
Figure 6-36
Data Mining Contextual Menu 168
After Focus Symbol -[SKTGraphicView drawRect:] 169
After focus and expansion 170
Source View: SKTGraphic drawInView:isSelected: 171
Source View: SKGraphic drawHandlesInView: 172
Source View: SKGraphic drawHandleAtPoint:inView: 173
Heavy View of Focused Sketch 174
Expanded Heavy View of Focused Sketch 174
After Charge Library libRIP.A.dylib 175
After Flatten Library 175
Malloc Trace Main Window 177
Result of Malloc Sampling 178
Chart View 179
Place to Select 180
Graph View with Call-Stack Pane 182
Custom Configurations 183
Figure 7-1
Figure 7-2
Figure 7-3
Figure 7-4
Figure 7-5
Figure 7-6
Figure 7-7
Figure 7-8
Figure 7-9
Figure 7-10
Figure 7-11
Figure 7-12
Figure 7-13
Figure 7-14
Main Configuration Menu 183
Config Editor 186
Simple Timed Samples and Counters Data Source - Sampling Tab 187
Simple Timed Samples and Counters Data Source - Counter Settings 188
Malloc Data Source - Sampling Settings 189
Static Analysis Data Source - Settings 190
Java Trace Data Source - Sampling Settings 191
Sampler Data Source - Settings 192
System Trace Data Source - Settings 193
All Thread States Data Source - Settings 194
Counter Spreadsheet Analysis 196
Choosing a counter-based starting configuration 199
Enabling two performance counters 200
Performance Spreadsheet: Shortcut Equation 201
Hardware Counter Configuration 202
Figure 8-1
Figure 8-2
Figure 8-3
Figure 8-4
Figure 8-5
Figure 8-6
Figure 8-7
Timed Samples & Counters Data Source - Advanced Sampling Tab 203
A typical set of performance counter controls 206
Process Marker 208
MacOS X Performance Counters Configuration 209
Intel Core 2 Configuration Tab 211
PowerPC G4+ Configuration Tab (G3 and G4 are similar) 213
PowerPC 970 Processor Performance Counters Configuration 215
Retired Document | 2012-07-23 | Copyright © 2012 Apple Inc. All Rights Reserved.
10
Figures, Tables, and Listings
Figure 8-8
Figure 8-9
Figure 8-10
Figure 8-11
Figure 8-12
Figure 8-13
Figure 8-14
Figure 8-15
PowerPC 970 IMC (IFU) Configuration Tab 217
PowerPC 970 IMC (IDU) Configuration Tab 221
U1.5/U2 Configuration Tab 223
U3 Memory Configuration Tab 225
U3 API Configuration Tab 226
U4 (Kodiak) Memory Configuration Tab 227
U4 (Kodiak) API Configuration Tab 228
ARM11 Counter Configuration Tab 229
Miscellaneous Topics 242
Figure B-1
Figure B-2
Figure B-3
PPC970 Resource Modeling 243
Timer Sampling in the Kernel 244
CPU PMI Sampling in the Kernel 245
Retired Document | 2012-07-23 | Copyright © 2012 Apple Inc. All Rights Reserved.
11
SwiftObjective-C
Retired Document | 2012-07-23 | Copyright © 2012 Apple Inc. All Rights Reserved.
12
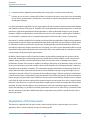
Introduction
Important: This document may not represent best practices for current development. Links to downloads
and other resources may no longer be valid.
Overview
Shark is a tool for performance understanding and optimization. Why is it called “Shark?” Performance tuning
requires a hunter’s mentality, and no animal is as pure in this quest as a shark. A shark is also an expert in his
field — one who uses all potential resources to achieve his goals. The name “Shark” embodies the spirit and
emotion you should have when tuning your code.
To help you analyze the performance of your code, Shark allows you to profile the entire system (kernel and
drivers as well as applications). At the simplest level, Shark profiles the system while your code is running to
see where time is being spent. It can also produce profiles of hardware and software performance events such
as cache misses, virtual memory activity, memory allocations, function calls, or instruction dependency stalls.
This information is an invaluable first step in your performance tuning effort so you can see which parts of
your code or the system are the bottlenecks.
In addition to showing you where time is being spent, Shark can give you advice on how to improve your
code. Shark is capable of identifying many common performance pitfalls and visually presents the costs of
these problems to you.
Philosophy
The first and most important step when optimizing your code is to determine what to optimize. In a program
of moderate complexity, there can be thousands of different code paths. Optimizing all of them is normally
impractical due to deadlines and limited programmer resources. There are also more subtle tradeoffs between
optimized code and portability and maintenance that limit candidates for optimization.
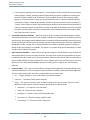
Here are a few general guidelines for finding a good candidate for optimization:
1.
It should be time-critical. This is generally any operation that is perceptibly slow; the user has to wait for
the computer to finish doing something before continuing. Optimizing functionality that is already faster
than the user can perceive is usually unnecessary.
Retired Document | 2012-07-23 | Copyright © 2012 Apple Inc. All Rights Reserved.
13
Introduction
Organization of This Document
2.
It must be relevant. Optimizing functionality that is rarely used is usually counter-productive.
3.
It shows up as a hot spot in a time profile. If there is no obvious hot spot in your code or you are spending
a lot of time in system libraries, performance is more likely to improve through high-level improvements
(architectural changes).
Low-level optimizations typically focus on a single segment of code and make it a better match to the hardware
and software systems it is being run on. Examples of low-level optimizations include using vector or cache hint
instructions. High-level optimizations include algorithmic or other architectural changes to your program.
Examples of high-level optimizations include data structure choice (for example, switching from a linked list
to a hash-table) or replacing calls to computationally expensive functions with a cache or lookup table.
Remember, it is critical to profile before investing your time and effort in optimization. Sadly, many programmers
invest prodigious amounts of effort optimizing what their intuition tells them is the performance-critical section
of code only to realize no performance improvement . Profiling quickly reveals that bottlenecks often lie far
from where programmers might assume they are. Using Shark, you can focus your optimization efforts on both
algorithmic changes and tuning performance-critical code. Often, even small changes to a critical piece of code
can yield large overall performance improvements.
By default, Shark creates a profile of execution behavior by periodically interrupting each processor in the
system and sampling the currently running process, thread, and instruction address as well as the function
callstack. Along with this contextual information, Shark can record the values of hardware and software
performance counters. Each counter is capable of counting a wide variety of performance events. In the case
of processor and memory controller counters, these include detailed, low-level information that is otherwise
impossible to know without a simulator. The overhead for sampling with Shark is extremely low because all
sample collection takes place in the kernel and is based on hardware interrupts. A typical sample incurs an
overhead on the order of 20µs. This overhead can be significantly larger if callstack recording is enabled and
a virtual memory fault is incurred while saving the callstack. Time profiles generated by Shark are statistical in
nature; they give a representative view of what was running on the system during a sampling session . Samples
can include all of the processes running on the system from both user and supervisor code, or samples can be
limited to a specific process or execution state. Shark’s sampling period can be an arbitrary time interval (timer
sampling). Shark also has the ability to use a performance event as the sampling trigger (event sampling).
Using event sampling, it is possible to associate performance events such as cache misses or instruction stalls
with the code that caused them. Additionally, Shark can generate exact profiles for specific function calls or
memory allocations.
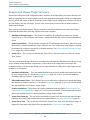
Organization of This Document
This manual is organized into four major sections, each consisting of two or three chapters, plus several
appendices. Here is a brief “roadmap” to help you orient yourself:
Retired Document | 2012-07-23 | Copyright © 2012 Apple Inc. All Rights Reserved.
14
Introduction
Organization of This Document
●
Getting Started with Shark— This introduction and Getting Started with Shark (page 17) are designed
to give you an overall introduction to Shark. After covering some basic philosophy here, Getting Started
with Shark (page 17) describes basic ways to use Shark to sample your applications, features of the Session
windows that open after you sample your applications, and the use of Shark’s global preferences.
●
Profiling Configurations— Three chapters discuss Shark’s default Configurations — its methods of
collecting samples from your system or applications — and presentation of the sampled results in Session
windows. These chapters are probably the most important ones. Time Profiling (page 29) discusses Time
Profiling , the most frequently used configuration, which gives a statistical profile of processor utilization.
System Tracing , discussed in System Tracing (page 63), provides an exact trace of user-kernel transitions,
and is useful both to debug interactions between your program and the underlying system and to provide
a “microscope” to examine multithreaded programming issues in detail. After the complete chapters
devoted to these two configurations, the remainder are covered in Other Profiling and Tracing
Techniques (page 97). Time Profile (All Thread States) is a variant of Time Profile that also samples blocked
threads, and as a result is a good way to get an overview of locking behavior in multithreaded applications.
Malloc Trace allows you to examine memory allocation and deallocation activity in detail. Shark can apply
Static Analysis to your application in order to quickly examine rarely-traversed code paths. Equivalents
for Time Profile , Malloc Trace , and an exact Call Trace , all customized for use with Java applications, are
also available. Finally, the chapter gives an overview of Shark’s extensive performance counter recording
and analysis capabilities.
●
Advanced Techniques— Shark’s basic techniques for sampling and analysis are sufficient for most purposes,
but with complex applications you may need more sophisticated techniques. Advanced Profiling
Control (page 122) covers ways to start and stop Shark’s sampling very precisely, allowing you to carefully
control what is sampled, in advance. You can also learn how to control Shark remotely from other machines
or even to control Shark running on iOS devices attached to your machine in this chapter. Advanced
Session Management and Data Mining (page 145) looks at Shark’s symbol management and data mining
techniques, which are ways to very precisely select subsets of your samples for examination after they are
taken.
●
Custom Configurations— Shark is not just limited to its default configurations. If you want to save your
own custom settings for a configuration or create a new one from scratch, then you will want to check
out chapters Custom Configurations (page 183) and Hardware Counter Configuration (page 202). The first
describes how you may make adjustments to the existing configurations, while the latter covers the many
options relating to the use of hardware performance counters. Because there are so many different possible
combinations of performance counters, only a limited number of the possibilities are covered by the
default configurations. Hence, this is likely to be the main area where the use of custom configurations
will be necessary for typical Shark users.
●
Appendices— The first appendix, Command Reference (page 230), provides a brief reference to Shark’s
menu commands. The second, Miscellaneous Topics (page 242), describes several minor, miscellaneous
options that do not really fit in anywhere else or are of interest only to a small minority of Shark users. The
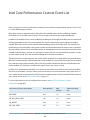
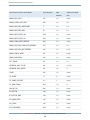
remainder of the appendices (Intel Core Performance Counter Event List (page 246), Intel Core 2 Performance
Retired Document | 2012-07-23 | Copyright © 2012 Apple Inc. All Rights Reserved.
15
Introduction
Organization of This Document
Counter Event List (page 252), PPC 750 (G3) Performance Counter Event List (page 263), PPC 7400 (G4)
Performance Counter Event List (page 265), PPC 7450 (G4+) Performance Counter Event List (page 271),
PPC 970 (G5) Performance Counter Event List (page 282), UniNorth-2 (U1.5/2) Performance Counter Event
List (page 316), UniNorth-3 (U3) Performance Counter Event List (page 319), and Kodiak (U4) Performance
Counter Event List (page 323)) provide a reference for the performance counters that you can measure
with Shark.
Retired Document | 2012-07-23 | Copyright © 2012 Apple Inc. All Rights Reserved.
16
Getting Started with Shark
Starting to use Shark is a relatively simple process. You only need to choose one or two items from menus and
press a big “Start” button in order to start sampling your applications. This chapter describes these basic steps
and a few other general Shark features, such as its preferences.
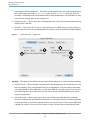
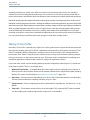
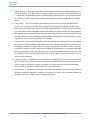
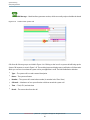
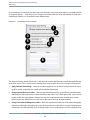
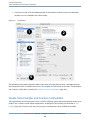
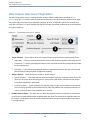
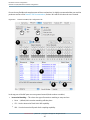
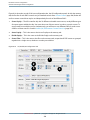
Main Window
Figure 1-1
Main Window
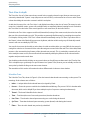
After launching Shark, you will be presented with Shark’s main window, as illustrated in Figure 1-1. The default
sampling configuration is timer-based sampling (Time Profile ) of everything running on the system. By default,
the Time Profile configuration uses a 1 ms timer as the trigger for sampling and will record for 30 seconds
(30,000 samples per processor). Opening the Sampling Configuration menu (#1) allows you to select from
various built-in profiling configurations. Here is a list:
●
Time Profile— This configuration, the default, performs timer-based sampling, interrupting your system
after a regular interval and taking a sample of what is executing. It is a great starting point, as it allows
you to very quickly see what code in your application is actually executing most frequently. Knowing this
is the first step to successfully optimizing CPU-bound applications. See Time Profiling (page 29) for more
information.
●
System Trace— This configuration records an exact trace of calls into the Mac OS X kernel by your program,
and which threads are running. It is useful for examining your program’s interactions with Mac OS X and
for visualizing how your threads are interacting in multithreaded programs. System Trace is discussed in
depth in System Tracing (page 63).
●
Time Profile (All Thread States)— This variation on time profiling also records the state of all blocked,
inactive threads. As a result, it’s a great way to see how much and why your threads are blocked. This is
quite helpful in the development of multithreaded programs that do a lot of synchronization. This
configuration is described in Time Profile (All Thread States) (page 97).
Retired Document | 2012-07-23 | Copyright © 2012 Apple Inc. All Rights Reserved.
17
Getting Started with Shark
Main Window
●
Malloc Trace— If your program allocates and deallocates a lot of memory, performance can suffer and
the odds of accidental memory leaks increase. Shark can help you find and analyze these allocations.
Malloc Trace (page 101) talks about this more.
●
Static Analysis— Shark can provide some basic optimization hints without actually running code. See
Static Analysis (page 107) for more information.
●
Java Profiling— Because Java programs run within the Java Virtual Machine (JVM), normally sampling
them with Shark produces little useful information. However, Shark also includes several configurations
that simulate the normal Time Profile , Malloc Trace , and even an exact trace of method calls, but while
collecting information about what the JVM is executing instead of the native machine. A full description
of these options and how to attach Shark to your Java programs is given in Using Shark with Java
Programs (page 108).
●
Hardware Measurements— The L2 cache miss and Processor Bandwidth (x86 systems) or Memory
Bandwidth (PowerPC systems) configurations measure memory system activity using counters built into
the hardware. They are a great way to see how your program is being slowed because of poor cache
memory use. See Event Counting and Profiling Overview (page 111) for an overview of Shark’s counter
measurement capabilities.
These built-in configurations are adequate for sampling most applications. After you have used Shark for
awhile, however, you may decide that you would like to sample something in your application that is not
covered by the built-in collection of options. In particular, you may want to perform hardware measurements
using counters that are not used by the default hardware measurement configurations. The process for building
your own configurations is described in Custom Configurations (page 183). This process is complex enough
that you should probably familiarize yourself with Shark before attempting the creation of configurations.
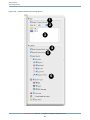
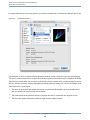
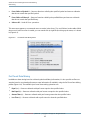
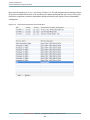
By default, Shark samples your entire system, as indicated by the “Everything” item selected for you in the
Target pop-up menu (#2). Popping open this menu allows you to select a specific process or file (Figure 1-2).
You may also choose different targets using the keyboard: Command-1 for everything, Command-2 for an
executing process, and Command-3 for a file. For a Time Profile , it is unnecessary to select a specific target,
but others like Malloc Trace and Static Analysis require you to target a specific process or file. If you select the
“Process” target, you can also choose to launch a new process. See Process Attach (page 122) and Process
Launch (page 122) for full instructions on the process attaching and launching target selection techniques.
Figure 1-2
Process Target
Retired Document | 2012-07-23 | Copyright © 2012 Apple Inc. All Rights Reserved.
18
Getting Started with Shark
Perform Sampling
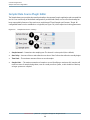
Mini Configuration Editors
Each configuration typically has a few parameters that are frequently modified. Shark allows you to edit these
easily using the mini configuration editors associated with each configuration. You can enable mini configuration
editors by selecting the Config Show Mini Config Editor menu item (Command-Shift-C ). Most mini configuration
editors are similar to the one depicted in Shark Preferences, but all have small configuration-specific variations.
The selection of controls available in each min configuration editor are described in the chapters associated
with each type of configuration.
Figure 1-3
Mini Configuration Editor
Perform Sampling
After you choose what you would like to sample (or trace, with some configurations) and how, then actually
using Shark to sample your program is extremely simple. There are two main ways to start sampling:
1.
Click the Start button (#3 in Main Window).
2.
Press the current “Hot Key” (Option-Esc , by default).
Shark will emit a brief tone and the Shark icon in the dock will turn bright red to let you know that Shark is
now actively sampling. At this point, you should exercise your program appropriately to trigger the execution
of code that you want to measure. Sometimes this may require no active input on your part, but if you are
measuring something like user interface performance then you may need to manually perform several steps
while Shark samples.
Retired Document | 2012-07-23 | Copyright © 2012 Apple Inc. All Rights Reserved.
19
Getting Started with Shark
Session Windows and Files
Note: Occasionally you may notice a small delay while Shark allocates the sample buffers it needs
to record data, due to time spent in the Mac OS X virtual memory system performing the necessary
memory allocations. If this delay is long enough to cause you to miss the key events that you wanted
to measure, you should just stop Shark and try to repeat your experiment, since memory allocation
delays are usually much shorter for second and subsequent repeated Shark invocations.
After you have finished sampling the interesting portion of your program, you will need to stop Shark’s sampling.
Again, this is a simple process. You will typically use one of the following three options:
1.
Click the Stop button, which is what the “Start” button becomes once sampling has started.
2.
Press the current “Hot Key” (Option-Esc , by default).
3.
Wait for the maximum profiling time or number of samples specified by the configuration to pass. When
either of these conditions is met, Shark will automatically stop.
After Shark stops sampling, you will see a progress bar appear at the bottom of the main Shark window as
samples are processed and symbols are gathered. During processing, Shark sorts samples both by process and
by thread. Shark also looks up the symbols corresponding to each sampled address and caches any other
information that may be needed for later browsing of your program. All of this work is done only after sampling
is complete, in order to minimize the system overhead of Shark during sampling.
If you would like to use the “Hot Key” technique, but your application already uses Option-Esc for another
purpose, then you should reassign Shark’s “Hot Key” to another key combination. See Shark Preferences (page
24) for information on how to do this.
In addition to the basic timing options shown here, Shark also offers many other techniques for very fine
selection of the time used for Shark’s sampling, should you need more control. See Advanced Profiling
Control (page 122) if you find that the basic start/stop operation described here is not enough to focus Shark’s
sampling on the parts of your application that you would like to measure.
Session Windows and Files
Once you’ve recorded samples or a trace, Shark will open up a new session window to display the results.
Depending upon the configuration you chose, the appearance of this window will vary. See the chapter on
the particular configuration that you chose for more information (in Time Profiling (page 29), System
Tracing (page 63), and Other Profiling and Tracing Techniques (page 97)). Nevertheless, all session windows
have some basic features in common.
Retired Document | 2012-07-23 | Copyright © 2012 Apple Inc. All Rights Reserved.
20
Getting Started with Shark
Session Windows and Files
Shark allows you to work with multiple sampling sessions at a time, displaying a separate window for each
session. This is useful for comparing two or more sampling sessions side-by-side. The currently displayed session
can be changed using the Window menu. By default, sessions are listed in the order they are loaded or created.
In addition, each new session is given a unique name, in the format of “Session # - Configuration.”
Session Files
Shark makes it easy to save any sessions to .mshark “session” files at any time. There are several reasons why
you might want to do this: for later analysis, to keep as archives to track performance regressions, or to share
your results. These files are particularly convenient when attached to performance bug reports, as a session
file that records samples of slow code offers a simple and effective way to document the performance problem.
Each session file contains all of the necessary data (symbols, source, and — optionally — even program text,
see Shark Preferences (page 24)) needed to display and explore the session on any computer running Mac
OS X, independent of that system’s hardware or software configuration. Because of this, you can freely share
your session files with any other coworkers using Shark, without regard to what type of Mac they might have.
A session is saved to disk as a single, compressed file when you use the File Save menu item (Command-S ).
The first time you save a session, you will need to name the new session. This name will be used to name the
new session file and to replace the “Session #” part of the original window name. If you want to save the session
again at any point in time using a new name, then just choose the File Save as... menu item (Command-Shift-S ).
You may even choose to have Shark email your session file to someone else at any time, using the File Mail
This Session menu item. When chosen, this will send your default email program a remote message asking it
to start up a new email message for sending. Subsequently, Shark will automatically attach a session file of the
current session (saving it first, if necessary). You may then finish composing your message and send it using
the normal procedures for your email program.
Retired Document | 2012-07-23 | Copyright © 2012 Apple Inc. All Rights Reserved.
21
Getting Started with Shark
Session Windows and Files
Note: Shark’s session files have slowly evolved and changed over time, as new features have been
added that made it difficult to keep backwards-compatible file formats. The current file format
(.mshark) is only compatible with Shark 4.6 and later. Shark 4.0–4.5 use a transitional file format
(also called.mshark) that can still be read by more recent versions of Shark. However, users of these
versions of Shark who need to read Shark 4.6 or later files will need to upgrade. Old .shark files
from Shark 3 and before and the .sample files created by the Sampler application or command-line
tool can only be read by Shark 4.3 or earlier.
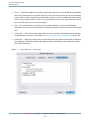
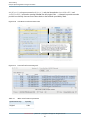
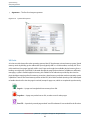
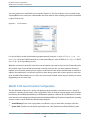
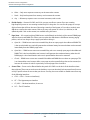
Session Information Sheet
You can see many underlying details about the session by using File Get Info (Command-I ). This will drop down
the sheet shown in Session Report over the top of your session window.
Figure 1-4
Session Inspector Panel
This panel contains four tabbed panes:
●
Summary— Because Shark records samples at a very low level, the configuration of the sampled system
can often be critical when interpreting results. This pane, shown in Session Report, displays many facts
about the system setup when the session was originally recorded. This is very useful if you send a session
file to another person, as they can call up your system’s configuration with a single key combination. Four
different types of information are presented in the four quadrants of the view:
Retired Document | 2012-07-23 | Copyright © 2012 Apple Inc. All Rights Reserved.
22
Getting Started with Shark
Session Windows and Files
1.
Basic Statistics — This section of the pane contains basic information about the system at the time
the session was recorded. The system’s name, the current user, date, and time are available here.
2.
Software Configuration — This shows version information about Shark and the underlying Mac OS X
and frameworks.
3.
Sampling Configuration — This shows a text description of the configuration used for recording the
session. This is the same sort of summary description that you can see in the upper right corner of
the custom configuration window (as shown in The Config Editor (page 184)).
4.
Hardware Configuration — This shows key characteristics about the machine used for sampling and
its underlying hardware components: processor, main memory, memory controller, I/O subsystem
controller, and such.
●
Notes— This pane is just a text box. You can type any notes and messages that you want here, and they
will be saved with the session file. This is helpful when you would like to record some additional information
about how the session was recorded, making notes about insights gained by you during analysis, and the
like.
●
Symbols— Here you can see a list of all binaries (application binaries, dynamic libraries, and the like) that
were sampled during the session. It also provides controls for selecting and “symbolicating” (adding
symbols to) samples taken from those binaries. See Manual Session Symbolication (page 146) for instructions
on how to do this.
●
Plug Ins— This pane displays a list of the Shark PlugIns that were used to record, analyze, and view the
session. See Custom Configurations (page 183) for more information on these.
Session Report
At any time, you may open a window containing a brief text summary of your session’s findings by using the
File Generate Report... menu item (Command-J ). This report includes some information about what the
configuration was, the underlying system configuration, and a brief summary of the recorded samples. If you
need to give a quick overview of a session to someone who does not have Shark on their computer, then this
can be a useful command. Otherwise, it is probably easier just to send them your entire session file.
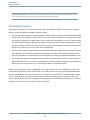
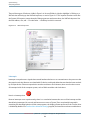
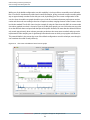
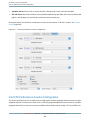
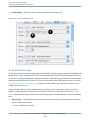
Advanced Settings Drawer
Most session windows in Shark have a variety of settings that can modify how the information in that window
is presented. For consistency, the controls for these settings are always presented in the Advanced Settings
Drawer , a drawer that can slide in and out of the right side of the session window by choosing the Window Show
Retired Document | 2012-07-23 | Copyright © 2012 Apple Inc. All Rights Reserved.
23
Getting Started with Shark
Shark Preferences
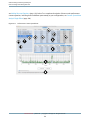
Advanced Settings menu item (Command-Shift-M ). An example is depicted below in Main Window. The controls
presented will vary depending upon the current session viewer visible in the window, and so instructions on
how to use these controls are provided in sections following the descriptions of the session viewers themselves.
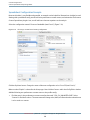
Figure 1-5
Sample Window with Advanced Settings Drawer visible at right
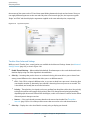
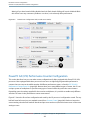
Shark Preferences
Shark’s global preferences are accessed from the Shark Preferences... menu item. This window allows you to
set some global options that Shark uses while recording and displaying all of your sessions. Shark’s preference
panel is divided into four tabbed panes:
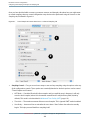
●
Appearance— The first tab lets you control the appearance of Shark’s main window (1–2) and session
windows (3–5).
1.
Sort Process Lists By — Choose whether you want the process menu in Shark’s main window to be
sorted by name or process ID here.
2.
Show Only Owned Processes — This option, selected by default, reduces clutter in the process menu
by removing root (mostly daemon) processes and any processes from other users, on a multi-user
system.
Retired Document | 2012-07-23 | Copyright © 2012 Apple Inc. All Rights Reserved.
24
Getting Started with Shark
Shark Preferences
3.
Alternating/Solid Table Background — For tabular session window views, such as the profile browsers
and code browsers described in Profile Browser (page 32) and Code Browser (page 45), Shark can
use either a solid background color behind the text or alternate between a color and white on every
row. Select the viewing option that you prefer here.
4.
Background Color — Choose either the solid background color or the color to alternate with white by
clicking on this color well.
5.
Grid Color — Choose the color to use as a grid between rows in tabular session views by clicking on
this color well. If it is the same as the background color, previous, then the grid will essentially disappear.
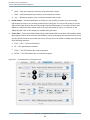
Figure 1-6
●
Shark Preferences — Appearance
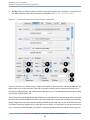
Sampling— The options in this tab let you vary some of Shark’s behaviors as it starts and stops sampling.
1.
Play Alert Sound — Choose whether or not you want to have Shark play an alert sound when you start
and stop sampling. This is on by default, but if you are sampling for a very short time or are testing
out something like an audio application, you may want Shark to stay quiet, instead. If you choose to
have Shark play these alert sounds, then you can choose any alert sound installed on your system
using the popup menu.
2.
Auto Hide/Unhide — When checked, this option causes Shark to automatically hide its windows
whenever sampling starts and unhide them afterwards. It is useful if you need to see another application
covering the entire screen during sampling. Because you cannot press the “Stop” button while Shark
is hidden, this option is of most use if you use the “hot key” chosen below to start and stop Shark.
Retired Document | 2012-07-23 | Copyright © 2012 Apple Inc. All Rights Reserved.
25
Getting Started with Shark
Shark Preferences
3.
Remain in Background — Shark normally brings itself to the front when sampling completes. This
means that it will be the main application while it analyzes samples and then displays a session
window. Generally, this is the desirable behavior, because most users want to examine their sampled
sessions immediately. However, if you want to quickly capture several sessions in a row, then this
option will force Shark to stay in the background while it processes samples. Because you cannot
press the “Stop” button without bringing Shark to the front first, this option is of most use if you use
the “hot key” chosen below to start and stop Shark.
4.
Hot Key Capture — The current “hot key” used to start Shark, as described in Perform Sampling (page
19), can be set here. Option-Esc is the default, because it is rarely used by other programs, but you
may want to use a different key if this collides with one of your own key combinations. Press the
Capture button and then press the new key combination immediately afterwards to change the
setting.
5.
Cache Options — Caching of Program Text , Source Files , and Exited Processes allows Shark to provide
useful information for short-lived processes after they complete, but may require more memory usage
and increase sample processing time. You can disable these features if your applications of interest
will not normally exit during sampling.
Figure 1-7
●
Shark Preferences — Sampling
Sessions— This tab contains some options about the saving of source files.
Retired Document | 2012-07-23 | Copyright © 2012 Apple Inc. All Rights Reserved.
26
Getting Started with Shark
Shark Preferences
1.
Ask About Unsaved Sessions — With Shark, you can optionally disable the usual behavior of asking if
you want to individually save each session file when closing it or quitting Shark. Some users tend to
examine their data right after sampling, and therefore will rarely need to save Shark session files. If
you tend to work this way, then you might find the default behavior annoying and wish to uncheck
this box.
2.
Embed Source Files — Shark allows you to optionally embed source information right into your sessions
when you save them, as discussed in Session Files (page 21), allowing anyone who opens the session
to see source code, even if the source files are not actually available on their system at the time. This
is usually very convenient, but may be problematic if you have a large amount of source code — since
the session file can become enormous — or if you may be sending the file to a person who does not
have permission to see all of the source. In these situations, you can choose not to include source
code. For your convenience, this preference lets you tell Shark to never embed source, to always
embed source, or to ask each time if you want to embed source (the default).
Figure 1-8
●
Shark Preferences — Sessions
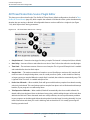
Search Paths— This tab lets you add (using the “+” button) or delete (using the “–” button) default
directories where Shark will search for various types of files when it needs them. Shark lets you specify
default paths for four different types of files:
Retired Document | 2012-07-23 | Copyright © 2012 Apple Inc. All Rights Reserved.
27
Getting Started with Shark
Shark Preferences
1.
Source — Shark will usually find source files automatically if they are not moved between compilation
and session viewing times. If you must move the source at all, however, then you will need to specify
a path to the new source location here so that Shark can find your source. Probably the most common
reason why you might need to use this is if you compile the source on one system and then execute
your code and examine your session on another.
2.
Kext — This tells Shark where to look for kernel extension binaries in order to find debugging
information for non-user code. By default, the standard system paths for kernel extensions are included
here.
3.
Symbol-Rich — Shark will use these paths when it looks for symbol-rich binary files during attempts
at Symbolication of sessions, as described in Automatic Symbolication Troubleshooting (page 145).
4.
UUID Server — Shark can use these paths to automatically look up symbol-rich binary files and libraries
by matching the UUID information in the stripped version of the binary to the symbol-rich versions
of the files located here.
Figure 1-9
Shark Preferences — Search Paths
Retired Document | 2012-07-23 | Copyright © 2012 Apple Inc. All Rights Reserved.
28
Time Profiling
The first and most frequently used Shark configuration is the Time Profile . This produces a statistical sampling
of the program’s or system’s execution by recording a new sample every time that a timer interrupt occurs, at
a user-specified frequency (1 KHz, for 1ms sampling intervals, by default). At each interrupt, Shark records a
few key facts about the state of each processor for later analysis: the process and thread ID of the executing
process, the program counter, and the callstack of the routine that was executing. From this sampled information,
Shark reconstructs exactly what code from which functions was executing as samples were taken.
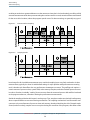
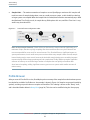
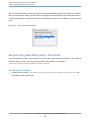
Statistical Sampling
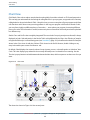
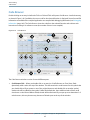
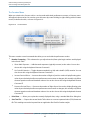
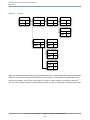
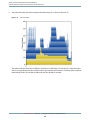
This sampling process provides an approximate view of what is executing on the system. Figure 2-1 shows the
worst case of an application with a sample interval greater than the lifespan of typical function calls, while
Figure 2-2 shows the corresponding statistical sample, after post processing. In the first interval (marked #1),
sampling correctly identifies long-running routines executing in the sample interval. However, when
encountering short functions, two effects are seen because execution time is attributed to functions only at
the granularity of the sampling rate:
●
As seen in the third sample (marked #2), short-lived function calls can be missed entirely, so they are
underrepresented in the samples.
●
In contrast, when brief functions occur right on the sample points, as illustrated in the seventh sample
(marked #3), they are recorded as taking an entire time quantum and hence overrepresented in the samples.
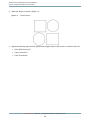
Luckily, over a large number of samples these errors average out in most cases, producing a collection of
samples that fairly accurately represent the actual time spent executing each function in the application. In
the example from Figure 2-1 and Figure 2-2, the rare occasions when the small subroutine bar() is measured
Retired Document | 2012-07-23 | Copyright © 2012 Apple Inc. All Rights Reserved.
29
Time Profiling
Statistical Sampling
as taking an entire time quantum balances out the numerous times that it is missed entirely, providing a fairly
accurate measurement of the time spent executing the routine overall. As a result, execution time measurements
for the most critical routines, where the program spends most of its time executing, are generally very good.
Figure 2-1
Execution Before Sampling
Figure 2-2
Sampling Results
In exchange for this inevitable measurement error, statistical sampling incurs very little overhead as it takes
measurements, typically less than 2% with default settings. A major problem with performance-measuring
tools is that the tool often affects the very performance it attempts to measure. The profiling tool requires a
certain amount of processor time, system RAM, cache memory footprint, and other limited system resources
in order to function. Inevitably, “stealing” these resources from the measured process adds artificial overhead
to the program under test, sometimes skewing the performance measurements.
Statistical sampling minimizes this impact in two key ways. First, samples are taken at a relatively low frequency
when compared with most event-monitoring mechanisms. The sampling mechanism's low intervention rate
consumes only a small amount of processor time and memory, thereby minimizing the risk of skewed results.
Second, and more subtly, samples can occur anytime during the execution of the program; side effects of the
Retired Document | 2012-07-23 | Copyright © 2012 Apple Inc. All Rights Reserved.
30
Time Profiling
Taking a Time Profile
sampling mechanism are spread out to affect most areas of measured execution more or less equally. In
contrast, most event counting-based mechanisms, such as function or basic block counting, record data at
preset code locations, and therefore distort performance more near the preset sample points than elsewhere.
Statistical sampling provides helpful information about what executes most frequently, down to the level of
individual assembly-language instructions, without the additional overhead required for an event-based profile
at the instruction level. After sampling has ended, Shark correlates samples with the original binary to determine
which assembly-language instructions or lines of original source code were executing when each interrupt
occurred. Shark then accumulates results across samples, determining which individual lines of code were
executing most often. In contrast, the overhead from adding the necessary code to profile at this level of detail
in a non-statistical way would distort the results enough to render them virtually useless.
Taking a Time Profile
Recording a Time Profile is generally very simple. Just use the general session-capture instructions presented
in the previous chapter with the Time Profile configuration selected, and you will capture one. Because Time
Profile is usually the default configuration, recording a session can be a matter of just starting Shark and
pressing the “Start” button. Using the process selection menu, you may choose between capturing samples
from just one process, or of the entire system at once. The former mode is usually better for analyzing most
standalone applications, while the latter is better for seeing how applications interact.
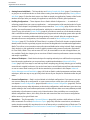
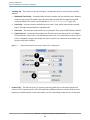
If you need more control over the sampling behavior, the mini-configuration editor (Figure 2-3) contains the
most common options. The list is reasonably short:
1.
Windowed Time Facility— If enabled, Shark will collect samples until you explicitly stop it. However, it
will only store the last N samples, where N is the number entered into the sample history field (10,000 by
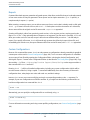
default). This mode is also described in Windowed Time Facility (WTF) (page 125).
2.
Start Delay— Amount of time to wait after the user selects “Start” before data collection actually begins.
This helps prevent Shark from sampling itself after you press “Start.”
3.
Sample Interval— Enter a sampling period here to determine the sampling rate. The interval is 1 ms by
default.
4.
Time Limit— The maximum amount of time to record samples. This is ignored if WTF mode is enabled
or if the sampling rate is high enough that the Sample Limit is reached first.
Retired Document | 2012-07-23 | Copyright © 2012 Apple Inc. All Rights Reserved.
31
Time Profiling
Profile Browser
5.
Sample Limit — The maximum number of samples to record. Specifying a maximum of N samples will
result in at most N samples being taken, even on a multi-processor system, so this should be scaled up
as larger systems are sampled. When the sample limit is reached, data collection automatically stops. With
the Windowed Time Facility mode, its sample history field replaces this one, and if the Time Limit is very
small it may be reached first.
Figure 2-3
Time Profile mini-configuration editor
Note on short sample intervals: Shark will let you decrease the sample interval significantly, to a
minimum of 20µs, but the very high sampling rates that result from these very short intervals are
not recommended for most work, for several reasons. First, Shark will have a significant impact on
system performance, since it needs some processor time when every sample is taken. Second, sample
interval timing may be more erratic, because the inevitable sample timing error caused by interrupt
response timing will be a larger percentage of each sample time. Finally, Shark may require significant
amounts of memory to record the large number of samples that can quickly accumulate with
short-interval sampling, adding significant memory pressure on systems with smaller amounts of
main memory.
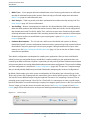
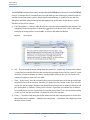
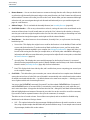
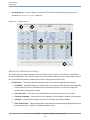
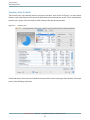
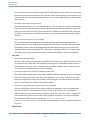
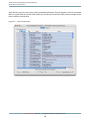
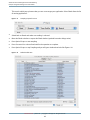
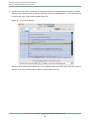
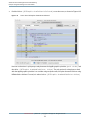
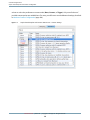
Profile Browser
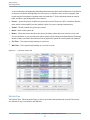
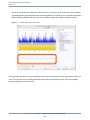
After you record a Time Profile session, Shark displays the a summary of the samples from the dominant process
in a tabular form called a Profile Browser . An example is shown in Figure 2-6. Samples are grouped (usually by
symbol), and the groups with the most samples are listed first. This ordering is known as the “Heavy” view,
and is described further below in Heavy View (page 36). This view can be modified using the View popup
Retired Document | 2012-07-23 | Copyright © 2012 Apple Inc. All Rights Reserved.
32
Time Profiling
Profile Browser
menu (#8), if you would rather see the “Tree” view, which is described in Tree View (page 36) and organizes
the sample groups according to the program’s callgraph tree, or “Heavy and Tree” view, which splits the window
and shows both simultaneously.
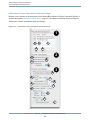
Figure 2-4
The Profile Browser
The window consists of several main parts:
1.
Pane Tabs— These tabs let you select to view your samples using this pane, the Chart view (see Chart
View (page 40)), or from among one or more Code Browsers (see Code Browser (page 45)).
2.
Results Table Column Headers— Click on any column title to select it, causing the rows to be sorted
based on the contents of that column. You will usually want to sort by the “Self” or “Total” columns in this
window. You can also select ascending or descending sort order using the direction triangle that appears
at the right end of the selected header.
3.
Results Table— The results table summarizes your samples in a simple, tabular form. User space code is
normally listed in black text while supervisor code (typically the Mac OS X kernel or driver code) is listed
in dark red text. However, this color scheme can be adjusted using the Advanced Settings , described below
in Profile Display Preferences (page 38).
Retired Document | 2012-07-23 | Copyright © 2012 Apple Inc. All Rights Reserved.
33
Time Profiling
Profile Browser
TheEdit ind
F ind
F command(Command-F )andtherelatedEdit ind
F indNext
F
(Command-G )andEdit ind
F ind
F
Previous (Command-Shift-G ) commands are very useful when you are searching for particular entries in
a profile browser listing many symbols. Simply type the desired library or symbol name into the Find...
dialog box, and Shark will automatically find and highlight the next instance of that library or symbol.
The table consists of five columns:
a.
Code Tuning Advice — When possible, Shark points out performance bottlenecks and problems. The
availability of code tuning advice is shown by a
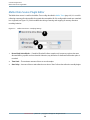
button in the Results Table . Click on the button
to display the tuning advice in a text bubble, as shown in ISA Reference Window.
Figure 2-5
Tuning Advice
b.
Self — The percentage of samples falling within this granule (i.e. symbol) only . Sorting on this column
is a good way to locate the functions that were actively executing the most, and as a result is a good
choice for use with the bottom-up “Heavy” view. By double-clicking on this, you can view the raw
number of samples for each row in the table.
c.
Total — In the “Heavy” view, this column lists the portion of each leaf entry’s time that passes through
the given function (at the root level, therefore, it is equal to the Self column). In the “Tree” view this
column lists the percentage of samples that landed in the given granule or anything called by it (self
plus descendants or “children”). Sorting on this column is a good way to locate the top of callstack
trees rapidly, and as a result is a good choice for use with the top-down “Tree” view. By double-clicking
on this, you can view the raw number of samples for each row in the table.
d.
Library — The name of the library (binary file) where the code of the sampled symbol is located. If no
library information is available — unlikely but not impossible — the address of the beginning of the
library is shown, instead.
Retired Document | 2012-07-23 | Copyright © 2012 Apple Inc. All Rights Reserved.
34
Time Profiling
Profile Browser
e.
Symbol — The symbol where this sample was located. Most of the time, this is the name of the function
or subroutine that was executing when the sample was taken, but the precise definition is controlled
by the compiler. One particular area for wariness is with macros and inline functions. These will usually
be labeled according to the name of the calling function, and not the macro or inline function name
itself. If no symbol information is available, the address of the beginning of the symbol is shown,
instead.
You may click the disclosure triangle to the left of the symbol name to open up nested row(s) containing
the name of all caller(s) (“Heavy” view) or callee(s) (“Tree” view). If you Option-Click on the triangle,
instead, then all disclosure triangles nested within will open, too, allowing you to open up the entire
stack with a single click.
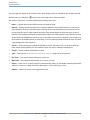
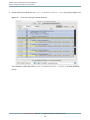
4.
Status Bar— This line shows you the number of active samples, the number of samples in any selected
row(s) of the Results Table , and the percent of samples that are selected. Note that the number of active
samples being displayed can be reduced dramatically using controls such as the Process pop-up, Thread
pop-up, and data mining operations (see Data Mining (page 151)).
5.
Callstack View Button— Pressing this button opens up the function Callstack Table , shown in Figure 2-6,
which allows you to view deep calling trees more easily. The most frequently occurring callstack within
the selected granule (address/symbol/library) is displayed. Once open, you can click rows of the Callstack
Table to navigate quickly to other granules that are present in the selected callstack.
Figure 2-6
Callstack Table
Retired Document | 2012-07-23 | Copyright © 2012 Apple Inc. All Rights Reserved.
35
Time Profiling
Profile Browser
6.
Process Popup Menu— This lists all of the sampled processes, in order of descending number of samples
in the profile, plus an “All” option at the top. When you choose an option here, the Results Table is
constrained to only show samples falling within the selected process. Each entry in the process list displays
the following information: the percent of total samples taken within that process, process name, and
process ID (PID). This information is similar to the monitoring information provided by tools such as the
command-line top program.
7.
Thread Popup Menu— When you select a single process using the Process Popup , this menu lets you
choose samples from a particular thread within that process. By default, the samples from all of the threads
within the selected process are merged, using the “All” option.
8.
View Popup Menu— This popup menu lets you choose from among the two different view options
(“Heavy” and “Tree”) described below, or to split the window and display both views at once (“Heavy and
Tree”).
Heavy View
The “Heavy” view is not flat – each symbol name has a disclosure triangle next to it (closed by default). Opening
the disclosure triangles shows you the call path or paths that lead to each function. This allows you first to
understand which functions are most performance-critical and second to see the calling paths to those functions.
Figure 2-7
Heavy Profile View Detail
For example, Figure 2-7 shows a close-up of the “Heavy” profile view log10() entry. The library function
log10() represents 12.7% of the time spent in the Celestia process. The 12.7% of the overall time spent in
log10() is distributed between three calling paths. The Total column shows that the first path (through
StarOctree::findVisibleStars()) accounts for 12.1% of the overall time. The rest of the total time spent
in log10() is through calls made by two other functions in the example shown above
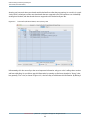
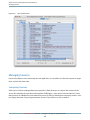
Tree View
In addition to the default “Heavy” or bottom-up profile view, Shark supports a call tree or top-down view (select
“Tree” in the Profile View pop-up button).
Retired Document | 2012-07-23 | Copyright © 2012 Apple Inc. All Rights Reserved.
36
Time Profiling
Profile Browser
The “Tree” view gives you an overall picture of the program calling structure. In the sample profile (Figure 2-8),
the top-level function is [CelestiaOpenGLView drawRect:], which in turn calls [CelestiaController
display], which then calls CelestiaCore::draw(), and so on.
In “Tree” view, the Total column lists the amount of time spent in a function and its descendants, while the
Self column lists the time spent only inside the listed function.
Figure 2-8
Tree Profile View
Retired Document | 2012-07-23 | Copyright © 2012 Apple Inc. All Rights Reserved.
37
Time Profiling
Profile Browser
Note on Heavy/Tree comparisons: Please note that there may not be a one-to-one correspondence
between entries in “Tree” view and “Heavy” view. If you select a function in “Heavy” view and then
switch to “Tree” view, it will always select exactly one function in the tree. On the other hand, if you
select a function in “Tree” view and then switch back to “Heavy” view, Shark will automatically select
the “heaviest” symbol corresponding to that callpath. If several callpaths have similar weights, Shark
may end up selecting one that is surprising to you.
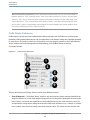
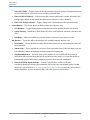
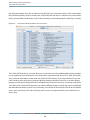
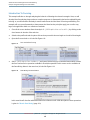
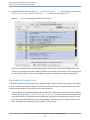
Profile Display Preferences
Profile analysis can help you better understand the data presented in the Profile Browser by tailoring the
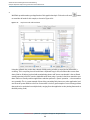
formatting of the sampled information to suit your application’s code. Analysis settings are controlled separately
for each session. The analysis controls are accessed per session by opening a drawer on the Profile Window,
shown in Advanced Session Management and Data Mining, using File Show Advanced Settings
(Command-Shift-M ).
Figure 2-9
Profile Analysis Preferences
This part of the Advanced Settings drawer contains many different controls:
1.
Show All Branches— The default “Heavy” view lists only the leaf entries (where samples landed) for the
sampled callstacks. As a result, each sample only appears once in the profile. Opening disclosure triangles
in the “Heavy” view reveals the contribution of each calling function to the “leaf” function’s total, if you
are interested in seeing what is calling those functions. With Show All Branches on, a “sample” is counted
for all symbols (root, interior and leaf ), rather than only leaf entries. This results in actual samples with
Retired Document | 2012-07-23 | Copyright © 2012 Apple Inc. All Rights Reserved.
38
Time Profiling
Profile Browser
deep callstacks being over-represented in the profile, since they are counted many times, but makes it
easier to find symbols for frequently-occurring but non-leaf functions, since one no longer must drill down
through multiple levels of disclosure triangles to find them.
While Shark will allow you to use this mode with “tree” view, it is not recommended.
2.
Color By Library— Uses colors to differentiate libraries in the Results table.
3.
Show Symbol Length— Displays the sum of instruction lengths in bytes for each symbol.
4.
Demangle C++ Symbols— Translates compiler-generated symbol names to user-friendly names in C++
code, stripping off the name additions required to support function polymorphism.
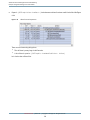
5.
Granularity— Determines the grouping level that Shark uses to bind samples together.
6.
a.
Address — Group samples from the same program address.
b.
Symbol — Group samples from the same symbol (usually there is a one-to-one correspondence
between symbols and functions).
c.
Library — Group samples from the same library.
d.
Source File — Group samples from the same source file.
e.
Source Line — Group samples from the same line of source code.
Stats Display— Selects units and a baseline number of samples.
a.
Value — Shows raw sample counts rather than percentages.
b.
% of Scope — Shows percentages based on currently selected process and/or thread.
c.
% of Total — Shows percentages based on total samples taken.
7.
Weight By— In Shark’s default weighting method (weight by sample count), each sample contributes a
count of one. During sample processing, any time a sample lands in a particular symbol’s address range
(in the case of symbol granularity) the total count (or weight) of the granule is incremented by one. In
addition to context and performance counter information, each sample also saves the time interval since
the last sample was recorded. When samples are weighted by time, each granule is weighted instead by
the sum of the sampling interval times of all of its samples.
8.
Time Unit— Selects the time unit (µs, ms, s) used to display time values. Auto will select the most
appropriate time unit for each value when weighting by “Time.”
9.
Process ID— Shark normally differentiates between processes according to their process ID (PID) – a
unique integer assigned to each process running on the system. Thus, Shark groups together samples
from the same PID. Shark can also identify processes by name. In this case, samples from processes with
the same name (and possibly different PIDs) would be grouped together. This is particularly useful for
programs that are run from scripts or that fork/join many processes.
The remainder of the controls visible in the Advanced Settings Drawer, which control Data Mining, are described
in Data Mining (page 151).
Retired Document | 2012-07-23 | Copyright © 2012 Apple Inc. All Rights Reserved.
39
Time Profiling
Chart View
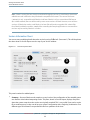
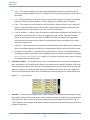
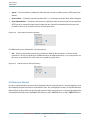
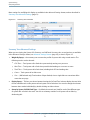
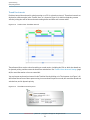
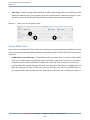
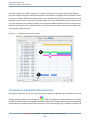
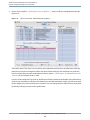
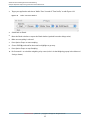
Chart View
Click Shark’s Chart tab to explore sample data chronologically, from either a thread- or CPU-based perspective.
This can help you understand the chronological calling behavior in your program, as opposed to the summary
calling behavior shown in the Results Table . Using this chart, you can see at a glance if your program rarely/often
calls functions and if there are any recurring patterns in the way your program calls functions. Based on this,
you can often visually see different phases of execution — areas where your program is executing different
pieces of its code. This information is useful, because each phase of execution will usually need to be optimized
in a different way.
Shark’s Chart and Profile views are tightly integrated. The same level of scope (system/process/thread) is always
displayed on both. Selected entries in the Results Table are highlighted in the Chart view. Filtering of samples
using the Profile Analysis or Data Mining panes (see Data Mining (page 151)) also affects the selection of samples
shown in the Chart view. As with the Callstack Table shown in the Profile Browser, double clicking on any
entry in the table opens a new Code Browser tab.
By default, Shark displays the currently selected scope (system, process, or thread) against an “absolute” time
x-axis. This view displays gaps wherever the currently selected process or thread was not running. Use the
Time Axis pop-up button to switch between absolute and relative time, which compresses out these out-of-scope
areas.
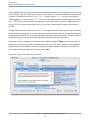
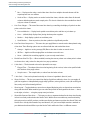
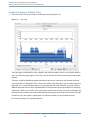
Figure 2-10
Chart View
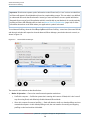
The chart view shown in Figure 2-10 has several parts:
Retired Document | 2012-07-23 | Copyright © 2012 Apple Inc. All Rights Reserved.
40
Time Profiling
Chart View
1.
Callstack Chart— This chart displays the depth (y-axis) of the callstack for each sample, chronologically
from left-to-right over time (x-axis). The figure also clearly shows several key features of the chart:
a.
User Callstack — Most callstacks, in blue, represent user-level code from your program.
b.
Supervisor Callstack — Callstacks in dark red represent supervisor-level code stacks that were sampled.
c.
Selected Callstack — A yellow “pyramid” of callstacks is highlighted when you click on the graph to
select a sample. Once you have chosen a sample, you can use the left and right arrow keys to navigate
to the previous or next unique callstack “pyramid.” After highlighting the chosen sample, Shark
examines the callstacks to either side and automatically extends the selection outwards to the left
and right wherever the adjacent callstacks have the same symbol. In this way, you can easily see the
full tenures for each function (length of time that function is in the callstack). Because functions at
the base of the callstack, like main, have much longer tenures than the leaf functions at the top of
the callstack, the shape of the highlighted area will always be a pyramid of some sort.
It is also possible to select one or more individual symbols within the chart view by selecting them in
the Profile Browser and then switching over to the chart view. After you switch to the chart view, all
of the dots on the chart representing calls to the selected symbol(s) will be highlighted in yellow,
allowing you to find and examine samples containing those symbol(s) more easily in complex charts.
It is usually easy to differentiate these “symbol selections” from the “sample selections” made by
clicking within the chart view itself, because only elements of each callstack corresponding to the
selected symbols are highlighted in the former case, and not entire samples or “pyramids,” as in the
latter.
d.
Context Switch Lines — These lines indicate where the operating system switched another process or
thread into the processor. Note that because Shark uses statistical sampling, it is possible to miss very
short thread contexts. They are only visible at high levels of magnification in “absolute” time mode
(as chosen in #12, below), when you select the option to show them in the Advanced Settings .
e.
Out-of-Scope Callstack — (not shown) Callstacks in gray, visible only in “absolute” time mode, are just
placeholders for samples that are outside the current process/thread scope. In “relative” mode, they
are eliminated from the graph.
2.
Zoom Slider— You can zoom in or out of the chart by dragging this slider towards the “+” and “–” ends,
respectively. You can also use the mouse to zoom into a subset of the displayed samples by dragging the
mouse pointer over the desired region of the chart. Zooming out can also be accomplished by
Option-Clicking on the chart.
3.
Chart Scroll Bar— If you have magnified the chart, then you can use this scroll bar to move left-and-right
within it.
4.
Callstack Table Button— Press this button to expose or collapse the Callstack Table , below.
5.
Callstack Table Header— This area summarizes the CPU number, process ID, thread ID, and user/supervisor
code status of the sample. This is displayed or hidden using the Callstack Table Button (#4).
Retired Document | 2012-07-23 | Copyright © 2012 Apple Inc. All Rights Reserved.
41
Time Profiling
Chart View
6.
Callstack Table— This displays the functions within the callstack for the currently selected sample, with
the leaf function at the top and the base of the stack at the bottom. As you select different samples in the
chart, this listing will update to reflect the location of the current selection. This is displayed or hidden
using the Callstack Table Button (#4).
7.
Sample Table Headers— Like most tables in Shark, you can click here to select the column used to sort
the samples in this table, and then click on the arrow at the right end of the selected header cell to choose
to sort in ascending or descending order. Choosing a column here has no other effect besides controlling
the sort order, however.
8.
Sample Table— This table lists a summary of all samples recorded within the session. It lists several key
facts that are recorded with each sample:
9.
a.
Index — Number of the sample within the session, starting from 1 and going up.
b.
Time — Time that has passed between this sample and the previous one. Normally, this will be a
constant amount of time equal to the sampling period, but there are some sampling modes that allow
variation here.
c.
CPU — Number of the CPU on your system where this sample was recorded, starting from 1 and going
up.
d.
Process — Process ID for this sample’s process, including the name of the application.
e.
Thread — Thread ID for this sample’s thread.
Sample Table Callstacks— If you pull this window splitter to the left, you will expose a table listing all
symbol names within the callstacks of each sample, in a large grid. Effectively, this is like looking at multiple
Callstack Table s rotated 90 degrees and placed side-by-side. Most of the time, this level of detail about
your samples is not necessary, but there may be some occasions when you might find this view helpful.
10. Process Popup Menu— This lists all of the sampled processes, in order of descending number of samples
in the profile, plus an “All” option at the top. When you choose an option here, the Callstack Chart is
constrained to only show samples falling within the selected process. Each entry in the process list displays
the following information: the percent of total samples taken within that process, process name, and
process ID (PID). This information is similar to the monitoring information provided by tools such as the
command-line top program.
11. Thread Popup Menu— When you select a single process using the Process Popup , this menu lets you
choose samples from a particular thread within that process. By default, the samples from all of the threads
within the selected process are merged, using the “All” option.
12. Time Popup Menu— This popup lets you choose between two different viewing modes. The first, “absolute”
time mode, shows all samples from a particular processor, no matter what was executing. Samples from
outside the current process/thread scope are grayed out, but are still plotted. On the other hand, in
“relative” time mode, all out-of-scope samples are eliminated and the chart’s x-axis is adjusted to account
for the smaller number of samples.
Retired Document | 2012-07-23 | Copyright © 2012 Apple Inc. All Rights Reserved.
42
Time Profiling
Chart View
13. View Popup Menu— This popup lets you choose to view sets of samples from different processor cores.
Advanced Chart View Settings
The first pane of the Advanced Settings drawer displays a new set of options if you switch to a Chart view
(Figure 2-11). These controls affect the appearance of the chart, and are generally fairly minor:
1.
Draw Context Switch Lines— Enables or disables the drawing of gray lines between samples that are
from different process and/or thread contexts. They are quite useful, but can clutter the display at low
levels of magnification.
2.
Hide Samples Not In Scope— When chosen, this hides all samples from processes or threads outside of
the ones in the current scope, as chosen by the Process and Thread pop-up menus. Any remaining samples
are compressed together to remove any gaps. This process is similar to switching to “Relative” time using
the Time pop-up menu, but the results are slightly different.
3.
Coalesce Samples— When chosen, this combines adjacent samples containing the same callstacks
together, so they are no longer individually selectable. If your Time Profiles often contain large blocks of
identical samples, the use of this option can make maneuvering through the samples using the arrow keys
somewhat easier.
4.
Chart Type— Selects which type of chart to plot. You will rarely need to change this, but other options
are available:
a.
Saturn — The default chart type, this presents a graph consisting of a solid bar representing the
callstack at each sample point.
b.
Trace — This chart type is similar to the Saturn graph type, except that it only draws an outline around
the bars instead of coloring them completely. Selections are made only on a sample-by-sample basis,
instead of in “pyramids.”
c.
Delta — This is much like the trace view, including the point selections. However, it only shows changes
in the callstacks, and not their exact depth. As a result, it is of most use when you are looking for rare
changes in the callstack depth or trends over time.
d.
Hybrid — This graph looks like a Trace graph, but uses the full “pyramid” selection capability of the
Saturn graph type.
5.
Weight By— Choose how to present the x-axis scale for the chart view. You may have Shark present this
axis in terms of sample count or by time. You may also use the keyboard equivalents Command-1 to use
sample counts or Command-2 to use time.
6.
Time Unit— Selects the time unit to use in the Time column of the Sample Table . Normally you should
just leave this on the default, “Auto,” but if you would prefer you may explicitly choose to have the numbers
displayed in µs, ms, or s.
Retired Document | 2012-07-23 | Copyright © 2012 Apple Inc. All Rights Reserved.
43
Time Profiling
Chart View
7.
Color Selection— Choose colors to use for user sample callstacks, kernel sample callstacks, and the
selection area by clicking on these color wells.
Figure 2-11
Advanced Settings for the Chart View
The remainder of the controls visible in the Advanced Settings Drawer, which control Data Mining, are described
in Data Mining (page 151).
Retired Document | 2012-07-23 | Copyright © 2012 Apple Inc. All Rights Reserved.
44
Time Profiling
Code Browser
Code Browser
Double-clicking on an entry in the Results Table or Callstack Table will open a Code Browser view for that entry,
as shown in Figure 2-12. If available, the source code for the selected function is displayed. Source line and file
information are available if the sampled application was compiled with debugging information (see Debugging
Information (page 146)). The Code Browser shows the code from the selected function and colorizes each
instruction according to its reference count (the number of times it was sampled).
Figure 2-12
Code Browser
The Code Browser window consists of several different parts:
1.
Code Browser Tab— When you double-click on an entry in a Profile Browser or Chart View, Shark
dynamically adds a tab to the top of the window. This tab contains the code browser for the symbol that
you double-clicked. If you return to one of the original browsers and double-click on another symbol,
another tab will be added for that symbol. Unlike the default tabs, these additional tabs all have small
close boxes on the left end. When clicked, the tab will be eliminated. If you open up more than about 3–5
code browsers, this may be necessary because of limited space at the top of the window.
Retired Document | 2012-07-23 | Copyright © 2012 Apple Inc. All Rights Reserved.
45
Time Profiling
Code Browser
2.
Browse Buttons— You can use these buttons to maneuver through function calls. After you double-click
on a function call (denoted by blue text) and go to the actual function, the “back” button here (left arrow)
will be enabled. To return to the caller, just click on the “back” button. After you have maneuvered through
a function call, you can navigate through code forward and backward just as you would navigate web
pages in a web browser.
3.
Address Range— This is used with the Assembly Browser (see Assembly Browser (page 48)).
4.
Code Table Headers— Click on any column title to select it, causing the rows to be sorted based on the
contents of that column. You will usually want to sort by the “Line” column in this window, so that you
can view your code in the original sequence order. You can also select ascending or descending sort order
using the direction triangle that appears at the right end of the selected header.
5.
View Buttons— Use these buttons to choose between:, Assembly View , or a split-screen view showing
both side-by-side.
6.
●
Source View : This displays the original source code for the function. It is the default, if Shark can find
source code for the function. To make sure that Shark can find your source, you first need to have
debugging information enabled in your compiler (see Debugging Information (page 146)). Also, it is
best to avoid moving the files after you compile them, so all source paths embedded in debugging
information will still be accurate. Otherwise, you may need to adjust Shark’s source paths, as described
in Shark Preferences (page 24).
●
Assembly View : This displays the raw assembly language for the function. Because it is extracted
directly from the program binary, this option is always available, even for library code. See the Assembly
Browser section (Assembly Browser (page 48)) for more information.
●
Both : This displays both views side-by-side, and is useful when you are comparing your source input
to the compiler’s output.
Code Table— This table allows you to examine your source code and see how samples were distributed
among the various lines of code. Each row of the table is automatically color-coded based on the number
of samples associated with that line — by default, hotter colors mean more samples — allowing you can
see at a glance which code is executing the most.
You can use the Edit ind
F ind
F command (Command-F ) and the related Edit ind
F ind
F Next (Command-G )
and Edit ind
F ind
F Previous (Command-Shift-G ) commands to search through your code, much like you
can in most text editors. Just type the desired text into the Find... dialog box, and Shark will automatically
find and highlight the next instance of that text in your code. You can also use this to search for comments,
if you need to look for repeated instances of a tip in the comments, for example.
The table consists of several columns. Some of these are optional, and are enabled or disabled using
checkboxes in the Advanced Settings drawer.
a.
Self — This optional column lists the percentage of displayed references for each instruction or source
line, using only the samples that fell within this particular address range. To see sample counts instead
of percentages, double-click on the column.
Retired Document | 2012-07-23 | Copyright © 2012 Apple Inc. All Rights Reserved.
46
Time Profiling
Code Browser
b.
Total — This optional column lists the percentage of displayed references for each instruction or
source line, including called functions. To see sample counts instead of percentages, double-click on
the column.
c.
Line — The line number for each line from your original source code file. This column is particularly
useful for sorting the browser window, in order to keep the line numbers there in sequence.
d.
Code — This column lists your original source file, line-by-line. Double-clicking on this column will
take you to the equivalent location in the Assembly display. Double-clicking on any function calls
(denoted by blue text), will take you to the source code for that function.
e.
Code Tuning Advice — When possible, Shark points out performance bottlenecks and problems. The
availability of code tuning advice is shown by a
button in this column. Click on the button to
display the tuning advice in a text bubble, as shown in ISA Reference Window. The suggestions
provided in the code browser will usually be more detailed and lower-level than the ones visible
within the profile browser.
7.
f.
Comment — This column gives a brief summary of the code tuning advice, allowing you to determine
which code tuning suggestions are likely to be helpful without clicking on every last advice button.
g.
Performance Event Column — (Not shown) This optional column, which is only available when you
are looking at a code browser while using a configuration that uses performance counters (as described
in Event Counting and Profiling Overview (page 111)), shows raw counts from those counters. It cannot
be enabled with normal time profiles.
Code Table Scrollbar— This scrollbar (Figure 2-13) is customized to show an overview of sampling hot
spots; the brightness of a location in the scrollbar is proportional to the sampling reference count of the
corresponding instruction in the Code Table . Since programmer time is best spent optimizing code that
makes up a large portion of the execution time, this visualization of hot spots helps you to quickly see
and focus your development effort on the code that has the greatest influence on overall performance.
Figure 2-13
8.
Hot Spot Scrollbar
Status Bar— This line shows you the number of active samples in the currently displayed memory range,
the number of active samples in the entire session, and/or the number of samples in any selected row(s)
of the Code Table . Either or both of the active samples will be eliminated from this line if the “Self” or
“Total” columns in the code table are disabled. In addition, the percent of samples that are in each of these
categories is displayed.
Retired Document | 2012-07-23 | Copyright © 2012 Apple Inc. All Rights Reserved.
47
Time Profiling
Code Browser
9.
Source File Popup Menu—A given memory range can contain source code from more than one file
because of inlining done by the compiler. You can select which source file to view using this menu.
10. Edit Button— You can open the currently displayed source file in Xcode by selecting the Edit button. The
file will open up and scroll to your selected line, or the line with the most samples if nothing is selected.
11. Function Popup Menu— This pop-up menu allows you to jump quickly to different functions in the
current source file. Please note that sample counts are only shown for the source lines in the current
memory range — other functions not in the current memory range may be visible, and you can still look
at them, but they will show no sample counts).
Assembly Browser
In addition to displaying the source code from the current memory range, Shark also provides a detailed
assembly-level view (Figure 2-14) that can be enabled by clicking on the Assembly button or combined with
a source browser by clicking on the Both button. This browser will also pop up in place of a source browser if
Shark cannot find source code for the address range that you are examining. This will often be the case with
common system libraries, the kernel, and precompiled applications.
Often, it is useful to examine the relationship between a line of source code and its compiler-generated
instructions. Shark encourages this type of exploration: either use the Both button to view source and assembly
simultaneously or double-click on a line in the Source or Code columns in the Assembly Code Browser to jump
to the corresponding source line in the Source Code Browser . Conversely, double-click on a line of code in the
Source Code Browser to jump back to the corresponding instructions in the Assembly Code Browser .
Many parts of this browser are identical to their counterparts in the Source Browser , including Self, Total, tuning
advice, and Comment columns. However, there are a few differences:
1.
Browse Buttons— You can use these buttons to maneuver through branches. After you double-click on
a branch with a static target address (denoted by blue text) and go to the destination, the “back” button
here (left arrow) will be enabled. To return to the branch itself, just click on the “back” button. After you
have maneuvered through branches, you can navigate through code forward and backward just as you
would navigate web pages in a web browser.
2.
Address Range— Samples are displayed only for the address range between these two boxes (usually
one symbol). Code outside of this range may have samples, but they will not be displayed.
3.
Code Table— About half of the columns have functions that are identical to the basic source browser,
but the others are new or slightly different:
Retired Document | 2012-07-23 | Copyright © 2012 Apple Inc. All Rights Reserved.
48
Time Profiling
Code Browser
a.
Address Column — This displays the address of the assembly-language instruction displayed on this
row. With PowerPC, this value simply increases by 4 with every row, but with x86 this will change by
1–18 bytes per row, depending upon the variable length of each instruction. You can double-click on
this column to switch to relative decimal or hexadecimal offsets from the beginning of the address
range.
b.
Code Column — This column displays the assembly code used by your routine. Using Advanced
Settings , you can choose to disable disassembly and to have Shark automatically find and indent
loops based on backwards branches in the code (the default). Within this column, you can double-click
on a branch with a static target address (denoted by blue text) to follow a branch to its target address;
after double-clicking, the function containing the target instruction will be loaded, if necessary, and
the target instruction will be highlighted. Finally, double-clicking on this column will take you to the
equivalent location in the corresponding Source display.
c.
Cycles Column — (not shown) This PowerPC-only column displays the latency (processor cycles before
an instruction’s result is available to dependent instructions) and repeat rate (processor cycles between
completing instructions of this type when the corresponding pipeline is full) of the assembly instruction
on this line, in processor cycles. In general, you will want to minimize the use of instructions with high
latency, especially if the values that they produce are used by immediately following instructions. Use
of instructions with poor (high number) repeat rates may also impact your performance if you try to
issue them too frequently.
d.
Comment Column — In addition to its usual function of providing short versions of the code analysis
tips, on PowerPC the comment column also displays information about how long the instruction must
stall as a result of long latency by prior instructions. You will find that very low-level optimization
hints, focused on particular assembly instructions, are provided here.
e.
Source Column — This shows the source file name and line number of where in the source code this
instruction originated, when this is available. As with the Code Column , you can double-click here to
get back to the Source display, scrolled to the line listed here.
Retired Document | 2012-07-23 | Copyright © 2012 Apple Inc. All Rights Reserved.
49
Time Profiling
Code Browser
4.
Asm Help Button— Press this button to get help for the selected assembly-language instruction, as
described in ISA Reference Window (page 54).
Figure 2-14
Assembly Browser
Advanced Code Browser Settings
The Advanced Settings drawer displays a new set of options if you switch to a Code Browser view (Manual
Session Symbolication). These options allow you to customize the viewing of source and assembly code and
turn on and off various features of the browser. These are many controls in this view:
●
Code Browser— This section affects the display of both source and assembly-language browsers.
1.
CPU Model— By default, Shark uses a model of the current system’s CPU architecture when analyzing
code sequences in order to determine instruction latencies and hints. You can select other CPU
architectures by changing this setting.
2.
Hot Code Colors— Choose the colors that Shark uses to display the “hotness” of code here.
3.
Selection Formatting— Choose the color and whether or not an outline is used for code selections.
4.
Grid Lines— Adds grid lines between each line of code when checked (the default).
5.
Show Total Column— Toggles display of the column that lists the percentage of displayed references
for each instruction or source line, including called functions.
Retired Document | 2012-07-23 | Copyright © 2012 Apple Inc. All Rights Reserved.
50
Time Profiling
Code Browser
●
●
6.
Show Self Column— Toggles display of the column that lists the percentage of displayed references
for each instruction or source line, but not including called functions.
7.
Show Perf Event Column(s)— If the current profile contains performance counter information, this
setting toggles display of that data within the browser. Otherwise, it will be disabled.
8.
Show Code Analysis Columns— Toggles display of the columns that provide optimization tips.
Source Browser— This section affects the display of the source browser only.
1.
Line Numbers— Toggles display of the column that lists the line number from the source code.
2.
Syntax Coloring— Enable this to have Shark color source code keywords, constants, comments, and
such.
3.
Tab Width— Shark auto-indents loops by this number of spaces for every loop nest level.
Asm Browser— This section affects the display of the assembly-language browser only.
1.
Disassemble— Choose whether to display disassembled mnemonics or raw hexadecimal values for
the instructions.
2.
Indent Loops— Choose whether or not to have Shark auto-indent loops in the code here. Loops are
found based on analysis of backwards branches in typical compiled code.
3.
Simplified Mnemonics— (PowerPC-only) Choose whether or not to enable full disassembly of
instructions with constant values that specify special instruction modes, or to only disassemble to
fundamental opcodes and leave the modifying constants intact for your examination.
4.
Show G5 (PPC970) Dispatch Groups— (PowerPC-only) Displays outlines on the main
assembly-language grid showing the breakdown of the instructions into dispatch groups. Further
details on is can be found in Code Analysis with the G5 (PPC970) Model (page 242). This function is
always disabled for sessions recorded on Macs with other processor architectures.
Retired Document | 2012-07-23 | Copyright © 2012 Apple Inc. All Rights Reserved.
51
Time Profiling
Code Browser
5.
Show G5 (PPC970) Details Drawer— (PowerPC-only) Shark can display graphs of instruction dispatch
slot and functional unit utilization in an additional, G5-specific “details” drawer. Further details on is
can be found in Code Analysis with the G5 (PPC970) Model (page 242). This function is always disabled
for sessions recorded on Macs with other processor architectures.
Retired Document | 2012-07-23 | Copyright © 2012 Apple Inc. All Rights Reserved.
52
Time Profiling
Code Browser
Figure 2-15
Advanced Settings for the Code Browser
Other architectures have slightly different options for items 3–5 of the Asm Browser settings. For x86-based
systems, illustrated in , these options are:
Retired Document | 2012-07-23 | Copyright © 2012 Apple Inc. All Rights Reserved.
53
Time Profiling
Code Browser
●
Syntax— Chooses whether to display the x86 instructions in Intel assembler syntax or AT&T syntax (the
default).
●
Show Prefixes— If checked, instruction prefixes (like lock and temporary mode shifts) will be displayed.
●
Show Operand Sizes— If checked, each instruction explicitly encodes its operand size into the mnemonic
(AT&T syntax) or operand list (Intel syntax). Otherwise, the code will be streamlined but it may not be
possible to tell 8, 16, 32, and 64-bit versions of instructions apart.
Figure 2-16
x86 Asm Browser Advanced Settings
For ARM-based systems, illustrated in , the only option is:
●
ISA— Selects to decode the instructions in the block as ARM (32-bit) instructions or Thumb (16-bit)
instructions. The iOS uses both types of ARM instructions for different functions, so you may need to use
this menu to switch from one to the other on a symbol-by-symbol basis.
Figure 2-17
ARM Asm Browser Advanced Settings
ISA Reference Window
In order to understand the low-level analysis displayed in Shark’s Assembly Browser , it may be helpful to view
the underlying machine’s instruction set architecture (ISA). You can display the PowerPC or Intel ISA Reference
Manual (Figure 2-18) by clicking on the Asm Help button in the Assembly Browser or choosing the appropriate
command from the Help menu: Help owerPC
P
ISA Reference , Help IA3
2 ISA Reference , or Help EM6
4T ISA Reference .
Retired Document | 2012-07-23 | Copyright © 2012 Apple Inc. All Rights Reserved.
54
Time Profiling
Code Browser
The ISA Reference Window provides an indexed, searchable interface to the PowerPC, IA-32 (32-bit x86), or
EM64T (64-bit x86) instruction sets. The reference is also integrated with selection in the Shark Assembly Browser
– selecting an instruction in the table causes the ISA Reference Window to jump to that instruction’s definition
in the manual.
Figure 2-18
ISA Reference Window
Retired Document | 2012-07-23 | Copyright © 2012 Apple Inc. All Rights Reserved.
55
Time Profiling
Tips and Tricks
Tips and Tricks
This section points out a few things that you might see while looking at a Time Profile , what they may mean,
and how to optimize your code if you see them. The tips and tricks listed herein are organized according to
the view most commonly used to infer the associated behavior.
●
Profile Browser
●
Where should I start? :
When first presented with a Profile Browser, you will want to begin in “Heavy View” sorted by “Self”
and see what pops to the top. These will be the functions that execute the most, and probably have
inner loops that may be susceptible to optimization. Do not forget to pop open disclosure triangles
to see what functions are calling these functions; sometimes it is easier to optimize outer loops in
these calling functions, instead of inner loops in the leaf functions. If any of these outer functions look
promising, you may want to consider flipping to “Tree” view in order to see the caller-callee
relationships a little more clearly.
●
No Samples Taken:
Shark will come up and report that it has not taken any samples if all of the threads in your application
are blocked when you choose to sample one process using Process Attach (page 122) or Process
Launch (page 122). In this case, you probably want to use Time Profile (All Thread States) (see Time
Profile (All Thread States) (page 97)) to see where your threads are blocking.
If you are using programmatic control of Shark’s start and stop points (see Programmatic Control (page
134)), having no samples taken may also indicate that you are starting and stopping so quickly that
there was simply no chance to take any meaningful samples. In this case, you should either adjust
your start and stop points to increase the amount of time between them, increase the sampling rate
(see Taking a Time Profile (page 31)), or both.
●
Too many symbols displayed:
If there is just too much clutter in the profile browser, then you need to use data mining. See Data
Mining (page 151) for details on how to do this. Sometimes, switching between “Tree” and “Heavy”
view can help organize the symbols in a more helpful way, also.
If you are looking for a small number of known symbols in a large browser window, the Edit ind
F ind
F
command (Command-F ) and the related Edit ind
F ind
F Next (Command-G ) and Edit ind
F ind
F Previous
(Command-Shift-G ) commands are probably your best bet. With these commands, Shark will
automatically find and highlight the next instance of that library or symbol for you.
●
Lots of symbols have almost equal weight:
If you have many symbols popping up to the top of the list, the best thing is to quickly examine several
of them using the Code Browser, while keeping an eye out for functions with loops that look
easy-to-optimize.
Retired Document | 2012-07-23 | Copyright © 2012 Apple Inc. All Rights Reserved.
56
Time Profiling
Tips and Tricks
●
Chart View
●
Different parts of the chart look visibly different:
Different-looking areas were probably created by different code in your program as it executes different
program phases of execution. In most applications, each of these will need to be optimized separately.
As a result, you may want to sample these with different Shark sessions, so that you can examine the
different phases separately. Alternately, you may sample them all in one session and then use data
mining (see Data Mining (page 151)) to focus more selectively on each phase as you examine the
session.
●
What is executing at a point in the chart? :
Click on the chart at the point of interest and then open up the Callstack Table to see the stack for
that sample (#4–6 in Figure 2-10 (page 40)). You can also double-click on the chart to open a Code
Browser for the function executing at that point.
●
Code Browser
●
The assembly browser shows lots of MOV (x86) or LD/ST (PowerPC) instructions:
If well over half of the instructions in your Assembly Browsers are memory access instructions, instead
of actual computation, then it is quite likely that you forgot to turn on compiler optimization. One of
the most important compiler optimizations is register allocation , which assigns variables to processor
registers temporarily between operations. Without this — such as when you use Xcode’s gcc with
-O0 optimization — the compiler will typically load and store all values to-and-from memory with
every operation, resulting in multiple data movement instructions per computation instruction. WIth
register allocation, however, the compiler will use registers to route data right from one computation
instruction directly to another, resulting in significantly fewer instructions and hence faster code.
As a result of the significant “free” performance improvement possible using this and other
optimizations, we suggest that you always use compiler optimization before using Shark (with Xcode’s
gcc we suggest -O2, -Os, or -O3).
●
I do not see any source:
Shark finds source code based on the full path to the source at the time it was compiled, but it recovers
this source as you examine the session. If your source code moved or changed between compilation
and session examination, or if you are recording and examining your session on a different Mac than
you used for compilation, then you are likely to have trouble finding source. In this case, you will want
to either recompile your source, in order to reset the paths correctly, or add the path to your source
to Shark’s list of source search paths, in Shark Preferences (page 24).
Another common source of this problem is omitting the -g flag when you compile. You should only
use Shark on fully-optimized, release-quality code, but default settings in development environments
such as Xcode often turn off debugging options like -g when set to produce optimized code. As a
result, you will often need to manually adjust the build settings to enable this option when using
Retired Document | 2012-07-23 | Copyright © 2012 Apple Inc. All Rights Reserved.
57
Time Profiling
Example: Optimizing MPEG-2 using Time Profiles
Shark. Please note that in Xcode you will need to adjust the build settings for the Target that you are
testing and the correct (optimized) build configuration . Unfortunately, it is quite easy to set options
for the wrong target or build configuration accidentally.
●
I want to see code coloring based on time spent here and in functions called by this code:
By default, the code browser only shows the Self value column, and code is colored based on these
values, which are the percent of samples spent executing each line of code within the displayed
function. If you are examining your code line-by-line, this is generally how you will want to see the
weighting displayed. However, you may also be interested in seeing time spent within the function
and all descendant functions that it calls. In this case, you will want to enable the Total column using
the Advanced Settings drawer. The code browser’s color scheme will then change to show weight
coloring based on the values in this column, instead.
Example: Optimizing MPEG-2 using Time Profiles
In this section, Shark is used to increase the performance of the reference implementation of the MPEG-2
decoder (from mpeg.org) by 5.7x on a Mac Pro with 3.0 GHz Intel® Core 2™ processor cores.
Before beginning any performance study, it is critical to define your performance metric and to justify its
relevance. Measurement of your metric should be both precise and consistent. Our performance metric for
MPEG-2 was defined as the frame rate, in frames per second, of the decoder when decoding a reference movie.
Unlike most video decoders, our test harness for the mpeg.org reference code let it decode as quickly as
possible, without trying to keep the frame rate fixed at the rate at which it was originally recorded. As a result,
the frame rate was a direct function of how fast the processor was able to do the actual decoding. This kind
of unlimited decoding speed is used for offline video decoding/encoding, a task performed almost constantly
by video editing programs as they read and write video clips. In addition, higher decoding speed in playback
settings where the processor is limited to a fixed frame rate is still a useful metric, because means that the
processor will have more time between frames to do other tasks, decode larger frames, or simply shut down
and save power for a longer time between frames.
Base
The reference MPEG-2 decoder source code consists of over 120 densely coded functions spread across more
than 20 files. As a result, if one were handed the code and told to optimize it, the task would appear virtually
hopeless — there is simply too much code to review in a reasonable amount of time! However, as in many
programs, a large majority of the code handles initialization tasks and unusual corner cases, and is therefore
only rarely executed. As a result, the actual quantity of code that needs modification in order to dramatically
speed up the application is probably small, but Shark is required to locate it efficiently.
Retired Document | 2012-07-23 | Copyright © 2012 Apple Inc. All Rights Reserved.
58
Time Profiling
Example: Optimizing MPEG-2 using Time Profiles
After compiling and running the reference decoder, Shark generated the session displayed in Figure 2-19. Just
by pressing the “Start” and “Stop” button, we get a session that lets us see that about half the execution time
is spent in a combination of the Reference_IDCT() function and the floor() function. By clicking the
callout ( ) button to the left of the floor() function in the display, we see that Shark suggests we replace
the floor() function with a simple, inline replacement. Following this advice garners a 1.12x performance
increase. This is not a huge improvement, but is very good for something that only takes a few minutes to
perform.
Looking at the code more closely shows why floor() was required: the IDCT (Inverse Discrete Cosine Transform)
function takes short integer input, converts to floating point for calculation, and then converts the results back
to short integers. While this is a good way to keep the mathematics simple in the sample “reference” platform,
the numerous type conversions and slow floating point arithmetic make this routine slow.
Converting to integer mathematics throughout avoids expensive integer FPteger
in conversions and slow FP
mathematics, at the expense of more convoluted math in the code. This code is available in the mpeg2play
implementation (also available on mpeg.org). Switching the implementation to integer math resulted in a
much more dramatic speedup over the original code of 1.86x.
Figure 2-19
Original Time Profile, with Tuning Advice
Retired Document | 2012-07-23 | Copyright © 2012 Apple Inc. All Rights Reserved.
59
Time Profiling
Example: Optimizing MPEG-2 using Time Profiles
Vectorization
Optimizing the Reference_IDCT() function by converting it from floating point to integer also presented
another possible optimization that could be helpful: SIMD vectorization. All Intel Macintoshes support the SSE
instruction set extensions, allowing them to process 128-bit vectors of data, and most PowerPC Macintoshes
support the very similar AltiVec™ extensions. Although the methodology for vectorizing your code is beyond
the scope of this document, there is a plethora of documentation and sample code available to you online at
http://developer.apple.com/hardwaredrivers/ve/index.html. The very regular, mathematically intensive inner
loops of the IDCT routine are perfect candidates for this kind of vectorization. Following the suggestion supplied
by Shark in Figure 2-20 led to converting the IDCT routine to use SSE. Surprisingly, performance only increased
to 2.05x, with only a 10% improvement from vectorization.
At a point like this, where our optimization efforts result in non-intuitive results, it is generally a good idea to
use Shark again to see how conditions have changed since our first measurement. This additional run of Shark
produced the session in Figure 2-21. The vectorized IDCT function, IWeightIDCT(), now takes up less than
5% of the total execution time. The mystery is solved: as the IDCT function was optimized while other routines
were not modified, those other, unoptimized routines became the performance bottleneck instead. Further
examination with Shark quickly identified the key loops in several new functions. Because, like IDCT, they were
performing complex math in tight inner loops, most of the new bottlenecks were also good targets for
vectorization. As seen in Table 2-1, final optimization of motion compensation (Flush_Buffer() and
Retired Document | 2012-07-23 | Copyright © 2012 Apple Inc. All Rights Reserved.
60
Time Profiling
Example: Optimizing MPEG-2 using Time Profiles
Add_Block()), colorspace conversion (dither()), and pixel interpolation (conv420to422() and
conv422to444()) achieved a speedup of 5.69x over the original code — a dramatic improvement made
possible in a relatively short amount of time thanks to the feedback provided by Shark.
Figure 2-20 Code Browser with Vectorization Hint
Figure 2-21
Time Profile after Vectorizing IDCT
Table 2-1
MPEG-2 Performance Improvement
Optimization Step
Original
Speedup
1.00x
Retired Document | 2012-07-23 | Copyright © 2012 Apple Inc. All Rights Reserved.
61
Time Profiling
Example: Optimizing MPEG-2 using Time Profiles
Optimization Step
Speedup
Fast floor()
1.12x
Integer IDCT
1.86x
Vector IDCT
2.05x
All Vector
5.69x
Retired Document | 2012-07-23 | Copyright © 2012 Apple Inc. All Rights Reserved.
62
System Tracing
Shark’s System Trace configuration records an exact trace of system-level events, such as system calls, thread
scheduling decisions, interrupts, and virtual memory faults. System Trace allows you to measure and understand
how your code interacts with Mac OS X and how the threads in your multi-threaded application interact with
each other. If you would like to gain a clear understanding of the multi-threaded behavior of a given program,
characterize user vs. system processor utilization, or understand the virtual memory paging behavior of your
application, then System Trace can give you the necessary insight.
Tracing Methodology
System Trace complements Shark’s default Time Profiling configuration (see Time Profiling (page 29)) by
allowing you to see all transitions between OS and user code, a useful complement to the statistical sampling
techniques used by Time Profiling . For example, in Basic Usage we can see an example of a thread of execution
sampled by both a Time Profile (on top) and a System Trace (on the bottom). Time profiling takes evenly-spaced
samples over the course of time, allowing us to get an even distribution of samples from various points of
execution in both the user and system code segments of the application. This gives us a statistical view of what
the processor was doing, but it does not allow us to see all user-kernel transitions — the first, brief visit to the
kernel is completely missed, because it falls between two sample points. System tracing, in contrast, records
an event for each user-kernel transition. Unlike time profiling, this does not give us an overview of all execution,
because we are looking only at the transition borders and never in the execution time between them, but we
gain an exact view of all of the transitions. This precision is often more useful when debugging user-kernel
Retired Document | 2012-07-23 | Copyright © 2012 Apple Inc. All Rights Reserved.
63
System Tracing
Basic Usage
and multithreading problems, because these issues frequently hinge upon managing the precise timing of
interaction events properly in order to minimize the time that threads spend waiting for resources (blocked),
as opposed to minimizing execution time.
Figure 3-1
Time Profile vs. System Trace Comparison
4IME
4IME0ROFILE%VENLYSPACEDSAMPLES
3YSTEM4RACE3AMPLESATUSERSYSTEMTRANSITIONS
5SER#ODE
3YSTEM#ODE
As with most other profiling options available from Shark, System Trace requires no modification of your
binaries, and can be used on released products. However, it is possible to insert arbitrary events into the System
Trace Session using Sign Posts , which are discussed in detail in Sign Posts (page 90), if the built-in selection
of events simply does not record enough information.
Basic Usage
In its simplest usage, all you need to do is select System Trace from the Configuration Popup and start sampling.
Shark will then capture up to 1,000,000 system events per-processor (a user-tunable limit), process the results,
and display a session (see Interpreting Sessions (page 66)). In most cases, this should be more than enough
data to interpret. Note that you cannot select a single process before you start tracing using the standard
pop-up menu (from Main Window (page 17)); instead, if you only want to see a trace for a specific process or
thread, you must narrow the scope of the traced events after the session is recorded (see Interpreting
Sessions (page 66)).
In order to allow direct correlation of system events to your application’s code, Shark records the following
information with each event:
Retired Document | 2012-07-23 | Copyright © 2012 Apple Inc. All Rights Reserved.
64
System Tracing
Basic Usage
●
Start Time
●
Stop Time
●
A backtrace of the user-space function calls (callstack) associated with each event
●
Additional data customized depending on the event type that triggers recording (see Trace View
In-depth (page 73) for details)
In the course of profiling your application, it may become necessary to trim or expand the number of events
recorded. Most of the typical options are tunable by displaying the Mini Config Editor, depicted in Figure 3-2.
Figure 3-2
System Trace Mini Config Editor
The Mini Config Editor adds the following profiling controls to the main Shark window:
1.
Start Delay— Amount of time to wait after the user selects “Start” before data collection actually begins.
2.
Time Limit— The maximum amount of time to record samples. This is ignored if Windowed Time Facility
is enabled, or if Sample Limit is reached before the time limit expires.
3.
Sample Limit — The maximum number of samples to record. Specifying a maximum of N samples will
result in at most N samples being taken, even on a multi-processor system, so this should be scaled up
as larger systems are sampled. On the other hand, you may need to reduce the sample limit if Shark runs
out of memory when you attempt to start a system trace, because it must be able to allocate a buffer in
RAM large enough to hold this number of samples. When the sample limit is reached, data collection
automatically stops, unless the Windowed Time Facility is enabled (see below). The Sample Limit is always
enforced, and cannot be disabled.
4.
Windowed Time Facility— If enabled, Shark will collect samples until you explicitly stop it. However, it
will only store the last N samples, where N is the number entered into the Sample Limit field. This mode
is described in Windowed Time Facility (WTF) (page 125).
If the user-level callstacks associated with each system event are of no interest to you, it is possible to disable
their collection from within the Plugin Editor for the System Trace Data Source (see System Trace Data Source
PlugIn Editor (page 193)), further reducing the overhead of system tracing. With callstack recording disabled,
Shark will still record the instruction pointer associated with each event, but will not record a full callstack.
Since most system calls come from somewhere within library code, you may lose some ability to relate system
events to your code with callstack recording disabled.
Retired Document | 2012-07-23 | Copyright © 2012 Apple Inc. All Rights Reserved.
65
System Tracing
Interpreting Sessions
Out of memory errors?: If you see these when starting a system trace, then just reduce the Sample
Limit value until Shark is able to successfully allocate a buffer for itself.
Interpreting Sessions
Upon opening a System Trace session, Shark will present you with three different views, each in a separate
tab. Each viewer has different strengths and typical usage:
●
The Summary View provides an overall breakdown of where and how time was spent during the profiling
session, and is very analogous to the Profile Browser used with Time Profile. You can use this information
to ensure your application is behaving more-or-less as expected. For example, you can see if your program
is spending approximately the right amount of time in system calls that you were expecting. You can even
click on the System Call Summary to find out which system calls are being used and open the disclosure
triangles to see where, in your code , these calls are happening.
●
The Trace View provides a complete trace of system events during the profiling session. Does the Summary
View show that your CPU-bound threads are only getting an average of 200 microseconds of processor
time every time they are scheduled? Flip to the Trace View to see why your threads are blocking so soon.
●
The Timeline View provides a complete picture of system activity over the course of a session, similar to
Time Profile’s Chart View . You can use it to verify that your worker threads are running concurrently across
all the processors in your system, or to visually inspect when various threads block.
All views show trace events from a configurable scope of your System Trace. The default scope is the entire
system, but you can also focus the session view on a specific process, and even a specific thread within that
process. Independently, you can choose to only view events from a single CPU. For example, when focusing
on CPU 1 and thread 2, you will see only the events caused by thread 2 that also occurred on CPU 1. The
current settings for the scope are set using the three popup menus at the bottom of all System Trace session
windows, which select process, thread, and CPU, respectively.
Retired Document | 2012-07-23 | Copyright © 2012 Apple Inc. All Rights Reserved.
66
System Tracing
Interpreting Sessions
Summary View In-depth
The Summary View is the starting point for most types of analysis, and is shown in Figure 3-3. Its most salient
feature is a pie chart that gives an overview of where time was spent during the session. Time is broken down
between user, system call, virtual memory fault, interrupt, idle, and other kernel time.
Figure 3-3
Summary View
Underneath the pie chart, there are individual summaries of the various event types. Each of these is discussed
in turn in the following subsections.
Retired Document | 2012-07-23 | Copyright © 2012 Apple Inc. All Rights Reserved.
67
System Tracing
Interpreting Sessions
Scheduler Summary
The Scheduler Summary tab, shown in Figure 3-4, summarizes the overall scheduling behavior of the threads
running in the system during the trace. Each thread is listed in the outline underneath its owning process, as
shown at (1). To the left of each thread’s name, Shark displays the number of run intervals of that thread (or
all threads within a process) that it recorded in the course of this session.
Figure 3-4
Summary View: Scheduler
The Total , Avg , Min and Max columns list the total, average, minimum, and maximum values for the selected
metric. A popup button below the outline (2) lists the supported metrics:
●
Busy Time— Total time spent running, including both user and non-idle system time
●
User Time— Total time spent running in user space
●
System Time— Total time spent running in supervisor space (kernel and driver code)
●
Priority— Dynamic thread priority used by the scheduler
Information about how your application’s threads are being scheduled can be used to verify that what is
actually happening on the system matches your expectations. Because the maximum time that a thread can
run before it is suspended to run something else (the maximum quantum or time slice ) is 10ms on Mac OS X,
you can expect that a CPU-bound thread will generally be scheduled for several milliseconds per thread tenure.
If you rewrite your CPU-bound, performance-critical code with multiple threads, and System Trace shows that
these threads are only running for very short intervals (on the order of microseconds), this may indicate that
the amount of work given to any worker thread is too small to amortize the overhead of creating and
synchronizing your threads, or that there is a significant amount of serialization between these threads.
Retired Document | 2012-07-23 | Copyright © 2012 Apple Inc. All Rights Reserved.
68
System Tracing
Interpreting Sessions
Note on Thread IDs: Thread IDs on Mac OS X are not necessarily unique across the duration of a
System Trace Session. The Thread IDs reported by the kernel are not static, single use identifiers they are actually memory addresses. When you destroy a thread, and then create a new one
immediately thereafter, there is a very high probability that the new thread will have the same thread
ID as the one you just destroyed. This can lead to some confusion when profiling multithreaded
applications that create and destroy many threads.
There are a couple of distinct ways to avoid this confusion. Your first option is to park your threads
when you are profiling; if you don’t let any new threads exit for the duration of profiling, it is not
possible to get duplicate thread IDs. A better option is to utilize a work queue model: create enough
threads to fully populate the processors in your system, and instead of destroying the threads when
they are out of work, put them on a work queue to be woken up later with more work.
System Calls Summary
The System Calls Summary tab, shown in Figure 3-5, allows you to see the breakdown of system call time for
each specific system call. Because System Trace normally records the user callstack for each system call, you
can use this view to correlate system call time (and other metrics) directly to the locations in your application’s
code that make system calls. This view is quite similar to Time Profile’s standard profile view, described in
Profile Browser (page 32). In fact, many of the same tools are available. For example, the system call profile
can be viewed as either a heavy or tree view (selected using the popup menu at the bottom). Similarly, data
mining can be used to simplify complex system call callstacks (see Data Mining (page 151)).
More settings for modifying this display are available in the Advanced Settings drawer, and are described in
Summary View Advanced Settings (page 71).
Figure 3-5
Summary View: System Calls
Retired Document | 2012-07-23 | Copyright © 2012 Apple Inc. All Rights Reserved.
69
System Tracing
Interpreting Sessions
Note on System Trace callstacks: In rare cases, it is not possible for System Trace to accurately
determine the user callstack for the currently active thread. In this case, it may just copy the callstack
from the previous sample. While it occurs so rarely that it is usually not a problem, this “interpolation”
can occasionally result in bad callstack information. As a result, you should carefully analyze Shark’s
system trace callstacks when the callstack information seems unusual or impossible.
Virtual Memory (VM) Faults Summary
The VM Faults Summary tab, depicted in Figure 3-6, allows you to see what code is causing virtual memory
faults to occur. The purpose of this view is to help you find behavior that is normally transparent to software,
and is obscured in a statistical time profile. Functionally, it acts just like the System Calls Summary tab.
By default, virtual memory faults are broken down by type:
●
Page In— A page was brought back into memory from disk.
●
Page Out— A page was pushed out to disk, to make room for other pages.
●
Zero Fill— A previously unused page marked “zero fill on demand” was touched for the first time.
●
Non-Zero Fill— A previously unused page not marked “zero fill on demand” was touched for the first
time. Generally, this is only used in situations when the OS knows that page being allocated will immediately
be overwritten with new data, such as when it allocates I/O buffers.
●
Copy on Write (COW)— A shared, read-only page was modified, so the OS made a private, read-write
copy for this process.
●
Page Cache Hit— A memory-resident but unmapped page was touched.
●
Guard Fault— A page fault to a “guard” page. These pages are inserted just past the end of memory
buffers allocated using the special MacOS X “guard malloc” routines, which can be used in place of normal
memory allocations during debugging to test for buffer overrun errors. One of these faults is generated
when the buffer overruns.
●
Failed Fault— Any page fault (regardless of type) that started and could not be completed. User processes
will usually die when these occur, but the kernel usually handles them more gracefully in order to avoid
a panic.
In some cases, virtual memory faults can represent a significant amount of overhead. For example, if you see
a large amount of time being spent in zero fill faults, and correlate it to repeated allocation and subsequent
deallocation of temporary memory in your code, you may be able to instead reuse a single buffer for the entire
loop, reallocating it only when more space is needed. This type of optimization is especially useful in the case
of very large (multiple page) allocations.
Retired Document | 2012-07-23 | Copyright © 2012 Apple Inc. All Rights Reserved.
70
System Tracing
Interpreting Sessions
More settings for modifying this display are available in the Advanced Settings drawer, and are described in
Summary View Advanced Settings (page 71).
Figure 3-6
Summary View: VM Faults
Summary View Advanced Settings
When you are viewing the System Calls Summary and VM Faults Summary tabs, several options are available
in the Advanced Settings drawer (see Advanced Settings Drawer (page 23)), as seen in Figure 3-7:
1.
Weight By Popup— the summary can construct the profile of system calls using several metrics. The
following metrics can be selected:
●
CPU Time — Total system call or fault time spent actively running on a processor
●
Wait Time — Total system call or fault time spent blocked waiting on a resource or event
●
Total Time — Total system call or fault time, including both CPU and waiting time
●
Count — Total system call or fault count
●
Size — (VM fault tab only) Total number of bytes faulted, since a single fault can sometimes affect
more than one page
2.
Display Popup— This lets you choose between having the Self and Total columns display the raw Value
for the selected metric or the percent of total system call or fault time. You can also change the columns
between these modes individually by double clicking on either column.
3.
Group by System Call/VM Fault Type— By default, the metrics are listed for each of the different types
of system calls or faults in the trace. You can see summary statistics for all system calls or faults by
deselecting this.
Retired Document | 2012-07-23 | Copyright © 2012 Apple Inc. All Rights Reserved.
71
System Tracing
Interpreting Sessions
4.
Callstack Data Mining— The System Call and VM Fault summaries support Shark’s data mining options,
described in Data Mining (page 151), which can also be used to customize the presentation of the data.
Figure 3-7
Summary View Advanced Settings Drawer
Retired Document | 2012-07-23 | Copyright © 2012 Apple Inc. All Rights Reserved.
72
System Tracing
Interpreting Sessions
Trace View In-depth
The Trace View lists all of the events that occurred in the currently selected scope. Because events are most
commonly viewed with “System” scope (all processes and all CPUs), each event list has a Process and a Thread
column describing the execution context in which it took place.
As with the Summary View , the Trace View is sub-divided according to the class of event. The events in each
event class (scheduler events, system calls, and VM Faults) are separately indexed, starting from 0. Each tab in
the Trace View lists the index of the event (specific to each event class) in the Index Column .
Each tab in the Trace View supports multi-level (hierarchical) sorting of the event records, based on the order
that you click column header row cells. This provides an extremely flexible means for searching the event lists.
For example, clicking on the “CPU Time” column title will immediately sort by CPU Time. If you then click on
the “Name” column title Shark will group events by Name, and then within each group of identically named
events it will sort secondarily by CPU Time.
You may click on events in the table to select them. As with most Mac tables, you may Shift-click to extend a
contiguous selection or Command-click to select discontiguous events. Below the main Trace View table, Shark
presents a line summarizing key features of the selected trace event(s). This is particularly convenient if you
select multiple events at once, because Shark will automatically add up key features of the selected events
together and present the totals here.
You should note that double-clicking on any event in the trace list will jump to that event in the Timeline View .
This is a helpful way to go directly to a spot of interest in a System Trace, because you can reliably scroll to the
same point by double-clicking on the same trace element.
The remainder of this section will examine the three different tabs in the trace view window.
Scheduler Trace
The Scheduler Trace Tab, shown in Figure 3-8, lists the intervals that threads were running on the system. The
meanings of the columns are as follows:
●
Index— A unique index for the thread interval, assigned by Shark
●
Process— Shows the process to which the scheduled thread belongs. The process’ PID is in brackets after
the name, which can be helpful if you have multiple copies of a process running simultaneously.
●
Thread— The kernel’s identifier for the thread
●
Time— Total time (the sum of user and system time) that the thread ran
●
User Time— Time that the thread spent executing user code during the interval
●
Sys Time— Time that the thread spent executing system (kernel) code during the interval
●
Prev—
t
Time since this thread was previously scheduled
Retired Document | 2012-07-23 | Copyright © 2012 Apple Inc. All Rights Reserved.
73
System Tracing
Interpreting Sessions
●
Reason— Reason that the thread tenure ended (described in Thread Run Intervals (page 79))
●
Priority— Dynamic scheduling priority of the thread
Figure 3-8
Trace View: Scheduler
System Call Trace
The System Call Trace Tab, shown in Figure 3-9, lists the system call events that occurred during the trace. In
most respects, this Tab behaves much like the scheduler tab described previously, but it does have a couple
of new features.
You can inspect the first five integer arguments to each system call by selecting an entry in the table and
looking at the arg fields near the bottom of the window.
The current user callstack is recorded for each system call. You can toggle the display of the Callstack Table
by clicking the
button in the lower right corner of the trace table. When visible, the Callstack Table displays
the user callstack for the currently selected system call entry.
The meanings of the columns are as follows:
●
Index— A unique index for the system call event, assigned by Shark
●
Interval— Displays thread run interval(s) in which the system call occurred. Each system call occurs over
one or more thread run intervals . If the system call begins and ends in the same thread interval, the Interval
Column for that event lists only a single number: the index of the thread interval in which the event
Retired Document | 2012-07-23 | Copyright © 2012 Apple Inc. All Rights Reserved.
74
System Tracing
Interpreting Sessions
occurred. Otherwise, the beginning and ending thread interval indices are listed. Because it is possible for
an event to start before the beginning of a trace session, or end after a trace session is stopped, event
records may be incomplete. Incomplete events are listed with “?” for the unknown thread run interval
index, and have a gray background in the event lists.
●
Process— Shows the process in which the system call occurred. The process’ PID is in brackets after the
name, which can be helpful if you have multiple copies of a process running simultaneously.
●
Thread— Thread in which the system call occurred
●
Name— Name of the system call
●
Return— Shows the return value from the system call. Many system calls return zero for success, and
non-zero for failure, so you can often spot useless system calls by looking for multiple failures. Eliminating
streams of these can reduce the amount of time an application spends in wasted system call overhead.
●
CPU Time— Time spent actively running on a processor
●
Wait Time— Time spent blocked waiting on a resource or event
Figure 3-9
Trace View: System Calls
VM Fault Trace
The VM Fault Trace Tab, illustrated in Figure 3-10, lists the virtual memory faults that occurred. The current
user callstack, if any, is recorded for each VM fault.
Retired Document | 2012-07-23 | Copyright © 2012 Apple Inc. All Rights Reserved.
75
System Tracing
Interpreting Sessions
You can toggle the display of the Callstack Table , which displays the user callstack for the currently selected
VM fault entry, by clicking the
button in the lower right corner of the trace table.
The columns in the trace view have the following meanings in this tab:
●
Index— A unique index for the VM fault event, assigned by Shark
●
Interval— Displays thread run interval(s) in which the VM fault occurred. Each fault occurs over one or
more thread run intervals. If the fault begins and ends in the same thread interval, the Interval Column
for that event lists only a single number: the index of the thread interval in which the event occurred.
Otherwise, the beginning and ending thread interval indices are listed. Because it is possible for an event
to start before the beginning of a trace session, or end after a trace session is stopped, event records may
be incomplete. Incomplete events are listed with “?” for the unknown thread run interval index, and have
a gray background in the event lists.
●
Process— Shows the process in which the VM fault occurred. The process’ PID is in brackets after the
name, which can be helpful if you have multiple copies of a process running simultaneously.
●
Thread— Thread in which the VM fault occurred
●
Type— Fault type (see Virtual Memory (VM) Faults Summary (page 70) for descriptions)
●
CPU Time— Time spent actively running on a processor
●
Wait Time— Time spent blocked waiting on a resource or event
●
Library— In the case of a code fault, this lists the framework, library, or executable containing the faulted
address. In contrast, it is blank for faults to data regions, such as the heap or stack.
●
Address— Address in memory that triggered the fault
Retired Document | 2012-07-23 | Copyright © 2012 Apple Inc. All Rights Reserved.
76
System Tracing
Interpreting Sessions
●
Size— Number of bytes affected by the fault, an integral multiple of the 4096-byte system page size
Figure 3-10
Trace View: VM Faults
Timeline View In-depth
The Timeline View , displayed in Figure 3-11, allows you to visualize a complete picture of system events and
threading behavior in detail, instead of just summaries. Each row in the timeline corresponds to a traced thread,
with the horizontal axis representing time. At a glance, you can see when and why the threads in your system
start and stop, and how they interact with the system when they are running.
Session timelines are initially shown in their entirety. Because a typical session has thousands or millions of
events in it, this initially means that you can only see a broad overview of when threads are running. Events
such as system calls and VM faults are labeled with icons, but these icons are automatically hidden if there is
insufficient space to display them, as is usually the case when the trace is completely zoomed out. Hence, to
see and examine these events, you will need to zoom in on particular parts of the timeline display and then
maneuver around to see other parts of the display. There are 3 main ways to perform this navigation:
●
Scroll/Zoom Bars— Use the scroll bar at the bottom of the window to scroll side to side, and zoom with
the slider at the top of the window.
●
Mouse Dragging— Click and drag anywhere (or “rubber-band”) within the main Timeline View to form
a box. When you release the mouse bottom, the Timeline View will zoom so that the horizontal portion
of the box fits on screen (until you reach the maximum zoom level).
Retired Document | 2012-07-23 | Copyright © 2012 Apple Inc. All Rights Reserved.
77
System Tracing
Interpreting Sessions
●
Keyboard Navigation— After highlighting a Thread Run Interval by clicking on it, the Left or Right Arrow
keys will take you to the previous or next run interval from the same thread, respectively. If you highlighted
a System Call, VM Fault, or Interrupt, the arrow keys will scroll to the next event of any of these types.
Holding the Option key, however, will scroll to the next event of the same type. For example, if you had
clicked on a Zero Fill Fault, the Right Arrow would take you to the next event on the same thread, whether
it was a System Call, VM Fault, or Interrupt, but Option-Right Arrow would take you to the next Zero Fill
Fault on the same thread.
If you have too many threads, the Timeline View allows you to limit the scope of what is displayed using the
standard scope-control menus described in Interpreting Sessions (page 66), at the bottom of the window.
There are also many options for filtering out events in the Advanced Settings drawer, as described in Timeline
View Advanced Settings (page 86).
Figure 3-11
Timeline View
Retired Document | 2012-07-23 | Copyright © 2012 Apple Inc. All Rights Reserved.
78
System Tracing
Interpreting Sessions
Thread Run Intervals
Each time interval that a thread is actively running on a CPU is a thread run interval . Thread run intervals are
depicted as solid rectangles in the Timeline View , as is shown in Figure 3-12, with lines depicting context
switches joining the ends of the two threads running before and after each context switch.
Figure 3-12
Timeline View: Thread Run Intervals
Thread interval lines can be colored according to several metrics, including the CPU on which the thread ran,
its dynamic priority, and the reason the thread was switched out. See Timeline View Advanced Settings (page
86) for more information on how to control this.
You can inspect any thread run interval in the Timeline View by clicking on it. The inspector (see Figure 3-13)
will indicate the amount of time spent running in user mode and supervisor mode, the reason the thread was
switched out, and its dynamic priority.
Figure 3-13
Thread Run Interval Inspector
Retired Document | 2012-07-23 | Copyright © 2012 Apple Inc. All Rights Reserved.
79
System Tracing
Interpreting Sessions
There are five basic reasons a thread will be switched out by the system to run another thread:
Blocked— The thread is waiting on a resource and has voluntarily released the processor while it waits.
Explicit Yield— The thread voluntarily released its processor, even though it is not waiting on any particular
resource.
Quantum Expired— The thread ran for the maximum allowed time slice, normally 10ms, and was therefore
interrupted and descheduled by the kernel.
Preemption— A higher priority thread was made runnable, and the thread was interrupted in order to
switch to that thread. It is also possible to be “urgently” preempted by some real-time threads.
Urgent Preemption— Same as previous, except that the thread preempting us must have the processor
immediately, usually due to real-time constraints.
System Calls
System calls represent explicit work done on behalf of the calling process. They are a secure way for user-space
applications to employ kernel APIs. On Mac OS X, these APIs can be divided into four groups:
BSD— Syscall, ioctl, sysctl APIs
Mach— Basic services and abstractions (ports, locks, etc.)
Locks— pthread mutex calls that trap to the kernel. These are a subset of Mach system calls.
Retired Document | 2012-07-23 | Copyright © 2012 Apple Inc. All Rights Reserved.
80
System Tracing
Interpreting Sessions
MIG Message— Mach interface generator routines, which are usually only used within the kernel
Figure 3-14
Timeline View: System Calls
Calls from all of these groups are visible in Figure 3-14. Clicking on the icon for a system call will bring up the
System Call Inspector, as seen in Figure 3-15. The resulting inspector displays many useful pieces of information
which you can use to correlate the system call to you application’s code. The listed information includes:
●
Type— The system call icon and a textual description
●
Name— The system call name
●
Number— The system call’s event index number (its number in the Trace View)
●
Callstack— A backtrace of user space function calls that caused the system call
●
Time — Total, CPU, and wait time
●
Result— The return value from the call
Retired Document | 2012-07-23 | Copyright © 2012 Apple Inc. All Rights Reserved.
81
System Tracing
Interpreting Sessions
●
Arguments— The first four integer arguments
Figure 3-15
System Call Inspector
VM Faults
As is the case with almost all modern operating systems, Mac OS X implements a virtual memory system. Virtual
memory works by dividing up the addressable space (typically 4GB on a 32-bit machine, currently 256 TB on
64-bit machines) into pages (typically 4 KB in size). Pages are brought into available physical memory from a
backing store (typically a hard disk) on demand through the page fault mechanism. In addition to efficiently
managing a system’s available physical memory, this added level of indirection provided by the virtual to
physical address mapping allows for memory protection, shared memory, and other modern operating system
capabilities. There are five virtual memory events on Mac OS X, all of which are faults (running code is interrupted
to handle them the first time the page is touched) except for page outs, which are completed asynchronously.
Page In— A page was brought back into memory from disk.
Page Out— A page was pushed out to disk, to make room for other pages.
Zero Fill— A previously unused page marked “zero fill on demand” was touched for the first time.
Retired Document | 2012-07-23 | Copyright © 2012 Apple Inc. All Rights Reserved.
82
System Tracing
Interpreting Sessions
Non-Zero Fill— A previously unused page not marked “zero fill on demand” was touched for the
first time. Generally, this is only used in situations when the OS knows that page being allocated will
immediately be overwritten with new data, such as when it allocates I/O buffers.
Copy on Write (COW)— A shared, read-only page was modified, so the OS made a private,
read-write copy for this process.
Page Cache Hit— A memory-resident but unmapped page was touched.
Guard Fault— A page fault to a “guard” page. These pages are inserted just past the end of memory
buffers allocated using the special MacOS X “guard malloc” routines, which can be used in place of normal
memory allocations during debugging to test for buffer overrun errors. One of these faults is generated
when the buffer overruns.
Failed Fault— Any page fault (regardless of type) that started and could not be completed. User
processes will usually die when these occur, but the kernel usually handles them more gracefully in order
to avoid a panic.
Figure 3-16
Timeline View: VM Faults
Retired Document | 2012-07-23 | Copyright © 2012 Apple Inc. All Rights Reserved.
83
System Tracing
Interpreting Sessions
Three of these types of faults are visible in Figure 3-16. A zero-fill fault is circled to highlight it. Clicking on a
VM Fault Icon will bring up the VM Fault Inspector, as seen in Figure 3-17. This inspector functions much like
the System Call Inspector, except instead of listing arguments and return values, the VM Fault Inspector lists
the fault address, size, and — for code faults — the library in which it occurred.
Figure 3-17
VM Fault Inspector
Interrupts
Interrupts are asynchronous signals that external hardware devices use to communicate to the processor that
they require servicing. Most are associated with I/O devices, and signal either that new data has been received
by an input device or that an output device needs more data to send. However, there are also other sources
of interrupts inside of the computer system, such as DMA controllers and clock timers.
Here is an interrupt icon:
Because interrupts occur asynchronously, there is no correlation between the source of the interrupt and the
thread being interrupted. As a result, and because most users of System Trace are primarily interested in
examining the threading behavior of their own programs, the display of interrupt events in the Timeline View
is disabled by default. See Timeline View Advanced Settings (page 86) for instructions on how to enable these.
Retired Document | 2012-07-23 | Copyright © 2012 Apple Inc. All Rights Reserved.
84
System Tracing
Interpreting Sessions
Clicking on an Interrupt icon will bring up the Interrupt Inspector. This inspector lists the amount of time the
interrupt consumed, broken down by CPU and wait time.
Figure 3-18
Interrupt Inspector
Sign Posts
You can often get a good idea of your application’s current state by inspecting the user callstacks associated
with the built-in VM fault and system call events that occur in your application. But an even more precise
technique is to instrument your application with Sign Post events at critical points in your code (see Sign
Posts (page 90) for instructions as to how you can do this). For example, if you are developing an application
that operates on video frames, you can insert a sign post marker whenever the processing of a new frame
starts.
Here is a sign post icon:
Sign posts are displayed in the timeline alongside the other events. You can inspect each sign post by clicking
its icon in the timeline. The inspector will indicate which thread it came from, its event name, the 4 user-specified
ancillary data values for both the begin and the end point, and the associated user callstack (if any). If the sign
post is an “interval” sign post, an under-bar will indicate its duration on the timeline, and the inspector will list
Retired Document | 2012-07-23 | Copyright © 2012 Apple Inc. All Rights Reserved.
85
System Tracing
Interpreting Sessions
the amount of time spent on the CPU and time spent Waiting between the begin and end event. Since you
can supply different arguments to the start and end points of an interval sign post, the inspector supplies
“Begin” and “End” tabs that display the arguments supplied to the start and end points, respectively.
Figure 3-19
Sign Post Inspector
Timeline View Advanced Settings
While you are in Timeline View , several options are available in the Advanced Settings drawer (see Advanced
Settings Drawer (page 23)), as seen in Figure 3-20.
1.
Enable Thread Coloring— When enabled (the default), Shark attempts to color-code the threads in the
timeline display using one of the algorithms selected below.
2.
Color By— Assuming that you do choose to use thread coloring, this menu allows you to choose from
among several different color schemes that allow you to see different trends:
3.
●
CPU— Each CPU is assigned a different color, so you can see both how a processor is bouncing from
one thread to another or, alternately, how a thread is bouncing from one processor to another. This
is the default, and usually the most useful coloration.
●
Priority— Thread priority is assigned a color on a gradient from deep blue-violet colors (low priority)
to bright, hot yellows and oranges (high priority). Mac OS X changes thread priority dynamically,
depending upon how much CPU time each thread gets, so this color scheme is useful to see the effects
of these dynamic changes over time.
●
Reason— Colors each thread run tenure based on the reason that it ended. See Thread Run
Intervals (page 79) for a list of the possible reasons that are used to color-code thread tenures.
Color Key— Displays the colors that Shark is currently using to display your threads.
Retired Document | 2012-07-23 | Copyright © 2012 Apple Inc. All Rights Reserved.
86
System Tracing
Interpreting Sessions
4.
Draw Context Switch Lines— Check this to enable (default) or disable the thin gray lines that show context
switches, linking the thread tenures before and after the switch that ran on the same CPU core.
5.
Detailed Event Icons— Deselecting this instructs Shark turn off the icons that identify the various types
of VM faults and system calls and just replace them with generic “plain page” VM fault and “gray phone”
system call icons.
Retired Document | 2012-07-23 | Copyright © 2012 Apple Inc. All Rights Reserved.
87
System Tracing
Interpreting Sessions
6.
Label Events— These checkboxes allow you to enable or disable the display of event icons either entirely,
by type group, or on an individual, type-by-type basis. For example, you can use them to enable interrupt
icons or to remove icons for events, such as VM faults, that you may not be interested in at the present
time.
Retired Document | 2012-07-23 | Copyright © 2012 Apple Inc. All Rights Reserved.
88
System Tracing
Interpreting Sessions
Figure 3-20 Timeline View Advanced Settings Drawer
Retired Document | 2012-07-23 | Copyright © 2012 Apple Inc. All Rights Reserved.
89
System Tracing
Sign Posts
Sign Posts
Even with all of the system-level instrumentation already included in Mac OS X, you may sometimes find that
it is helpful or even necessary to further instrument your code. Whether to orient yourself within a long trace,
or to time certain operations, Sign Posts can be inserted in your code to accomplish these and other tasks.
Shark supports two types of Sign Posts:
●
Point events (no duration)
●
Interval events (with beginning and ending points)
Point events can be used to orient yourself within a larger trace. For example, if you are developing an application
that operates on video frames, you can insert a sign post marker whenever the processing of a new frame has
begun. Interval events can be used to time operations, such as the length a particular lock is held, or how long
it takes to decode a frame of video.
In order to use Sign Posts, you must first make Shark aware of your Sign Posts’ definitions. Do so by creating
a Sign Post File . In your home directory, Shark creates a folder in which you can place Sign Post Files:
~/Library/Application Support/Shark/KDebugCodes. A Sign Post File is any file that contains specially
formatted lines which associate a code value with a Sign Post name. This name can be anything you like. To
create a Sign Post File, simply create a new text file in the above directory and edit it, adding one Sign Post
definition per line. Each line should only contain a hexadecimal value followed by an event name, as illustrated
in the following example:
Listing 3-1
~/Library/Application Support/Shark/KDebugCodes/myFirstSignPosts
0x31 LoopTimer
0x32 LockHeld
Sign Post values can take any value from 0x0 to 0x3FFF, inclusive.
Note on changes to Sign Post Files: If you created your Sign Post File while Shark was running,
you might need to relaunch Shark for your new Sign Posts to appear in a System Trace. If you’ve
already taken a System Trace that generated Sign Posts, but no Sign Posts are displayed in the
Viewers, then save your session and relaunch Shark with your Sign Post Definition file(s) in place.
Once you’ve added your Sign Post File(s) to the KDebugCodes directory, you can add Sign Posts to your code.
There are two ways to accomplish this, depending on where your code runs:
Retired Document | 2012-07-23 | Copyright © 2012 Apple Inc. All Rights Reserved.
90
System Tracing
Sign Posts
●
User Applications using CHUD Framework: User Applications that link with the CHUD.framework, and
can simply call chudRecordSignPost(), which has the following API:
int chudRecordSignPost(unsigned code, chud_signpost_t type,
unsigned arg1, unsigned arg2, unsigned arg3, unsigned arg4);
●
User Applications not using CHUD Framework: User Applications for which you prefer not to link with
the CHUD.framework can still create signposts using explicit system calls. You will need to include
<sys/syscall.h> and <sys/kdebug.h>, and then use the following call (with a “type” suffix of NONE
for a point signpost, START for begin interval, and END for end interval):
syscall(SYS_kdebug_trace, APPSDBG_CODE(DBG_MACH_CHUD, <your code number>)
|
DBG_FUNC_<<type>>, arg1, arg2, arg3, arg4);
●
Kernel Extensions: Kernel Extensions must call kernel_debug() directly, using the APPS_DEBUG()
macro as the debugid argument. Using this function and macro requires you to include <sys/kdebug.h>,
and then make your call like this (the “type” suffixes are the same as in the syscall case):
KERNEL_DEBUG(APPSDBG_CODE(DBG_MACH_CHUD, <your code number>) |
DBG_FUNC_<<type>>, arg1, arg2, arg3, arg4, 0);
In both cases, the caller can record up to 4 values of user-defined data with each Sign Post that will be recorded
and displayed with the session.
The Sign Post type must be one of the following:
●
chudPointSignPost for a point event with no duration.
●
chudBeginIntervalSignPost for the start point of an interval Sign Post.
●
chudEndIntervalSignPost for the end point of an interval Sign Post.
When using interval Sign Posts, the start and end points will be coalesced into one Sign Post with a duration
equal to the elapsed time between the two events. You must ensure that the same code value is given for
both the start and end points of the interval Sign Post. It is possible to “nest” sign posts - just be sure you match
the code value for each start and end point.
The example uses the Sign Post defined in the above Sign Post File to create an interval Sign Post that times
a loop in a user-space application:
Retired Document | 2012-07-23 | Copyright © 2012 Apple Inc. All Rights Reserved.
91
System Tracing
Sign Posts
Listing 3-2
signPostExample.c
#include <CHUD/CHUD.h>
#include <stdint.h>
/* This corresponds to the sign post defined above, LoopTimer */
#define LOOP_TIMER 0x31
#define ITERATIONS 1000
uint32_t ii;
/* The last 4 arguments are user-defined, ancillary data */
chudRecordSignPost(LOOP_TIMER, chudBeginIntervalSignPost, ITERATIONS, 0, 0, 0);
for(ii = 0; ii < ITERATIONS; ii++) {
do_some_stuff();
do_more_stuff();
}
/* notice that the code value used here matches that used above */
chudRecordSignPost(LOOP_TIMER, chudEndIntervalSignPost, 0, 0, 0, 0);
Note: To compile the above example, you’ll need to instruct gcc to use the CHUD.framework:
gcc -framework CHUD -F/System/Library/PrivateFrameworks signPostExample.c
To accomplish the same task in a kernel extension, use kernel_debug() as follows:
Listing 3-3
testKernelSignPost.c
#include <sys/kdebug.h>
#define LOOP_TIMER 0x31
#define ITERATIONS 1000
uint32_t ii;
Retired Document | 2012-07-23 | Copyright © 2012 Apple Inc. All Rights Reserved.
92
System Tracing
Tips and Tricks
/*
* Use the kernel_debug() method when in the kernel (arg5 is unused),
* DBG_FUNC_START corresponds to chudBeginIntervalSignPost.
*/
kernel_debug(APPS_DEBUG(DBG_MACH_CHUD, LOOP_TIMER) | DBG_FUNC_START,
ITERATIONS, 0, 0, 0, 0);
for(ii = 0; ii < ITERATIONS; ii++) {
do_some_stuff();
do_more_stuff();
}
/* remember to use the same debugid value, with DBG_FUNC_END */
kernel_debug(APPS_DEBUG(DBG_MACH_CHUD, LOOP_TIMER) | DBG_FUNC_END,
0, 0, 0, 0, 0);
You should note that when using Sign Posts in the kernel, it is not necessary to add CHUD to the list of linked
frameworks. Adding the above code to your drivers will cause Sign Posts to be created in the System Trace
session without it. Similar code using the syscall(SYS_kdebug_trace,... invocation instead of
kernel_debug does exactly the same thing, but works from user code, instead.
Tips and Tricks
This section will list common things to look for in a System Trace , what they may mean, and how to improve
your application’s code using the information presented. The tips and tricks listed herein are organized according
to the view most commonly used to infer the associated behavior.
●
Summary View
●
Short average run intervals for worker threads:
This can indicate that the amount of work given to each worker thread is too small to amortize the
cost of creating and synchronizing your threads. Try giving each thread more work to do, or dynamically
tune the amount of work given to each thread based on the number and speed of processors present
in the system (these values can be introspected at runtime using the sysctl() or sysctlbyname()
APIs).
Retired Document | 2012-07-23 | Copyright © 2012 Apple Inc. All Rights Reserved.
93
System Tracing
Tips and Tricks
It can also indicate that your threads frequently block while waiting for locks. In this case, it is possible
that the short intervals are inherent to your program’s locking needs. However, you may want to see
if you can reduce the inter-thread contention for locks in your code so that the locks are not contested
nearly as much.
●
Inordinate count of the same system call:
Sometimes, things like select() are called too often. For system calls such as this, try increasing the
timeout value. You might also want to rethink your algorithm to reduce the number of system calls
made, if possible. Because System Trace records the user callstack associated with each system call
by default, it’s relatively easy to find the exact lines of code that cause the frequent system call(s) in
question.
●
Large amount of time spent in Zero Fill Faults:
This can indicate that your application is frequently allocating and deallocating large chunks of
temporary memory. If you correlate the time spent in Zero Fill Faults to allocation and deallocation
of temporary memory, then try eliminating these allocation/deallocation pairs and just reuse the
chunks of memory whenever possible. This optimization is especially useful with very large chunks
of memory, since a large amount of time can be wasted on zero-fill faults after every reallocation.
●
Trace View
●
System calls repeatedly failing:
As above, when system calls repeatedly return failure codes, inspect your algorithm and ensure that
you still need to be calling them. The overhead of a system call is considerable, and any chance to
avoid making a system call, such as checking for known failure conditions prior to making the call,
can improve the performance of your code considerably.
●
System calls repeated too frequently (redundant system calls):
This can be indicated either by the same system call being called multiple times in a row as displayed
in the Trace View, or by a large count value when Weight By is set to Count in the Summary View .
Inspect your algorithm to ensure the repeated system call needs to be called as often as reported —
there’s a good chance you could be doing redundant work.
●
Sign Posts were generated during session, but are not displayed:
If you’ve already taken a System Trace session in which your application or driver generated Sign
Posts, but no Sign Posts are displayed in the Trace view, it is possible that the correct Sign Post
definition file(s) were not in place when you launched Shark. First, save your session — if Sign Posts
were generated, they will be saved in the session regardless of whether or not they are displayed.
Ensure the correct Sign Post Files are in place in ~/Library/Application
Support/Shark/KDebugCodes/ and relaunch Shark. Opening your session should now display the
Sign Posts.
●
Timeline View
Retired Document | 2012-07-23 | Copyright © 2012 Apple Inc. All Rights Reserved.
94
System Tracing
Tips and Tricks
●
Multi-threaded application only has only one thread running at a time:
First of all, ensure you’ve performed the System Trace on a multiprocessor machine. You can do this
by pressing Command+I to bring up the session inspector, which will list the pertinent hardware
information from the machine on which the session was created. Usually, this is not an issue.
Second, ensure your selected scope is not limited to a single CPU.
Once you’ve verified the session was taken on a multi-processor machine and is displaying data for
all processors, look in the timeline for Lock icons (see System Calls (page 80)). Their presence indicates
pthread mutex operations that have resulted in a trap to the kernel, usually as a result of lock
contention. This may indicate a serialization point in your algorithm.
Locking Note: Currently, only pthread mutex operations are given a distinct icon. However,
you can still view semaphore system calls in the Trace and Timeline views under their Mach
system calls. In either case, only contention that results in a trap to the kernel is indicated;
user space contention will not show up in a System Trace.
Correlate the locking operations to your application’s code using the inspector (single-click the icon).
If the serialization point is not necessary, remove it. Otherwise, try to reduce the amount of time spent
holding the lock. You might also instrument your code with Sign Posts (page 90) in order to characterize
the amount of time spent holding the lock.
●
Worker thread run intervals are shorter than expected:
Remember, the default scheduling quantum on Mac OS X is 10ms. If the thread run intervals are near
10ms, there may not be any benefit to continuing this investigation.
If the thread run intervals are much shorter than 10ms, single-click the short thread run intervals,
making sure not to click any event icons. The resulting inspector will list the reason why the thread
in question was switched out. If it blocked, the inspector will list the blocking event and its index. Use
the trace view to correlate this event (usually a system call) to your application’s code.
An alternate approach is to look for event icons which have an underbar that extends past the end
of the thread run intervals. This generally indicates that the event in question — such as an I/O system
call or mutex lock — caused the thread to block. Clicking the event icon will display the associated
user callstack (if any), allowing you to correlate it directly to your application’s code.
If you find your threads are frequently blocking on system calls such as stat(2), open(2), lseek(2),
and the like, you may be able to use smarter caching for file system actions. If you see multiple threads
context switching back and forth, identify their purpose. If they are CPU-bound, this is not necessarily
a problem. However, if these threads are communicating with each other, it may be prudent to
redesign your inter-thread communication protocol to reduce the amount of inter-thread
communication.
Retired Document | 2012-07-23 | Copyright © 2012 Apple Inc. All Rights Reserved.
95
System Tracing
Tips and Tricks
Another possibility is that you’ve simply not given your worker threads enough work to do. Verify this
theory using the tip from the summary view suggestions above.
●
One processor doesn’t show any thread run intervals until much later than another:
If this happens, chances are you are using the Windowed Time Facility. This is due to a fundamental
difference in how the data is recorded when using this mode. When using WTF Mode, the user-specified
number of events are right-aligned, as described in Windowed Time Facility (WTF) (page 125). Because
of this right-alignment, you’ll notice that all the CPUs tend to end around the same point in time in
the timeline, but may start at vastly different times.
This difference in start time is expected, and most likely means that any CPU which starts later in the
timeline was generating system events at a higher rate (on average) than CPUs that start earlier.
●
My application is supposed to be creating and destroying more threads than are shown:
On Mac OS X, thread identifiers (thread IDs) are not always static, unique numbers for the duration
of a profiling session. In fact, thread IDs are merely addresses in a zone of memory used by the kernel.
When your application creates and destroys threads in rapid succession, the kernel must also allocate
and free threads from this zone of memory. Not only is this a huge amount of overhead, but it makes
it possible to create a new thread that will have the exact same thread ID as a thread which you just
destroyed.
There are a couple of ways to avoid this confusion. The first, simple option is to “park” your threads
when profiling. Simply don’t let your threads exit, and your thread IDs are guaranteed to be unique.
A second, arguably better option is to utilize a work queue model for your threads. Create just enough
worker threads to fully populate the number of processors in your system, and two queues: one to
hold IDs of free threads and another to hold task records describing new “work” to be completed.
When a worker thread completes a task, do not destroy it. Either assign it a new task from the task
queue, or place it on the free thread queue until another task is available. This not only reduces the
overhead of allocating and freeing memory in the kernel, but also ensures that your thread IDs will
be unique while profiling.
●
I see an inordinate amount of interrupt icons:
If you see a large number of interrupt icons during the run intervals of your threads, you may be
communicating with the underlying hardware inefficiently. Sometimes, it is possible to assemble your
hardware requests into larger batch requests for better performance. Inspect your algorithm and find
any places to group hardware requests.
●
I need to return to a particular point X on the timeline:
If you might be returning to a location later, take a moment to note the index number and type of a
nearby event, by clicking on that event and reading the event inspector. To return, or to send someone
else there, look up that event in the Trace View and double-click on it. This will bring you directly back
to the interesting spot.
Retired Document | 2012-07-23 | Copyright © 2012 Apple Inc. All Rights Reserved.
96
Other Profiling and Tracing Techniques
Not every performance problem stems from computation in a program or a program’s interaction with the
operating system. For these other types of problems, Shark provides a number of profiling and tracing
configurations that focus on individual types of performance problems. Any of them may be chosen using the
configuration list in the main Shark window before pressing “Start.”
Time Profile (All Thread States)
When doing certain types of operations, a program can temporarily stop running while it waits on some other
event to finish. This is commonly referred to as blocking . Blocking can be the source of many performance
problems. Portions of programs, such as startup routines, making heavy use of library calls can accidentally
waste a significant amount of time blocked at various points within those calls. In heavily multithreaded
programs, time spent blocking at locks and barriers is another serious source of performance loss.
Since a program is not running while it is blocked, Time Profile will not take many samples in routines that
spend large amounts of time being blocked. To provide some insight into blocking, Shark offers the Time Profile
(All Thread States) configuration. This configuration is similar to Time Profile , but with one key difference: it
takes samples of all threads, whether they are blocked or running. With this information, you can get a good
idea about how often your threads are blocked, and where in your code the blocking calls are being made.
Like Time Profile , Time Profile (All Thread States) can be used to look at blocking behavior of a single application
or the whole system by selecting the appropriate option in the target list in Shark’s main window. While the
default settings for this configuration are often sufficient, you can also select many useful options in the
mini-configuration editor (see Mini Configuration Editors (page 19)), as shown in Figure 4-1. Here is a list of
options:
1.
Start Delay— Amount of time to wait after the user selects “Start” before data collection actually begins.
2.
Sample Interval— Determine the trigger for taking a sample. The interval is a time period (10 ms default).
3.
Time Limit— The maximum amount of time to record samples. This is ignored if Sample Limit is enabled
and reached before the time limit expires.
4.
Sample Limit — The maximum number of samples to record. Specifying a maximum of N samples will
result in at most N samples being taken, even on a multi-processor system, so this should be scaled up
as larger systems are sampled. When the sample limit is reached, data collection automatically stops. This
is ignored if the Time Limit is enabled and expires first.
Retired Document | 2012-07-23 | Copyright © 2012 Apple Inc. All Rights Reserved.
97
Other Profiling and Tracing Techniques
Time Profile (All Thread States)
5.
Prefer User Callstacks— When enabled, Shark will ignore and discard any samples from threads running
exclusively in the kernel. This can eliminate spurious samples from places such as idle threads and interrupt
handlers, if your program is not affected by these.
6.
Trim Supervisor Callstacks— When enabled, Shark will automatically trim the recorded callstacks for
threads calling into the kernel down to the kernel entry points, and discarding the parts of the stack from
within the kernel itself. These shortened stacks are usually sufficient, since most performance problems
in your programs can be debugged without knowing about how the kernel is running internally. You just
need to know how and when your code is blocking, and not how Mac OS X is actually processing the
blocking operation itself.
Figure 4-1
Time Profile (All Thread States) mini configuration editor
After you record a Time Profile (All Thread States) session, you will be presented with a profile browser window
that looks almost exactly like one you might see after recording a conventional Time Profile . However, there
are some subtle differences, as you can see in the profile of “Safari” while idle in Figure 4-2 and Figure 4-3.
All threads have exactly the same number of samples, since Shark recorded samples for them whether they
were running or not. With 9 threads, as we have in this example, all threads have exactly 1/9 of the samples,
or 11.1%. This “even-division-of-samples” rule will always hold true for Time Profile (All Thread States) sessions,
unless you happen to sample an application that is actively creating and destroying threads while it is being
measured, because Time Profile (All Thread States) always records samples for all threads at each sample point,
whether they are blocking or not. This trend can be less obvious if your threads are actively calling many
different routines over the course of the measurement, but it generally holds. This kind of behavior is much
less common in conventional Time Profile s, because almost all threads block occasionally during the time that
Shark samples them.
With “Heavy” view, as shown in Figure 4-2, you will mostly see Mac OS X’s primitive blocking routines like
pthread_mutex_lock, pthread_cond_wait, mach_msg_trap, semaphore_timedwait_signal_trap,
select, and similar functions popping up to the top of the browser window. This view is mostly useful for
Retired Document | 2012-07-23 | Copyright © 2012 Apple Inc. All Rights Reserved.
98
Other Profiling and Tracing Techniques
Time Profile (All Thread States)
showing you how much time your threads are blocked and how often they are running. As a result, it is a good
“sanity check” technique to make sure that threads that are supposed to be CPU-bound are not accidentally
wasting time blocked, and that threads that are supposed to be blocked really are idle.
Figure 4-2
Time Profile (All Thread States) session, heavy view
Unfortunately, this does not tell you the most important information: why your code is calling these routines
and hence blocking. It is possible to get this information by opening up disclosure triangles in “Heavy” view,
but generally “Tree” view, as shown in Figure 4-3, is the best way to track down this information. By flicking a
Retired Document | 2012-07-23 | Copyright © 2012 Apple Inc. All Rights Reserved.
99
Other Profiling and Tracing Techniques
Time Profile (All Thread States)
few disclosure triangles open, this view lets you logically follow your code paths until you reach a point where
they call blocking library routines. At that point, and possibly with the help of a code browser, you should be
able to get a good idea of which parts of your code are blocking, and how frequently this blocking is occurring.
Figure 4-3
Time Profile (All Thread States) session, tree view
Time Profile (All Thread States) can often allow you to track down and solve multithreaded blocking problems
in your applications by itself. However, it also works well in conjunction with System Trace . After you identify
which code that is blocking too often with Time Profile (All Thread States) , if you cannot determine why the
code is blocking, then the precise recording of blocking timing provided by System Trace can often help by
letting you see the precise timing of blocks as multiple threads compete for resources. Conversely, using System
Trace without Time Profile (All Thread States) can often be difficult, because it is fairly easy to get overwhelmed
with data while examining a System Trace . Performing a Time Profile (All Thread States) first can be very helpful,
since it can let you know which bits of blocking code are the most important before you look for them in a
System Trace .
Retired Document | 2012-07-23 | Copyright © 2012 Apple Inc. All Rights Reserved.
100
Other Profiling and Tracing Techniques
Malloc Trace
Note regarding launched target processes: When launching a process (as described in Process
Launch (page 122)) with Time Profile (All Thread States) , you may notice samples in _dyld_start.
Since Shark starts sampling the process before the launched process begins executing, some samples
will fall in this method. When profiling launch time in this way, you will want to make sure that you
skip past all these samples before paying attention to the results or use data mining to remove all
callstacks with this symbol.
Malloc Trace
In today’s large and complex software applications, it is often informative to understand the scope and pattern
of memory allocations and deallocations. If you understand how your software objects are being created and
destroyed, you can often improve the overall performance of your application significantly, since memory
allocation is a very expensive operation in Mac OS X, especially for large blocks of memory. If your program
suffers from memory leaks, Malloc Trace is also a good way to identify locations in your program that may be
the culprits.
To collect an exact trace of memory allocation and freeing function calls, select Malloc Trace in the configuration
list. Unlike with most configurations in Shark, you must choose a particular process to examine with this
configuration. In its mini configuration editor (see Mini Configuration Editors (page 19)), shown in Figure 4-4,
Malloc Trace offers the following tuning options to help refine the memory events that are collected:
1.
Record Only Active Blocks— Collect only memory allocations that were not released during the collection
period (the default). It is most useful for catching memory leaks. If turned off, any allocation or deallocation
that takes place is recorded, an option that is more useful when you are just attempting to reduce the
overall number of allocations that occur.
2.
Time Limit— Specify a maximum length of time to collect a profile. After this amount of time has elapsed
since the start of collection, Shark will automatically stop collecting the profile.
Retired Document | 2012-07-23 | Copyright © 2012 Apple Inc. All Rights Reserved.
101
Other Profiling and Tracing Techniques
Malloc Trace
3.
Start Delay— Specify a length of time that Shark should wait after being told to start collecting a profile
before the collection begins. If the program action to be profiled requires a sequence of actions to start,
this option can be used to delay the start until after the setup actions have been completed.
Figure 4-4
Malloc Trace mini configuration editor
Using a Malloc Trace
Once you have recorded a Malloc Trace , there are several ways that you can analyze the resulting trace, which
comes up in a window that superficially resembles a standard time profile. Here are a few of the most common
techniques:
●
Profile Browser: Get an Overview— The profile browser from a Malloc Trace , as shown in Using a Malloc
Trace, looks a lot like what you might obtain with a normal Time Profile , but it contains an extra column
listing the amount of memory allocated. In addition, the “Self” and “Total” columns are based on the
number of allocations made using that call instead of execution time. These figures are highlighted in the
figure. By sorting on the “Total” or “Alloc Size” columns in a “Heavy” view, you can see which routines in
your program either make the largest number of allocations or allocate the most memory at a glance. It
Retired Document | 2012-07-23 | Copyright © 2012 Apple Inc. All Rights Reserved.
102
Other Profiling and Tracing Techniques
Malloc Trace
is often a good idea to look over the routines near the top of this list and make sure that both the routines
allocating memory are the ones you think should be allocating memory, and that the amount of memory
allocated by each routine makes sense.
Figure 4-5
Malloc Trace session, profile browser
●
Code Browsers: Locate Allocating Code— If you see a potentially troublesome routine, double-clicking
it will bring it up in a code browser window. Unlike the code browsers associated with Time Profile sessions,
lines in a Malloc Trace session are colored based on how many memory allocations they perform. With
this feedback, you can see exactly which lines of code were the cause of memory allocation. Often these
lines will be fairly obvious, but with object-oriented languages like Objective-C and C++ it is surprisingly
easy to accidently allocate and free memory implicitly, as a side effect of object method calls. Using a code
browser from a Malloc Trace session can allow you to identify which method calls are performing memory
allocation and focus your optimization efforts on these. In addition, knowing what code is performing
memory allocation implicitly can help you track down memory leaks, as these allocations are easy to forget
about when one is cleaning up and freeing memory allocations.
●
Chart View: Look for Patterns— The chronological view of allocations presented by the extra memory
allocation graph added below the usual callstack plot in Chart view can easily reveal unexpected repetitive
allocation and deallocation activity in your software, like the pattern shown in the highlighted part of
Figure 4-5. When you see patterns like this, it can be helpful to try and adjust your code to move memory
Retired Document | 2012-07-23 | Copyright © 2012 Apple Inc. All Rights Reserved.
103
Other Profiling and Tracing Techniques
Malloc Trace
allocation and deallocation operations outside of loops, so that you can reuse the same memory buffers
repeatedly without reallocating them each time through the loop. Similarly, if you see repetitive allocation
without matching deallocations, then you are most likely seeing a major memory leak in progress!
Figure 4-6
Malloc Trace session, chart view
Using techniques like these, you can identify and isolate memory allocation locations and patterns within your
code. This is the first step to actually eliminating these memory problems from your code, and hopefully
improving performance in the process.
Retired Document | 2012-07-23 | Copyright © 2012 Apple Inc. All Rights Reserved.
104
Other Profiling and Tracing Techniques
Malloc Trace
Advanced Display Options
Each Malloc Trace records a few additional pieces of information at each allocation event. These are not
displayed by default, but can be useful in some situations. Display of these values can be enabled by using the
“Performance Counter Data Mining” pane in the Advanced Settings Drawer of the session window (see Advanced
Settings Drawer (page 23)), as shown below in Figure 4-7, and then clicking on the check boxes in the “eye”
column of each row to show that data element.
Figure 4-7
Enabling Malloc Trace Advanced Options
Five different types of information can be enabled or disabled in this manner:
●
Alloc Size — The size in bytes of each memory allocation. This is enabled by default, as it is almost always
useful.
●
Heap Delta — The change in size of the heap since the start of the trace. This is sometimes useful for
spotting memory leaks, which can be seen when the heap grows but never shrinks. Note that it is also
possible to get this data by using the “summation” option (as described in Perf Count Data Mining (page
157)) with Alloc Size .
●
Lifetime — The number of allocation/deallocation events between matched allocation and deallocation
pairs. This option is only useful if you disabled the “Record Only Active Blocks” option before taking your
Malloc Trace, because otherwise that option automatically screens out all matched pairs from the trace
and leaves no interesting lifetimes remaining in the trace.
●
Address — The address of the memory block allocated or freed. For performance analysis purposes, this
is only rarely helpful, but it can sometimes be useful during debugging of memory allocation behavior.
●
Is allocation? — This binary value records a 1 for allocations and 0 for frees.
Retired Document | 2012-07-23 | Copyright © 2012 Apple Inc. All Rights Reserved.
105
Other Profiling and Tracing Techniques
Malloc Trace
When you enable display of a particular type of data, it will appear in several places. First, columns displaying
it will appear in the Profile Browser (as shown previously in Figure 4-5 (page 103)), although this type of display
is really only meaningful for Alloc Size . Raw values are displayed in the list of samples at the bottom of the
Chart View (as shown in Figure 4-8), and all types of displays are useful here. Finally, charts appear in the main
part of the chart view displaying all of the sample values graphically for your inspection. These are useful with
Alloc Size (enabled by default), Heap Delta , and Lifetime .
Figure 4-8
Additional Malloc Trace Charts
The rest of the “Performance Counter Data Mining” pane, which is described more fully in the context of
performance counter analysis in the section Perf Count Data Mining (page 157), also has other features that
can be useful. For example, if a Malloc Trace contains allocations of wildly varying size, use of these options
may be necessary in order to make the allocation size chart readable, as no means for vertical scaling or scrolling
are provided by Shark. A particularly quick way of focusing the view on allocations of particular sizes is to use
the “remove !=,” “remove <,” or “remove >” screening options to chop off most allocations that are vastly
different in size from the ones that you are trying to examine.
All other features accessible through the Advanced Settings Drawer work just like they do for Time Profiling
(see Profile Display Preferences (page 38) for the “Profile Analysis” pane and Data Mining (page 151) for the
“Callstack Data Mining” pane).
Retired Document | 2012-07-23 | Copyright © 2012 Apple Inc. All Rights Reserved.
106
Other Profiling and Tracing Techniques
Static Analysis
Static Analysis
Most of Shark’s profiling methods limit their code analysis to those functions that appear dynamically in
functions that are executed during the profiling. Dead or otherwise unused code is not analyzed or presented
for optimization precisely because it has very little effect on the measured performance. However, it can
sometimes be useful to statically analyze and examine infrequently used code paths in a piece of code to look
for problems that might crop up if those code paths do become important at some point, such as with a
different input data set.
Shark is capable of statically analyzing either a running process or a binary file with the Static Analysis
configuration, but not your entire system. To analyze a running application, select Process in the target list
and then select the process you wish to analyze in the process list. To analyze an executable file, select File in
the target list and then select the file in file selection window.
Static Analysis ’ mini config editor (see Mini Configuration Editors (page 19)), shown in Figure 4-9, offers a
number of tuning options to refine what types of problems to look for and where in the program to look for
them. The available options are:
1.
2.
Target Selection— These options allow you to narrow down the area of memory examined by Shark.
●
Application — Looks for potential performance issues in the main text segment of the target process
●
Frameworks — Looks for potential performance issues in the frameworks that are dynamically loaded
by the target process.
●
Dyld Stubs — Looks for any potential performance or behavior anomalies in the glue code inserted
into the binary by the link phase of application building.
Analysis Options— These allow you to enable or disable analysis.
●
Browse Functions — Gives each function in the text image of a process a reference count of one. This
allows you to browse all of the functions of a given process with Shark’s code browser. No analysis
(or problem weighting) is performed.
●
Look For Problems — search all functions in the text image of a process for problems of at least the
level of severity specified by the Problem Severity slider. Any address with a problem instruction or
code is given a reference count equivalent to its severity.
3.
Problem Severity Slider— This slider acts as a filter, adjusting the minimum “importance” of problems
to report using a predefined problem weighting built into Shark. The further to the right the slider, the
less output is generated, as more and more potential problems are ignored because their “importance”
is not high enough.
4.
Processor Settings— Shark needs to know which model of processor is your target before it can examine
code and find potential problems. Separate menus are provided for PowerPC and Intel processors because
it can analyze for one model of each processor family simultaneously.
Retired Document | 2012-07-23 | Copyright © 2012 Apple Inc. All Rights Reserved.
107
Other Profiling and Tracing Techniques
Using Shark with Java Programs
●
PowerPC Model — Selects the PowerPC model to use when searching for and assigning problem
severities .
●
Intel Model — Selects the Intel model to use when searching for and assigning problem severities .
Figure 4-9
Static Analysis mini configuration editor
Once you have created a Static Analysis session, you can examine it to see Shark’s optimization suggestions
for your program. Both the profile browser and code browser views offer optimization hints similar to those
you can see after a normal Time Profile run, and they can be used to help you analyze your application in much
the same manner.
Using Shark with Java Programs
Shark’s profiling and tracing techniques will work just fine with programs written in virtually any compiled
language. Your compiler processes your source code in these languages and creates binary files where the
various instructions in the binary are PowerPC or x86 instructions that correspond closely with your original
source code operations. Shark records program counters and callstacks from the native machine execution as
it profiles, and can use this information to reference back to your source code. Because Mac OS X imposes
requirements on how its binaries are formatted, compilers for any language use the same techniques to record
which machine instructions correspond with which source files, making it possible for Shark to show you
symbol information and source code in languages as disparate as C and Fortran.
This system breaks down when your source code is written in a compiled language that runs within a runtime
virtual machine, such as Java, or interpreted scripting languages. In these cases, Shark’s samples will only tell
you what code is executing within the virtual machine or interpreter, which will not help you optimize your
programs. For Shark to return useful information, it must move “up” a level in the software hierarchy (as shown
in Figure 4-10) and record the location within the virtual machine code or script that is executing, instead.
While support for recording this information is unavailable with most script interpreters, recent versions of
Retired Document | 2012-07-23 | Copyright © 2012 Apple Inc. All Rights Reserved.
108
Other Profiling and Tracing Techniques
Using Shark with Java Programs
Sun’s Java virtual machine included with Mac OS X do provide an interface that Shark can use. As a result,
Shark includes some special, Java-only configurations that use this interface to allow you to usefully profile
your Java applications.
Figure 4-10
How Shark-for-Java differs from regular Shark configurations
*AVA#LASSES
*AVA3HARKATTACHESTO
THE*6-INSTEAD
*AVA6-
3HARKNORMALLYPROFILES
BYLOOKINGATTHEMACHINE
.ATIVE-ACHINE
Java Tracing Techniques
Shark supports three different techniques for examining your Java applications:
●
Java Time Profile: This is the Java version of Time Profile . The targeted Java program is periodically
interrupted and Shark records the method that was running and the callstack of method calls leading up
to the current method. You may examine the results using browsers that are almost identical to the normal
Time Profile ones described in Profile Browser (page 32), except that they only list Java methods and
libraries. Note that, because a fair amount of code must be executed to communicate with the JVM,
overhead requirements for a Java Time Profile are somewhat higher than for a conventional time profile.
Using the mini-config editor (see Mini Configuration Editors (page 19)), you can adjust the sampling rate
at the millisecond level.
●
Java Call Trace: This is the Java analog to the separate Saturn program. Java Call Trace records each call
into and exit from every Java method during the execution of your program. As a result, it records an
exact trace of all the method calls, much like a normal System Trace records an exact trace of all system
calls. The amount of time spent in each method is also recorded. While this provides very exact and detailed
information about the execution of your program, with no potential for sampling error, it also incurs a
significant amount of system overhead due to the frequent interruptions of your code to pass information
back to Shark. As a result, Shark’s overhead may distort the timing of your program to a certain extent,
and this factor should be considered if you have code that is sensitive to external timing adjustments.
Also, due to the large amount of data that can be collected very quickly, you probably want to limit the
use of this to relatively short timespans. When complete, Shark presents the information that it has collected
in a browser virtually identical to one produced by a Java Time Profile.
Retired Document | 2012-07-23 | Copyright © 2012 Apple Inc. All Rights Reserved.
109
Other Profiling and Tracing Techniques
Using Shark with Java Programs
●
Java Alloc Trace: This records memory allocations and the sizes of the objects allocated, and is analogous
to a regular Malloc Trace (Malloc Trace (page 101)). Not surprisingly, the resulting session window produced
by Shark is very similar to one produced by Malloc Trace . As with Malloc Trace , the display is just that of
a Time Profile — albeit a Java Time Profile, in this case — with an added “allocation size” column. As with
the previous two techniques, the overhead imposed by the Shark while doing a Java Alloc Trace is large
enough that it may affect some programs that are very sensitive to external timing adjustments. Also, due
to the large amount of data that can be collected very quickly, you probably want to limit the use of this
to relatively short timespans.
Linking Shark with the Java Virtual Machine
In order to let Shark connect to your JVM and access its internals, to get the detailed information used by all
of the techniques described earlier, the Java Virtual Machine first needs to load the “Shark for Java” extension.
The method for doing this varies, depending upon which version of the JVM you’re using (use the command
java -version to see which one you are running):
●
JVM 1.3 or earlier: Shark will not work with these, as they do not have the necessary external debugging
support.
●
JVM 1.4: Add the following flag to your Java VM command line options: –XrunShark.
●
JVM 1.5 or later: Add the following flag to your Java VM command line options: -agentlib:Shark.
If you are using Xcode to build your Java application, edit the program’s target. Under the Info.plist Entries ,
select Pure Java Specific . In the Additional VM Options field, add -XrunShark or -agentlib:Shark as
appropriate.
When you run a Java program with Shark for Java, the program will output to the shell (or console for a
double-clickable target) a message similar to the following:
2004-06-27 03:33:24 java[4489] Shark for Java is enabled...
As soon as you see this message you can begin sampling with Shark. When you choose one of the Java tracing
configurations in Shark’s main window, the process list will change to only display Java processes that are
running with Shark for Java loaded. Non-Java processes and Java processes that have been started without
Shark support will both be eliminated.
To use source navigation, the program’s source must be on disk in package hierarchy structure. Shark does
not support inspection within jar files. If you have a jar such as
/System/Library/Frameworks/JavaVM.framework/Home/src.jar, you will need to extract it into a
directory hierarchy (jar -xvf src.jar for the example). When adding a path to the Source Search Path
(see Shark Preferences (page 24)), add only the path to the root of the source tree.
Retired Document | 2012-07-23 | Copyright © 2012 Apple Inc. All Rights Reserved.
110
Other Profiling and Tracing Techniques
Event Counting and Profiling Overview
Event Counting and Profiling Overview
After analyzing an application using a Time Profile , you may find it informative to count system events or even
sample based on system events in order to understand why your application spends time where it does. The
best way to do this is to take advantage of the performance counters built into your Mac’s processors (usually
called PMCs) and Mac OS X itself. Shark provides built-in configurations to help you access this information in
meaningful ways:
●
Processor Bandwidth (x86) or Memory Bandwidth (PowerPC): These configurations track off-chip memory
traffic over time. Because of differences in the implementation of the counters, the PowerPC version
measures memory bandwidth only, while the x86 version measures processor bus bandwidth, including
traffic to memory, I/O, and other processors.
●
L2 (Data) Cache Miss Profile: This configuration provides an event-driven profile of L2 cache misses. As
each L2 cache miss causes the processor to stall for a significant amount of time while it accesses main
memory, algorithms that arrange accesses to memory in ways that minimize these misses will tend to run
faster than ones that do not.
The rest of this section attempts to describe how you can use these default configurations to get useful
information about your system with Shark, and learn about performance counters in the process. However,
the default configurations only scratch the surface of what Shark’s counter recording mechanisms can do.
Using the mini-configuration editor (see Mini Configuration Editors (page 19)) associated with each of these
configurations, you can adjust the same parameters used with a normal Time Profile mini-config editor (see
Taking a Time Profile (page 31)) to control things like sampling rate, time limit, and the like. Beyond this, using
the full Configuration Editor , you can set up a variety of other configurations to count or sample a variety of
hardware or software events, such as instruction stalls or page misses. See Custom Configurations (page 183)
and Hardware Counter Configuration (page 202) for more information.
Timed Counters: The Performance Counter Spreadsheet
This section uses the built-in Processor Bandwidth and Memory Bandwidth configurations as an example of
how to use Shark’s Performance Counter Spreadsheet, its mechanism for analyzing and displaying sessions
that record performance counters in a regular, timed fashion.
After you perform sampling with one of these configurations, you will be presented with a session window
containing a Performance Counter Spreadsheet like the one shown in Figure 4-11. This window contains many
features:
1.
Column Control Table— This optional table lists the columns in the Results and PMC Summary tables to
the right, providing longer names and allowing you to hide columns. It may be hidden or exposed using
the window splitter on its right edge or a checkbox in the Advanced Settings drawer (see Performance
Retired Document | 2012-07-23 | Copyright © 2012 Apple Inc. All Rights Reserved.
111
Other Profiling and Tracing Techniques
Event Counting and Profiling Overview
Counter Spreadsheet Advanced Settings (page 116)). Selecting rows in this list also selects the corresponding
columns in the counter table, graphing them. Use Command-clicks (for discontiguous selection) and/or
Shift-clicks (for contiguous selection) to select multiple rows simultaneously.
2.
a.
“Eye” Column — Uncheck the checkboxes in this column to hide columns in the results table(s). This
is very helpful if you have a large number of columns.
b.
Term Column — Contains the short names for the columns, which can be used as terms in “shortcut
equations,” as described below.
c.
Description Column — Contains the long names for the columns, for your reference. This can be useful
when you have many columns with long names that do not fit into the name cells at the tops of the
columns.
Results Table— This table shows the actual results from performance counters and any derived results
calculated from them. You can Control-click (or right click) anywhere on this table to bring up the Counters
menu, described in The Counters Menu (page 115).
a.
Column Names — These provide a brief description of the contents of the column. If you find a name
too terse, then you may want to open up the Column Control Table and see the longer description
there. In addition, clicking on these names selects one or more columns of data to be graphed below
in the Results Chart . Use Command-clicks (for discontiguous selection) and/or Shift-clicks (for
contiguous selection) to select multiple columns simultaneously. By default, the first performance
counter column (“M/C Read/write request beats,” in this example) is automatically selected and
graphed when the window is first opened. Finally, you can resize any columns by clicking-and-dragging
on the lines separating these cells from each other.
b.
Index Column — Lists an integer value associated with each sample, counting from 1 on up, for your
reference. This column can be hidden from display using the appropriate checkbox in the Advanced
Settings drawer (see Performance Counter Spreadsheet Advanced Settings (page 116)). This column
may not be selected or graphed.
c.
Timebase Column(s) — Contains the time between each sample, with one column for each processor
in the system. Normally, these should be essentially constant, but you may see occasional glitches
where a sample took slightly longer than normal to record due to interrupt contention on a processor.
The first and/or last samples may also show some timing variation. In addition, you will see significant
variation here if you choose to view results from an event-driven counter run (see Event-Driven
Counters: Correlating Events with Your Code (page 119)) using the counter “spreadsheet.” These
columns may be shown or hidden using checkboxes in the Column Control Table to the left.
d.
Counter Result Column(s) — These columns show the “raw” results recorded from performance counters,
one column per active counter. These columns may be shown or hidden using checkboxes in the
Column Control Table to the left.
Retired Document | 2012-07-23 | Copyright © 2012 Apple Inc. All Rights Reserved.
112
Other Profiling and Tracing Techniques
Event Counting and Profiling Overview
e.
Shortcut Result Column(s) — These columns show the performance counter results after they have
been processed by the math in any “shortcut” equations. These columns may be shown or hidden
using checkboxes in the Column Control Table to the left, and the “shortcut” equations may be viewed
or edited using the controls in the Advanced Settings drawer (see Performance Counter Spreadsheet
Advanced Settings (page 116) and Adding Shortcut Equations (page 119)).
3.
PMC Summary Table— This window pane extends the Results Table with additional rows that list the
total, average (arithmetic mean), geometric mean, minimum, and maximum values for each column. This
pane can be hidden from display using the appropriate checkbox in the Advanced Settings drawer (see
Performance Counter Spreadsheet Advanced Settings (page 116)) or the window splitter at the top of the
pane.
4.
Results Chart— This graph charts the values in the selected column(s) in the Results Table. There are
many options for controlling this graph in the Advanced Settings drawer (see Performance Counter
Spreadsheet Advanced Settings (page 116)). The chart starts out scaled so that it fits entirely within the
window allocated, but you can also magnify the chart and the scroll to any part of the magnified chart
using the magnifier sliders and scroll bars along both the right side and bottom. In addition, you can print
the contents of this graph using a command in the Counters menu (see The Counters Menu (page 115))
and vary the percentage of the window’s space allocated to the chart using the window splitter at its top
edge.
5.
Session Summary— This line of text summarizes key facts about the session, including the number of
processors, the number of samples taken, and the total time that elapsed during counter sampling.
In Figure 4-11, the last two columns have been selected and their contents displayed together in the chart.
These last two columns are not actual event counts, but the results of “Shortcut Equations.” These equations
are simple mathematical combinations of the “raw” counts recorded by Shark. Shortcut equations can be added
to the configuration before a profile is taken, or just as easily be added to a session afterwards. In this session,
the “Read MB/s,” and “Write MB/s” columns were generated by performing some simple arithmetic on the
entries in the two “M/C Read/write request beat” columns (reads to left, writes to right). Every counter sample
is multiplied by 16 (bytes per beat), multiplied by 100 (samples per second) and divided by 220 (bytes per
megabyte), which yields MB/s in each new column. For a brief introduction to adding equations to your sessions,
Retired Document | 2012-07-23 | Copyright © 2012 Apple Inc. All Rights Reserved.
113
Other Profiling and Tracing Techniques
Event Counting and Profiling Overview
see Adding Shortcut Equations (page 119), below. For a complete description of how to write performance
counter equations, including how to add them permanently to your configurations, see Counter Spreadsheet
Analysis PlugIn Editor (page 196).
Figure 4-11
Performance Counter Spreadsheet
Retired Document | 2012-07-23 | Copyright © 2012 Apple Inc. All Rights Reserved.
114
Other Profiling and Tracing Techniques
Event Counting and Profiling Overview
The Counters Menu
When you switch to the Counters tab in a session made with timed performance counters, a Counters menu
will appear in the menu bar. You can also access this menu by control-clicking (or right-clicking, with a 2-button
mouse) in the Results table , as shown in Figure 4-12.
Figure 4-12
Counters Menu
This menu contains several commands that allow you to work with the performance results:
●
Number Formatting— This submenu lets you adjust how the (often quite large) numbers are displayed
in the Results Table :
●
Show 1000’s Separator — Add thousands separators (typically commas) to the values. You can also
choose this using the keyboard shortcut Command-/ .
●
Use Scientific Notation — Toggles between standard (e.g. 100) and scientific (1.0E2) notation. You can
also choose this using the keyboard shortcut Command-^ .
●
Increase Decimal Places — Increases the number of digits of precision used to display floating-point
values by one decimal place. Because performance event counts are integers, this normally only affects
shortcut equation results and timebase columns. You can also choose this using the keyboard shortcut
Command- .
●
Decrease Decimal Places — Decreases the number of digits of precision used to display floating point
values by one decimal place. Because performance event counts are integers, this normally only affects
shortcut equation results and timebase columns. You can also choose this using the keyboard shortcut
Command- .
●
Print Chart…— Allows you to print the currently displayed chart, using a standard Mac Print dialog box.
●
Save Text File…— Exports the current Results Table values as a comma-separated value (CSV) format text
file. This resulting text can be imported into an application like Excel for further analysis.
Retired Document | 2012-07-23 | Copyright © 2012 Apple Inc. All Rights Reserved.
115
Other Profiling and Tracing Techniques
Event Counting and Profiling Overview
Performance Counter Spreadsheet Advanced Settings
With the session window in the foreground, select Window Show Advanced Settings (Command-Shift-M ), as
we described earlier in Advanced Settings Drawer (page 23). The palette of advanced controls will appear
(Performance Counter Spreadsheet Advanced Settings).
Figure 4-13
Performance Counter Spreadsheet: Advanced Settings
A
D
C
B
E
A
B
C
D
A
B
C
E
D
F
G
H
I
J
Retired Document | 2012-07-23 | Copyright © 2012 Apple Inc. All Rights Reserved.
116
Other Profiling and Tracing Techniques
Event Counting and Profiling Overview
This drawer contains three main panels, each with many different controls that affect the presentation of
results:
1.
2.
3.
Counter Shortcut Equations— This table displays the “Shortcut Equations” used to generate each of the
computed results columns in the Results Table , one equation per row. Both equations that were included
right in the configuration and ones that you add yourself after the session has been recorded are listed
here, and you can freely edit any of them here. The table consists of a few fairly straightforward parts:
a.
Term column — This column lists the “term” name for this equation (usually eq01, eq02, etc.). This is
the shorthand name that you can use to include the results of this equation in a subsequent, dependent
equation. These “term” names, plus the “term” names for the original performance counter data, are
also listed in the Column Control Table described previously in Timed Counters: The Performance
Counter Spreadsheet (page 111).
b.
Name column — Here is where you may edit the label that will appear as the column header for this
shortcut equation’s results.
c.
Equation column — You can define or edit the equation used to calculate the entries in the shortcut
column here, using the techniques described below in Adding Shortcut Equations (page 119).
d.
Add button — Creates a new “shortcut equation” and a Results Table column for it..
e.
Delete button — Removes the selected shortcut(s) and their associated columns from the Results Table .
Counter Table Settings— This section of the drawer lets you adjust the appearance of the tables within
the counter spreadsheet window.
a.
Show Column Control Table — Toggles display of the Column Control Table to the left side of the
Results Table .
b.
Show Index Column — Toggles view of the index column in the Results Table .
c.
Show PMC Summary Table — Toggles display of the PMC Summary Table below the Results Table .
d.
Timebase Units popup — Allows you to change the units used in the time base column(s) to something
more appropriate. Selections are listed in order of increasing size: CPU cycles, bus cycles, microseconds,
milliseconds (default), and seconds.
Counter Chart Settings— This section of the drawer lets you adjust the appearance of the chart within
the counter spreadsheet window.
a.
b.
Multiple Data Set Chart Mode — These buttons select how you would like the chart to display when
multiple columns are selected:
●
One combined chart for all selected result columns
●
Separate charts for each selected column
Chart Type — Selects the type of chart that will be displayed:
●
Lines — Display results as line charts. There are several sub-options for displaying these charts,
which can be selected using the two menus below.
Retired Document | 2012-07-23 | Copyright © 2012 Apple Inc. All Rights Reserved.
117
Other Profiling and Tracing Techniques
Event Counting and Profiling Overview
c.
d.
●
Bars — Display results using a vertical bar chart. Bars from multiple selected columns will be
superimposed over one another.
●
Stacks of Bars — Display results as stacked vertical bar charts, with the values from all selected
columns added together at each sample point. This chart is identical to the standard bar chart if
only one column is selected
Line Chart Subtype — This menu fine-tunes line charts by controlling the display of symbols at data
points on the line charts:
●
Lines and Markers — Display both symbols at each data point and lines to join them up.
●
Lines — (default) Only displays lines joining the data points together.
●
Markers — Only displays symbols at each data point.
●
Small Markers — Same as previous, but the symbols are significantly smaller.
Line Chart Data Compression — This menu lets you apply filters to smooth out the data plotted using
a line chart. These filtering options are not allowed with bar and stacked bar charts.
●
Average — Applies a moving average (FIR) filter to the data in order to smooth it out.
●
IIR Filter — Applies an IIR averaging filter to the data to smooth it out.
●
None — (default) No smoothing applied, so you see only actual values.
e.
Enable Data Point Tool Tips — When enabled, hovering the mouse pointer over a data point in a data
set shows the x- and y-values for that point in a pop-up window.
f.
X-Axis Units — The horizontal scale can be plotted in two ways:
●
Elapsed Time — The elapsed time since the beginning of the session, in the units specified with
the Timebase Units popup above.
●
Sample count — The sample index, or values from the index column.
g.
Y-Axis Scale — Data can be plotted vertically on a linear or logarithmic (base 10) scale.
h.
Show Grid Lines — This lets you control the display of grid lines within the chart. You can toggle all
grid lines together or independently toggle major grid lines, minor grid lines, x-axis (all vertical) grid
lines, and y-axis (all horizontal) grid lines.
i.
Show Legend — Toggles whether or not to show a legend, displaying color-to-data column associations,
along with the chart. When enabled, you can select the position of the legend for the chart — above,
to the right, or below — using the popup menu just below.
j.
Show/Hide Separate Chart View... — This opens or closes a separate window for the chart view, freeing
it from its normal position below the Results Table . While it does not enable any new functionality,
this option can be useful if you have a widescreen display, and want to position the Results Table and
Results Chart side-by-side instead of top-and-bottom, or if you have multiple monitors attached to
your Macintosh and would like to put the Results Table and Results Chart on different screens.
Retired Document | 2012-07-23 | Copyright © 2012 Apple Inc. All Rights Reserved.
118
Other Profiling and Tracing Techniques
Event Counting and Profiling Overview
Adding Shortcut Equations
This section gives a brief summary of how to add new “shortcut equation” results columns to your performance
counter spreadsheet. For a full description of all the capabilities of shortcut equations, see Using the Editor (page
196).
1.
Open up the Advanced Settings drawer, if you do not already have it open.
2.
Click the “Add” button, in the Counter Shortcut Equations palette, and enter a name for your new equation.
3.
Double-click on the “Equation” field in the row for your new equation, and enter your equation. You may
use any terms from previous columns (using the short names in the term list from the Column Control
Table ) and numeric constants, combined using simple 4-function arithmetic — addition (+), subtraction
(-), multiplication (*), and division (/).
4.
Press Enter when you are done editing your equation. A new column will immediately appear in the Results
Table with the results from your computation. You may then examine, graph, or use the numbers in that
column in subsequent equations, just as if they had been there from the start.
Event-Driven Counters: Correlating Events with Your Code
Like Time Profiling, using performance counters in “timed counter” mode only performs timed sampling of
the various counters, giving you a set of samples with a statistical view of how your application works. However,
you may want record more exact information, more like what you can record using System Trace. This is possible
using event sampling , which is used by the default L2 Cache Miss Profile configurations. In this case, you set
up a performance counter to interrupt the processor and record a new sample after it has counted a
predetermined number of events. Because hardware events happen quickly, you will usually want to have this
be a fairly large number, but with some lower-frequency counters it is possible to set the value as low as 1,
allowing you to get an exact event trace.
When complete, a standard profile browser will appear, which looks much like the ones created for Time
Profiling (see Profile Browser (page 32)). However, the results must be interpreted quite differently. Because
of the unusual way that sampling is triggered, the sample percentages (or counts) do not represent time
percentages, but instead show event percentages. This distinction is not clearly marked on the columns, so
you must be careful when reading and interpreting the results. With these results presented in this way, you
can get a good idea about which routines and even which lines of code are responsible for causing the largest
number of performance-draining events, such as L2 cache misses, in a manner that is completely analogous
to interpreting a conventional Time Profile .
Retired Document | 2012-07-23 | Copyright © 2012 Apple Inc. All Rights Reserved.
119
Other Profiling and Tracing Techniques
Event Counting and Profiling Overview
Note: The built-in L2 cache miss profile configuration is a great way to find lines in your code that
access memory in ways that cause very slow L2 cache misses, events which can significantly slow
down processors like the ones in modern Macs. Optimizing this code to reduce the number of cache
misses by adjusting your algorithms and/or memory access patterns can be a very helpful way to
improve performance significantly.
Event sampling can only be triggered by a single PMC at a time, so you can only trigger on a single event type
(such as L2 misses or off-chip data movement) per session. The value of other counters can be recorded at the
same time, but they cannot be used as triggers. While this can be a serious disadvantage, it is balanced out by
the fact that you are able to capture your program’s callstack exactly where the event is occuring, allowing
you to see exactly which lines of code are causing the events, instead of the approximate locations returned
by “counter” mode profiling. In general, if you need to visualize system-wide or process-wide performance
events over time without associating performance events to a specific piece of code, the timed counter method
is appropriate. On the other hand, if you need to associate performance events precisely with source code that
is causing the event to occur, then event sampling is the better choice. These various pros and cons are
summarized below:
Timer Sampling
Pros
Cons
Event Sampling
●
Measure multiple performance events
over time.
●
Very precise; can relate performance
events to a small window of instructions.
●
Produce meaningful system and process
level chart of performance events.
●
Works with any processor.
●
Results are easy to interpret on
multiprocessors.
●
Normally no correlation with your code.
●
With callstack recording enabled (see
below), event-code correlation is very
approximate.
Trigger on only a single performance
event per session.
●
●
No chart of performance events.
●
It is harder to interpret results on
multiprocessors, since events do not
occur simultaneously on all processors.
●
Not available on older PowerPC
processors (G3 and G4).
Retired Document | 2012-07-23 | Copyright © 2012 Apple Inc. All Rights Reserved.
120
Other Profiling and Tracing Techniques
Event Counting and Profiling Overview
While none of the default configurations use this capability, it is also possible to essentially record callstacks
like a Time Profile simultaneously with timed counter information, giving you timed counter recording with a
way to approximately correlate results with your code, by building your own custom configuration. In this
case, the chart view adds new graphs that allow you to look for correlations between performance monitor
counts and what code was running at the time a sample was taken, merging elements of the Counters viewer
in with the standard Time Profile chart view. An example of using the Chart view with PMCs in counter mode
(raw values graphed over time) is shown in Figure 4-14. With these graphs, you can click on them at any point
to see the callstacks that correspond with that part of the profile. However, be aware that the callstack locations
only record approximately what code was executing at the time the counts were recorded, and may not be
representative if the sampling rate is significantly lower than the rate at which your program calls functions.
This potential defect is the reason why none of the default configurations use this technique, even though it
can sometimes be useful if used judiciously.
Figure 4-14
Chart View with additional timed counter graphs
Retired Document | 2012-07-23 | Copyright © 2012 Apple Inc. All Rights Reserved.
121
Advanced Profiling Control
Although the Start button makes starting and stopping Shark quite simple, sometimes it can be impractical,
or even impossible to use. For example, how can you press the start button on a headless server? Profiling
application launch can be hard to accomplish by hand as well. And what if you are only interested in profiling
one particular “hot” loop, buried somewhere deep within your application?
This section discusses various advanced ways to control what Shark profiles, when it profiles, and how the
resulting profile relates to your target execution.
Process Attach
It’s not always beneficial to profile the entire system — often there is just too much information. For this reason,
Shark allows you to target any process in the system individually, further focusing your profile. In this mode,
Shark will only save samples from the target process, while discarding any others.
Figure 5-1
Process Attach
When you enter this mode by selecting Process from the Target popup in Shark’s main window(or use
Command-2 ), the Shark window will expand, adding a new popup — the Process List , as we show in Figure
5-1. By default, the Process List is sorted by process name, and you will only see processes that you own. To
change these defaults, open the preferences by selecting the Shark Preferences menu item (Command-Comma )
and adjust the values for the Process List under the “Appearance” tab Shark Preferences (page 24).
Process Launch
Attempting to profile launch times for your application by hand can be a frustrating endeavor. Profiling an
application (or part of one) that only runs for a short time can be similarly difficult. For this reason, Shark allows
you to launch your application directly, from within Shark. To instruct Shark to launch your process, enter
Retired Document | 2012-07-23 | Copyright © 2012 Apple Inc. All Rights Reserved.
122
Advanced Profiling Control
Process Launch
Process Attach mode, by selecting Process from the Target popup (Command-2 ). Now, select the “Launch...”
target from the top of the process list (or use Command-Shift-L ). Choosing this “process” and then pressing
“Start” will bring up the Process Launch Panel, shown below in Figure 5-2.
Figure 5-2
Launch Process Panel
Once the Process Launch Panel has appeared, you need to “fill in the blanks” in order to tell Shark how to
launch your application. If you reach here by choosing Debug Launch Using Performance Tool Shark in Xcode,
most of these blanks will be completed for you. At the very least, you must choose an executable file before
pressing “OK” and continuing. However, you can also supply many other bits of information to Shark in order
to simulate the launching of your application from a command-line shell prompt, and specify a couple of
options to help limit capture of spurious samples.
1.
Executable— The full path to the executable. You can either type it here or press the “Set...” button and
then find it using a normal Mac “Open File...” dialog box. For Mac applications, you can set this to be either
the entire application or the core binary file inside of it.
Retired Document | 2012-07-23 | Copyright © 2012 Apple Inc. All Rights Reserved.
123
Advanced Profiling Control
Process Launch
2.
Working Dir— The full path to the working directory that the application will start using. By default, this
is the path where the executable is located, but you may point it anywhere else that you like. When the
application is executed, it will appear to have been started from a shell that had this directory as its working
directory (i.e. the output of pwd) just before executing the command. Hence, relative paths to data files
will start being determined from this directory.
3.
Arguments— Enter any arguments here that you would have normally entered onto your shell command
line after the name of the executable. Shark will feed them into the application just as if they had come
from a normal shell. Note that since Shark’s “shell” does not have any text I/O, you will need to provide <
stdin.txt and > stdout.txt redirection operations here if your executable expects to use stdin
and/or stdout “files.”
4.
Environment Variables— Supply any environment variables that must be set before your application
starts in this table. Otherwise, Shark will start your application with no environment variables set (it even
clears out any “defaults” that you may have had before invoking Shark). Pressing the “+” and “–” buttons
below the table allows you to add or remove environment variables, respectively. Once added, you can
freely edit the names of the variables and their value in the appropriate table cells.
5.
Stop sampling if this application exits— If checked, Shark stops sampling immediately after your
application completes. Hence, this will prevent Shark from capturing a bunch of samples that have nothing
to do with your application if it completes quickly.
6.
Cancel & OK— Shark will start your application and sample it immediately after you hit OK. If you change
your mind, Cancel will return you back to the main Shark window.
Retired Document | 2012-07-23 | Copyright © 2012 Apple Inc. All Rights Reserved.
124
Advanced Profiling Control
Batch Mode
Batch Mode
Batch mode queues up any sessions recorded without displaying them. Pending sessions are listed in the main
Shark window. Batch mode allows multiple sessions to be recorded in quick succession, by not immediately
incurring the overhead of displaying the viewers for each session. To enter Batch Mode, select the Sampling atch
B
Mode menu item (or Command-Shift-B ).
Figure 5-3
Batch Mode
Batch mode is most useful when paired with remote control from within your application’s code, profiling
multiple hot loops in quick succession, during a single program execution. Using a different session label for
each loop, you can rapidly obtain multiple profiles for later investigation. See Performance Counter Spreadsheet
Advanced Settings (page 116) for information on using this technique.
Windowed Time Facility (WTF)
For measuring hard to repeat scenarios, Shark provides the Windowed Time Facility (abbreviated as WTF ) with
the Time Profile and System Trace configurations. The Windowed Time Facility directs Shark to only record
and process a finite buffer of the most recently acquired samples, allowing it to run continuously for long
periods of time in the background. This continuous behavior allows you to stop profiling just after something
interesting occurs. At this point, Shark processes the samples in the window of time just before profiling was
terminated. This allows you to determine what part of your program’s execution is “interesting” after it occurs,
instead of trying to anticipate it in advance. Now, you effectively have the benefit of hindsight for finding hard
to repeat problems.
Another way of describing how WTF mode works is how it modifies Shark’s normal “start” and “stop” behavior.
Generally, Shark processes all the data between the “start” and “stop” trigger events, as is shown in Figure 5-4.
Most commonly, users start Shark just before entering an “interesting” period of execution and stop it when
Retired Document | 2012-07-23 | Copyright © 2012 Apple Inc. All Rights Reserved.
125
Advanced Profiling Control
Windowed Time Facility (WTF)
leaving the area of interest. However, you may not always know when you will encounter the “interesting”
region of your program in advance. WTF mode sidesteps this problem by eliminating the need to “start”
normally. While Shark stops in the normal way, as we show in Figure 5-5, the starting position is just a fixed
number of samples (or effectively amount of time, with Time Profiling) before the end, instead of at a
user-specified point.
Figure 5-4
Normal Profiling Workflow
Figure 5-5
Windowed Time Facility Workflow
Retired Document | 2012-07-23 | Copyright © 2012 Apple Inc. All Rights Reserved.
126
Advanced Profiling Control
Windowed Time Facility (WTF)
Tracing the execution around an asynchronous event, such as inter-thread communication, the arrival of a
network packet, or OS event such as a page fault, are all situations when WTF mode can make profiling easier,
especially when these “glitches” occur at hard-to-predict times.
This mode of profiling is especially useful for game programming; often, the timing of calls to performance-critical
code regions is highly dependent upon a player’s actions, which can be hard to reproduce. For example, assume
you are developing a video game engine and occasionally see the frame rate drop and/or video glitches. If the
conditions for causing the glitch are unpredictable and inconsistent, then you would normally have to start
sampling, attempt to reproduce the problem, and then stop sampling afterwards. If the glitch is rare, then
odds will be low that you will catch the glitch within the limited sampling window, creating an extremely
frustrating workflow. With WTF mode, in contrast, you can just start Shark and forget about it — until the glitch
actually occurs, when a quick press of the “stop” button will capture the sequence of samples involving the
glitch.
WTF mode can be enabled in several different ways. In order of increasing complexity, it can be turned on
through any of the following three options:
●
You can select the Time Profile and System Trace configurations with “WTF” included in the name from
the Configuration popup (see Main Window (page 17)).
●
WTF is an option for the “normal” Time Profile and System Trace configurations which may be enabled by
checking the “WTF Mode” check boxes in the mini-configuration editors associated with these configurations
(see Taking a Time Profile (page 31) and Basic Usage (page 64)).
●
You may include this option in your own configurations that use the “Timed Samples & Counters” or
“System Trace” data source plugins (see Simple Timed Samples and Counters Config Editor (page 186) and
System Trace Data Source PlugIn Editor (page 193)).
In addition, WTF mode works perfectly well with all of the different ways to effectively press “start” and “stop”
described in this chapter. For example, instead of manually pressing “stop” at the end of your WTF region, you
might have code in your program detect “glitch” conditions and programmatically fire a “stop” signal using
the techniques described in Programmatic Control (page 134).
WTF with System Trace
In most ways, WTF mode functions exactly the same when used with both the Time Profile and System Trace
configurations. However, there are two notable differences.
First, since System Trace is event-driven, and not time interval-driven, the “window” is actually a fixed number
of system events per processor, and not a fixed window of time. Therefore, the actual period of time represented
by the window is highly dependent on the rate that system events occur for each processor. If these events
occur very rapidly, the window might be quite short in time; if these events occur infrequently, the window
might represent a long interval.
Retired Document | 2012-07-23 | Copyright © 2012 Apple Inc. All Rights Reserved.
127
Advanced Profiling Control
Unresponsive Application Measurements
Second, the beginning of a WTF System Trace Timeline (see Figure 5-6) can appear a bit strange; different
processors might first appear at vastly different points in the timeline. In the figure below, the timeline for the
processor at (1) begins well before the other three processor timelines at (2). This occurs because each processor
maintains its own “window” of samples, and system events can occur at vastly different rates on each processor.
As a result, each processor’s window of samples can correspond to different periods of time. Since all processors’
timelines end at the same time, the effect of this is that some processors won’t show up in the timeline until
much later than other processors.
Figure 5-6
The Windowed Time Facility Timeline
Unresponsive Application Measurements
During the development process, there may come a point where your application goes unresponsive, and the
dreaded spinning rainbow cursor is displayed (
). Often, the situations in which this happens can be hard
to repeat. For these situations, Shark provides Unresponsive Application Triggering, allowing you to automatically
sample whenever an application becomes unresponsive. This method of triggering is enabled by selecting the
Retired Document | 2012-07-23 | Copyright © 2012 Apple Inc. All Rights Reserved.
128
Advanced Profiling Control
Command Line Shark
Sampling UnresponsiveApplications menu item (Command-Shift-A ). When Unresponsive Application Triggering
is enabled, Shark will automatically switch to Batch Mode and display unresponsive application triggering
options, as shown below.
Figure 5-7
Unresponsive Application Triggering
Unresponsive application profiling can be limited to a single application by setting the Application Name Filter
check box and filling in a name or partial name in the associated text field. The threshold for the amount of
time an application is unresponsive (does not respond to mouse or keyboard events) can be set by entering
a value (in seconds) in the Unresponsive Time Threshold text field. With this, you can eliminate sampling of
expected, brief bits of unresponsive time and focus instead on the really long and painful occurrences.
Note: The Unresponsive Time Threshold value modifies the system-wide definition of what an
“unresponsive application” actually is, and will consequently change the amount of time from the
last time the application was responsive to the first time that the system presents the spinning
rainbow cursor for it.
Command Line Shark
In some situations, such as profiling on headless servers, it is not possible to use the graphical user interface
at all. For these cases, use /usr/bin/shark. Command line shark supports the major features of its graphical
counterpart for data collection, but does not do much with the recorded data beyond saving sessions. In
Retired Document | 2012-07-23 | Copyright © 2012 Apple Inc. All Rights Reserved.
129
Advanced Profiling Control
Command Line Shark
general, it is intended that you use it to collect sessions and then review your results with a graphical copy of
Shark later. This section will discuss some common ways to use command line shark. A more complete
description of the options available when using command line shark is available in its man page, shark(1).
Basic Methodology
There are four main ways to use command-line shark. With the exception of network mode, which can run
along with interactive and remote modes, any one invocation of shark is locked into using only one of these
modes for its entire duration.
Interactive Mode
By default, command-line shark works in a simple interactive mode. After starting up, it records sessions on
demand through a simple, three-step process:
1.
shark waits in the background until it spots a “hot key” press, and then it starts sampling. On your local
system, the hot key same as graphical Shark (Option-Escape , by default), while on remote terminals it
defaults to Control-\ , since this key combination can be transmitted through a generic terminal.
2.
When you press the same “hot key” again, shark will stop sampling and begin analyzing its samples to
produce a standard Shark session file. It displays progress as this occurs, and then writes out the session
file to disk, using the name session_XX.mshark (XX = a number) and the current terminal directory by
default. When complete, shark waits for another “hot key” press.
3.
If you press Control-c instead of a “hot key,” then shark will terminate and return you to the shell prompt.
After shark completes, you will have a sequence of Shark session files that you may then examine at your
leisure with graphical Shark. Of course, there are many ways to modify this basic methodology, described in
the next few sections.
Immediate Mode
Command line shark also supports immediate mode, where it starts sampling immediately after it is launched
with no user interaction, and quits after it finishes profiling — usually after 30 seconds, or when the user presses
Control-C . This is often useful for invocation from shell scripts. To launch shark in this mode, use the -i option,
as follows:
shark -i
Retired Document | 2012-07-23 | Copyright © 2012 Apple Inc. All Rights Reserved.
130
Advanced Profiling Control
Command Line Shark
Remote Mode
A third way to use command line shark is remote mode, which works much like the remote mode supported
by graphical Shark and described in Interprocess Remote Control (page 134). Once started in this mode, shark
will wait for start/stop signals from other processes to arrive in any one of three ways:
1.
A program instrumented with chudStartRemotePerfMonitor() and chudStopRemotePerfMonitor()
calls can start and stop shark, respectively. This works the same as the equivalent functionality described
in Programmatic Control (page 134).
2.
The utility program chudRemoteCtrl can start and stop shark. This works the same as the equivalent
functionality described in Command Line Remote Control (page 137).
3.
The UNIX SIGUSR1 and SIGUSR2 signals can be sent to shark’s PID by your program or the UNIX kill
utility with the “-s USR1” and “-s USR2” options. It will interpret SIGUSR1 as a start/stop toggle and
SIGUSR2 as a command to stop sampling and generate a session.
To launch shark in this mode, use the -r option, as follows:
shark -r
Network Mode
Finally, command line shark supports network mode, where it is controlled remotely by graphical Shark
running on another computer. When enabled, shark starts up in interactive (or remote) mode, and works
normally that way. However, it also listens for network connections from graphical Shark running on different
Macintoshes. You can then use a combination of local start/stop operations and network start/stop operations
while shark is running. To launch shark in this mode, use the -N option, as follows:
shark -N
A full description of network shark usage is in Network/iPhone Profiling (page 138).
Common Options
Many of Shark’s configurations, such as Time Profile and System Trace , support common options such as time
and sample limits. Command line shark allows you to change these limits for configurations that support
them. These common options include:
●
Time Limit — shark -T allows you to change the time limit. Valid times are any integer followed by “u,”
“m,” or “s,” corresponding to microseconds, milliseconds, and seconds, respectively.
Retired Document | 2012-07-23 | Copyright © 2012 Apple Inc. All Rights Reserved.
131
Advanced Profiling Control
Command Line Shark
●
Time Interval — shark -I allows you to change the sampling interval for configurations that support a
sampling interval. Valid times are entered the same way as for time limits.
●
Sample Limit — shark -S allows you to specify the maximum number of samples to record during each
session.
Some other, less commonly used options change the behavior of shark:
●
Quiet Mode — shark -q will limit terminal output to reporting of errors only.
●
Ignore task exits — shark -x will instruct shark to ignore task exit notifications. Normally, shark gets
notified when tasks are about to exit while it is profiling. This allows shark to collect some basic information
about the task just before it is allowed to quit. It is possible, though not likely, that this can cause gaps in
profiling. Use of this option is discouraged. This is equivalent to the use of the similarly named preference
in Shark Preferences (page 24).
●
Change default filename — shark -o allows you to change the default session file name from
session_XX.mshark to a user supplied name. This name will be appended with a unique number to
create a unique file name. For example, shark -o myfile will result in session files names
myfile_01.mshark, myfile_02.mshark, and so on.
●
Change session file path — shark -d allows you to specify the directory where shark will save session
files, instead of the current working directory.
Target Selection
With command line shark, you can choose to launch and attach shark to a process, or attach shark to a
currently running process, using options similar to the ones described previously in Process Attach (page 122)
and Process Launch (page 122) for graphical Shark. To launch a process, simply append the process invocation
as you normally would to the end of the shark command line. The following example would launch /bin/ls
~/Documents, and start shark profiling immediately:
shark -i /bin/ls ~/Documents
Instead, if you wanted to attach to a running Apache daemon process, you might try this line:
shark -i -a [pid of httpd]
Making things even simpler, if you do not know the PID of the process in which you are interested, you can
specify a full or partial name as the argument to the -a option. If there are multiple matches to a partial name,
Shark will take its best guess. For these situations, it is often best to supply a PID instead.
Retired Document | 2012-07-23 | Copyright © 2012 Apple Inc. All Rights Reserved.
132
Advanced Profiling Control
Command Line Shark
Reports
Command line shark supports generation of textual reports, either from session files that you’ve already created,
or from new sessions as they are generated. These reports can be simple summaries (-g or -G options), or
complete analysis reports (-t option).
When creating a summary report, you can either create one from a session that is already saved on disk, with
shark -g, or create it for new sessions, with shark -G. Both options result in the creation of a sidecar file,
whose name will be the original session file name with -report.txt appended.
Creating a full analysis, either from previously saved sessions, or for any new sessions, requires passing the -t
flag to shark. The -t flag optionally takes a filename as an argument. If no file name is specified, shark will
allow you to take sessions as normal, except it will write one additional file per session — the full analysis
report. If you specify a file name, shark will instead only generate the full analysis report sidecar file, and
immediately quit. In both cases, the report filename will be the session file name, with -full.txt appended.
Custom Configurations
Because of its command line nature, shark can only operate on configurations already created by its graphical
counter-part as discussed in Custom Configurations (page 183). To use a custom configuration on a headless
server, export it from Shark by opening the Configuration Editor, selecting the desired Configuration, and
clicking the “Export...” button in the Configuration Editor (as described in The Config Editor (page 184)). Copy
the resulting .cfg file to ~/Library/Application Support/Shark/Configs on the target machine so
that command-line shark can find it.
Running shark -l will list all installed configurations, including any custom configurations (which will be
near the bottom of the list). Using a capital -L instead will additionally list a short summary of what each
configuration does, what plugins are active with each one, and their settings.
Instruct shark to use your custom config by passing its corresponding number to the -c argument. For
example, if your new configuration was listed as number 13, you might use the following command line to
load that configuration into command line shark:
shark -c 13
Alternatively, you can specify the configuration file to use directly, using -m:
shark -m custom.cfg
For more information on creating and using custom profiling configurations, see Custom Configurations (page
183).
Retired Document | 2012-07-23 | Copyright © 2012 Apple Inc. All Rights Reserved.
133
Advanced Profiling Control
Interprocess Remote Control
More Information
This section has presented some of the most common options and techniques for using command-line shark.
For more detailed information on all available options, please read the man page: shark(1).
Interprocess Remote Control
In some cases, it is best to have your programs start and stop Shark’s sampling at precisely chosen points in
their execution. Shark supports two major forms of start/stop “remote control” from other processes:
programmatic control allows you to insert code directly into your application to start and stop profiling, while
command line remote control allows you to insert commands in your perl or shell scripts to start and stop
profiling. In order for a remote client to activate Shark, Shark must first be placed in remote mode using the
Shark Sampling Programmatic (Remote ) menu item. Similarly, you can use shark -r to start command line
shark in remote mode (as mentioned in Remote Mode (page 131)).
Programmatic Control
It may be useful to narrow down what is profiled by Shark to a particular section of code within your application.
You can start and stop sampling from within your application’s code by calling the
chudStartRemotePerfMonitor() and chudStopRemotePerfMonitor() functions, defined in the
CHUD.framework. This can be accomplished in one of two ways:
1.
Remote Profiling — instrument your code with calls to chudStartRemotePerfMonitor()/
chudStopRemotePerfMonitor(). Shark should then be placed in remote monitoring mode via the
Sampling Programmatic (Remote) menu item (Command-Shift-R ) before running your instrumented
program. For every pair of start/stop calls, Shark will create a new sampling session. This can be especially
useful with Adding Shortcut Equations (page 119).
2.
Thread Marking — When using Hardware Performance Counters on a PowerPC machine, as discussed in
Hardware Counter Configuration (page 202), you can use chudMarkPID() to mark your process or
chudMarkCurrentThread() to mark the current thread around your critical sections of code. If you
configure Shark to sample only marked performance events, only code in the critical sections will be
profiled.
Note: Currently, Intel machines do not support process or thread marking for performance
monitoring. Consequently, this technique is only useful for PowerPC machines.
Retired Document | 2012-07-23 | Copyright © 2012 Apple Inc. All Rights Reserved.
134
Advanced Profiling Control
Interprocess Remote Control
It is important to keep in mind that many profiling techniques used by Shark employ statistical sampling in
order to generate a profile. If the sampling interval is longer than the time it takes to execute the instrumented
section of code, you may see few or no samples in the resulting profile. Statistical sampling is most useful when
at least several hundred samples are taken.
Example: Towers of Hanoi
We will use the Towers of Hanoi puzzle as an example of controlling Shark from within source code. The French
mathematician Edouard Lucas invented the Towers of Hanoi puzzle in 1883 . The puzzle begins with a tower
of N disks, initially stacked in decreasing size on one of three pegs. The goal is to transfer the entire tower to
one of the other pegs, moving only one disk at a time and never a larger one onto a smaller one. A common
solution to the Towers of Hanoi problem is a recursive algorithm (see Listing 5-1, below).
Listing 5-1
Towers of Hanoi Source Code
/* This functions takes a tower of n disks and moves from peg
*/
/* 'source' to peg 'destination'.
*/
Peg 'temp' may be used
/* temporarily.
*/
void Hanoi(char source, char temp, char destination, int n){
if(n>0) {
Hanoi (source, destination, temp, n-1);
Hanoi (temp, source, destination, n-1);
}
}
As a demonstration of source code instrumentation, we insert calls to start and stop Shark into the Towers of
Hanoi test program (see Listing 5-2, below). Shark is then placed in Remote Monitoring mode and set to use
the standard Time Profile configuration. The test program is run for N=10..20 disks. Shark records a session for
each pair of start and stop calls.
Listing 5-2
Instrumented Towers of Hanoi
#include <CHUD/CHUD.h>
chudInitialize();
chudAcquireRemoteAccess();
for(i=n_min; i<=n_max; i++) {
Retired Document | 2012-07-23 | Copyright © 2012 Apple Inc. All Rights Reserved.
135
Advanced Profiling Control
Interprocess Remote Control
sprintf(label_str, "Hanoi #%d", i);
chudStartRemotePerfMonitor(label_str);
Hanoi('A','B','C',i);
chudStopRemotePerfMonitor();
}
chudReleaseRemoteAccess();
Note: To compile this example program, you must instruct gcc to link with the CHUD framework:
gcc -framework CHUD -F/System/Library/PrivateFrameworks towersOfHanoi.c
Retired Document | 2012-07-23 | Copyright © 2012 Apple Inc. All Rights Reserved.
136
Advanced Profiling Control
Interprocess Remote Control
The Towers of Hanoi test program demonstrates the need for a sampling interval that is much shorter than
the time between the calls to start and stop Shark (see Figure 5-8). Less than 100 samples are taken unless the
problem size is at least 15 disks. As a result, you will often find that it is better to sample your entire application
and use Shark’s powerful Data Mining (page 151) mechanisms to narrow down what is displayed after sampling.
Figure 5-8
Samples Taken for Towers of Hanoi N=10..20
3500
B
Samples Taken
3000
2500
2000
B
1500
1000
B
500
0
B
B
10
B
11
B
12
B
13
B
14
B
B
15
16
17
18
19
20
N discs for Towers of Hanoi Run
Command Line Remote Control
You can also start sampling remotely through the command-line using the chudRemoteCtrl command-line
tool. Again, in order for remote clients to activate Shark, Shark must first be placed in remote mode using the
Shark Sampling Programmatic (Remote ) menu item.
To start profiling from within your shell scripts (or by hand), issue the following command:
chudRemoteCtrl -s MySessionLabel
The argument to -s, above, is an arbitrary, user-specified label that will be applied to the generated session.
To stop profiling, issue the following command:
chudRemoteCtrl -e
Retired Document | 2012-07-23 | Copyright © 2012 Apple Inc. All Rights Reserved.
137
Advanced Profiling Control
Network/iPhone Profiling
When used to stop profiling, chudRemoteCtrl will not return until Shark has stopped profiling. In the case
of command-line shark, chudRemoteCtrl will not exit until the session file is written to disk. More information
on chudRemoteCtrl is available from its man page, chudRemoteCtrl(1).
Network/iPhone Profiling
Shark allows you to share computers for profiling over a network and to discover other computers sharing
their copies of Shark using Bonjour or manual IP address entry. This allows you to record profiles on two
separate Macs on your desk (good for fullscreen application profiling), Macs in another room (useful when you
are profiling servers), or even Macs halfway around the world (for travelers).
Note: Because of changes required to add iOS support to Shark 4.6, the networking protocol software
changed between versions 4.5 and 4.6 of Shark. As a result, you cannot control computers running
versions of Shark 4.5 or earlier from a machine running 4.6 or later, and vice-versa. Hence, it is a good
idea to keep copies of Shark that may be communicating with each other remotely synchronized to
the same version.
In addition, the same user interface can be used to control Shark running on any iPhone (or other device that
runs the iOS, such as the iPod Touch). Shark is included by default in the iOS developer tools, so once they are
installed onto your device it can be controlled by Shark running on any Mac simply by docking the device and
attaching the dock to one of the Mac’s USB ports.
Retired Document | 2012-07-23 | Copyright © 2012 Apple Inc. All Rights Reserved.
138
Advanced Profiling Control
Network/iPhone Profiling
Important: Shark cannot capture symbol information on the iPhone itself, so “raw” sessions recorded from
an iPhone will appear in Shark labeled only based on sample address ranges. This can make it very difficult
to understand the results that Shark returns. Instead, you must tell Shark to recover symbol information
afterwards from a copy of your iOS application which is stored locally on your Macintosh. As a result, anybody
profiling an iPhone will definitely want to check out Manual Session Symbolication (page 146) for more
information about how to tell Shark where your application’s symbols are located.
To use Network Profiling, select the Shark Sampling Network/iPhone Profiling... menu item (Command-Shift-N ),
and the main window will expand to show the Network/iPhone Manager pane below the main controls, as
shown in Figure 5-9.
Figure 5-9
Network/iPhone Manager
The controls in this window are described below:
1.
Modes of Operation— Choose the overall network operation mode here:
●
Profile this computer — Profile the system that is running this instance of Shark; this is the “normal”
way of running Shark, and effectively disables Network/iPhone Mode.
●
Share this computer for network profiling — Shark will advertise itself as a shared profiling service to
networked computers. In this shared profiling mode, the user interface for starting and stopping
profiling on the local machine is disabled.
Retired Document | 2012-07-23 | Copyright © 2012 Apple Inc. All Rights Reserved.
139
Advanced Profiling Control
Network/iPhone Profiling
●
Control network profiling of shared computers — Any computers on the network (in the local domain)
running Shark in “shared” network mode will automatically be listed as available for control by this
instance of Shark. In addition, all iOS devices in docks attached directly to this computer will also
appear as “shared computers” if they have Shark installed (because it cannot be controlled directly
on the device, Shark is automatically started in “shared” mode on these devices when necessary). In
“Control” mode, clicking on Shark’s Start button triggers profiling on the selected shared computer(s).
“Distant” computers that are outside of the local network domain can be added to the list of controlled
computers by entering the computer’s network name in the field below the shared computer table
and clicking the Add (+) button.
2.
Control All Computers checkbox— When selected, all of the currently listed shared computers will be
automatically selected for control. Any new computers that become available in the list (either by Bonjour
auto-discovery or by being manually added by name to the table) will be automatically selected for control,
as well. All computers will start and stop sampling together, at approximately the same time. Additionally,
changing the config or target of any shared computer causes all the controlled computers’ settings to
change to the same setting, if it is available. This option is very useful when you are attempting to control
a large cluster of identical computers.
3.
Auto Download checkbox— When selected, the shared computers controlled by this copy of Shark will
automatically deliver sessions to the the controller. The name of the system that generated each session
is included in the title of each session document window. Otherwise, the sessions will be saved locally on
the controlled machines for later download. This can be a better policy if you are taking many sessions in
quick succession, and network bandwidth becomes a limiting factor or impacts your measurements
adversely.
4.
Computer table— This is the list of all the Macs running the Shark application in shared profiling mode
and attached iOS devices. These computers can be selected for profiling control by this Shark application.
Columns are discussed in the order they are presented onscreen, left-to-right:
●
Use — Toggles whether or not to control Shark on a shared computer.
●
Computer — The name of each shared computer
●
Status — This shows the current “state” of Shark running on the remote system. There are several
different possible states of a shared computer running Shark in network mode:
●
Unknown (–?–): Computer is not connected.
●
Ready (–R–): Shark can start sampling.
●
Sampling (–S–): Shark is actively collecting profile data.
●
Processing (–P–): Shark is creating a profile session.
●
Transmitting (–T–): The new session is being sent.
Retired Document | 2012-07-23 | Copyright © 2012 Apple Inc. All Rights Reserved.
140
Advanced Profiling Control
Network/iPhone Profiling
●
Config — The currently active Sampling Configuration on the shared computer. The entries in this
column are menus, just like the one in Shark’s main window (see Main Window (page 17)). The selected
configuration on the remote shared computer can be changed by changing the selection in the menu
●
Target — The currently active Profiling Target on the shared computer. The entries in this column are
menus, just like the one in Shark’s main window (seeMain Window (page 17)). The targeted process
(if any) on the remote shared computer can be changed by changing the selection in the menu.
●
Cached Sessions (not pictured) — This column is only visible if “Auto Download” is not active. It lists
the number of complete profile sessions cached on each shared computer, and waiting for download
to the controlling system.
5.
Refresh button— Click this button to clear the table and search for shared computers and attached iOS
devices again. Computers that you have added by hand will not be cleared from the list when you refresh.
6.
Add Computer button and Name field— Pressing this button attempts to add the computer with the
name or IP address entered into the computer name field to the list of shared computers. The specified
computer must be attached to the network and running Shark in shared profiling mode, or this will fail.
7.
Download One and Download All buttons— If the Auto Download checkbox is not selected, then
computers that are being controlled across the network will cache the session files they generate for later
download rather than sending them immediately to the controlling Shark application. The number of
sessions available to download is listed in the Shared Computer table’s Cached Sessions column. Clicking
the Download One button will download a single session, while clicking the Download All button will
download all available sessions. Sessions are always retrieved in the order that they were created.
Using Shared Profiling Mode
Although the graphical Shark application can be placed in “Share this computer” mode, it is more typical to
use command line shark on any remote, shared computers. You can use ssh(1) to connect to a remote
computer. Once connected, launch command line shark with the –N option. The remote run of shark will
Retired Document | 2012-07-23 | Copyright © 2012 Apple Inc. All Rights Reserved.
141
Advanced Profiling Control
Network/iPhone Profiling
then respond to network requests to start and stop profiling. A sample transcript of a remote command line
shark in “Network Sharing” mode is shown in Figure 5-10. For more information on the usage and configuration
of command line shark, see Timed Counters: The Performance Counter Spreadsheet (page 111).
Figure 5-10
Command Line Shark in Network Profiling Mode
Retired Document | 2012-07-23 | Copyright © 2012 Apple Inc. All Rights Reserved.
142
Advanced Profiling Control
Network/iPhone Profiling
Mac OS X Firewall Considerations
The sharing firewall on Mac OS X can prevent Shark’s network profiling from working in either sharing or
control mode. When the Shark Network Manager successfully opens a network connection, the communication
port number Shark is using is listed in brackets. This is normally port number 7475. Unfortunately, this port is
not “open” through the firewall by default. If you attempt to enter “Shared Profiling” or “Network Control”
mode while the firewall is enabled, you will be presented with a warning dialog, as illustrated in Figure 5-11
Figure 5-11
Sharing Firewall Warning Dialog
Retired Document | 2012-07-23 | Copyright © 2012 Apple Inc. All Rights Reserved.
143
Advanced Profiling Control
Network/iPhone Profiling
Click the Sharing... button in the warning dialog to bring up the System Preferences window Sharing tab.
Otherwise click the Ignore button to dismiss the dialog, but note that doing so may result in the inability to
use Shark over the network. Once in the Sharing Preference window of System Preferences , select the Firewall
tab. If you have never before added settings for Shark, then click the New… button, and fill in the sheet as
shown in Figure 5-12, and click the OK button.
Figure 5-12
Firewall Sharing Preferences, while adding a new port range for Shark
Retired Document | 2012-07-23 | Copyright © 2012 Apple Inc. All Rights Reserved.
144
Advanced Session Management and Data Mining
SwiftObjective-C
Often, the profile analysis windows can provide you with a very helpful view of your application’s behavior
using the default settings. However, there are also many tools available in Shark that can help you sort through
the large quantity of data that Shark can collect quite quickly. This chapter describes many of the techniques
that you can use to adjust how data is presented if the profiles are providing you with too little or too much
information.
Automatic Symbolication Troubleshooting
A common problem encountered by Shark users is a profile filled with instruction address ranges, instead of
actual names, for all of the symbols (functions) in the program. Shark is very good at finding and using symbol
information created by the compiler, but you do need to make sure that the compiler and linker actually record
the correct symbol information, or you will be stuck deciphering cryptic address ranges instead of the names
that you were expecting. This section explains how to solve some of the most common problems that can
prevent Shark from finding and displaying the symbol names in your code.
Symbol Lookup
Shark records samples from the system in both user and supervisor code. In order to look up symbols for user
space samples, the corresponding process is temporarily suspended while its memory is examined for symbols.
Symbol lookup of user space samples will fail if the option to catch exiting processes (see Shark Preferences (page
24)) is disabled and the process is no longer running. In addition, if you need to profile a task which will exit
before profiling is finished, then you should execute it with an absolute path (e.g. /usr/local/bin/foo)
rather than a relative path (e.g. ../foo). Otherwise you may not be able to examine program code in a Code
Browser. Supervisor space symbol lookup is done by reconstructing the kernel and driver memory space from
user accessible files: /System/Library/Extensions for drivers and other kernel extensions and
/mach_kernel for kernel symbols. Samples from kernel extensions or drivers not in the locations specified
on Shark’s Search Paths Preference pane (see Shark Preferences (page 24)) will fail symbol lookup. Developers
who download the KernelDebugKit SDK and mount the disk image are able to see source information for the
kernel and base IOKit kernel extension classes (families).
Retired Document | 2012-07-23 | Copyright © 2012 Apple Inc. All Rights Reserved.
145
Advanced Session Management and Data Mining
Manual Session Symbolication
If symbol lookup fails, Shark may present the missing “symbols” in two different ways. If the memory of the
process is readable — for example, a binary that has had its symbols stripped — Shark tries to determine the
range of the source function by looking for typical compiler-generated function prologue and epilogue
sequences around the address of the sampled instruction. Symbol ranges gathered in this manner are listed
as address [length]. If the memory of a process is completely unreadable, the sample will be listed with
the placeholder symbol address [unreadable].
Debugging Information
In order for Shark to look up symbol information, the sampled application must contain debugging information
generated by a compiler or linker.
It is almost always more useful to profile a release build rather than a debug build because compiler
optimizations can drastically alter the performance profile of an application. Debug-style code is most often
compiled without any optimizations at all (-O0). This makes debugging simpler, but produces non-optimal
code. A profile of unoptimized code is misleading because it will often have different performance bottlenecks
than optimized code.
Xcode
To generate debugging information in Xcode, select Project dit
E Active Target and go to the GNU C/C++ Compiler
panel. Make sure that the Generate Debug Symbols checkbox is enabled. If you want to have your Release style
products left unstripped (with symbol information), select the Unstripped Product checkbox. Make sure that
the COPY_PHASE_STRIP variable, if it is defined, is set to NO.
GCC/XLC/XLF
If you are using command-line compilers such as GCC, XLC/XLF, and/or makefiles, use the “-g” compiler flag
to specify that debugging information is generated
Manual Session Symbolication
It’s common practice for software built for public release to be stripped of debugging information (symbols
and source locations). Although this reduces the overall size of the product and helps protect proprietary code
against prying eyes, it makes it much more difficult to understand profiles taken with Shark. Shark doesn’t
Retired Document | 2012-07-23 | Copyright © 2012 Apple Inc. All Rights Reserved.
146
Advanced Session Management and Data Mining
Manual Session Symbolication
require debugging information to work, but it can be much more helpful if it’s available. In case you record a
Shark session and discover that symbols have not been captured, then you can attempt to have Shark add
them in afterwards.
Figure 6-1
Session Inspector: Symbols
The most common way to “symbolicate” or add symbols (along with other debugging information) to your
session is to simply use the File ymbolicate...
S
command. With this command, you can quickly choose a
symbol-rich application binary to attach to your Shark session, even if the original measurement was taken
using a symbol-free binary.
Shark’s Session Inspector window (see Session Windows and Files (page 20)) also allows you to add debugging
information to a session. This technique requires more steps, but is recommended if you are adding symbols
from a dynamic library used by your application, instead of the application itself, or if you need to selectively
add symbols from many different application binary files. The Symbols tab (1) in the window shows you the
list of all the profiled executables in the session, along with the libraries and frameworks they were linked with.
The Process popup (2) allows you to select the application you’re interested in inspecting or symbolicating.
Each row of the table lists the name, version (if available) and creation date of each binary. The full path of
each binary is displayed as a tooltip for each entry in the Name column (3). To symbolicate any particular
binary, double-click on its entry in the table or select it and click the Symbolicate button (4).
Retired Document | 2012-07-23 | Copyright © 2012 Apple Inc. All Rights Reserved.
147
Advanced Session Management and Data Mining
Manual Session Symbolication
No matter which way you choose to get here, you will be presented with a Symbolication dialog (Figure 2-20).
Figure 6-2
Symbolication Dialog
Use this dialog to select a symbol-rich (but otherwise identical) version of the binary you are symbolicating.
The version, creation date and size is shown for both the original and selected binary. For maximum flexibility
Shark does not restrict what you can select in any way. But it does indicate when something might be wrong
with the selection you have made by highlighting potential problems. Ideally, this is the list of attributes that
Shark expects for a good match:
●
The name of the original and symbol-rich binaries should match (for bundles, this is the bundle name).
Also, for bundles, the version strings should match.
●
The creation date of the symbol-rich binary should be the same or earlier than the stripped version.
●
The size of the symbol-rich binary should be larger than the stripped version.
Retired Document | 2012-07-23 | Copyright © 2012 Apple Inc. All Rights Reserved.
148
Advanced Session Management and Data Mining
Manual Session Symbolication
Shark will warn you if you select a binary that is potentially problematic. If you do happen to select an executable
that isn’t a good match, the profile results will be incorrect. Heavy View and Tree View show an example session
before and after symbolication.
Figure 6-3
Before Symbolication
Retired Document | 2012-07-23 | Copyright © 2012 Apple Inc. All Rights Reserved.
149
Advanced Session Management and Data Mining
Managing Sessions
Figure 6-4
After Symbolication
Managing Sessions
If you have multiple sessions measuring the same application, it is possible to use Shark to compare or merge
those sessions with each other.
Comparing Sessions
Shark can be used for tracking performance regressions. Shark allows you to compare the contents of two
session files sampling the same process through the File Compare ... menu item (Command-Option-C ). Note
that processes are identified by name rather than process ID (PID) by default when comparing sessions, so do
not change the name of your program between sessions if you want to use this command.
Retired Document | 2012-07-23 | Copyright © 2012 Apple Inc. All Rights Reserved.
150
Advanced Session Management and Data Mining
Data Mining
When used, a new session is created from two existing ones: Session A and Session B. The first session (Session
A) is given a negative scaling factor, and the second session (Session B) is given a positive scaling factor. The
result of a compare operation is a new session with negative profile entries for more samples in the earlier
session (Session A), and positive profile entries for more samples in the later session (Session B).
The magnitude of the scaling factor is adjusted according to the number of samples in each session so that
both sessions are given equal total weight. In the case of comparing two sessions with an equal number of
samples, the scaling factor for Session A is -1.0, and for Session B is +1.0.
Example
As an example of how the session comparison algorithm works, let’s say that Session A has 400 samples in
process foo, and Session B has 440 samples in process foo. The total weight for process foo in the combined
session will be 840.
If in Session A there were 80 samples for function bar() in process foo, and in Session B there were 120
samples for function bar() in process foo, the value of bar() is 120 – 80 = +40. The value shown for bar()
would be (+40 / 840) * 100 = +4.8%. Note that the meaning of percentage is consistent with the standard time
profile display — the baseline is the total count for the currently selected scope (system, process or thread).
Merging Sessions
If you have profiled the individual components that make up a workload separately, you may want to merge
the resulting sessions into a single file. Shark can merge two session files through a process similar to comparing
them. The only difference is that each source session file is given a scaling factor of +1.0. Select the File Merge ...
menu item (Command-Option-M ).
Data Mining
By default, Shark groups samples by symbol (although other groupings such as address, library and source
line are also possible using the controls described previously in Automatic Symbolication Troubleshooting (page
145)). Although this is often sufficient, judiciously filtering out pieces of a profile can in some cases make it
easier to analyze. Data mining allows you to hide samples that may obscure important behavioral or algorithmic
characteristics in a profile.
Retired Document | 2012-07-23 | Copyright © 2012 Apple Inc. All Rights Reserved.
151
Advanced Session Management and Data Mining
Data Mining
Callstack Data Mining
In order to understand how to use data mining to better understand your application, it is necessary to first
understand a few fundamental concepts about samples and callstacks. Each Shark session contains some
number of samples. Each sample contains contextual information such as where and when it was taken (process
and thread ID, timestamp) as well as the callstack information for how the sampled thread of execution arrived
at the current program counter address. An example of several callstacks is shown in Figure 6-5.
Each callstack is made up of N stack frames (N =4 in the case of Sample 1). Note that when a sample is taken,
the program’s stack pointer points to the leaf entry at N -1 (cos in the first sample). When Shark builds up a
call tree to analyze how routines call each other, “self” counts in the profile browser are simply the number of
samples where this routine is the leaf entry function. Therefore, the “self” count represents the amount of time
that code within the function was executing. In contrast, “total” counts are the number of samples where this
function appears at any point in a callstack, and therefore represents the summation of a function’s execution
time and the time of all functions that it calls.
Shark can combine samples into call trees in two different ways. Figure 6-6 depicts the “Heavy” call tree
assembled from the example samples, while Figure 6-7 shows the corresponding “Tree” view. As you can see,
the “heavy” view starts from the leaf functions and builds towards the base of the callstack, while the “tree”
view starts at the base of the callstack and works down to the leaves. The former view is usually better for
finding out which parts of your program are executing most often, while the latter is often better for finding
Retired Document | 2012-07-23 | Copyright © 2012 Apple Inc. All Rights Reserved.
152
Advanced Session Management and Data Mining
Data Mining
large routines farther down the callstack that call many other routines in the course of their execution. Once
you have a clear picture of how callstacks are converted into call trees, it is easier to understand the application
of the data mining operations.
Figure 6-5
Figure 6-6
Example Callstacks
Sample 1
Sample 2
Sample 3
Sample 4
Sample 5
main
foo
bar
cos
main
foo
bar
sqrt
main
baz
bar
main
baz
sqrt
main
baz
cos
Heavy View
cos
Total:
Self:
bar
2
2
Total:
Self:
foo
Total:
1
0
Self:
baz
Total:
Self:
sqrt
Total:
Self:
Total:
Self:
Total:
Self:
1
0
bar
Total:
Self:
Total:
Self:
1
0
Total:
Self:
Self:
1
0
main
1
0
Total:
Self:
main
Total:
Self:
1
0
baz
1
1
Total:
1
0
foo
baz
Total:
Self:
1
0
main
bar
2
2
main
1
0
main
Total:
Self:
1
0
1
0
Retired Document | 2012-07-23 | Copyright © 2012 Apple Inc. All Rights Reserved.
153
1
0
Advanced Session Management and Data Mining
Data Mining
Figure 6-7
Tree View
main
Total:
Self:
foo
5
0
Total:
Self:
bar
Total:
Self:
2
0
cos
2
0
Total:
Self:
1
1
sqrt
Total:
Self:
bar
baz
Total:
Self:
1
1
3
0
Total:
1
Self:
1
sqrt
Total:
1
Self:
1
cos
Total:
1
Self:
1
Shark’s Data Mining operations allow you to prune down call trees in order to make them easier to understand.
While the small call trees in the preceding figures are fairly simple, in real applications with hundreds and
thousands of symbols, the call trees can be huge. As a result, it is often useful to consolidate or prune off
sections of the call trees that do not add useful information, in order to simplify the view that Shark provides
Nathan Slingerland -
Retired Document | 2012-07-23 | Copyright © 2012 Apple Inc. All Rights Reserved.
154
Advanced Session Management and Data Mining
Data Mining
in controlled ways. For example, you often won’t care about the exact places that samples occur within MacOS
X’s extensive libraries — only which of your functions are calling them too much. Data Mining can help with
simplifications like this. It is accessible in three different ways.
Figure 6-8
Data Mining Advanced Settings
The Advanced Settings drawer (Figure 6-8), in its lower half, contains the following controls that apply filtering
to an entire session. This is a great way for making a few common quick trims to too-complex callstack trees.
1.
Apply Callstack Data Mining— Global control that toggles the use of all data mining controls en masse,
good for quickly comparing your results before and after data mining.
2.
Charge System Libraries to Callers— Removes any callstack frames from system libraries and frameworks,
effectively reassigning time spent in those functions to the callers. This is often quite useful, as you cannot
usually modify the system libraries directly, but only your code that calls them. Samples from system
libraries that aren’t called from user code, such as the system idle loop, disappear entirely.
3.
Charge Code without Debug Info to Callers— Removes any callstack frames from code without debugging
information, effectively reassigning time spent in those functions to the callers. In a typical development
environment, this will effectively show all samples only in source code that you own and compiled using
Retired Document | 2012-07-23 | Copyright © 2012 Apple Inc. All Rights Reserved.
155
Advanced Session Management and Data Mining
Data Mining
a flag such as ‘–g’ with GCC or XLC, and in the process eliminating a lot of user-level code that you probably
do not have control over. Samples from code that isn’t called from debug-friendly code are eliminated
entirely.
4.
Hide Weight < N— Hides any granules that have a total weight less than the specified limit. This macro
helps reduce visual noise caused by granules (i.e. symbols) that only trigger a sample or two, making it
easier to see the overall profile.
5.
Flatten Recursion— For each branch in the call tree, this collapses functions that call themselves into a
single entry, removing all of the recursive calls entirely from the trace.
6.
Flatten System Libraries— Chops off the top of callstacks beyond the entry points into system libraries,
so that any samples from the libraries are only identified by the entry points.
7.
Remove Supervisor Callstacks— Completely removes (without charging to the callers) all samples in the
profile from supervisor code (kernel and drivers).
8.
Granule List— Displays a list of particular granules that you have identified for data mining, using the
menu controls described next, along with the name of the operation applied to that granule. You can
modify the operation used to mine them using the menu associated with this name.
AData Mining menu appears in the menu bar whenever a Shark session is open. The menu contains the
following items that allow you to selectively apply data mining to particular granules in your code:
1.
Charge Symbol X to Callers— Removes any callstack frames containing the symbol X , and frames of
functions called by X , effectively reassigning time spent in those functions to the callers.
2.
Charge Library to X Callers— Removes any callstack frames containing the specified library, effectively
reassigning samples to the callers of the library.
3.
Flatten Library X — Removes all but the first callstack frame for the specified library, attributing all samples
in interior functions to the entry points of the library.
4.
Remove Callstacks with Symbol X — All callstacks that contain the specified symbol are removed from
the profile; samples in matching callstacks are discarded.
5.
Retain Callstacks with Symbol X — Overrides all of the above operations for any callstack that contains
the specified symbol.
6.
Restore All— Undo all Charge To , Flatten , Remove , and Retain operations.
7.
Focus Symbol X — Makes the specified symbol the root of the call tree; removes symbols and samples
above (callers to) this symbol in the call tree and remove callstacks that do not contain this symbol. This
allows you to quickly eliminate all samples but those from an interesting part of a program.
8.
Focus Library X — Makes the specified library the root of the call tree; removes symbols and samples
above (callers to) this library in the call tree and remove callstacks that do not contain this library.
Retired Document | 2012-07-23 | Copyright © 2012 Apple Inc. All Rights Reserved.
156
Advanced Session Management and Data Mining
Data Mining
9.
Focus Callers of Symbol X — Removes functions called by the specified symbol and removes callstacks
that do not contain the specified symbol.
10. Focus Callers of Library X — Removes functions called by the specified library and removes callstacks
that do not contain the specified library.
11. Unfocus All— Undo all Focus operations.
This same menu appears as a contextual menu on entries in the Heavy , Tree and Callstack results tables. While
the mouse is held over a line in a table, you can control-click (or right-click) to bring up the menu, as is shown
in (Figure 6-9).
Figure 6-9
Contextual Data Mining Menu
Perf Count Data Mining
In addition to data mining based on callstack symbol and library information, it is also possible to filter out
samples based on associated performance count information (if available), using the Perf Count Data Mining
palette (Figure 6-10). The available “perf count” data mining operations are:
●
Equal (==)— Removes callstacks with perf counts equal to the specified value.
●
Not Equal (!=)— Removes callstacks with perf counts not equal to the specified value.
●
Greater Than (>)— Removes callstacks with perf counts greater than the specified value.
●
Less Than (<)— Removes callstacks with a perf counts less than the specified value.
Retired Document | 2012-07-23 | Copyright © 2012 Apple Inc. All Rights Reserved.
157
Advanced Session Management and Data Mining
Example: Using Data Mining with a Time Profile
The Perf Count Data Mining palette also supplies a global enable/disable toggle, much like the one available
with conventional data mining, and check boxes for toggling the visibility of perf count information (the eye
column) and whether or not the perf count data is accumulated across processors (the column), on a per-counter
basis.
Figure 6-10
Perf Count Data Mining Palette
Example: Using Data Mining with a Time Profile
Our first example uses Shark’s data mining tools to help isolate a performance problem from a time profile of
the Sketch demo program. If you want to follow along with the demo, it is available in
/Developer/Applications/Examples/AppKit/Sketch.
A Performance Problem...
1.
Launch Sketch (located in /Developer/Applications/Examples/AppKit/Sketch/build/ after
you build the project with Xcode)
Retired Document | 2012-07-23 | Copyright © 2012 Apple Inc. All Rights Reserved.
158
Advanced Session Management and Data Mining
Example: Using Data Mining with a Time Profile
2.
Make four shapes as shown in Figure 6-11
Figure 6-11
3.
Example Shapes
Repeat the following steps until the app becomes sluggish (takes a half second or second to select all):
●
Select All (Command-A )
●
Copy (Command-C )
●
Paste (Command-V )
Retired Document | 2012-07-23 | Copyright © 2012 Apple Inc. All Rights Reserved.
159
Advanced Session Management and Data Mining
Example: Using Data Mining with a Time Profile
This should take 8-10 times (maybe more) depending on hardware. When you are done it should look
something similar to Figure 6-12
Figure 6-12
Example Shapes, Replicated
4.
Click in blank area of the window to deselect all the shapes.
5.
Do select all and notice how long it takes for all of them to be selected. This is a performance problem.
Taking Samples
1.
Launch Shark (in /Developer/Applications/Performance Tools/)
2.
Target your application by selecting the “Sketch” process, as shown in Figure 6-13.
The start button will start and stop sampling. The Everything/Process pop-up will let you choose whether
you wish to sample the entire system or just a single process. The Time Profile pop-up will let you choose
different types of sampling that you can perform. In this case we will switch the System/Process pop-up
to Process (to target a single process.)
Retired Document | 2012-07-23 | Copyright © 2012 Apple Inc. All Rights Reserved.
160
Advanced Session Management and Data Mining
Example: Using Data Mining with a Time Profile
This reveals a third pop-up button that you can use to target your application. Select Sketch from the list
of running applications.
Figure 6-13
Sampling a Specific Process
3.
Switch back to Sketch and make sure nothing is selected.
4.
Move the Sketch window to expose the Shark window (optional but makes things easier).
5.
Press Option-Escape to start sampling.
6.
Press Command-A to select all and wait for the operation to complete.
7.
Press Option-Escape to stop Sampling and you will get a window that looks like Figure 6-14.
Figure 6-14
Default Profile View
Retired Document | 2012-07-23 | Copyright © 2012 Apple Inc. All Rights Reserved.
161
Advanced Session Management and Data Mining
Example: Using Data Mining with a Time Profile
High Level Analysis
The session window gives you by default a summary of all the functions that the sampler found samples in
and the percentage of the samples that were found there. So in the example, 14.1% of the samples were found
in objc_msgSend. This view is very useful for doing analysis of performance when the bottlenecks occur in
leaf functions. As you can see, the above window gives you a lot of detail about where your program is spending
time, but unfortunately it is at too low a level to be of use to the developer of Sketch, or even the developers
of the Frameworks that Sketch depends on.
To get at the parts of the program that are of most interest to the developer of Sketch, you can do the following:
1.
2.
In the Window menu, choose Show Advanced Settings... . This will open a drawer with the data mining
palette, among other things, as was shown in Advanced Session Management and Data Mining (page
145). We will go over each of these areas in more detail later. For now, let's turn on a couple of cool features.
In the Profile Analysis Palette , do the following:
●
Click on the Stats Display pop-up and select Value . This lets you the actual counts for the samples
rather than percentage. This may be more intuitive for some users than weighting by %, especially
while you are going through this tutorial. Use whichever you prefer.
●
Click on the Weight by: pop-up and select Time . You will see the samples displayed as the time spent
in that function rather than counts.
●
Check the Color by Library checkbox. This will display the text of symbols and library names in different
colors based on the library they came from. This is handy for visually identifying groups of related
functions.
In the Data Mining Palette box, check Charge System Libraries to Callers . This will eliminate system libraries
and frameworks, and charge the cost of their calls to the application level functions or methods that are
calling them.
Retired Document | 2012-07-23 | Copyright © 2012 Apple Inc. All Rights Reserved.
162
Advanced Session Management and Data Mining
Example: Using Data Mining with a Time Profile
3.
Click on the callstack
button on the lower right corner of the table to reveal the callstack pane, as
shown in Figure 6-15. As you click on symbols on the left, the callstack pane will show you the stack leading
up to the selected symbol. Since system libraries and frameworks were filtered out in the previous step,
you will only see your application's symbols. Note that if you click on a symbol in the callstack pane, the
outline on the left will automatically expand the outline to show that symbol.
Figure 6-15
Navigation Via the Call-Stack Pane
4.
Click on the
pop-up menu on the lower right corner of the window and select
to split it in half. The top half will continue to show the Heavy View
("Bottom-Up View") of the samples and the bottom will show the Tree View ("Top-Down View").
If you click on the symbol main in the bottom pane, you will see that the callstack view on the right will
show the stack, as shown in Figure 6-16. This view will control navigation for whichever outline that was
last selected
Figure 6-16
5.
Navigation Via the Call-Stack Pane with Tree View
Looking at this outline, we see there are two areas where a lot of time is being spent: -[SKTGraphicView
drawRect:] and -[SKTGraphicView selectAll:]. Let's look at the selectAll method first.
Analysis Via Source Navigation
The following is an example of doing interior analysis across a few levels of function calls.
1.
Open up the tree view as shown in Figure 6-16.
Retired Document | 2012-07-23 | Copyright © 2012 Apple Inc. All Rights Reserved.
163
Advanced Session Management and Data Mining
Example: Using Data Mining with a Time Profile
2.
Double click on the symbol -[SKTGraphicView selectAll:] in the tree view above. You will see a
source window that looks like Figure 6-17
Figure 6-17
Source View: SKTGraphicView selectAll
The code browser uses yellow to indicate sample counts that occur in this function or functions called by
that function.
Retired Document | 2012-07-23 | Copyright © 2012 Apple Inc. All Rights Reserved.
164
Advanced Session Management and Data Mining
Example: Using Data Mining with a Time Profile
3.
Double-click on the yellow colored line to navigate to the function (performSelector) called here. When
the new source window comes up, double-click in the yellow area marked with 2.7 s. This will display the
counts for this code, which should look like Figure 6-18:
Figure 6-18
Source View: NSObject
Before we go on, please notice that this is a for loop that iterates over all the items in the array, which in
this case is the array of all the graphic objects stored in Sketch's model.
Retired Document | 2012-07-23 | Copyright © 2012 Apple Inc. All Rights Reserved.
165
Advanced Session Management and Data Mining
Example: Using Data Mining with a Time Profile
4.
Double-click on the yellow colored line [self performSelector: sel withObject:[array
ObjectAtIndex:i]]; and you'll get Figure 6-19:
Figure 6-19
Source View: SKTGraphicView selectGraphic
There are several hotspots here:
At line 116, there is a call to indexOfObjectIdenticalTo:graphic. This is a linear search of the
selected graphics. Since we are doing a "select all" operation, this is a linear search inside of a linear
search. You have just found a fundamentally O(N2) operation. Interestingly, this is not where most of
the time is being spent.
The operation in lines 118 and 119 appears to be an expensive framework call. This should be hoisted
out of the performSelector: OnEachObjectInArray loop and done once, if possible. If we were
the framework developers, it might also be interesting to investigate why these calls are so costly.
Line 121 shows a call out to -[SKTGraphicView invalidateGraphic]. Let's dig deeper into this
since this is in Sketch's code.
Retired Document | 2012-07-23 | Copyright © 2012 Apple Inc. All Rights Reserved.
166
Advanced Session Management and Data Mining
Example: Using Data Mining with a Time Profile
5.
Double-click on [self invalidateGraphic:graphic]; and you'll get Figure 6-20. This contains one
line of expensive code that tests for nested objects.
Figure 6-20
Source View: SKTGraphicView invalidateGraphic
It is interesting to note that even with this fairly quick analysis we have already identified several glaring
problems. The first problem we found was O(N2) behavior introduced by our code implementation hiding
within functions and the use of abstraction. In general it is good to create and use abstraction in your coding.
However, doing so can unintentionally introduce unnecessary performance pitfalls. Each of these functions is
well conceived locally, but when they are used together they combine to have poor scalability. Second, we
used expensive framework calls (in this case, to the undo manager) inside of a loop. Since undoing each step
of a “select all” operation really isn’t necessary, the expensive call can be moved up to a higher level, in order
to just undo all of the selects at once. This is an example of hoisting functionality to a higher level in the
execution tree. Finally, the invalidateGraphic routine was doing some heavyweight testing, and it would
clearly be worthwhile to see if we can move this testing outside of the inner loops, if possible.
Retired Document | 2012-07-23 | Copyright © 2012 Apple Inc. All Rights Reserved.
167
Advanced Session Management and Data Mining
Example: Using Data Mining with a Time Profile
Introduction To Focusing
This example will take us through analyzing the behavior of drawing the selected rectangles. Here, we will
develop ideas for analyzing larger and more complex programs (or frameworks) that involve multiple libraries.
In doing so, we will introduce the Analysis menu/context menu and the ideas of focusing and filtering. This
example will use system frameworks to demonstrate the ideas but the principles apply just as well to any
large-scale application built as a collection of modules.
1.
Close all the source windows from the analysis of -[SKTGraphicView selectAll:] by clicking on the
close buttons in the tabs of the tab view.
2.
Switch to the profile tab and do option click on the top most disclosure triangle to close all of the triangles.
3.
Open the first two levels so it looks like Figure 6-21:
Figure 6-21
4.
Tree view before focusing
Select -[SKTGraphicView drawRect:] and control-click to bring up a contextual menu which contains
the focus and exclusion operations available in Shark (the operations in this menu are also available via
the Data Mining Menu in the menu bar). It looks like Figure 6-22.
Figure 6-22
Data Mining Contextual Menu
In this tutorial we'll describe and demonstrate a few of them as well. A full description of these operations
is given in Callstack Data Mining (page 152).
Retired Document | 2012-07-23 | Copyright © 2012 Apple Inc. All Rights Reserved.
168
Advanced Session Management and Data Mining
Example: Using Data Mining with a Time Profile
5.
Choose "Focus Symbol -[SKTGraphicView drawRect:]" and you will get something that looks like
Figure 6-23
Figure 6-23
After Focus Symbol -[SKTGraphicView drawRect:]
The bottom pane (Tree view) is now rooted on the symbol that we focused on and the items in the top
pane (Heavy view) have changed to reflect only the leaf times relative to the execution tree under this
new root. In the Heavy view, we see that the most time is spent in -[SKTGraphic drawHandleAtPoint:
inView]. We'll come back to this in a bit.
It is also worth noting that if you look in the Advanced Settings drawer at the bottom of the data mining
controls (you may need to scroll down the drawer if your document window is small), you will see an entry
for the symbol you just focused in the list of symbols. You can change the focus behavior here at any time
by clicking in the pop-up next to the symbol name.
Retired Document | 2012-07-23 | Copyright © 2012 Apple Inc. All Rights Reserved.
169
Advanced Session Management and Data Mining
Example: Using Data Mining with a Time Profile
6.
Expand -[SKTGraphicView drawRect:] in the bottom outline a few times until it looks likes likeFigure
6-24:
Figure 6-24
After focus and expansion
There are two interesting things here:
●
The self time is pretty large in this function
●
A lot of time is spent in -[SKTGraphic drawHandleAtPoint: inView]
Let's look at the self time first.
Retired Document | 2012-07-23 | Copyright © 2012 Apple Inc. All Rights Reserved.
170
Advanced Session Management and Data Mining
Example: Using Data Mining with a Time Profile
7.
Double click on -[SKTGraphic drawInView:isSelected] to see the source, as shown in Figure 6-25:
Figure 6-25
Source View: SKTGraphic drawInView:isSelected:
Here we see that time is split pretty evenly between the AppKit graphics primitive [path stroke] and
the call to -[SKTGraphic drawHandleAtPoint: inView]. The only option for a developer to deal
with the AppKit graphics primitive is to consider using raw Quartz calls, an option that we'll look into using
NSBezierPath a bit later. For now, let's take a look at -[SKTGraphic drawHandleAtPoint:inView].
Retired Document | 2012-07-23 | Copyright © 2012 Apple Inc. All Rights Reserved.
171
Advanced Session Management and Data Mining
Example: Using Data Mining with a Time Profile
8.
Double click on line 406 on the text -[self drawHandlesInView: view] and you'll get Figure 6-26:
Figure 6-26
Source View: SKGraphic drawHandlesInView:
This continues on with other calls to [self drawHandleAtPoint: inView], so it's been elided for
brevity.
Retired Document | 2012-07-23 | Copyright © 2012 Apple Inc. All Rights Reserved.
172
Advanced Session Management and Data Mining
Example: Using Data Mining with a Time Profile
9.
Double click on line 502 in the text [self drawHandleAtPoint: ...] and it will take you to the code
for [SKTGraphicview drawHandleAtPoint: ...] which is shown in Figure 6-27
Figure 6-27
Source View: SKGraphic drawHandleAtPoint:inView:
Here we see another call into an NS drawing primitive. At this point, if you are a developer, your only
option is to investigate using other graphics primitives such as direct calls to Quartz. In this example we'll
do some further analysis to show some techniques useful for analyzing larger apps and frameworks.
Dig Deeper by Charging Costs
To dig deeper we will turn off “Charge System Libraries to Callers” and go through a more step-by-step analysis
of what is involved in drawing the shapes for Sketch. This will be focus more on demonstrating various data
mining operations and less on particular issues in the frameworks.
1.
Go to the filter box in the advanced drawer and un-check the "Charge System Libraries to Callers" checkbox.
Since we are still focused on -[SKTGraphicView drawRect:] we avoid seeing all the framework code
that went brought us to that draw routine, and thereby avoid being overwhelmed with symbols. In the
heavy view you will now find all sorts of system symbols, so we may need some help to make sense of
these. A powerful tool for pruning useless symbols is “Filter Library.”
Retired Document | 2012-07-23 | Copyright © 2012 Apple Inc. All Rights Reserved.
173
Advanced Session Management and Data Mining
Example: Using Data Mining with a Time Profile
2.
We're going to work with the “Heavy View” (the upper profile) for a bit. So click the
and set it back to
3.
.
Select the first symbol in the upper profile, as shown in Figure 6-28.
Figure 6-28
Heavy View of Focused Sketch
Notice that the stack view on the right shows a backtrace leading up to our old friend -[SKTGraphicView
drawRect:].
4.
In the callstack view on the right click on -[SKTGraphicView drawRect:] and you'll get Figure 6-29:
Figure 6-29
Expanded Heavy View of Focused Sketch
Suppose we are interested in understanding the calls made into CoreGraphics. This is challenging because
AppKit calls CoreGraphics, which calls libRIP.A.dylib, which then calls back into CoreGraphics. This is a lot
of interdependency to sort out.
Fortunately there is a way to hide this complexity and see just what we are interested in. We use what are
called the exclusion commands. One of the most powerful ones is “Charge Library.” This command tells
Shark to hide all functions in a particular library and charge the costs of those functions to the functions
calling into that library. We'll show this in action in our example:
Retired Document | 2012-07-23 | Copyright © 2012 Apple Inc. All Rights Reserved.
174
Advanced Session Management and Data Mining
Example: Using Data Mining with a Time Profile
5.
In the left hand outline select the symbol ripd_mark and control+click on it to bring up the data mining
contextual menu. Choose "Charge Library libRIP.A.dylib" and you get Figure 6-30:
Figure 6-30
After Charge Library libRIP.A.dylib
Notice that the symbols for libRIP.A.dylib are gone from the samples. Now this is a bit cleaner, but there
are still multiple layers in CoreGraphics. Notice that we have CGContextDrawPath both in the caller chain
to vecCGSColorMaskCopyARGB8888 and as a leaf function. What we really want to see is how much
time we're spending in CGContextDrawPath.
This is most easily accomplished with “Flatten Library.” “Flatten Library” is similar to “Charge Library,”
except that it leaves the first function (entry point) into the library intact. It in effect collapses the library
down to just its entry points. There is a quick click button in the Advanced Settings Drawer’s Data Mining
Palette that lets you flatten all system libraries. This is a good quick shortcut for flattening all the system
libraries, which greatly simplifies your trace in one shot.
6.
Do a control+click on vecCGSColorMaskCopyARGB8888 and choose "Flatten Library CoreGraphics" and
you'll get Figure 6-31
Figure 6-31
After Flatten Library
Now this is getting interesting. Time spent has converged into CGContextFillRect and
CGContextDrawPath. These two call trees represent the two different places we saw hot spots in our
top down analysis. But now we have exposed more detail. The CoreGraphics team could now choose to
use the “Focus on Symbol” commands to study either piece of the execution tree in detail.
Retired Document | 2012-07-23 | Copyright © 2012 Apple Inc. All Rights Reserved.
175
Advanced Session Management and Data Mining
Example: Graphical Analysis using Chart View with a Malloc Trace
This example is a bit simplistic, but it shows the power of the exclusion operations to strip out unnecessary
information and identify where the real choke points are in the middle part of the execution tree. Please note
that using the data mining operations does not change the underlying sample data that you've recorded. It
just changes how the data is displayed, and so you can always remove all data mining choosing “Restore All”
and “Unfocus All” from the Data Mining Menu at any time. As you master the use of these operations, you will
learn how to identify the dynamic behavior of complex programs and frameworks faster than you ever thought
possible.
Example: Graphical Analysis using Chart View with a Malloc Trace
The previous example demonstrated how to use various filtering/focusing data mining techniques to identify
hot spots in your program. All of these also apply to sampling by malloc events (heap tracing), in addition to
samples obtained by time profiling.
However, graphical analysis is also a useful technique for examining the results Shark provides, when used in
conjunction with the time based analysis described previously. This technique involves looking at the actual
execution pattern using Shark’s Chart view tab (see Chart View (page 40)). While time analysis helps us
prioritize which areas of complexity we wish to attack first, graphical analysis helps us identify the patterns of
complexity within these regions in a way that just doesn't come through when looking at the “average”
summaries seen in the profile browsers. While this concept applies to all configurations, it is particularly critical
with the Malloc Trace configuration (see Malloc Trace (page 101)), because analyzing the precise memory
allocation/deallocation patterns, and determining which calls are causing these allocations and deallocations,
is often more important than just looking at the averages seen with the browsers.
Please note an important distinction between malloc tracing and time profiling. With time profiling, you
generally want choose a data set that will take an interestingly long amount of time so that you can get a good
set of samples. In contrast, with exact tracing you generally want to scale back your operation size so that you
do one operation on just a few items, in order to keep the number of trace elements manageable.
This example uses the same Sketch demo build environment as the previous one. Complete that one up to
the end of A Performance Problem... (page 158) if you have not already gone through it in order to follow
along.
Taking Samples
1.
Switch to “Sketch” with your array of replicated shapes from A Performance Problem... (page 158). Do a
“Select All” to select all of the shapes before continuing.
2.
Launch Shark (in /Developer/Applications/Performance Tools/).
Retired Document | 2012-07-23 | Copyright © 2012 Apple Inc. All Rights Reserved.
176
Advanced Session Management and Data Mining
Example: Graphical Analysis using Chart View with a Malloc Trace
3.
Target your application and choose “Malloc Trace” instead of “Time Profile,” as with Figure 6-32.
Figure 6-32
Malloc Trace Main Window
4.
Switch back to Sketch.
5.
Move the Sketch window to expose the Shark window (optional but makes things easier).
6.
Make sure everything is selected.
7.
Press Option+Escape to start sampling.
8.
Choose Edit opy
C and wait for the menu bar highlight to go away.
9.
Press Option+Escape to stop Sampling.
10. Hit Command-1 to switch the weighting to by count (or do it via the Weighting popup in the Advanced
Settings drawer).
Retired Document | 2012-07-23 | Copyright © 2012 Apple Inc. All Rights Reserved.
177
Advanced Session Management and Data Mining
Example: Graphical Analysis using Chart View with a Malloc Trace
The window should look like Figure 6-33, if you have gone through Tutorial 1 first. Otherwise, it will look similar
but not exactly the same.
Figure 6-33 Result of Malloc Sampling
Retired Document | 2012-07-23 | Copyright © 2012 Apple Inc. All Rights Reserved.
178
Advanced Session Management and Data Mining
Example: Graphical Analysis using Chart View with a Malloc Trace
Graphical Analysis of a Malloc Trace
1.
Click on the Chart Tab and you'll get a window that looks like Figure 6-34.
Figure 6-34
Chart View
The lower graph a standard plot of the callstacks, with sample number on the X axis and stack depth on
the Y axis, while the upper graph is a plot of the size of each allocated block plotted against the sample
number.
This plot is useful for identifying repeated execution paths in your code due to the fact that execution
trees leave a form of “fingerprint” that is often quite readily visible. Basically, if you see similar patterns in
the graph, it is a strong indication that you are going through the same code path. It may be acting on
different data each time, but these repeated patterns often represent good opportunities for improving
performance. Often, you can hoist some computation outside of the innermost loop in each nesting and
make the actual work done in the loop smaller while performing the same actual work. This kind of change
would show up in the graph by reducing the size and the complexity of the repeated structure.
Let's show an example of a repeated structure.
Retired Document | 2012-07-23 | Copyright © 2012 Apple Inc. All Rights Reserved.
179
Advanced Session Management and Data Mining
Example: Graphical Analysis using Chart View with a Malloc Trace
2.
Select the first hump just before sample 6,000 and enlarge it, as shown in Figure 6-35:
Figure 6-35
Place to Select
The yellow indicates the tenure of different stack frames. Stack frame 0 is main and it is active the entire
time. As you get deeper into the stack the tenures get narrower and narrower. Tall skinny spikes of yellow
indicate deep chains of calls that do little work and this should be avoided.
Retired Document | 2012-07-23 | Copyright © 2012 Apple Inc. All Rights Reserved.
180
Advanced Session Management and Data Mining
Example: Graphical Analysis using Chart View with a Malloc Trace
3.
Now use the slider on the bottom left of the window to adjust zoom. Play with this a bit. As you zoom in
and out you'll see that there are multiple levels of unfolding complexity — much like a fractal. Here is a
sequence of zooms that show complexity at different levels:
It is a good idea to explore around your execution trace and identify every range of repeated structure
and understand what it is doing in each case. The reason this has a fractal like quality is that Mac OS X’s
library calls have many layers of libraries that encapsulate one another. Each of these layers can introduce
levels of iteration that is nested inside of other layers. This is like the problem with the nested iteration
that we showed in Analysis Via Source Navigation (page 163), but on a system wide scale. In order to
drastically improve performance you must attack this problem of complexity creep and eliminate it as
much as possible. Application developers obviously can't fix framework issues, but they can strive to
eliminate similar complexity issues in their libraries.
Retired Document | 2012-07-23 | Copyright © 2012 Apple Inc. All Rights Reserved.
181
Advanced Session Management and Data Mining
Example: Graphical Analysis using Chart View with a Malloc Trace
4.
We'll finish up with another good application of this graphical analysis. Click on the call stack
to reveal the call stack for this sample, as shown in Figure 6-36:
Figure 6-36
button
Graph View with Call-Stack Pane
Using the callstack view, notice that a bunch of XML parsing to build up some kind of NSPrintInfo is
occurring. This is surprising since all we did was a clipboard copy. In fact, all of the malloc events from
about 5,000 to 15,000 are involved with manipulating printer stuff. It turns out that this is due to Sketch
actually exporting a full PDF onto the clipboard rather than using a “promise” that it has material to put
there if the user actually switches applications and then performs a “paste” operation — the uncommon
case, generally. This is a great example of how doing something fairly innocuous at the application level
can cause the system libraries to do a lot of extra work. It is also a great example of a cross-library problem
that needs to be optimized on multiple levels, ranging from the application to the printing framework to
the XML parsing code.)
Retired Document | 2012-07-23 | Copyright © 2012 Apple Inc. All Rights Reserved.
182
Custom Configurations
Up until now, you have been using the configuration menu in Shark’s main window (in Figure 7-1) to select
from various built-in sampling methods. Each of these sampling methods is called a configuration (abbreviated
as “configs"), and Shark saves each configuration as a separate configuration file (which is also often called a
“config”). Each config file describes a variety of settings for Shark which enable it to sample or profile your
application in a particular way, plus a summary of any hardware requirements that are necessary to use it.
Figure 7-1
Main Configuration Menu
Once you have gained some experience with Shark, you might want to change some of the settings or adjust
some of the types of data Shark collects when a particular config is active. For example, you might adjust the
default sample rate of the Time Profiling config to sample more often, if your examinations routinely need
higher sampling resolution. This chapter gives an overview as to how this can be accomplished using Shark’s
sophisticated Configuration Editor .
Retired Document | 2012-07-23 | Copyright © 2012 Apple Inc. All Rights Reserved.
183
Custom Configurations
The Config Editor
The Config Editor
The Configuration Editor lets you individually modify settings for any of Shark’s modules, which are called
PlugIns . The properties available in each PlugIn differ depending on the nature of the work that particular
PlugIn is designed to do. Shark uses three types of PlugIns:
●
Data Source – These are responsible for collecting and/or generating session data. Many user-modifiable
parameters are typically available to control the sampling or profiling performed by these modules.
●
Analysis – These process raw data and produce intermediate results that are typically shared by more
than one viewer. Only a few settings are available for these modules.
●
Viewer – These display analysis results and performance data. Because users typically want immediate
feedback to viewer adjustments, options for these are set by interacting directly with the visible display
or through the Advanced Settings Drawer (see Advanced Settings Drawer (page 23)) attached to each
analysis window, instead of here in the Configuration Editor.
Once you have decided that the built-in configs are not sufficient for the work that you are doing, the first step
to creating or editing your own configurations is to start the Configuration Editor using one of two techniques:
●
Select the Config ew...
N (Command-N ) command to start a new config from scratch.
●
Select Config dit...
E (Command-Option-Shift-C ) to modify the current config.
Either technique will bring up the Configuration Editor dialog box, which allows you to examine and modify
any part of a configuration. Adding Shortcut Equations points out the four main major parts of this editor:
1.
The Config Listing — This contains an entry for every configuration Shark knows about. This includes
documents stored in /System/Library/Application Support/Shark/Configs folder, and any
custom config documents stored in $USER/Library/Application Support/Shark/Configs in your
home folder. Some config file names may be dimmed in the list. This means they are not compatible with
the system Shark is currently running on, and therefore cannot be enabled for sampling or profiling, but
you can still select and modify them here in the Configuration Editor. The rest of the Configuration Editor
controls always modify the selected entry in this list.
Next to the main listing, various controls support basic file operations to manage these config files:
●
You can Duplicate any config in the list. This is usually the best way to begin making a custom config.
In fact, selecting “New...“ from the Config Menu just makes a duplicate of the current config in order
to provide a starting baseline.
●
You can Delete any custom config in the list, but not built-in config files. A verification message will
appear when you click the Delete button. A deleted config will be erased from the appropriate Configs
folder when you finally press the OK button.
Retired Document | 2012-07-23 | Copyright © 2012 Apple Inc. All Rights Reserved.
184
Custom Configurations
The Config Editor
●
You can Rename any custom config in the list, but not built-in config files. A renamed config will be
changed in the appropriate Configs folder immediately.
●
You can Import any config that you may have saved on your system or a mounted fileserver. Imported
configs are copied to your home $USER/Library/Application Support/Shark/Configs folder.
You can also perform this function without invoking the Configuration Editor by using the
Config Imp
ort... menu command.
●
You can Export any listed config to an arbitrary file on your system or a fileserver. This is a great way
to share configs between computers or user accounts. You can also perform this function without
invoking the Configuration Editor by using the Config xport...
E
menu command.
2.
The Summary — Explains the details of the selected config and all the PlugIn settings that will be used
to collect data.
3.
The PlugIn List — Each PlugIn type in the configuration may optionally provide an editor for its properties
in the configuration. You can select the PlugIn to edit by clicking on the desired PlugIn name here. You
can also enable or disable PlugIns using the checkboxes.
The order of the plugins has a different meaning depending upon on the type of plugin. For data source
plugins, the vertical order of the enabled plugins indicates the order in which data sources will be started
and stopped. Analysis plugin order indicates the order of their creation, and viewer plugin order determines
the order of viewer tabs in the resulting Shark session window. The position of a plugin can be changed
using the Up and Down arrow buttons to the lower left of the PlugIn List .
4.
The PlugIn Property Editor — This displays user-tunable options, if any, for the PlugIn currently selected
in the PlugIn List . Some PlugIns have no or only a few controls, while other PlugIns (such as the “Timed
Samples & Counters” Data Source plugin) have many properties, and require multiple tabbed window
panes to organize all the various settings available.
5.
The Property View Pop-up: Each plugin’s property editor can optionally support two modes of operation:
Simple (the default) and Advanced . This menu allows you to select between them, if they are both present.
In addition, this control modifies the PlugIn List as follows:
●
In Simple mode, only plugins enabled by the currently selected config that have property editors are
listed.
Retired Document | 2012-07-23 | Copyright © 2012 Apple Inc. All Rights Reserved.
185
Custom Configurations
Simple Timed Samples and Counters Config Editor
●
In Advanced mode, all of the available plugins are listed with a checkbox next to each indicating
whether or not it is enabled in the current config.
Figure 7-2
Config Editor
The remainder of this chapter describes Shark’s wide variety of PlugIn editors that are controllable through
the Configuration Editor . In addition, because it is very complex, the “Advanced” mode of the “Timed Samples
and Counters” config editor is described in Hardware Counter Configuration (page 202).
Simple Timed Samples and Counters Config Editor
The Timed Samples and Counters data source is used for collecting system-wide time and performance count
profiles. This is used for several default configurations, including the Time Profiling one described in Time
Profiling (page 29). In Simple mode, there are two types of settings that can be modified in the editor:
Retired Document | 2012-07-23 | Copyright © 2012 Apple Inc. All Rights Reserved.
186
Custom Configurations
Simple Timed Samples and Counters Config Editor
●
Sampling Tab – The controls on this tab (see Figure 7-3) determine when to start and stop recording
samples.
1.
Windowed Time Facility— If enabled, Shark will collect samples until you explicitly stop it. However,
it will only store the last N samples, where N is the number entered into the sample history field
(10,000 by default). This mode is also described in Windowed Time Facility (WTF) (page 125).
2.
Start Delay— Amount of time to wait after the user selects “Start” before data collection actually
begins. This helps prevent Shark from sampling itself.
3.
Time Limit— The maximum amount of time to record samples. This is ignored if WTF mode is enabled.
4.
Sample Interval— Determines the sampling rate. The interval can be a time period (1 ms default),
CPU performance event count, or OS performance event count . If no performance counters (CPU or
OS) are configured as triggers, the sample interval is assumed to be a time interval, and hence only
the time entry field is enabled.
Figure 7-3
Simple Timed Samples and Counters Data Source - Sampling Tab
1
2
3
4
●
Counters Tab— This tab (see Figure 7-4) presents a fast and simple way to search and configure the
Processor (CPU), Operating System (OS), and Northbridge (MEM) performance counters. Enter an event
keyword or partial description in the search field to see a list of matching counter events. Use the Mode
Retired Document | 2012-07-23 | Copyright © 2012 Apple Inc. All Rights Reserved.
187
Custom Configurations
Simple Timed Samples and Counters Config Editor
column to select the performance counter mode (None, Counter, or Trigger). Only a small subset of
possible counter options are available here. For more, you will have to use the Advanced settings, described
in Hardware Counter Configuration (page 202).
Figure 7-4
Simple Timed Samples and Counters Data Source - Counter Settings
Retired Document | 2012-07-23 | Copyright © 2012 Apple Inc. All Rights Reserved.
188
Custom Configurations
Malloc Data Source PlugIn Editor
Malloc Data Source PlugIn Editor
The Malloc data source is used for the Malloc Trace config described in Malloc Trace (page 101). It is used for
collecting a memory allocation profile from a particular executable. All of its configurable controls are contained
in a single tab (see Figure 7-5), which modifies the timing of starting and stopping of memory allocation
recording behavior:
Figure 7-5
Malloc Data Source - Sampling Settings
1
2
3
1.
Record Only Active Blocks— If enabled, Shark will collect samples only in memory regions that were
allocated during a profile and not released. Otherwise, any allocation or deallocation that takes place is
recorded.
2.
Time Limit— The maximum amount of time to record samples.
3.
Start Delay— Amount of time to wait after the user selects “Start” before data collection actually begins.
Retired Document | 2012-07-23 | Copyright © 2012 Apple Inc. All Rights Reserved.
189
Custom Configurations
Static Analysis Data Source PlugIn Editor
Static Analysis Data Source PlugIn Editor
The Static Analysis data source is used by the Static Analysis default configuration, described in Static
Analysis (page 107). It is used to search for potential performance issues by looking for problems that might
crop up through some other (as yet untested) code path. All of its configurable controls are contained in a
single tab (see Figure 7-6), which modifies the type and severity of potential problems that can be identified
using the mechanism:
Figure 7-6
Static Analysis Data Source - Settings
2
4
3
1
1.
2.
3.
Target Selection— These options allow you to narrow down the area of memory examined by Shark.
●
Application — Looks for potential performance issues in the main text segment of the target process
●
Frameworks — Looks for potential performance issues in the frameworks that are dynamically loaded
by the target process.
●
Dyld Stubs — Looks for any potential performance or behavior anomalies in the glue code inserted
into the binary by the link phase of application building.
Analysis Options— These allow you to enable or disable analysis.
●
Browse Functions — Gives each function in the text image of a process a reference count of one. This
allows you to browse all of the functions of a given process with Shark’s code browser. No analysis
(or problem weighting) is performed.
●
Look For Problems — search all functions in the text image of a process for problems of at least the
level of severity specified by the Problem Severity slider. Any address with a problem instruction or
code is given a reference count equivalent to its severity.
Problem Severity Slider— This slider acts as a filter, adjusting the minimum “importance” of problems
to report using a predefined problem weighting built into Shark. The further to the right the slider, the
less output is generated, as more and more potential problems are ignored because their “importance”
is not high enough.
Retired Document | 2012-07-23 | Copyright © 2012 Apple Inc. All Rights Reserved.
190
Custom Configurations
Java Trace Data Source PlugIn Editor
4.
Processor Settings— Shark needs to know which model of processor is your target before it can examine
code and find potential problems. Separate menus are provided for PowerPC and Intel processors because
it can analyze for one model of each processor family simultaneously.
●
PowerPC Model — Selects the PowerPC model to use when searching for and assigning problem
severities .
●
Intel Model — Selects the Intel model to use when searching for and assigning problem severities .
Java Trace Data Source PlugIn Editor
The Java Trace data source supports three types of Java tracing: Time , Alloc , and Method . All of these have
default configurations described in Java Tracing Techniques (page 109). These types of tracing only work on a
single Java process at a time, as there is no systemwide Java tracing. The controls on the tab (see Figure 7-7)
determine what type of Java Tracing to perform, and the time between samples for a Java Time Trace.
Figure 7-7
Java Trace Data Source - Sampling Settings
1
2
1.
2.
Trace Type PopUp Menu— Chooses one of the four types of Java tracing available:
●
Timed Samples — Selects the Java Time Trace mode. This is similar to a regular Time Profile. It
periodically stops the Java process and takes samples of the running threads.
●
Memory Allocations — Selects the Java Alloc Trace mode. Memory allocations and the sizes of the
objects allocated are recorded.
●
Method Trace — This type of Java tracing is still under development, and should not be used yet.
●
Call Trace — Selects the Java Call Trace mode. This records each entry into every method during the
execution of your program. Hence, this is an exact trace of the methods called (within the limitations
of the Java VM).
Interval field— Enter the time between samples here, for the Timed Samples mode.
Retired Document | 2012-07-23 | Copyright © 2012 Apple Inc. All Rights Reserved.
191
Custom Configurations
Sampler Data Source PlugIn Editor
Sampler Data Source PlugIn Editor
The Sampler data source provides the same functionality as the separate Sampler application and command-line
tool. It is not used for any of the default configurations provided with Shark, as most of its functionality has
been superseded by features of the much more sophisticated “Timed Samples and Counters” PlugIn. All
configurable features can be modified on a single tab (see Figure 7-8), which adjusts basic timing parameters:
Figure 7-8
Sampler Data Source - Settings
1
3
2
4
1.
Sample Interval— Determines the sampling rate. The interval is a time period (10 ms default).
2.
Start Delay— Amount of time to wait after the user selects “Start” before data collection actually begins.
3.
Time Limit— The maximum amount of time to record samples.
4.
Sample Limit — The maximum number of samples to record. Specifying a maximum of N samples will
result in at most N samples being taken, even on a multi-processor system, so this should be scaled up
as larger systems are sampled.
Retired Document | 2012-07-23 | Copyright © 2012 Apple Inc. All Rights Reserved.
192
Custom Configurations
System Trace Data Source PlugIn Editor
System Trace Data Source PlugIn Editor
This data source collects data for the System Trace default configuration, described in System Tracing (page
63). All configurable features can be modified on a single tab (see Figure 7-9), which adjusts basic timing
parameters:
Figure 7-9
System Trace Data Source - Settings
2
1
3
4
5
1.
Sample Limit — The maximum number of samples to record. Specifying a maximum of N samples will
result in at most N samples being taken, even on a multi-processor system, so this should be scaled up
as larger systems are sampled. On the other hand, you may need to reduce the sample limit if Shark runs
out of memory when you attempt to start a system trace, because it must be able to allocate a buffer in
RAM large enough to hold this number of samples. When the sample limit is reached, data collection
automatically stops, unless the Windowed Time Facility is enabled (see below). The Sample Limit is always
enforced, and cannot be disabled.
2.
Time Limit— The maximum amount of time to record samples. This is ignored if Windowed Time Facility
is enabled, or if Sample Limit is reached before the time limit expires.
3.
Start Delay— Amount of time to wait after the user selects “Start” before data collection actually begins.
4.
Record Callstacks— When enabled, Shark will collect the function backtrace along with the program
counter value for each sample. This should normally be enabled, but can be disabled if you need to record
longer traces with a limited amount of memory or if the performance impact of recording the callstacks
is too high.
5.
Windowed Time Facility— If enabled, Shark will collect samples until you explicitly stop it. However, it
will only store the last N samples, where N is the number entered into the Sample Limit field. This mode
is also described in Windowed Time Facility (WTF) (page 125).
Retired Document | 2012-07-23 | Copyright © 2012 Apple Inc. All Rights Reserved.
193
Custom Configurations
All Thread States Data Source PlugIn Editor
All Thread States Data Source PlugIn Editor
This data source collects data for the Time Profile (All Thread States) default configuration, described in Time
Profile (All Thread States) (page 97), which samples the callstacks of all threads on the system simultaneously,
whether they are running or blocked. All configurable features can be modified on a single tab (see Figure
7-10), which adjusts basic timing parameters:
Figure 7-10
All Thread States Data Source - Settings
1
3
2
4
5
6
1.
Sample Interval— Determine the trigger for taking a sample. The interval is a time period (10 ms default).
2.
Start Delay— Amount of time to wait after the user selects “Start” before data collection actually begins.
3.
Time Limit— The maximum amount of time to record samples. This is ignored if Sample Limit is enabled
and reached before the time limit expires.
4.
Sample Limit — The maximum number of samples to record. Specifying a maximum of N samples will
result in at most N samples being taken, even on a multi-processor system, so this should be scaled up
as larger systems are sampled. When the sample limit is reached, data collection automatically stops. This
is ignored if the Time Limit is enabled and expires first.
5.
Prefer User Callstacks— When enabled, Shark will ignore and discard any samples from threads running
exclusively in the kernel. This can eliminate spurious samples from places such as idle threads and interrupt
handlers, if your program is not affected by these.
6.
Trim Supervisor Callstacks— When enabled, Shark will automatically trim the recorded callstacks for
threads calling into the kernel down to the kernel entry points, and discarding the parts of the stack from
within the kernel itself. These shortened stacks are usually sufficient, since most performance problems
in your programs can be debugged without knowing about how the kernel is running internally. You just
need to know how and when your code is blocking, and not how Mac OS X is actually processing the
blocking operation itself.
Retired Document | 2012-07-23 | Copyright © 2012 Apple Inc. All Rights Reserved.
194
Custom Configurations
Analysis and Viewer PlugIn Summary
Analysis and Viewer PlugIn Summary
All Data Source PlugIns include configuration editors. However, most of the analysis and viewer editors do not.
While you generally will not need to spend much time worrying about these plugins during the configuration
process, you will still need to enable or disable the correct PlugIns in your configuration in order to be able to
see your results in the way you expect. The lists in this section give you an overview of when to enable or
disable various PlugIns.
There are only a few analysis PlugIns. They just need to be matched to the data source and viewer PlugIns
used before and after them, since they connect these PlugIns together:
●
Standard Profile and Counters— This should be enabled for all configurations except ones that use
“System Trace” or “Timed Samples and Counters” configurations that only use the “Counter Spreadsheet”
viewer.
●
Counter Spreadsheet— This can only be used with the “Timed Samples and Counters” data source and
the matching “Counter Spreadsheet” viewer. Unlike the rest of the analysis and viewer PlugIns, it actually
has an editor for configuring a preset list of “shortcut equations.” See Counter Spreadsheet Analysis PlugIn
Editor (page 196), below, for details.
●
System Trace— This can only be used with the “System Trace” data source and any of the four “System
Trace” viewers.
There are several viewer PlugIns. When these are enabled, the matching tabs will appear across the top of any
session windows made with these configurations, in the order that the configurations are listed in the
Configuration Editor . Like the analysis PlugIns, you can only enable these usefully when other PlugIns are also
enabled, as we note below.
●
Standard Profile Browser— This is the standard tabular browser view of symbols and sample counts used
by most configurations, as is described in Profile Browser (page 32). To use it, you need to enable the
“Standard Profile and Counters” analysis PlugIn.
●
Callstack & Counters Chart— This is the the Chart View used by many configurations to graphically display
the callstacks of samples over time, as is described in Chart View (page 40). To use it, you need to enable
the “Standard Profile and Counters” analysis PlugIn.
●
Counter Spreadsheet— This presents the counter spreadsheet view described in Timed Counters: The
Performance Counter Spreadsheet (page 111). To use it, you must have the “Timed Samples and Counters”
data source enabled and the “Counter Spreadsheet” analysis PlugIn enabled.
●
System Trace: Summary— This can only be used with the “System Trace” data source and analysis PlugIns.
It displays the Summary tab used by System Trace and described in Summary View In-depth (page 67).
●
System Trace: Trace— This can only be used with the “System Trace” data source and analysis PlugIns. It
displays the Trace tab used by System Trace and described in Trace View In-depth (page 73).
Retired Document | 2012-07-23 | Copyright © 2012 Apple Inc. All Rights Reserved.
195
Custom Configurations
Counter Spreadsheet Analysis PlugIn Editor
●
System Trace: Timeline— This can only be used with the “System Trace” data source and analysis PlugIns.
It displays the Timeline tab used by System Trace and described in Timeline View In-depth (page 77).
●
System Trace: Raw— This can only be used with the “System Trace” data source and analysis PlugIns. It
displays raw and unprocessed samples recorded by System Trace, and is normally not used by end users.
Counter Spreadsheet Analysis PlugIn Editor
When PMCs are active during sampling, this analysis plugin can be enabled. The controls on this editor allow
you to create new results equations called shortcuts . The shortcuts will show up in the counter spreadsheet
as extra columns of data that you can plot in the counter spreadsheet’s chart view. With these shortcuts, you
can effectively create new types of results data that use the event counts from the sampling to derive new
information about the way the event counts may relate to each other, without forcing you to first export the
data into another application, such as a spreadsheet. These derivative results can then be viewed just as if they
were any other bit of “raw” counter data sampled by Shark.
Using the Editor
When using the editor, you will first be presented with the view shown in Figure 7-11:
Figure 7-11
Counter Spreadsheet Analysis
1
3
4
2
Retired Document | 2012-07-23 | Copyright © 2012 Apple Inc. All Rights Reserved.
196
Custom Configurations
Counter Spreadsheet Analysis PlugIn Editor
This view contains the following constituent parts:
1.
PMC Sumary Table – This table summarizes all the performance counters (PMCs) that are currently selected
and enabled in the Timed Samples and Counters data source.
●
PMC column — This is a short description of the counter and the device in which this performance
monitor counter is found.
●
Mode column — The counter’s current mode. This is typically counter , because unused and trigger
PMCs are filtered out and not listed in this table.
●
Symbol column — This display’s the counter’s term . This is the algebraic symbol that represents the
counter in the shortcut equations .
●
PMC Description column — The name of the event type currently being counted by the selected PMC,
which is also used as the header for the results column for this PMC in the Counter Spreadsheet.
2.
Shortcut Equation Table – This table will list any equations that you have defined to generate extra results
in the counter spreadsheet viewer. You can edit the names of the shortcut equations in the left column,
and their formulas in the right.
3.
Add Button – Creates a new shortcut equation.
4.
Delete Button– Erases the existing shortcut equation that you are currently editing.
If you decide that you would like to combine the existing counter results into a new, derivative result, then
simply click the Add button. A new line will be added to the Shortcut Equation Table , where you can type a
name in the left column and the equation itself in the right. The name can be whatever you like, but the
equation must follow a proscribed format consisting of input terms (using the notation in the table below)
combined together using basic four-function math symbols (+ for addition, - for subtraction, * for multiplication,
and / for division) and using parenthesis to order the operations, if necessary. You may also include numeric
constants at any point in an equation. These are most often used when you need to convert between different
types of units.
Once created, each shortcut equation is applied to each row of results (i.e. on a per-sample basis). Shark adds
a new column titled with the shortcut name to its “spreadsheet” of counter results in order to hold the newly
calculated values.
Shortcut
Description
Equation
Terms
pXcY
Represents processor-X , counter-Y . For example: p2c1 is the term that represents counter
#1 on processor #2.
X = CPU number, numbered 1, 2, 3, ...
Y = PMC number, numbered 1, 2, 3, ...
Retired Document | 2012-07-23 | Copyright © 2012 Apple Inc. All Rights Reserved.
197
Custom Configurations
Counter Spreadsheet Analysis PlugIn Editor
Shortcut
Description
Equation
Terms
pNcY
Represents a summation of results from all processors on counter-Y . For example: pNc1
is the term that represents event count samples for every active processor’s counter #1,
all added together. You could get the same effect with an equation of your own like
(p1c1+p2c1+p3c1+p4c1), but this would only work correctly on a four processor
system. On a two processor system, it would fail, since processors 3 and 4 do not exist,
while on an eight processor system it would get incorrect results because it would miss
results from processors 5–8.
Y = PMC number, numbered 1, 2, 3, ...
mXcY
Represents memory Controller-X , counter-Y . For example: m1c1 is the term that represents
counter #1 on memory controller #1.
X = Memory controller number, numbered 1, 2, 3, ... (At present, there are no Macs with
more than one memory controller.)
Y = PMC number, numbered 1, 2, 3, ...
oXcY
Represents operating System-X , counter-Y. For example: o1c1 is the term that represents
counter #1 in operating system image #1.
X = OS image number, numbered 1, 2, 3, ... (At present, there are no Macs with multiple
operating system images.)
Y = PMC number, numbered 1, 2, 3, ...
aXcY
Represents apple Processor Interface-X , counter-Y. For example: a1c1 is the term that
represents counter #1 in API #1.
X = Apple Processor Interface (API) number, numbered 1, 2, 3, ... (At present, there are
no Macs with multiple APIs.)
Y = PMC number, numbered 1, 2, 3, ...
tbX
Represents timebase Register in core X . For example: tb1 is the term that represents the
timebase register in core #1.
X = Core to take the timebase from, numbered 1, 2, 3, ...
eqX
Represents equation-X . For example: eq01 is the term that represents the result already
calculated by the first shortcut equation in the results table. In this way, new equations
can be built using results already calculated.
Retired Document | 2012-07-23 | Copyright © 2012 Apple Inc. All Rights Reserved.
198
Custom Configurations
Counter Spreadsheet Analysis PlugIn Editor
Spreadsheet Configuration Example
Because this editor is very flexible and powerful, an example can be helpful to illustrate how it might be used.
Starting with a predefined config, we will add some performance counter events, and activate the Performance
Counter Spreadsheet plugins. Last, we will add some shortcut equations to the analysis.
Select the configuration named “Processor Bandwidth (Intel Core 2)” (Figure 7-12).
Figure 7-12
Choosing a counter-based starting configuration
Click the Duplicate button . Change the name of the new configuration to be “Core CPI (Intel Core 2).”
Make sure that “Simple” is selected in the View popup . Now click the Counters tab in the Config Editor window.
Add the following two performance counter events to the profile config:
1.
Find the entry in the performance counter event list that reads “CPU_CLK_UNHALTED.CORE.” Select
“Counter” in the Mode column . The event name will change color (blue) to indicate that the selected event
is to be used as a counter.
Retired Document | 2012-07-23 | Copyright © 2012 Apple Inc. All Rights Reserved.
199
Custom Configurations
Counter Spreadsheet Analysis PlugIn Editor
2.
Next search the list by typing “INST” into the search field, as is shown in Figure 7-13. Select the
“INST_RETIRED” entry and change the mode to “Counter” as with the first event.
Figure 7-13
Enabling two performance counters
Click on the Counter Spreadsheet line in the list of PlugIns to see the Performance Counter Spreadsheet . You
will see the editor described previously in Using the Editor (page 196). To add a new equation to the Shortcut
Equation table click the Add button . Enter a shortcut name (e.g. “CPI” – this equation will compute the average
number of CPU cycles per instruction for each sample).
Retired Document | 2012-07-23 | Copyright © 2012 Apple Inc. All Rights Reserved.
200
Custom Configurations
Counter Spreadsheet Analysis PlugIn Editor
Next, enter the equation pNc3/pNc2, as is shown in Figure 7-14. This will automatically calculate the number
of cycles per completed instruction, or CPI, and allow you to display it alongside the “raw” counts of CPU cycles,
instructions completed, and the bus bandwidths already calculated by the original “Processor Bandwidth”
configuration.
Figure 7-14
Performance Spreadsheet: Shortcut Equation
Retired Document | 2012-07-23 | Copyright © 2012 Apple Inc. All Rights Reserved.
201
Hardware Counter Configuration
The different CPUs and North bridge chipsets available in Macintosh systems have widely varying performance
monitoring capabilities. Because there are such a wide variety of counters and ways in which they can be
combined to get useful information, the default configurations supplied with each version of Shark can only
scratch the surface of the immense variety of possible configurations. As a result, this is one of the main areas
where building custom Shark configurations can be helpful — but for the same reason it is also one of the
most complex aspects of Shark configuration.
Above and beyond its basic, system-wide sampling functionality, Shark’s main “Timed Samples and Counters”
data source offers access to this rich selection of performance counters. Its basic sampling configuration options
were already covered briefly in Simple Timed Samples and Counters Config Editor (page 186). However, there
are many more options available in Advanced mode of the configuration editor (see The Config Editor (page
184) for how to get here), where multiple separate tabs provide access to all of the settings that the PlugIn
has. Depending upon factors such as the underlying hardware capabilities, the number of tabs can vary. In
general, Shark will present the advanced Sampling tab, one to four processor and/or North bridge tab(s), and
the MacOS performance counter tab. The “processor” tab(s) allow configuration of processor performance
counters, and are titled with the make and model of the processor. For most processors, all counter configuration
fits in a single tab, but in the case of the PowerPC 970 CPU there are so many settings that a second IMC tab
is also added. Finally, if the North bridge chipset in the system has hardware performance counters, then there
will be one or two tab(s) titled with the model of the chipset.
This chapter describes how you can configure the wide variety of hardware counters using the customized
controls available in these configuration editor panes. It will start by describing the advanced data source
PlugIn settings available on the most modern Macs and work through describing the PlugIn tabs supporting
the older systems’ CPUs and North bridge performance monitor counters (PMCs), in detail.
Configuring the Sampling Technique: The Sampling Tab
The Sampling tab is always the first tab presented when one chooses to edit the “Timed Samples and Counters”
data source in “Advanced” mode. This tab controls how to start and stop sampling, and when samples are
taken. The remainder of this section discusses the various features of the tab.
Retired Document | 2012-07-23 | Copyright © 2012 Apple Inc. All Rights Reserved.
202
Hardware Counter Configuration
Configuring the Sampling Technique: The Sampling Tab
Once you have decided which counters you want to measure, and thought a bit about how you might want
to control sampling, there are several configuration steps that must be performed using the controls on the
Sampling tab, illustrated in Figure 8-1.
Figure 8-1
Timed Samples & Counters Data Source - Advanced Sampling Tab
1.
Sampling Control— First, you must choose ways to start and stop sampling using the options at the top
of the configuration controls. These options are essentially identical to the basic options used to control
“Timed Samples and Counters.”
●
WTF Mode — If enabled, Shark will collect samples until you explicitly stop it. However, it will only
store the last N samples, where N is the number entered into the sample history field (10,000 by
default). This mode is also described in Windowed Time Facility (WTF) (page 125).
●
Time Limit — The maximum amount of time to record samples. This is ignored if WTF mode is enabled.
●
Start Delay — Amount of time to wait after the user selects “Start” before data collection actually
begins. This helps prevent Shark from sampling itself.
Retired Document | 2012-07-23 | Copyright © 2012 Apple Inc. All Rights Reserved.
203
Hardware Counter Configuration
Configuring the Sampling Technique: The Sampling Tab
●
2.
Sample Limit — Sets the maximum number of samples to record. Specifying a maximum of N samples
will result in at most N samples being taken on a uniprocessor machine or C *N samples taken on a
multiprocessor system with C processors. This prevents the sample buffers from growing too large
in case you happen to choose a combination of a large time limit and high sampling rate.
Sample Trigger— Next, choose when you want samples to be taken between the “start” and “stop” events
using the options in the middle of the configuration controls. There are a variety of ways, one of which is
unique to performance monitor work.
●
Timed Sampling — The most common way to use counters is to record the values of all counters
periodically, when a timer fires. This produces a distribution of events over time, much like a Time
Profile. Because the events are counted for the entire time between sample points, and not just at
the sample points, they are only approximately correlated with the program counter information
sampled by Shark.
●
Event-Triggered Sampling — An alternative is to let performance events trigger sampling themselves.
As a result, this is only possible when performance monitoring counters are used. One counter at a
time can be set to a special Trigger mode which initiates sampling when the event count reaches a
preset Sample Interval . If the event occurs frequently, many samples will be taken, while if it occurs
infrequently then only a few samples will be taken. There are pros and cons to this mode. First, you
can only trigger on one event type at a time. However, each sample point will be taken immediately
after the event occurs, so you can accurately determine which lines of code from your program are
causing the events. Hence, this mode is most helpful when you are trying to determine which code
is triggering a particular event.
●
Programmatic Sampling — A third alternative is to let your program determine when to take a sample.
Your program can link to the CHUD framework and call chudRecordUserSample, which will force a
performance counter sample to be taken. In this way, you will be able to see events at a rate that is
precisely controlled by you. This is useful when you want to examine issues such as how your program’s
behavior varies over time, from one loop iteration to another.
Once you have chosen a technique for controlling the sampling, just check the appropriate box in this
section of the tab and fill out any necessary parameters.
●
Time — A sample is taken every T time units (1 millisecond, by default). This is the same control used
ot vary the sampling frequency of a standard time profile.
●
CPU PMC Events — A sample is taken every N CPU PMC events from the selected CPU PMC. Only one
trigger PMC can be selected at a time. In a multi-processor system, any CPU can trigger the collection
for all CPUs.
●
OS PMC Events — A sample is taken every N OS performance monitor counter (PMC) events from a
selected OS PMC. Only one trigger PMC can be selected at a time.
Retired Document | 2012-07-23 | Copyright © 2012 Apple Inc. All Rights Reserved.
204
Hardware Counter Configuration
Configuring the Sampling Technique: The Sampling Tab
●
chudRecordUserSample — A sample is recorded for every call to the
CHUD.frameworkchudRecordUserSample() function. This is analogous to using signposts (Sign
Posts (page 85)) with system trace.
Finally, once you have chosen a sampling mode, there is one additional variation that can be applied to
the nominal sampling rate. The Fuzz feature, when enabled, randomizes the sampling interval by ±N%
around the specified nominal value. For example, if timer sampling is selected, the sampling period is 1ms
and Fuzz is set to 5%, the actual sampling period will vary randomly between 0.95ms and 1.05ms. Fuzz
helps prevent harmonic relationships between the sampling interval and execution behavior. You should
use this if your code performs the same work repeatedly, with very little variation in its patterns.
3.
4.
Samples—Down at the bottom of the tab are a couple of “miscellaneous” options.
●
Record Callstacks — When enabled, Shark will collect the function backtrace along with the program
counter value for each sample. This is used by default, but can be disabled if you need to record an
extremely large number of samples into Shark’s kernel buffers or if the callstack recording is impacting
performance (a possibility if sample rates are very high).
●
Record Final Sample — By default, when sampling is stopped all collection is terminated immediately .
In a multiprocessor system, this can cause the last sample from some processors to be dropped if they
are a little bit behind the “main” processor and therefore have not quite completed a time interval or
reached an interrupt state when Shark is stopped. This setting will force collection of the last sample
from all processors, even if it is not a “full” sample.
Device Selection— Finally, below the tab itself are menus that let you choose a device to target. While
this will often simply be the processor and/or North bridge on your own machine, Shark also allows you
to choose other processors that aren’t even installed on your machine. This latter option is quite useful if
you are making measurements of a different machine over a network Network/iPhone Profiling (page 138).
●
CPU PopUp Menu — This selects the processor type to configure. By default, the CPU in the running
system is selected. If any CPU performance counters are enabled (in either Counter or Trigger mode,
as described in Counter Control (page 206)), then the configuration will only be compatible with
machines that have the specified CPU.
●
North Bridge PopUp Menu — This selects the memory controller type to configure. By default, the
North bridge in the running system is selected, or “none” if no North bridge counters are available in
the system. If any memory controller performance counters are enabled (in Counter mode, as described
in Counter Control (page 206)), then the configuration will only be compatible with machines that
have the specified memory controller. Please note that currently there are no supported North bridge
performance counters in Intel-based Macs.
Changing either of these settings will not have a visible effect on the “Sampling” tab. However, both will
change the contents of the relevant hardware tab(s), the name of those tab(s) will update immediately,
and the controls for setting up events will change if one of the hardware tabs is visible.
Retired Document | 2012-07-23 | Copyright © 2012 Apple Inc. All Rights Reserved.
205
Hardware Counter Configuration
Common Elements in Performance Counter Configuration Tabs
Common Elements in Performance Counter Configuration Tabs
All of the various performance counter configuration tabs have many unique elements, as the various processors
and North bridges supported by MacOS X are significantly different from each other in many ways. However,
Shark uses several common interfaces throughout these various tabs in order to make it reasonably easy for
you to work with more than one variety of Macintosh. To avoid repeating these descriptions for every tab, they
are discussed here.
Counter Control
Every performance counter is controlled with a consistent set of three controls, like those illustrated below in
Figure 8-2. This section describes how they work, for any variety of hardware.
Figure 8-2
A typical set of performance counter controls
2
1
3
There are three controls associated with every performance counter
1.
2.
Enable Button— This button turns the counter on and off. If it is on, then it further controls whether the
counter is used as the event trigger source or not. As a result, every time it is pressed it will toggle among
three different states:
●
Unused — The counter will not count, and is ignored by Shark.
●
Counter — The counter counts the event selected using the Event List menu. Its contents will be
recorded every time that Shark takes a sample.
●
Trigger — The counter is enabled as the sampling trigger. Whenever it has counted the number of
events listed in the Sample Interval box, it will cause Shark to record another sample. Only one counter
at a time can be in this mode; you must switch any previous counter to use one of the other two
modes before it is possible to select this mode with a second counter. Also, note that this mode is
not available on the counters in all types of Macintosh hardware (particularly older processors and
North bridges).
Event List— This list displays the names of all events that can be counted by this counter. It may also
include some “reserved” event types that can be chosen, but are not actually implemented on the hardware
in any useful way. For most types of hardware, these lists are constant. However, in the case of the PowerPC
970, the event lists can change depending upon the settings of the other controls in the tab. See PPC 970
(G5) Performance Counter Event List (page 282) for more details.
Retired Document | 2012-07-23 | Copyright © 2012 Apple Inc. All Rights Reserved.
206
Hardware Counter Configuration
Common Elements in Performance Counter Configuration Tabs
3.
Sample Interval— This is the number of events that must occur before this PMC will trigger sampling. It
is ignored unless this particular counter has been set to Trigger mode using the Enable Button . If a counter
cannot support Trigger mode, then this box will not be present.
Privilege Level Filtering
With the various performance counters, it is often possible to filter events such that only events from user-level
code or only events from privileged (supervisor mode) are counted. Shark disables this option if it is not
applicable to the currently selected sampling trigger.
●
Any — Record all performance counter events of this type.
●
User— Record performance counter events of this type only when running user-level code.
●
Supervisor— Record performance counter events of this type only when running supervisor-level code
in the OS kernel.
Process Marking
With the various performance counters, Shark can filter events such that only events from a user-defined
selection of “marked” processes are actually counted. In this way, you could limit counting to events from your
own application’s process, for example, while ignoring all others. Alternatively, a user may choose to record
events from all “unmarked” processes. This is a good choice when you want to tell Shark to ignore a few
processes — probably background ones like daemons or the Finder — while recording events from everything
else.
●
Any— Record all events, no matter when they occur
●
Marked— Record only events that occur in “marked” processes or threads that you have selected.
●
Unmarked— Record only events that occur in “unmarked” processes or threads.
Retired Document | 2012-07-23 | Copyright © 2012 Apple Inc. All Rights Reserved.
207
Hardware Counter Configuration
MacOS X OS-Level Counters Configuration
You can mark processes with Shark’s Process Marker (Figure 8-3). The Process Marker can be opened via the
Sampling Mark Process menu item. Shark disables this menu item for timer sampling, because the marked bit
is ignored in that case.
Figure 8-3
Process Marker
It is also possible to enable thread marking programmatically, using the chudMarkPID(pid_t pid, int
markflag) call (in the CHUD framework) to set the marked flag to a value of TRUE (markflag = 1) or FALSE
(markflag = 0) for any arbitrary process.
While this mechanism is powerful, it does have some limitations imposed on it by how the OS internally tracks
the “marked” state of each thread. New threads created by a process after you have marked it will not be
marked; you will need to mark the process again to make sure all of the newly created threads are marked. In
addition, the marked bit is not copied to supervisor space during system calls or other supervisor state code
done on behalf of the marked process, so if you choose to record “marked” events only you will only see events
triggered by your user-level code.
MacOS X OS-Level Counters Configuration
This tab, illustrated in Figure 8-4, is always the rightmost tab in the editor. It provides access to a variety of
counters for operating system events, such as page faults. These OS counters support trigger mode, privilege
level filtering, and marked thread filtering on all Macintosh platforms. However, all OS performance counters
must share the same settings for privilege level and marked thread filtering. The events counted by the operating
system’s counters can be divided into the following categories:
●
Virtual Memory: Events such as page faults, zero fill faults, copy-on-write faults, and page cache hits
●
System Calls: Transfers into the kernel requested by user code, divided up into BSD and Mach syscalls
Retired Document | 2012-07-23 | Copyright © 2012 Apple Inc. All Rights Reserved.
208
Hardware Counter Configuration
Intel CPU Performance Counter Configuration
●
Scheduler Events: Events such as context switches, “thread ready” events, and stack handoffs
●
Disk I/O Events: Disk reads and writes, with optional breakdown by type (data, disk control metadata, VM
page-in, and VM page-out) and timing (synchronous and asynchronous)
No unique controls are needed to control these counters; for information on all of the controls, see Counter
Control (page 206).
Figure 8-4
MacOS X Performance Counters Configuration
Intel CPU Performance Counter Configuration
This section describes how you can make custom configurations for Macs equipped with Intel processors. Macs
equipped with Intel Core processors have access to two fully programmable performance counters, and Macs
equipped with Intel Core 2 processors have an additional three fixed-purpose counters. The two families can
Retired Document | 2012-07-23 | Copyright © 2012 Apple Inc. All Rights Reserved.
209
Hardware Counter Configuration
Intel CPU Performance Counter Configuration
both count a similar but not identical list of events on the programmable processors. Full event listings are
provided in Intel Core Performance Counter Event List (page 246) and Intel Core 2 Performance Counter Event
List (page 252) for the Core and Core 2, respectively.
Figure 8-5 shows the single configuration tab for the Intel Core 2 processor (the one for the Core is virtually
identical, but lacks PMCs 3–5). For the most part, it uses the standard controls from Counter Control (page 206).
A nice feature of these cores is that control over user/supervisor event counting selection is provided
independently for each counter on these cores. On the other hand, “marked” threads and processes cannot
be used.
One unique control is necessary with these cores: the Event Mask Bits control. This control, which is used more
extensively in the Core 2 than in the Core processor, acts to fine-tune the type of events counted. For example,
instead of just counting all line fetches from the L2 cache, you can use these bits to only count line fetches of
lines in particular states (such as “exclusive,” or only in this L2 cache). The selection of bits available and their
behavior varies depending upon the type of event being counted. The description of the effect that mask bits
will have on the event counting is described in a tooltip both on the event name, as you are choosing among
the various event types, and also in a tooltip that appears if you wave your mouse cursor over each of the
Retired Document | 2012-07-23 | Copyright © 2012 Apple Inc. All Rights Reserved.
210
Hardware Counter Configuration
PowerPC G3/G4/G4+ CPU Performance Counter Configuration
bit-names in the mask list. Any bit in the list labeled *Reserved* should not be enabled. A brief summary of
which bits are active for any particular event is included in the event lists in Intel Core Performance Counter
Event List (page 246) and Intel Core 2 Performance Counter Event List (page 252).
Figure 8-5
Intel Core 2 Configuration Tab
PowerPC G3/G4/G4+ CPU Performance Counter Configuration
This section describes how you can make custom configurations for Macs equipped with PowerPC G3, G4, and
G4+ processors. Macs equipped with these processors have access to four (G3, G4) or six (G4+) fully
programmable performance counters. The list of available events varies significantly from processor to processor,
since many new event types were added with each generation of PowerPC chips. Full event listings are provided
in PPC 750 (G3) Performance Counter Event List (page 263), PPC 7400 (G4) Performance Counter Event List (page
265), and PPC 7450 (G4+) Performance Counter Event List (page 271) for the G3, G4, and G4+ processor cores,
respectively.
Retired Document | 2012-07-23 | Copyright © 2012 Apple Inc. All Rights Reserved.
211
Hardware Counter Configuration
PowerPC G3/G4/G4+ CPU Performance Counter Configuration
Figure 8-6 shows the single configuration tab for the G4+ processor (the one for the G3 and G4 is virtually
identical, but lacks PMCs 5–6). For the most part, it uses the standard controls from Counter Control (page 206).
Both user/supervisor event counting selection and “marked” threads and processes can be used, but all counters
must use the same settings at once.
Three relatively minor additional controls are provided with all of these cores, to adjust features specific to
these processors. The three controls are numbered on Figure 8-6, and are:
1.
Threshold: This sets a lower limit on the number of processor cycles that a wide variety of stall events
must take before they are actually recorded, in case you want to filter out short stalls and thereby focus
in only on the most lengthy and problematic stalls.
2.
TB Select: This is the divider used for timebase events that cause processor exceptions, and selects from
four different division ratios.
3.
Branch Folding: PowerPC G3 and G4 CPUs have a feature that allows them to coalesce multiple branch
instructions into one instruction, instead of issuing multiple branch instructions. When this feature is
enabled (the default) performance events counting branch instructions and predictions can be inaccurate.
Hence, for best results when counting performance events dealing with branch instructions, you should
usually disable this feature. See your processor’s User Manual for more details.
Retired Document | 2012-07-23 | Copyright © 2012 Apple Inc. All Rights Reserved.
212
Hardware Counter Configuration
PowerPC G5 (970) Performance Counter Configuration
Warning: If you leave branch folding disabled and exit Shark, branch folding will remain disabled. While
this will not cause any correctness problems or crashes, it can adversely affect performance.
Figure 8-6
PowerPC G4+ Configuration Tab (G3 and G4 are similar)
PowerPC G5 (970) Performance Counter Configuration
This section describes how you can make custom configurations for Macs equipped with PowerPC G5 (970)
processors. Macs equipped with these processors have access to eight fully programmable performance
counters that can count an incredible number of different performance events, as listed in PPC 970 (G5)
Performance Counter Event List (page 282). Because there are so many different types of events, the G5 uses
a unique system of multiplexers to pre-filter many types of events before they reach the event counters.
Depending upon the settings supplied for these various multiplexers, it is possible to enable vastly different
selections of events in the performance counter event menus.
Figure 8-7 shows the first of two configuration tabs used by the G5 processor’s configuration control. The top
half and lower left corner just use standard controls from Counter Control (page 206). Both user/supervisor
event counting selection and “marked” threads and processes can be used, but all counters must use the same
settings at once.
Retired Document | 2012-07-23 | Copyright © 2012 Apple Inc. All Rights Reserved.
213
Hardware Counter Configuration
PowerPC G5 (970) Performance Counter Configuration
In addition, several additional controls are provided. Most are multiplexer controls to switch the various event
pre-filtering multiplexers, but the last two adjust features specific to these processors. These controls are
numbered on Figure 8-7, and are:
1.
TTM0 Event Selector: This first-stage mux selects collections of events from different processor functional
units for all four second-stage muxes (FPU = floating point unit, ISU = instruction sequencer unit, IFU =
instruction fetch unit, and VMX = Altivec processing unit).
2.
TTM1 Event Selector: This first-stage mux selects collections of events from different processor functional
units for all four second-stage muxes (IDU = instruction dispatch unit, ISU = instruction sequencer unit,
and GPS = storage subsystem).
3.
TTM3 Event Selector: This stage 1 mux selects collections of events from load/store unit #1 (LSU1), in four
different patterns for second-stage muxes 2 and 3 only (2/3 = lane 2 & 3 both “upper” LSU1 events, 2/7 =
lane 2 “upper” & 3 “lower” LSU1 events, 6/3 = lane 2 “lower” & 3 “upper” LSU1 events, 6/7 = lane 2 & 3
both “lower” LSU1 events).
4.
Even Lane Event Selectors: These two second-stage muxes select inputs for performance counters 1, 2,
5, and 6 from among the different first-stage muxes or directly from the load/store units (LSU0/LSU1).
5.
Odd Lane Event Selectors: These two second-stage muxes select inputs for performance counters 3, 4,
7, and 8 from among the different first-stage muxes or directly from the load/store units (LSU0/LSU1).
6.
Speculative Event Selector: This enables speculative event recording and performance counters 5 and/or
7. A full discussion of these counts is beyond the scope of this document. See the PowerPC 970 Documentation for more information.
7.
Threshold: This sets a lower limit on the number of processor cycles that a wide variety of stall events
must take before they are actually recorded, in case you want to filter out short stalls and thereby focus
in only on the most lengthy and problematic stalls.
Retired Document | 2012-07-23 | Copyright © 2012 Apple Inc. All Rights Reserved.
214
Hardware Counter Configuration
PowerPC G5 (970) Performance Counter Configuration
8.
TB Select: This is the divider used for timebase events that cause processor exceptions, and selects from
four different division ratios. More information is available in the PowerPC 970 Documentation.
Figure 8-7
PowerPC 970 Processor Performance Counters Configuration
Figure 8-8 shows the second tab used to configure the PowerPC 970 performance counters, the IMC tab. This
tab provides access to the Instruction Fetch Unit's instruction marking and the Instruction Dispatch Unit’s
instruction sampling feature, a pair of mechanisms that allow you to count individual instruction types as they
are executed on the PowerPC 970.
The IFU instruction matching facility provides a CAM array to match PowerPC instructions by opcode or extended
opcode as they are fetched. When a PowerPC instruction is fetched from memory, the IFU instruction matching
facility compares the instruction with the opcode/extended opcode mask values in each of its CAM array rows.
If a PowerPC instruction matches one or more IMC array row masks, you may have it “mark” the instruction in
the L1 instruction cache. Thereafter, every time it is executed special performance counter events may occur
Retired Document | 2012-07-23 | Copyright © 2012 Apple Inc. All Rights Reserved.
215
Hardware Counter Configuration
PowerPC G5 (970) Performance Counter Configuration
to count it. Please note that as long as an instruction resides in the L1 instruction cache, its match bit will
remain unchanged. Hence, if the match condition for an instruction changes, then the L1 instruction cache
should be flushed to force the lines to be reloaded and the “match” bits to be recalculated.
Another level of instruction matching — performed in the IDU — allows you to mark instructions (or their
constituent microinstructions, for the more complex PowerPC instructions) on the basis of some categories
related to how they interact with the PowerPC 970 pipeline, such as whether or not they are internally broken
up into microcode. Because this comes later in the processor’s pipeline, it is possible that it can override previous
IFU marking.
Retired Document | 2012-07-23 | Copyright © 2012 Apple Inc. All Rights Reserved.
216
Hardware Counter Configuration
PowerPC G5 (970) Performance Counter Configuration
Due to the very flexible and complex nature of these mechanisms, it is highly recommended that you read the
pertinent sections of the PowerPC 970 Documentation, Sections 10.9 and 10.10 in the main user’s manual.
Figure 8-8
PowerPC 970 IMC (IFU) Configuration Tab
In the top part of the IMC pane are some general controls (black numbers on white):
1.
Instruction Matching— This selects the type of instruction matching to setup and use.
●
None – (default) No instruction matching will take place
●
IFU – Use the Instruction Fetch Unit’s IMC capability.
●
IDU – Use the Instruction Dispatch Unit’s sampling capability.
Retired Document | 2012-07-23 | Copyright © 2012 Apple Inc. All Rights Reserved.
217
Hardware Counter Configuration
PowerPC G5 (970) Performance Counter Configuration
2.
IOP Marking – This pre-filter will limit the type of internal PowerPC microinstructions (IOPs) that are
matched or sampled.
●
All IOPs – (default) Any IOP will pass
●
µCode IOPs –Only IOPs resulting from microcode expansion will pass.
●
One Per Inst – Only pass one IOP per PowerPC instruction.
●
1st IOP of ld/st – Only pass the first IOP to go to an LSU for every PowerPC load/store instruction, a
less restrictive form of the previous filter.
Below that, a variety of controls (white numbers on black) operate on either the IFU’s instruction matching or
IDU’s sampling. In Figure 8-8, the IFU instruction matching pane is shown:
1.
IMC Row PopUp— There are six CAM rows that can be configured to match instructions in the IFU. Use
this to select one of the six rows to manage.
2.
IMC Row Enable— Enable and disable the IMC rows with this check box.
3.
IMC Match None/All Buttons— Flips the configuration bits to match no PowerPC or all PowerPC instructions
with a single button press. If you only want to match a small number of instructions, start with “none” and
enable the instructions you want, while if you want to match many then start with “all” and knock off ones
you don’t need.
4.
MSR Configuration Bits— Selects instructions to match on the basis of a few large and coarse
categorizations about when they may execute (matching specific bits in the machine status register, or
MSR). In general, you will want to leave these set to “any” (asterisk), but you may optionally narrow down
the possible list by setting these to 0 or 1.
●
TA — (Target) Leave this set to “any” (asterisk), since it is ignored in all cases.
●
PR — (Privilege) Matches instructions on the basis of their privilege requirements.
●
●
●
0 — Matches only instructions executable in both user and supervisor mode.
●
1 — Matches only privileged instructions executable in supervisor mode only.
FP — (Floating Point Unit Availablity) This matches instructions on the basis of whether or not they
need and FPU to be present.
●
0 — Matches only non-FPU instructions.
●
1 — Matches only FPU instructions..
VMX — (Vector Unit Availability) This matches instructions on the basis of whether or not they need
an Altivec vector unit to be present.
●
0 — Matches only non-Altivec unit instructions..
●
1 — Matches only Altivec unit instructions.
Retired Document | 2012-07-23 | Copyright © 2012 Apple Inc. All Rights Reserved.
218
Hardware Counter Configuration
PowerPC G5 (970) Performance Counter Configuration
5.
6.
7.
Major Opcode Bits— This allows you to select marked instructions on the basis of their six major opcode
bits (bits 0–5 of each PowerPC instruction). There is a column for each bit, and you can individually control
matching on the basis of each bit.
●
X — (default) Ignore the bit
●
0 — Only match if this bit is a zero
●
1 — Only match if this bit is a one
●
* (any) — Match any state.
Minor Opcode Bits— This allows you to select marked instructions on the basis of their eleven minor
opcode bits (bits 21–30 of each PowerPC instruction). There is a column for each bit, and you can individually
control matching on the basis of each bit. Note that you should only use these for major opcodes 4 (Altivec
instructions), 19 (branch unit operations), 31 (integer instructions), 59 (FP instructions), and 63 (FP
instructions); these bits are not used as part of the opcode by other types of instructions.
●
X — (default) Ignore the bit
●
0 — Only match if this bit is a zero
●
1 — Only match if this bit is a one
●
* (any) — Match any state.
Instruction Table— This allows you to see which instructions are actually being matched on the basis of
your various settings.
●
Mnemonic column — This lists the assembly language mnemonic for an instruction.
●
Major opcode column — This shows the actual major opcode for the instruction.
●
Minor opcode column — This shows the actual minor opcode for the instruction, or zero for instructions
that do not use the minor opcode.
●
Match Rows column — This shows which row(s) in the IMC are the cause of any match(es), so you can
see which ones need to be turned on or off as a result.
8.
All Rows— If checked, the Instruction Table shows instructions that are matched by any of the IMC rows,
all combined together. This is usually the most useful view since it shows all instructions that will be
marked. Otherwise, only instructions that match the row currently selected in the IMC Row PopUp are
displayed.
9.
All Instructions— If checked, the Instruction Table shows non-selected instructions in a grayed-out form.
Otherwise, they are completely omitted from the table.
Finally, in Figure 8-9, the IDU instruction filtering pane is shown:
1.
Microinstruction Table— This allows you to see which classes of instructions are actually being matched
on the basis of your various settings.
Retired Document | 2012-07-23 | Copyright © 2012 Apple Inc. All Rights Reserved.
219
Hardware Counter Configuration
PowerPC G5 (970) Performance Counter Configuration
2.
3.
●
BSFL column — This lists the BSFL (Branch instruction, instruction that will be Split, First instruction
in a dispatch group, and Last instruction in a dispatch group) bits associated with every instruction
in the L1 cache.
●
Classification column — This gives the name of every microinstruction class.
IMRMASK bits— These bits mask off an instruction’s BSFL bits before matching.
●
0 — AND this bit position with 0, requiring an IMRMATCH of 0 here.
●
1 — AND this bit position with 1, enabling full matching with the IMRMATCH bits here.
IMRMATCH bits— These bits select the value to match for any corresponding IMRMASK bits set to 1.
●
0 — Match this bit position with 0. Note that this must be 0 for any IMRMASK bit positions that equal
0, or no matches will ever occur.
Retired Document | 2012-07-23 | Copyright © 2012 Apple Inc. All Rights Reserved.
220
Hardware Counter Configuration
PowerPC North Bridge Counter Configuration
●
1 — Match this bit position with 1. Normally only desired if the corresponding IMRMASK bit is 1, or if
you want to intentionally match nothing.
Figure 8-9
PowerPC 970 IMC (IDU) Configuration Tab
PowerPC North Bridge Counter Configuration
This section describes how you can make custom configurations to examine counters in some of the North
Bridge (memory interface) chips of Macs equipped with PowerPC processors, using the “Advanced” configuration
interface. Because some of the “useful” options for these counters require fairly complex combinations of
Retired Document | 2012-07-23 | Copyright © 2012 Apple Inc. All Rights Reserved.
221
Hardware Counter Configuration
PowerPC North Bridge Counter Configuration
settings, we strongly suggest that you start using the “Simple” settings at first, as described in Simple Timed
Samples and Counters Config Editor (page 186), at least until you learn which combinations of settings are best
at producing useful information.
Memory controller counters are available on PowerPC machines with UniNorth v1.5 and later memory controllers.
Unfortunately, no equivalent exists for Intel processors. These counters do not support event-triggered interrupts
(PMI, or “trigger” mode), privilege level filtering, or marked thread/process filtering. However, on most of the
chips they do support filtering on the basis of which interface generated the performance event (see the
description of each chipset for details).
U1.5/U2 North Bridges
This section describes how you can make custom configurations for Macs equipped with the U1.5/U2 North
bridge chipset used in some PowerPC G4 Macs. Macs equipped with these North bridge chipsets have access
to four fully programmable performance counters that can record various memory system event types, as
listed in UniNorth-2 (U1.5/2) Performance Counter Event List (page 316).
Figure 8-10 shows the configuration tab for the U1.5/2’s configuration control. All controls for each of the PMC
are just standard controls from Counter Control (page 206), except for the Event Sources checkboxes along the
bottom. These allow filtering of events based on which North bridge interface is involved. These sources are
chosen via checkbox, so you can selectively look at events from all sources or only a specific subset of sources
that you choose. You may choose to enable or disable events from any of the following interfaces:
1.
CPU1–CPU2 — Processor interface(s)
2.
AGP — The AGP interface
3.
PCI — The PCI interface
Retired Document | 2012-07-23 | Copyright © 2012 Apple Inc. All Rights Reserved.
222
Hardware Counter Configuration
PowerPC North Bridge Counter Configuration
4.
FireWire/Enet — The dedicated FireWire and Ethernet I/O ports
Figure 8-10
U1.5/U2 Configuration Tab
U3 North Bridge
This section describes how you can make custom configurations for Macs equipped with the U3 North bridge
chipset used in some PowerPC G5 Macs. Macs equipped with these North bridge chipsets have access to two
sets of six fully programmable performance counters, on both the memory interface controller and the Apple
processor interface (API) controller. These can count a wide variety of different event types, as listed in UniNorth-3
(U3) Performance Counter Event List (page 319), and also filter events on the basis of their source interface and
type of access.
Figure 8-11 shows the first of two configuration tabs used by the U3’s configuration control, the memory
interface configuration panel. The first line of each PMC’s controls are just standard controls from Counter
Control (page 206). Below this are four custom controls that may be set independently for each of the different
PMCs:
1.
Access PopUp— This popup menu lets you restrict the event counting to only certain types of memory
accesses, either reads or writes.
a.
None — Disables the counter.
Retired Document | 2012-07-23 | Copyright © 2012 Apple Inc. All Rights Reserved.
223
Hardware Counter Configuration
PowerPC North Bridge Counter Configuration
b.
Write — Only store requests to memory can increment the counter.
c.
Read — Only load requests from memory can increment the counter.
d.
Any — All memory requests cause a counter increment, read or write.
2.
Divider PopUp— Because U3 PMCs are 32-bit, you may overflow a counter if you are counting
high-frequency events or are counting continuously for a long time. You can use this popup to set up a
division factor that will slow the rate of incoming events by a fixed power of 2 in order to make it more
difficult to overflow the main counter. Choices of every even power of 2 from 1 (no division) to 128
(effectively adds 7 bits to the counter) are available using this menu.
3.
Page State— U3’s events involving DRAM access can be filtered on the basis of the current SDRAM page
state for the accessed DIMM. This allows you to monitor the effectiveness of different memory paging
policies, such as how long to keep a page open before closing it.
4.
a.
Open Hit — DRAM access events are counted if they hit on an open page in the addressed DIMM. This
is the most desirable case, and will generate the minimum latency because the data can be returned
immediately from the DRAM’s page cache.
b.
Open Miss — DRAM access events are counted if they miss on a currently open page in the addressed
DIMM. This is the least desirable case, because it will generate the maximum latency when the old
DRAM page is closed and then the new one is opened before data can be returned.
c.
Closed — DRAM access events are counted if the addressed DIMM does not have an open page. This
is an intermediate case, because while a new page must be opened before data can be returned, at
least we do not have to wait for a previously-accessed page to be closed first.
Source Filter— Events can be filtered before they reach U3’s PMCs on the basis of the interface where
they originate. These sources are chosen via checkbox, so you can selectively look at events from all sources
or only a specific subset of sources that you choose. You may choose to enable or disable events from any
of the following interfaces:
a.
CPU1–CPU4 — Processor interface(s)
b.
HT — The Hypertransport interface
c.
CV , NCV — Obsolete interfaces, do not use
d.
PCI — The PCI interface
Retired Document | 2012-07-23 | Copyright © 2012 Apple Inc. All Rights Reserved.
224
Hardware Counter Configuration
PowerPC North Bridge Counter Configuration
e.
AGP — The AGP interface
Figure 8-11
U3 Memory Configuration Tab
Figure 8-12 shows the second of U3’s two configuration tabs, the API configuration panel. As with the memory
tab, the first line of each PMC’s controls are just standard controls from Counter Control (page 206). Below this
is a pair of custom controls that may be set independently for each of the different PMCs:
1.
Source PopUp— The API controller chip has 51 different selectable event sources, mostly different types
of request queues within the chip. You must select one of these sources in order to count its events. To
count events from multiple sources simultaneously, you will have to use different PMCs for each source.
A full list of these sources is listed in UniNorth-3 (U3) Performance Counter Event List (page 319).
Retired Document | 2012-07-23 | Copyright © 2012 Apple Inc. All Rights Reserved.
225
Hardware Counter Configuration
PowerPC North Bridge Counter Configuration
2.
Divider PopUp— This is the same as the Divider PopUp on the memory tab.
Figure 8-12
U3 API Configuration Tab
U4 (Kodiak) North Bridge
This section describes how you can make custom configurations for Macs equipped with the U4 (Kodiak) North
bridge chipset used in some PowerPC G5 Macs. Macs equipped with these North bridge chipsets have access
to two sets of six fully programmable performance counters, on both the memory interface controller and the
Apple processor interface (API) controller. These can count a wide variety of different event types, as listed in
Kodiak (U4) Performance Counter Event List (page 323), and also filter events on the basis of their source
interface and type of access.
Figure 8-13 shows the first of two configuration tabs used by the U4’s configuration control, the memory
interface configuration panel. The first line of each PMC’s controls are just standard controls from Counter
Control (page 206). Below this are three custom controls that may be set independently for each of the different
PMCs:
1.
Access PopUp— This popup menu lets you restrict the event counting to only certain types of memory
accesses, either reads or writes.
a.
None — Disables the counter.
Retired Document | 2012-07-23 | Copyright © 2012 Apple Inc. All Rights Reserved.
226
Hardware Counter Configuration
PowerPC North Bridge Counter Configuration
b.
Write — Only store requests to memory can increment the counter.
c.
Read — Only load requests from memory can increment the counter.
d.
Any — All memory requests cause a counter increment, read or write.
2.
Divider PopUp— Because Kodiak PMCs are 32-bit, you may overflow a counter if you are counting
high-frequency events or are counting continuously for a long time. You can use this popup to set up a
division factor that will slow the rate of incoming events by a fixed power of 2 in order to make it more
difficult to overflow the main counter. Choices of every even power of 2 from 1 (no division) to 128
(effectively adds 7 bits to the counter) are available using this menu.
3.
Source Filter— Events can be filtered before they reach Kodiak’s PMCs on the basis of the interface where
they originate. These sources are chosen via checkbox, so you can selectively look at events from all sources
or only a specific subset of sources that you choose. You may choose to enable or disable events from any
of the following interfaces:
a.
CPU1–CPU4 — Processor interface(s)
b.
HT — The Hypertransport interface
c.
CPCIE — The PCIE interface (for coherent requests)
d.
NCPCIE — The PCIE interface (for non-coherent requests)
Figure 8-13
U4 (Kodiak) Memory Configuration Tab
Retired Document | 2012-07-23 | Copyright © 2012 Apple Inc. All Rights Reserved.
227
Hardware Counter Configuration
PowerPC North Bridge Counter Configuration
Figure 8-14 shows the second of U4’s two configuration tabs, the API configuration panel. As with the memory
tab, the first line of each PMC’s controls are just standard controls from Counter Control (page 206). Below this
are four custom controls that may be set independently for each of the different PMCs:
1.
Source PopUp— The API controller chip has 33 different selectable event sources, mostly different types
of request queues within the chip. You must select one of these sources in order to count its events. To
count events from multiple sources simultaneously, you will have to use different PMCs for each source.
A full list of these sources is listed in Kodiak (U4) Performance Counter Event List (page 323).
2.
Access PopUp— This is the same as the Access PopUp on the memory tab.
3.
Divider PopUp— This is the same as the Divider PopUp on the memory tab.
4.
Source Filter— This is the same as the filter on the memory tab, except that all PCIE events are grouped
together into a single source, whether or not they are coherent.
Figure 8-14
U4 (Kodiak) API Configuration Tab
Retired Document | 2012-07-23 | Copyright © 2012 Apple Inc. All Rights Reserved.
228
Hardware Counter Configuration
ARM11 CPU Performance Counter Configuration
ARM11 CPU Performance Counter Configuration
This section describes how you can make custom configurations for iOS devices with ARM11 processors. These
devices have two identical, fully programmable performance counters plus one counter (#1) that can record
cycle counts only. Full event listings are provided in ARM11 Performance Counter Event List (page 327).
Figure 8-15 shows the configuration tab for the ARM11 processor. It just uses three sets of the standard PMC
controls from Counter Control (page 206), although each PMC also includes a “help” field that describes what
the currently-selected counter actually counts with some additional text.
Important: Currently, while you can make custom ARM counter configurations with Shark, there is no way
to load customized configuration files onto your iOS device using the iOS SDK. This restriction may be
relaxed in future versions of the SDK. In the meantime, send suggestions for useful configurations to
[email protected] and we may include them in future iOS SDK releases.
Figure 8-15
ARM11 Counter Configuration Tab
Retired Document | 2012-07-23 | Copyright © 2012 Apple Inc. All Rights Reserved.
229
Command Reference
Menu Reference
This section summarizes Shark’s commands, arranged by menu.
Shark
This menu contains the usual application-menu commands.
Command
Shortcut
About Shark...
Description
Where Described
See revision information for Shark.
Preferences...
Cmd-,
Edit some global Shark parameters.
Hide Shark
Cmd-H
Hides Shark's window(s) and switches to the
next-frontmost application.
Hide Others
Opt-Cmd-H
Hides all other applications' windows.
Show All
Quit Shark
Shark
Preferences (page
24)
Restores all windows hidden with the
previous two commands.
Cmd-Q
Quits Shark.
File
This menu contains commands that control the processing of Shark’s session files. Most are fairly standard File
operations, but there are a few commands here that are unique to Shark and described further in the sections
noted below.
Command
Shortcut
Description
Open
Cmd-O
Open a saved session.
Open Recent
Where Described
Contains a list of recently used saved
sessions — choose one to open it.
Retired Document | 2012-07-23 | Copyright © 2012 Apple Inc. All Rights Reserved.
230
Command Reference
Menu Reference
Command
Shortcut
Description
Close
Cmd-W
Close the frontmost window. If the
frontmost window is the main control
window, this will quit Shark.
Close All
Opt-Cmd-W
Close all session windows.
Save
Cmd-S
Save the frontmost session.
Session Files (page
21)
Save As...
Shift-Cmd-S
Save the frontmost session to a new
location.
Session Files (page
21)
Attach a copy of the frontmost session
to a new email in your default email
program.
Session Files (page
21)
Mail This
Session
Where Described
Compare...
Opt-Cmd-C
Compare two saved sessions.
Comparing
Sessions (page 150)
Merge...
Opt-Cmd-M
Merge two saved sessions.
Merging
Sessions (page 151)
Get Info
Cmd-I
Opens the Info sheet for the frontmost
session.
Session Information
Sheet (page 22)
Symbolicate...
Opt-Cmd-S
Add symbols to the frontmost session
from a symbol-rich copy of the target
application on disk.
Manual Session
Symbolication (page
146)
Generate
Report...
Cmd-J
Create a plain text summary of
highlights from the frontmost session.
Session Report (page
23)
Page Setup...
Shift-Cmd-P
Configure printers and print settings.
Print...
Cmd-P
Print the frontmost window.
Edit
All items in this menu are standard text editing items. They work generally as expected when you are editing
or examining text in Shark, and the cut/copy/paste commands will also work with some higher-level objects.
Command
Shortcut
Description
Undo
Cmd-Z
Undo the previous action.
Retired Document | 2012-07-23 | Copyright © 2012 Apple Inc. All Rights Reserved.
231
Command Reference
Menu Reference
Command
Shortcut
Description
Redo
Shift-Cmd-Z
Redo the next action.
Cut
Cmd-X
Cut the selected text, placing it on the clipboard.
Copy
Cmd-C
Copy the selected text to the clipboard.
Paste
Cmd-V
Paste the contents of the clipboard.
Paste and Match Style
Opt-Shift-Cmd-V
Paste the contents of the clipboard using the same
style as existing text.
Select All
Cmd-A
Select all of whatever was most recently selected
(samples, text, etc.).
Find...
Cmd-F
Open the Find text window.
Find Next
Cmd-G
Find the next occurrence of the text search pattern.
Find Previous
Shift-Cmd-G
Find the previous occurrence of the text search
pattern.
Show Spelling and
Grammar
Cmd-:
Open the Spelling and Grammar palette.
Check Spelling
Cmd-;
Check the spelling within the current text field,
opening the Spelling and Grammar palette to
highlight suspected errors.
Find
Spelling
Check Spelling while
Typing
If ticked, spelling is checked as it is typed. Suspected
errors are underlined.
Speech
Start Speaking
Start speaking the selected text, if any, or else the
contents of the current text field.
Stop Speaking
Stop speaking.
Special Characters...
Opt-Cmd-T
Open the character palette, to access special
characters and symbols.
Retired Document | 2012-07-23 | Copyright © 2012 Apple Inc. All Rights Reserved.
232
Command Reference
Menu Reference
Format
All items in this menu are standard text processing commands. Since it is generally not possible to apply custom
formats to most text within Shark, this menu is seldom used.
Command
Shortcut
Description
Show Fonts
Cmd-T
Show the Font palette.
Bold
Cmd-B
Toggle the bold attribute of the selected text.
Font
Italic
Toggle the italic attribute of the selected text.
Underline
Cmd-U
Toggle the underline attribute of the selected text.
Bigger
Cmd-+
Increase the font size of the selected text.
Smaller
Cmd--
Decrease the font size of the selected text.
Show Colors
Show the color picker palette.
Copy Style
Copy the style of the selected text to the clipboard.
Paste Style
Opt-Cmd-V
Apply the style information on the clipboard to the selected text.
Align Left
Cmd-{
Align the current line or selected text to the left margin.
Center
Cmd-|
Center the current line or selected text.
Text
Justify
Align Right
Align the current line or selected text justified across the page.
Cmd-}
Show Ruler
Align the current line or selected text to the right margin.
Show the ruler and text editing tools for the current text view.
Copy Ruler
Ctrl-Cmd-C
Copy the current ruler configuration to the clipboard.
Paste Ruler
Ctrl-Cmd-V
Paste the current ruler configuration from the clipboard.
Config
This menu contains commands that allow you to adjust Shark’s built-in configurations to match your needs.
These are described further in Custom Configurations (page 183) and Hardware Counter Configuration (page
202), in the sections noted below.
Retired Document | 2012-07-23 | Copyright © 2012 Apple Inc. All Rights Reserved.
233
Command Reference
Menu Reference
Command
Shortcut
Description
Where Described
Show/Hide
Mini Config
Editor
Shift-Cmd-C
Show/Hide the mini config
editor attached to the main
control window.
Mini Configuration
Editors (page 19)
Edit...
Opt-Shift-Cmd-C
Edit the current configuration.
The Config Editor (page
184)
New...
Cmd-N
Create a new configuration.
The Config Editor (page
184)
Export...
Export the current
configuration to a file.
The Config Editor (page
184)
Import...
Import a configuration from a
file.
The Config Editor (page
184)
Sampling
This menu contains commands that modify when Shark starts and stops profiling and tracing operations. These
are described further in Advanced Profiling Control (page 122), in the sections noted below.
Command
Shortcut
Description
Where Described
Programmatic
(Remote)
Shift-Cmd-R
Causes Shark to listen for
programmatic start/stop commands.
It will then take sessions using the
currently selected configuration.
Interprocess Remote
Control (page 134)
Unresponsive
Applications
Shift-Cmd-A
Using the currently selected
configuration, Shark automatically
profiles all applications which
become unresponsive. Automatically
activates Batch Mode when used.
Unresponsive
Application
Measurements (page
128)
Batch Mode
Shift-Cmd-B
Toggles Batch mode, allowing the
recording of multiple sessions before
analysis begins. Automatically
enabled when Unresponsive
Applications is ticked.
Batch Mode (page
125)
Retired Document | 2012-07-23 | Copyright © 2012 Apple Inc. All Rights Reserved.
234
Command Reference
Menu Reference
Command
Shortcut
Description
Where Described
Network/iPhone
Profiling...
Shift-Cmd-N
Enable Network Profiling of other
computers or iPhones, instead of local
profiling, or share this computer for
others to profile.
Network/iPhone
Profiling (page 138)
Data Mining
This menu, which disappears when data mining is not possible, provides access to Shark’s powerful symbol-level
data mining capabilities. These are described in more detail in Data Mining (page 151).
Command
Shortcut
Description
Charge Symbol to
Callers
Cmd-E
Add the cost of the selected symbol(s) to their caller(s),
and hide the selected symbol(s).
Charge Library to
Callers
Shift-Cmd-E
Add the cost of all calls to the selected library(ies) to
their caller(s), and hide the selected library(ies).
Flatten Library
Shift-Cmd-F
Just hide the selected library(ies), without adding time
to the callers.
Remove Callstacks with
Symbol
Cmd-K
Hide all callstacks which contain the selected
symbol(s).
Retain Callstacks with
Symbol
Shift-Cmd-K
Keep visible all callstacks which contain the selected
symbol(s). Callstacks retained in this way will not be
hidden even if they contain symbols that are used
with "Remove Callstacks with Symbol".
Restore All
Cmd-R
Show all symbols and libraries previously hidden by
"Charge Symbol to Callers", "Charge Library to Callers"
or "Remove Callstacks with Symbol", and restore
original costs for all symbols.
Focus Symbol
Cmd-Y
Hide all except the selected symbol(s).
Focus Library
Shift-Cmd-Y
Hide all except the selected library(ies).
Focus Callers of Symbol
Opt-Cmd-Y
Hide all except the caller(s) of the selected symbol(s).
Focus Callers of Library
Opt-Shift-Cmd-Y
Hide all except the caller(s) of the selected library(ies).
Unfocus All
Show all symbols and libraries previously hidden by
any of the Focus commands.
Retired Document | 2012-07-23 | Copyright © 2012 Apple Inc. All Rights Reserved.
235
Command Reference
Alphabetical Reference
Window
Along with standard window control functionality, this contains the command to show or hide the Advanced
Settings drawer on the right side of each session window, as described in Advanced Settings Drawer (page
23).
Command
Shortcut
Description
Minimize
Cmd-M
Minimise the frontmost window.
Minimize All
Minimise all Shark windows.
Zoom
Zoom the frontmost window.
Show Advanced Settings
Shift-Cmd-M
Bring All to Front
Toggle visibility of the advanced settings drawer of the
frontmost session.
Bring all Shark windows to the front.
Help
This menu provides access to Shark’s online documentation, which is what you are reading! It also provides
access to instruction reference manuals for PowerPC, 32-bit x86, and 64-bit x86 instructions, through the viewer
described in ISA Reference Window (page 54).
Command
Shortcut
Description
Shark Help
Cmd-?
Show the Shark User Guide (PDF).
PowerPC ISA Reference
Show the PowerPC Instruction Set Architecture Reference.
IA32 ISA Reference
Show the IA32 Instruction Set Architecture Reference.
EM64T ISA Reference
Show the EM64T Instruction Set Architecture Reference.
Acknowledgements
Show acknowledgements for open-source materials used in
Shark.
Alphabetical Reference
This section summarizes Shark’s unique commands, arranged alphabetically. Common text editing commands
have been omitted from this table.
Retired Document | 2012-07-23 | Copyright © 2012 Apple Inc. All Rights Reserved.
236
Command Reference
Alphabetical Reference
Command
Shortcut
Description
Where Described
Menu
Batch Mode
Shift-Cmd-B
Toggles Batch
mode, allowing
the recording of
multiple sessions
before analysis
begins.
Automatically
enabled when
Unresponsive
Applications is
ticked.
Batch Mode (page
125)
Sampling
Charge Library
to Callers
Shift-Cmd-E
Add the cost of all
calls to the
selected
library(ies) to
their caller(s), and
hide the selected
library(ies).
Data Mining (page
151)
Data
Mining
Charge Symbol
to Callers
Cmd-E
Add the cost of
the selected
symbol(s) to their
caller(s), and hide
the selected
symbol(s).
Data Mining (page
151)
Data
Mining
Compare...
Opt-Cmd-C
Compare two
saved sessions.
Comparing
Sessions (page 150)
File
Edit...
Opt-Shift-Cmd-C
Edit the current
configuration.
The Config
Editor (page 184)
Config
EM64T ISA
Reference
Show the EM64T
Instruction Set
Architecture
Reference.
ISA Reference
Window (page 54)
Help
Export...
Export the current
configuration to a
file.
The Config
Editor (page 184)
Config
Retired Document | 2012-07-23 | Copyright © 2012 Apple Inc. All Rights Reserved.
237
Command Reference
Alphabetical Reference
Command
Shortcut
Description
Where Described
Menu
Flatten Library
Shift-Cmd-F
Just hide the
selected
library(ies),
without adding
time to the
callers.
Data Mining (page
151)
Data
Mining
Focus Callers of
Library
Opt-Shift-Cmd-Y
Hide all except
the caller(s) of the
selected
library(ies).
Data Mining (page
151)
Data
Mining
Focus Callers of
Symbol
Opt-Cmd-Y
Hide all except
the caller(s) of the
selected
symbol(s).
Data Mining (page
151)
Data
Mining
Focus Library
Shift-Cmd-Y
Hide all except
the selected
library(ies).
Data Mining (page
151)
Data
Mining
Focus Symbol
Cmd-Y
Hide all except
the selected
symbol(s).
Data Mining (page
151)
Data
Mining
Generate
Report...
Cmd-J
Create a plain text
summary of
highlights from
the frontmost
session.
Session Report (page
23)
File
Get Info
Cmd-I
Opens the Info
sheet for the
frontmost session.
Session Information
Sheet (page 22)
File
IA32 ISA
Reference
Show the IA32
Instruction Set
Architecture
Reference.
ISA Reference
Window (page 54)
Help
Import...
Import a
configuration
from a file.
The Config
Editor (page 184)
Config
Retired Document | 2012-07-23 | Copyright © 2012 Apple Inc. All Rights Reserved.
238
Command Reference
Alphabetical Reference
Command
Shortcut
Mail This Session
Description
Where Described
Menu
Attach a copy of
the frontmost
session to a new
email in your
default email
program.
Session Files (page
21)
File
Merge...
Opt-Cmd-M
Merge two saved
sessions.
Merging
Sessions (page 151)
File
Network/iPhone
Profiling...
Shift-Cmd-N
Enable Network
Profiling of other
computers or
iPhones, instead
of local profiling,
or share this
computer for
others to profile.
Network/iPhone
Profiling (page 138)
Sampling
New...
Cmd-N
Create a new
configuration.
The Config
Editor (page 184)
Config
Show the
PowerPC
Instruction Set
Architecture
Reference.
ISA Reference
Window (page 54)
Help
PowerPC ISA
Reference
Preferences...
Cmd-,
Edit some global
Shark parameters.
Shark
Preferences (page
24)
Shark
Programmatic
(Remote)
Shift-Cmd-R
Causes Shark to
listen for
programmatic
start/stop
commands. It will
then take sessions
using the
currently selected
configuration.
Interprocess Remote
Control (page 134)
Sampling
Retired Document | 2012-07-23 | Copyright © 2012 Apple Inc. All Rights Reserved.
239
Command Reference
Alphabetical Reference
Command
Shortcut
Description
Where Described
Menu
Remove
Callstacks with
Symbol
Cmd-K
Hide all callstacks
which contain the
selected
symbol(s).
Data Mining (page
151)
Data
Mining
Restore All
Cmd-R
Show all symbols
and libraries
previously hidden
by "Charge
Symbol to
Callers", "Charge
Library to Callers"
or "Remove
Callstacks with
Symbol", and
restore original
costs for all
symbols.
Data Mining (page
151)
Data
Mining
Retain Callstacks
with Symbol
Shift-Cmd-K
Keep visible all
callstacks which
contain the
selected
symbol(s).
Callstacks
retained in this
way will not be
hidden even if
they contain
symbols that are
used with
"Remove
Callstacks with
Symbol".
Data Mining (page
151)
Data
Mining
Shark Help
Cmd-?
Show the Shark
User Guide (PDF).
Show Advanced
Settings
Shift-Cmd-M
Toggle visibility of
the advanced
settings drawer of
the frontmost
session.
Help
Advanced Settings
Drawer (page 23)
Retired Document | 2012-07-23 | Copyright © 2012 Apple Inc. All Rights Reserved.
240
Window
Command Reference
Alphabetical Reference
Command
Shortcut
Description
Where Described
Menu
Show/Hide Mini
Config Editor
Shift-Cmd-C
Show/Hide the
mini config editor
attached to the
main control
window.
Mini Configuration
Editors (page 19)
Config
Symbolicate...
Opt-Cmd-S
Add symbols to
the frontmost
session from a
symbol-rich copy
of the target
application on
disk.
Manual Session
Symbolication (page
146)
File
Show all symbols
and libraries
previously hidden
by any of the
Focus commands.
Data Mining (page
151)
Data
Mining
Unfocus All
Retired Document | 2012-07-23 | Copyright © 2012 Apple Inc. All Rights Reserved.
241
Miscellaneous Topics
Code Analysis with the G5 (PPC970) Model
Shark offers several features designed to help the programmer understand instruction execution behavior on
the G5 (PPC970). From the Advanced Settings drawer’s Assembly Browser tab, you can set the Assembly Browser
to display an estimate of G5 dispatch group formations, using the check box near item #1 in Figure B-1. After
this is checked, the assembly display around item #2 has dark lines added to indicate breaks between instruction
dispatch groups. If you look closely, you will see that all of Shark’s samples generally fall on the first or last
instructions of dispatch groups, due to the way program counters are captured by Shark on the G5 processor.
A key factor in optimizing performance on the G5 is maximizing dispatch group sizes. A detailed explanation
of G5 dispatch group formation rules is beyond the scope of this document, but Shark accurately models the
CPU behavior as much as possible using static analysis. See the PowerPC970 User Manual (see the PowerPC
970 documentation) for a complete description of dispatch groups.
Functional unit utilization and dispatch slot utilization are two more features that Shark offers to visualize G5
execution behavior. When the user selects Show G5 (PPC970) Details Drawer in the Advanced Settings drawer
(at #1 in Figure B-1), the user will see the G5 Resource Utilization drawer. The Functional Unit Utilization chart
and table (item #3) provide visual feedback to the programmer about how effectively instructions are spread
among the various functional units within the G5. Similarly, the number of dispatch groups and instructions
flowing into each G5 dispatch slot are shown in the Dispatch Slot Utilization chart and table (item #4). Please
Retired Document | 2012-07-23 | Copyright © 2012 Apple Inc. All Rights Reserved.
242
Miscellaneous Topics
Supervisor Space Sampling Guidelines
note that the data in the G5 Resource Utilization drawer is based on the currently selected instructions in the
Code Table, or on the entire code sequence if nothing is selected. The user can specify a subset of instructions
within the current Code Table , and the G5 Resource Utilization charts and tables will update dynamically.
Figure B-1
PPC970 Resource Modeling
2
1
3
4
Supervisor Space Sampling Guidelines
Supervisor space samples come from either the Mach kernel or kernel extensions. If you are a driver writer or
simply interested in the workings of the Mac OS X kernel, you may encounter inconsistent results between
timer sampling and event sampling when profiling code that executes with interrupts disabled. For example,
consider the PowerPC-specific virtual memory (VM) page-zeroing code in the kernel. When profiled with timer
sampling, Shark displays the output shown in Figure B-2. Because pmap_zero_page() disables interrupts,
Retired Document | 2012-07-23 | Copyright © 2012 Apple Inc. All Rights Reserved.
243
Miscellaneous Topics
Supervisor Space Sampling Guidelines
any timer interrupts that occur in it are not serviced until interrupts are reenabled in ml_restore(). It is for
this reason that all of the timer samples appear to come from the isync instruction at 0x96da8 (see Figure
B-2).
Figure B-2
Timer Sampling in the Kernel
Retired Document | 2012-07-23 | Copyright © 2012 Apple Inc. All Rights Reserved.
244
Miscellaneous Topics
Supervisor Space Sampling Guidelines
A more accurate picture of the kernel behavior can be seen with event sampling (Figure B-3). This is because
CPU event sampling reads the SIAR (sampled instruction address register) rather than the originating PC when
the performance monitor interrupt is serviced. Whenever a CPU performance monitor interrupt (PMI) occurs,
the SIAR register is set to the currently executing PC (program counter) . As in the timer sampling case, the
PMI is not actually serviced until interrupts are reenabled.
Figure B-3
CPU PMI Sampling in the Kernel
Retired Document | 2012-07-23 | Copyright © 2012 Apple Inc. All Rights Reserved.
245
Intel Core Performance Counter Event List
Intel’s Core processors have 2 performance counters per core. Both are programmable, and can count 111 (#1)
or 112 (#2) different types of events.
Most of the events are reserved, and not listed here. The available events can be modified by enabling
Event-Mask bits, in the PMC control registers. There are eight such bits in each programmable PMC.
In addition, the available events can be modified by enabling any of the eight Event-Mask bits associated with
each programmable counter. The event-mask bits are critical to determining exactly which events will be
counted. Most of the events can be selected without enabling any event-mask bits at all. The mask bits just
modify the type of event slightly or the way the counter gets incremented when the event occurs. In particular,
the mask settings often act as an event filter, limiting or expanding the selection of related events that can be
counted simultaneously. In contrast, for some types of events youmust set event-mask bits properly, in order
to count anything at all. These bits are labeled ‘Required’ in the event-mask bit list.
The table below lists each Event Name, the counter (PMC) number(s) for counters which can count the event,
the event’s number, and the valid mask bits that can be enabled, for every useful event type. This last column
lists mask bits using numbers between 0 and 7. Missing numbers indicate bits that are reserved and should
not be enabled. If no mask bits are valid for that type of event, then “none” is listed.
In Shark, more complete documentation as to what the event names mean and how each mask bit modifies
the count are provided as “tool-tips” when you hover the mouse over an event name in the popup menu, or
over a specific bit name in the event-mask list. The event-mask bit controls are only accessible from the Advanced
View controls shown in the “The Counters Menu (page 115).
For more information on how to configure these counters, see Intel CPU Performance Counter
Configuration (page 209).
Performance Counter Event Name
Event Number
PMC
Valid Event-Mask
Number
Bits
BACLEARS
230
1,2
none
BR_BAC_MISSP_EXEC
138
1,2
none
BR_BOGUS
228
1,2
none
BR_CALL_EXEC
146
1,2
none
Retired Document | 2012-07-23 | Copyright © 2012 Apple Inc. All Rights Reserved.
246
Intel Core Performance Counter Event List
Performance Counter Event Name
Event Number
PMC
Valid Event-Mask
Number
Bits
BR_CALL_MISSP_EXEC
147
1,2
none
BR_CND_EXEC
139
1,2
none
BR_CND_MISSP_EXEC
140
1,2
none
BR_IND_CALL_EXEC
148
1,2
none
BR_IND_EXEC
141
1,2
none
BR_IND_MISSP_EXEC
142
1,2
none
BR_INST_DECODED
224
1,2
none
BR_INST_EXEC
136
1,2
none
BR_INST_RETIRED
196
1,2
none
BR_MISS_PRED_RETIRED
197
1,2
none
BR_MISS_PRED_TAKEN_RET
202
1,2
none
BR_MISSP_EXEC
137
1,2
none
BR_RET_BAC_MISSP_EXEC
145
1,2
none
BR_RET_EXEC
143
1,2
none
BR_RET_MISSP_EXEC
144
1,2
none
BR_TAKEN_RETIRED
201
1,2
none
BTB_MISSES
226
1,2
none
BUS_BNR_DRV
97
1,2
none
BUS_DATA_RCV
100
1,2
6
BUS_DRDY_CLOCKS
98
1,2
5
BUS_LOCK_CLOCKS
99
1,2
6
BUS_REQ_OUTSTANDING
96
1,2
4567
BUS_SNOOP_STALL
126
1,2
none
BUS_TRAN_ANY
112
1,2
567
Retired Document | 2012-07-23 | Copyright © 2012 Apple Inc. All Rights Reserved.
247
Intel Core Performance Counter Event List
Performance Counter Event Name
Event Number
PMC
Valid Event-Mask
Number
Bits
BUS_TRAN_BRD
101
1,2
6
BUS_TRAN_BURST
110
1,2
567
BUS_TRAN_DEF
109
1,2
567
BUS_TRAN_IFETCH
104
1,2
6
BUS_TRAN_INVAL
105
1,2
6
BUS_TRAN_MEM
111
1,2
567
BUS_TRAN_PWR
106
1,2
6
BUS_TRAN_RFO
102
1,2
6
BUS_TRANS_IO
108
1,2
6
BUS_TRANS_P
107
1,2
6
BUS_TRANS_WB
103
1,2
567
CPU_CLK_UNHALTED
60
1,2
01
CYCLES_DIV_BUSY
20
1
none
CYCLES_INT_MASKED
198
1,2
none
CYCLES_INT_PENDING_AND_MASKED
199
1,2
none
DATA_MEM_REFS
67
1,2
none
DCU_LINES_IN
69
1,2
none
DCU_M_LINES_IN
70
1,2
none
DCU_M_LINES_OUT
71
1,2
none
DCU_MISS_OUTSTANDING
72
1,2
none
DCU_SNOOPS
120
1,2
016
DIV
19
2
016
DTLB Misses
73
1,2
none
Retired Document | 2012-07-23 | Copyright © 2012 Apple Inc. All Rights Reserved.
248
Intel Core Performance Counter Event List
Performance Counter Event Name
Event Number
PMC
Valid Event-Mask
Number
Bits
EMON_ESP_UOPS
215
1,2
none
EMON_FUSED_UOPS_RET
218
1,2
01
EMON_KNI_PREF_DISPATCHED
7
1,2
01
EMON_KNI_PREF_MISS
75
1,2
01
EMON_PREF_RQSTS_DN
248
1,2
none
EMON_PREF_RQSTS_UP
240
1,2
none
EMON_SIMD_INSTR_RETIRED
206
1,2
none
EMON_SSE_SSE2_COMP_INST_RETIRED
217
1,2
01
EMON_SSE_SSE2_INST_RETIRED
216
1,2
012
EMON_SYNCH_UOPS
211
1,2
none
EMON_UNFUSION
219
1,2
none
EST_TRANS
58
1,2
01
EXTERNAL_BUS_CYCLES
119
1,2
0124
EXTERNAL_BUS_QUEUE
125
1,2
6
FLOPS
193
1,2
none
FP_ASSIST
17
2
none
FP_COMP_OPS_EXE
16
1
none
FP_MMX_TRANS
204
1,2
0
HW_INT_RX
200
1,2
none
IFU_IFETCH
128
1,2
none
IFU_IFETCH_MISS
129
1,2
none
IFU_MEM_STALL
134
1,2
none
ILD_STALL
135
1,2
none
INST_DECODED
208
1,2
none
Retired Document | 2012-07-23 | Copyright © 2012 Apple Inc. All Rights Reserved.
249
Intel Core Performance Counter Event List
Performance Counter Event Name
Event Number
PMC
Valid Event-Mask
Number
Bits
INST_RETIRED
192
1,2
none
ITLB_MISS
133
1,2
none
L1_CACHEABLE_DATA_READS
64
1,2
0123
L1_CACHEABLE_DATA_READS_AND_WRITES
68
1,2
0123
L1_CACHEABLE_DATA_WRITES
65
1,2
0123
L1_CACHEABLE_LOCK_READS
66
1,2
0123
L1_PREFETCH_REQUEST_MISSES
79
1,2
none
L2_ADS
33
1,2
6
L2_DBUS_BUSY
34
1,2
none
L2_DBUS_BUSY_RD
35
1,2
6
L2_IFETCH
40
1,2
0123456
L2_LD
41
1,2
0123456
L2_LINES_IN
36
1,2
0123456
L2_LINES_OUT
38
1,2
0123456
L2_M_LINES_INM
37
1,2
6
L2_M_LINES_OUT
39
1,2
0123456
L2_NO_REQUEST_CYCLES
50
1,2
6
L2_REJECT_CYCLES
48
1,2
6
L2_RQSTS
46
1,2
0123456
L2_ST
42
1,2
0123456
LD_BLOCKS
3
1,2
none
MISALIGN_MEM_REF
5
1,2
none
MMX_ASSIST
205
1,2
none
Retired Document | 2012-07-23 | Copyright © 2012 Apple Inc. All Rights Reserved.
250
Intel Core Performance Counter Event List
Performance Counter Event Name
Event Number
PMC
Valid Event-Mask
Number
Bits
MMX_INSTR_EXEC
176
1,2
none
MMX_INSTR_TYPE_EXEC
179
1,2
012345
MMX_SAT_INSTR_EXEC
177
1,2
none
MMX_SAT_INSTR_RET
207
1,2
none
MMX_UOPS_EXEC
178
1,2
none
MUL
18
2
none
PARTIAL_RAT_STALLS
210
1,2
none
RESOURCE_STALLS
162
1,2
none
RET_SEG_RENAMES
214
1,2
none
SB_DRAINS
4
1,2
none
SEG_REG_RENAMES
213
1,2
0123
SEG_RENAME_STALLS
212
1,2
0123
SEGMENT_REG_LOADS
6
1,2
none
SELF_MODIFYING_CODE
195
1,2
none
THERMAL_TRIP
59
1,2
67
UOPS_RETIRED
194
1,2
none
Retired Document | 2012-07-23 | Copyright © 2012 Apple Inc. All Rights Reserved.
251
Intel Core 2 Performance Counter Event List
Intel’s Core 2 processors have 5 performance counters per core. Two of these are fully programmable, and can
count 116 (#1) or 115 (#2) different types of events. The other three counters are fixed, and can only count one
type of event (for counter 3: INSTR_RETIRED.ANY, 4: CPU_CLK_UNHALTED.CORE, and 5:
CPU_CLK_UNHALTED.REF).
In addition, the available events can be modified by enabling any of the eight Event-Mask bits associated with
each programmable counter. The event-mask bits are critical to determining exactly which events will be
counted. Most of the events can be selected without enabling any event-mask bits at all. The mask bits just
modify the type of event slightly or the way the counter gets incremented when the event occurs. In particular,
the mask settings often act as an event filter, limiting or expanding the selection of related events that can be
counted simultaneously. In contrast, for some types of events youmust set event-mask bits properly, in order
to count anything at all. These bits are labeled ‘Required’ in the event-mask bit list.
The table below lists each Event Name, the counter (PMC) number(s) for counters which can count the event,
the event’s number, and the valid mask bits that can be enabled, for every useful event type. This last column
lists mask bits using numbers between 0 and 7. Missing numbers indicate bits that are reserved and should
not be enabled. If no mask bits are valid for that type of event, then “none” is listed.
In Shark, more complete documentation as to what the event names mean and how each mask bit modifies
the count are provided as “tool-tips” when you hover the mouse over an event name in the popup menu, or
over a specific bit name in the event-mask list. The event-mask bit controls are only accessible from the Advanced
View controls shown in the Timed Counters: The Performance Counter Spreadsheet (page 111).
For more information on how to configure these counters, see Intel CPU Performance Counter
Configuration (page 209).
Performance Counter Event Name
Event Number
PMC Number
Valid Event-Mask Bits
BACLEARS
230
1
none
2
0
1
none
2
0
1
none
BR_BAC_MISSP_EXEC
BR_BOGUS
138
228
Retired Document | 2012-07-23 | Copyright © 2012 Apple Inc. All Rights Reserved.
252
Intel Core 2 Performance Counter Event List
Performance Counter Event Name
BR_CALL_EXEC
146
BR_CALL_MISSP_EXEC
BR_CND_EXEC
147
139
BR_CND_MISSP_EXEC
140
BR_IND_CALL_EXEC
148
BR_IND_EXEC
141
BR_IND_MISSP_EXEC
142
BR_INST_DECODED
224
BR_INST_EXEC
136
BR_INST_RETIRED
196
BR_INST_RETIRED.MISPRED
BR_MISSP_EXEC
Event Number
197
137
PMC Number
Valid Event-Mask Bits
2
0
1
none
2
0
1
none
2
0
1
none
2
0
1
none
2
0
1
none
2
0
1
none
2
0
1
none
2
0
1
none
2
0
1
none
2
0
1
012367
2
0234567
1
none
2
02345
1
none
Retired Document | 2012-07-23 | Copyright © 2012 Apple Inc. All Rights Reserved.
253
Intel Core 2 Performance Counter Event List
Performance Counter Event Name
BR_RET_BAC_MISSP_EXEC
BR_RET_EXEC
BR_RET_MISSP_EXEC
BR_TKN_BUBBLE_1
BR_TKN_BUBBLE_2
BUS_BNR_DRV
BUS_DATA_RCV
BUS_DRDY_CLOCKS
BUS_HIT_DRV
BUS_HITM_DRV
BUS_IO_WAIT
Event Number
145
143
144
151
152
97
100
98
122
123
127
PMC Number
Valid Event-Mask Bits
2
0
1
none
2
0
1
none
2
0
1
none
2
0
1
none
2
0
1
none
2
0
1
5
2
0
1
67
2
07
1
5
2
0
1
5
2
02357
1
5
2
023
1
67
2
0
Retired Document | 2012-07-23 | Copyright © 2012 Apple Inc. All Rights Reserved.
254
Intel Core 2 Performance Counter Event List
Performance Counter Event Name
Event Number
PMC Number
Valid Event-Mask Bits
BUS_LOCK_CLOCKS (Core and Bus
Agents masks apply)
99
1
567
2
067
1
4567
2
0
1
567
2
07
1
567
2
07
1
567
2
07
1
567
2
07
1
567
2
07
1
567
2
07
1
567
2
07
1
567
2
07
1
567
2
07
1
567
2
07
BUS_REQ_OUTSTANDING
BUS_TRAN_RFO
BUS_TRANS_ANY
BUS_TRANS_BRD
BUS_TRANS_BURST
BUS_TRANS_DEF
BUS_TRANS_IFETCH
BUS_TRANS_INVAL
BUS_TRANS_IO
BUS_TRANS_MEM
BUS_TRANS_P
96
102
112
101
110
109
104
105
108
111
107
Retired Document | 2012-07-23 | Copyright © 2012 Apple Inc. All Rights Reserved.
255
Intel Core 2 Performance Counter Event List
Performance Counter Event Name
Event Number
PMC Number
Valid Event-Mask Bits
BUS_TRANS_PWR
106
1
567
2
07
1
567
2
0
1
67
2
07
1
0167
2
0
1
01
2
0
BUS_TRANS_WB
103
BUSQ_EMPTY
125
CMP_SNOOP
120
CPU_CLK_UNHALTED
60
CPU_CLK_UNHALTED.CORE
0
4
none
CPU_CLK_UNHALTED.REF
0
5
none
CYCLES_DIV_BUSY
20
1
none
CYCLES_INT
198
1
01
2
024
1
none
2
03
CYCLES_L1I_MEM_STALLED
134
DELAYED_BYPASS
25
2
0
DIVIDES
19
2
0
DTLB_MISSES
8
1
0123
2
0
1
none
2
0
1
01
EIST_TRANS
ESP Register
58
171
Retired Document | 2012-07-23 | Copyright © 2012 Apple Inc. All Rights Reserved.
256
Intel Core 2 Performance Counter Event List
Performance Counter Event Name
EXT_SNOOP
Event Number
119
PMC Number
Valid Event-Mask Bits
2
0
1
0135
2
0
FP_ASSIST
17
2
0
FP_COMP_OPS_EXE
16
1
none
FP_MMX_TRANS
204
1
01
2
0
1
none
2
0
HW_INT_RCV
200
IDLE_DURING_DIV
24
1
none
ILD_STALL
135
1
none
2
0
1
1
2
0
1
012
2
0
INST_QUEUE.FULL
INST_RETIRED
131
192
INSTR_RETIRED.ANY
0
3
none
ITLB
130
1
146
2
0
1
none
2
023
1
01
2
02345
1
0123
ITLB_MISS_RETIRED
L1D_ALL_REF
L1D_CACHE_LD
201
67
64
Retired Document | 2012-07-23 | Copyright © 2012 Apple Inc. All Rights Reserved.
257
Intel Core 2 Performance Counter Event List
Performance Counter Event Name
L1D_CACHE_LOCK
66
L1D_CACHE_ST
65
L1D_M_EVICT
71
L1D_M_REPL
70
L1D_PEND_MISS
72
L1D_PREFETCH.REQUESTS
L1D_REPL
L1D_SPLIT
L1I_MISSES
L1I_READS
L2_ADS
L2_DBUS_BUSY_RD
Event Number
78
69
73
129
128
33
35
PMC Number
Valid Event-Mask Bits
2
0
1
01234
2
0
1
0123
2
0
1
none
2
0
1
none
2
023
1
none
2
02345
1
4
2
023
1
0123
2
023456
1
01
2
0
1
none
2
067
1
none
2
0
1
67
2
0
1
67
Retired Document | 2012-07-23 | Copyright © 2012 Apple Inc. All Rights Reserved.
258
Intel Core 2 Performance Counter Event List
Performance Counter Event Name
L2_IFETCH
L2_LD
L2_LINES_IN
L2_LINES_OUT
L2_LOCK
L2_M_LINES_IN
L2_M_LINES_OUT
L2_NO_REQ
L2_REJECT_BUSQ
L2_RQSTS
L2_ST
LOAD_BLOCK
Event Number
40
41
36
38
43
37
39
50
48
46
42
3
PMC Number
Valid Event-Mask Bits
2
0
1
012367
2
0
1
01234567
2
067
1
4567
2
0
1
4567
2
0
1
01234567
2
02345
1
67
2
0
1
4567
2
067
1
67
2
0
1
01234567
2
0
1
01234567
2
0234567
1
012367
2
067
1
12345
Retired Document | 2012-07-23 | Copyright © 2012 Apple Inc. All Rights Reserved.
259
Intel Core 2 Performance Counter Event List
Performance Counter Event Name
LOAD_HIT_PRE
Event Number
76
MACHINE_NUKES
195
MACRO_INSTS.CISC_DECODED
170
PMC Number
Valid Event-Mask Bits
2
0
1
none
2
023
1
02
2
0234
1
3
2
0
MEM_LOAD_RETIRED
203
1
none
MEMORY_DISAMBIGUATION
9
1
01
2
0
1
none
2
0
MISALIGN_MEM_REF
5
MULTIPLIES
18
2
0
PAGE_WALKS
12
1
01
2
023
1
none
2
0
1
none
2
0
1
0123
2
0
1
01234
2
0
1
none
PREF_RQSTS_DN
248
PREF_RQSTS_UP
240
RAT_STALLS
210
RESOURCE_STALLS
220
RS_UOPS_DISPATCHED
160
Retired Document | 2012-07-23 | Copyright © 2012 Apple Inc. All Rights Reserved.
260
Intel Core 2 Performance Counter Event List
Performance Counter Event Name
SEG_REG_RENAMES
213
SEG_RENAME_STALLS
212
SEGMENT_REG_LOADS
SIMD_ASSIST
SIMD_INST_RETIRED
202
199
SIMD_INSTR_RETIRED
206
SIMD_SAT_INSTR_RETIRED
SIMD_SAT_UOP_EXEC
207
177
SIMD_UOP_TYPE_EXEC
SNOOP_STALL_DRV
6
205
SIMD_COMP_INST_RETIRED
SIMD_UOPS_EXEC
Event Number
179
176
126
PMC Number
Valid Event-Mask Bits
2
0
1
0123
2
02345
1
0123
2
0
1
none
2
034567
1
none
2
02345
1
0123
2
023456
1
01234
2
02345
1
none
2
023456
1
none
2
023
1
none
2
0
1
012345
2
0
1
none
2
0
1
4567
Retired Document | 2012-07-23 | Copyright © 2012 Apple Inc. All Rights Reserved.
261
Intel Core 2 Performance Counter Event List
Performance Counter Event Name
SSE_PRE_EXEC
SSE_PRE_MISS
STORES BLOCKED
THERMAL_TRIP
UOPS_RETIRED
X87_OPS_RETIRED
Event Number
7
75
4
59
194
193
PMC Number
Valid Event-Mask Bits
2
07
1
01
2
0235
1
01
2
0
1
013
2
0
1
67
2
0
1
0123
2
0
1
0123456
2
0
Retired Document | 2012-07-23 | Copyright © 2012 Apple Inc. All Rights Reserved.
262
PPC 750 (G3) Performance Counter Event List
The PowerPC 750 (G3) cores contain four independent performance counters, each of which can count 12–17
different types of events. Four commonly measured types of events (CPU cycles, instructions completed,
timebase clock transitions, and instructions dispatched) can be counted on any counter, while other types of
events can only be counted on a limited subset of the counters.
The table below lists each Event Name, the counter (PMC) number(s) for counters which can count the event,
and each event’s number.
For more information on how to configure these counters, see PowerPC G3/G4/G4+ CPU Performance Counter
Configuration (page 211).
Performance Counter Event Name
PMC Number(s)
Event Number
2nd Spec Branch Buffer Correct
3
16
Branch Unit LR/CTR Stall Cycles
3
17
Branch Unit Speculative Stall Cycles
1, 2
12
4
14
CacheOp L2 Hits
3
13
CPU Cycles
1, 2, 3, 4
1
dL1 Load Miss Cycles
3
15
dL1 Miss Cycles > Threshold
1, 2
10
dL1 Misses
3
5
dL2 Misses
3
7
DTLB Misses
3
6
DTLB Search Cycles
4
6
EIEIO Instr
1, 2
5
Floating Point Instr
3
11
Retired Document | 2012-07-23 | Copyright © 2012 Apple Inc. All Rights Reserved.
263
PPC 750 (G3) Performance Counter Event List
Performance Counter Event Name
PMC Number(s)
Event Number
Instr Bkpt Matches
1, 2
9
Instr Completed
1, 2, 3, 4
2
Instr Dispatched
1, 2, 3, 4
4
Instr Fetches
1, 2
8
Integer Instr
4
13
ITLB Search Cycles
1, 2
6
L2 Castouts
4
5
L2 Hits
1, 2
7
L2 Snoop Castouts
3
12
Marked/Unmarked Supervisor Transitions
4
9
Marked/Unmarked User Transitions
3
9
Mispredicted Branches
4
8
Nothing
1, 2, 3, 4
0
Snoop Retries
4
12
STWCX Instr
3
10
Successful STWCX Instr
4
10
SYNC Instr
4
11
Taken Branches
3
8
TimeBase (Lower) 0->1 bit transitions
3, 4
3
TimeBase (Upper) 0->1 bit transitions
1, 2
3
Unresolved Branches
1, 2
11
Retired Document | 2012-07-23 | Copyright © 2012 Apple Inc. All Rights Reserved.
264
PPC 7400 (G4) Performance Counter Event List
The PowerPC 7400 (G4) cores contain four independent performance counters, each of which can count 27–48
different types of events. Four commonly measured types of events (CPU cycles, instructions completed,
timebase clock transitions, and instructions dispatched) can be counted on any counter, while other types of
events can only be counted on a limited subset of the counters.
The table below lists each Event Name, the counter (PMC) number(s) for counters which can count the event,
and each event’s number.
For more information on how to configure these counters, see PowerPC G3/G4/G4+ CPU Performance Counter
Configuration (page 211).
Performance Counter Event Name
PMC Number(s)
Event Number
1st Spec Branch Buffer Correct
2
38
2nd Spec Branch Buffer Correct
3
14
AltiVec Load Instr
1
48
AltiVec MFVSCR Instr Sync Cycles
1
14
AltiVec MTVRSAVE Instr
1
16
AltiVec MTVSCR Instr
1
15
AltiVec VCIU Instr
3
7
AltiVec VFPU Instr
4
7
AltiVec VFPU Stall Cycles
3
8
AltiVec VFPU Traps
2
34
AltiVec VPU Instr
1
7
AltiVec VPU Stall Cycles
4
8
AltiVec VSCR[SAT] 0->1
1
17
AltiVec VSIU Stall Cycles
1
8
Retired Document | 2012-07-23 | Copyright © 2012 Apple Inc. All Rights Reserved.
265
PPC 7400 (G4) Performance Counter Event List
Performance Counter Event Name
PMC Number(s)
Event Number
Branch Unit LR/CTR Stall Cycles
3
15
Branch Unit Speculative Load Stall Cycles
1
37
Branch Unit Speculative Stall Cycles
1
13
4
14
Branches Taken
3
5
Bus Kill Transactions (Non-Retried)
4
12
Bus Multi Beat Write TAs
4
25
Bus Multi-Beat Read TAs
2
21
Bus Read TAs
2
42
Bus Retries
2
20
Bus Single Beat Read TAs
1
28
Bus Single Beat Write TAs
3
29
Bus Transactions (Non-Retried)
1
27
Cache Inhibited Stores
2
24
Clean L1 Castouts to L2
1
18
Conditional Store Instr
3
12
CPU Cycles
1, 2, 3, 4
1
Data Bkpt match
1
10
Data Reload Table Snoop Hits
2
35
Data Reload Table Store Miss Merges
2
22
Dirty L1 Castouts to L2
2
13
dL1 CacheOp Cycles
3
17
dL1 Castout to L2 Misses
2
28
dL1 Castouts to L2
4
19
Retired Document | 2012-07-23 | Copyright © 2012 Apple Inc. All Rights Reserved.
266
PPC 7400 (G4) Performance Counter Event List
Performance Counter Event Name
PMC Number(s)
Event Number
dL1 Cycles
3
18
dL1 Hits
1
24
dL1 Load Hits
1
22
dL1 Load Misses
2
15
dL1 Miss Cycles > Threshold
1
11
dL1 Misses
2
17
dL1 Reloads
3
30
dL1 Snoop Hits
4
23
dL1 Snoop Interventions
4
16
4
26
dL1 Store Hits
1
23
dL1 Store Misses
2
16
dL1 Touch Hits
3
16
dL1 Touch Misses
4
15
dL1 Writes Hit Shared
1
30
dL2 Hits
1
33
dL2 Misses
2
26
DSS Instr
3
24
DSSALL Instr
4
22
DST DTLB Table Successful Searches
4
27
DST Instr Dispatched
1
38
DTLB Misses
3
6
DTLB Search Cycles
4
6
DTLB Search Cycles > Threshold
1
20
Retired Document | 2012-07-23 | Copyright © 2012 Apple Inc. All Rights Reserved.
267
PPC 7400 (G4) Performance Counter Event List
Performance Counter Event Name
PMC Number(s)
Event Number
EIEIO Instr
1
5
External Snoop Requests
1
42
Fall through Branches
2
5
Floating Point Instr
3
11
Full Cache Line Store Miss Merge
3
21
Hit Exclusive Interventions
3
28
Hit Interventions
1
45
Hit Modified Interventions
2
36
Hit Shared Interventions
4
24
iL1 Misses
1
32
iL1 Reloads
2
25
iL2 Hits
2
27
iL2 Misses
1
34
Instr Bkpt match
1
9
Instr Completed
1, 2, 3, 4
2
Instr Dispatched
1, 2, 3, 4
4
Integer Instr
4
13
ITLB Misses
2
6
ITLB Search Cycles
1
6
ITLB Search Cycles > Threshold
1
19
L1 Castout to L2 Hits
1
35
L1 Load Fold Queue Reload Hits
1
29
L1 Load Fold Queue Touch Hits
1
46
L1 Operations Queue Snoop Hits
1
47
Retired Document | 2012-07-23 | Copyright © 2012 Apple Inc. All Rights Reserved.
268
PPC 7400 (G4) Performance Counter Event List
Performance Counter Event Name
PMC Number(s)
Event Number
L2 Allocations
1
36
L2 Castout Snoop Hits
1
44
L2 Sectors Castout
2
29
L2 Snoop Hits
3
27
L2 Snoop Interventions
3
13
L2 Tag Accesses
1
26
L2 Tag Lookup
1
25
L2 Tag Snoop Writes
4
17
L2 Tag Snoops
3
19
L2 Tag Writes
2
18
L2 Write Hit on Shared
2
23
L2SRAM Cycles
4
18
L2SRAM Read Cycles
2
19
L2SRAM Write Cycles
3
20
Load Instr
2
11
Mispredicted Branches
4
5
Nothing
1, 2, 3, 4
0
Reserved Loads
2
10
Snoop Hits
2
37
Snoop Retries
3
26
Snooped TLB Invalidations
2
41
Snoops Serviced
2
12
Store Instr
1
21
Successful STWCX Instr
4
10
Retired Document | 2012-07-23 | Copyright © 2012 Apple Inc. All Rights Reserved.
269
PPC 7400 (G4) Performance Counter Event List
Performance Counter Event Name
PMC Number(s)
Event Number
SYNC Instr
4
11
System Register Unit Instr
2
14
TimeBase (Lower) 0->1 bit transitions
1, 2, 3, 4
3
TLBI Instr
2
40
TLBSYNC Instr
3
10
Unresolved Branches
1
12
User/Supervisor Switches
2
9
VCIU Wait Cycles
2
8
VSIU Instr
2
7
VTE Data Reload Table Hits
3
22
VTE dL1 Hits
4
20
VTE L1 Cache Misses
2
30
VTE Line Fetches
2
32
VTE Premature Cancels
2
33
VTE Refresh
1
40
VTE Resume on Context Switch
2
39
VTE Suspend Context Switch
1
41
VTE0 Fetches
1
39
VTE1 Line Fetches
2
31
VTE2 Line Fetches
3
23
VTE3 Line Fetches
4
21
Window of Opportunity Push Address Tenures
1
43
Write Through Stores
1
31
Retired Document | 2012-07-23 | Copyright © 2012 Apple Inc. All Rights Reserved.
270
PPC 7450 (G4+) Performance Counter Event List
The PowerPC 7450 (G4+) cores contain six independent performance counters, each of which can count 20–94
different types of events. CPU cycles can be measured on any counter, five other commonly measured types
of events (instructions completed, timebase clock transitions, instructions dispatched, performance monitor
interrupts, and external performance monitor events) can also be counted on any of the first four counters,
while other types of events can only be counted on a limited subset of the counters.
The table below lists each Event Name, the counter (PMC) number(s) for counters which can count the event,
and each event’s number.
For more information on how to configure these counters, see PowerPC G3/G4/G4+ CPU Performance Counter
Configuration (page 211).
Performance Counter Event Name
PMC Number(s)
Event Number
1st Spec Buffer Active Cycles
1
24
2nd Spec Branch Buffer Active
2
56
2nd Spec Branch Buffer Correct
3
27
3rd Spec Branch Buffer Active
3
28
3rd Spec Branch Buffer Correct
4
27
Aligned FP Store Instr
1
65
AltiVec CFX Instr
1, 2, 4
11
AltiVec CFX Stall Cycles
1, 2
17
AltiVec Float Instr
1, 2, 4
9
AltiVec Float Stall Cycles
1, 2
15
AltiVec Issue Queue > Threshold
1
31
AltiVec Issue Stalls
3
11
AltiVec Loads
1
64
Retired Document | 2012-07-23 | Copyright © 2012 Apple Inc. All Rights Reserved.
271
PPC 7450 (G4+) Performance Counter Event List
Performance Counter Event Name
PMC Number(s)
Event Number
AltiVec MFVSCR Instr Sync Cycles
1, 2
18
AltiVec MTVRSAVE Instr
1, 2, 4
13
AltiVec MTVSCR Instr
1, 2, 4
12
AltiVec Permute Instr
1, 2, 4
8
AltiVec Permute Stall Cycles
1, 2
14
AltiVec SFX Instr
1, 2, 4
10
AltiVec SFX Stall Cycles
1, 2
16
AltiVec VSCR[SAT] 0->1
1, 2
19
Branch Flushes
3
26
Branch Instr
1
34
Branch Link Stack Correct
2
59
Branch Link Stack Mispredicts
3
31
Branch Link Stack Prediction Used
1
27
Branch Unit CTR Stall Cycles
3
29
Branch Unit Stall Cycles
1
25
2
57
BTIC Hits
1
26
BTIC Misses
2
58
Bus Outstanding Read Queue Full Cycles
6
28
Bus Read/Writes not Retried
6
46
Bus Reads not Retried
6
44
Bus Retries
6
26
Bus Retry from Collision
6
49
Bus Retry from Intervention
6
50
Retired Document | 2012-07-23 | Copyright © 2012 Apple Inc. All Rights Reserved.
272
PPC 7450 (G4+) Performance Counter Event List
Performance Counter Event Name
PMC Number(s)
Event Number
Bus Retry from L1 Retry
6
47
Bus Retry from Prev-Adjacent
6
48
Bus TA's for Reads
6
42
Bus TA's for Writes
6
43
Bus Writes not Retried
6
45
Cache-Inhibited Stores
1
52
Canceled iL1 Misses
3
19
Completed 0 Instr
1
32
Completed 1 Instr
2
33
Completed 2 Instr
3
8
Completed 3 Instr
4
14
Completion Queue > Threshold
2
32
Complex Integer Instr
1
33
CPU Cycles
1, 2, 3, 4, 5, 6
1
Data Bkpt Matches
2
53
DCBF/DCBST Instr dL1 Hits
3
20
Dispatched 0 Instr
4
15
Dispatched 1 Instr
3
9
Dispatched 2 Instr
2
34
Dispatched 3 Instructions
1
29
Dispatched AltiVec Instr
3
10
dL1 Castouts
2
50
dL1 Cycles
2
41
dL1 Hits
1
56
Retired Document | 2012-07-23 | Copyright © 2012 Apple Inc. All Rights Reserved.
273
PPC 7450 (G4+) Performance Counter Event List
Performance Counter Event Name
PMC Number(s)
Event Number
dL1 Load Hits
1
53
dL1 Load Miss Cycles
3
21
dL1 Load Misses
2
37
dL1 Load-Miss Cycles > Threshold
1
43
dL1 Misses
2, 3
23
dL1 Pushes
3
22
dL1 Reloads
2
49
dL1 Snoop Hit in COQ
1
48
dL1 Snoop Hit in COQ Retry
1
49
dL1 Snoop Hit Modified
1
44
dL1 Snoop Hits
1
50
dL1 Snoops
1, 2
22
dL1 Store Hits
1
55
dL1 Store Misses
2
39
dL1 Touch Hits
1
54
dL1 Touch Miss Cycles
2
40
dL1 Touch Misses
2
38
dL2 Misses
5, 6
6
dL3 Misses
5, 6
7
6
34
DSS Instr
1
60
DSSALL Instr
4
19
dst-Instr Dispatched
1
57
DSTx Search Success
1
59
Retired Document | 2012-07-23 | Copyright © 2012 Apple Inc. All Rights Reserved.
274
PPC 7450 (G4+) Performance Counter Event List
Performance Counter Event Name
PMC Number(s)
Event Number
DTLB Misses
3
18
DTLB Search Cycles
4
23
DTLB Search Cycles > Threshold
1
40
DTQ Full
6
25
EIEIO Instr
1
35
Extern Perf Monitor
1, 2, 3, 4
7
External Interventions
6
22
External Pushes
6
23
External Snoop Retries
6
24
Fall Thru Branches
2
54
Fast BTIC Hits
3
30
Folded Branches
4
29
FP Denorm Result
1
94
FP Denormalize
1
67
FP Instr Dispatched to FPR Queue
2
24
FP Issue Queue > Threshold
3
13
FP Issue Stalls
2
60
FP Load Instr
1
79
FP Load-Double Instr
1
81
FP Load-Single Instr
1
80
FP Renormalize
1
66
FP Store Double Instr
4
30
FP Store Single Instr
2
62
FP Store Stall Cycles
1
68
Retired Document | 2012-07-23 | Copyright © 2012 Apple Inc. All Rights Reserved.
275
PPC 7450 (G4+) Performance Counter Event List
Performance Counter Event Name
PMC Number(s)
Event Number
FPSCR Renames 1/2 Busy
1
91
FPSCR Renames 1/4 Busy
1
90
FPSCR Renames 3/4 Busy
1
92
FPSCR Renames All Busy
1
93
FPU Instr
3
14
GPR Issue Queue > Threshold Cycles
4
16
GPR Issue Queue Stall Cycles
4
17
GPR Rename Buffer > Threshold
3
12
iL1 Accesses
1
41
iL1 Miss Cycles
2
36
iL1 Misses
1, 2
21
iL1 Reloads
2
48
iL2 Misses
5, 6
4
iL3 Misses
5, 6
5
6
33
Instr Bkpt Matches
1
42
Instr Completed
1, 2, 3, 4
2
Instr Dispatched
1, 2, 3, 4
4
Instr Dispatched to GPR Queue
1
28
Instr Queue > Threshold
1
30
Interventions
5, 6
18
ITLB Misses
2
35
ITLB Search Cycles
1
39
ITLB Search Cycles > Threshold
3
17
Retired Document | 2012-07-23 | Copyright © 2012 Apple Inc. All Rights Reserved.
276
PPC 7450 (G4+) Performance Counter Event List
Performance Counter Event Name
PMC Number(s)
Event Number
L1 External Interventions
6
19
L2 Castout Queue Full Cycles
6
10
L2 Castouts
6
8
L2 External Interventions
6
20
L2 Hits
5, 6
2
L2 Load Hits
5
8
L2 Misses
5
19
6
29
L2 Store Hits
5
9
L2 Touch Hits
5, 6
13
L2 Valid Requests
6
27
L3 Castout Queue Full Cycles
6
11
L3 Castouts
6
9
L3 External Interventions
6
21
L3 Hits
5, 6
3
6
31
5
10
6
35
5
20
6
30
6
32
L3 Read Queue Full Cycles
6
16
L3 Store Hits
5
11
6
36
L3 Load Hits
L3 Misses
Retired Document | 2012-07-23 | Copyright © 2012 Apple Inc. All Rights Reserved.
277
PPC 7450 (G4+) Performance Counter Event List
Performance Counter Event Name
PMC Number(s)
Event Number
L3 Touch Hits
5, 6
14
6
37
L3 Write Queue Full Cycles
6
17
LD/ST Alias vs. CSQ
1
73
LD/ST Alias vs. FSQ/WB0/WB1
1
72
LD/ST CSQ Forwards
1
86
LD/ST Indexed Alias Stalls
1
71
1st Spec Branch Buffer Correct
2
55
LD/ST LMQ Full Stalls
1
78
LD/ST LMQ Index Alias Stalls
1
84
LD/ST Load vs. STQ Alias Stalls
1
83
LD/ST Load-Hit Line vs. CSQ0
1
74
LD/ST Load-Miss Line vs. CSQ0
1
75
LD/ST RA Latch Stall
1
82
LD/ST STQ Index Alias Stalls
1
85
LD/ST Touch Alias vs. CSQ
1
77
LD/ST Touch Alias vs. FSQ/WB0/WB1
1
76
LD/ST True Alias Stalls
1
70
Load Instr
2
26
Load String/Multi Instr Pieces
3
16
Load-Miss Alias
1
45
Load-Miss Alias on Touch
1
46
Load/Store Instr
2
25
LSWI/LSWX/LMW Instr
1
38
Retired Document | 2012-07-23 | Copyright © 2012 Apple Inc. All Rights Reserved.
278
PPC 7450 (G4+) Performance Counter Event List
Performance Counter Event Name
PMC Number(s)
Event Number
LWARX Instr
2
29
MFSPR Instr
2
30
Mispredicted Branches
4
28
MTSPR Instr
1
36
Nothing
1, 2, 3, 4, 5, 6
0
Perf Monitor Interrupts
1, 2, 3, 4
5
Prefetch Engine Full
6
57
Prefetch Engine Requests
6
52
Prefetch Instr Fetch Collisions
6
55
Prefetch Load Collisions
6
53
Prefetch Load/Store/Instr Fetch Collisions
6
56
Prefetch Store Collisions
6
54
Refetch Serializations
2
31
Refreshed DSTs
1
58
SC Instr
1
37
Simple Integer Instr
4
18
Snoop Modified
5
16
Snoop Requests
6
51
Snoop Retries
4
24
5, 6
15
Snoop Valid
5
17
Store Instr
1, 2
20
Store Merge to 32 Bytes
2
52
Store Merge/Gathers
2
51
Retired Document | 2012-07-23 | Copyright © 2012 Apple Inc. All Rights Reserved.
279
PPC 7450 (G4+) Performance Counter Event List
Performance Counter Event Name
PMC Number(s)
Event Number
Store String/Multi Pieces
4
22
STSWI/STSWX/STMW Instr
2
27
STWCX Instr
3
15
Successful STWCX Instr
4
25
SYNC Instr
4
21
Taken Branches
3
25
TimeBase (Lower) 0->1 bit transitions
1, 2, 3, 4
3
TLBIE Instr
2
28
TLBIE Snoops
2
47
TLBSYNC Instr
4
20
Touch Alias
1
47
Unaligned Load Instr
1
87
Unaligned Load/Store Instr
1
89
Unaligned Store Instr
1
88
Unresolved Branches
1
23
User/Supervisor Switches
2
61
VTE Branch Speculation Cancel
2
43
VTE Line Fetch dL1 Hits
1
63
VTE Line Fetch dL1 Miss
2
45
VTE Line Fetches
2
46
VTE Resume on Context Switch
2
44
VTE Suspended on Context Switch
1
62
VTE0 Line Fetches
1
61
VTE1 Line Fetches
2
42
Retired Document | 2012-07-23 | Copyright © 2012 Apple Inc. All Rights Reserved.
280
PPC 7450 (G4+) Performance Counter Event List
Performance Counter Event Name
PMC Number(s)
Event Number
VTE2 Line Fetches
3
24
VTE3 Line Fetches
4
26
Write-Through Stores
1
51
Retired Document | 2012-07-23 | Copyright © 2012 Apple Inc. All Rights Reserved.
281
PPC 970 (G5) Performance Counter Event List
The PowerPC 970 (G5) cores contain an extremely sophisticated and complex set of performance counters.
Unlike the other processors used in Macintoshes, one cannot simply choose a counter and type of performance
counter event for it to count. There are simply too many different possible events in these processors that can
be counted. Instead, one must first select various options on the “TTM” and “Byte Lane” muxes in order to
narrow down the possible field of events that can be counted, before actually selecting one particular event
to count.
The table below lists each Event Name followed by the various selections of event number(s), counter (PMC)
number(s), TTM mux settings, and Byte Lane settings that can be used to count that type of event. Where lists
of both event and PMC numbers are given in a single row of the table, the corresponding event and PMC
numbers (first with first, second with second, etc.) should be used together.
For more information on how to configure these counters, see PowerPC G5 (970) Performance Counter
Configuration (page 213).
Performance Counter Event
Event
PMC
TTM Mux
Byte Lane
Name
Number(s)
Number(s)
Number
Number
1 or more Instrs Completed
3
5
[FPU] fp0 add, mult, sub,
compare, fsel
19
1, 2, 5, 6
0: FPU
0: TTM0
[FPU] fp0 add, mult, sub,
compare, fsel + fp1 add, mult,
sub, compare, fsel
0
5
0: FPU
0: TTM0
[FPU] fp0 denorm operand
24
1, 2, 5, 6
0: FPU
2: TTM0
[FPU] fp0 denorm operand + fp1
denorm operand
32
1
0: FPU
2: TTM0
[FPU] fp0 divide
16
1, 2, 5, 6
0: FPU
0: TTM0
[FPU] fp0 divide + fp1 divide
0
1
0: FPU
0: TTM0
[FPU] fp0 estimate
18
3, 4, 7, 8
0: FPU
1: TTM0
Retired Document | 2012-07-23 | Copyright © 2012 Apple Inc. All Rights Reserved.
282
PPC 970 (G5) Performance Counter Event List
Performance Counter Event
Event
PMC
TTM Mux
Byte Lane
Name
Number(s)
Number(s)
Number
Number
[FPU] fp0 estimate + fp1
estimate
0
3
0: FPU
1: TTM0
[FPU] fp0 finished and produced
a result
19
3, 4, 7, 8
0: FPU
1: TTM0
[FPU] fp0 finished and produced
a result + fp1 finished and
produced a result
0
4
0: FPU
1: TTM0
[FPU] fp0 fpscr
24
3, 4, 7, 8
0: FPU
3: TTM0
[FPU] fp0 fpscr + nothing
32
8
0: FPU
3: TTM0
[FPU] fp0 move, estimate
16
3, 4, 7, 8
0: FPU
1: TTM0
[FPU] fp0 move, estimate + fp1
move, estimate
0
8
0: FPU
1: TTM0
[FPU] fp0 mult-add
17
1, 2, 5, 6
0: FPU
0: TTM0
[FPU] fp0 mult-add + fp1
mult-add
0
2
0: FPU
0: TTM0
[FPU] fp0 round, convert
17
3, 4, 7, 8
0: FPU
1: TTM0
[FPU] fp0 round, convert + fp1
round, convert
0
7
0: FPU
1: TTM0
[FPU] fp0 single precision
27
1, 2, 5, 6
0: FPU
2: TTM0
[FPU] fp0 single precision + fp1
single precision
32
5
0: FPU
2: TTM0
[FPU] fp0 square root
18
1, 2, 5, 6
0: FPU
0: TTM0
[FPU] fp0 square root + fp1
square root
0
6
0: FPU
0: TTM0
[FPU] fp0 stall 3
25
1, 2, 5, 6
0: FPU
2: TTM0
[FPU] fp0 stall 3 + fp1 stall 3
32
2
0: FPU
2: TTM0
[FPU] fp0 store
26
1, 2, 5, 6
0: FPU
2: TTM0
[FPU] fp0 store + fp1 store
32
6
0: FPU
2: TTM0
Retired Document | 2012-07-23 | Copyright © 2012 Apple Inc. All Rights Reserved.
283
PPC 970 (G5) Performance Counter Event List
Performance Counter Event
Event
PMC
TTM Mux
Byte Lane
Name
Number(s)
Number(s)
Number
Number
[FPU] fp1 add, mult, sub,
compare, fsel
23
1, 2, 5, 6
0: FPU
0: TTM0
[FPU] fp1 denorm operand
28
1, 2, 5, 6
0: FPU
2: TTM0
[FPU] fp1 divide
20
1, 2, 5, 6
0: FPU
0: TTM0
[FPU] fp1 estimate
22
3, 4, 7, 8
0: FPU
1: TTM0
[FPU] fp1 finished and produced
a result
23
3, 4, 7, 8
0: FPU
1: TTM0
[FPU] fp1 move, estimate
20
3, 4, 7, 8
0: FPU
1: TTM0
[FPU] fp1 mult-add
21
1, 2, 5, 6
0: FPU
0: TTM0
[FPU] fp1 round, convert
21
3, 4, 7, 8
0: FPU
1: TTM0
[FPU] fp1 single precision
31
1, 2, 5, 6
0: FPU
2: TTM0
[FPU] fp1 square root
22
1, 2, 5, 6
0: FPU
0: TTM0
[FPU] fp1 stall 3
29
1, 2, 6
0: FPU
2: TTM0
[FPU] fp1 store
30
1, 2, 5, 6
0: FPU
2: TTM0
[GPS] All CO state machines busy
28
1, 2, 5, 6
1: GPS
2: TTM1
[GPS] All read/claim state
machines busy
27
1, 2, 5, 6
1: GPS
2: TTM1
[GPS] All read/claim state
machines busy + I=1 store
queue full
32
5
1: GPS
2: TTM1
[GPS] All snoop state machines
busy
29
1, 2, 6
1: GPS
2: TTM1
[GPS] Cacheable store operation
(before gathering)
17
3, 4, 7, 8
1: GPS
1: TTM1
[GPS] Cacheable store operation
(before gathering) + Master L2
read transaction on bus was
retried
0
7
1: GPS
1: TTM1
Retired Document | 2012-07-23 | Copyright © 2012 Apple Inc. All Rights Reserved.
284
PPC 970 (G5) Performance Counter Event List
Performance Counter Event
Event
PMC
TTM Mux
Byte Lane
Name
Number(s)
Number(s)
Number
Number
[GPS] Cacheable store queue full
30
1, 2, 5, 6
1: GPS
2: TTM1
[GPS] I=1 load operation
completed on bus
16
3, 4, 7, 8
1: GPS
1: TTM1
[GPS] I=1 load operation
completed on bus + Master L2
store transaction on bus was
retried
0
8
1: GPS
1: TTM1
[GPS] I=1 store operation (before
gathering)
22
1, 2, 5, 6
1: GPS
0: TTM1
[GPS] I=1 store operation
completed on bus
23
1, 2, 5, 6
1: GPS
0: TTM1
[GPS] I=1 store queue full
31
1, 2, 5, 6
1: GPS
2: TTM1
[GPS] L2 access collision with L2
prefetch (DST)
16
1, 2, 5, 6
1: GPS
0: TTM1
[GPS] L2 access collision with L2
prefetch (DST) + L2 miss, bus
response is modified
intervention
0
1
1: GPS
0: TTM1
[GPS] L2 access collision with L2
prefetch (non-DST)
17
1, 2, 5, 6
1: GPS
0: TTM1
[GPS] L2 access collision with L2
prefetch (non-DST) + L2 miss,
bus response is shared
intervention
0
2
1: GPS
0: TTM1
[GPS] L2 access for store
18
1, 2, 5, 6
1: GPS
0: TTM1
[GPS] L2 access for store + I=1
store operation (before
gathering)
0
6
1: GPS
0: TTM1
[GPS] L2 miss on store access (R,
S, I)
19
1, 2, 5, 6
1: GPS
0: TTM1
Retired Document | 2012-07-23 | Copyright © 2012 Apple Inc. All Rights Reserved.
285
PPC 970 (G5) Performance Counter Event List
Performance Counter Event
Event
PMC
TTM Mux
Byte Lane
Name
Number(s)
Number(s)
Number
Number
[GPS] L2 miss on store access (R,
S, I) + I=1 store operation
completed on bus
0
5
1: GPS
0: TTM1
[GPS] L2 miss, bus response is
modified intervention
20
1, 2, 5, 6
1: GPS
0: TTM1
[GPS] L2 miss, bus response is
shared intervention
21
1, 2, 5, 6
1: GPS
0: TTM1
[GPS] Load or store dispatch
retries
26
1, 2, 5, 6
1: GPS
2: TTM1
[GPS] Load or store dispatch
retries + Cacheable store queue
full
32
6
1: GPS
2: TTM1
[GPS] Load or store dispatch
retries due to CO conflicts
24
1, 2, 5, 6
1: GPS
2: TTM1
[GPS] Load or store dispatch
retries due to CO conflicts + All
CO state machines busy
32
1
1: GPS
2: TTM1
[GPS] Load or store dispatch
retries due to Snoop conflicts
25
1, 2, 5, 6
1: GPS
2: TTM1
[GPS] Load or store dispatch
retries due to Snoop conflicts +
All snoop state machines busy
32
2
1: GPS
2: TTM1
[GPS] Master bus transactions
completed
18
3, 4, 7, 8
1: GPS
1: TTM1
[GPS] Master bus transactions
completed + Master SYNC
operation competed
0
3
1: GPS
1: TTM1
[GPS] Master bus transactions
retried
19
3, 4, 7, 8
1: GPS
1: TTM1
[GPS] Master bus transactions
retried + Master SYNC operation
retried
0
4
1: GPS
1: TTM1
Retired Document | 2012-07-23 | Copyright © 2012 Apple Inc. All Rights Reserved.
286
PPC 970 (G5) Performance Counter Event List
Performance Counter Event
Event
PMC
TTM Mux
Byte Lane
Name
Number(s)
Number(s)
Number
Number
[GPS] Master L2 read transaction
on bus was retried
21
3, 4, 7, 8
1: GPS
1: TTM1
[GPS] Master L2 store transaction
on bus was retried
20
3, 4, 7, 8
1: GPS
1: TTM1
[GPS] Master SYNC operation
competed
22
3, 4, 7, 8
1: GPS
1: TTM1
[GPS] Master SYNC operation
retried
23
3, 4, 7, 8
1: GPS
1: TTM1
[GPS] Snoop (external)
24
3, 4, 7, 8
1: GPS
3: TTM1
[GPS] Snoop (external) + Snoop
caused cache transition from M
to E or S
32
8
1: GPS
3: TTM1
[GPS] Snoop caused cache
transition from E or S to R or I
30
3, 4, 7, 8
1: GPS
3: TTM1
[GPS] Snoop caused cache
transition from E to S
29
3, 4, 7, 8
1: GPS
3: TTM1
[GPS] Snoop caused cache
transition from M to E or S
28
3, 4, 7, 8
1: GPS
3: TTM1
[GPS] Snoop caused cache
transition from M to I
31
3, 4, 7, 8
1: GPS
3: TTM1
[GPS] Snoop retried due to all
snoop state machines busy
27
3, 4, 7, 8
1: GPS
3: TTM1
[GPS] Snoop retried due to all
snoop state machines busy +
Snoop caused cache transition
from M to I
32
4
1: GPS
3: TTM1
[GPS] Snoop retried due to any
conflict
26
3, 4, 7, 8
1: GPS
3: TTM1
[GPS] Snoop retried due to any
conflict + Snoop caused cache
transition from E or S to R or I
32
3
1: GPS
3: TTM1
Retired Document | 2012-07-23 | Copyright © 2012 Apple Inc. All Rights Reserved.
287
PPC 970 (G5) Performance Counter Event List
Performance Counter Event
Event
PMC
TTM Mux
Byte Lane
Name
Number(s)
Number(s)
Number
Number
[GPS] Snoop state machine
dispatched
25
3, 4, 7, 8
1: GPS
3: TTM1
[GPS] Snoop state machine
dispatched + Snoop caused
cache transition from E to S
32
7
1: GPS
3: TTM1
[IDU] instruction queue fullness
16, 17, 18,
19, 20, 21,
22, 23, 16,
17, 18, 19,
20, 21, 22,
23, 16, 17,
18, 19, 20,
21, 22, 23,
16, 17, 18,
19, 20, 21,
22, 23
3, 4, 4, 4,
4, 4, 4, 4,
4, 7, 7, 7,
7, 7, 7, 7,
7, 8, 8, 8,
8, 8, 8, 8, 8
1: IDU
1: TTM1
[IDU] instruction queue fullness
+ instruction queue fullness
0
3, 4, 7, 8
1: IDU
1: TTM1
[IFU] branch execution issue
valid
25
3, 4, 7, 8
0: IFU
3: TTM0
[IFU] branch execution issue
valid + nothing
32
7
0: IFU
3: TTM0
[IFU] branch mispredict due to
CR value
26
3, 4, 7, 8
0: IFU
3: TTM0
[IFU] branch mispredict due to
CR value + nothing
32
3
0: IFU
3: TTM0
[IFU] branch mispredict due to
target address predict
24
3, 4, 7, 8
0: IFU
3: TTM0
[IFU] branch mispredict due to
target address predict + valid
instructions available, but ifu
held by BIQ or IDU
32
8
0: IFU
3: TTM0
[IFU] cycles i L1 write active
27
3, 4, 7, 8
0: IFU
3: TTM0
Retired Document | 2012-07-23 | Copyright © 2012 Apple Inc. All Rights Reserved.
288
PPC 970 (G5) Performance Counter Event List
Performance Counter Event
Event
PMC
TTM Mux
Byte Lane
Name
Number(s)
Number(s)
Number
Number
[IFU] cycles i L1 write active +
nothing
32
4
0: IFU
3: TTM0
[IFU] i cache data source
24, 25, 26,
27, 24, 25,
26, 27, 24,
25, 26, 27,
24, 25, 26,
27
1, 2, 2, 2,
2, 5, 5, 5,
5, 6, 6, 6, 6
0: IFU
2: TTM0
[IFU] i cache data source + instr
prefetch installed in prefetch
buffer
32
6
0: IFU
2: TTM0
[IFU] i cache data source +
instruction prefetch request
32
2
0: IFU
2: TTM0
[IFU] i cache data source +
translation written to i erat
32
5
0: IFU
2: TTM0
[IFU] i cache data source + valid
instruction available
32
1
0: IFU
2: TTM0
[IFU] instr prefetch installed in
prefetch buffer
30
1, 2, 5, 6
0: IFU
2: TTM0
[IFU] instruction prefetch
request
29
1, 2, 6
0: IFU
2: TTM0
[IFU] translation written to i erat
31
1, 2, 5, 6
0: IFU
2: TTM0
[IFU] valid instruction available
28
1, 2, 5, 6
0: IFU
2: TTM0
[IFU] valid instructions available,
but ifu held by BIQ or IDU
28
3, 4, 7, 8
0: IFU
3: TTM0
[ISU] br issue queue full
21
1, 2, 5, 6
0: ISU
0: TTM0
1: ISU
0: TTM1
0: ISU
0: TTM0
1: ISU
0: TTM1
[ISU] completion table full
16
1, 2, 5, 6
Retired Document | 2012-07-23 | Copyright © 2012 Apple Inc. All Rights Reserved.
289
PPC 970 (G5) Performance Counter Event List
Performance Counter Event
Event
PMC
TTM Mux
Byte Lane
Name
Number(s)
Number(s)
Number
Number
[ISU] completion table full + cr
mapper full
0
1
0: ISU
0: TTM0
1: ISU
0: TTM1
0: ISU
1: TTM0
1: ISU
1: TTM1
0: ISU
1: TTM0
1: ISU
1: TTM1
0: ISU
0: TTM0
1: ISU
0: TTM1
0: ISU
3: TTM0
1: ISU
3: TTM1
0: ISU
3: TTM0
1: ISU
3: TTM1
0: ISU
2: TTM0
1: ISU
2: TTM1
0: ISU
2: TTM0
1: ISU
2: TTM1
0: ISU
2: TTM0
1: ISU
2: TTM1
0: ISU
3: TTM0
1: ISU
3: TTM1
[ISU] cr issue queue full
[ISU] cr issue queue full + flush
originated by LSU
[ISU] cr mapper full
17
0
20
[ISU] dispatch blocked by
scoreboard
[ISU] dispatch blocked by
scoreboard + gpr mapper full
[ISU] dispatch reject
25
32
28
[ISU] dispatch valid
27
[ISU] dispatch valid + group
experienced a branch mispredict
[ISU] duration MSR(EE) = 0
32
27
3, 4, 7, 8
7
1, 2, 5, 6
3, 4, 7, 8
7
1, 2, 5, 6
1, 2, 5, 6
5
3, 4, 7, 8
Retired Document | 2012-07-23 | Copyright © 2012 Apple Inc. All Rights Reserved.
290
PPC 970 (G5) Performance Counter Event List
Performance Counter Event
Event
PMC
TTM Mux
Byte Lane
Name
Number(s)
Number(s)
Number
Number
[ISU] duration MSR(EE) = 0 +
MSR(EE)=0 and interrupt
pending
32
4
0: ISU
3: TTM0
1: ISU
3: TTM1
0: ISU
1: TTM0
1: ISU
1: TTM1
0: ISU
1: TTM0
1: ISU
1: TTM1
0: ISU
1: TTM0
1: ISU
1: TTM1
0: ISU
0: TTM0
1: ISU
0: TTM1
0: ISU
0: TTM0
1: ISU
0: TTM1
0: ISU
0: TTM0
1: ISU
0: TTM1
0: ISU
0: TTM0
1: ISU
0: TTM1
0: ISU
0: TTM0
1: ISU
0: TTM1
0: ISU
3: TTM0
1: ISU
3: TTM1
[ISU] flush (includes LSU, branch
mispredict)
[ISU] flush originated by branch
mispredict
[ISU] flush originated by LSU
[ISU] fp0 issue queue full
[ISU] fp0 issue queue full + fp1
issue queue full
[ISU] fp1 issue queue full
[ISU] fpr mapper full
23
22
21
19
0
23
17
[ISU] fpr mapper full + br issue
queue full
[ISU] fx0 produced a result
0
26
3, 4, 7, 8
3, 4, 7, 8
3, 4, 7, 8
1, 2, 5, 6
5
1, 2, 5, 6
1, 2, 5, 6
2
3, 4, 7, 8
Retired Document | 2012-07-23 | Copyright © 2012 Apple Inc. All Rights Reserved.
291
PPC 970 (G5) Performance Counter Event List
Performance Counter Event
Event
PMC
TTM Mux
Byte Lane
Name
Number(s)
Number(s)
Number
Number
[ISU] fx0 produced a result + fx1
produced a result
32
3
0: ISU
3: TTM0
1: ISU
3: TTM1
0: ISU
1: TTM0
1: ISU
1: TTM1
0: ISU
1: TTM0
1: ISU
1: TTM1
0: ISU
3: TTM0
1: ISU
3: TTM1
0: ISU
1: TTM0
1: ISU
1: TTM1
0: ISU
3: TTM0
1: ISU
3: TTM1
0: ISU
2: TTM0
1: ISU
2: TTM1
0: ISU
2: TTM0
1: ISU
2: TTM1
0: ISU
2: TTM0
1: ISU
2: TTM1
0: ISU
2: TTM0
[ISU] fx0/ls0 issue queue full
[ISU] fx0/ls0 issue queue full +
fx1/ls1 issue queue full
[ISU] fx1 produced a result
[ISU] fx1/ls1 issue queue full
[ISU] gpr mapper full
16
0
30
20
29
[ISU] group experienced a
branch mispredict
[ISU] group experienced a
branch redirect
[ISU] instructions dispatched
count
[ISU] instructions dispatched
count + dispatch reject
31
30
24, 25, 26,
24, 25, 26,
24, 25, 26,
24, 25, 26
32
3, 4, 7, 8
8
3, 4, 7, 8
3, 4, 7, 8
3, 4, 7, 8
1, 2, 5, 6
1, 2, 5, 6
1, 2, 2, 2,
5, 5, 5, 6,
6, 6
1
Retired Document | 2012-07-23 | Copyright © 2012 Apple Inc. All Rights Reserved.
292
PPC 970 (G5) Performance Counter Event List
Performance Counter Event
Event
PMC
TTM Mux
Byte Lane
Name
Number(s)
Number(s)
Number
Number
1: ISU
2: TTM1
0: ISU
2: TTM0
1: ISU
2: TTM1
0: ISU
2: TTM0
1: ISU
2: TTM1
0: ISU
0: TTM0
1: ISU
0: TTM1
0: ISU
1: TTM0
1: ISU
1: TTM1
0: ISU
1: TTM0
1: ISU
1: TTM1
0: ISU
3: TTM0
1: ISU
3: TTM1
0: ISU
1: TTM0
1: ISU
1: TTM1
0: ISU
1: TTM0
1: ISU
1: TTM1
0: ISU
0: TTM0
1: ISU
0: TTM1
0: ISU
0: TTM0
[ISU] instructions dispatched
count + group experienced a
branch redirect
[ISU] instructions dispatched
count + nothing
[ISU] lr/ctr mapper full
32
32
22
[ISU] LRQ full
18
[ISU] LRQ full + flush originated
by branch mispredict
[ISU] MSR(EE)=0 and interrupt
pending
[ISU] SRQ full
0
31
19
[ISU] SRQ full + flush (includes
LSU, branch mispredict)
[ISU] xer mapper full
0
18
[ISU] xer mapper full + lr/ctr
mapper full
0
6
2
1, 2, 5, 6
3, 4, 7, 8
3
3, 4, 7, 8
3, 4, 7, 8
4
1, 2, 5, 6
6
Retired Document | 2012-07-23 | Copyright © 2012 Apple Inc. All Rights Reserved.
293
PPC 970 (G5) Performance Counter Event List
Performance Counter Event
Event
PMC
TTM Mux
Byte Lane
Name
Number(s)
Number(s)
Number
Number
1: ISU
0: TTM1
[LSU0] d erat miss side 0
18
1, 2, 5, 6
0: LSU0
[LSU0] d erat miss side 0 + d erat
miss side 1
0
6
0: LSU0
[LSU0] d erat miss side 1
22
1, 2, 5, 6
0: LSU0
[LSU0] d slb miss
21
1, 2, 5, 6
0: LSU0
[LSU0] d tlb miss
20
1, 2, 5, 6
0: LSU0
[LSU0] fl pt load side 0
24
3, 4, 7, 8
3: LSU0
[LSU0] fl pt load side 0 + fl pt
load side 1
32
8
3: LSU0
[LSU0] fl pt load side 1
28
3, 4, 7, 8
3: LSU0
[LSU0] i slb miss
17
1, 2, 5, 6
0: LSU0
[LSU0] i slb miss + d slb miss
0
2
0: LSU0
[LSU0] i tlb miss
16
1, 2, 5, 6
0: LSU0
[LSU0] i tlb miss + d tlb miss
0
1
0: LSU0
[LSU0] L1 Prefetch
25
3, 4, 7, 8
3: LSU0
[LSU0] L1 Prefetch + SRQ sync
duration
32
7
3: LSU0
[LSU0] L2 Prefetch
27
3, 4, 7, 8
3: LSU0
[LSU0] L2 Prefetch + new stream
allocated
32
4
3: LSU0
[LSU0] larx executed 0
31
1, 2, 5, 6
2: LSU0
[LSU0] marked flush from LRQ
shl, lhl side 0
18
3, 4, 7, 8
1: LSU0
Retired Document | 2012-07-23 | Copyright © 2012 Apple Inc. All Rights Reserved.
294
PPC 970 (G5) Performance Counter Event List
Performance Counter Event
Event
PMC
TTM Mux
Byte Lane
Name
Number(s)
Number(s)
Number
Number
[LSU0] marked flush from LRQ
shl, lhl side 0 + marked flush
from LRQ shl, lhl side 1
0
3
1: LSU0
[LSU0] marked flush from LRQ
shl, lhl side 1
22
3, 4, 7, 8
1: LSU0
[LSU0] marked flush SRQ lhs side
0
19
3, 4, 7, 8
1: LSU0
[LSU0] marked flush SRQ lhs side
0 + marked flush SRQ lhs side 1
0
4
1: LSU0
[LSU0] marked flush SRQ lhs side
1
23
3, 4, 7, 8
1: LSU0
[LSU0] marked flush unaligned
load side 0
16
3, 4, 7, 8
1: LSU0
[LSU0] marked flush unaligned
load side 0 + marked flush
unaligned load side 1
0
8
1: LSU0
[LSU0] marked flush unaligned
load side 1
20
3, 4, 7, 8
1: LSU0
[LSU0] marked flush unaligned
store side 0
17
3, 4, 7, 8
1: LSU0
[LSU0] marked flush unaligned
store side 0 + marked flush
unaligned store side 1
0
7
1: LSU0
[LSU0] marked flush unaligned
store side 1
21
3, 4, 7, 8
1: LSU0
[LSU0] marked imr reload
26
1, 2, 5, 6
2: LSU0
[LSU0] marked imr reload +
marked stcx fail
32
6
2: LSU0
[LSU0] marked L1 d cache store
miss
27
1, 2, 5, 6
2: LSU0
Retired Document | 2012-07-23 | Copyright © 2012 Apple Inc. All Rights Reserved.
295
PPC 970 (G5) Performance Counter Event List
Performance Counter Event
Event
PMC
TTM Mux
Byte Lane
Name
Number(s)
Number(s)
Number
Number
[LSU0] marked L1 d cache store
miss + larx executed 0
32
5
2: LSU0
[LSU0] marked L1 dcache load
miss side 0
24
1, 2, 5, 6
2: LSU0
[LSU0] marked L1 dcache load
miss side 0 + marked L1 dcache
load miss side 1
32
1
2: LSU0
[LSU0] marked L1 dcache load
miss side 1
28
1, 2, 5, 6
2: LSU0
[LSU0] marked stcx fail
30
1, 2, 5, 6
2: LSU0
[LSU0] new stream allocated
31
3, 4, 7, 8
3: LSU0
[LSU0] out of streams
26
3, 4, 7, 8
3: LSU0
[LSU0] out of streams + reserved
32
3
3: LSU0
[LSU0] reserved
30
3, 4, 7, 8
3: LSU0
[LSU0] snoop tlbie
19
1, 2, 5, 6
0: LSU0
[LSU0] snoop tlbie + tablewalk
duration
0
5
0: LSU0
[LSU0] SRQ sync duration
29
3, 4, 7, 8
3: LSU0
[LSU0] stcx failed
25
1, 2, 5, 6
2: LSU0
[LSU0] stcx failed + stcx passed
32
2
2: LSU0
[LSU0] stcx passed
29
1, 2, 6
2: LSU0
[LSU0] tablewalk duration
23
1, 2, 5, 6
0: LSU0
[LSU1] flush from LRQ shl,lhl side
0
18
1, 2, 5, 6
3: LSU1 2|3
3: LSU1 2|7
3: LSU1 6|3
Retired Document | 2012-07-23 | Copyright © 2012 Apple Inc. All Rights Reserved.
296
0: LSU1
PPC 970 (G5) Performance Counter Event List
Performance Counter Event
Event
PMC
TTM Mux
Byte Lane
Name
Number(s)
Number(s)
Number
Number
3: LSU1 6|7
[LSU1] flush from LRQ shl,lhl side
0 + flush from LRQ shl,lhl side 1
0
6
3: LSU1 2|3
0: LSU1
3: LSU1 2|7
3: LSU1 6|3
3: LSU1 6|7
[LSU1] flush from LRQ shl,lhl side
1
22
1, 2, 5, 6
3: LSU1 2|3
0: LSU1
3: LSU1 2|7
3: LSU1 6|3
3: LSU1 6|7
[LSU1] flush SRQ lhs side 0
19
1, 2, 5, 6
3: LSU1 2|3
0: LSU1
3: LSU1 2|7
3: LSU1 6|3
3: LSU1 6|7
[LSU1] flush SRQ lhs side 0 +
flush SRQ lhs side 1
0
5
3: LSU1 2|3
0: LSU1
3: LSU1 2|7
3: LSU1 6|3
3: LSU1 6|7
[LSU1] flush SRQ lhs side 1
23
1, 2, 5, 6
3: LSU1 2|3
3: LSU1 2|7
3: LSU1 6|3
3: LSU1 6|7
Retired Document | 2012-07-23 | Copyright © 2012 Apple Inc. All Rights Reserved.
297
0: LSU1
PPC 970 (G5) Performance Counter Event List
Performance Counter Event
Event
PMC
TTM Mux
Byte Lane
Name
Number(s)
Number(s)
Number
Number
[LSU1] flush unaligned load side
0
16
1, 2, 5, 6
3: LSU1 2|3
0: LSU1
3: LSU1 2|7
3: LSU1 6|3
3: LSU1 6|7
[LSU1] flush unaligned load side
0 + flush unaligned load side 1
0
1
3: LSU1 2|3
0: LSU1
3: LSU1 2|7
3: LSU1 6|3
3: LSU1 6|7
[LSU1] flush unaligned load side
1
20
1, 2, 5, 6
3: LSU1 2|3
0: LSU1
3: LSU1 2|7
3: LSU1 6|3
3: LSU1 6|7
[LSU1] flush unaligned store side
0
17
1, 2, 5, 6
3: LSU1 2|3
0: LSU1
3: LSU1 2|7
3: LSU1 6|3
3: LSU1 6|7
[LSU1] flush unaligned store side
0 + flush unaligned store side 1
0
2
3: LSU1 2|3
3: LSU1 2|7
3: LSU1 6|3
3: LSU1 6|7
Retired Document | 2012-07-23 | Copyright © 2012 Apple Inc. All Rights Reserved.
298
0: LSU1
PPC 970 (G5) Performance Counter Event List
Performance Counter Event
Event
PMC
TTM Mux
Byte Lane
Name
Number(s)
Number(s)
Number
Number
[LSU1] flush unaligned store side
1
21
1, 2, 5, 6
3: LSU1 2|3
0: LSU1
3: LSU1 2|7
3: LSU1 6|3
3: LSU1 6|7
29
5
0: FPU
2: TTM0
0: ISU
0: IFU
0: VMX
1: IDU
2: TTM1
1: ISU
1: GPS
2: LSU0
3: LSU1 2|3
2: LSU1
3: LSU1 2|7
3: LSU1 6|3
3: LSU1 6|7
[LSU1] L1 d cache store miss
19
3, 4, 7, 8
3: LSU1 2|3
1: LSU1
3: LSU1 2|7
3: LSU1 6|3
3: LSU1 6|7
27
1, 2, 5, 6
3: LSU1 2|3
3: LSU1 2|7
Retired Document | 2012-07-23 | Copyright © 2012 Apple Inc. All Rights Reserved.
299
2: LSU1
PPC 970 (G5) Performance Counter Event List
Performance Counter Event
Event
PMC
TTM Mux
Byte Lane
Name
Number(s)
Number(s)
Number
Number
[LSU1] L1 d cache store miss +
L1 dcache entries invalidated
from L2
0
4
3: LSU1 2|3
1: LSU1
3: LSU1 2|7
3: LSU1 6|3
3: LSU1 6|7
[LSU1] L1 d cache store miss +
LSU ls1 reject
32
5
3: LSU1 2|3
2: LSU1
3: LSU1 2|7
[LSU1] L1 dcache entries
invalidated from L2
23
3, 4, 7, 8
3: LSU1 2|3
1: LSU1
3: LSU1 2|7
3: LSU1 6|3
3: LSU1 6|7
[LSU1] L1 dcache load miss side
0
18
3, 4, 7, 8
3: LSU1 2|3
1: LSU1
3: LSU1 2|7
3: LSU1 6|3
3: LSU1 6|7
[LSU1] L1 dcache load miss side
0 + L1 dcache load miss side 1
0
3
3: LSU1 2|3
1: LSU1
3: LSU1 2|7
3: LSU1 6|3
3: LSU1 6|7
[LSU1] L1 dcache load miss side
1
22
3, 4, 7, 8
3: LSU1 2|3
Retired Document | 2012-07-23 | Copyright © 2012 Apple Inc. All Rights Reserved.
300
1: LSU1
PPC 970 (G5) Performance Counter Event List
Performance Counter Event
Event
PMC
TTM Mux
Byte Lane
Name
Number(s)
Number(s)
Number
Number
3: LSU1 2|7
3: LSU1 6|3
3: LSU1 6|7
[LSU1] L1 dcache load side 0
16
3, 4, 7, 8
3: LSU1 2|3
1: LSU1
3: LSU1 2|7
3: LSU1 6|3
3: LSU1 6|7
[LSU1] L1 dcache load side 0 +
L1 dcache load side 1
0
8
3: LSU1 2|3
1: LSU1
3: LSU1 2|7
3: LSU1 6|3
3: LSU1 6|7
[LSU1] L1 dcache load side 1
20
3, 4, 7, 8
3: LSU1 2|3
1: LSU1
3: LSU1 2|7
3: LSU1 6|3
3: LSU1 6|7
[LSU1] L1 dcache store side 0
17
3, 4, 7, 8
3: LSU1 2|3
1: LSU1
3: LSU1 2|7
3: LSU1 6|3
3: LSU1 6|7
[LSU1] L1 dcache store side 0 +
L1 dcache store side 1
0
7
3: LSU1 2|3
3: LSU1 2|7
3: LSU1 6|3
3: LSU1 6|7
Retired Document | 2012-07-23 | Copyright © 2012 Apple Inc. All Rights Reserved.
301
1: LSU1
PPC 970 (G5) Performance Counter Event List
Performance Counter Event
Event
PMC
TTM Mux
Byte Lane
Name
Number(s)
Number(s)
Number
Number
[LSU1] L1 dcache store side 1
21
3, 4, 7, 8
3: LSU1 2|3
1: LSU1
3: LSU1 2|7
3: LSU1 6|3
3: LSU1 6|7
[LSU1] L1 reload data source
24, 25, 26,
27, 24, 25,
26, 27, 24,
25, 26, 27,
24, 25, 26,
27
3, 4, 4, 4,
4, 7, 7, 7,
7, 8, 8, 8, 8
3: LSU1 2|3
3: LSU1
3: LSU1 2|7
3: LSU1 6|3
3: LSU1 6|7
[LSU1] L1 reload data source +
L1 reload data valid
32
8
3: LSU1 2|3
3: LSU1
3: LSU1 6|3
[LSU1] L1 reload data source +
LMQ full
32
4
3: LSU1 2|3
3: LSU1
3: LSU1 6|3
[LSU1] L1 reload data source +
LMQ load hit reload merge
32
7
3: LSU1 2|7
3: LSU1
3: LSU1 6|7
[LSU1] L1 reload data source +
LMQ slot 0 allocated
32
3
3: LSU1 2|3
3: LSU1
3: LSU1 6|3
[LSU1] L1 reload data source +
LMQ slot 0 valid
32
7
3: LSU1 2|3
3: LSU1 6|3
Retired Document | 2012-07-23 | Copyright © 2012 Apple Inc. All Rights Reserved.
302
3: LSU1
PPC 970 (G5) Performance Counter Event List
Performance Counter Event
Event
PMC
TTM Mux
Byte Lane
Name
Number(s)
Number(s)
Number
Number
[LSU1] L1 reload data source +
Marked L1 reload data source
valid
32
8
3: LSU1 2|7
3: LSU1
3: LSU1 6|7
[LSU1] L1 reload data source +
Marked SRQ valid
32
3
3: LSU1 2|7
3: LSU1
3: LSU1 6|7
[LSU1] L1 reload data source +
nothing
32
4
3: LSU1 2|7
3: LSU1
3: LSU1 6|7
[LSU1] L1 reload data valid
28
3, 4, 7, 8
3: LSU1 2|3
3: LSU1
3: LSU1 6|3
[LSU1] LMQ full
31
3, 4, 7, 8
3: LSU1 2|3
3: LSU1
3: LSU1 6|3
[LSU1] LMQ load hit reload
merge
29
3, 4, 7, 8
3: LSU1 2|7
3: LSU1
3: LSU1 6|7
[LSU1] LMQ reject 0 - LMQ full
or missed data coming
25
1, 2, 5, 6
3: LSU1 6|3
2: LSU1
3: LSU1 6|7
[LSU1] LMQ reject 0 - LMQ full
or missed data coming + LMQ
reject 1- LMQ full or missed data
coming
32
2
3: LSU1 6|3
2: LSU1
3: LSU1 6|7
[LSU1] LMQ reject 1- LMQ full or
missed data coming
29
1, 2, 6
3: LSU1 6|3
3: LSU1 6|7
Retired Document | 2012-07-23 | Copyright © 2012 Apple Inc. All Rights Reserved.
303
2: LSU1
PPC 970 (G5) Performance Counter Event List
Performance Counter Event
Event
PMC
TTM Mux
Byte Lane
Name
Number(s)
Number(s)
Number
Number
[LSU1] LMQ slot 0 allocated
30
3, 4, 7, 8
3: LSU1 2|3
3: LSU1
3: LSU1 6|3
[LSU1] LMQ slot 0 valid
29
3, 4, 7, 8
3: LSU1 2|3
3: LSU1
3: LSU1 6|3
[LSU1] LRQ slot 0 allocated
30
1, 2, 5, 6
3: LSU1 2|3
2: LSU1
3: LSU1 2|7
[LSU1] LRQ slot 0 valid
26
1, 2, 5, 6
3: LSU1 2|3
2: LSU1
3: LSU1 2|7
[LSU1] LRQ slot 0 valid + LRQ
slot 0 allocated
32
6
3: LSU1 2|3
2: LSU1
3: LSU1 2|7
[LSU1] LS0 reject - erat miss.
27
1, 2, 5, 6
3: LSU1 6|3
2: LSU1
3: LSU1 6|7
[LSU1] LS0 reject - erat miss. +
LS1 reject - erat miss
32
5
3: LSU1 6|3
2: LSU1
3: LSU1 6|7
[LSU1] LS0 reject - reload cdf or
tag updata collision
26
1, 2, 5, 6
3: LSU1 6|3
2: LSU1
3: LSU1 6|7
[LSU1] LS0 reject - reload cdf or
tag updata collision + LS1 reject
- reload cdf or tag updata
collision
32
6
3: LSU1 6|3
2: LSU1
3: LSU1 6|7
[LSU1] LS1 reject - erat miss
31
1, 2, 5, 6
3: LSU1 6|3
3: LSU1 6|7
Retired Document | 2012-07-23 | Copyright © 2012 Apple Inc. All Rights Reserved.
304
2: LSU1
PPC 970 (G5) Performance Counter Event List
Performance Counter Event
Event
PMC
TTM Mux
Byte Lane
Name
Number(s)
Number(s)
Number
Number
[LSU1] LS1 reject - reload cdf or
tag updata collision
30
1, 2, 5, 6
3: LSU1 6|3
2: LSU1
3: LSU1 6|7
[LSU1] LSU ls1 reject
31
1, 2, 5, 6
3: LSU1 2|3
2: LSU1
3: LSU1 2|7
[LSU1] Marked L1 reload data
source valid
28
3, 4, 7, 8
3: LSU1 2|7
3: LSU1
3: LSU1 6|7
[LSU1] Marked SRQ valid
30
3, 4, 7, 8
3: LSU1 2|7
3: LSU1
3: LSU1 6|7
[LSU1] SRQ reject 0 - load hit
store
24
1, 2, 5, 6
3: LSU1 6|3
2: LSU1
3: LSU1 6|7
[LSU1] SRQ reject 0 - load hit
store + SRQ reject 1- load hit
store
32
1
3: LSU1 6|3
2: LSU1
3: LSU1 6|7
[LSU1] SRQ reject 1- load hit
store
28
1, 2, 5, 6
3: LSU1 6|3
2: LSU1
3: LSU1 6|7
[LSU1] SRQ slot 0 allocated
29
1, 2, 6
3: LSU1 2|3
2: LSU1
3: LSU1 2|7
[LSU1] SRQ slot 0 valid
25
1, 2, 5, 6
3: LSU1 2|3
2: LSU1
3: LSU1 2|7
[LSU1] SRQ slot 0 valid + SRQ
slot 0 allocated
32
2
3: LSU1 2|3
3: LSU1 2|7
Retired Document | 2012-07-23 | Copyright © 2012 Apple Inc. All Rights Reserved.
305
2: LSU1
PPC 970 (G5) Performance Counter Event List
Performance Counter Event
Event
PMC
TTM Mux
Byte Lane
Name
Number(s)
Number(s)
Number
Number
[LSU1] SRQ store forwarding side
0
24
1, 2, 5, 6
3: LSU1 2|3
2: LSU1
3: LSU1 2|7
[LSU1] SRQ store forwarding side
0 + SRQ store forwarding side 1
32
1
3: LSU1 2|3
2: LSU1
3: LSU1 2|7
[LSU1] SRQ store forwarding side
1
28
1, 2, 5, 6
3: LSU1 2|3
2: LSU1
3: LSU1 2|7
[SPECA] reserved
11
5
[SPECB] reserved
11
7
[SPECC] reserved
12
5
[SPECD] reserved
12
7
[VMX] ALU issue marked inst
18
1, 2, 5, 6
0: VMX
0: TTM0
[VMX] ALU issue marked inst +
Store issue marked inst
0
6
0: VMX
0: TTM0
[VMX] ALU issue queue full
16
1, 2, 5, 6
0: VMX
0: TTM0
[VMX] ALU issue queue full + Sat
zero to one
0
1
0: VMX
0: TTM0
[VMX] Denorm traps
19
3, 4, 7, 8
0: VMX
1: TTM0
[VMX] Denorm traps + nothing
0
4
0: VMX
1: TTM0
[VMX] finish contention cycle
21
3, 4, 7, 8
0: VMX
1: TTM0
[VMX] Finish with IMR
16
3, 4, 7, 8
0: VMX
1: TTM0
[VMX] Finish with IMR + Sat bit
set
0
8
0: VMX
1: TTM0
Retired Document | 2012-07-23 | Copyright © 2012 Apple Inc. All Rights Reserved.
306
PPC 970 (G5) Performance Counter Event List
Performance Counter Event
Event
PMC
TTM Mux
Byte Lane
Name
Number(s)
Number(s)
Number
Number
[VMX] forwarding occurred from
perm or alu or load
29
1, 2, 6
0: VMX
2: TTM0
[VMX] Generic forward
17
3, 4, 7, 8
0: VMX
1: TTM0
[VMX] Generic forward + finish
contention cycle
0
7
0: VMX
1: TTM0
[VMX] instruction finish with IMR
28
1, 2, 5, 6
0: VMX
2: TTM0
[VMX] issue valid
30
1, 2, 5, 6
0: VMX
2: TTM0
[VMX] Perm issue marked inst
19
1, 2, 5, 6
0: VMX
0: TTM0
[VMX] Perm issue marked inst +
nothing
0
5
0: VMX
0: TTM0
[VMX] Perm issue queue full
17
1, 2, 5, 6
0: VMX
0: TTM0
[VMX] Perm issue queue full +
VMX mapper full
0
2
0: VMX
0: TTM0
[VMX] Sat bit set
20
3, 4, 7, 8
0: VMX
1: TTM0
[VMX] Sat zero to one
20
1, 2, 5, 6
0: VMX
0: TTM0
[VMX] saturation count for valid
instruction
31
1, 2, 5, 6
0: VMX
2: TTM0
[VMX] Store issue marked inst
22
1, 2, 5, 6
0: VMX
0: TTM0
[VMX] VMA issue count
18
3, 4, 7, 8
0: VMX
1: TTM0
[VMX] VMA issue count +
nothing
0
3
0: VMX
1: TTM0
[VMX] VMX mapper full
21
1, 2, 5, 6
0: VMX
0: TTM0
BRU marked instr finish
5
2
Completion Stall by other reason
11
1
CPU Cycles
15
1, 2, 3, 4,
5, 6, 7, 8
CPU Cycles (hypervisor)
4
3
Retired Document | 2012-07-23 | Copyright © 2012 Apple Inc. All Rights Reserved.
307
PPC 970 (G5) Performance Counter Event List
Performance Counter Event
Event
PMC
TTM Mux
Byte Lane
Name
Number(s)
Number(s)
Number
Number
CPU Marked Instruction finish
5
4
Dispatch Successes
1
5
dL2 Hit (dL1 reload from L2)
7
1
3: LSU1
dL2 Miss (dL1 reload from
Memory)
7
3
3: LSU1
External Interrupt
2
8
FPU marked instruction finish
4
7
FXU Marked Instr finish
4
6
FXU0 busy and FXU1 busy
2
6
FXU0 busy and FXU1 idle
2
7
FXU0 Idle and FXU1 Busy
2
4
FXU0 idle and FXU1 idle
2
5
GCT Empty
4
1
GCT empty by SRQ full
11
2
Group Completed
3
7
Group Dispatch
4
2
Group Dispatch Reject
3
8
Group Marked in IDU
4
5
iL2 Hit (iL1 reload from L2)
6
1
0: IFU
2: TTM0
iL2 Miss (iL1 reload from
Memory)
6
3
0: IFU
2: TTM0
Instr Completed (ppc)
9
1, 2, 3, 4,
5, 6, 7, 8
Instr Completed (ppc,io,ld/st)
1
4, 6, 7, 8
Retired Document | 2012-07-23 | Copyright © 2012 Apple Inc. All Rights Reserved.
308
PPC 970 (G5) Performance Counter Event List
Performance Counter Event
Event
PMC
TTM Mux
Byte Lane
Name
Number(s)
Number(s)
Number
Number
Instr Src Encode 0 (Lane 2 not
set to IFU)
6
1
0: FPU
2: TTM0
0: ISU
0: VMX
0: FPU
2: TTM1
0: ISU
0: IFU
0: VMX
0: FPU
2: LSU0
0: ISU
0: IFU
0: VMX
0: FPU
2: LSU1
0: ISU
0: IFU
0: VMX
Instr Src Encode 1 (Lane 2 not
set to IFU)
6
2
0: FPU
2: TTM0
0: ISU
0: VMX
0: FPU
2: TTM1
0: ISU
0: IFU
0: VMX
0: FPU
Retired Document | 2012-07-23 | Copyright © 2012 Apple Inc. All Rights Reserved.
309
2: LSU0
PPC 970 (G5) Performance Counter Event List
Performance Counter Event
Event
PMC
TTM Mux
Byte Lane
Name
Number(s)
Number(s)
Number
Number
0: ISU
0: IFU
0: VMX
0: FPU
2: LSU1
0: ISU
0: IFU
0: VMX
Instr Src Encode 2 (Lane 2 not
set to IFU)
6
3
0: FPU
2: TTM0
0: ISU
0: VMX
0: FPU
2: TTM1
0: ISU
0: IFU
0: VMX
0: FPU
2: LSU0
0: ISU
0: IFU
0: VMX
0: FPU
0: ISU
0: IFU
0: VMX
Retired Document | 2012-07-23 | Copyright © 2012 Apple Inc. All Rights Reserved.
310
2: LSU1
PPC 970 (G5) Performance Counter Event List
Performance Counter Event
Event
PMC
TTM Mux
Byte Lane
Name
Number(s)
Number(s)
Number
Number
Instr Src Encode 3 (Lane 2 not
set to IFU)
6
4
0: FPU
2: TTM0
0: ISU
0: VMX
0: FPU
2: TTM1
0: ISU
0: IFU
0: VMX
0: FPU
2: LSU0
0: ISU
0: IFU
0: VMX
0: FPU
2: LSU1
0: ISU
0: IFU
0: VMX
Instr Src Encode 4 (Lane 2 not
set to IFU)
6
5
0: FPU
2: TTM0
0: ISU
0: VMX
0: FPU
2: TTM1
0: ISU
0: IFU
0: VMX
0: FPU
Retired Document | 2012-07-23 | Copyright © 2012 Apple Inc. All Rights Reserved.
311
2: LSU0
PPC 970 (G5) Performance Counter Event List
Performance Counter Event
Event
PMC
TTM Mux
Byte Lane
Name
Number(s)
Number(s)
Number
Number
0: ISU
0: IFU
0: VMX
0: FPU
2: LSU1
0: ISU
0: IFU
0: VMX
Instr Src Encode 5 (Lane 2 not
set to IFU)
6
6
0: FPU
2: TTM0
0: ISU
0: VMX
0: FPU
2: TTM1
0: ISU
0: IFU
0: VMX
0: FPU
2: LSU0
0: ISU
0: IFU
0: VMX
0: FPU
0: ISU
0: IFU
0: VMX
Retired Document | 2012-07-23 | Copyright © 2012 Apple Inc. All Rights Reserved.
312
2: LSU1
PPC 970 (G5) Performance Counter Event List
Performance Counter Event
Event
PMC
TTM Mux
Byte Lane
Name
Number(s)
Number(s)
Number
Number
Instr Src Encode 6 (Lane 2 not
set to IFU)
6
7
0: FPU
2: TTM0
0: ISU
0: VMX
0: FPU
2: TTM1
0: ISU
0: IFU
0: VMX
0: FPU
2: LSU0
0: ISU
0: IFU
0: VMX
0: FPU
2: LSU1
0: ISU
0: IFU
0: VMX
Instr Src Encode 7 (Lane 2 not
set to IFU)
6
8
0: FPU
2: TTM0
0: ISU
0: VMX
0: FPU
2: TTM1
0: ISU
0: IFU
0: VMX
0: FPU
Retired Document | 2012-07-23 | Copyright © 2012 Apple Inc. All Rights Reserved.
313
2: LSU0
PPC 970 (G5) Performance Counter Event List
Performance Counter Event
Event
PMC
TTM Mux
Byte Lane
Name
Number(s)
Number(s)
Number
Number
0: ISU
0: IFU
0: VMX
0: FPU
0: ISU
0: IFU
0: VMX
Instructions Completed
(ppc,io,ld/st)
1
1
LSU empty (LMQ and SRQ
empty)
2
2, 3
LSU Marked Instr finish
4
8
Marked Group complete
4
4
Marked Group Complete
Timeout
5
5
Marked group dispatch
2
1
Marked Group issued
5
6
Marked Instr finish in any unit
5
7
Marked store complete
3
1
Marked Store Complete w/int.
3
3
Marked Store sent to GPS
3
6
Nothing
8
1, 2, 3, 4,
5, 6, 7, 8
Overflow from PMC1
10
2
Overflow from PMC2
10
3
Retired Document | 2012-07-23 | Copyright © 2012 Apple Inc. All Rights Reserved.
314
2: LSU1
PPC 970 (G5) Performance Counter Event List
Performance Counter Event
Event
PMC
TTM Mux
Byte Lane
Name
Number(s)
Number(s)
Number
Number
Overflow from PMC3
10
4
Overflow from PMC4
10
5
Overflow from PMC5
10
6
Overflow from PMC6
10
7
Overflow from PMC7
10
8
Overflow from PMC8
10
1
Run Cycles
5
1
SRQ empty
3
4
Stop Completion
1
3
Threshold Timeout
3
2
Timebase Event
5
8
VMX Marked Instruction finish
5
3
Work Held
1
2
Retired Document | 2012-07-23 | Copyright © 2012 Apple Inc. All Rights Reserved.
315
UniNorth-2 (U1.5/2) Performance Counter Event
List
The U1.5 and U2 North bridge chipsets contain four independent counters, each of which can count any one
of 55 different types of events.
The table lists the events alphabetically by name, followed by the Event Number that must be selected to
activate counting of a particular event. Some of the events are suffixed with a term in braces at the end of the
event name. for example: If the term is [AGP], then the event can only occur if the AGP event source is active.
If an event has no suffix, it can be generated by any active event source. The events suffixed with [Bus] are
never generated by any of the sources, only by the front-side bus activities.
For more information, see U1.5/U2 North Bridges (page 222).
Performance Counter Event Name
Event Number
Addr-only Xacts Not Retried [Bus]
93
AGP R/W Hit Closed Page [AGP]
49
AGP R/W Hit Open Page [AGP]
48
AGP R/W Miss Open Page [AGP]
50, 100
AGP Read Hit Closed Page [AGP]
52
AGP Read Hit Open Page [AGP]
51
AGP Read Miss Open Page [AGP]
53, 101
All Xacts [Bus]
90
Burst Mem Reads [Bus]
88
Burst Mem Reqs [Bus]
77
Burst Mem Writes [Bus]
89
Burst PCI Reads [Bus]
84
Burst PCI Reqs [Bus]
76
Burst PCI Writes [Bus]
85
Retired Document | 2012-07-23 | Copyright © 2012 Apple Inc. All Rights Reserved.
316
UniNorth-2 (U1.5/2) Performance Counter Event List
Performance Counter Event Name
Event Number
Burst Read Reqs [Bus]
72
Burst Write Reqs [Bus]
73
Burst Xacts [Bus]
65
Cache Inhib. Xacts [Bus]
91
Cycles Addr Bus Busy [Bus]
94
Cycles Data Bus Busy [Bus]
95
MaxBus Cycles [---]
1
Mem Read Reqs [Bus]
80
Mem Requests [Bus]
67
Mem Write Reqs [Bus]
81
PCI Read Reqs [Bus]
78
PCI Requests [Bus]
66
PCI Write Reqs [Bus]
79
R/W Hit Closed Page [Mem]
17
R/W Hit Open Page [Mem]
16
R/W Miss Open Page [Mem]
18
R/W Miss Open page [Mem]
39
R/W Page Hit (LRU) [Mem]
28
R/W Page Hit (MRU) [Mem]
27
Read Hit Closed Page [Mem]
30
Read Hit Open Page [Mem]
29
Read Miss Open page [Mem]
40
Read Miss Open Page [Mem]
31
Read Prefetch Buff Hits [Mem]
99
Retired Document | 2012-07-23 | Copyright © 2012 Apple Inc. All Rights Reserved.
317
UniNorth-2 (U1.5/2) Performance Counter Event List
Performance Counter Event Name
Event Number
Read Prefetch Ops [Mem]
98
Read Xacts [Bus]
69
Retries on Maxbus [Bus]
97
Single Beat Mem Reads [Bus]
86
Single Beat Mem Reqs [Bus]
75
Single Beat Mem Writes [Bus]
87
Single Beat PCI Reads [Bus]
82
Single Beat PCI Reqs [Bus]
74
Single Beat PCI Writes [Bus]
83
Single Beat Read Reqs [Bus]
70
Single Beat Write Reqs [Bus]
71
Single Beat Xacts [Bus]
64
Sync/Eieio Not Retried [Bus]
92
UniN Retries on Maxbus [Bus]
96
Write Xacts [Bus]
68
Retired Document | 2012-07-23 | Copyright © 2012 Apple Inc. All Rights Reserved.
318
UniNorth-3 (U3) Performance Counter Event List
The U3 North bridge chipsets contain two distinct sets of counters.
The first set of counters counts memory events, in a manner similar to the counters for the other North bridge
chips. Six independent memory counters are present, each of which can count any one of five different general
types of events. Each of these types may be focused further by filtering events on the basis of their source I/O
interface (any combination of the nine independently selectable interfaces may be counted) and three memory
page states (for events involving DRAM interaction).
The second set of counters (“API counters”) count queueing and buffering events internal to the chip, allowing
a more detailed look at its inner workings. Six independent API counters are present, each of which can count
any one of six different general types of events. Each of these types may be focused further by filtering events
on the basis of their source queue/buffer (any one from among 51 possible sources).
The first of the three tables in this appendix lists the memory events alphabetically by name, followed by the
Event Number that needs to be selected to activate counting of a particular event. The second table does the
same for the API performance counters. Finally, the third table provides a list of the sources for API events and
their corresponding numbers.
For more information, see U3 North Bridge (page 223).
Memory Performance Counter Event Name
Event Number
Cycles 1 or more queues have 0 entries
8
Cycles 1 or more queues have 2 entries
16
DRAM Clock Cycles (no filters apply, 1/2 DDR freq.)
1
Nothing
0
Number of Memory Transactions
2
Read/write request beats (bytes=beats*16)
4
API Performance Counter Event Name
Event Number
Accumulate Queue Requests
0x02
Retired Document | 2012-07-23 | Copyright © 2012 Apple Inc. All Rights Reserved.
319
UniNorth-3 (U3) Performance Counter Event List
API Performance Counter Event Name
Event Number
API Cycles
0x00
Nothing
0xFF
Queue Reservations
0x03
Queue Transactions
0x01
Retries
0x05
Transaction Size (bytes)
0x04
API Event Source Name
Source Number
API0 Mem MI Target Rq Queue
0x1A
API0 Mem Rd Target Rq Queue
0x16
API0 Mem Wt Target Rq Queue
0x18
API1 Mem MI Target Rq Queue
0x1B
API1 Mem Rd Target Rq Queue
0x17
API1 Mem Wt Target Rq Queue
0x19
Command Slot
0x01
Ht Coh Rd Rq Queue
0x13
Ht Coh Wt Rq Queue
0x14
Ht Rd Data Queue
0x90
Ht Rd Target Rq Queue
0x09
Ht Response Queue
0x0E
Ht Wt Data Queue
0x40
Ht Wt Target Rq Queue
0x08
Intervention Queue
0x03
Master Tag: All
0xE00
Retired Document | 2012-07-23 | Copyright © 2012 Apple Inc. All Rights Reserved.
320
UniNorth-3 (U3) Performance Counter Event List
API Event Source Name
Source Number
Master Tag: API0
0x200
Master Tag: API0 and API1
0x400
Master Tag: API1
0x300
Master Tag: HT
0xA00
Master Tag: PCI
0x900
Master Tag: VSP
0x800
Master Tag: VSP, PCI, and HT
0xC00
Mem Rd Data Queue
0x70
Mem Rd Target Rq Queue
0x05
Mem Response Queue
0x0C
Mem Wt Data Queue
0x20
Mem Wt Target Rq Queue
0x04
Pci Coh Rd Rq Queue
0x11
Pci Coh Wt Rq Queue
0x12
Pci Rd Data Queue
0x80
Pci Rd Target Rq Queue
0x07
Pci Response Queue
0x0D
Pci Wt Data Queue
0x30
Pci Wt Target Rq Queue
0x06
Reg Rd Data Queue
0xB0
Reg Response Queue
0x10
Reg Target Rq Queue
0x0B
Reg Wt Data Queue
0x60
Snoop Slots
0x02
Retired Document | 2012-07-23 | Copyright © 2012 Apple Inc. All Rights Reserved.
321
UniNorth-3 (U3) Performance Counter Event List
API Event Source Name
Source Number
Synchronization Queue
0x00
Vsp Coh Rd Rq Queue
0x15
Vsp Rd Data Queue
0xA0
Vsp Response Queue
0x0F
Vsp Target Rq Queue
0x0A
Vsp Wt Data Queue
0x50
Write Data Buffer
0x100
Write Data Buffer API0 MI
0x130
Write Data Buffer API0 Wr
0x110
Write Data Buffer API1 MI
0x140
Write Data Buffer API1 Wr
0x120
Retired Document | 2012-07-23 | Copyright © 2012 Apple Inc. All Rights Reserved.
322
Kodiak (U4) Performance Counter Event List
The U4/Kodiak North bridge chipsets contain two distinct sets of counters.
The first set of counters counts memory events, in a manner similar to the counters for the other North bridge
chips. Six independent memory counters are present, each of which can count any one of 22 different general
types of events. Each of these types may be focused further by filtering events on the basis of their source
interface (any combination of the seven independently selectable sources may be counted).
The second set of counters (“API counters”) count queueing and buffering events internal to the chip, allowing
a more detailed look at its inner workings. Six independent API counters are present, each of which can count
any one of six different general types of events. Each of these types may be focused further by filtering events
on the basis of their source queue/buffer (any one from among 33 possible sources) and source I/O interface
(any combination of the six independently selectable interfaces may be counted simultaneously).
The first of the three tables in this appendix lists the memory events alphabetically by name, followed by the
Event Number that needs to be selected to activate counting of a particular event. The second table does the
same for the API performance counters. Finally, the third table provides a list of the sources for API events and
their corresponding numbers.
For more information, see U4 (Kodiak) North Bridge (page 226).
Memory Performance Counter Event Name
Event Number
Activate commands -- open page (filtered and counted)
7
Bottom entry aged (count events, no filters)
64
Cache line sized transfers -- 128 bytes (filtered and counted)
3
Commands with auto-precharge enabled (filtered and counted)
5
Conflict detected in oldest read reorder queue (count events, no filters)
32
DRAM Cycle Count (1/2 DDR frequency, no filters)
255
Entries in non-coherent request queue (accumulate events, no filters)
113
Entries in read reorder queue (accumulate events, no filters)
81
Entries in write reorder queue (accumulate events, no filters)
80
Retired Document | 2012-07-23 | Copyright © 2012 Apple Inc. All Rights Reserved.
323
Kodiak (U4) Performance Counter Event List
Memory Performance Counter Event Name
Event Number
Issued transfer size (accumulate events, no filters)
83
Non-coherent read request [RT #24253] (count events, no filters)
97
Non-coherent request [RT #24252] (count events, no filters)
96
Nothing
0
Precharge commands -- close page (filtered and counted)
6
Read reorder queue empty (count events, no filters)
17
Read requests (filtered and counted)
1
Request queue empty [RT #23441] (count events, no filters)
16
Requested transfer size (accumulate events, no filters)
82
Requested transfer size from non-coherent queue (accumulate events, no filters)
112
RMW transfers (filtered and counted)
4
Write high watermark reached (count events, no filters)
48
Write reorder queue empty (count events, no filters)
18
Write requests (filtered and counted)
2
API Performance Counter Event Name
Event Number
Accumulate Queue Requests
0x02
API Cycles
0x00
Nothing
0xFF
Queue Reservations
0x03
Queue Transactions
0x01
Retries
0x05
Transaction Size (bytes)
0x04
Retired Document | 2012-07-23 | Copyright © 2012 Apple Inc. All Rights Reserved.
324
Kodiak (U4) Performance Counter Event List
API Event Source Name
Source Number
API Wt Data Buffer
0x28
Bypass Queue
0x10
Command Slot
0x01
GCR Rd Data Queue
0x27
GCR Response Queue
0x0B
GCR Target Rq Queue
0x08
GCR Wt Data Queue
0x23
Ht Coh Rd Pending Queue
0x14
Ht Coh Rd Rq Queue
0x0E
Ht Coh Wt Pending Queue
0x15
Ht Coh Wt Rq Queue
0x0F
Ht Rd Data Queue
0x26
Ht Rd Target Rq Queue
0x07
Ht Response Queue
0x0A
Ht Wt Data Queue
0x22
Ht Wt Target Rq Queue
0x06
Intervention Buffer
0x29
Memory Rd Buffer (NI)
0x2A
Memory Request Queue
0x11
Memory Response Buffer
0x20
Memory Wt Data Buffer
0x24
PCIE Coh Rd Pending Queue
0x12
PCIE Coh Rd Rq Queue
0x0C
PCIE Coh Wt Pending Queue
0x13
Retired Document | 2012-07-23 | Copyright © 2012 Apple Inc. All Rights Reserved.
325
Kodiak (U4) Performance Counter Event List
API Event Source Name
Source Number
PCIE Coh Wt Rq Queue
0x0D
PCIE Rd Data Queue
0x25
PCIE Rd Target Rq Queue
0x05
PCIE Response Queue
0x09
PCIE Wt Data Queue
0x21
PCIE Wt Target Rq Queue
0x04
Power Management
0x3F
Snoop Slots
0x02
Synchronization Queue
0x00
Retired Document | 2012-07-23 | Copyright © 2012 Apple Inc. All Rights Reserved.
326
ARM11 Performance Counter Event List
The ARM11 cores used in iOS devices contain three independent performance counters. The first counter can
count only cycle counts, while the other two (which are identical) can count 25 different types of events.
The table below lists each Event Name, the counter (PMC) number(s) for counters which can count the event,
and each event’s number.
For more information on how to configure these counters, see ARM11 CPU Performance Counter
Configuration (page 229).
Performance Counter Event Name
PMC Number(s)
Event Number
Branch instruction executed
2-3
5
Branch mispredicted
2-3
6
Cycle Count
1,2-3
0,255
Data cache access, no cache operations (cacheable accesses
only)
2-3
9
Data cache access, no cache operations
2-3
10
Data cache miss, no cache operations
2-3
11
Data cache writeback per 4 words
2-3
12
Data MicroTLB miss
2-3
4
ETMEXTOUT[0,1] asserts
2-3
34
ETMEXTOUT[0] asserts
2-3
32
ETMEXTOUT[1] asserts
2-3
33
Explicit external data access
2-3
16
Instruction cache miss requires fetch
2-3
0
Instruction executed
2-3
7
Instruction MicroTLB miss
2-3
3
Retired Document | 2012-07-23 | Copyright © 2012 Apple Inc. All Rights Reserved.
327
ARM11 Performance Counter Event List
Performance Counter Event Name
PMC Number(s)
Event Number
Main TLB miss
2-3
15
Procedure call instruction executed
2-3
35
Procedure return instruction executed, return address predicted
incorrectly
2-3
38
Procedure return instruction executed, return address predicted
2-3
37
Procedure return instruction executed
2-3
36
Software changed the PC
2-3
13
Stall, data dependency
2-3
2
Stall, instruction buffer cannot deliver
2-3
1
Stall, LSU request queue full
2-3
17
Write buffer drained count
2-3
18
Retired Document | 2012-07-23 | Copyright © 2012 Apple Inc. All Rights Reserved.
328
Document Revision History
This table describes the changes to Shark User Guide .
Date
Notes
2008-04-14
TBD
2007-10-31
New document that explains how to analyze code performance by profiling
the system.
Retired Document | 2012-07-23 | Copyright © 2012 Apple Inc. All Rights Reserved.
329
Apple Inc.
Copyright © 2012 Apple Inc.
All rights reserved.
No part of this publication may be reproduced,
stored in a retrieval system, or transmitted, in any
form or by any means, mechanical, electronic,
photocopying, recording, or otherwise, without
prior written permission of Apple Inc., with the
following exceptions: Any person is hereby
authorized to store documentation on a single
computer or device for personal use only and to
print copies of documentation for personal use
provided that the documentation contains
Apple’s copyright notice.
No licenses, express or implied, are granted with
respect to any of the technology described in this
document. Apple retains all intellectual property
rights associated with the technology described
in this document. This document is intended to
assist application developers to develop
applications only for Apple-branded products.
Apple Inc.
1 Infinite Loop
Cupertino, CA 95014
408-996-1010
Apple, the Apple logo, Bonjour, eMac, Finder,
FireWire, iPhone, iPod, Mac, Mac OS, Mac Pro,
Macintosh, Numbers, Objective-C, OS X, Pages,
Quartz, Safari, and Xcode are trademarks of Apple
Inc., registered in the U.S. and other countries.
.Mac is a service mark of Apple Inc., registered in
the U.S. and other countries.
DEC is a trademark of Digital Equipment
Corporation.
IOS is a trademark or registered trademark of
Cisco in the U.S. and other countries and is used
under license.
Intel and Intel Core are registered trademarks of
Intel Corporation or its subsidiaries in the United
States and other countries.
Java is a registered trademark of Oracle and/or
its affiliates.
MMX is a trademark of Intel Corporation or its
subsidiaries in the United States and other
countries.
OpenGL is a registered trademark of Silicon
Graphics, Inc.
PowerPC and the PowerPC logo are trademarks
of International Business Machines Corporation,
used under license therefrom.
SPEC is a registered trademark of the Standard
Performance Evaluation Corporation (SPEC).
UNIX is a registered trademark of The Open
Group.
APPLE MAKES NO WARRANTY OR REPRESENTATION,
EITHER EXPRESS OR IMPLIED, WITH RESPECT TO THIS
DOCUMENT, ITS QUALITY, ACCURACY,
MERCHANTABILITY, OR FITNESS FOR A PARTICULAR
PURPOSE. AS A RESULT, THIS DOCUMENT IS PROVIDED
“AS IS,” AND YOU, THE READER, ARE ASSUMING THE
ENTIRE RISK AS TO ITS QUALITY AND ACCURACY.
IN NO EVENT WILL APPLE BE LIABLE FOR DIRECT,
INDIRECT, SPECIAL, INCIDENTAL, OR CONSEQUENTIAL
DAMAGES RESULTING FROM ANY DEFECT, ERROR OR
INACCURACY IN THIS DOCUMENT, even if advised of
the possibility of such damages.
Some jurisdictions do not allow the exclusion of
implied warranties or liability, so the above exclusion
may not apply to you.