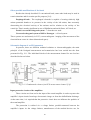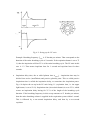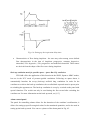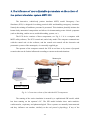
1
Experimental tasks within the environment of an ICU simulated site Bc. Ondřej Čadek, Ing. Richard Grünes, Ph.D., Ing. Petr Kudrna, Ing. Roman Matějka, Ing. Martin Rožánek, Ph.D., Ing. Jan Suchomel (z českého originálu přeložila Progress Language Institute s.r.o.) Czech Technical University in Prague Faculty of Biomedical Engineering Experimental tasks within the environment of an ICU simulated site Bc. Ondřej Čadek, Ing. Richard Grünes, Ph.D., Ing. Petr Kudrna, Ing. Roman Matějka, Ing. Martin Rožánek, Ph.D., Ing. Jan Suchomel 2012 Czech Technical University in Prague (ČVUT v Praze) Reviewed by: Ing. Jakub Ráfl Česká technika - publishing house of the Czech Technical University in Prague (ČVUT) calls the authors’ attention to adhering to the copyright. The author is responsible for language and material correctness of the contents. The text has not been subject to language or text proofreading. ©Ondřej Čadek, Richard Grünes, Petr Kudrna, Roman Matějka, Martin Rožánek, Jan Suchomel, 2012 ISBN 978-80-XX-XXXX-X Acknowledgements: This publication was supported by the European social fund within the framework of realizing the project „Modernisation of teaching methods and improvement practical skills and habits of students in Biomedical technician branch“, CZ.1.07/2.2.00/15.0415. Period of the project’s realization 11/10/2010 - 28/02/2013. Table of contents Introduction ............................................................................................................................................. 5 1. Principles and applications of tonometers ........................................................................................... 7 2. Principles and applications of electrocardiographs ........................................................................... 16 3. Principles and applications of defibrillators ...................................................................................... 33 4. Principles and applications of pulse oxymeters................................................................................. 45 5. Principles and application of infusion pumps and linear infusion pumps ......................................... 55 6. Using the patient simulator and breathing simulators in the area of ventilation technology............. 67 7. Principles and application of electrosurgical apparatus .................................................................... 83 8. Principles and applications of the vital functions monitors ............................................................... 96 9. The influence of user-adjustable parameters on the action of the patient simulator system METI ECS...................................................................................................................................................... 103 Introduction Dear students, dear readers, you are now holding a coursebook dealing with the problem of laboratory practical trainings in the course Medical apparatus and devices at the Faculty of Biomedical Engineering of the Czech Technical University in Prague (FBMI ČVUT). However, the coursebook is suitable for other subjects as well, both at the FBMI ČVUT and at other faculties of ČVUT dealing with medical instrumentation or using it. The coursebook has been created as a universal set of groundwork for laboratory tasks in the field of medical devices and instrumentation, and may be used in a number of other subjects, as well, such as Special instrumentation in anaesthesiology and resuscitation care (Equipments for Anaesthesiology and Resuscitation), Medical devices survey, Human biosystem (biotransport), etc. The aim of the authors was to create a coursebook which would not grow obsolete too fast, and therefore there are usually no particular descriptions of the apparatus, unless the apparatus forms the core of the task and is not only designed for teaching. Therefore in several tasks, it is also necessary to work with the operations manual, just like in practice, when the biomedical technician comes into contact with new apparatus. The tasks cover a wide sphere of medical devices and instrumentation from tonometers, electrocardiographs and defibrillators, past linear infusion pumps (syringe), all the way to artificial lung ventilation and vital signs monitors. The coursebook is completed with a task combining medicine with technical sciences. The tasks are focused in a highly practical way, so that students can try to work with the individual instruments and devices in each of them and gain practical skills and wide overview in the field of medical devices and instrumentation. While preparing the coursebook, the above mentioned group of teachers within ČVUT and outside of ČVUT used several years of experience in teaching these issues. This coursebook presents a specific result of the FBMI efforts to improve and extend high quality laboratory equipment, both for studies and for research. For this purpose, FBMI cooperates with many external professionals and companies. That should eventually bring characteristic features in teaching, which can be found in real practice. In result it contributes to better assertion of the graduates in these fields in practice. This also corresponds to our effort to support this strive via different projects, also including projects financed from the EU European Structural Funds and from the Czech 5 national budget. And this part has been issued thanks to this support, namely by means of the authors’ fees being paid from the above mentioned projects. To conclude with, please allow us to express our thanks to all those who participated in preparing the coursebook, and to express our belief that the educational text will contribute to better understanding of the issues taught and also to greater interest in the field which by all means is very interesting, far-reaching and also very quickly developing. 6 1. Principles and applications of tonometers Theoretical introduction Measuring the blood pressure in a non-invasive way is a common routine in diagnosing the patient’s health status. Knowing the current, as well as long-term values of the patient’s blood pressure may reveal even severe diseases. Timely diagnosis and treatment can also save the patient’s life. Unlike the invasive measurements, it is utterly painless, does not require insertion of any catheters or cannulas, and today it is rather common to measure one’s blood pressure at home, thanks to fully automated instruments. On the other hand, this type of measurement is less accurate than the invasive type. Blood pressure As it was already mentioned above, blood pressure value is one of the common indicators that can reveal also severe or life threatening conditions. This coursebook was not designed to make the students perfectly acquainted with all the pathological conditions related to blood pressure. Yet it is certainly useful to at least summarize the basics. Blood pressure in general is the pressure exerted on the vascular walls during the blood transport in the circulation system. Systolic and diastolic pressure is monitored. Systolic pressure is maximum pressure in the arteries during the cardiac cycle. When the heart thrusts blood in the arteries, it is followed by a fast increase of pressure, which then slowly decreases until the heart contracts again. Diastolic pressure - the lowest pressure - just before the blood is thrusted in the arteries. Common blood pressure value is 120/80 Torr or mmHg (a unit to be described later on). This expression is a standard record, which in the first number indicates the systolic pressure value, and in the second the diastolic pressure value. These values may vary in healthy people exercising different activities; lower values are recorded at rest, higher values during e.g. physical activity. These short-term changes are not serious and are rather common. On the other hand, long-term deviation from these values may indicate a pathological condition. In general, pressures lower than the standard values are marked as hypotension. The values in this case remain below 100/65. This condition is often accompanied by overall fatigue, sleepiness, headaches, dizziness, insufficient blood circulation in the limbs. Another extreme is represented by higher pressure values, collectively marked as hypertension. These pressures exceed the values of 140/90. High values may present direct threat to the patient’s life. 7 Apparatus for blood pressure measurements The basic concept of blood pressure measurements has remained the same from historical apparatus to the new automatic systems. The entire set consists of a sleeve to be placed above the patient’s elbow, or eventually on the thigh or the wrist, of a pressure gauge (a manometer or an electronic pressure sensor), of a balloon with air relief valve, or of a compressor for inflating the sleeve; in the electronic systems eventually also of electronic circuits guaranteeing the running of the gauge and the safety valves and escape valves, which deflate the sleeve quickly after the measurement. The original tonometers, or else the mercury tonometers, only contained the bare elements for the measurement itself, namely: pressure sleeve (cuff), inflatable balloon with an air relief valve, and a manometer in the form of a mercury column in a tube. Mercury was selected rather intentionally, as it kept its physical properties over time (density, viscosity, surface tension). The principle of such measurement is very simple. Think of an U-shaped tube, which is partially filled with mercury in accordance with the function (1.1), where p is hydrostatic pressure, h is height of the column, g is gravitation constant of normal gravitational acceleration, and ρ is density of the substance. p = h.ρ .g (1.1) Establishing this function gives us the result that 1 mm of mercury column corresponds to the pressure of 133.322 Pa. Of course in the technical practice the unit Pa is more common, or eventually its multiples kPa, MPa, but in case of blood pressure, the description uses millimetres of mercury column, also marked as Torr. This mark was named after the Italian physicist J. E. Torricelli. Yet let’s return to the tonometers. These mercury tonometers were, and even today still are considered as the golden standard. They are stable over time, they are easy to use, but mercury presents a problem due to its toxicity. They are therefore replaced by other types of apparatus. Mercury tonometer is depicted in Figure 1.1. Among other types of instruments, quite commonly used, there are the so called aneroid tonometers. The arrangement is identical to the mercury tonometers, but mercury column is not used for the pressure measurement. A manometer is used in this case, with a deformation spring. There is a disadvantage compared to mercury, and it is the fact that the 8 spring changes its qualities over time, and so these instruments are less accurate on a longterm basis. This type of apparatus is depicted in Figure 1.2. Fig. 1.1: Standard mercury tonometer in a metal case with connected sleeve (cuff) and a balloon with air relief valve. Fig. 1.2: Aneroid pressure gauge, in which the mercury manometer was replaced by a spring watch manometer, again the sleeve (cuff) is connected. 9 The efforts to replace mercury but to keep a similar design lead to the introduction of so called pseudo-mercury tonometers. These are electronic tonometers, which do not have autonomous evaluation algorithms, but they only depict the value of the current pressure on a display or within a column of luminous diodes. This apparatus is depicted in Fig. 1.3. Fig. 1.3: Digital pseudo-mercury tonometer, in which the mercury manometer was replaced by digital imaging element, again with connected sleeve (cuff) with a ball. Nearly the most common type today, which even ordinary people can come across, is the electronic, automatic tonometer. These tonometers do not contain a mechanical element for the pressure measuring, but they are equipped with an electronic pressure sensor, just like the pseudo-mercury tonometers. They also have their own system for inflating the sleeve (cuff), realized via a compressor and electronically controlled air relief valves. The electronics inside guarantees overall measurement and evaluation of blood pressure, allows for the record of profiles, and often also depicts trends, etc. These systems are at a very high level in terms of user comfort, and we can say that all you need to do to measure is push the start button. This apparatus is depicted in Fig. 1.4. Blood pressure measurement The actual measurement of blood pressure can be realized via several methods. For the mercury and aneroid tonometers, there are two methods utilizable in practice - the palpation method and the auscultation method. Before we start describing these methods, however, let’s consider an essential fact which takes place during the measurement. Inflating the sleeve (cuff) above a certain level of pressure (systolic pressure) causes constriction of the blood 10 circulation within the artery above which the pressure sleeve (cuff) is placed. By gradual reduction of pressure in the sleeve (cuff), the circulation in this artery is restored and the values of blood pressure can be set by monitoring changes. Fig. 1.4: Digital automatic tonometers The palpation method is very simple and only allows for determining the value of the systolic pressure. We place the sleeve (cuff) on the arm and inflate this sleeve (cuff) above the value of the systolic pressure, which causes the constriction of the brachial artery. We press the ball of the finger above the radial artery, just like in case we want to detect pulse. We gradually deflate the sleeve (cuff) and in the moment we feel the first signs of pulse, we get the value of the systolic pressure. The auscultation method represents the second method for blood pressure measurements. It is measured via classical tonometers. Again, we place the sleeve (cuff) on the arm and inflate it, thus causing the constriction of the brachial artery, but this time, we will also need a stethoscope. We place the stethoscope in the bend of the elbow, and by gradual reduction of pressure in the sleeve (cuff), the brachial artery is released and the blood can circulate again. The partial restoration of circulation through the artery, yet still decreased by partial constriction, will allow for the hearing of the so called Korotkov murmurs (phenomenons). Upon the first echo of these murmurs, we take the currently taken value as the systolic pressure value. By further decreasing of the pressure in the sleeve, the artery 11 becomes fully transitory again, and the Korotkov murmurs fade away. At this moment, we read the current pressure value, and it is the diastolic pressure value. General legislation regarding tonometers Validation of tonometers abides by Law No. 505/1990 Coll., as amended by No. 119/2000 Coll. and subsequent modifications by Law No. 137/2002 Coll. According to the public notice (decree) No. 345/2002 Coll., tonometer is an assigned gauge subject to validation after every two years. Periodic revisions of medical devices (including tonometers) - electric and non-electric medical devices - are given by Law No. 123/2000 Coll., as amended by No. 130/2003 Coll., and subsequently modified by Law No. 346/2003 Coll. At first, revisional inspections were carried out by the manufacturer or the service organizations providing for repairs of medical devices. The organizations carried out the revisional inspections within the framework of their trade licence for “manufacturing and repairs of medical apparatus” and after passing an examination according to public notice (decree) No. 50/1978 Coll. Current legal state clearly defines the rules of who and under what conditions can carry out the revisional inspections. This issue is regulated by Law No. 124/2000 Coll. and by amended standards ČSN EN 60601-1-2 and ČSN EN 62 353. State Office for Drug Control (SÚKL) in Prague, General Health Insurance Company (VZP), Czech Metrological Institute (ČMI) and Czech Commercial Inspection (ČOI) are entitled to carry out inspections, together with the State Office for Labour Inspections (since 2005) in Prague. At present, the revisional inspections can only be carried out by a person with authorization granted by the Institute of Technical Inspection (ITI) in Prague for carrying out this type of work, on the basis of which a trade licence was issued for such person for assembly, repairs, revisions and inspections of assigned devices. The actual revisional inspection may only be carried out by a natural person with a state examination passed at ITI Prague and with a certificate of a revisional technician. The aim and the contents of the measurements The aim of the measurement will be to verify the accuracy of tonometers with different principles and construction. In classical mercury, pseudo-mercury and aneroid tonometers, it will be followed by the formation of a calibration curve based on the measured deviations compared to standardized gauges (NIBP simulator). In automatic and semiautomatic gauges, only the accuracy dedicated by the manufacturer regarding pressure and 12 pulse measurement will be verified in three particular simulated situations via the NIBP simulator. Measurement tasks 1) Carry out measurement of pressure deviations in mercury tonometer for 5 values of pressure and record them in a chart; create the correction curve. 2) Carry out measurement of pressure deviations in pointer-type tonometer for 5 values of pressure and record them in a chart; create the correction curve. 3) Carry out measurement of pressure deviations in pseudo-mercury tonometer for 5 values of pressure and record them in a chart; create the correction curve. 4) Verify accuracy of digital automatic tonometer in three pressure situations and confirm whether it is in conformity with the accuracy given by the manufacturer. 5) Verify accuracy of digital semi-automatic tonometer in three pressure situations and confirm whether it is in conformity with the accuracy given by the manufacturer. 6) Carry out pressure measurement via the palpation, auscultation methods and via automatic tonometer and compare the individual results. Apparatus and aids used • Pressure simulator BC Biomedical NIBP-1010 + accessories • Ball with air relief valve • mercury tonometer • Aneroid-deformation (watch-type) tonometer • Pseudo-mercury tonometer • Semi-automatic digital tonometer • Automatic digital tonometer Measurement procedure First of all, set up the measurement apparatus. That consists of a tested tonometer, pressure source in manual and semi-automatic tonometers (ball with air relief valve), and the NIBP-1010 simulator. When connecting the pneumatic parts, use suitable connector terminals from the NIBP-1010 simulator’s accessories. See the schematic draft of the measurement apparatus on p. 16, Chapter OPERATIONS in the simulator’s user manual, please see [1.7]. 13 For points 1), 2), and 3), the measurement procedure is the same. In mercury tonometer, do not forget to open the transport valve prior to the actual measurement, and to close this valve again after the measurement. After setting up the measurement apparatus, turn on the NIBP-1010 simulator and set up the pressure measurement node to “MANOMETER” and proceed in accordance with the user manual, Chapter “RUNNING AND TEST” on page 28 [1.7]. Close the air relief valve of the ball and pressurize the system to the pressure of 200 mmHg. Then slowly relieve the pressure and monitor the pressure values on the simulator, record the values measured on the simulator and on the measuring tonometer in five points. In each measured point, close the relief valve and wait for the pressure value on the simulator to settle. Adjust the size of the pressure step to the number of measurements, and choose the pressure of 50 mmHg as the lower limit. Record the measurement results in a table and mark them in a chart, where you will project a calibration curve (a chart of deviations of the values measured as opposed to the values on the NIBP-1010 pressure simulator) for each tonometer. For points 4) and 5), the measurement procedure is the same. In point 4), do not connect the ball, connect the tonometer directly to the pressure simulator, as the automatic tonometer has its own pressure source. Set up the measurement apparatus and turn on the NIBP-1010 simulator; set the NIBP mode to simulation. Here you can choose from three situations - “Adult high”, “Adult low”, and “Neonatal”. You will find a detailed description of the simulator’s set up in the user manual, page 21, Chapter „BASIC TEST MODES“[1.7]. The parameters and the means of controlling the digital tonometers are described in each tonometer’s user manual. Carry out three measurements, each time with different situation. For each measured situation, record in a table the simulated pressure values and the pulse rate from the simulator’s display and the resulting measured pressure and pulse rate from the digital tonometer. Find out by calculation whether the measured values are within the interval given by the particular tonometer’s accuracy according to the manufacturer’s specifications. Record the measured values in a table together with the calculated deviation. With tonometers 1) - 3), carry out pressure measurement both with the palpation and the auscultation methods, and compare the results with the automatic tonometer. Measured results Create tables of measured values for the individual tonometers and their measured parameters. According to the data from the tables, form charts of calibration curves for 14 manual tonometers, and for digital tonometers, calculate percentual deviations of the measured values. For each group of tonometers (manual, digital), elaborate a protocol according to the teacher’s requirements. Check‐up questions regarding the given issue • What is the auscultation method of pressure measurement? • What is the purpose of verifying tonometers? • What parameters are included in the information representing the blood pressure? • What principle is used for measuring the blood pressure? References to used and recommended information sources [1.1] Silbernagl, S., Despopoulos, A. Atlas fyziologie člověka. 6. vyd. [s.l.] : Grada. ISBN 80-247-0630-X. (in Czech) [1.2] Wesbter, J.G. ed. Encyclopedia of Medical Devices and Instrumentation. Wiley. [online]. c1999-2009, last update 17. 8. 2008 [cit. 2009-05-12]. Available from WWW via CTU Electronic Information Sources gate – EIS gate http://knihovna.cvut.cz – authorised access - for CTU students only! [1.3] Rozman, J. a kol. Elektronické přístroje v lékařství. Praha: Academia, 2006. 406 s. (in Czech) [1.4] Zákon č. 123/2000 Sb., zdroj: SBÍRKA ZÁKONŮ ročník 2000, částka 36, ze dne 12.5.2000. (in Czech) [1.5] ČSN EN 60601-1-2. Zdravotnické elektrické přístroje: Všeobecné požadavky na bezpečnost. 02/2003. (in Czech) [1.6] ČSN EN 62353. Zdravotnické elektrické přístroje: Opakované zkoušky a zkoušky po opravách zdravotnických elektrických přístrojů. 8/2008. (in Czech) [1.7] Non-invasive Blood Pressure Simulators. NIBP 1000 Series. User Manual. Rev. 10. St. Louis: BC Biomedical, BC Group International, Inc. 2008. 40 s. 15 2. Principles and applications of electrocardiographs To understand the principle of functioning of the actual electrocardiograph, it is necessary to understand the electrophysiological essence of the actual biosignal’s origin. The necessary introduction can be found in the chapters below. Anatomically ‐ physiological introduction The heart is a hollow organ, divided via a vertical partition into the right and the left part; these parts are then further divided via valves into atriums and ventricles, see Fig. 2.1. The muscles of the heart are called the myocardium. It is formed by two layers in the atriums and three layers in the ventricles - the surface layer (common for both the atriums, mostly consisting of crossways running columns of heart cells), the middle layer (separate for each atrium, mostly consisting of circular columns of hearth cells), and the internal layer (intergrowing with the endocardium - the epithelium of the heart cavity, forming papillary muscles and trabecules), see Fig. 2.2. The whole heart is then set in Obr. 2.1: Muscles of the atriums’ myocardium [2.6]. a fibrous sack - the pericardium. In the area where the blood vessels are, the pericardium curls inside and forms the second layer, called the epicardium. Between them, there is the so called pericardial cavity with a small amount of fluid [2.4], [2.5]. Fig. 2.2: Anatomic structure of the heart [2.6]. 16 Heart functions ‐ physiology A healthy heart works as a pump, which makes the blood circulate in the body. Blood is brought from the organs by veins, leading via the upper and the lower vena cava into the right atrium. By a contraction of the right atrium, the blood is ejected into the right ventricle. From the right ventricle, the blood is transported via the pulmonary arteries into the lungs, where it gets rid of carbon dioxide and arterializes. The blood returns from the lungs into the left atrium via a pulmonary vein, it passes through the valve into the left ventricle, from where it spreads via the aorta and other arteries throughout the body to supply the tissues with oxygen and nutrients, and to remove waste materials. In one minute of a resting state, the heart ejects approximately five litres of blood. If the heart is in stress, this volume can increase temporarily up to three times. This quantity is called the cardiac output - CO. For the correct function of the heart it is necessary that the contractions of the heart muscles are strong enough and synchronized. The contractions are initialized via electric incitement of the heart muscles; see the chapter below [2.3], [2.4], [2.5]. The heart’s conduction system ‐ electrophysiology The heart muscle’s cells are excitable, just like all the others, which means, that an adequate stimulus on a membrane induces a response in the form of an action potential. However, in case of the heart cells, this potential lasts much longer and its course differs in the working myocardium as well as in different parts of the conduction system - the set of specific cells, which are capable of independent generation of electrical impulses (automatia), thus controlling the heart’s functioning. The structure, which generates pulses with the highest frequency, is called the pacemaker. Via its activity, it determines the heart rate - HR. In healthy heart, this is the sinoatrial (SA) node in the right atrium. From this node, the pulses spread spokewise via the atriums all the way to the septum between the atriums and the ventricles, which is made of valves. The valves function not only as a Fig. 2.3: The heart’s transmission (conduction) system [2.6]. 17 precaution against the blood’s reflux from the ventricles to the atriums, but also as electrical insulation. In a healthy heart, the transmission of an electrical impulse via this insulation is only possible via the atrioventricular - AV node, which stimulates the ventricles with a delay against the SA node. The electrical impulse spreads further from the AV node alongside the ventricular septum via a bundle of His, which verges into the right and the left bundle branches, and further to fine Purkyně (Purkynje) fibres. These fibres pass it on to the myocardium cells. In a supraliminal stimulus, the impulse is thus spread throughout the heart; see Fig. 2.3. Spread velocity differs in each structure. The slowest conduction is in the SA and AV nodes in 0.05 m/s, the working myocardium in 0.3 - 1 m/s, and the conduction system in the ventricles in 14 m/s (the fastest being the bundle of His, and the slowest being the Purkyně (Purkynje) fibres). The value for the heart rate in a resting state, if the SA node is the pacemaker, is 70 beats per minute; if the pacemaker is the AV node, it is 50 - 60 beats per minute, and if the ventricular structures are the pacemaker, the rate is 25 - 45 beats per minute. Disorders of the conduction system in a form of the electrical stimulus transmission blockades or malfunctions of any of its parts form grounds for implanting a cardiostimulator, a cardioverter-defibrillator, or a biventricular cardioverter-defibrillator. This intervention does not heal the disorder, but significantly increases the quality and length of the patient’s life. Catheter ablation represents another possible treatment [2.1], [2.2], [2.3], [2.4]. Resting and action membrane potential The ability of depolarization and repolarization is the essential quality of excitable cells. The resting membrane potential equals to -50 to -90 mV (depending on the cell’s function) - the cell is polarized. The negative sign expresses the fact that the inside of the cell is negatively charged as opposed to the outside of the cell. This state is given by the uneven spreading of ions on the opposite sides of the cell membrane. The main intracellular ion of the heart cells, just like in all other cells, is K+, and the main extracellular ions are Na+, Ca2+ and Cl-. The cell membrane in a non-irritated state is better permeable for the potassium ions than for the others. As the K+ ions’ concentration inside the cell is approximately 30-times higher as opposed to the outside, they are transported out of the cell on their concentration gradient. That, together with the presence of natrium and calcium ions outside the cell causes an excess of positive ions in the extracellular area. The Cl- ions move through the membrane almost exclusively passively, i.e. they only pass through the membrane as a result of the movement of the cations. 18 The action potential is accompanied by changes of tension on the membrane; see Fig. 2.4. These are caused by the flow of ions inside and outside of the cell, based on the changes in the membrane’s permeability for the specific ion. The action potential occurs when the membrane potential changes very quickly (in 1-3 ms) from approximately -90 mV to +20 or +25 mV. In this stage, the cell is depolarized. This is followed by a short partial repolarization, when the membrane potential’s value decreases to +10 or +15 mV. The next part of the process is only typical for the heart cells and is called the plateau stage. It lasts for approximately 200 up to 350 ms. Only in its end the cell is fully repolarized and returns to the polarized state - the membrane potential is approx. -90 mV again. Vm (mV) Time (ms) Fig. 2.4: The transport of ions over the membrane and changes in polarity in the individual stages of the action potential [2.6]. 19 We distinguish between two essential types of action potentials: 1) Action potential with fast depolarization This is typical namely for the cells of the working myocardium, see Fig. 2.5. When reaching the threshold value of the stimulus, the fast Na+ channels open and these cations flow from the extracellular area quickly inside the cell. Fast speed of the flow is given by the concentration and electrical gradient and the high amount of the Na+ channels. 1-2 ms later, the channels are inactivated and remain in this state until the late repolarization. At this moment, the electrical gradient is switched, too. Partial repolarization is characteristic for the decrease of the membrane potential by 5-10 mV, and is caused by the closing of the fast Na+ channels and a short-term opening of the K+ channels (K+ flowing outside from the cell). During the plateau stage, the membrane potential remains positive (10-15 mV) and the movement of ions through the cell’s membrane remains relatively balanced. The channels for K+ are partially open (K+ flowing outside from the cell), and thanks to the membrane potential’s value being near to zero, also the Ca2+ channels open (Ca2+ flowing inside). When the flow of the cations outside from the cell prevails due to the inactivation of the Ca2+ channels, the membrane potential decreases, the permeability for the K+ ions increases, and the resting membrane potential is restored. 2) Action potential with slow depolarization This is typical for the cells of the SA and the AV nodes, see Fig. 2.5. It is mostly different in less negative and non-constant value of the resting potential, which slowly approximates the trigger level. This phenomenon is called a spontaneous diastolic depolarization and the cells can thus function as the source of stimuli. Another difference is represented by the speed of the depolarization. It is lower, because it is subject to the opening of the slow specific Ca2+ channels (as opposed to the fast Na+ channels). As the sodium cations do not participate in this phenomenon, the stage of the partial repolarization is missing [2.3], [2.4]. 20 Fig. 2.5: Processes of action potentials in the individual parts of the heart [2.6]. Spreading of the action potential Action potential is spread via the conduction system and then via the muscles in a single direction only. One cell activates the other. The progress of the stimulus in the single direction is caused by a temporary inability of the cell to react to irritation. This period of time is called an absolute refractory period. The action potential can thus only pass onto a cell, which has not been activated immediately before. The short period of time following the absolute refractory period is called a relative refractory period. In this stage, the cell can only be activated by a much greater supraliminal stimulus (such as a defibrillating impulse, which, however, can trigger the fibrillation of the ventricles!) [2.3], [2.4]. 21 Vm (mV) Time (ms) Absolute refractory period Relative refractory period Fig. 2.6: Absolute and relative refractory periods [2.6]. Variability of anatomical and physiological parameters Each individual has certain characteristic parameters describing the current state of his organism, see Tab. 2.1. These values change in connection with stress (physical or psychic). Tab 2.1 shows typical values for non-sportsmen and for trained endurance sportsmen [2.2]. Occurrence of the ECG curve When the irritation arrives at the muscles of the atriums, they gradually depolarize, which shows via the occurrence of the P wave. When the irritation passes through the slow conduction segment - the PQ segment, there is fast depolarization of both the ventricles at the same time, when the depolarization spreads from the inside to the outside. The depolarization of the ventricles is clearly visible on the ECG record as a QRS complex. Together with the QRS complex, there is a process of repolarization of the atriums, the electrical manifestation of which is overlaid by the QRS complex. The last stage - repolarization of the ventricles, can be observed as the last T wave in the record, see illustration in Fig. 2.7. The U wave is only observed in some individuals. 22 Tab. 2.1: Typical values for sportsmen and non-sportsmen [2.2]. Non-sportsmen at rest Heart weight (g) Blood volume (l) Heart rate (min-1) Stroke volume (ml) up Sportsman at rest up 300 500 5.6 5.9 80 180 40 180 70 100 40 190 Fig. 2.7: Description of the ECG curve. Standard 12‐lead ECG system Clinically the most commonly used system for imaging the heart biopotentials uses a system of ten electrodes placed on the limbs and on the chest of the examined person. Via a resistor network, see below, there are standard 12 ECG leads (ECG curves) acquired, which are based on the principle of measurement of the voltage course between the stable locations. 23 The 12-lead system consists of: • Bipolar limb leads according to Einthoven (leads I, II, III) • Unipolar augmented leads - Goldberg’s leads (aVL, aVR, aVF) • Unipolar chest leads - Wilson’s leads (V1 - V6) Bipolar leads - leads according to Einthoven The electrodes are placed on the wrists of the upper limbs (R-red color, L-yellow color) and on the lower part of the left lower limb (F-green). A neutral electrode (N-black) is connected to the lower part of the right limb. This layout is mostly used in ambulatory practices. Thanks to the relatively good conductivity of the skin (up to 600 mS/m), it is possible to place the individual electrodes even to other places on the body, yet the so called Einthoven’s triangle must always be observed. This fact is very often used in the urgent care or in ergometry, when the sensing electrodes are stuck on the patient’s chest. Differences in electrical potentials in time are measured via differential amplifiers, always between two electrodes, see Fig. 2.8. UI = Φ L - Φ R UII = ΦF - ΦR UIII = ΦF - ΦL Fig. 2.8: Geometry of the standard limb leads. Unipolar leads according to Goldberg The resulting voltage development is given by the difference in the potential of one limb and “averaged-out” medium potential from the remaining limbs. The medium potential is formed via a volt box 50:50, see Fig. 2.9. These leads are marked as aVR, aVL and aVF. 24 UaVR= ΦR – (ΦL+ ΦF)/2 UaVL= ΦL – (ΦR+ ΦF)/2 UaVF= ΦF – (ΦR+ ΦL)/2 Fig. 2.9: Unipolar leads’ geometry according to Goldberg. Wilson’s chest leads The limb leads mentioned so far represent the heart’s electrical activity in the frontal plane; yet the unipolar chest leads according to Wilson provide information about the heart’s electrical activity in a horizontal plane. Six active electrodes are placed to specific locations on the chest, and the difference in these potentials is measured against the so called Wilson’s central terminal (W), which is created by averaging-out all the three limb leads, see below. UV1 = ΦV1 - ΦW UV2 = ΦV2 - ΦW UV3 = ΦV3 - ΦW … UV6 = ΦV6 - ΦW Fig. 2.10: Layout of the chest leads according to Wilson. 25 Other possible modifications of the leads Besides the already described 12 conventional leads, some other leads may be used in certain situations and for certain specific purposes [2.6]: Esophageal leads - The esophageal electrode is capable of sensing relatively high atrium potentials thanks to its presence in the vicinity of the left atrium, thus accurately determining the electrical activity of the atriums and its relation to the activity of the ventricles. That is mostly significant in case of fibrillation and atrial flutter, AV block, etc. Frank’s corrected orthogonal system - 7 electrodes are used. Corrected orthogonal system of McFee-Parungao - a 9-lead system. These systems are used namely in VCG (vectorcardiogram - imaging of the movement of the electrical heart vector in a three-dimensional space). Schematic diagram of an ECG apparatus In practice, there are different technical solutions to electrocardiographs; the main principle of the biosignal measurement and transmission has been settled into the form presented in Fig. 2.11. The individual blocks of the measurement channel for one lead are described in the text below. Fig. 2.11: Fundamental scheme of an ECG measurement channel [2.8]. Input protective circuits of the amplifiers These circuits are front-end to the input of the actual amplifier in order to protect the amplifier’s input circuits from large electrostatic charges or from the defibrillation discharge. At the same time, it is required that the protective circuit does not influence the qualities of the actual amplifier. The protection is realized via a voltage limiter, parallel-connected between the amplifier’s inputs. As the voltage limiters, manufacturers of the medical devices use, for 26 example, diodes connected in anti-parallel, Zener diodes connected in anti-series, or eventually voltage limiters consisting of two silicon transistors. Low-voltage discharge tubes are sometimes used. To prevent the overcurrent (current overload) of the voltage limiter, there is usually a serial resistor, and a spark gap for large discharges. Amplifiers of the biopotentials The amplifiers increase the level of the signal in such a way as to make it suitable for further processing, and at the same time they ensure the impedance conformity of the apparatus’ input with the signal sources (the patient), and they can also suppress undesirable disturbances - when the most common source of external disturbances is the penetration of the mains frequency via the electrostatic coupling, the magnetic induction or directly galvanically into a part of the described system. These disturbing elements must be effectively suppressed by the amplifier. Essential qualities of the biopotentials’ amplifier with typical values: • differential input impedance (> 2x200 MΩ) • common mode input impedance (> 400 MΩ) • common mode rejection ratio CMRR (> 100 dB at 50 Hz) • input bias current (< 1 nA) • frequency characteristics (0.05-120 Hz, 0.5-40 Hz - e.g. Holter) • output impedance (< 10 Ω) • gain (200 - 1200) • noise voltage at input (15 µV) • recovery time at overdrive (overload, saturation) (10 s) • input protection from damage by surge – overload protection (5000 V) The Driven Right Leg circuit This circuit is often used by the designers to suppress the common mode signal. The common mode signal is taken away from the internal structure of the operating amplifier (instrumentation amplifier - IA), to be impedantly modified via a voltage follower and released back to the examined object via inverting amplifier (the interference (common mode) signal has a reverse phase). The resistor with a value of 390 kΩ is used as a current limiter of the excitation signal. 27 Filters Filtration is an inseparable part of signal processing. A filter is generally a circuit designed in such a way as to transmit signals of a certain frequency bands, while suppressing other frequencies. These circuits may be realized via passive components, such as resistors, coils and capacitors, or via active components, such as amplifiers. Fig. 2.12: Connection of the Driven Right Leg circuit. When processing the ECG signal, a frequency band of 0.05 Hz - 120 Hz is used. A high-pass filter with limiting frequency of 0.05 Hz removes disturbing elements from the signal, caused by slow movements of the examined person and slow electrochemical action. Low-pass filter, set to the position of 120 Hz, defines the upper threshold of the transmitted frequency band, thus removing the disturbing elements outside the scope of frequencies of the wanted signal. The ECG record contains a very significant disturbing contribution from the mains voltage, oscillating around the value of 50 Hz. To remove it, the so called band-reject filter is used. This serrated filter, the so called Notch filter, suppresses only one required frequency, or eventually a very narrow band of frequencies. Isolation amplifiers - galvanic separation Galvanic separation of the signal is realized via isolation components (such as isolation amplifiers, optocouplers). These components ensure the transmission of signal, analogue or digital, from the input to the output via an isolation barrier. The barrier ensures that there is no galvanic (ohmic) connection between the input and the output. The isolation 28 barrier is specified by the size of the isolation voltage uiso, the isolation capacity C, and the isolation resistance R. From the point of view of the medical devices and instrumentation, it is very important that the values of the leaking currents past the isolation barrier remain as low as possible. Low values of the direct-current leaking currents are achieved via high isolation resistance. On the contrary, a very low value of the isolation capacity ensures low alternating leaking currents. The Isolation Mode Rejection Ratio (IMRR) is defined for the isolation amplifiers. This factor indicates the isolation amplifier’s capability to reduce the disturbing common mode voltage. The isolation bond can be realized in several ways: • optocouplers • induction-transformer bond • capacitive bond • DC/DC converters • analogue isolation amplifiers • digital isolation devices Secure supply circuits for ECG apparatus From the point of view of the patient’s safety, the supply circuits must be galvanically separated from the mains; see the technical standard ČSN EN 60601-1 and other derived group standards. To ensure safety and to meet the standard’s requirements, a battery supply may be used or the DC/DC converters, which ensure the separation of the electrical circuit’s supply from the mains and at the same time, they change the voltage size. Additional circuits: Checking the quality of the electrodes’ connection To sense the biopotentials via non-invasive methods, it is necessary to ensure impedance modification of the electrode-patient transition. A special gel with chloride ions is used for a good contact between the patient’s skin and the electrode. The impedance value of this transition varies between single units and tens of kΩ. The value of this impedance is very important for correct sensing of the biopotentials, and therefore it must be checked 29 continuously. Fig. 2.13 shows a schematic diagram of the circuit, which is used to discover badly connected electrodes on the patient’s body. Fig. 2.13: Schematic diagram of the circuit checking quality of the electrodes’ connection [2.8]. To check the quality of the electrodes’ contact, a sinus signal of a 50 kHz frequency is brought between two electrodes connected to the patient from a mains source. There are two reasons for choosing this particular frequency. The first one is to reduce the risk of physiological effects of such a high frequency on human body. The second reason is that a signal of 50 kHz does not interfere with the ECG signal’s spectrum, and can be easily filtered out before the next processing of the measured signal via a band pass filter. The wanted signal of ECG is on the contrary filtered out via a low-pass filter, to be further conducted into the actual blocks of the ECG apparatus. Both the signals are thus very well separated from each other. Constant current about tens of µA passing through the human body creates electrical voltage with amplitude directly proportional to the size of the impedance between the electrodes. Therefore, if the electrodes are connected in a wrong way to the patient, or eventually if they are disconnected altogether, the voltage grows. After passing the band pass filter, the signal passes through a threshold detector. If the value of this measurement exceeds a certain limit, an alarm sets off. Measurement tasks 1) Use an ECG simulator and the “ECG 12lead” edutools to display the ECG signal’s progress in time on a digital oscilloscope or a PC monitor. 30 • Set the simulator to a normal sinus rhythm with a physiological frequency Measure the ECG signal’s amplitude, calculate the amplitude’s size prior to the gain, and compare it with the physiological parameters cited in literature. Input amplifiers’ gain A = 1000. • Measure the duration of the ECG curve’s individual segments and compare them with the physiological parameters depicted in Fig. 2.7. 2) Carry out the biosignal’s analysis within the frequency domain. To realize the task, it is necessary to connect the edutools to the PC; it is assumed that the SW environment LabVIEW or LabVIEW SignalExpres will be used. • Display the frequency spectrum of the measured ECG signal • Disturb the measured signal with disturbing frequency of 50 Hz and watch the change in the ECG signal’s frequency spectrum • 3) Apply a suitable filter (SW) to effectively remove the system interference of 50 Hz. Laboratory task: “STC of the ECG apparatus” • Carry out a safety-technical check (STC) of the apparatus, including the check of the electrical safety of the apparatus. Use a real medical ECG apparatus to measure: • Resistance of the supply lead • Insulation resistance • Leakage current in the apparatus • Leakage current in the patient Record the measured values in a protocol on the STC of the apparatus; see a sample in the appendix to the textbook. References to used and recommended information sources [2.1] Aschermann, M. et. al. Kardiologie. Praha, 2004. 1540s. ISBN 80-7262-290-0. (in Czech) 31 [2.2] Despopoulos, A., Silbernagl, S. Atlas fyziologie člověka, 6. vyd. Praha, Grada Publishing s. r. o., 2004. 448 s. ISBN 80-247-0630-X. (in Czech) [2.3] Rokyta, R., et.al. Fyziologie pro bakalářská studia v medicíně, přírodovědných a tělovýchovných oborech, 1. vyd. Praha, ISV, 2000. 359 s. (in Czech) [2.4] Trojan, S., et. al. Lékařská fyziologie, 4. vyd. Praha, Grada Publishing s. r. o., 2003. 772 s. ISBN 80-274-0512-5. (in Czech) [2.5] Valentová, K. Technologie a algoritmy implantabilních kardiostimulátorů a ICD. Kladno, červen 2009. 28s. Semestrální projekt, ČVUT, Fakulta biomedicínského inženýrství. (in Czech) [2.6] Malmivuo, J., Plosney, R. Bioelectromagnetism - Principles and Applications of Bioelectric and Biomagnetic Fields, [online] , last update November 2007 [cit. 10.12.2009] Oxford University Press, New York, 1995. Available from www: http://www.bem.fi/book/index.htm. [2.7] Punčochář, J. Operační zesilovače v elektronice, 2. vyd. Praha, BEN, 1996. 495 s. ISBN 80-901984-3-0. (in Czech) [2.8] Funda, T. Polytechnické pomůcky pro výuku lékařské elektroniky, semestrální práce, Praha: semestrální práce, 2002. (in Czech) 32 3. Principles and applications of defibrillators Theoretical introduction Defibrillation is used to eliminate fibrillations (cardiac arrhythmias, 340-600 pulses/min) of the cardiac muscles by means of artificially created electrical discharge (pulse) of a great energy. Application of defibrillation is most common in ventricular fibrillation, ventricular flutter or in sustained polymorphous ventricular tachycardia (longer than 30 s). Defibrillation causes depolarization of all the cells in the heart, which allows for restoring regular heart rhythm. Defibrillation’s effectiveness is very much influenced by the size of the passing current (single units to tens of Amperes). The size of the current depends on the impedance size of the patient’s tissue (tens to hundreds of Ohms) and on the transition resistance of the electrodes, as well as on the shape of the defibrillation pulse. Greater impedance of the patient reduces the value of the passing current, which is compensated by the prolongation of the defibrillation pulse’s duration (single units to tens of milliseconds). The surface below the defibrillation pulse’s curve thus remains preserved, being the energy of this pulse. In external defibrillators, the amount of energy of the defibrillation pulse is adjustable within the scope of 50-400 Joules [J]; in implantable defibrillators (ICD - Implantable Cardioverter-Defibrillator), the size of the defibrillation pulse varies between 1-50 J (30 J), depending on the defibrillator’s type and manufacturer. Defibrillators currently manufactured use several types of defibrillation pulses. Fig. 3.1: Demonstration of monophasic depolarizing pulses (from the left: trapezoidal, damped, damped with delay). Depending on the number of pulse stages, we divide the defibrillation pulse to monophasic pulse (Fig. 3.1), when direct current is passed onto the patient in one direction 33 only, and to biphasic pulse (Fig. 3.2), when the direct current is lead past the heart muscle in one direction during the first stage of the pulse, and in the other direction in the second stage. Some defibrillators use triphasic or quadriphasic defibrillation pulses. Fig. 3.2: Demonstration of biphasic depolarizing pulses (from the left: trapezoidal BTE and damped with delay DBT). Depending on the shape of the pulse (monophasic and biphasic), we divide the defibrillation pulse to trapezoidal (exponential), damped (sine), and damped with delay. The trapezoidal shape of the defibrillation pulse is given by the time limited exponential discharge of the capacitor (tens of µF). Discharging of the capacitor is interrupted via thyristors in a moment the selected energetic value contained in the stimulation pulse is reached; see an equivalent diagram of such a circuit in Fig. 3.3. Fig. 3.3: Equivalent electrical diagram of a monophasic defibrillator with trapezoidal (exponential) defibrillation pulse. Position 1 - charging of the capacitor, position 2 discharging of the capacitor into the patient (defibrillation pulse), position 3 - fast discharge of the capacitor (the MTE defibrillation pulse is interrupted upon reaching the selected energy of the pulse). 34 The trapezoidal pulse is also marked as MTE or BTE (Monophasic/Biphasic Truncated Exponential pulse), Fig. 3.1 and Fig. 3.2. Damped shape of the defibrillation pulse (DSW - Damped Sine Wave) is acquired via the discharging of the capacitor past a coil, the so called choke, i.e. “choking” coil (from blocking). Adding the choking coil into the capacitor’s circuit creates a serial oscillating circuit with losses, Fig. 3.4. A damped oscillation is excited by means of this RLC circuit, the parameters of which depend on the capacity of the capacitor (tens to hundreds of µF), the inductivity of the choking coil (tens to hundreds of mH, the coil resistance in single units of Ω), and the size of the idle resistance (resistance in the patient’s circuit, tens to hundreds of Ω]. Damped defibrillation pulse is in some cases also time limited, just like the trapezoidal pulse, this pulse then being marked as DMT or DBT (Damped Monophasic/Biphasic Truncated pulse), Fig. 3.1 and Fig. 3.2. Fig. 3.4: Equivalent electrical diagram of a final stage of a monophasic defibrillator with damped (sine) defibrillation pulse. Position 1 - charging of the capacitor, position 2 discharging of the capacitor via a choking coil into the patient (DSW defibrillation pulse). Damped shape of the pulse with delay is acquired by means of a circuit with delay line, Fig. 3.5. Thanks to the delay line, the pulse extends, compared to the pulse created by a capacitor defibrillator with a choking coil. Extension of the pulse (increase in the area under the curve) allows for reducing the amount of current of the defibrillation discharge, which passes through the patient, thus reducing the stress on the patient’s tissue. 35 Fig. 3.5: Equivalent electrical diagram of a final stage of a monophasic defibrillator with damp-shaped defibrillation pulse with delay. Position 1 - charging of the capacitors, position 2 - discharging of the capacitors past the delay line (defibrillation pulse DMT). Synchronized cardioversion Synchronized cardioversion, or simply a cardioversion, is basically a synchronized defibrillation, which uses lower energy values of the defibrillation pulse. Typically, the synchronized cardioversion starts at the discharge value of 50 J in external biphasic cardioversion and at 5 J in internal biphasic cardioversion. The defibrillator senses the ECG (see Chapter 2) signal and calculates the distance of the R waves (the so called R-R interval), which means the distance of subsequent QRS complexes. Cardioversion is most often used in case of atrial flutter, atrial fibrillation and ventricular tachycardia. The applied discharge depolarizes the entire heart muscle, thus interrupting the so called reentry circuit. Transcutaneous stimulation (pacing) At present, most external defibrillators can perform the so called transcutaneous (external) stimulation besides defibrillation (TEPs - Transcutaneous External Cardiac Pacing). Transcutaneous stimulation is used in acute arrhythmias, in case of some forms of bradycardias and tachycardia (more than 90 beats/min, adult patients). The stimulation may be carried out in the on-demand mode or in the fix-rate mode. Single-use electrodes are used for the stimulation, with large surface area, the so called “pads”. The active surface of electrodes for transcutaneous stimulation must not be less than 75 cm2 for adult patients and 20 cm2 for child patients. In the on-demand mode (bradycardia, asystole), the stimulator is inactive as long as the patient has his own cardiac activity with frequency higher than that set up on the simulator (mostly 30-180 beats/min). The stimulation pulses are only applied in case the heart frequency decreases or if the heart stops beating. The heart’s activity is monitored via the 36 ECG signal with additional ECG electrodes. Also the time interval of the R-R waves in the ECG signal is evaluated. In the fix-rate mode (bradycardia, asystole, tachycardia), it is possible to set up fixed repetitive frequency of stimulation pulses on the stimulator (usually 30-180 stimuli/min), independently from the heart’s activity. The size of the stimulation pulse’s energy varying from tenths to single units of joules can be set up by means of the maximum size of current passing through the patient (0-200 mA). The size of the stimulation pulse’s voltage usually varies between tens to hundreds of volts. The length of the pulse and the shape of the pulse depend on the apparatus’ type and manufacturer. The length of the pulse not exceeding 5 ms is called „Short-Pulse Duration“, the pulse has a typical shape of a stimulation pulse with exponential decrease of the current, just like in case of implantable cardiostimulators. The length of the pulse not exceeding 20 ms with variable size of the current is called „Short-Pulse Duration, Current Drop Off (short duration of the pulse with current decrease by 15-20 % of the current maximum). The shape of the pulse is similar to the DMT defibrillation pulse. The length of the pulse not exceeding 40 ms with constant size of the current is called “Long-Pulse Duration, Constant Current”. The pulse’s course is rectangular and the size of the current in this pulse is half compared to the previous two pulses. Antitachycardia stimulation Just like some external defibrillators, also the implantable defibrillators are capable of heart stimulation. This stimulation, which may precede defibrillation, is called antitachycardia stimulation (ATP - Antitachycardia pacing). ATP is used to interrupt tachycardia (cardiac arrhythmia, increased heart rhythm exceeding 90 beats/min) of the heart muscles. ATP’s effectiveness was clinically confirmed in ventricular tachycardia not exceeding 240 beats/min. The energy of the ATP stimulation pulse is several digit numbers lower than in the defibrillation pulse. The energy of the ATP pulse reaches maximum values of tenths to single units of millijoules (mJ). The shape and the parameters of the ATP stimulation pulse are very close to the cardiostimulator’s stimulation pulse. The voltage of the ATP pulse’s entering edge varies between -5 V and -7.5 V; the pulse’s width varies between 0.05 ms and 2 ms. ATP is based on an application of a dose of stimulation pulses. The first pulse of this dose is applied before the beginning of the cardiac contraction. The delay between the last sensed cardiac contraction and the first stimulation impulse of the ATP dose is called the coupling interval (CI). The coupling interval may be fixed, and then its length is firmly set in milliseconds, or it may be adaptive, and then its length is calculated in % of the length of the 37 R-R interval of spontaneous activity (TCL - Tachycardia Cycle Length), typically at 85 % of TCL. The distance of the subsequent stimulation impulses of the dose (BCL - Burst Cycle Length) may be fixed (stimulation scheme Burst), and it is usually the same as the CI, or the distance of the individual stimulation impulses is variable (stimulation scheme Ramp), typically decreasing by 10 ms always with the next BCL. The ATP dose is repeated until the tachycardia is interrupted. Repeated stimulation Burst with shorter BCL in the subsequent dose is called the stimulation scheme Scan. Demonstrations of the Burst and the Ramp schemes of ATP stimulation are presented in Fig. 3.6. Fig. 3.6: Stimulation schemes Burst and Ramp for antitachycardia stimulation. The aim and the contents of the measurements Defibrillators are medical devices used to suppress cardiac arrhythmias, such as tachycardia of fibrillations, when the heart does not fulfil its physiological function due to non-coordinated contractions. Correct function of the heart is restored by the defibrillator by means of an electrical discharge, the so called defibrillation impulse, applied on the heart muscle. Modern types of defibrillators use different shapes of defibrillation impulses with different energy, which may vary between tenths of Joules and hundreds of Joules. Due to the size of energy of the defibrillation pulse, thus also due to related currents of tens of amperes, it is desirable to become acquainted with the function and the construction of these devices and with correct processes of their utilization or electrical safety revision. The aim of this measurement is to become acquainted with the function of the defibrillators in the defibrillation mode and in the transcutaneous stimulation mode and to measure and to verify the parameters and shapes of the stimulation pulses for different set-ups of the apparatus via a defibrillator analyzer. There is a very important supplement in the form of defibrillator measurements via an electro-revisional apparatus. 38 Measurement tasks Prior to the actual measurement, get familiar with the manipulation with and the components of the available defibrillators (such as CardioServ, GE Healthcare [3.8] and BeneHeart D3, Mindray [3.9]) and the defibrillator analyser (DA-2006, BC Biomedical [3.7]). During the measurements, consult all your procedures with the teacher. Work with the user manuals [3.8] and [3.9] available at the subject’s website. 1) With the defibrillator analyzer, compare the set and the measured parameters of the defibrillation pulse for more set ups within the range of the apparatus (at least for 5 values of energy). Compare the defibrillation pulses in different devices and make a chart of the measured courses. 2) Measure the charging time of the defibrillator’s capacitors. 3) Set the defibrillator analyzer to the “ECG simulator” mode, and watch different preprogrammed cardiac arrhythmias on the defibrillator’s display. Further on, switch the analyzer into the “Cardioversion test” mode. Set up the synchronized cardioversion mode (discharge synchronized with the closest R-wave) according to the defibrillator’s user manual, and measure the parameters of the synchronized discharge via the analyzer. 4) Measure the parameters and the course of the external defibrillator pulse in the transcutaneous stimulation mode, connected to an oscilloscope via a edutools. Compare the measured pulse parameters with the pulse parameters from sections 2) and 3) of the measurement. For different repetitive pulse frequencies, verify the consistency of parameters of the transcutaneous stimulation pulses for one set up of the stimulation current size. 5) Use the electro-revisional apparatus (MEDITEST 50) to measure the leakage current in the applied parts. Make a protocolar record on the measurements carried out and on the safety-technical check of the defibrillation apparatus. Measurement procedure During the measurement, be careful not to interrupt the contact between the defibrillator electrodes and the analyzer electrodes when applying the discharge, as this would induce a spark and damage (burn) the surface of the electrodes. Also be careful not to have the defibrillator electrodes touching at the application of the discharge. 39 Ad task 1) Switch on the analyzer using the switch on the back side, see Fig. 3.7. Set up the analyzer to the required range according to the energies you selected on the defibrillator, see Fig. 3.8. Set up the scope of energy by means of the “Range” button to “High Defibrillator Range” for discharge energy up to 1000 J, or to “Low Defibrillator Range” for discharge energy up to 50 J. Wait until the analyzer’s display shows “Status: Ready for Defib“, and now the analyzer is ready for the measurement. Fig. 3.7: Defibrillator analyzer - view of the back side with legend [3.6]. On the defibrillator, choose the value of the discharge energy corresponding to the selected range on the analyzer. Smear the defibrillator electrodes with defibrillator gel or ECG gel (so called Paddle) to prevent the interface surfaces from burning!!! Place the defibrillator electrodes perfectly on the analyzer electrodes and push the “Charge” button. At the moment the sound signalizes that the defibrillator is charged, placidly push both the “Defib” (“Discharge”) buttons on the electrodes with your thumbs. 40 Fig. 3.8: Defibrillator analyzer - overall view with legend [3.6]. Read and record the applied discharge’s energy on the analyzer’s display - “Energy”, the peak voltage value - “Peak V”, the peak current value - “Peak I”, and the length of the defibrillation pulse. Use the “Playback last pulse” button to switch to the chart of the defibrillation pulse’s duration and sketch its shape. Ad task 2) Use the “Range” button to switch the analyzer into the “High Defibrillator Range” mode. Set the defibrillator to a maximum value of the discharge energy. Push the “Start charge timer” button on the analyzer, and during the “Charge Timer Will Begin in” countdown on the display, apply the defibrillator electrodes on the analyzer electrodes. At the moment the countdown reaches zero, push the button for charging the defibrillator and allow for the charging. When the charging is finished, discharge the defibrillator by means of the 41 discharge buttons into the analyzer. Read the time for charging the defibrillator on the analyzer’s display “Chg Time: xxx.x sec”. Compare the value with the data stated by the manufacturer in the user manual [3.8, 3.9]. Ad task 3) Connect the patient cable in the connector for the ECG input on the defibrillator, and its second end to the simulated electrodes in the upper part of the analyzer’s front side via press studs. Then proceed according to the instructions in the user manual for the defibrillator analyser. Watch all the available ECG courses, including arrhythmias. Follow the instructions in the user manual for the defibrillator [3.8, 3.9] to set up the defibrillator into the synchronized mode and perform a synchronized cardioversion according to the procedure from section 1). On the analyzer’s display read and record the energy of the applied discharge - “Energy”, the peak voltage value - “Peak V”, the peak current value “Peak I”, and the length of the defibrillation pulse. Use the push button “Playback last pulse” to switch over to the defibrillation pulse’s time course chart and draw its shape. Ad task 4) Connect the cables for transcutaneous stimulation to the defibrillator. By means of a edutool “Converter for pacing” in Fig. 3.9 connect the defibrillator’s stimulation cables to the oscilloscope. The edutool is a power voltage divider with resistors R1 = 52 Ω and R2 = 7 Ω, which means the voltage ratio on the output is 0.12. Switch the defibrillator over to the stimulation mode “Pacemaker Stimulation” (“KStim”)!! Set different values of the stimulation current on the defibrillator, within the entire range of values 0-200 mA (for at least 5 values), and on the oscilloscope, read the pulse parameters, the pulse width, peak voltage value, repetition frequency of the pulses, and draw their courses. Do not forget to recalculate the read voltage on the oscilloscope via the ratio on the divider. Calculate the stimulation pulse’s energy from the value of the set current and the measured voltage. Select one value of the stimulation current and verify the conformity of the pulse parameters for different repetitive pulse frequencies set up on the defibrillator (for at least 3 frequencies). 42 Ad task 5) Safety-technical check: on the basis of the operation manual [3.8, 3.9] for the defibrillator and the electro-revisional apparatus Meditest 50 [3.7], first determine the defibrillator’s electrical insulation class, and then perform the electrical safety measurement, which is bound to the assigned MD class. Elaborate a protocol on STC, which you can find on the subject’s web site. Fig. 3.9: Converter for pacing, demonstration of stimulator and oscilloscope connection. Apparatus and aids used Monophasic defibrillator CardioServ (GE Healthcare, USA) Biphasic defibrillator BeneHeart D3 (Mindray, USA) Defibrillator analyser DA-2006 (BC Biomedical, USA) Converter for pacing (FBMI ČVUT in Prague) Digital apparatus for checking medical electrical apparatus MEDITEST 50 (ILLKO, s.r.o., Czech Rep.) Digital oscilloscope and connecting BNC cable Measured results Elaborate a protocol on the measurement from the laboratory task. Record the measured and calculated values into tables and draw the courses of the stimulation and defibrillation impulses into charts with descriptions of the axes and a corresponding scale. Conclusion In the measurement protocol, shortly comment on each point of the measurement. Evaluate the measured results and compare them with the data stated by the manufacturer in 43 the operation (user) manual. Determine the type of the applied part the apparatus works with, the (electrical) insulation class and the MD classification class. Check‐up questions regarding the given issue 1) Describe the differences between defibrillation and synchronized cardioversion. 2) When is antitachycardia stimulation used and how is this stimulation different from defibrillation? 3) Describe the differences between monophasic and biphasic defibrillation pulse. 4) What is the basic type of electrical circuit in the defibrillator with damped shape of the defibrillation pulse, and what is the type of electrical circuit in the defibrillator with trapezoidal shape of the defibrillation pulse? 5) What is the relation for the calculation of the defibrillation discharge’s energy? References to used and recommended information sources [3.1] Korpas, D. Kardiostimulační technika. 1. vyd. Praha: Mladá fronta, 2011. 206 s.: ISBN 978-80-204-2492-1. (in Czech) [3.2] Marcián, P., Klementa, B., Klementová, O. Elektrická kardioverze a defibrilace. Intervenční a akutní kardiologie. Olomouc: Solen, s. r. o., 2011; 10(1): 24-29: ISSN 1213-807X. (in Czech) [3.3] Chmelař, M. Lékařská přístrojová technika I. Brno: VUT, 1995. 192 s.: ISBN 8085867-63-X. (in Czech) [3.4] Hozman, J., a kol. Praktika z biomedicínské a klinické techniky Vyd. 1. V Praze: České vysoké učení technické, 2008. 118 s.: ISBN 978-80-01-04025-6. (in Czech) [3.5] Silbernagl, S. Atlas fyziologie člověka / 6. vyd., zcela přeprac. a rozšíř. Praha: Grada, 2004. 435 s.: ISBN 80-247-0630-X. (in Czech) [3.6] Defibrillator Analyzers. DA-2006, DA-2006P W/Pacer Analyzer. User Manual. Rev. 04. St. Louis: BC Biomedical, 2006. 78 s. [3.7] Digitální přístroj pro kontroly zdravotnických elektrických přístrojů MEDITEST 50 (ILLKO, s.r.o., ČR). Návod k používání přístroje. 2007. (in Czech) [3.8] CardioServ. Návod k obsluze. Verze 4.2. GE Medical Systems. 227 446 43 CZE Revize I. leden 2007. (in Czech) [3.9] BeneHeart D3. Defibrillator/Monitor. Operator’s manual. Shenzhen Mindray BioMedical Electronics Co., Ltd. May 2011. 44 4. Principles and applications of pulse oxymeters Theoretical introduction Pulse oxymetry is a non-invasive optical method used for long-term monitoring of arterial blood’s oxygen saturation. The method is based on measuring the intensity of radiation (light) transmitted through vascular tissue. This intensity can be calculated via the Lambert-Beer Law (4.1), which expresses the exponential dependence of the intensity of the transmitted radiation (light) on the concentration of the solution the radiation (light) passes through. I = I 0 .e − c. d .ε ( λ ) (4.1) I - intensity of the transmitted radiation (light) (W/m2), I0 - intensity of incident radiation (light) (W/m2), c - concentration of the solution (mol/l), d - thickness of the layer (m) through which the radiation (light) is transmitted, and ε(λ) - the absorption coefficient (l·mol-1·m-1), which depends on the wavelength of the transmitted radiation (light). The exponential decrease of the radiation (light) depending on the thickness of the layer the radiation (light) is transmitted through, is demonstrated in Fig. 4.1. Fig. 4.1: Absorption of radiation (light) in the tissue. 45 There are more factors influencing the decrease of the radiation (light) intensity in a tissue. The thickness of the tissue the radiation (light) has to get through has the greatest influence on the decrease of the radiation’s (light’s) intensity. Further decrease of intensity is caused by the radiation (light’s) absorption in venous and arterial blood which passes through the tissue. The volume of arterial blood can be divided into the volume which is constant in the arteries, and the so called pulsing volume, which is dependent on the heart muscle’s pulsations. The absorption of radiation (light) transmitted through the tissue can thus be divided to a direct component (DC), given by the thickness of the tissue and the amount of the fixed volume of venous and arterial blood, and to an alternating component (AC), given by the volume of the pulsating arterial blood, see Fig. 4.2. These pulsations can be depicted via the so called plethysmographic curve, which in reality depicts the change in intensity of the transmitted radiation (light) in dependence on the change of the pulsating arterial blood’s volume. Fig. 4.2: Transparency of a live tissue with pulsating arterial blood. As we are interested in the oxygen saturation of the arterial blood, it will be suitable to only focus on the alternating component of absorption caused by the pulsating arterial blood. Oxygen transport in blood is realized via two mechanisms. The first one of these is a state when the oxygen is freely dissolved in the blood plasma. The amount of this oxygen, which is very small, is directly dependent on the oxygen partial pressure in the alveoli PAO2 and on the oxygen solubility in blood (at PAO2 = 13.33 kPa, there is about 1.4 % of blood O2 physically dissolved). The second mechanism of oxygen transport in blood is based on the oxygen bond with hemoglobin, which is a protein (chromoprotein) located in the erythrocytes. One hemoglobin can bind up to four molecules of O2. Depending on whether or not the oxygen is 46 bound to hemoglobin, we identify it as oxyhemoglobin (oxy-Hb) or deoxyhemoglobin (deoxy-Hb). The volume of oxygen transported in blood is thus directly dependent on the amount of hemoglobin in the arterial blood. Besides oxy-Hb and deoxy-Hb, hemoglobin also exists as carbaminohemoglobin (Hb-carbamate) with bound CO2 and methemoglobin (metHb), which is not capable of binding oxygen. The individual states of hemoglobin have different physical qualities due to different chemical bonds. That is why oxy-Hb has a different shape of the absorption spectrum curve compared to deoxy-Hb (absorption of Hb-Carbamate and met-Hb may be neglected due to their concentration in blood in physiological conditions). For deoxy-Hb it is true that it absorbs red light more. On the contrary, oxy-Hb absorbs infrared radiation more. To find out the oxy- and deoxy-hemoglobin concentrations, it is sufficient to use two radiation wavelengths; the LED (light emitting diodes) with a wavelength of 660 nm and 940 nm are usually used. Absorption curves of oxy-Hb and deoxy-Hb are depicted in Fig. 4.3. Wavelength of 750 nm can be considered as a transition from red into infrared spectrum area. The place in which the oxy-Hb and deoxy-Hb absorption curves intersect is called the isobestic point. 104 met-Hb 103 oxy-Hb ε(λ) (l·mol-1·m-1) 10 deoxy-Hb 2 Hb-karbamát 10 600 660 700 750 800 900 940 λ (nm) Fig. 4.3: Absorption spectra of the individual states of hemoglobin, loosely adapted from [4.4]. To determine the O2 saturation of arterial blood, we will thus measure the intensity of transmitted radiation (light) for both the wavelengths. The transmitted radiation (light) 47 consists of the direct component DC (absorption of light via a tissue with fixed amount of venous and arterial blood), and of the alternating component AC (absorption of light via pulsating arterial blood). Due to the fact that the photosensor (photodiode) sensing light transmitted through both the LED does not have the same sensitivity for both the wavelengths, we observe the alternating component of the light for both the wavelengths via the direct component. The ratio R of the standardized light components is expressed via the following equation: R= R AC / RDC , IR AC / IRDC (4.2) R - standardized ratio of the light intensities, RAC and RDC - alternating and direct components of red light, IRAC and IRDC - alternating and direct components of infrared radiation. To re-calculate the R ratio into O2 saturation in arterial blood (4.3), it is possible to use the equation (4.2) and the modified Lambert-Beer law equation (4.1). S a O2 = ε Hb (λR ) − ε Hb (λIR ).R x100% , ε Hb (λR ) − ε HbO (λR ) + [ε HbO (λIR ) − ε Hb (λIR )].R 2 (4.3) 2 SaO2 - oxygen saturation of arterial blood, ε Hb (λR ), ε Hb (λIR ) - deoxy-Hb absorption coefficient for red and infrared radiation (light), ε HbO2 (λR ), ε HbO2 (λIR ) -oxy-Hb absorption coefficient for red and infrared radiation (light), R - standardized ratio of radiation (light) intensities. Fig. 4.4: Conversion curve of R ratio and O2 saturation. 48 With (4.3) it is possible to calculate a theoretical conversion curve between the R ratio and oxygen saturation in arterial blood SaO2 (Fig. 4.4), which is used in calibrating pulse oxymeters. By performing comparative measurements of O2 saturation via the pulse oxymeter and blood gas analyzer, it is possible to create the so called empirical conversion curve. The conversion curve may be approximated by a linear equation, which may be used to calculate the O2 saturation. The resulting value of oxygen saturation in arterial blood SaO2 measured by the pulse oxymeter is marked as SpO2. The contents and the aim of the measurements Pulse oxymeters are diagnostic medical devices, which allow for monitoring of oxygen saturation in arterial blood. The devices are based on an optical principle, when radiation (light) is transmitted through vascular tissue. We measure the loss of the radiation (light) intensity in two wavelengths, which is absorbed by hemoglobin contained in erythrocytes. Depending on the representation of oxy-hemoglobin and deoxy-hemoglobin in blood, both the radiations with different wavelengths are absorbed in different rates. The aim of the measurement is to get acquainted with the function of pulse oxymeters and to verify their correct functioning by means of a SpO2 simulator, and further on to verify and measure managing and sensed signals on an analogous pulse oxymeter. Measurement tasks 1. Use the SpO2 simulator [4.5] to verify the correctness of measured values in several types of pulse oxymeters. Compare and record the set and the measured values. 2. Use the analogue pulse oxymeter and via an oscilloscope display the signal courses in the check points K1-K12, see Fig. 4.5. 3. Measure the voltage size R/IR in the check points K9, K10 and K13, K14 by means of a digital voltmeter (multimeter), use them in an equation 2 and calculate the ratio R, and read the particular saturation value from a curve in Fig. 4.4. 4. Use edutools for sensing the plethysmographic curve to display the plethysmographic curve on the oscilloscope and watch how its shape changes in held breath and under the influence of movement artefacts. Read the size of heart frequency from the plethysmographic curve; draw the course of the plethysmographic curve. 49 Fig. 4.5: Schematic diagram of the edutool - a model of an analogous part of a pulse oxymeter with marked check points. 50 Measurement procedure Ad task 1) ATTENTION: Supply the SpO2 simulator form a 12V source with the positive pole on the cover and the negative pole on the pin, see the bottom of the apparatus!!! The SpO2 simulator has etalons available - “artificial fingers” with different nominal values of SpO2. Try to attach the available etalons one by one to the simulator and place the pulse oxymeter clips on them with a SpO2 scanner. For each SpO2 value of the etalon gradually set all the pulse rate defaults on the simulator. Compare and record the selected SpO2 values and pulse frequencies with values on the pulse oxymeter. When attaching the pulse oxymeter clips on the etalons, be patient and try to attach them as precisely as possible to the beginning of the “artificial finger”. A demonstration of the SpO2 simulator setting with attached pulse oxymeter on the etalon is presented in Fig. 4.6. Fig. 4.6: A SpO2 simulator setting with tested pulse oxymeter. Ad task 2) Connect the analogue pulse oxymeter edutool (Fig. 4.7 on the left) via contact plugs to the power supply +5 V and to the symmetrical power supply ±15 V. Attach the specialized probe with a finger clip to the CAN 9 connector. Perform the edutool calibration; the switch being in position 2 and the clip without inserted finger. The courses in the check points K11 and K12 should have the same amplitude (eventually adjust via variable resistors). If the output values at both the channels remain different, their ratio gives us the correction constant. Use the measurement probe on the oscilloscope to gradually display and compare the signals from the check point of the analogue pulse oxymeter. The individual check points have the following 51 meaning: K1 - oscillator’s clock pulses, K2, K3 - managing impulses of the R/IR diodes, K4 - output signal of the input amplifier, K5, K6 - managing signals of the S/H circuits, Sample and Hold circuits, K7, K8 - sensed signal divided into two channels, K9, K10 - DC (direct) components of the R/IR signal (measure by means of a digital voltmeter/multimeter), K11, K12 - AC (alternating) components of the R/IR signal, K13, K14 - voltage value of the VppAC component of the R/IR signal (measure by means of a digital voltmeter/multimeter). Record the signals from the check points K4, K7, K8, K11 and K12 into charts. Fig. 4.7: An edutool of a pulse oxymeter’s analogue part (left) and an edutool for sensing the plethysmographic curve (right.) Ad task 3) Use the digital voltmeter/multimeter to measure the values of RDC and IRDC - the direct components of red light and infrared radiation in check points K9, K10, and the values of RAC and IRAC - alternating components of red light and infrared radiation in check points K13, K14. Establish the measured values into (4.2) and calculate the ratio R. Read the particular saturation value from the chart in Fig. 4.4. Ad task 4) A specialized probe with a finger clip is attached to the edutool for sensing the plethysmographic curve (Fig. 4.7 on the left). You must be very careful in manipulating with this probe. Namely the supply cable must not be twisted. If you look inside the clip, you will see a soft lining and inlets for the transmitting and receiving diodes. There are two potentiometers on the edutool, one marked as OFFSET, which allows for setting a shift of the entire curve in a vertical direction, and the other marked as GAIN, which allows for setting a 52 suitable gain/amplification to display the curve within the full possible dynamic range. Connect the edutool to the oscilloscope by means of a coaxial cable with BNC connectors. Display the plethysmographic curve on the oscilloscope and watch how its shape is changing in held breath and under the influence of movement artefacts. Read the heart frequency from the plethysmographic curve, and draw the course of the plethysmographic curve. Apparatus and aids used • SpO2 simulator SpO2-200 pulse oxymetry simulator (BD Biomedical, USA) • Edutool - model of the pulse oxymeter’s analogous part (ČVUT in Prague) • Edutool for sensing the plethysmographic curve (ČVUT in Prague) • Probe for sensing the plethysmographic curve • Multimeter and cables terminated by a contact plug • Two-channel oscilloscope, including 2 probes and a coaxial cable • Adjustable double power supply (2x0-30 V, 1x5 V), including 6 supply conductors terminated by a contact plug. Measured results Elaborate the measurement protocol from the laboratory task. Record the measured values from task 1 for the individual pulse oxymeters into tables. Draw the measured signal courses from task 2 into charts with descriptions of the axes and a corresponding scale. Record the measured values from task 3 into a table and write out the calculation of the R ratio. Add the resulting SpO2 value read from the conversion curve in Fig. 4.4 into the table of measured values. Draw the plethysmographic curve from task 4 into a chart with descriptions of the axes and a corresponding scale. Add important parameters describing the course of the curve in the chart. Conclusion Briefly comment on each measurement point in the measurement protocol. Evaluate the measured results and compare with data stated by the pulse oxymeter’s manufacturer in the operation manual (ask your teacher for the operation/user manual). Determine the type of the applied part the apparatus works with, the (electrical) insulation class, and the MD classification class. 53 Check‐up questions regarding the given issue 1) Why is pulse oxymetry called “pulse”? 2) What is the principle for sensing the plethysmographic curve? 3) What are the sample and hold circuits (abbreviated to S/H) used for in the electrical circuit of the pulse oxymeter’s analogous part? 4) What general properties are important for the pulse oxymetry probes? References to used and recommended information sources [4.1] Design of pulse oximeters / edited by J.G. Webster. - Bristol; Philadelphia: Institut of Physics Pub., 1997, xvi. 244 s.: ISBN 0-7503-0467-7. [4.2] Gravenstein, J.S. : Gas monitoring and Pulse oximetry. Stoneham: Butterwort – Heinemann, 1990. 140 s.: ISBN 13: 9780409902617 [4.3] Hozman, J. Praktika z biomedicínské a klinické techniky. Vyd. 1. V Praze: ČVUT, 2008. 154 s.: ISBN 978-80-01-03956-4. (in Czech) [4.4] Silbernagl, S. Atlas fyziologie člověka / 6. vyd., zcela přeprac. a rozšíř. Praha: Grada, 2004. 435 s.: ISBN 80-247-0630-X. (in Czech) [4.5] Pulse oximeter simulator, SPO-2000. User manual, Rev. 02. BC GROUP INTERNATIONAL, INC., USA. 04/2006 54 5. Principles and application of infusion pumps and linear infusion pumps Infusion technology plays an important role in correct treatment of patients in the AR and IC units. This infusion technology ensures both continual and dose supply of drugs, supporting medicines, nutrition, etc. Compared to conventional system of drug administration, i.e. by the staff, gravitational or intravenous administrations, etc., they are capable of precise dosing, or eventually they also automatically control emergency situations, etc. Generally speaking, we can divide the infusion technology into two subsections. First, we speak about the so called infusion pumps, and then there are linear infusion pumps. Infusion pumps Infusion peristaltic pumps, or peristaltic infusion pumps, volumetric pumps ensure continuous supply of a substance in defined volume and over time. As opposed to the gravitational means of infusion, also called “dropping” in slang, they have precisely defined volume of the dose in time, and moreover, they have an alarm to notify the medical personnel in time about possible complications, such as the leakage of the substance, or its lack, etc. And besides, it is also possible to simply set the required occlusion pressure, via turning the pump, without the need of lifting the storage bag above the patient. There are several partial blocks to the infusion pumps, being the actual peristaltic drive, further controlling logics, bubble detectors, occlusion pressure sensor, back-up power supply. Then there are mechanical and structural elements, naturally, such as the mounting of the intravenous set, the mounting to the bed, or eventually a stand with more technology, remote access interface and a terminal, etc. Peristaltic drive of the medium Infusion pumps in principle use the peristaltic means of drawing the media. This method has several advantages and at the same time some disadvantages in comparison with other types of drawing the media, such as gear pumps, centrifugal, vane and other pumps. One of the unquestionable advantages of using the peristaltic pump is the fact that the actual pump is only in contact with the external coating of the tubing with the drawn medium, i.e. the IV set. This method thus guarantees the sterility of this set, as correct utilization does not allow for contamination of the internal premises of this set. Moreover, it is not necessary to sterilize 55 the entire pump for new utilization, but the entire set is again replaced. In case of using the above mentioned pumps, the medium flows directly through the pump’s body in such a way that it gets in contact with this pump’s mechanical elements. It is possible to sterilize these surfaces (chemically, thermally, etc.), yet the act itself is rather complicated and requires the removal of the actual drawing head, etc. Certain disadvantage of the peristaltic pumps lies in the fact that flexible tubing is used as a drawing element, and this tubing is compressed in regular intervals. That may lead to impairing this part of the tubing, or to even a partial rupture thereof, which then results in contamination, or eventually its full avulsion means the drawing does not continue. Commercially used infusion pumps basically use two types of peristaltic drive. It is a rotation system with two and more stoppers, or a system with a linear wave. Rotation systems Rotation systems consists of a rotor with rollers, so called stoppers, which compress the flexible tubing, and the rotor’s rotation causes the advancement of the liquid inside the tubing. There are several versions and arrangements. One of the aspects of the rotation peristaltic pumps is in the mounting system of the tubing. There are two versions, either with a supporting trail or without it. The version without the supporting trail is the simplest constructionally speaking, yet it is only suitable for certain types of tubing, it requires special mounting, and is rather used for other applications (dispensing chemicals, in clinical analyzers, etc.). This version is depicted in Fig. 5.1. Fig. 5.1: Rotation peristaltic heads, without the supporting trail. However, the so called pumps with supporting trail are much more common in the area of linear infusion pumps, with the tubing not being taut over the individual stoppers, but rather being pressed to them. These are the systems with the so called supporting trail. These 56 systems are used in infusion pumps, as they are not so selective regarding the tubing materials used, and moreover, it is possible to use various sizes, etc. This system is depicted in Fig. 5.2. Fig. 5.2: Rotation peristaltic head with the supporting trail. Other differences in the construction can be found in the number of the individual stoppers that get into contact with the tubing. There are many versions, the basic one being with two stoppers, but there are also versions with 3 and more, up to 12 stoppers. These versions are applied in other applications, such as chemicals dispensers, analytical apparatus, etc., due to better tightness, lesser attrition of the tubing, they do not create too big pulse waves, etc., yet they are more difficult constructionally speaking, as the tubing installation is more complicated, etc. Multi-stopper system can be seen in Fig. 5.3. Fig. 5.3: Eight-stopper system for the ISMATEC cartridges, used to dispense media in process chemistry and biology. 57 Concerning infusion dispensing, only the version using two stoppers and a supporting trail is used. This arrangement, together with the principle of the function, can be seen in Fig. 5.4. Fig. 5.4: Drawing principle by means of a rotation peristaltic head. This arrangement is very simple regarding maintenance, insertion of new tubing/set, etc. The picture depicts a peristaltic head with an inserted set. This configuration is also used in other applications, such as, for example, the blood pump in dialysis, the extra-corporeal circuit, etc., see Fig. 5.5. Fig. 5.5: Peristaltic pumps in Gambro AK-100 haemodialysis. The actual rotor is driven by an engine equipped with the revolutions’ and position encoder, and also by a gearbox. The most commonly used are brush DC motors or stepper motors. 58 Linear systems of the medium drive The second version used for drawing the media using the peristaltic transfer of the liquid is represented by the so called linear peristaltic drives. These drives use a linear peristaltic wave, which drives the medium in the tubing. This linear system is depicted in Fig. 5.6. Fig. 5.6: Drawing principle via a linear peristaltic head. As opposed to the rotation systems, these systems are much smaller, while keeping the same dispensing volume; yet this is compensated for by a more complex internal realization, and furthermore, these systems require specially designed sets with typed tubing for the given mechanism, so it is not possible to simply switch the sets, etc. Infusion pump with a linear system is depicted in Fig. 5.7. Fig. 5.7: An infusion pump with a linear peristaltic drive with installed set. 59 Linear infusion pumps Linear infusion pumps are used for similar purpose as the infusion pumps - to administer drugs. As opposed to the infusion pumps, however, they are modified for precise dosing of small volumes, which are dispensed via a syringe placed in such a dispenser. The substance in the syringe is pushed out via the injection dispenser’s arm. Fig. 5.8: Linear dispenser with installed syringe. Other systems in infusion technology Besides the actual medium drive, the infusion pumps and linear infusion pumps contain other supporting systems controlling the correct functioning and correct administration of the respective drug. The so called occlusion pressure sensor monitoring the pressure of the medium within the set represents one of these systems. High value may mean, for example, the obstruction of the set, its constriction, etc., and the other way round, low or zero value may mean, for example, a disrupted or disconnected set. Another system is the so called bubble detector, which checks the homogeneity of the dispensed mix. The presence of a bubble may cause even severe medical complications, should such a bubble get into the bloodstream. A deviation from normal state in these systems activates a visual and acoustic alarm. General legislation STC (safety-technical check), which ensues from Law No. 123/2000 Coll., more specifically from Chapter 27 thereof, is one of the most common activities of a biomedical technician in a medical facility. STC stem from the necessity to check and verify the parameters of medical devices in their clinical operation. This concerns devices with a capacity of potential damage to the patient’s health in case of malfunction or impaired 60 measurement accuracy. Another requirement stems from the standard ČSN EN 60601-1, which deals with electrical safety, both from the point of view of the attending staff, and of the patient. It is namely an inspection of the device’s insulation state, in order to prevent possible injury by the electrical current. The contents of the above mentioned legislation will be described in greater detail in the text below. Law No. 123/2000 Coll. on medical devices and on changing some related laws. Among other things, it determines the basic requirements for maintaining medical devices throughout their technical life. Conditions for using the medical devices are stated in Chapter 4. Medical devices must meet the technical parameters given by the manufacturer throughout the period of use. The law in this respect forbids using the MD if there is a reasonable suspicion that the safety and lives of users or third persons are endangered, or if their usable life determined by the manufacturers or importers has expired. According to Chapter 24, health care providers are obliged to adopt such measures in medical devices with measuring functions that will guarantee sufficient accuracy and reliability of measuring. The provider thus must guarantee meeting the conditions ensuing from the Law on metrology No. 505/1990 Coll., as amended. In case of assigned gauges, this means their verification within the statute of limitation, and in case of assigned gauges, it is necessary to keep their calibration within the time limits recommended by the manufacturer. Periodical safety-technical checks of medical devices are specified in Chapter 27. The Ministry of Health may determine the types or classes of MD to be periodically checked by a public notice. Here the term “periodical safety-technical check” appears, abbreviated to PSTC. This chapter directly orders to maintain the safety of MD, in our case specifically the electrical safety of the medical device, its function, i.e. the requirement for the medical device to reach technical parameters set in the manufacturer’s technical specification. These two requirements cannot be separated from each other. Last but not least, specification of the maintenance and service of the medical devices is described in Chapter 28. Medical devices must be, in accordance with the manufacturer’s instructions, professionally, repetitively, and demonstrably kept in such a state by treatment and regular checks to guarantee their functioning and safety throughout their usable life. PSTC and service may only be carried out by a person with professional training, experience, knowledge of legal regulations and technical standards, and completed training. Other standards regarding the safety of MD: 61 ČSN EN 60601-1, Part 1, General requirements for essential safety and necessary functioning This is a basic standard from an entire set of technical standards ČSN EN 60601, which define general technical requirements for the realization and electrical safety of medical devices. Among other things, the standard specifies the requirements for the so called applied part. The applied part can be found in most medical devices; it is used for diagnostics or for treatment. The standard divides the applied parts into groups: B, BF and CF. The CF applied parts are subject to the strictest requirements, as they are used for invasive operations on the patient. In case of defibrillators, directly on the patient’s heart. ČSN EN 62353 Electrical medical devices Repetitive tests and post-repair tests of the electrical medical devices. The standard defines the essential requirements for carrying out periodically repeated checks and tests following repairs of the medical devices. It deals with the issue of electrical safety of the apparatus and functional tests of medical devices. It is a parallel to the standard ČSN 331600 for checking electrical appliances. The aim and the contents of the measurements The aim of the measurement will be to elaborate the PSTC protocols, which in their contents and form correspond to the real protocols you may encounter in your practice. It is namely important to become acquainted with the PSTC elaboration methodology and the concept of the measuring/testing apparatus. With its contents, the PSTC protocol covers a wide spectre of evaluation parameters of the medical devices, from mechanical, physical and electrical points of view. Measurement tasks: 1) PSTC protocol for the infusion pump ARCOMED Siramed µSP6000. 2) PSTC protocol for the linear infusion pump ARCOMED Volumed µVP7000. 3) PSTC protocol for the infusion pump SEV LITOVEL 2P. 4) PSTC protocol for the linear infusion pump POLYMED ID 20/50. Apparatus and aids used • ARCOMED Siramed µSP6000 • ARCOMED Volumed µVP7000 62 • SEV LITOVEL 2P • POLYMED ID 20/50 • GOSSEN METRAWATT SECULIFE-IF + ACCESSORIES • ILLKO REVEX 2051 + ACCESSORIES • LUER syringe - 20 ml, 50 ml • 500ml beaker • Infusion set Procedure of the PSTC elaboration: 1) Carry out a detailed inspection of the apparatus for mechanical damage. 2) Check the integrity of the supply cable. 3) Check the functioning of the signalizing and controlling elements. 4) A - Measure the value of the leakage current of the apparatus and the resistance of the protective grounding (for ARCOMED Siramed µSP6000 and Volumed µVP7000). B - Measure the value of the insulation resistance of the apparatus and the leakage current via the cover of the apparatus (for SEV LITOVEL 2P and POLYMED ID 20/50). 5) Carry out the verification of the apparatus’ functional parameters, according to the items of the particular PSTC protocol. For the above mentioned apparatus in points (1 to 4) carry out the tasks (1-5) and record the results in the protocol, confirm meeting or not meeting the parameters declared in the protocol. Measurement procedure 1) Carry out a detailed inspection of the apparatus for mechanical damage. Check the apparatus very carefully to detect cracks; check namely the plastic moving mechanisms, which may show mechanical damage more frequently. Verify the function of the apparatus’ mechanical parts; the moving components must move freely without any marked resistance, yet should they have an arrest in the end position, then they must not be released from this position without exerting reasonable strength. Record the findings into the PSTC protocol by means of checking the cell “Satisfactory“. 63 2) Check the integrity of the supply cable While checking, focus namely of the cable terminations, in place where the cable enters the termination. This is the place where the external insulation layer often crackles. Verify that the insulation is compact throughout the cable’s length and that the cable shows no signs of breaking or notching. Any occurrence of bulging on the cable is also unallowable, as it demonstrates damage of the conductors inside. Record the findings in the PSTC protocol by means of checking the cell “Satisfactory”. 3) Check the functioning of the signalizing and controlling elements Examine all the optical signalizing elements for missing function descriptions. Check the mechanical running of the controlling elements (the buttons must be easy to push, rotation switches must exert adequate resistance in switching and they must not allow for turning the entire revolution). In membrane buttons, check the integrity of the top foil with function descriptions, as it must not be perforated in any place. The LCD display must not show signs of mechanical damage. After switching the apparatus on (in accordance with the operation manual), check whether all the optical signalizing elements meet their function. Record the findings in the PSTC protocol by means of checking the cell “Satisfactory”. 4) A - Measure the value of the leakage current of the apparatus and the resistance of the protective grounding (for ARCOMED Siramed µSP6000 and Volumed µVP7000) To measure the protective conductor’s resistance, proceed in accordance with the user manual of REVEX 2051. Detailed measurement procedure can be found in chapter 4.1.1. on page 13. During the measurement, follow the instructions of the trainer and always proceed only in accordance with the manual of REVEX 2051. Record the result into the PSTC protocol and compare with the recommended maximum value stated in the protocol. Confirm whether the machine passed. To measure the value of the apparatus’ leakage current, proceed in accordance with the user manual of REVEX 2051. Detailed measurement procedure can be found in chapter 4.4.1 on page 26. During the measurement, follow the instructions of the trainer and always proceed only in accordance with the manual of REVEX 2051. Record the result into the PSTC protocol and compare with the recommended maximum value stated in the protocol. Confirm whether the machine passed. 4) B - Measure the value of the insulation resistance of the apparatus and the leakage current via the cover of the apparatus 64 (for SEV LITOVEL 2P and POLYMED ID 20/50) To measure the apparatus’ insulation resistance, proceed in accordance with the user manual of REVEX 2051. Detailed measurement procedure can be found in chapter 4.3.1 on page 22 (for SEV LITOVEL 2P) and 4.3.2 on page 23 (for POLYMED ID 20/50). During the measurement, follow the instructions of the trainer and always proceed only in accordance with the manual of REVEX 2051. Record the result into the PSTC protocol and compare with the recommended maximum value. Confirm whether the machine passed. To measure the leakage current via the apparatus’ cover, proceed in accordance with the user manual of REVEX 2051. Detailed measurement procedure can be found in chapter 4.4.1 on page 26 (for SEV LITOVEL 2P) and 4.4.2 on page 27 (for POLYMED ID 20/50). During the measurement, follow the instructions of the trainer and always proceed only in accordance with the manual of REVEX 2051. Record the result into the PSTC protocol and compare with the recommended maximum value. Confirm whether the machine passed. 5) Carry out the verification of the apparatus’ functional parameters, according to the items of the particular PSTC protocol For a complete analysis and testing of the infusion technology, use the apparatus SECULIFE IF. Prior to the actual measurement of the infusion technology parameters, set up the measurement apparatus according to the operation manual of SECULIFE IF, page 11, chapter 3. Two modes will be used for the measurement: The mode for measuring occlusal pressure is described in chapter 4.3.2 on page 27. Before you start measuring, make sure the system is correctly irrigated and that the three-port valve is in the “ON” position, see chapter 3.2, page 13 of the operation manual. Record the result into the PSTC protocol and compare with the recommended maximum value. Confirm whether the machine passed. The mode for measuring the flow is described in chapter 4.3.1 on page 27. Before you start measuring, make sure the system is correctly irrigated and that the three-port valve is in the “ON” position, see chapter 3.2, page 13 of the operation manual. Record the result into the PSTC protocol and compare with the recommended maximum value. Confirm whether the machine passed. The actual set up of the measurement mode can be found in chapter 4.4 of the operation manual. Occlusal pressure measurement can be launched to advantage during the flow measurement. 65 To check the bubble detector, turn the infusion bottle in such a way as to allow for a small amount of air (a bubble) to be sucked into the infusion pump’s infusion set. Then wait whether the alarm sets off when the bubble passes through the infusion pump. Set up the infusion pumps and linear infusion pumps according to the measured parameters in the particular PSTC protocol. The actual controlling and set up for the individual parameters can be found in the respective operation manuals for each apparatus. Measured results Record the results in the individual protocols. Be particular about the level of the records, as in reality, crossed out PSTC protocol is legislatively non-permissible. Check‐up questions regarding the given issue • What is the occlusal pressure? • What is the functional difference between the infusion pump and the linear infusion pump? • What is the sense of PSTC? • Which legislative document describes the necessity of carrying out the PSTC? References to used and recommended information sources [5.1] Wesbter, J.G. ed. Encyclopedia of Medical Devices and Instrumentation. Wiley. [online]. c1999-2009, poslední aktualizace 17. 8. 2008 [cit. 2009-05-12]. Dostupné z WWW: http://mrw.interscience.wiley.com/emrw/9780471732877/home/ [5.2] Rozman, J. a kol. Elektronické přístroje v lékařství. Praha: Academia, 2006. 406 p. (in Czech) [5.3] Zákon č. 123/2000 Sb., zdroj: SBÍRKA ZÁKONŮ ročník 2000, částka 36, ze dne 12.5.2000. (in Czech) [5.4] ČSN EN 60601-1-2. Zdravotnické elektrické přístroje: Všeobecné požadavky na bezpečnost. 02/2003. (in Czech) [5.5] ČSN EN 62353. Zdravotnické elektrické přístroje: Opakované zkoušky a zkoušky po opravách zdravotnických elektrických přístrojů. 8/2008. (in Czech) 66 6. Using the patient simulator and breathing simulators in the area of ventilation technology Theoretical introduction Artificial lung ventilation is used as a technology substituting spontaneous breathing in case of the patient’s respiration failure. It is a rather old method, currently rather widespread and very frequently used. So far, many different types of ventilators have been constructed, and many different ventilation methods have been developed, respecting the patient’s breathing efforts, and minimizing adverse effects of artificial lung ventilation, yet the mortality of patients suffering from breathing failure is still too high - around 40 %. In patients with combined complications, mortality reaches an even higher percentage. For example, occurrence of haematological complications increases mortality of patients caused by respiration failure to up to 60 %. Using standard ventilator regimens and methods without any changes and modifications does not succeed in further reductions of mortality in case of respiration failure. The modifications and approaches include everything - from minor (at first sight) changes and additions, all the way to substantial changes in approaching ventilation and the development and change of the entire ventilation modes. There is a common goal in all these modifications: to minimize the negative influence of artificial lung ventilation on the ventilated patient. A majority of the currently used artificial lung ventilation regimens can be marked by summarizing term “positive-pressure ventilation”. Despite its nearly exclusive use in the clinical practice, this is the less suitable type of ventilation, when the lung is subject to pressure inversion compared to the normal state in spontaneous breathing. During inspirium, spontaneous ventilation creates a negative pressure in the lungs towards their surrounding, which causes the flow of gas from the surrounding atmosphere into the lungs. On the contrary, during inspirium in the positive-pressure artificial lung ventilation, the pressure generated by the ventilator, affecting the beginning of the airways and thus also the entire respiration system, is greater than the atmospheric pressure. The positive pressure, among other things, has negative influence on the circulation system as well as on the lungs as such. During expirium, the pressure balance between spontaneous and artificial breathing is also inverted. The said pressure inversion causes the “non-physiological character” of the positivepressure ventilation modes, which leads to the lung distress caused by the “treatment” 67 application of the artificial lung ventilation, together with other risks, such as a greater infection risk, oxygen toxicity in its increased faction in inspired gas, etc. Such lung distress is identified as the “lung distress caused by artificial lung ventilation”. The modern trend thus prefers the so called protective ventilation modes, the main goal of which is to reduce the adverse effects of artificial lung ventilation on the patient. The contents and the aim of the measurements The aim of this task is to introduce the artificial lung ventilation to the students. Particular options will be demonstrated on the Veolar apparatus manufactured by Hamilton Medical (Fig. 6.1), which will be connected to the breathing simulator. Veolar represents the conventional artificial lung ventilation. Within the framework of the measurement, you will become acquainted with the controlling and monitoring panels, and also with the alarms guarding the basic parameters used during patient ventilation. Fig. 6.1: Conventional ventilator VEOLAR manufactured by Hamilton Medical. Ventilation modes After switching the apparatus on, it is necessary to select the ventilation mode. The mode is selected by holding the button with the name of the ventilation mode in the left part 68 of the controlling panel [6.3]. The Hamilton ventilator supports the following ventilation modes: • (S)CMV – (Synchronized) Controlled Mechanical Ventilation • SIMV – Synchronized Intermittent Mandatory Ventilation • Spont – Spontaneous Support • MMV – Minimum Minute Ventilation • PCV – Pressure Controlled Ventilation (S)CMV ventilation mode (Synchronized) Controlled Mechanical Ventilation is the basic mode of artificial lung ventilation. It fully substitutes the patient’s breathing. That means that every breath is controlled by the ventilator. Breathing frequency is set by the operator or controlled by the patient (assisted ventilation) in case of setting the trigger. In this mode, the following parameters may be set up, marked by luminous spots: fCMV - ventilation frequency, VT - breathing volume, I:E - relative length of inspirium and expirium, Flow Pattern - the shape of the inspiratory curve, Pressure Trigger - pressure trigger, PEEP - positive end expiratory pressure, Oxygen - oxygen fraction in the inspiratory mix, Flow Trigger - flow trigger. Synchronizing the ventilator with the patient’s breathing activity is only possible when one of the triggers has been activated (Pressure Trigger or Flow Trigger). SIMV ventilation mode Synchronized Intermittent Mandatory Ventilation is a ventilation mode, which allows for two types of breathing: spontaneous and assisted (controlled). Spontaneous breathing is detected by the ventilator, which opens the inspiratory valve upon recognizing the patient’s breathing activity. The second type of breathing is the so called synchronized substitution breathing, which is synchronized according to the patient’s breathing frequency by his inspiratory efforts, or it has the character of fully controlled breathing. In this mode, the following parameters may be set up, marked by luminous spots: fCMV and fSIMV - ventilation frequency, VT - breathing volume, I:E - relative length of inspirium and expirium, Flow Pattern - the shape of the inspiratory curve, Pressure Trigger - pressure trigger, PEEP - positive end expiratory pressure, CPAP - continuous positive airway pressure, Oxygen - oxygen fraction in the inspiratory mix, Flow Trigger - flow trigger. 69 Spontaneous breathing ventilation mode (SPONT) This mode is designed for patients with spontaneous breathing activity and is used for its support and greater effectiveness. VEOLAR offers the following support options: supply of air enriched with oxygen, continuous positive airway pressure (CPAP) and inspiratory assistance during inspirium (pressure support). In this working mode, the ventilator functions as a “DEMAND” system, providing the patient with the needed gas flow in selected pressure values of CPAP or inspiratory assistance. The flow is controlled in such a way as to ensure expirium of sufficient length. In this working mode, the patient determines the required breathing volume and the breathing frequency, having given values of the inspiratory assistance’s positive pressure. It is possible to select “back up” ventilation in case of apnoe. In the SPONT mode, the following parameters may be set up, marked by luminous spots: Pressure Trigger - pressure trigger, CPAP - continuous positive airway pressure, Oxygen - oxygen fraction in the inspiratory mix, Flow Trigger - flow trigger. MMV ventilation mode Minimum Minute Ventilation. This ventilation mode allows for spontaneous breathing with automatic inspiratory assistance, the pressure value of which is selected directly by the ventilator. In MMV, the patient gets, if necessary, breathing assistance on the level of inspiratory assistance, yet no controlled breaths. MMV ensures the patient’s minute ventilation automatically on the level of the pre-set minute ventilation. In this mode, the following parameters may be set up, marked by luminous spots: Pressure Trigger - pressure trigger, CPAP - continuous positive airway pressure, Oxygen oxygen fraction in the inspiratory mix, Flow Trigger - flow trigger, MMV - minimum minute ventilation - to be set up via the ∧∨ buttons, followed by pushing the YES button on the Alarm panel. Just like in the SIMV or Spont modes, the trigger must be set optimally. If the trigger is switched off, the apparatus will automatically set the alarm off. During the first breaths, the patient may breathe in the way corresponding to the set inspiratory assistance. The ventilator compares the volume of the patient’s first eight breaths by converting them to one minute with the set-up MMV value. If there is a deviation of the minute ventilation from the set-up value, the balancing of the deficit starts by means of increasing the pressure support. A change of the pressure support is carried out gradually, step by step, and depends on the size of the difference between the actual and the required minute ventilation. 70 Throughout the MMV, the ventilator always assesses the last 8 breaths and converts their volume to the expected minute volume. This automatic regulatory process is functional within the limit of 3 kPa over CPAP and within 5 kPa absolutely. In case of alarm, the inspiratory pressure support remains constant until the cause of the alarm is cleared up and removed. In the MMV mode, the ventilator always reacts to the set-up of the inspiratory assistance (Pinsp). Both the initial value and the minimum value are set. The actually applied pressure support may be greater than the one that was set up, even in case of introducing distension treatment with the aim to keep the lung sufficiently stretched. The user may calculate the value of the set-up pressure support from the difference between the measured maximum pressure and the CPAP value. The pressure control ventilation PCV mode In the PCV (pressure control ventilation) mode, the guiding quantities are the inspiratory pressure and time. In the CMV and SIMV modes, the breathing volume (VT) is the decisive parameter. The pressure volume in CMV may be set up all the way to the value of 99 cm of H2O. During the PCV cycle, the initial flow is rather high, which allows for a fast increase of pressure to the pre-set value. Subsequently, the flow is regulated so that the inspiratory pressure remains constant in the following course. Setting up the I:E ration, as well as the inspiratory plateau and the expiratory time is the same as in (S)CMV or SIMV. In the pressure control ventilation (PCV), there is pressure variation in such a way as to achieve the predestined inspiratory time. The breathing volume is not preset and depends on many factors, among else on the pressure gradient, the peak flow, the breath’s flow characteristics, and last but not least on the compliance of the respiratory system and the resistance of the airways. PCV is similar to the inspiratory assistance, but there is a difference in the fact that PCV takes into account the pressure course in time. Pressure control ventilation can be used as classical ventilator controlled ventilation (PCMV), or else in the SIMV mode (PSIMV), where it determines the characteristics of the guided breath. PSIMV is very similar to the SIMV mode. It is characteristic for the set-up of a certain number of pressure controlled breathing cycles with the course’s time control. These breaths are synchronized by means of a trigger with the patient’s spontaneous breathing activity. Between these breaths, the patient may breathe spontaneously. 71 Spontaneous breathing may take place in the mode of continuous positive-pressure breathing or inspiratory assistance up to the positive pressure value of 50 cm of H2O (depending on the pressure limit). In the PCMV mode, the following parameters can be set up, marked by luminous spots: fCMV and fSIMV - ventilation frequency, PCV - pressure, I:E - relative length of inspirium and expirium, Pressure Trigger - pressure trigger, PEEP - positive end expiratory pressure, CPAP - continuous positive airway pressure, Oxygen - oxygen fraction in the inspiratory mix, Flow Trigger - flow trigger. In the volume-guided breath (CMV or SIMV), the gas flow is managed in such a way as to supply the pre-determined volume in a given time interval in the given pre-determined flow profile. The resulting pressure is a variable quantity and depends on the lung compliance, as well as on the resistance of the airways and the tracheal tube. Measurement tasks 1) Calculate minute ventilation for different combinations of values of the ventilation frequency and breathing volume, which can be set up on the Veolar ventilator. Consider the anatomical dead space of an adult person in the value of approximately 160 ml. For the above mentioned combinations, count the alveolar ventilation and compare it with minute ventilation. 2) Carry out the calibration of the flow screening according to the trainer’s instructions. 3) Connect the ventilator to the artificial lung or the lung simulator according to the trainer’s instructions. 4) Set up the CMV mode on the ventilator with physiological parameters according to the trainer’s recommendation, and observe the ventilator’s monitoring part. 5) Observe the PEEP (positive end expiratory pressure) parameter’s influence on the ventilation parameters. 6) Observe the influence of the I:E parameter (the ratio between the inspirium and expirium time) on the ventilation course. 7) Observe different types of flow profiles. 8) In the monitoring part, observe the ventilation parameters, such as PIP (peak inspiratory pressure), etc. 9) Find out the mechanical properties of the lungs on the ventilator, simulated by the connected model. Observe the change in the flow resistance and the change in the lung compliance. 72 Measurement procedure ad 1) Calculate the minute ventilation according to the relation (6.1): (6.1) V M = Vt ⋅ f , and the alveolar ventilation according to the relation (6.2): (6.2) V A = (Vt − VD ) ⋅ f , where VM is minute ventilation, Vt is tidal volume, f is breathing frequency, VA is alveolar ventilation and VD is anatomical dead space (approx. 160 ml for an adult person). Record the calculated values in Tab. 6.1. Tab. 6.1: Values of minute and alveolar ventilation for different combinations of breathing volume and breathing frequency. f = 12 d/min, f = 15 d/min f = 18 d/min Vt = 0,625 L Vt = 0,5 L V t = 0, 425 L V M - Minute ventilation [L/min] V A - Alveolar ventilation [L/min] Before the actual measurement, become acquainted with the Veolar ventilator on which the measurement will take place. Ventilation parameters Front panel of the Veolar ventilator is divided into three basic parts: controlling (“Control” panel), monitoring (“Patient Monitor”) and the part with alarms (“Alarm” panel). The controlling part (Fig. 6.2) is used for setting up parameters determining the character of the actual ventilation. 73 Fig. 6.2: Controlling panel of the ventilator. The individual parameters of artificial lung ventilation are set up on the controlling panel: • Ventilation frequency (fCMV) - frequency of guided breathing. The frequency may be set up as the number of breaths per minute. • Tidal volume (VT) - to be set up by means of the VT button. It is the volume of air in one inspiration. In some modes, e.g. the pressure-guided ventilation, this parameter cannot be set up. • Inspiration and expiration time, the ratio of the inspirium and expirium time (I:E) these are determined by the guided breathing frequency and the ratio of the inspirium and expirium time (I:E) (%). The percentual set-up of the cycle determines the ratio between inspirium and expirium. This set-up divides the entire breath cycle (100 %) to the inspiration and the expiration stage. Fig. 6.3 depicts a typical pressure and flow curve for a certain set-up of the I:E ratio. The light button determines the start of expiration, thus also the I:E ratio. If the upper button is set to 25 %, the scale is divided into two segments. In this way, the duration ratio I:E is set to 1:3. The I:E ratio is displayed on the monitor of the patient’s ventilation functions. Inspiration time is determined by the lower dark button. Usually, this button is in contact with the expiration button. That means no time for inspiration delay - plateau (see below) has been set up. Expiration time is set up in percentage and determines when the inspiration ends and the expiration starts. It is set up by the upper light button. 74 Fig. 6.3: Setting up the I:E ratio. Example: Breathing frequency fCMV is 15 breaths per minute. That corresponds to the duration of the entire breathing cycle of 4 seconds. If the expiration button is set to 75 %, then the inspiration will last 25 % of the entire breathing cycle. The I:E ratio in this case is 1:3. That means inspirium lasts for 1 second and expirium lasts for three seconds. • Inspiration delay time, the so called plateau time (tplateau) - inspiration time may be divided into active (insufflation) and passive (plateau) parts. This so called passive inspiration time is called the inspiration delay, or sometimes the inspiration pause. Fig. 6.4 depicts the set-up in the I:E ratio being 1:1 (expiration time, i.e. the upper light button, is set to 50 %). Inspiration time (lower dark button) is set to 25 %, which creates an inspiration delay lasting for 25 % of the length of the breathing cycle duration. If the breathing frequency in this set-up amounts to 15 breaths per minute, then the entire breathing volume is supplied in the respiration system within 1 second. This is followed by a one-second inspiration delay, and then by a two-second expirium. 75 Fig. 6.4: Setting up the inspiration delay time. • Characteristics of flow during inspirium - the user may select among seven defined flow characteristics in the time of inspirium: progressive, constant, degressive, sinusoidal, 50% degressive, 50% progressive and modified sinusoidal. Their names are derived from the shape of the flow curve during inspirium. Back-up ventilation mode for possible apnoe - Apnoe Back Up ventilation VEOLAR offers the application of this function in the SIMV, Spont or MMV modes, but not in the PCV mode of pressure-guided ventilation. Following an apnoe alarm, it automatically launches the set-up (back-up) artificial lung ventilation. In order for the ventilator to switch to the back-up ventilation, the so called back up mode must be preset prior to switching the apparatus on. The back-up ventilation is set up by a switch on the panel with special functions. The switch can only be used during the first second after switching the ventilator on. For more information on the back-up mode, see [6.3]. Alarm control panel The panel for controlling alarms allows for fast detection of the ventilator’s malfunction, it allows for setting up specific marginal values for the monitored quantities, and is also used in setting up the back-up mode. You can see a picture of the alarm panel in Fig. 6.5. 76 Fig. 6.5: Alarm control panel The Yes and No buttons are used for confirming the ventilator’s messages and actions. The Info button allows for displaying the previous parameters and other information. The up and down arrow buttons allow for increasing and decreasing the parameter that is being set up. The last button suppresses the sound alarm for 2 minutes. The potentiometers allow for setting up maximum allowed breathing frequency and maximum allowed pressure in the airways. The alarm sets off after exceeding the set up values. The apparatus also allows for setting up minimum and maximum minute ventilation and minimum and maximum permitted oxygen concentration. The alarms are activated in case there is a deviation of the actual minute ventilation or oxygen concentration value outside the set-up interval. Patient monitor The panel (Fig. 6.6) can be found in the left upper part of the ventilator’s front panel. It shows the actual state of the patient’s ventilation. It is important to say that this panel operates independently from the ventilator. There are three indicators on the panel, and three values may be displayed at the same time, selected by pushing the appropriate buttons under each of the indicators. Altogether, it is possible to gather information about 14 parameters. 77 Fig. 6.6: Patient monitor. The displayed parameters are immediate measured or calculated values. A column scale is used to display the measured pressures in the airways within the range of -30 and 130 cmH2O. Two LED diodes, “trigger” and “pause”, inform the staff about each activation of the patient’s trigger, or eventually in case there is an inspiratory pause “plateau“. The time the LED diodes are lightened corresponds to the actual duration of the plateau. The plateau is identified in case the measured decrease of pressure in time does not exceed 1 cmH2O/s. Patient’s immediate ventilation parameters - These parameters may be measured during each breath and subsequently displayed numerically. Information on pressure: Ppeak - peak pressure achieved during the entire breathing cycle is evaluated as of the beginning of the next inspirium. Often labelled as PIP (Peak Inspiratory Pressure) in literature. Pmean - shows the mean pressure of the previous eight breaths and is re-evaluated after each breath. Ppause - final inspiratory pressure of the plateau is evaluated in case there is a real plateau. 78 PEEP - positive end expiratory pressure or continuous positive pressure in the airways. Information on frequency: ftotal - total breathing frequency, i.e. the number of spontaneous and guided breaths during eight cycles, re-calculated to 1 minute; evaluation takes place after each breath. fspont - number of spontaneous breaths during the previous eight cycles, re-calculated to 1 minute; evaluation takes place after each breath. Information on volume: VT vent - inspiratory tidal volume measured in the ventilator and displayed in the beginning of the next breathing cycle. VT exp - expiratory tidal volume measured by the flow sensor, displayed in the beginning of the next inspiratory cycle; as this measurement takes place near the patient, the resulting inaccuracies caused by the compression volume allow for reverse evaluation of the system’s tightness. Vexp/min - expiratory minute volume (minute ventilation) calculated as the sum of expiratory volumes (spontaneous or guided) per 1 minute; re-evaluated anew after each breath. Information on flow, time and O2 concentration: Insp Flow - maximum inspiratory flow during one breath. It is evaluated in litres per minute. Oxygen - FIO2, oxygen fraction in the inspiratory mix (%) evaluated directly before the inspiratory output for the patient’s connection. texp pat - real expiratory time in seconds; it is defined as the time between the beginning of expiration and the reaching of the flow decrease to the level of 5 % of the peak expiratory flow. I:E - ratio between the durations of inspiratory and expiratory parts of the breathing cycle expressed in the form of 1:X. Information on lung mechanics: C - static lung compliance; it is calculated from the expired volume pressure and pressure plateau; the compliance value can only be counted in case of ventilation with inspiratory delay (“pause” LED diode is shining). 79 Rinsp - inspiratory resistance; this resistance represents the dynamic resistance of the circuit, the endotracheal tube and the airways; this parameter is not evaluated in case of selected sinusoidal and degressive flows and in spontaneous ventilation. Rexp - expiratory resistance; this resistance represents the dynamic expiratory decrease of the pressure in the circuit, including the expiratory valve, the endotracheal tube and the airways of the patient; this parameter is evaluated during spontaneous ventilation. Information on trends: All the parameters suitable for trends’ analysis may be stored and evaluated. These parameters are labelled by the “T” symbol in the upper right corner of the button. They are: lung compliance, spontaneous breathing activity, inspiratory resistance, expiratory resistance and expired minute volume. During standard use, the patient monitor evaluates immediate values breath by breath. The trend is summoned by pushing the respective button and then selecting the 15 min or 2 hour trend button. The trend is displayed within 10 s, and subsequently the immediate values are displayed. When selecting a parameter that is not observed in trends, the immediate value is always displayed. Apparatus and aids used • Lung ventilator Veolar (Hamilton Medical, USA) • Test lung for artificial lung ventilation (Michigan Instruments 5600i, ASL 5000, test lung). Conclusion Summarize your findings from the task and comment on the following points. The influence of Vt on minute and alveolar ventilation: 80 What does the abbreviation PEEP stand for and what is its significance during ventilation: What does the symbol Ppeak mean and what is its significance during ventilation: Name the essential mechanical lung parameters and state their units: Describe the difference between volume-guided and pressure-guided ventilation: 81 References to used and recommended information sources [6.1] Wesbter, J.G. ed. Encyclopedia of Medical Devices and Instrumentation. Wiley. [online]. c1999-2009, poslední aktualizace 17. 8. 2008 [cit. 2009-05-12]. Dostupné z WWW: http://mrw.interscience.wiley.com/emrw/9780471732877/home/ [6.2] Hamilton Medical: Veolar – Operator’s Manual. Hamilton Medical AG, Rhaezuens, 1993. [6.3] Roubík, K., Rožánek, M., Grünes, R. Praktika z biomedicínské a klinické techniky 4. České vysoké učení technické v Praze, 2008. 122 s. ISBN 978-80-01-04023-2. (in Czech) 82 7. Principles and application of electrosurgical apparatus Theoretical introduction Electrosurgery means application of radiofrequency (RF/VF) current within the scope of approx. 300 kHz to 5 MHz in order to achieve the required result of a surgical intervention. Typically, this concerns coagulation (conversion of a colloid system into a gross dispersive system) or surgical sections, when the tissue is affected or impaired. Further on, it might be desiccation of the tissue or destruction of the tissue. Physical operation principle is given by the effect of distributed heat within the tissue from the RF/VF stream via a mechanism of resistance or joule heat. This method allows for cutting and coagulating the tissue at the same time, and that is the main advantage used in electrosurgery ever since it was discovered, which was approx. in 1920. Although the first attempts regarding the utilization of heat for therapeutic purposes were realized several thousand years before Christ, it was not until 1920 that such technology was available and the electrotechnical industry became so developed that it was possible to manufacture such apparatus. Typical effects of electrosurgical procedures may be described as follows. It is the so called “white coagulation”, named after its external manifestation on the tissue, when the proteins in the tissue degrade, typically at 50-90 °C. Then it is the so called “black coagulation”, or else the “carbonization” (carbonification), when the tissue is completely desiccated and reduced to carbonized residue at higher temperatures. And there is the third effect in the form of the cutting, when the tissue structures are divided by fast evaporation of little volumes of water in the tissue. These three effects or manifestations appear in certain combinations, when they depend on the current used and on the voltage of the active (surgical) electrode, which is energized by the high-frequency electrosurgical generator. Electrosurgery is a suitable addition to the current surgical procedures, more than any other device or method. At the same time, it significantly reduces sickness rate and morbidity caused by surgical interventions. This is namely given by the fact that minimized time is required under anaesthesia, and also by the fact that bleeding during surgeries and afterwards is minimized. Today, for example, we cannot imagine demanding neurosurgical operations without the electrosurgery methods. Just as well, surgeries on an open heart and many urology operations could not be carried out at all without electrosurgery. You will find animations demonstrating the electrosurgery principles on the subject’s website. 83 The contents and the aim of the measurements High-frequency electrosurgery provides means for fine and accurate surgical interventions on vascular tissues. Using this method prevents undesirable extensive damage to the surrounding tissue. To achieve the best possible results, it is necessary to work with the unit’s performance set-up as gently as possible. The task demonstrates using ESU with the help of a specialized tester, the operation of which is based on measuring the working current and supplied delivery. The aim of this task, therefore, will be to learn about and verify the principle of the apparatus’ operation, to measure its functions by means of the tester, to find out operation characteristics and current dependencies. Measurement tasks Prior to the actual measurement, become acquainted with the operation and the parts of the electrosurgical apparatus (SMT BM CLINIC 170W, [5]) and of the analyzer of electrosurgical devices (RF 303, [6]). Suggest and consult with the trainer all the measurement schemes and connection of the individual apparatus. Work with the operation manuals [5, 6] available on the subject’s website. 1) Measure the output power in dependence on the size of the load resistance by means of the tester (RF 303) for monopolar and bipolar modes and for all the four functions. 2) Measure the passing current during section and coagulation by means of the tester (RF 303), for monopolar and bipolar modes at different ohmic load sizes. 3) Use the tester (RF 303) to measure the leakage currents by the applied part. 4) Elaborate a protocolar record on the carried out measurements and the safety-technical check of the electrosurgical apparatus. Measurement procedure To accomplish all the aims of this task, it is necessary to first become acquainted with the operation of the electrosurgical generator, the electrosurgical apparatus’ tester, and the electrical safety tester. First, learn how to connect the necessary accessories to the apparatus, such as the foot switch, the neutral electrode and the active electrode applicator. (See Fig. 7.1 and 7.2). Become acquainted with the activation principle of this electrosurgical unit [7.5]. Further on, study the principle of the RF 303 tester operation, the means for connecting ESU 84 for the individual measurements, the actual set-up of the analyzer and its connection to the oscilloscope [7.6]. Fig. 7.1: Front panel of the electrosurgical apparatus CLINIC 170 W [7.5]. Legend: 1 - connectors for connecting a neutral electrode 2 - a socket for connecting a monopolar instrument 3 - monopolar / bipolar mode switch 4 - a pair of sockets for connecting a bipolar instrument 5 - intensity regulator 6 - signalization of the neutral electrode’s malfunction 7 - switch-on signalization of the apparatus 8 - signalization of the selected mode (monopolar / bipolar) according to the position of the switch (3) 9 - signalization of the selected mode (section, mixed section, coagulation, microcoagulation) 10 - mode switch (section, mixed section, coagulation, microcoagulation) 85 Fig. 7.2: Rear panel of the electrosurgical apparatus CLINIC 170 W [7.5]. Legend: 1 - pneumatic trigger connector - connecting the foot switch 2 - power cord plug 3 - power switch 4 - manufacturer’s label Output power measurement in dependence on the size of the load resistance for monopolar and bipolar modes and for all the four functions Connect the neutral electrode into the main panel of the electrosurgical unit. Connect the interconnecting cable to it by means of a crocodile clip, and plug its second end into the left blue socket on the tester. Plug the interconnecting cable into the active electrode’s socket, and plug its second end to the yellow socket on the tester. Switch the apparatus into the monopolar mode (see Fig. 7.1). Connect the foot switch (see Fig. 7.2). Use the mode switch No. 10 (Fig. 7.1) to set up the functions of section, mixed section, coagulation and microcoagulation subsequently. Use the intensity regulator No. 5 (Fig. 7.1) to set the output performance to MAX. Set up the tester gradually for each function to the resistance of 50 Ω, 100 Ω, 200 Ω, 500 Ω, 750 Ω. Resistance is set on the tester via the OHMS SELECT + or button and by selecting the respective value, which is featured on the display (Fig. 7.3). Make sure you have really selected the performance measurement. If not, use the ENT button to select W (see Fig. 7.3). 86 After that, connect the electrosurgical apparatus in the electrical power network and switch it on via the rocker-type switch on the rear side of the apparatus (see Fig. 7.2). 1 - four-digit LCD display 11 - clamps for connecting the test conductors 2 - performance measurement indicator 12 - reference grounding for HF leakage currents 3 - current measurement indicator 13 - HF load resistance 4 - test load indicator 14 - signal grounding 5 - measurement mode selection 15 - socket for connecting the power supply cable 6 - button for increasing the test load size 16 - apparatus’ fuse cover 7 - button for decreasing the test load size 17 - main switch of the apparatus 8 - handle for carrying the apparatus 18 - air output from the ventilator 9 - battery status control 19 - air input to the ventilator 10 - BNC connector for the output to the oscilloscope 20 - RS 232 connector for data communication with a PC Fig. 7.3: Description of buttons and interfaces of the electrosurgical devices’ analyzer RF 303 [7.6]. 87 Activate the apparatus via the foot switch. Gradually read all the output performance values on the tester’s display and record them in the respective table. Then switch the apparatus into the mixed section, coagulation and mixed coagulation functions and repeat the measurement. Repeat the same procedure for all the remaining modes and functions. Proceed likewise for the bipolar mode measurements, only following the instructions in the operation manual [7.5], which relate to operating the apparatus in bipolar mode. For all the measurements, make use of the possibility of connecting the RF 303 tester to the oscilloscope and display the course of the actuating signal in the individual modes and functions of the electrosurgical generator CLINIC 170W. Record the measured results in Tab. 7.1 and 7.2. Measurement of the passing current during section and coagulation, for monopolar and bipolar modes at different ohmic load sizes The principle of the measurement is identical to that of the performance measurement. Carry out the measurements for the section and coagulation, and again in monopolar and bipolar modes for different load resistance values. Increase the performance on the electrosurgical unit gradually by means of the regulator No. 5 (Fig. 7.1) from the MIN position to the MAX position. Connect the apparatus to the tester in the same way as described in the previous section. Only set the RF 303 tester to current measurement [7.6]. Proceed likewise for the bipolar mode measurements, only following the instructions in the operation manual relating to operating the apparatus in bipolar mode [7.5]. For all the measurements, make use of the possibility of connecting the RF 303 tester to the oscilloscope and display the course of the actuating signal in the individual modes and functions of the electrosurgical generator CLINIC 170W. Record the measured results in Tabs. 7.3 to 7.6. Measurement of the leakage currents by the applied part Special attention is paid to the safety of the electrical medical devices. At present, the requirements imposed on the medical electronic devices stem from the widest European standards, namely from ČSN EN 60601-1 [7.8]. This standard gives the maximum values for the leakage currents by the applied part. Dangers and risks of using medical instrumentation are generally summarized in the standard IEC 513 from 1994 [7.9]. This chapter focuses on how to prevent the dangers connected with energy supplied during the apparatus’ normal 88 function, namely with leakage currents and functional currents flowing from the highfrequency apparatus via undesirable paths through the patient or the attending staff. When using an electrosurgical apparatus, direct connection of the patient with the apparatus cannot be avoided. As the ESU is powered by the 230 V/50 Hz electrical distribution network, there is a danger in the form of leakage currents on the network frequency (and their higher harmonic components). Leakage currents are understood as parasite currents flowing between mutually insulated parts of the apparatus, mostly through parasite capacity couplings between these parts. Connect the active electrode of the electrosurgical apparatus in the right grey socket, and the neutral electrode in the left blue socket. Then connect the yellow and the left green socket, and the right blue and the left grey socket via a short connecting cable. (Note: yellow socket = active, green = ground, blue = dispersion, grey = leakage currents). Set the resistance on the tester to 200 Ω. After that, make sure you really selected the current measurement. If not, then use the ENT button to select mA (Fig. 7.3). The electrosurgical unit is switched to the monopolar mode. If everything is right, activate the apparatus via the foot switch and measure the ESU leakage currents in all the four modes gradually (section, mixes section, coagulation, microcoagulation). Use the middle knob on the ESU main panel to gradually select the performance from the MIN position all the way to the MAX position (Fig. 7.1 and 7.2). Proceed likewise for the bipolar mode measurements, only following the instructions in the operation manual [7.5] relating to operating the apparatus in bipolar mode. For all the measurements, make use of the possibility of connecting the RF 303 tester to the oscilloscope and display the course of the actuating signal in the individual modes and functions of the electrosurgical generator CLINIC 170W. Record the measured results in Tab. 7.7 and 7.8. Apparatus and aids used • Electrosurgical generator SMT BM CLINIC 170W, neutral electrode for repetitive use, foot switch and interconnecting conductors (Speciální Medicínská Technologie, s.r.o., Czech Rep.) • Analyzer of electrosurgical devices RF 303 (Fluke Biomedical, USA) • Interconnecting conductors and crocodile clips (RF 303 accessories) 89 • Digital apparatus for checking the medical electric apparatus MEDITEST 50 (ILLKO, s.r.o., Czech Rep.) • Oscilloscope and interconnecting BNC cable Measured results Record all the measured results in the tables below and compare them with the data stated by the manufacturer in the Operation manual. Add all the required information and have the protocol checked and signed by the trainer. To realize the safety-technical check, follow the instruction of the manufacturer in the operation manual [7.5] and fill in the protocol at the end of the task. Tab. 7.1: Dependence of the electrosurgical unit’s performance on the load resistance size in monopolar mode. Load resistance Cut Mixed cut Coagulation Microcoagulation 50 Ω 100 Ω 200 Ω 500 Ω 750 Ω Tab. 7.2: Dependence of the electrosurgical unit’s performance on the load resistance size in bipolar mode. Load resistance CUT Mixed Cut 50 Ω 100 Ω 200 Ω 500 Ω 750 Ω 90 Coagulation Microcoagulation Tab. 7.3: Dependence of the working current size on the setting of the output performance and the load resistance size at section in monopolar mode. Output power [-] Current size 50 Ω 100 Ω 200 Ω 500 Ω 750 Ω 1 2 3 4 5 6 7 Tab. 7.4: Dependence of the working current size on the setting of the output performance and the load resistance size at section in bipolar mode. Output power [-] Current size 50 Ω 100 Ω 200 Ω 1 2 3 4 5 6 7 91 500 Ω 750 Ω Tab. 7.5: Dependence of the working current size on the setting of the output performance and the load resistance size at coagulation in monopolar mode. Output power [-] Current size 50 Ω 100 Ω 200 Ω 500 Ω 750 Ω 1 2 3 4 5 6 7 Tab. 7.6: Dependence of the working current size on the setting of the output performance and the load resistance size at coagulation in bipolar mode. Output power [-] Current size 50 Ω 100 Ω 200 Ω 1 2 3 4 5 6 7 92 500 Ω 750 Ω Tab. 7.7: Dependence of the leakage current size on the setting of the ESU output performance in monopolar mode. Output power [-] Cut Mixed cut Coagulation Microcoagulation 1 2 3 4 5 6 7 Tab. 7.8: Dependence of the leakage current size on the setting of the ESU output performance in bipolar mode. Output power [-] Cut Mixed cut 1 2 3 4 5 6 7 93 Coagulation Microcoagulation Conclusion Briefly comment on each point of the measurement. Evaluate the measured results and compare them with the data stated by the manufacturer in the operation manual [7.5]. Determine the type of the applied part the apparatus works with, the (electrical) insulation class and the MD classification class. Check‐up questions regarding the given issue 1) Explain the principle of the electrosurgical apparatus functioning. Describe the basic electrosurgery effects on live tissues. 2) Describe the individual modes in which the electrosurgical generator can work. 3) Explain the difference between monopolar and bipolar mode. 94 4) Describe the functional principle of the electrosurgical apparatus’ analyzer RF 303. 5) Describe the significance of measuring the so called leakage currents. Safety‐technical check Based on the operation manual to the electrosurgical apparatus [7.5] and the electrical safety tester Meditest 50 [7.7], first determine the insulation class ESU and subsequently carry out the electrical safety measurement related to the determined MD class. Elaborate a protocol on the STC, which can be found at the end of this task [7.8, 7.10]. References to used and recommended information sources [7.1] Wesbter, J.G. ed. Encyclopedia of Medical Devices and Instrumentation. Wiley. [online]. c1999-2009, poslední aktualizace 17. 8. 2008 [cit. 2009-05-12]. Dostupné z WWW: <http://mrw.interscience.wiley.com/emrw/9780471732877/home/> [7.2] Principles of Electrosurgery ONLINE. [online]. c2007, [cit. 2009-05-12]. Dostupné z WWW: <http://www.valleylab.com/education/poes/index.html> [7.3] Správná praxe elektrochirurgie. [online]. c2008, [cit. 2009-05-12]. Dostupné z WWW: <http://www.cszt.cz/> [7.4] Rozman, J. a kol. Elektronické přístroje v lékařství. Praha: Academia, 2006. 406 s. [7.5] Speciální Medicínská Technologie, s.r.o. Elektrochirurgický přístroj SMT BM CLINIC 170W. Návod k obsluze. N0100.03. 2011. [7.6] Fluke Biomedica. Analyzátor elektrochirurgických zařízení RF 303. Uživatelský manuál. Rev. 1.0. 2010. [7.7] Digitální přístroj pro kontroly zdravotnických elektrických přístrojů MEDITEST 50 (ILLKO, s.r.o., ČR). Návod k používání přístroje. 2007. [7.8] ČSN EN 60601-1 ed. 2. Zdravotnické elektrické přístroje - Část 1: Všeobecné požadavky na základní bezpečnost a nezbytnou funkčnost. Praha: Český normalizační institut, 2007. [7.9] ČSN IEC 513:1994. Základní hlediska norem bezpečnosti zdravotnických elektrických přístrojů. Praha: Český normalizační institut, 1994. [7.10] ČSN EN 62353. Zdravotnické elektrické přístroje – Opakované zkoušky a zkoušky po opravách zdravotnických elektrických přístrojů. Praha: Český normalizační institut, 2008. 95 8. Principles and applications of the vital functions monitors Theoretical introduction Monitors of the patient’s vital functions play an important role not only during the surgical operation, but also during the post-operation recovery. Their essential aim is to unite several partial systems into one complex whole. By these systems, we mean the ECG, which can have one, five or up to twelve leads, depending on the complexity and the determination means of the actual monitor. Further on, it is the system for measuring oxygen saturation in blood by means of an optical method using red and IR light. Then we have the systems for non-invasive blood pressure measurement using classical sleeves and the system of evaluating the blood pressure similar to automatic tonometers. Besides the non-invasive blood pressure measurement, these monitors also allow for connecting standard sets for invasive blood pressure measurement, which is much more accurate. As a standard, there is the possibility of connecting temperature sensors, either for surface scanning of the patient’s temperature, or for rectal scanning as well. Further on, there are specific types of monitors, the so called anaesthesiological monitors, which also allow for scanning spirometry quantities and breathing activities, and moreover, these monitors are also equipped with gas composition analyzers (i.e. O2, CO2, or other volatile media used for managing anaesthesia). However, the reason why these monitors are special compared to, say, the single-purpose apparatus, is that besides a great degree of integration, they are further equipped with a full range of warning visual and sound alarms. These alarms check the set thresholds of the currently monitored quantities and in case of any deviations from standard, they alert the attending staff, which can thus interfere in time, and even safe the patient’s life in case of a life-threatening condition. Further on, these monitors allow for recording and logging the individual parameters throughout the treatment, and they are also equipped with standard interfaces for communicating with the main, central terminal for distance monitoring without being by the patient’s bed. It would probably be useless to again describe the principles of the individual probe and measurement types, which have already been described in this textbook for the individual, single-purpose systems. General legislation within the framework of patient monitors, situation regarding STC 96 Just like any medical device, also the patient monitors and their utilization are subject to valid legislation. STC (safety-technical check), which ensues from the Law No. 123/2000 Coll., particularly from Chapter 27 thereof, is one of the most frequent activities of a biomedical technician in the healthcare facility. STCs stem from the necessity to check and verify the parameters of the medical instrumentation throughout their clinical operation. This concerns the devices in which there is a potential risk of damaging the patient’s health in case of impaired function or measurement accuracy. Another requirement stems from the standard ČSN EN 60601-1, which concerns electrical safety from the point of view of both the attending staff and the patient. It is namely the check of the apparatus’ insulation status in order to prevent the possible injury by electrical current. In the text below, the contents of the above mentioned legislation will be described in greater detail. Fig. 8.1: Overall view of the patient monitor, display showing the individual courses with a possibility of their selection (today often a touch screen). Law No. 123/2000 Coll. on medical devices and on changing some related laws. Among other things, it determines the basic requirements on maintaining the medical devices throughout their technical life. The conditions for using medical devices are mentioned in Chapter 4. Medical devices must meet the medical and technical parameters given by the manufacturer throughout their life. The law in this respect forbids the use of the MD in case there is a reasonable suspicion 97 that the safety and health of the users or third persons are threatened or the usability period determined by the manufacturer or the importer has expired. According to Chapter 24, the healthcare providers are obliged to adopt such measures in the medical devices with measurement functions, as to guarantee sufficient accuracy and reliability of the measurement. The provider must therefore guarantee to meet the requirements ensuing from the Law on metrology No. 505/1990 Coll., as amended. In case of assigned gauges, this means their verification within the statutory limit, and in case of nonassigned gauges, it is necessary to meet the calibration dates recommended by the manufacturer. Periodical safety-technical checks of medical devices are specified in Chapter 27. Ministry of health may determine the MD types or classes to be regularly checked in a public notice. This is where the term “periodical safety-technical check” appears, abbreviated to PSTC. This chapter directly prescribes to maintain the safety of the MD, in our case specifically the electrical safety of the medical device, the functionality, i.e. the requirement for the medical device to achieve the technical parameters stated in the manufacturer’s technical specification. These two requirements cannot be separated from each other. Last but not least, specification regarding the maintenance and service of the medical devices is given in Chapter 28. Medical devices must be, in accordance with the manufacturer’s instructions, professionally, repetitively and demonstrably maintained by treatment and regular checks in such a state as to guarantee their functionality and safety throughout the usability period. PSTC and service can only be carried out by a person with professional training, experience, knowledge of legal regulations and technical standards and passed training. Other standards relating to the MD safety: ČSN EN 60601-1, Part 1 General requirements for essential safety and necessary functioning This is the basic standard in the full set of the ČSN EN 60601 technical standards defining the general technical requirements for the realization and the electrical safety of the medical devices. Among other things, the standard specifies the requirements for the so called applied part. The applied part can be found in a majority of medical devices; it is used for diagnosis or for the treatment operation. The standard divides the applied parts into groups: B, BF and CF. The most strict requirements concern the CF applied parts, which are used for invasive operations on the patients. 98 ČSN EN 62353 Electrical medical devices Repetitive tests and post-repair tests of the electrical medical devices. The standard defines the essential requirements for carrying out periodically repeated checks and tests following repairs of the medical devices. It deals with the issue of electrical safety of the apparatus and functional tests of medical devices. It is a parallel to the standard ČSN 331600 for checking electrical appliances. The aim and the contents of the measurements The aim of the measurement will be to elaborate the PSTC protocols, which in their contents and form correspond to the real protocols you may encounter in your practice. It is namely important to become acquainted with the PSTC elaboration methodology and the concept of the measuring/testing apparatus. With its contents, the PSTC protocol covers a wide spectre of evaluation parameters of the medical devices, from mechanical, physical and electrical points of view. Measurement tasks Carry out a complete process of checking the anaesthesiological monitor DatecOhmeda S/5 CAM according to the entries of the PSTC protocol. Procedure for carrying out the PSTC: 1) Carry out a detailed inspection of the apparatus for mechanical damage. 2) Check the integrity of the supply cable. 3) Check the functioning of the signalizing and controlling elements. 4) Measure the value of the insulation resistance, the protective conductor resistance and the leakage current. 5) Verify the apparatus’ functional parameters according to the entries of the particular PSTC protocol. 6) For the above mentioned anaesthesiological monitor Datex-Ohmeda, carry out the tasks (1-5) and record the results in the protocol; confirm meeting or not meeting the parameters declared in the protocol. Apparatus and aids used • Anaesthesiological monitor GE Datex-Ohmeda S/5 CAM • Revisional apparatus ILLKO Revex 2051 99 • Accessories for measuring the applied part’s current ILLKO RM 2050 • Simulator FLUKE medSim 300B Measurement procedure 1) Carry out a detailed inspection of the apparatus for mechanical damage. Check the apparatus very carefully to detect cracks; check namely the plastic moving mechanisms, which may show mechanical damage more frequently. Verify the function of the apparatus’ mechanical parts; the moving components must move freely without any marked resistance, yet should they have an arrest in the end position, then they must not be released from this position without exerting reasonable strength. In case you find malfunction, confirm the respective apparatus’ protocol as unsatisfactory. 2) Check the integrity of the supply cable. While checking, focus namely of the cable terminations, in place where the cable enters the termination. This is the place where the external insulation layer often crackles. Verify that the insulation is compact throughout the cable’s length and that the cable shows no signs of breaking or notching. Any occurrence of bulging on the cable is also unallowable, as it demonstrates damage of the conductors inside. In case you find malfunction, confirm the respective apparatus’ protocol as unsatisfactory. 3) Check the functioning of the signalizing and controlling elements. Examine all the optical signalizing elements for missing function descriptions. Check the mechanical running of the controlling elements (the buttons must be easy to push). In membrane buttons, check the integrity of the top foil with function descriptions, as it must not be perforated in any place. The LCD display must not show signs of mechanical damage. After switching the apparatus on (in accordance with the operation manual), check whether all the optical signalizing elements meet their function. In case you find malfunction, confirm the respective apparatus’ protocol as unsatisfactory. 4) Measure the value of the insulation resistance, the protective conductor resistance and the leakage current. 100 To measure the apparatus’ insulation resistance, proceed in accordance with the user manual of REVEX 2051. Detailed measurement procedure can be found in chapter 4.3.1 on page 22. During the measurement, follow the instructions of the trainer and always proceed only in accordance with the manual of REVEX 2051. Record the result into the PSTC protocol and compare with the recommended maximum value. Confirm whether the machine passed. To measure the apparatus’ protective conductor resistance, proceed in accordance with the user manual of REVEX 2051. Detailed measurement procedure can be found in chapter 4.1.1 on page 13. During the measurement, follow the instructions of the trainer and always proceed only in accordance with the manual of REVEX 2051. Record the result into the PSTC protocol and compare with the recommended maximum value. Confirm whether the machine passed. To measure the leakage current via the accessible part, proceed in accordance with the user manual of REVEX 2051. Detailed measurement procedure can be found in chapter 4.4.1 on page 26. During the measurement, follow the instructions of the trainer and always proceed only in accordance with the manual of REVEX 2051. Record the result into the PSTC protocol and compare with the recommended maximum value. Confirm whether the machine passed. To measure the leakage current via the applied part, it is necessary to use the measurement device RM 2050, which will be connected into REVEX 2051. Detailed measurement procedure can be found in chapter 4.1 on page 4. During the measurement, follow the instructions of the trainer and always proceed only in accordance with the manual of REVEX 2051 and RM 2050. Record the result into the PSTC protocol and compare with the recommended maximum value. Confirm whether the machine passed. 5) Verify the apparatus’ functional parameters according to the entries of the particular PSTC protocol. To verify the function of the anaesthesiological monitor, it is necessary to simulate the electrophysiological processes in the human body. To simulate the ECG signal, a simulator FLUKE medSim 300B will be used, or another one that is capable of reliably simulating the heart’s electrical signals. Connect the anaesthesiological monitor in the 5-lead ECG scanning mode to the medSim 300B simulator. While connecting, be careful about correct contacts of the electrodes’ clamps with the simulator; proceed in accordance with the recommended 101 connection according to the user manual for medSim 300B. Turn the monitor on and set up the ECG measurement on at least two leads (e.g. II and V1), the pulse rate reading and the breathing frequency measurement. Always set up the monitor in accordance with the user manual. According to the user manual for medSim 300B, set up several possible pulse rates and breathing frequencies, always comparing them with the value numerically displayed on the anaesthesiological monitor, and then check whether the ECG signal’s course is clean, with not artefacts or distinct murmurs. When setting up the ECG simulator, always use ECG simulation without pathological changes (ECG of a healthy person). Record the result into the PSTC protocol and confirm whether the machine passed. Measured results Record the results in the individual protocols. Be particular about the level of the records, as in reality, crossed out PSTC protocol is legislatively non-permissible. Check‐up questions regarding the given issue • Describe the principle of the ECG scanning. • What is the purpose of measuring the patient’s blood pressure? • What is pulse oxymetry? • What is the significance of STC? References to used and recommended information sources [8.1] Wesbter, J.G. ed. Encyclopedia of Medical Devices and Instrumentation. Wiley. [online]. c1999-2009, poslední aktualizace 17. 8. 2008 [cit. 2009-05-12]. Dostupné z WWW: http://mrw.interscience.wiley.com/emrw/9780471732877/home/ [8.2] Rozman, J. a kol. Elektronické přístroje v lékařství. Praha: Academia, 2006. 406 s. [8.3] Zákon č. 123/2000 Sb., zdroj: SBÍRKA ZÁKONŮ ročník 2000, částka 36, ze dne 12.5.2000. [8.4] ČSN EN 60601-1-2. Zdravotnické elektrické přístroje: Všeobecné požadavky na bezpečnost. 02/2003. [8.5] ČSN EN 62353. Zdravotnické elektrické přístroje: Opakované zkoušky a zkoušky po opravách zdravotnických elektrických přístrojů. 8/2008 102 9. The influence of user-adjustable parameters on the action of the patient simulator system METI ECS The interactive, whole-body patient simulator METI, model Emergency Care Simulator (ECS) is designed for training practical skills and handling emergency situations. Namely the training of healthcare personnel is presumed. This simulator plausibly imitates the human body anatomical composition and allows for demonstrating acute clinical symptoms (such as bleeding, cardiac arrest, troubled breathing, spasms, etc.). The ECS device consists of three components, see Fig. 9.1. It is a computer with METI utility software, The PCU control unit, and a body model. The computer communicates with the control unit via the software, and the control unit controls all the electronic and pneumatic systems of the mannequin, via externally supplied gas. The operator of the computer controls the ECS in real time or by means of prepared scenarios that can be further influenced according to current needs and situations. Mannequin Computer Gas inlet Control unit Operator’s input Fig. 9.1: Connection scheme of the individual ECS components. The running of the entire simulation is ensured by a sophisticated SW model, which has been running on the operator’s PC. The SW model includes three main modules: cardiovascular, respiratory and pharmacological. These systems are mutually interconnected and they influence one another, similarly to the real person’s physiology. If any of the 103 parameters change in one system, then all other parameters in a mutual bond change adequately, see the mutual interconnection in Fig. 9.2. Cardiovascular Respiratory Operator’s input Operator’s input Pharmacological Operator’s input Fig. 9.2: Mutual interconnection of the whole-body patient simulator’s parts Respiratory system The respiratory system model can be divided into two parts. The upper respiratory tract includes the nasal cavity, the nasopharynx, the pharynx and a part of larynx. The lower respiratory tract is represented by the trachea, the bronchi and the lungs. Upper respiratory tract The upper respiratory tract of the ECS simulator realistically copies its real anatomical structure. It is possible to carry out an orotracheal intubation, which means inserting a tracheal tube into the patient’s trachea via the mouth, as well as a nasotracheal intubation, when the tube is inserted via the nose. Several complications may occur during intubation, and they can realistically occur in this simulator as well: • Inserting the tracheal tube too deep into one of the two bronchi. In this case, only one lung gets ventilated. It will be apparent on the figurine that only one side of the chest is moving. • Inserting the tracheal tube into the gullet - in this case stomach distension can be observed. 104 • Oropharyngeal oedema - the oedema size can be set up to various levels (medium severe to severe) and orotracheal intubation can thus be prevented. Thanks to the replaceable skin on the neck, it is possible in this case to carry out tracheotomy, which means a surgical intervention when a permanent opening is made on the neck, which ensures breathing, or coniotomy, i.e. opening the breathing system at the position of the larynx where ligamentum conicum is located between the cricoid cartilage and the thyroid gland. Lower respiratory tract The patient simulator breathes spontaneously and is capable of simulating oxygen consumption and carbon dioxide production. The ECS also allows for the realization of movement on one side of the chest only, for possible cases of wrong intubation or severe damage of one lung. Both the right and the left side of the chest allow for hearing physiological as well as pathological breathing sounds. The ECS is capable of simulating atelectasis, pneumothorax, asthma or chronic obstructive pulmonary disease. The simulator also reacts to drug administration. A mathematical model of the pulmonary function continuously calculates the value of the “patient’s” blood gases and pH in respect of the breathing parameters. Cardiovascular system The patient simulator allows for setting up both physiological and pathological cardiac activity, including echoes that are synchronizable with the QRS complexes at ECG. Cardiac echoes are detectable by means of a stethoscope on the left and the right upper and lower sternal border. It is possible to connect the 5-lead ECG to the patient monitor via the respective positions on the mannequin’s chest, and the activity can also be observed on the real vital functions’ monitor. There is palpable pulse on the neck, the wrist, the arm, the thigh, in the popliteal area and on the feet, again synchronized with the ECG. The ECS allows for measuring and monitoring the following: • Arterial blood pressure • Central venous pressure • Left ventricular pressure • Right ventricular pressure 105 • Right atrial pressure • Pressure in the pulmonary artery • Cardiac output by means of thermodilution The system dynamically models the arterial blood gases values according to current alveolar concentrations of carbon dioxide and oxygen. It is possible to simulate both metabolic acidosis and alkalosis. Pharmacological system The whole-body patient simulator contains a pre-programmed pharmacokinetic and pharmacodynamic model for more than 60 different types of drugs. Drug administration is only simulated - that means that drug administration must always be set up by the simulator’s operator during the simulation, under the direction of the trained person. Physical drug administration can be simulated by means of an injection needle into vena cephalica, vena basalica or vena mediana antebrachii, yet it is only an administration of the drug’s mock-up. The simulator does not react to this mock-up in any way, the operator’s intervention is always necessary. Fig. 9.3: Patient window 106 Basic parameters of the model Some initial patient configurations and scenarios have already been pre-programmed to the ECS: Man, 33 years old, healthy, no previous health complications Woman, 29 years old, in the 40th week of pregnancy, no complications Woman, 70 years old, former smoker with mild hypertension Man, 61 years old, alcoholic and smoker with ischemic heart disease and chronic obstructive pulmonary disease (COPD), Man, 20 years old, healthy but hyperthermic, hypermetabolic and dehydrated due to intensive physical loads. The initial selection of the patient configuration influences the character of the simulator’s reaction to the external interventions from the attending staff or the trained person. The configuration of the individual patients can be changed according to the particular needs, or a new patient can be created. The METI ECS software For scenario programming, METI ECS uses the METI HPS6 software or updated SW MÜSE, which have been designed for the Apple platform, using the Mac OS X operating system. Tab 9.1: List of simulated parameters. Parameter Title Unit HR Heart rate puls/min MAP Mean arterial pressure mmHg C. O. Cardiac output l/min SpO2 Oxygen saturation % Hct Hematocrit % Isch. Idx. Ischemic index ABP Arterial blood pressure mmHg PAP Blood pressure in the pulmonary artery mmHg 107 CVP Central venous pressure mmHg Left Vol. The volume of the left lung ml Right Vol. The volume of the right lung ml Spont. VT Spontaneous tidal volume ml PACO2 Alveolar partial pressure of CO2 mmHg PAO2 Alveolar partial pressure of O2 mmHg Spont. RR Spontaneous respiratory rate breath/min Alv. N2O Alveolar partial pressure of N2O mmHg Alv. Iso. Alveolar partial pressure of Isoflurane mmHg Alv.Sevo. Alveolar partial pressure of Sevoflurane mmHg Alv. Halo. Alveolar partial pressure of Halothane mmHg Alv. Enf. Alveolar partial pressure of Enflurane mmHg PaCO2 Arterial partial pressure of CO2 mmHg pH pH PaO2 Arterial partial pressure of O2 mmHg PvCO2 Venous partial pressure of CO2 mmHg After launching the programme, it is possible to either select from the preprogrammed patients, or to create a new patient according to your own needs. Fig. 9.3 “The Patient Window” depicts the programme’s controlling part, including all the current monitored parameters. For the list of all the parameters simulated, see Tab. 9.1. Measurement tasks 1) Observe the basic parameters of the METI ECS simulator on the software monitor. 2) Connect the apparatus for ECG measuring to the mannequin according to the trainer’s instructions. Display all the available leads on the monitor. 3) Observe the influence of moving the cables on the ECG signal, which is displayed on the external apparatus. 108 4) Simulate disconnecting the cable by taking one of the Einthoven leads off of the mannequin simulator and observe the influence on the ECG signal. 5) Change selected parameters on the simulator according to the trainer’s instructions and observe the influence of the change on the simulator’s physiological parameters. 6) Simulate ventricular fibrillation and use the defibrillator under the trainer’s supervision and according to his instructions. 7) Suppress the simulator’s spontaneous breathing activity and observe the influence on the respiratory and cardiovascular system’s parameters. 8) Under the trainer’s supervision and according to his instructions intubate the mannequin and observe the influence of the ambu vac ventilation. 9) Connect the mannequin to the artificial lung ventilation according to the trainer’s instructions and under his supervision! Observe the influence of the ventilation on the simulator’s physiological parameters. 10) Observe the influence of the breathing volume change on the simulator’s physiological parameters. Measurement procedure ad 1) Record the basic physiological parameters of the ECS simulator in the beginning of the measurement, including the units: HR (heart rate) = ABP (arterial blood pressure) = SpO2 = CO (cardiac output) = PACO2 = PAO2 = PaCO2 = PaO2 = pH = PvCO2 = PvO2 = ad 5a) Record the basic physiological parameters of the ECS simulator after an action carried out by the trainer: Action: HR (heart rate) = ABP (arterial blood pressure) = SpO2 = CO (cardiac output) = 109 PACO2 = PAO2 = PaCO2 = PaO2 = pH = PvCO2 = PvO2 = ad 5b) Record the basic physiological parameters of the ECS simulator after an action carried out by the trainer: Action: HR (heart rate) = ABP (arterial blood pressure) = SpO2 = CO (cardiac output) = PACO2 = PAO2 = PaCO2 = PaO2 = pH = PvCO2 = PvO2 = ad 7) Record the basic physiological parameters of the ECS simulator approx. 1 minute after suppressing the mannequin’s breathing activity: HR (heart rate) = ABP (arterial blood pressure) = SpO2 = CO (cardiac output) = PACO2 = PAO2 = PaCO2 = PaO2 = pH = PvCO2 = PvO2 = Apparatus and aids used • Simulator METI ECS (METI, USA) • ECG monitor (Datex Ohmeda, SE-12 Express) • Monophasic defibrillator CardioServ (GE Healthcare, USA) 110 • Intubation set • Ambu vac • Lung ventilator Veolar (Hamilton Medical, USA) Conclusion Summarize your findings and comment on the individual measurement tasks. 111