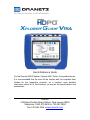
1
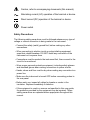
/ / Quick Reference Guide For the Dranetz HDPQ Xplorer / Xplorer 400 / Guide / Visa product family. It is recommended that the user still be familiar with the complete User Guides for the respective products, as it contains more detailed information about all of the functions, as well as the specifications and accessories. Dranetz 1000 New Durham Road, Edison, New Jersey 08818 Telephone 1-800-372-6832 or 732-287-3680 Fax 732-248-1834 www.dranetz.com WARNING Death, serious injury, or fire hazard could result from improper connection of this instrument. Read and understand this manual before connecting this instrument. Follow all installation and operating instructions while using this instrument. Connection of this instrument must be performed in compliance with the National Electrical Code (ANSI/NFPA 70-2014) of USA and any additional safety requirements applicable to your installation. Installation, operation, and maintenance of this instrument must be performed by qualified personnel only. The National Electrical Code defines a qualified person as “one who has the skills and knowledge related to the construction and operation of the electrical equipment and installations, and who has received safety training on the hazards involved.” Qualified personnel who work on or near exposed energized electrical conductors must follow applicable safety related work practices and procedures including appropriate personal protective equipment in compliance with the Standard for Electrical Safety Requirements for Employee Workplaces (ANSI/NFPA 70E-2012) of USA and any additional workplace safety requirements applicable to your installation. Published by Dranetz 1000 New Durham Road Edison, NJ 08818-4019 USA Telephone: 1-800-372-6832 or 732-287-3680 Fax: 732-248-1834 Web site: www.dranetz.com Copyright ©2014 Dranetz All rights reserved. No part of this book may be reproduced, stored in a retrieval system, or transcribed in any form or by any means—electronic, mechanical, photocopying, recording, or otherwise—without prior written permission from the publisher, Dranetz, Edison, NJ 08818-4019. Printed in the United States of America. P/N QR-HDPQ Rev B 06.16.14 2 ADVERTENCIA Una conexión incorrecta de este instrumento puede producir la muerte, lesiones graves y riesgo de incendio. Lea y entienda este manual antes de conectar. Observe todas las instrucciones de instalación y operación durante el uso de este instrumento. La conexión de este instrumento a un sistema eléctrico se debe realizar en conformidad con el Código Eléctrico Nacional (ANSI/NFPA 70-2014) de los E.E.U.U., además de cualquier otra norma de seguridad correspondiente a su establecimiento. La instalación, operación y mantenimiento de este instrumento debe ser realizada por personal calificado solamente. El Código Eléctrico Nacional define a una persona calificada como "una que esté familiarizada con la construcción y operación del equipo y con los riesgos involucrados." El personal cualificado que trabaja encendido o acerca a los conductores eléctricos energizados expuestos debe seguir prácticas y procedimientos relacionados seguridad aplicable del trabajo incluyendo el equipo protector personal apropiado en conformidad con el estándar para los requisitos de seguridad eléctricos para los lugares de trabajo del empleado (ANSI/NFPA 70E-2012) de los E.E.U.U. y cualquier requisito de seguridad adicional del lugar de trabajo aplicable a su instalación. AVERTISSEMENT Si l'instrument est mal connecté, la mort, des blessures graves, ou un danger d'incendie peuvent s'en suivre. Lisez attentivement ce manuel avant de connecter l'instrument. Lorsque vous utilisez l'instrument, suivez toutes les instructions d'installation et de service. Cet instrument doit être connecté conformément au National Electrical Code (ANSI/NFPA 70-2014) des Etats-Unis et à toutes les exigences de sécurité applicables à votre installation. Cet instrument doit être installé, utilisé et entretenu uniquement par un personnel qualifié. Selon le National Electrical Code, une personne est qualifiée si "elle connaît bien la construction et l'utilisation de l'équipement, ainsi que les dangers que cela implique". Le personnel qualifié qui travaillent dessus ou s'approchent des conducteurs électriques activés exposés doit suivre des pratiques en matière et des procédures reliées par sûreté applicable de travail comprenant le matériel de protection personnel approprié conformément à la norme pour des conditions de sûreté électriques pour les lieux de travail des employés (ANSI/NFPA 70E-2012) des Etats-Unis et toutes les conditions de sûreté additionnelles de lieu de travail applicables à votre installation. 3 WARNUNG Der falsche Anschluß dieses Gerätes kann Tod, schwere Verletzungen oder Feuer verursachen. Bevor Sie dieses Instrument anschließen, müssen Sie die Anleitung lesen und verstanden haben. Bei der Verwendung dieses Instruments müssen alle Installation- und Betriebsanweisungen beachtet werden. Der Anschluß dieses Instruments muß in Übereinstimmung mit den nationalen Bestimmungen für Elektrizität (ANSI/NFPA 70-2014) der Vereinigten Staaten, sowie allen weiteren, in Ihrem Fall anwendbaren Sicherheitsbestimmungen, vorgenommen werden. Installation, Betrieb und Wartung dieses Instruments dürfen nur von Fachpersonal durchgeführt werden. In dem nationalen Bestimmungen für Elektrizität wird ein Fachmann als eine Person bezeichnet, welche "mit der Bauweise und dem Betrieb des Gerätes sowie den dazugehörigen Gefahren vertraut ist." Qualifiziertes Personal, das an bearbeiten oder herausgestellte angezogene elektrische Leiter sich nähern, muß anwendbare Sicherheit bezogener Arbeit Praxis und Verfahren einschließlich passende persönliche schützende Ausrüstung gemäß dem Standard für elektrische Sicherheitsauflagen für Angestellt-Arbeitsplätze (ANSI/NFPA 70E-2012) der Vereinigten Staaten und alle zusätzlichen Arbeitsplatzsicherheitsauflagen folgen, die auf Ihre Installation anwendbar sind. Safety Summary Definitions WARNING statements inform the user that certain conditions or practices could result in loss of life or physical harm. CAUTION statements identify conditions or practices that could harm the instrument, its data, other equipment, or property. NOTE statements call attention to specific information. Symbols The following International Electrotechnical Commission (IEC) symbols are marked on the top and rear panel in the immediate vicinity of the referenced terminal or device: 4 Caution, refer to accompanying documents (this manual). Alternating current (AC) operation of the terminal or device. Direct current (DC) operation of the terminal or device. Power switch Safety Precautions The following safety precautions must be followed whenever any type of voltage or current connection is being made to the instrument. • Connect the safety (earth) ground first, before making any other connections. • When connecting to electric circuits or pulse initiating equipment, open their related breakers. DO NOT install any connection of the instrument on live power lines. • Connections must be made to the instrument first, then connect to the circuit to be monitored. • Wear proper personal protective equipment, including safety glasses and insulated gloves when making connections to power circuits. • Hands, shoes and floor must be dry when making any connection to a power line. • Make sure the instrument is turned OFF before connecting probes to the rear panel. • Before each use, inspect all cables for breaks or cracks in the insulation. Replace immediately if defective. • If the equipment is used in a manner not specified in this user guide, the protection provided by the equipment may be impaired. These safety precautions are repeated where appropriate throughout this manual. 5 TABLE OF CONTENTS Introduction…………………………………………….…… 8 Getting Started……………………………………………... Connecting to AC Power Source………………...………... Controls, Indicators and Connectors….………...………… 9 10 12 Making Connections…………….………………………… Connecting Voltage Measurement Cables……………….. 3 Phase Four Wire Wye…………………………………….. 3 Phase (Floating or Grounded) Delta …….……......……. 15 16 19 20 Xplorer UI Touchscreen Features…………..……...…… 21 Xplorer Touch Icon Buttons……........………...………… 22 Xplorer Home Monitoring Page…...………..…………… Key Instrument Control Functions……………......……….. 23 24 Setup Monitoring....................................……………….. Measurement Connections………………………..……….. Automatic Setup for Power Quality….…………………….. Automatic Setup for Energy/Demand.…………………….. Wizard Setup…………………………………………..…….. Input Configuration….……………………………...……….. Monitor Same Circuit.......…………....…………………….. Load Setup Template………………....……...…………….. Load Data File from Memory.………………………..…….. Change Instrument Configuration……………...………….. View/Save Monitoring…...…………....…………………….. 25 26 26 27 27 28 38 39 39 41 41 Instrument Settings.................................……………….. Set Up Communications Options……....………...……….. Download Data Remotely via Network, WiFi & Bluetooth PAN.. Download Data via USB Connection..………...……....….. 42 43 44 45 Real Time Meter Modes…………………………………... Scope Mode …………….…………………………………… Dial Meters (graphical).….……………………………..…… Text Display Meters (tabular)………………………………. Dashboard............………………………………..…………. Harmonics ……………………………....…………………… Phasor Display ……………......……………………………. Strip Chart Recorder…………………………..……………. 46 46 46 47 47 48 48 49 Stored Data Functions and Displays…..………………. Event Data and Reports Menu………….……………...…. Trend Plot.………………………………………………...…. 50 50 51 6 Trend with Event Markers..……………………………...…. Event List.………………………………………………….… Event Plot (rms)……………...…………………………...…. Event Waveform..………………………………………...…. Event Detail………………..……………………………...…. 51 52 53 53 54 Reports.………………………..……………………..……… Voltage Compliance Report….………………...………..…. Energy and Demand Report……...……………..…………. Harmonics Statistics Report………....……..……………… Mini-Report Viewer..………......……………………………. 55 55 57 58 58 General Specifications…..…………………………….….. 59 Statement and Notices….………………………………… 59 7 INTRODUCTION The Dranetz HDPQ® Xplorer, Xplorer 400, Guide and Visa are portable, hand-held, eight-channel power quality meter/monitors which are very similar in operation, although the Xplorer also has a high speed sampling board for capturing the details of very fast transients. The features common to all monitors are covered in this document, and the Xplorer name will be used to represent all four instruments unless otherwise noted. These cutting-edge power quality instruments are designed with a 7” WVGA wide screen LCD, using touch screen technology. They can monitor, record and display data on four voltage channels, as well as four current channels simultaneously. The Xplorer is designed to meet both the IEEE 1159 and IEC 61000-430 Class A standards for accuracy and measurement requirements. It can do PQ-optimized acquisition of power quality related disturbances and events. It is designed with a statistical package called Quality of Supply (QOS), with monitoring and setup protocols set to determine voltage measurement compliance required for EN50160 monitoring. European standard EN50160 requires that measurement parameters must be within a specified percentage for 95% of the time. The Xplorer also allows you to perform automatic setup or to customize threshold settings for power quality or energy/demand. The power quality and energy/demand dashboard interface helps you monitor and manage energy consumption including utility costs. The Xplorer firmware can monitor power quality and energy/demand phenomena for troubleshooting and/or compliance purposes. It can record inrush conditions, carry out long-term statistical studies to establish performance baselines, and perform field-based equipment testing and evaluation for commissioning and maintenance. The firmware integrates an intuitive instrument setup procedure to ensure the capture of all relevant data for additional post process analysis, report writing, and data archiving using other compatible Dranetz software applications such as Dran-View®. 8 GETTING STARTED IMPORTANT NOTICE Charge Battery Before Use Always charge the battery fully before using the instrument! The instrument will fully charge its internal battery in three (3) hours. The instrument will always operate on the charger and is designed to do so regardless of the state of charge of the battery. Refer to the User Guide for additional information. Set Time and Date From the Home screen, press the Setup Instrument ( then press Set Time and Date. ) icon, Set the time zone applicable to your application using the Time Zone drop down selection list. NOTE: Time and/or date cannot be changed if monitoring is on. The Xplorer also lets you synchronize time, so that all of your devices are using the same time for data recording. Time sync options include GPS, NTP or Real Time Clock (RTC). Each Time Sync Source button toggles the respective source enabled or disabled. If all three are enabled, time sync is sourced by the instrument in the following priority order: If GPS is available, then it is used. If not and NTP is available, then NTP is used. If neither GPS nor NTP is available, then RTC is used. NOTE: If the battery is removed and only RTC time is available, the instrument reverts to the default time/date. Refer to the User Guide for additional information. 9 Connecting to AC Power Source Power The Xplorer AC adapter can be connected to a 50/60 Specifications Hz, 90-264V AC power input source. CAUTION Always set the power switch to the off position before connecting or disconnecting the input power cable. Operation of the Xplorer from an AC voltage source other than the rated voltage input stated on the instrument nameplate can cause damage to the instrument. PRECAUCION Siempre fije el interruptor de encendido en la posición apagada antes de conectar o desconectar el cable de energía de entrada. La operación del Xplorer desde una fuente de voltaje de ca que no sea la entrada de voltaje nominal indicada en la placa de identificación de la unidad puede causar daños a la unidad. MISE EN GARDE Mettez toujours l’interrupteur dans la position ouverte avant de connecter ou de déconnecter le câble d’alimentation primaire. Mettez toujours l’interrupteur dans la position ouverte avant de connecter ou de déconnecter le câble d’alimentation primaire. VORSICHT Vor dem Einstecken bzw. Ausstecken des Eingangsnetzkabels den Netzschalter immer in die Aus-Stellung bringen. Der Betrieb des Xplorer von einer Wechselspannungsquelle, die nicht dem auf der Namensplatte der Einheit aufgeführten Nennspannungseingang entspricht, kann zur Beschädigung der Einheit führen. 10 AC Power Source The Xplorer can be operated from a 50/60 Hz, 120/240V AC power source with or without the battery pack installed. • Voltage range, 120/240V AC • Frequency, 50/60 Hz • Power consumption, 20W STEP 1 Connect the AC adapter/battery charger plug into the left side of the instrument. STEP 2 Plug the AC adapter into an AC power source. STEP 3 Press the momentary On/Off power switch to turn the instrument on. Result: The Dranetz logo will be displayed while the instrument is booting. STEP 4 The instrument completes the power on sequence. If the instrument was shut down while monitoring, the instrument will resume monitoring upon power up. Result: Upon start-up, the Home screen serves as the access point for major instrument control functionalities. Home Screen: The Home screen displays large shortcut buttons to include Start Monitoring, Real Time Data, Recorded Data and Instrument Setup. Repeated pressing of the Dranetz logo alternates between the Home screen and the Home Monitoring screen. Home Monitoring Screen: After the instrument has been powered up and monitoring is turned ON, the Home Monitoring screen becomes the start-up page. This is the screen from which all other functions launch and eventually return back to using the Exit function key. 11 Controls, Indicators and Connectors Top View Voltage and Current Connections - There are four differential voltage and four differential current channels, which can be wired to measure a variety of circuit configurations. Use only Dranetz voltage leads and current probes for proper operation. Do not exceed the marked maximum ratings. Front View Color LCD with Touch Screen – the color LCD has an integral touch screen that is used to select functions for setups, real time meters, and viewing stored data. The color LCD touch screen is operable using the finger and/or a stylus. The touch screen display permits menu selection and alphanumeric data entry. Clean only with a soft cloth. Power Indicator - LED will light steadily when the instrument is operating normally. Three Button Icons - used to perform various functions i.e. take a Snapshot of the active screen, capture Mini-Reports and access Help screens. These buttons cannot be activated with gloves on, as they employ capacitive or touch technology. 12 Left Side View Left Side Panel - contains the power switch, GPS receiver port, and AC adapter input connector. Right Side View Right Side Panel - contains the ethernet port and two USB port connectors for the USB flash drive, as well as the USB cable for plug & play file transfer directly to a computer. 13 Rear View Rear Panel - shows the device mounting hanger located on top if you want to hang the instrument on a panel, wire coil holders to manage wire connections, and the hinge which deploys a stand. The stand also has features to hold the measurement wiring. Field Replaceable Battery Pack – the internal UPS feature requires that the internal batteries be properly charged and maintained. If the battery pack is in need of replacement, de-energize the connections and power to the instrument before opening the battery door. Replace the pack only with the Dranetz battery pack P/N BP-HDPQ. 14 MAKING CONNECTIONS WARNING Death, serious injury, or fire hazard could result from improper connection of this instrument. Read and understand the warnings in the beginning of this manual before connecting this instrument. ADVERTENCIA Una conexión incorrecta de este instrumento puede producir la muerte, lesiones graves y riesgo de incendio. Lea y entienda este manual antes de conectar. Observe todas las instrucciones de instalación y operación durante el uso de este instrumento. AVERTISSEMENT Si l'instrument est mal connecté, la mort, des blessures graves, ou un danger d'incendie peuvent s'en suivre. Lisez attentivement ce manuel avant de connecter l'instrument. Lorsque vous utilisez l'instrument, suivez toutes les instructions d'installation et de service. WARNUNG Der falsche Anschluß dieses Gerätes kann Tod, schwere Verletzungen oder Feuer verursachen. Bevor Sie dieses Instrument anschließen, müssen Sie die Anleitung lesen und verstanden haben. Bei der Verwendung dieses Instruments müssen alle Installation- und Betriebsanweisungen beachtet werden. 15 Connecting Voltage Measurement Cables Measurement Cable Set Description: Voltage measurement cables are provided as standard accessories, and are stored in a cable pouch as part of the measurement cable set, P/N VSC-HDPQ. Each cable set consists of a cable and an alligator clip. Voltage Rating: Direct connection of all voltage measurement cables are rated at 1000 VCAT III Vrms max. For measuring voltages greater than 1000 Vrms, potential transformers (PTs) must be used. Interconnect Jumpers The standard cable set for the HDPQ includes four (4) interconnect jumpers bearing part number 114013G1. These interconnect jumpers can be used to connect the same conductor points together and are rated 600V CAT III. When using the interconnect jumpers, also use the supplied wire markers to identify the wiring connections applicable to your installation. WARNINGS DO NOT EXCEED 600 VRMS when using Dranetz P/N 114013-G1 interconnect jumpers. For circuit configurations above 600VRMS, each voltage channel input is to be individually connected to the HDPQ instrument with the supplied 1000V CAT III cables and safety clips ONLY. Optional Fused Voltage Adapter There are two optional fuse voltage adapter accessory kits available for use with the measurement cables for the HDPQ Xplorer. A single kit (P/N FVA-1K1) contains one (1) fuse voltage adapter and one (1) black measurement connecting cable 50 cm in length. The other kit (P/N FVA-1K4) contains four (4) fuse voltage adapters and four (4) black measurement connecting cables 50 cm in length. These fuse voltage adapters are rated up to 1000V AC/DC applications. A wire marker kit consisting of snap-on wire markers in various colors are also supplied with each fuse voltage adapter to be used for identifying connections applicable to your installation. 16 The single fuse voltage adapter kit is used for one single voltage measurement input, while the four fuse voltage adapter kit is used for a three phase and neutral voltage measurement inputs. Wire Markers Each kit consisting of snap-on wire markers in various colors is supplied as described in the following table. These wire markers are to be used to identify each wire connection applicable to your installation. WMV-KIT (118376-G1) measures 0.138 inch diameter; kit is included with the standard measurement cable set and used for identifying voltage cables. WMI-KIT (118377-G1) measures 0.218 inch diameter; kit is included with the standard measurement cable set and is used for identifying current probes. WMFV-KIT (118376-G2) measures 0.138 inch diameter; kit is supplied with each Fuse Voltage Adapter and is used for identifying voltage cables. Wire Marker Color Blue WMV-KIT Quantity 16 WMI-KIT Quantity 4 WMFV-KIT Quantity 4 Black 4 4 4 Brown 4 4 4 Orange 4 4 4 Yellow 4 4 4 Red 4 4 4 Green 4 4 4 White 16 4 4 17 Measurement Cable with Optional Fused Voltage Adapter WARNING: To avoid the risk of electric shock or burns, always connect the safety (or earth) ground before making any other connections. WARNING: To reduce the risk of fire, electrical shock, or physical injury, it is strongly recommended to fuse the voltage measurement inputs. Fuses must be located as close to circuit connection as possible to maximize protection. WARNING: For continued protection against risk of fire or shock hazard, replace only with same type and rating of recommended fuse. WARNING: Do not replace fuse again if failure is repeated. Repeated failure indicates a defective condition that will not clear with replacement of the fuse. Refer condition to a qualified technician. --------------------------------------------------------------------------------The Xplorer can monitor the following power configurations: Single Phase Split Phase 3 Phase, Four Wire Wye 3 Phase (Floating or Grounded) Delta 3 Phase 2-Watt Delta Generic Circuit 2 ½ Element without Vb 2 ½ Element without Vc 3 Phase, Four Wire Wye and 3 Phase (Floating or Grounded) Delta are described in this Quick Reference Guide. For other configurations, please refer to the complete User Guide, UG-HDPQ. 18 3 Phase, Four Wire Wye Channels A, B, and C are connected to voltage and current probes. The neutral is connected to common, and is the reference for the three channels. The figure also shows voltage connection using channel D as a differential input for measuring neutral to ground voltage. Neutral to ground measurements are important, but optional. 19 3 Phase (Floating or Grounded) Delta In this power connection, the Xplorer uses voltage channels A, B, and C as differential inputs with channel A using source voltage A-B, channel B using B-C, and channel C using C-A as the reference. Current probes are connected to channels A, B, and C. Neutral to ground measurements are important, but optional. 20 XPLORER UI TOUCHSCREEN FEATURES All Dranetz HDPQ Xplorer screen functions are operable using the color LCD touch screen display. Use your finger and/or a stylus to apply light pressure to the LCD screen to initiate touch screen recognition. The touch screen display is also workable with lineman gloves on. In order to reduce power consumption, the backlight of the LCD screen times-out after a specified programmable time of no user activity. The backlight reactivates by touching any part of the screen. Sample touchscreen working area window shown below: Taskbar Icons The Taskbar features interactive icon graphics located at the top of the user interface. These icons are used as shortcuts to common instrument functions, and generally divided into three areas - Instrument Control Functions, Monitoring Status Functions and Housekeeping Functions. The current date and time is also featured on the rightmost side. The taskbar is generally used to navigate between different operations of the instrument. Work Area with Soft Function Keys Each displayable function will appear in the work window. The work window displays the selected data, function, control, etc. Depending on the data function on display, the work window may show soft function keys, the definitions of which can change based on the context of the screen. These soft keys are generally used to access submenus or pop-up screens as part of the operation of the active screen, such as zoom in/out, data entry, etc. The Exit or Done key typically closes the present viewing screen and returns to the previous screen. 21 XPLORER TOUCH ICON BUTTONS Touch Icon Buttons There are three touch icon buttons located below the LCD screen Snapshot, Mini-Report Capture and Help. The buttons allow you to perform functions specific to the screen on display, as described below: Snapshot Icon Button This button takes a snap shot image of the current screen. The image is saved to a mini-report if one is open. If no report is open, the image is saved to internal memory. Mini-Report Capture Icon Button This button opens or closes a mini report. The first time this button is pressed, a new report may be opened. You can then enter a report name and choose a template. The second time it is pressed, the report can be closed and saved. Help Icon Button This button allows you to access instant on screen Help. It is context sensitive, in that it displays the pertinent Help information based on the active screen. 22 XPLORER HOME MONITORING PAGE After the instrument has been powered up and monitoring is turned ON (and subsequently if monitoring is DONE), the Home Monitoring screen becomes the start-up page. The Home Monitoring screen allows you to view monitoring status and setups as configured. The taskbar located on top of the screen features shortcuts to common instrument functions. The monitoring summary includes: Monitoring Status - On or Off File Name - user specified or HDPQ Xplorer xx, where xx increments every time data is saved using the same file name Duration – length of time from the start of monitoring to the present time while monitoring is on Triggered Events – counts the number of events saved to memory Timed Events - counts the number of timed readings recorded Memory Available - remaining free space in GB in memory device % Memory Full - percentage of used space in internal memory of 4GB Icons to display the Start menu, access real time meters, view recorded data and set up instrument are found at the bottom of the screen. 23 Key Instrument Control Functions The major instrument control functionalities are described below: Start / Stop Monitoring Setup Instrument You have the option to use Automatic Setup and proceed directly with data monitoring or configure the instrument step-by-step using the Wizard Setup. You can also load previously saved setups or previously saved data from memory. If monitoring is ON, a warning message will be displayed requiring monitoring to be stopped before invoking. Setup is a configuration of parameter thresholds that control the data recorded by the Xplorer. See Section - Setup Monitoring. NOTE: The Start Monitoring icon changes into Stop Monitoring when monitoring status is on, and vice versa. You may perform instrument configuration settings such as time and date display preferences, language selection, communications options, firmware update, etc. See Section - Instrument Settings. Real-Time Data Displays voltage and current measurements, along with other calculated parameters in different modes. See Section - Real Time Meter Modes. Recorded Data Displays recorded data in either graphic or textual form, including events and trends, along with mini-reports and voltage compliance (EN50160) reports. See Section - Stored Data Functions and Displays. Remember! Typically, there are three ways to access these major instrument control functions: 1st – upon instrument power-up and prior to monitoring, by using the large shortcut buttons on the Home screen 2nd – on the Home Monitoring screen after the instrument has been powered up and monitoring is turned ON (and subsequently if monitoring is DONE) 3rd – on the taskbar of most typical screens, where shortcuts to common instrument functions are found 24 SETUP MONITORING The Start Monitoring icon takes you to the next page to begin setup monitoring. There are two ways to set up the instrument for monitoring - via Automatic Setup or Wizard Setup. Experienced users have the ability to turn on any available parameter and set threshold limits to any value within the acceptable range. The length of time to monitor a circuit can vary from a few hours to a few months or more depending on user application. Automatic Setup automatically configures the instrument’s circuit type, voltage and current channels, and parameter thresholds. The autoconfigured setup enables you to proceed directly with data monitoring. The Xplorer allows you to perform automatic setup for power quality or for energy/demand, depending on your application. Wizard Setup takes you through a series of screens prompting for information about the circuit to be monitored and the monitoring settings. The instrument turns on the appropriate voltage and current channels when you select a circuit type. Parameter thresholds are initially set based on the line voltage and current values that you enter. Threshold limits for capturing events are also set according to the monitoring mode selected. Selection of a setup mode typically depends on the user’s application and extent of familiarity with the operation of the instrument. Monitor Same Circuit makes use of the previous setup for monitoring. Load Setup Template allows you to load previously saved setup templates from internal memory or from an external USB device. Load Data File from Memory brings up a list of recorded session data files containing recordings that are saved to memory while monitoring is on. Change Instrument Configuration brings up the instrument settings menu to help you manage the instrument according to your setup preferences and application. Refer to Section - Instrument Settings. View/Save Monitoring Setup displays the list of parameter settings for application setup. 25 Measurement Connections The Xplorer can monitor the following power configurations: Single phase Split phase 3 Phase Delta 3 Phase Wye 3 Phase 2-Wattmeter Delta Generic 2 ½ Element without Vb 2 ½ Element without Vc While monitoring any of the above configurations, the Xplorer can also be connected to monitor neutral to ground voltage, and neutral or ground current. Automatic Setup for Power Quality Automatically configures the setup for monitoring quality of supply based on IEEE and IEC typical trigger settings. Automatic Setup is a one-stop process using pre-defined values to set up the instrument automatically. You have the option to view the summary list of parameter settings, change probe types, and/or proceed directly with data monitoring. From the Start Menu, press Automatic Setup for Power Quality. The auto-configured circuit type, nominal voltage, current and frequency values appear on screen. The remaining free space in GB is shown, and you have the ability to specify the name in which the PQ setup file can be saved. 26 Automatic Setup for Energy/Demand Automatically configures the setup for monitoring energy/demand. Automatic Setup is a one-stop process using pre-defined values to set the instrument automatically. You have the option to view the summary list of parameter settings, change probe types, and/or proceed directly with data monitoring. From the Start Menu, press Automatic Setup for Energy/Demand. The auto-configured circuit type, nominal voltage, current and frequency values appear on screen. The remaining free space in GB is shown, and you have the ability to specify the name in which the Energy/Demand setup file can be saved. Wizard Setup Wizard Setup guides you through the circuit setup step-by-step, via a series of screens prompting for information about the circuit to be monitored. The instrument automatically turns on the correct channels, sets the parameter thresholds and waveform capture settings depending on the detected circuit type, nominal voltage and current values, and monitoring mode specified. The user can then modify these settings if necessary. 27 From the Start Menu, press Wizard Setup. You can go through the monitoring setup step-by-step by clicking on the Next function key, or you can skip ahead and select the menu tab on top of the screen that you want to change/view. Note that any setup menu you skip remains configured using the auto-programmed or previous settings, which may not be compatible with your present application. Or if you return to a menu with an existing setup and then skip ahead, all menu settings, which may have been modified from the initial setup, will remain. The screens shown below follow the sequence by which they appear when in the Wizard Setup. Input Configuration Current probe types (if used), turns ratios (when using additional PTs and/or CTs), circuit configuration (single phase, wye, delta, etc.), and the nominal voltage, current and frequency tracking range are set up first before selecting the monitoring mode. Current Probe / Turns Ratios Setup Press the Probes & Scaling tab, or from the Wizard Setup screen press Next. The Current Probes – Turns Ratios window is displayed. Circuit Type Selection The Xplorer is able to display wiring diagrams from which you can select the circuit type appropriate to your application. The instrument will automatically select and display the detected circuit type when entering the screen, and compare the detected voltages, currents, and phase sequence (if applicable) to the selected circuit type. Press the Wiring Config tab, or from the Current Probes – Turns Ratios screen, press Next. Read the Warning advisory, then press I Accept to display the menu for circuit selection. 28 An auto circuit detection window is displayed to select the detected circuit type, nominal voltage, current and frequency. Parameters that match expected measurements are displayed in green. Ones that do not match are displayed in red. Frequency, Voltage and Current Settings The Nominal Values screen allows you to select frequency sync options, including channel source (Va, Vd, Ia, Id), speed of response (Standard Utility Power Line, Fast - Local Generator or Internal), and frequency sync min/max range. 29 Monitoring Modes The Xplorer provides nine monitoring modes of operation from which to monitor and capture data relevant to the user’s application. Selecting any setup category automatically sets trigger and capture conditions. Advanced users are free to mix and match settings using the trigger limits discussed in the next section. The Xplorer allows you to monitor events in the following setup categories: Standard Power Quality (IEEE/IEC): Xplorer algorithms automatically evaluate existing rms and waveform conditions to optimize setups to reliably capture data. This feature ensures that the first-time user gets the expected results, while providing the experienced user with the ability to tweak settings for specific applications. Either way, the necessary data used to identify critical events and optimize mitigation solutions is recorded. Current Inrush: Determining system characteristics during current inrush conditions such as impedance changes during motor energization or the I2t curve of a breaker trip is key to preventative maintenance and enhanced power system performance. Inrush type events, such as motor start-up, typically requires extended duration cycle-by-cycle recording. With Xplorer, users can capture and store detailed data to evaluate system performance against specifications and previous benchmark data. Under the current inrush mode, triggers are typically current-based. By operating in the inrush mode, the instrument will capture and store highly detailed data in real time, then rearm and be ready to capture data during the next test run. Fault Recorder: A fault in a circuit is usually due to unintentional grounding, a break in the line, a crossing or shorting of the wires, etc. A digital fault recorder logs extended duration cycle-by-cycle recording. Under the fault recorder mode, triggers are typically voltage-based. The 30 Xplorer can help locate failures detected in various components of assorted equipment by recording an extended period of cycle-by-cycle data to capture the entire duration of the fault and the associated system response. Energy & Demand Audits: Monitors demand and energy parameters for energy audits, efficiency studies and cost reduction programs. Long-Term Timed Readings: Performing a statistically valid power quality energy survey requires the capture of a set of basic data over an extended period of time. The Xplorer is designed to facilitate long-term monitoring by collecting min/max/avg data at each predetermined interval in order to perform post-process harmonic and other events analysis. The Xplorer is also designed to be left unattended in the field, recording statistically representative data for long-term analysis. Continuous Data Logging: This logs the rms and power values once per second for totally gapless logging. Cyclic triggers are disabled. No waveforms are recorded under this monitoring mode. Voltage Compliance (EN50160): EN50160 monitors and reports Quality of Supply (QOS) compliance as specified by the EN standard. The seven parameters required by EN50160 to determine QOS compliance are: Power Frequency, Supply Voltage Variations, Rapid Voltage Changes, Supply Voltage Unbalance, Harmonic Voltage, Interharmonic Voltage, and Mains Signaling. Motor Quality: Automatically sets up the parameters that affect the operation of motors. Motor parameters include True Power Factor, Horsepower and Derating Factor, among others. NOTE: You can override the default settings in any of the above monitoring modes to customize the instrument to your application. Limits Setup Options After selecting a monitoring mode, the system is now ready to begin monitoring and to record data in memory. Prior to actual monitoring, you have the option to accept the default threshold settings and proceed with monitoring, or to review and/or modify monitoring settings. Trigger limits list the threshold parameters available for review or modification. Experienced users are able to customize threshold settings according to their applications. They can turn on or off any available parameters and enter new threshold limits, as required. 31 After selecting a monitoring mode, press the Trigger Limits tab or press Next. The Limits screen will vary according to the selected monitoring mode. Trigger Limits for all Monitoring Modes Except Voltage Compliance (EN50160): The Xplorer allows you to set the limits for the following triggers: Set RMS Limits – use to review/modify limits for rms variation as well as set the amount of rms value (in cycles) to record before and after the trigger cycle. Dranetz instruments label rms voltage or current variations as either sags (voltage or current decreases below low limit) or swells (voltage or current increases above high limit) as per IEEE 1159. Voltage disturbances which are shorter in duration than typical sags and swells (which are usually 1/4 cycle or longer) are classified as transients. 32 The Xplorer uses four different algorithms to detect and record transients, while Dranetz HDPQ Guide and Visa have three. You have the option to check Enable Automatic Limit Incrementing to set limit trigger channel settings to autothreshold mode. Set Peak Transients – use to set peak or instantaneous trigger magnitude. The crest factor or instantaneous peak is the absolute peak sample value within one cycle. The instantaneous peak triggers on the absolute peak value of the entire waveform. Set Waveshape Transients – use to set waveshape threshold duration (window) and magnitude (tolerance) cycle to cycle. A trigger occurs when either waveshape or rms deviation go outside the programmed thresholds. Waveshape trigger values include the magnitude and duration of the difference between the present and previous cycle. 33 Set RMS Diff Transients – use to set the rms distortion waveshape limit. The rms deviation algorithm subtracts the same point-on-wave sample values from previous to present cycle then calculates the rms value of the deviation over an entire cycle. If this value exceeds the threshold, then a trigger occurs. Set High Frequency Transients – the high speed sampling analog board installed in Dranetz HDPQ Xplorer enables it to detect and capture transients as small as 1 microsecond in duration. This transient detection algorithm is only available on the Xplorer. 34 XTRIG Channels – use to set the trigger channels/parameters for waveform capture to determine which channel’s data will be saved when a trigger occurs. Timed Intervals – use to define how often you want the Xplorer to save data periodically, regardless of power quality disturbances and journal limits. The intervals for timed readings are user programmable. Journal Limits – multiple parameters are available for recording by exception. This menu lets the user specify thresholds to force journal recording at the moment the threshold is crossed. Note only the values of the parameter are captured, and not rms or waveform data. 35 Monitoring Mode for EN50160 Voltage Compliance The following screen appears if the selected monitoring mode is Voltage Compliance (EN50160): If the default settings for the specified monitoring mode are acceptable, proceed to the next tab Finalize (if there is nothing else to change). If Strict Compliance is not checked, you can customize the setting on this screen. Finalize Monitoring Setup Once the instrument has been set up for monitoring or after reading a setup template from memory, you can finalize and configure the monitoring process using the parameters below. Start/Stop Monitoring Conditions Under the Start monitoring options, select one from the following: Immediate - to begin monitoring immediately Delay - use the window provided to enter the number of days, hours, minutes or seconds of delay to start monitoring from the present time Specified time and date - use the corresponding windows provided to specify the time and date when monitoring begins 36 Under the Stop monitoring options, select one from the following: Storage full - to end monitoring when memory storage is full Delay - use the window provided to enter the number of days, hours, minutes or seconds of delay to end monitoring Specified time and date - use the corresponding windows provided to specify the time and date when monitoring ends Never - to keep monitoring without a specified end date/time NOTE: You can manually stop monitoring at any time using the Stop Monitoring icon. Under Memory: Free Space - indicates the remaining space in memory in gigabytes Used Space - indicates the memory space used in gigabytes Manage Memory - lists the recorded monitoring sessions, when events have been captured and stored in memory. Each recorded session is identified by the Session #, Name, the Date and Time range when monitoring started and ended, and the Number of Event Records contained in the particular session. The monitoring sessions are arranged in the order of date and time they were recorded. Configuration: View Summary - use this key to display the parameter settings in effect; Setup summary is available for review before, during, and after monitoring. Save - use this key to create a filename and save the Setup file template in memory. Optional Information: Name - You can enter a monitoring session name which will be used to identify a session in the HDPQ session list. This name will also be used as a file name when archiving a session to the USB flash drive. Location and Notes - You can add additional lines of text in this field which will be displayed in the setup summary. 37 Exit Setup At the end of the Wizard Setup, the Exit Setup screen prompts you to either accept the setup changes or not, before going on to start monitoring (if accepted). You also have the option to use the instrument as a meter, where monitoring setup changes are retained without turning monitoring on. If you jump to the Start Monitor mode while stepping through the Wizard Setup, this screen will pop up to verify if the changes are to be accepted or not, before continuing on to start monitoring (if accepted). Use as Meter if you want to finish the setup process (save setup changes) but DO NOT turn monitoring on. Accept if you want to confirm changes made in monitoring settings and start monitoring. Exit if you want to retain monitoring settings as they were and return to Start Menu. Monitor Same Circuit Menu options for monitoring become available only after setting up the instrument or from reading a setup template from memory. You can make use of existing setups for monitoring using the Monitor Same Circuit key. 38 Load Setup Template The Xplorer lists the setup template files (.set) stored in internal memory or external USB device, along with wiring configuration, setup mode application and location of file. Setup files are arranged in the order of date and time they were recorded. NOTE: Loading a setup template from memory will overwrite your existing setup. Select (highlight) the desired setup template file that you want to Load from internal memory or USB into the instrument’s setup memory. Load Data File from Memory The Xplorer lists the recorded monitoring sessions, when data has been captured and stored in memory. Each recorded session is identified by the Session #, Name, the Date and Time range when monitoring started and ended, and the Number of Event Records contained in the particular session. The monitoring sessions are arranged in the order of date and time they were recorded. 39 NOTE: The icons on the screen indicate the status of action you take with a particular session data file. Select (highlight) the desired session data file, then press the key corresponding to the action that you want to take: Open - brings up the Event Data & Reports menu. Once you open a session data file, it will load and store it into the instrument’s event and trend memory, and it becomes available to be acted on by the view data screen functions. Close – removes the data file from the instrument’s event and trend memory. Delete - clears the selected (highlighted) session data file in the list. This will remove the selected file from memory. Delete All - clears all session data files in the list. This will remove all data files from memory. NOTE: All data files stored in event memory will be lost when you press Delete All. Copy any file that you want to save to a USB flash drive or computer first before deleting all files. Archive to USB - copies and saves data files from internal memory to an external memory device (USB). Once the files have been saved, you will need the Dranetz Dran-View® program to retrieve and view the files in your computer. NOTE: When saving files to USB: If the data file is open for active viewing, you have to close the file first in order to archive or save the file to the USB flash drive. If the data file is open for active monitoring, you have to first press stop monitoring, then view the setup session file. Once the setup file has been successfully recorded, events captured, and then stored in memory, you can proceed to archive or save the file to a USB flash drive. Archive Locally - copies and saves data files locally into the instrument’s internal memory. Once the files have been saved, it becomes available to be acted on by the view data screen functions. NOTE: You cannot archive an active session file. You have to close the file first in order to save it to the instrument’s local memory. 40 Change Instrument Configuration The Xplorer lets you manage the instrument to ensure that it runs efficiently, and the instrument is set up according to your preferences and application. View/Save Monitoring Setup summary displays the list of parameter settings for the present setup application. You have the ability to save the monitoring settings to internal memory or to an external USB flash drive. Save to Memory if you want to save the monitoring settings to internal memory. Save to USB if you want to save the monitoring settings to an external USB device. Make sure the device is plugged into the USB port. 41 INSTRUMENT SETTINGS Instrument settings describe the miscellaneous tasks that you can perform to keep the Xplorer running efficiently. These are tasks that you might perform only occasionally. You can configure the instrument to set up the following: Time and date display Language selection Communications options Manage files in memory Firmware update Trigger alarm setup Setup display Factory default settings As with other instrument control functions, there are three ways to access the Setup Instrument page: 1st – upon instrument power-up and prior to monitoring, using the large shortcut button, select Setup Instrument on the Home page. 2nd – on the taskbar of most typical screens, where shortcuts to common instrument functions including Setup Instrument are found. 3rd – from the Start Menu, press Change Instrument Configuration. 42 Set Up Communications Options Communications setting is where you enter instrument-specific information to enable the Xplorer to communicate to external devices. The available communications interfaces are: Ethernet, WiFi and Bluetooth. WiFi and Bluetooth options are standard for the HDPQ Xplorer and Guide. WiFi is factory installed and not available on the Visa. These communications interfaces can be used for VNC remote control, remote access by the Dranetz HDPQ App, and for Modbus TCP. Ethernet IP connection (Wired) – The Xplorer can be connected to any Ethernet network (10/100 MBaud Ethernet) using Ethernet/IP software protocols. The instrument must be connected to the computer network via the Ethernet cable port. Configurations using the Ethernet/IP protocol require an IP Address for network communication, and a Gateway address to effectively communicate with the host device. Wireless (WiFi) network connection – The wireless network connection is identical to a standard Ethernet connection, except that it requires a wireless local area network (WLAN) access point or hotspot based on any of the 802.11x standards, a wireless network card installed in the Xplorer (factory-installed at the time of purchase), and a wireless-enabled host laptop/computer. Bluetooth connection – The Xplorer requires the addition of a Dranetz supplied Bluetooth external adapter in order to connect to a wireless-enabled device using the Bluetooth networking mode. The Bluetooth interface uses a PAN network that is only available on PC based devices. VNC connection – The Xplorer can be VNC-enabled so that any VNC Client can access the instrument remotely, provided the correct password is entered. Virtual network computing (VNC) software allows you to view and interact with the Xplorer from any other computer or mobile device anywhere using the Internet. VNC software is cross-platform, allowing remote screensharing control of the Xplorer. A VNC app or program (not supplied by Dranetz) is required on your computer, tablet or smartphone for VNC remote control. Modbus connection – HDPQ Xplorer can also be connected for real time measurement reading via the Modbus/TCP protocol. 43 Download Data Remotely via Network, WiFi & Bluetooth PAN 1) Navigate to the Manage Memory screen (Instrument Settings > Manage Memory). Select a recorded monitoring session and press Archive Locally. 2) Connect to the instrument with a web browser and enter http://xxx.xxx.xxx.xxx/user, where xxx.xxx.xxx.xxx is the IP address of the instrument. 3) Enter the Username and Password for the instrument. The username is always admin. The default password is Dranetz. Password setups can be done in the instrument's Communications settings. 4) The web page will show four folders, each of which contains the following information to upload: screens – contain all screen snapshots not associated with a mini report reports – contain the Mini Reports setups – contain the Setup files archive – contains the ddbx data folders 5) Click on any folder to see the available files to download. Proceed to select a file to download to your computer. The selected content file will be downloaded into the Downloads folder of your web browser. 44 Download Data via USB Connection 1) Plug the small end of the USB active sync cable into the small USB connector on the right side of the HDPQ instrument. Plug the other end into the USB connector on your computer. 2) The HDPQ instrument will plug & play, and the Windows® Mobile window will open automatically. 3) In your device, look under File Management, and click on Browse Contents. 4) Navigate to the folder directory: Computer\HDPQ\Flash\User You should see the following folders: screens – contain all screen snapshots not associated with a mini report reports – contain the Mini Reports setups – contain the Setup files archive – contains the ddbx data folders 5) Click on any folder to see the available files to download. Proceed to select and right-click on a file and select Copy. 6) Using Windows® Explorer, navigate to the folder where you would like to upload the data. Right click and select paste to transfer the data to your computer. 45 REAL TIME METER MODES Scope Mode Scope mode functions as an oscilloscope, displaying real-time waveforms of voltage and current for up to eight channels simultaneously, updated approximately once every three seconds. The colors of waveform display are user programmable. Waveforms may be displayed on a single or dual axis (overlaid or stacked). A range check function shows the detected input range for all channels. Scope mode also provides a textual display of rms values, division for axis values, and frequency. Dial Meters (graphical) Dial Meters allow you to define the parameters, and create dial-type readings of each channel or parameter. Readings are updated approximately once every three seconds. Six dial type meters can be displayed for any of the channel/parameters that are journalled. By default, the instrument shows dial-type readings for Va, Vb, Vc, Ia, Ib, Ic. Axis (end points of meter) can be changed on a per meter basis, and journal limits can be shown as bands of colors on the dial face. 46 Text Display Meters (tabular) Text display meter screens are displayed in tabular form. The metered parameters are logically separated into the following tabs: Standard, Distortion, Unbalance, Advanced Power, Advanced Demand & Energy and Advanced Flicker. The function keys at the bottom of the meter screens change depending on the parameter tab selected. NOTE: Meter mode operation does not interfere with any of other Xplorer monitoring or recording functions. Dashboard The Dashboard is a visual way of seeing present values, and if any events occurred, such as out-of-limit conditions, for each of the displayed parameters. The Dashboard is color coded to indicate whether or not the parameter is within limits. Green indicates the parameter is within limits and/or no events have occurred since the Dashboard was last cleared. Red indicates the parameter is extremely out of limits and/or events of that type have occurred since the Dashboard was last cleared. It can display status summary for three report types - Power Quality (PQ), Energy/Demand and Motor Health. Real time data, event count, or user specified calculated data is available in 2x3, 3x4, or 4x6 matrix displays. 47 Harmonics Harmonics display the amplitude and phase of each harmonic to the 127th harmonic in both graphical and textual format. You can select which parameter to show the harmonics for (V,I,W), which channel (A,B,C,D) zoom in on the 5Hz components, set options such as show harmonics and/or interharmonics and then display in Hz or harmonic number, scale to the fundamental or absolute value, and list the harmonic magnitudes and phase angles in tabular fashion. Phasor Display The phasor screen displays a graph that indicates phase relations between voltage and current based upon the angles at the fundamental frequency, as determined by Fourier analysis. Phasor diagram displays voltage and current phasors for all channels. Functioning as a phase angle meter, the instrument can display system imbalance conditions and provides such information in textual form as well. The phase angle display can also verify if monitoring connections have been made correctly. Animated phasor demo rotations demonstrating resistive, inductive and capacitive loads can be displayed. 48 Strip Chart Recorder Strip Chart Recorder displays a real-time auto-scaled graph of selected parameters, updated once every 3 seconds. The initial strip chart screen records up to 10-minutes worth of horizontal scale data, with the vertical axis also initially on auto-scale. Once 10-minutes worth of data is drawn across the entire graph, the horizontal scale continues to shift forward in time with each update. This process continues until the Clear function key is pressed. 49 STORED DATA FUNCTIONS AND DISPLAYS The Xplorer offers a graphical, information-packed, and easy to navigate display of event data. Trend, Event List, Event Plot, and Event Waveform are available for display, with options to view detailed information in graphic as well as textual form. The Xplorer also does Voltage (Quality of Supply or QOS) compliance monitoring as specified by EN50160, or other similar voltage compliance standards. Event Data and Reports Menu Event data and reports become available while monitoring is on or upon reading a file from internal memory or external flash drive. Press the Recorded Data icon to bring up the Event Data & Reports menu. While monitoring is on, you can use the Data Review icons to bring up the same data and reports menu. The Event Data & Reports menu lets you select how to display recorded data, either in graphic or textual form. These include both trended data and events generated from user programmed triggers or thresholds. What are Events? An event occurs when a programmed threshold limit is crossed. An event consists of the pre-trigger cycle(s), trigger cycle(s), and post-trigger cycles(s), when available. The event data for all of the captured channels can be displayed in time plots of the rms values or waveforms, event details such as trigger conditions, characterization of the event according to PQ standards, and min/max values, or the time-stamped event list. What is displayed on a Trend? It shows journalled (timed) event data trend over a specific time range. Journals are periodic events recorded by the instrument at a specified timed interval. The trend plot can show up to three (3) parameters, and each parameter can then show up to four (4) channels on the same axis. 50 Trend Plot Users can generate time plots or trend visualizations for all journalled data combined with min/max/avg recordings of that parameter. Most journal parameters have multiple channels to plot. The Trend screen can display up to four (4) stacked graphs with as many as four (4) channels in each graph. You have the option to enable/disable plot display; the display area will resize according to the number of plots enabled for display. Trend with Event Markers The same as trend plots, but includes event markers on the time axis where there are events - events are marked on the horizontal axis with a triangle. Pressing a triangle will allow you to jump to the event list showing events near this marker. 51 Event List Presents a summary of all captured events in the order in which they occurred. Each event entry contains the date and time when the event was captured, the color coded channel/parameter of the captured event, the event category and event classification. The event list can be filtered by type and/or time. Once you bring up an event screen, the taskbar changes to show specialized icons that provide easy access to view event display. These icons are not common to all screens, only to event data screens. Trend Plot Displays time plots or trend visualizations of journalled data. Event List Presents a summary of all captured events in the order that they occurred. Event Plot (rms) Shows the voltage and current rms plots recorded for the event. Threshold values and event details can be displayed using the corresponding function keys. Event Waveform Shows the voltage and current waveforms that were captured with the event, based on user settings. 52 Event Plot (rms) Event rms plot displays the actual voltage and/or current rms that occurred when a certain threshold parameter was crossed. The horizontal black dotted lines indicate the upper and lower limits that trigger events. The Red vertical line indicates the trigger timestamp or start of event. Event rms plot of voltage and current NOTE: Event plot displays events in rms by default. To view event plot in waveform display, press the Waveform icon on the taskbar. Event Waveform The Xplorer allows you to view events in graphic waveform display. Waveforms from transient event capture NOTE: The instrument will only display waveform data for channels that are enabled to record waveforms. For channels that do not have associated waveform data, the screen will maintain the format, but will leave the plot blank. 53 Event Detail Event detail screen is generated for each event. Event details show the triggered parameters and event data saved by the instrument, along with characterization information about the event. The event details will also include result of the Sag Directivity and Power Factor Correction Capacitor AnswerModules (not available on Dranetz HDPQ Visa). Each event entry is identified by the time and date when the event was captured (shown on header row), the trigger parameters, and characterization details pertaining to the selected event entry. The threshold values captured are color coded. Triggered parameters that are within limits are shown in green. Triggered parameters that are out of limits, exceeding Low or High threshold limits, are shown in red. Detailed information of transient event capture 54 REPORTS You have the option to view and set up data via the Voltage Compliance Report, Energy/Demand Audit Report, Harmonics Statistics Report or the Mini-Report Viewer. Each report has their own method of presenting compliance data, as well as differs on the length of evaluation period to monitor compliance. Voltage Compliance Report Voltage Compliance Report appears in the form of a table called Compliance History. Compliance History displays a summary of the QOS evaluation status. The Voltage (QOS) functionality is equipped with monitoring and setup protocols to meet the measurements required for EN50160 monitoring. EN50160 is a European standard that stipulates the voltage characteristics that can be expected in public distribution networks. EN50160 specifies that various parameters must be within a specified percentage for 95% of the standard one week monitoring period. Use the respective functions keys – Statistics Summary, DISDIP, Min/Max - to view the voltage compliance summary, the magnitude and duration distribution table (DISDIP), and the min/max values for Power Frequency and RMS Voltage during monitoring interval. Statistics Summary Voltage Compliance Summary appears in the form of a statistical bar chart featuring the seven parameters required for determining QOS compliance. The color of the bar indicates compliance status. A green bar indicates that the parameter is within compliance. A red bar indicates that the parameter does not comply with the QOS limits. Each measurement parameter is discussed in the following pages. 55 You can view component graphs for three parameters using the soft keys provided - Frequency for Power Frequency graph, Harmonics for Harmonic graph, and Interharmonics for Interharmonic graph. DISDIP The EN50160 DISDIP (distribution of dips) table is based upon the event statistics calculated by EN50160. It includes the UNIPEDE DISDIP Statistics and the table for Transient Overvoltages. UNIPEDE DISDIP data is collected and saved on a weekly basis with the counts reset as the final file save occurs. If additional data is detected for an evaluation period after that period has been saved, that internal data is retrieved and updated. The DISDIP table also includes those events of Transient type. Use the Transient key to display data for Transient Overvoltage. 56 Min/Max The Min/Max table displays the minimum and maximum values for Power Frequency and RMS Voltage, along with the time and date of occurrence. Maximum phase values of Rapid Voltage Change, Flicker, Supply Voltage Unbalance, and Harmonic are also displayed along with time and date of occurrence. Press the next pages to display the rest of the table values and view Harmonic values up to order number 25. Energy and Demand Report The Xplorer gives you the option to view the demand and energy report. The report list, as shown below, helps you monitor and manage energy consumption including utility costs. Use the function keys at the bottom of the screen to select Energy or Demand report for viewing. 57 Harmonics Statistics Report Harmonics Statistics Report allows you to set up a harmonic statistics report, based on the 3-second data calculating the 95 and 99% values per IEC 61000-4-7 and IEEE 519. Use the function keys at the bottom of the screen – Open, Start Today, Start Date, Failed Only, Weekly Only - to set up the report. Mini-Report Viewer The Mini-Report Viewer brings up the list of active or previously saved mini-report(s) available. Select the report that you want to view or save to an external USB flash drive. Use the Open key to view the report to the full size of the LCD display, with the taskbar on top remaining active and viewable. The viewer opens the file in .rtf format, with read only function, and editing not enabled. The Delete All key clears all active or previously saved mini-reports on the list. This will remove the mini-report files from memory. The Copy to USB key allows you to save the report file - with the text and image, if any. Graphics are saved as an image in .bmp format, while alphanumeric content is saved as a text (.txt) file. 58 General Specifications Dimensions: Size: 10” Width x 8” Height x 2.75” Depth (25.4 x 20.3 x 7cm) Weight: 4.2 pounds (1.9 kg) Environmental: Operating: 0 to 50 °C (32 to 122 °F) Storage: -20 to 55 °C (4 to 131 °F) Humidity: 10% - 90% non-condensing Altitude: 2000m (6560 ft) maximum Installation Categories: Mains Supply: Installation Category II, Pollution Degree 2 Measurement Voltage Inputs: 1000 Vrms Maximum Installation Category III, Pollution Degree 2 ______________________________________________________ Statements and Notices Statement of Warranty All Dranetz manufactured portable instruments and accessories are warranted to the original purchaser against defective material and workmanship for a period of three years from the date of invoice. User replaceable instrument batteries are warranted for a period of one year from the date of invoice. Certain Dranetz branded accessories, such as current transformers and other accessories not manufactured by Dranetz, are warranted to the original purchaser against defective material and workmanship for a period of one year from the date of invoice. Warranties for products and accessories sold by, but not branded as Dranetz, are covered by their respective manufacturer’s warranties and are not warranted by Dranetz. Dranetz will repair or replace, at its option, all defective equipment that is returned, freight prepaid, during the warranty period. There will be no charge for repair, provided there is no evidence that the equipment has been mishandled or abused. This warranty shall not apply to any defects resulting from improper or inadequate maintenance, buyer-supplied hardware/software interfacing, unauthorized modification or misuse of the equipment, operation outside of environmental specifications, or improper site preparation or maintenance. 59 Statements and Notices (cont.) Statement of Reliability The information in this Quick Reference Guide has been reviewed and is believed to be entirely reliable. However, no responsibility is assumed for any inaccuracies. All material is for informational purposes only, and is subject to change without prior notice. Notice Regarding FCC Compliance This device has been tested and found to comply with the limits for a Class A digital device, pursuant to Part 15 of the FCC Rules. These limits are designed to provide reasonable protection against harmful interference when the equipment is operated in a commercial environment. This equipment generates, uses, and can radiate radio frequency energy and, if not installed and used in accordance with the instruction manual, may cause harmful interference to radio communications. Operation of this equipment in a residential area is likely to cause harmful interference in which case the user will be required to correct the interference at his/her own expense. Notice Regarding Proprietary Rights This publication contains information proprietary to Dranetz. By accepting and using this Quick Reference Guide, you agree that the information contained herein will be used solely for the purpose of operating equipment of Dranetz. Copyright This publication is protected under the Copyright laws of the United States, Title 17 et seq. No part of this publication may be reproduced, transmitted, transcribed, stored in a retrieval system, or translated into any language or computer language, in any form, by any means, electronic, mechanical, magnetic, optical, chemical, manual, or otherwise, without the prior written consent of Dranetz, 1000 New Durham Road, Edison, New Jersey 08818. Copyright © 2014 Dranetz All Rights Reserved. Printed in the United States of America. Trademarks Dranetz HDPQ®, Scope Mode®, and Dran-View® are registered trademarks of Dranetz. Other trademarks and trade names are those of their respective owners. 60