1
DA2_FX9850GB_01.qxd 12/30/05 09:58 AM Page 9
CHAPTER 1
Calculator Notes for the fx-9750G Plus
and CFX-9850GC Plus
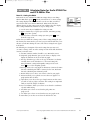
Note 1A • Setting the Mode
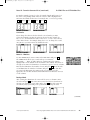
Each mode on your calculator has different settings that you can change.
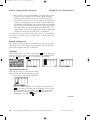
While in RUN mode, press SHIFT [SET UP]. Arrow down to see more settings.
The settings displayed in the screens above are the ones that you will use
most often in this course while in RUN mode. Other modes may have
different choices on their setup screens. If your calculator does not display
these settings in RUN mode, follow these steps to change them.
a. Use the arrow keys to highlight the setting you want.
b. Press a function key to register your selection. Sometimes pressing
F6 (¤) gives more options.
c. When you have selected the settings you want, press EXIT to exit
from the setup screen.
In this class, you will need to change some of these settings during the year.
The list may not mean much to you now, but your textbook will refer you to
this note several times during the course. All of these settings do not appear
in all modes.
The following is a description of the mode settings that you may need
(or want) to change. There are other settings in some modes that should not
concern you in this course.
a. Stat Wind (statistics window) should be set to Man in this course.
b. Graph Func (graph function) gives you the choice to display or not
display the function on the screen with its graph.
c. Func Type (function type) refers to the type of function (or relation)
currently active on the calculator. Y is the usual setting. The
Parm (parametric) setting and inequality settings are also used.
Press F6 (¤) to see the inequality options.
d. Draw Type refers to the way graphs are drawn. Con (connected) means
that each calculated point will be connected to the next. Plot means
that each calculated point is drawn by itself.
e. Plot/Line allows you to choose one of three colors for your graph.
f. Dual Screen allows you to split the screen to show two graphs or a
graph and its table of values.
g. Angle allows you to choose the type of angle measure. In this course,
you will use only deg (degree) measure. This setting is not important
until you reach the chapter on distance.
h. Coord (coordinates) allows you to show or not show the coordinates
of points while tracing.
i. Grid allows you to show or not show the grid points on a
graph screen.
j. Axes allows you to show or not show the axes on a graph screen.
k. Label allows you to show or not show the label for the axes.
(continued)
©2007 Key Curriculum Press
Discovering Algebra Calculator Notes for the Casio fx-9750G Plus and CFX-9850GC Plus
9
DA2_FX9850GB_01.qxd 12/30/05 09:58 AM Page 10
Note 1A • Setting the Mode (continued)
fx-9750G Plus and CFX-9850GC Plus
l. Display refers to the way in which numbers are written. The options
are Fix (fixed), Sci (scientific), Norm (normal), and Eng (English).
Usually the setting should be Norm. Sci is used in the chapter on
exponents. After you choose Sci, you also decide on the total number
of digits you want displayed. The Fix setting is useful in hiding long
decimal answers and will make some numbers clearer. After choosing
Fix, you choose how many digits appear to the right of the decimal
point. This setting is helpful in applications involving money, for
example, where one wants two decimal places showing. Change this
setting back to Norm when you don’t need a special display.
If you find that your screen looks strange when you try to do something, it’s
a good idea to look at the setup screen and check to see if any settings have
been changed.
Note 1B • Entering Lists
The calculator contains six folders, each with six preset lists. You can enter
255 elements into a list if enough memory is available. You can enter data
directly into lists from either LIST or STAT mode.
Clearing Data
From the Main Menu, select LIST or STAT and press EXE . If a list already has
data in it, position the cursor so that any cell of the list is highlighted, and
then press F4 (DEL-A). Press F1 (YES) to delete all the cells in the list.
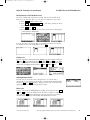
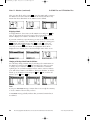
Entering Data Directly into a List
Follow the steps below to enter data, for example,
{400, 455, 390, 450, 360, 320, 480, 480}, into a list.
a. Select LIST or STAT from the Main Menu.
b. Enter each number into List 1. After entering each data value, press
EXE . If you want to add a data value in the middle of the list, move
the cursor to the place of insertion, press F5 (INS), and then enter
the new number and press EXE . To remove an entry from a list,
highlight the entry and press F3 (DEL).
(continued)
10
Discovering Algebra Calculator Notes for the Casio fx-9750G Plus and CFX-9850GC Plus
©2007 Key Curriculum Press
DA2_FX9850GB_01.qxd 12/30/05 09:58 AM Page 11
Note 1B • Entering Lists (continued)
fx-9750G Plus and CFX-9850GC Plus
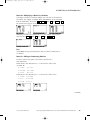
Entering Data into a List from the Run Screen
If you are working with a short list, you may want to enter it while in the
Run screen. To enter the data {1, 2, 3, 4} into List 1, follow the steps below.
a. Press OPTN F1 (LIST) to list the data.
b. Press SHIFT [ { ] 1 , 2 , 3 , 4 SHIFT [ } ]. (The brace symbols are above
the multiplication and division signs.)
c. Press → F1 (List) 1 EXE .
d. You can check to see that the new data is in the list by selecting LIST
or STAT from the Main Menu.
You can also enter a list into the Run screen without storing it in a stat list
by entering the values as in step b above. Press EXE .
Deleting a List
To delete a single list while in LIST mode, highlight any entry in the list and press
F4 (DEL-A) F1 (Yes). In STAT mode, press F6 (¤), then F4 (DEL-A) F1 (Yes). To delete
all lists, select MEM from the Main Menu. Highlight Memory Usage and press EXE .
Arrow down to highlight List File and press F1 (DEL) F1 (FILE1) F1 (Yes).
Switching Between List Files
You can store up to six lists (List 1 through List 6) in each file (File 1
through File 6). To switch between list files, select LIST from the Main Menu
and press EXE . Press SHIFT [SET UP] to display the List setup screen. Press the
appropriate function key to select the file you want.
Moving a List
To move a list, begin by highlighting the heading of an empty list. Press OPTN
F1 (LIST) F1 (List), enter the number of the list whose contents you want to
copy, and press EXE . The list data appears. You can now delete or overwrite
the data in the original list, and the data will remain in the new list.
©2007 Key Curriculum Press
Discovering Algebra Calculator Notes for the Casio fx-9750G Plus and CFX-9850GC Plus
11
DA2_FX9850GB_01.qxd 12/30/05 09:58 AM Page 12
fx-9750G Plus and CFX-9850GC Plus
Note 1C • Mean, Median, and Mode
Enter the data into a list. (See Note 1B if you don’t remember how to enter
data into a list. This example uses the same data as the first list entered in
Note 1B.)
a. Press MENU , select RUN, and press EXE .
b. Press OPTN F1 (LIST).
c. Press F6 to see more menu options.
d. To find the mean, press F3 (Mean) F6 F6 F1 (List), and the number of
the list that contains the data. Then close the parentheses, press EXE ,
and press F6 to see more menu options.
e. To find the median, press F4 (Med) F6 F6 F1 (List), the number of
the list that contains the data, and EXE .
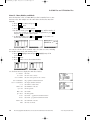
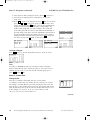
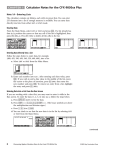
You can also calculate all the statistical values of a data set at once, including
the median, mean, mode, and summary values.
a. Press MENU . Highlight STAT and press EXE . Highlight any cell in
your list.
b. Press F2 (CALC).
c. Press F1 (1VAR) to access the statistical values.
Use the down arrow to display the entire list of values.
x 416.875
x 3335
x2 1.414425
xn 54.93959751
xn1 58.73290025
n8
minX 320
Q1 375
the sum of the x-values
the sum of the squares of the x-values
the population standard deviation
the sample standard deviation
the number of data values
the minimum of the list
the first quartile
Med 425
the median
Q3 467.5
the third quartile
x–xn
data mean population standard deviation
xxn
data mean population standard deviation
maxX 480
Mod
12
the mean
the maximum of the list
the mode of the list
Discovering Algebra Calculator Notes for the Casio fx-9750G Plus and CFX-9850GC Plus
©2007 Key Curriculum Press
DA2_FX9850GB_01.qxd 12/30/05 09:58 AM Page 13
fx-9750G Plus and CFX-9850GC Plus
Note 1D • Box Plots
Entering the Data
Enter the data set into a list. In this example, List 1 is
{400, 455, 390, 450, 360, 320, 480, 480}. (See Note 1B if you need help
entering data.)
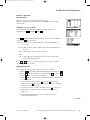
Setting the VIEW WINDOW Values
Select STAT from the Main Menu. While the statistical data list is
displayed, press SHIFT [SET UP] F2 (Man) EXIT .
Press SHIFT [V-Window] and input the following values on the View Window
screen. Press EXE after each entry.
Xmin: 300
max: 500
scale: 1
(This value is a number slightly less than the minimum of
the data.)
(This value is a number slightly greater than the maximum of
the data.)
(This number does not affect a box plot.)
Ymin: 0
max: 10
(This number is not important for a box plot. Any number
greater than Ymin will work.)
Press EXIT or EXE when you are done entering values. The view window
shown is [300, 500, 1, 0, 10, 0].
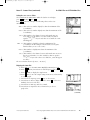
Displaying the Box Plot
This example uses the data in List 1, but you can choose any list.
a. Press MENU to display the Main Menu. Highlight STAT and press EXE .
b. Press SHIFT [SET UP]. Arrow down to Grid and press F2 (Off). Press EXE .
c. Press F1 (GRPH) to display the graph menu.
d. Press F6 (SET) to enter the graph settings menu. Press a function key
to select a graph.
e. Arrow down to Graph Type. Press F6 (¤). Press F2 (Box) to select
MedBox. (Pressing F3 (Box) also gives a box plot; but it is a MeanBox,
which is not used in this course.)
f. Arrow down to XList to display list choices. Press F1 to select List 1.
g. Arrow down to Graph Color. Press a function key to select the
graph color.
h. Arrow down to Outliers and select On or Off by pressing the
corresponding function key.
(continued)
©2007 Key Curriculum Press
Discovering Algebra Calculator Notes for the Casio fx-9750G Plus and CFX-9850GC Plus
13
DA2_FX9850GB_01.qxd 12/30/05 09:58 AM Page 14
Note 1D • Box Plots (continued)
fx-9750G Plus and CFX-9850GC Plus
i. Press EXIT to return to the Graph screen. Press F4 (SEL). Use the
down arrow and F1 or F2 to turn on the graph you selected and to
turn off the other graphs. Press F6 (DRAW) to draw the graph. (You
can also graph from the Graph screen by pressing the function key
corresponding to the number of the graph that you want to display.)
Tracing on a Box Plot
Press SHIFT [Trace]. The trace option allows you to see the five summary values
for the box plot by pressing the left and right arrow keys. When you press the
up and down arrow keys, you move from one box plot to another. (See the
Graphing More Than One Box Plot section that follows.) Look in the upper-left
corner of the calculator screen to see which plot the calculator is tracing.
Graphing More Than One Box Plot
The calculator can graph up to three box plots at once. Follow the directions
for making a box plot and press F4 (SEL). Use the arrow keys and F1 or F2
to choose DrawOn or DrawOff for each graph. Be sure the list you select when
setting up each box plot is the same list in which you’ve entered the data.
Using a different color for each plot is an effective way to display them.
Errors
If you don’t see a graph and you selected Stat Wind:Manual, check Xmin and
Xmax to make sure that your data lies between those values. If the
minimum value is greater than the maximum value, the axis will be inverted.
If you get a Dim ERROR, you selected a blank list. If anything appears on
the graph other than the statistical graph you set, press SHIFT [Sketch] F1 (Cls).
Note 1E • Histograms
Entering the Data
Enter the data into a list. In this example, List 1 is
{400, 455, 390, 450, 360, 320, 480, 480}. (See Note 1B if you need help
entering the data.)
Setting the VIEW WINDOW Values
Select STAT from the Main Menu. While the data list is displayed, press
SHIFT [SET UP] F2 (Man) EXIT .
(continued)
14
Discovering Algebra Calculator Notes for the Casio fx-9750G Plus and CFX-9850GC Plus
©2007 Key Curriculum Press
DA2_FX9850GB_01.qxd 12/30/05 09:58 AM Page 15
Note 1E • Histograms (continued)
fx-9750G Plus and CFX-9850GC Plus
Press SHIFT [V-Window] and input the following values into the View
Window screen.
Xmin: 300
max: 500
scale: 10
Ymin: 0.5
(This value is a number slightly less than the minimum of
the data.)
(This value is a number slightly greater than the maximum of
the data.)
(This number sets the distance between the tick marks on the
horizontal axis. This number is not critical, but if it’s too small,
the tick marks will make the horizontal axis appear too thick.)
(Using a negative value allows you to see the horizontal axis. This
value should be about a quarter of a fifth of the Ymax value, but
the opposite sign.)
max: 2
(This value should be the height of the tallest bar. You might
have to revise this value when you look at the graph. Tracing on
the graph can help you determine the maximum bar height.)
scale: 0
(This value does not affect a histogram.)
Press EXIT or EXE when you are done entering values. The view window
shown is [300, 500, 10, 0.5, 2, 0].
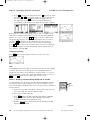
Displaying the Histogram
This example assumes the data is in List 1, but you can choose any list.
a.
b.
c.
d.
Press MENU to see the Main Menu. Highlight STAT and press EXE .
Press SHIFT [SET UP]. Arrow down to Grid and press F2 (Off). Press EXE .
Press F1 (GRPH) to display the Graph menu.
Press F6 (SET) to enter the Graph settings menu. Press a function key
to select a graph.
e. Arrow down to Graph Type. Press F6 (¤) to display the 1-variable
graph types. Press F1 (Hist) to select Hist.
(continued)
©2007 Key Curriculum Press
Discovering Algebra Calculator Notes for the Casio fx-9750G Plus and CFX-9850GC Plus
15
DA2_FX9850GB_01.qxd 12/30/05 09:58 AM Page 16
Note 1E • Histograms (continued)
fx-9750G Plus and CFX-9850GC Plus
f. Arrow down to XList to display list choices. Press F1 to select List 1.
g. Arrow down to Graph Color. Press a function key to select the
graph color.
h. Press EXIT to return to the Graph menu. Press F4 (SEL). Use the down
arrow and F1 or F2 to turn on the graph you selected and to turn
off the other graphs. Press F6 (DRAW). (You can also graph from the
Graph screen by pressing the function key corresponding to the
number of the graph that you want to display.) The Set Interval
menu will appear with the values of Start and Pitch automatically set.
You may change both values. Start is the minimum x-value shown on
the graph, and Pitch changes the width of the bars on the graph. A
smaller pitch value results in narrower bars. Press EXE to accept the
new values (if any) and F6 (DRAW) to draw the graph.
Tracing on a Histogram
Press
SHIFT [Trace].
Use the left and right arrow keys to move the cursor.
Errors
You will get a Ma ERROR message if you attempt to make a histogram
with too many intervals (bars). Increase the pitch to correct this error. If
anything appears on the screen other than the statistical graph you set,
press SHIFT [Sketch] F1 (Cls).
Note 1F • Scatter Plots
Entering the Data
Enter the x-coordinates (horizontal axis) into one list and the
y-coordinates (vertical axis) into another list. List 1 and List 2 are used for
this example. (See Note 1B if you need help entering the data.) Note: The
data can also be entered while in the Stat screen. Any changes made to lists
while in STAT mode show up in the same lists in LIST mode and vice versa.
In this example, {27, 10, 18, 5, 47, 36, 8} is entered into List 1 and
{20, 2, 22, 3, 45, 28, 15} is entered into List 2.
(continued)
16
Discovering Algebra Calculator Notes for the Casio fx-9750G Plus and CFX-9850GC Plus
©2007 Key Curriculum Press
DA2_FX9850GB_01.qxd 12/30/05 09:58 AM Page 17
Note 1F • Scatter Plots (continued)
fx-9750G Plus and CFX-9850GC Plus
Setting the VIEW WINDOW Values
Select STAT from the Main Menu. While the data list is on display,
press SHIFT [SET UP] F2 (Man) EXIT .
Press SHIFT [V-Window] and input the following values on the view
window screen.
Xmin: 0
(This value is a number slightly less than the minimum of the
x-coordinates.)
max: 50
(This value is a number slightly more than the maximum of the
x-coordinates.)
scale: 5
Ymin: 10
max: 50
scale: 5
(This number is the distance between tick marks. You can
use 0, that is, no tick marks, or a value usually less than or
Xmax Xmin
. If your scale value is too small, the x-axis
equal to 10
will disappear.)
(This number is slightly less than the minimum of the
y-coordinates. In this example, 0 would work, but a negative
number allows you to see the x-axis.)
(This number is slightly more than the maximum of the
y-coordinates.)
(This number is the distance between tick marks. You can use 0,
that is, no tick marks, or a value usually less than or equal to
Ymax Ymin
. If your scale value is too small, the y-axis will appear
10
too thick.)
The view window shown is [0, 50, 5, 10, 50, 5].
Displaying the Scatter Plot
a.
b.
c.
d.
Press MENU to see the Main Menu. Highlight STAT and press EXE .
Press SHIFT [SET UP]. Arrow down to Grid and press F2 (Off). Press EXE .
Press F1 (GRPH) to display the Graph menu.
Press F6 (SET) to enter the Graph settings menu. Press a function key
to select a graph.
e. Arrow down to Graph Type. Press F1 (Scat) to select Scatter.
f. Arrow down to XList to display list choices. Press F1 to select List 1.
Similarly, choose List 2 for YList.
g. Arrow down to Mark Type and select a mark.
h. Arrow down to Graph Color. Press a function key to select a
graph color.
(continued)
©2007 Key Curriculum Press
Discovering Algebra Calculator Notes for the Casio fx-9750G Plus and CFX-9850GC Plus
17
DA2_FX9850GB_01.qxd 12/30/05 09:58 AM Page 18
Note 1F • Scatter Plots (continued)
fx-9750G Plus and CFX-9850GC Plus
i. Press EXIT to return to the Graph screen. Press F4 (SEL). Use the down
arrow and F1 or F2 to turn on the graph you selected and to turn
off the other graphs. Press F6 (DRAW) to draw the graph. (You can
also graph from the Graph screen by pressing the function key
corresponding to the number of the graph that you want
to display.)
Tracing on a Scatter Plot
Press SHIFT [Trace]. Use the left and right arrow keys to move
the cursor.
Graphing More Than One Scatter Plot at a Time
The calculator can graph up to three scatter plots at the same time. Follow
the directions for making a scatter plot and press F4 (SEL). Use the arrow
keys and F1 or F2 to choose DrawOn or DrawOff for each graph. Be sure the
list you select when setting up each scatter plot is the same list in which
you’ve entered the data. Choose a different mark and color for each plot.
Errors
A Dim ERROR message means that the two lists do not have the same number
of entries. The same error message could appear if you accidentally turned
on a graph you are not using or if you named the wrong list. To clear extra
graphs from the screen, press SHIFT [Sketch] F1 (Cls).
Note 1G • POINTS Program
Link or manually enter the POINTS program into your calculator. (See
Note 0F or Note 0G.) The POINTS program plots a single point in a
graphing window that measures from 5.5 to 5.5 on the horizontal axis and
from 3.5 to 3.5 on the vertical axis. You identify and enter the coordinates
of the point rounded to the nearest 0.5 unit.
a. To execute the program, select PRGM from the Main Menu and
press EXE . Arrow to POINTS and press EXE . Press EXE again to start
the program.
b. Study the screen and determine the coordinates of the marked point,
then press EXE .
c. Enter the x-coordinate and press EXE . You will see the graph screen
again. Press EXE , enter the y-coordinate, and press EXE .
d. If you enter the wrong coordinates, the calculator will ask you to try
again. Look at the graph and repeat steps b and c.
e. If you enter the wrong coordinates a second time, the calculator will
display the correct answer.
(continued)
18
Discovering Algebra Calculator Notes for the Casio fx-9750G Plus and CFX-9850GC Plus
©2007 Key Curriculum Press
DA2_FX9850GB_01.qxd 12/30/05 09:58 AM Page 19
Note 1G • POINTS Program (continued)
fx-9750G Plus and CFX-9850GC Plus
File Name:POINTS
DrawStat
0áN
For ù3áA To 3
"
For ù2áB To 2
POINTS"
"ALWAYS PRESS EXE"
PlotOn A,B
"TO GO ON."ª
Next
ClrText
Nextª
"LOOK AT THE POINT ON"
ClrText
"THE GRAPH."ª
"(A,B) IS THE POINT."
ClrText
"WHAT IS A"?áC
"DETERMINE ITS"
"WHAT IS B"?áD
"COORDINATES."ª
If C=List 1[1]
Int (Ran#£1000)áS
Then If D=List 2[1]
Int (Ran#£1000)áT
Then "GOODÉ"
If S§2=Int (S§2)
Goto 2
Then ù1áS
IfEnd
Else 1áS
IfEnd
IfEnd
If N=0
If T§2=Int (T§2)
Then N+1áN
Then ù1áT
ClrText
Else 1áT
"LOOK AGAIN"ª
IfEnd
Goto 1
{S£(Int ((Ran#£10+1)§3)}áList 1
Else ClrText
{T£(Int ((Ran#£10+1)§4)}áList 2
"NO. PRESS EXE TO SEE"
Lbl 1
"THE ANSWER."ª
S-WindMan
Plot List 1[1],List 2[1]
ViewWindow ù3.9,3.9,1,ù2.3,2.3,1
Lbl 2
S-Gph1 DrawOn,Scatter,List 1,
List 2,1,Square
Note 1H • Connecting the Points
The xyLine connects a sequence of points with line segments. The order in
which the points are connected is the order in which the coordinates appear
in the lists.
Enter the data and set the window as described in Note 1F.
Displaying the Connected Points
a.
b.
c.
d.
Press MENU to see the Main Menu. Highlight STAT and press EXE .
Press SHIFT [SET UP]. Arrow down to Grid and press F2 (Off). Press EXE .
Press F1 (GRPH) to display the Graph menu.
Press F6 (SET) to enter the Graph settings menu. Press a function key
to select a graph.
e. Arrow down to Graph Type. Press F2 (xy) to select xyLine.
f. Arrow down to XList to display list choices. Press F1 to select List 1.
Similarly, choose List 2 for YList.
g. Arrow down to Mark Type and select a mark.
h. Arrow down to Graph Color. Press a function key to select the
graph color.
(continued)
©2007 Key Curriculum Press
Discovering Algebra Calculator Notes for the Casio fx-9750G Plus and CFX-9850GC Plus
19
DA2_FX9850GB_01.qxd 12/30/05 09:58 AM Page 20
Note 1H • Connecting the Points (continued)
fx-9750G Plus and CFX-9850GC Plus
i. Press EXIT to return to the Graph menu. Press F4 (SEL). Use the down
arrow and F1 or F2 to turn on the graph you selected and turn off
the other graphs. Press F6 (DRAW) to draw the graph. (You can
also graph from the Graph screen by pressing the function key
corresponding to the number of the graph that you want to display.)
If the points are not listed in ascending order by their x-coordinates, your
xyLine will be scrambled, with segments crisscrossing each other. While the
data lists are on the screen, press F6 F1 (SRT-A) to sort in ascending order.
The prompt How many lists? will appear to ask how many lists you want to
sort. Press 2 EXE to indicate two lists. Respond to the next prompt by
pressing 1 EXE to select List 1 as the base list, and after the last prompt,
press 2 EXE to select List 2 as the second list. Notice that the sort command
puts List 1 in ascending order but maintains the original pairings between
List 1 and List 2. (See Note 10B.)
Tracing Connected Points
Press
SHIFT [Trace].
Use the right and left arrows to move the cursor.
Errors
A Dim ERROR message means that the two lists do not have the same number
of entries. The same error would appear if you accidentally turned on a
graph you’re not using or if you named the wrong list when you set up the
graph. If anything appears on the graph other than the graph you set, press
SHIFT [Sketch] F1 (Cls) to clear the extra graphs from the screen.
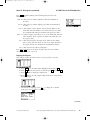
Note 1I • Reading a Distance Using the EA-100 or EA-200
To read a distance, you will need a Casio EA-100 or EA-200 Data Analyzer,
an Ultrasonic Motion Sensor (distance probe), and a meterstick or meter
tape. Your EA-100 or EA-200 does not need to be connected to a calculator to
measure distance.
a. Connect your EA-100 or EA-200 to a distance probe from the sonic
port on the right side of the EA-100 or EA-200.
b. Turn on the EA-100 or EA-200.
c. Press MODE until the EA-100 or EA-200 begins flashing SAMPLING
and DONE alternately. Your EA-100 or EA-200 is now ready to
measure and display in the multimeter mode.
d. Push the CH-View button several times until the EA-100 or EA-200
display indicates SONIC M.
To distance
probe
(continued)
20
Discovering Algebra Calculator Notes for the Casio fx-9750G Plus and CFX-9850GC Plus
©2007 Key Curriculum Press
DA2_FX9850GB_01.qxd 12/30/05 09:58 AM Page 21
Note 1I • Reading a Distance Using . . . (continued)
fx-9750G Plus and CFX-9850GC Plus
You should see the distance probe’s blinking red light and hear it clicking as
it samples measurements (in meters) to the nearest object in front of it. As
you point the distance probe at various objects, your EA-100 will display the
distances to the nearest object in meters. Shown on the previous page is a
reading of an object that is 3.14 meters from the probe.
e. Use your meterstick (tape) and hold the distance probe so that the
front of the probe is exactly 1 meter from the wall, and then take a
reading. Determine whether the distance is measured to the front,
middle, or back of the probe. This knowledge is important for
accurate length measurements. You will need to repeat this step if
you change equipment because not all devices work the same.
Errors
If you do not get a reading, check to make sure the distance probe is
plugged into the port marked SONIC and that the link cable is
securely connected.
Note 1J • Equations
To graph an equation on your calculator, the equation must be in the form
y “some expression.” If the equation contains variables other than x and y,
you need to rewrite it using only x and y as variables.
a. From the Main Menu, select GRAPH.
b. Enter the equation using the variable x. Press ,, to enter the
variable x. Press EXE .
c. Setting a window for graphing equations is not as easy as setting a
window for data. If it is an application problem, think about what
values make sense for both x and y. You may need to try different
windows to find one that is appropriate. The following graph has a
view window of [10, 10, 1, 10, 10, 1]. Press EXIT to return to the
Graph Func screen.
d. Press F6 (DRAW).
e. If you want the axes labeled, as in the previous screen,
press SHIFT [SET UP], scroll down to Label, and press F1 (On).
Press EXIT to return to the graph.
(continued)
©2007 Key Curriculum Press
Discovering Algebra Calculator Notes for the Casio fx-9750G Plus and CFX-9850GC Plus
21
DA2_FX9850GB_01.qxd 12/30/05 09:58 AM Page 22
Note 1J • Equations (continued)
fx-9750G Plus and CFX-9850GC Plus
Tracing Equations and Plots on the Same Graph
In STAT mode, enter the data and draw a scatter plot. Store the scatter
plot in one of the six picture memories. To store in Pic1, press
OPTN F1 (PICT) F1 (STO) F1 (Pic1). In GRAPH mode, enter the equation,
set the view window, and graph the equation. Remember, your
view window must accommodate both the data and the equation.
Press OPTN F1 (PICT) F2 (RCL) F1 (Pic1) to recall a graph stored in Pic1.
You will see the scatter plot and the equation(s) graphed on the same
screen. To trace the equation, press SHIFT [Trace]. Note the label in the
upper-left corner of the screen. When you are tracing an equation, the
equation is displayed. To trace the scatter plot, store the equation graph in
picture memory, graph the scatter plot, and recall the equation graph. Trace
works on either the scatter plot or the equation, but not on both at the same
time. It works on whichever you graph first.
Errors
If you see a Syn ERROR message, check your equation and count the number
of left and right parentheses to make sure they match. Look for numbers
with two decimal points. Check that you used the negative or subtraction
sign correctly. If you see the Graph screen but nothing appears, you might
have a problem with your equation or your view window settings.
Remember that your view window must accommodate both the equation
and the scatter plot. Try changing one or both of these.
Note 1K • Formula-Generated Lists
Enter the data into a list. (See Note 1B.) Move the cursor to another list,
arrow up to highlight the list name, and press EXE . Enter the formula for
the operations you want to perform. For example, if List 2 is defined as List 1
plus 47, highlight List 2, press OPTN , and then press F1 (LIST) F1 (List) 1 4
If you get an error message, press AC/ON . Make sure you have highlighted the
name of the list before you enter the list operation. You can perform
operations with list variables the same way you do with numbers. You can
add, subtract, multiply, divide, or do any other mathematical operation.
7 EXE
.
(continued)
22
Discovering Algebra Calculator Notes for the Casio fx-9750G Plus and CFX-9850GC Plus
©2007 Key Curriculum Press
DA2_FX9850GB_01.qxd 12/30/05 09:58 AM Page 23
Note 1K • Formula-Generated Lists (continued)
fx-9750G Plus and CFX-9850GC Plus
For another example, let List 1 be a list of rectangle lengths and let List 2 be a
list of the corresponding widths. Move the cursor so that it highlights List 3
and enter the formula for the area of a rectangle, List 1 List 2, by pressing
OPTN F1 (LIST) F1 (List) 1 F1 (List) 2 . Press EXE .
List Formulas
If you change the values in the list referred to in a formula, you must
reenter the formula to update the values in the new list. For example, let
List 1 be {2, 3, 4} and define the name of List 2 to be 3 List 1. Now, edit one
of the entries in List 1; for example, change the 3 to 5. To change the second
entry in List 2, you must reenter the formula for List 2.
Note 1L • Matrices
To enter MATRIX mode, arrow to MAT on the Main Menu and press EXE .
The MATRIX mode allows you to work with up to 26 matrices:
Mat A, Mat B, . . . , Mat Z. To define and store a matrix, Mat A, for example,
highlight Mat A on the Matrix screen. If a matrix is not defined, :None shows to
the right of its name. The dimensions of a matrix are given as rows by columns.
Enter the first dimension, the number of rows, and press EXE . Then, enter the
second dimension, the number of columns, and press EXE . Notice that after
you enter both dimensions, the matrix on the screen will be set at the
appropriate size. On this calculator, matrix dimensions are limited to 255 rows
or 255 columns.
Entering a Matrix
After entering the dimensions, the cursor will be at row 1, column 1. Enter
the value and press EXE . The cursor moves across the first row, then down to
the next row. Continue to enter values and to press EXE after each entry. You
can edit any entry by arrowing to the position and reentering the value.
(continued)
©2007 Key Curriculum Press
Discovering Algebra Calculator Notes for the Casio fx-9750G Plus and CFX-9850GC Plus
23
DA2_FX9850GB_01.qxd 12/30/05 09:58 AM Page 24
Note 1L • Matrices (continued)
fx-9750G Plus and CFX-9850GC Plus
After you enter all the values, press EXIT to store the matrix and to return to
the Matrix screen. Notice that the dimensions are listed beside Mat A. Any
matrix that shows dimensions on the Matrix screen is defined.
Displaying a Matrix
To display Matrix A, choose Mat A on the Matrix screen and press EXE . The
letter “A” appears in the upper-left corner of the screen and the complete
matrix is displayed. To return to the Matrix screen, press EXIT .
If you want a matrix to represent money, you can set the calculator so that
all numbers are rounded to two decimal places. To change the setting, press
SHIFT [SET UP] and highlight Display. Press F1 (Fix) and F3 to select two
decimal places. Press EXIT to return to the Matrix screen. As you use the
arrow keys to move around the matrix, the highlighted values will be
displayed to two decimal places at the bottom-right corner of the screen.
Changing or Deleting a Matrix from the Calculator
You can always change a matrix entry by arrowing to the matrix name on
the Matrix screen and pressing EXE , then arrowing to the entry you want
to change. If you reenter the dimensions, you will define a new matrix
replacing the one you had. You might, however, want to conserve memory
space and delete a matrix (or all matrices) from your calculator. To delete a
matrix, go to the Matrix screen and press F1 (DEL) F1 (YES). To delete all
matrices, press F2 (DEL-A) F1 (YES).
Errors
If you get a MEM ERROR message, it means there is not enough free memory
to create a matrix of the size that you chose.
A Dim ERROR message probably indicates that you named a matrix that is
not defined.
24
Discovering Algebra Calculator Notes for the Casio fx-9750G Plus and CFX-9850GC Plus
©2007 Key Curriculum Press
DA2_FX9850GB_01.qxd 12/30/05 09:58 AM Page 25
fx-9750G Plus and CFX-9850GC Plus
Note 1M • Multiplying a Matrix by a Number
To multiply a matrix by a number, multiply each cell value of the matrix by
the number. For example, to multiply Mat A (from Note 1L) by 50, select RUN
from the Main Menu. Then press 5 0 OPTN F2 (MAT) F1 (Mat) ALPHA [A] EXE .
The matrix answer appears on the screen.
Multiplying a number by a matrix, Mat A 50, for example, is done in the
same way. Press OPTN F2 (MAT) F1 (Mat) ALPHA [A] 5 0 EXE .
Errors
A Dim ERROR message probably indicates that you named a matrix that is
not defined.
Note 1N • Adding or Subtracting Matrices
To add or subtract two matrices, the matrices must have the
same dimensions.
Define Mat B to have dimensions 3 2, and enter the values below.
(See Note 1L.)
1, 1 8.9
1, 2 9.1
2, 1 2.35 2, 2 2.65
3, 1 1.5
3, 2 1.6
Define Mat C to have dimensions 3 2, and enter the values below.
1, 1 2.5 1, 2 2.25
2, 1 1
2, 2 1.25
3, 1 .65 3, 2 .5
(continued)
©2007 Key Curriculum Press
Discovering Algebra Calculator Notes for the Casio fx-9750G Plus and CFX-9850GC Plus
25
DA2_FX9850GB_01.qxd 12/30/05 09:58 AM Page 26
Note 1N • Adding or Subtracting Matrices (continued)
fx-9750G Plus and CFX-9850GC Plus
Go to the Run screen from the Main Menu.
Press OPTN F2 (MAT) F1 (Mat) ALPHA [B] F1 (Mat) ALPHA [C] EXE . The
matrix showing on the screen is the sum of Matrix B and Matrix C.
Errors
If you get a Dim ERROR message, you’ve tried to add (or subtract) two
matrices that don’t have the same dimensions or you have named a matrix
that is not defined.
Note 1P • Multiplying Two Matrices
To multiply two matrices, the number of columns in the first matrix must
match the number of rows in the second. For example, if the first matrix has
dimensions 1 3 and the second matrix has dimensions 3 2, the three
columns of the first matrix will match the three rows of the second. The
multiplication will be defined.
Enter Mat D and Mat C as shown in the screens below. (See Note 1L.)
Display Mat D Mat C on the Run screen using the following keystrokes:
OPTN F2 (MAT) F1 (Mat) ALPHA [D] F1 (Mat) ALPHA [C]. Press EXE and the
product will appear on the screen. The dimensions of the product are (the
number of rows of the first matrix) (the number of columns of the second
matrix). In this example, a 1 3 matrix times a 3 2 matrix has a
1 2 answer.
Errors
If you get an ERR:DIM MISMATCH message, the number of columns in the
first matrix does not match the number of rows in the second.
An ERR:UNDEFINED message probably indicates that you named a matrix that
is not defined.
26
Discovering Algebra Calculator Notes for the Casio fx-9750G Plus and CFX-9850GC Plus
©2007 Key Curriculum Press