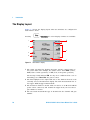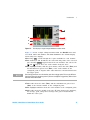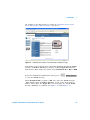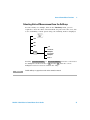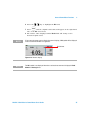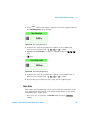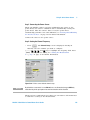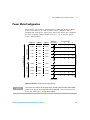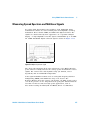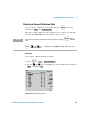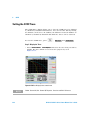
1
Agilent
N1911A/1912A
P-Series Power
Meters
User’s Guide
Agilent Technologies
Notices
© Agilent Technologies, Inc. 2006–2014
Warranty
No part of this manual may be reproduced in
any form or by any means (including electronic storage and retrieval or translation
into a foreign language) without prior agreement and written consent from Agilent
Technologies, Inc. as governed by United
States and international copyright laws.
The material contained in this document is provided “as is,” and is subject to being changed, without notice,
in future editions. Further, to the maximum extent permitted by applicable
law, Agilent disclaims all warranties,
either express or implied, with regard
to this manual and any information
contained herein, including but not
limited to the implied warranties of
merchantability and fitness for a particular purpose. Agilent shall not be
liable for errors or for incidental or
consequential damages in connection with the furnishing, use, or performance of this document or of any
information contained herein. Should
Agilent and the user have a separate
written agreement with warranty
terms covering the material in this
document that conflict with these
terms, the warranty terms in the separate agreement shall control.
Manual Part Number
N1912-90002
Edition
Twelfth Edition, April 4, 2014
Printed in Malaysia
Agilent Technologies, Inc.
3501 Stevens Creek Blvd.
Santa Clara, CA 95052 USA
Safety Notices
Technology Licenses
The hardware and/or software described in
this document are furnished under a license
and may be used or copied only in accordance with the terms of such license.
Restricted Rights Legend
U.S. Government Restricted Rights. Software and technical data rights granted to
the federal government include only those
rights customarily provided to end user customers. Agilent provides this customary
commercial license in Software and technical data pursuant to FAR 12.211 (Technical
Data) and 12.212 (Computer Software) and,
for the Department of Defense, DFARS
252.227-7015 (Technical Data - Commercial
Items) and DFARS 227.7202-3 (Rights in
Commercial Computer Software or Computer Software Documentation).
ii
CAUTION
A CAUTION notice denotes a hazard. It calls attention to an operating procedure, practice, or the like
that, if not correctly performed or
adhered to, could result in damage
to the product or loss of important
data. Do not proceed beyond a
CAUTION notice until the indicated
conditions are fully understood and
met.
WA R N I N G
A WARNING notice denotes a
hazard. It calls attention to an
operating procedure, practice, or
the like that, if not correctly performed or adhered to, could result
in personal injury or death. Do not
proceed beyond a WARNING
notice until the indicated conditions are fully understood and
met.
N1911/1912A P-Series Power Meters User’s Guide
Certification
Agilent Technologies certifies that this product met its published
specifications at the time of shipment. Agilent further certifies that its
calibration measurements are traceable to the United States National
Institute of Standard and Technology (formerly National Bureau of
Standards), to the extent allowed by that organization’s calibration facility,
and to the calibration facilities of other International Standards
Organization members.
General Warranty
The material contained in this document is provided “as is,” and is subject
to being changed, without notice, in future editions. Further, to the
maximum extent permitted by applicable law, Agilent disclaims all
warranties, either express or implied with regard to this manual and any
information contained herein, including but not limited to the implied
warranties of merchantability and fitness for a particular purpose. Agilent
shall not be liable for errors or for incidental or consequential damages in
connection with the furnishing, use, or performance of this document or
any information contained herein. Should Agilent and the user have a
separate written agreement with warranty terms covering the material in
this document that conflict with these terms, the warranty terms in the
separate agreement shall control. Duration and conditions of warranty for
this product may be superseded when the product is integrated into
(becomes a part of) other Agilent products. During the warranty period,
Agilent will, at its option, either repair or replace products which prove to
be defective. The warranty period begins on the date of delivery or on the
date of installation if installed by Agilent.
Warranty Service
For warranty service or repair, this product must be returned to a service
facility designated by Agilent. For products returned to Agilent for
warranty service, the Buyer shall prepay shipping charges to Agilent and
Agilent shall pay shipping charges to return the product to the Buyer.
However, the Buyer shall pay all shipping charges, duties, and taxes for
products returned to Agilent from another country.
N1911/1912A P-Series Power Meters User’s Guide
iii
Limitation of Warranty
The foregoing warranty shall not apply to defects resulting from improper
or inadequate maintenance by the Buyer, Buyer-supplied products or
interfacing, unauthorized modification or misuse, operation outside of the
environmental specifications for the product, or improper site preparation
or maintenance.
The design and implementation of any circuit on this product is the sole
responsibility of the Buyer. Agilent does not warrant the Buyer’s circuitry
or malfunctions of Agilent products that result from the Buyer’s circuitry.
In addition, Agilent does not warrant any damage that occurs as a result of
the Buyer’s circuit or any defects that result from Buyer-supplied products.
To the extent allowed by local law, Agilent makes no other warranty,
expressed or implied, whether written or oral with respect to this product
and specifically disclaims any implied warranty or condition of
merchantability, fitness for a particular purpose or satisfactory quality.
Exclusive Remedies
To the extent allowed by local law, the remedies provided herein are the
Buyer’s sole and exclusive remedies. Agilent shall not be liable for any
direct, indirect, special, incidental, or consequential damages (including
lost profit or data), whether based on warranty, contract, tort, or any other
legal theory.
iv
N1911/1912A P-Series Power Meters User’s Guide
Restricted Rights Legend
The Software and Documentation have been developed entirely at private
expense. They are delivered and licensed as “commercial computer
software” as defined in DFARS 252.227-7013 (Oct 1988), DFARS
252.211-7015 (May 1991), or DFARS 252.227-7014 (Jun 1995), as a
“commercial item” as defined in FAR 2.101(a), or as “restricted computer
software” as defined in FAR 52.227-19 (Jun 1987) (or any equivalent
agency regulation or contract clause), whichever is applicable. You have
only those rights provided for such Software and Documentation by the
applicable FAR or DFARS clause or the Agilent standard software
agreement for the product involved.
Technology Licenses
The hardware and/or software described in this document are furnished
under a license and may be used or copied only in accordance with the
terms of such license.
N1911/1912A P-Series Power Meters User’s Guide
v
Safety Summary
The following general safety precautions must be observed during all
phases of operation of this instrument. Failure to comply with these
precautions or with specific warnings elsewhere in this manual violates
safety standards of design, manufacture, and intended use of the
instrument. Agilent Technologies, Inc. assumes no liability for the
customer’s failure to comply with these requirements.
Safety Notices
WA R N I N G
A WARNING notice denotes a hazard. It calls attention to an operating
procedure, practice, or the like that, if not correctly performed or
adhered to, could result in personal injury or loss of life. Do not proceed
beyond a WARNING notice until the indicated conditions are fully
understood and met.
CAUTION
A CAUTION notice denotes a hazard. It calls attention to an operating
procedure, practice, or the like that, if not correctly performed or adhered
to, could result in damage to the product or loss of important data. Do not
proceed beyond a CAUTION notice until the indicated conditions are fully
understood and met.
Recommended Calibration Interval
Agilent Technologies recommends a two- years calibration cycle for the
N1911A and N1912A P-Series power meter.
vi
N1911/1912A P-Series Power Meters User’s Guide
Safety Symbols
The following symbol on the instrument and in the documentation
indicates precautions that must be taken to maintain safe operation of the
instrument.
Caution, risk of danger.
The Instruction Documentation Symbol. The product is marked with this symbol
when it is necessary for the user to refer to the instructions in the supplied documentation.
Alternating current (AC).
This symbol indicates the operating switch for ‘Stand-by’ mode. Note, the instrument is NOT isolated from the mains when the switch is pressed.
To isolate the instrument, the mains coupler (mains input cord) should be
removed from the power supply.
Direct current (DC).
Both direct and alternating current.
Three-phase alternating current.
Earth (ground) TERMINAL.
N1911/1912A P-Series Power Meters User’s Guide
vii
PROTECTIVE CONDUCTOR TERMINAL.
Frame or chasis TERMINAL.
Equipotentiality.
On (Supply).
Off (Supply).
Equipment protected throughout by DOUBLE INSULATION or
REINFORCED INSULATION.
Caution, risk of electric shock.
Caution, hot surface.
In position of bi-stable push control.
viii
N1911/1912A P-Series Power Meters User’s Guide
Out position of bi-stable push control.
N1911/1912A P-Series Power Meters User’s Guide
ix
General Safety Information
This is a Safety Class I instrument (provided with a protective earthing
ground, incorporated in the power cord). The mains plug shall only be
inserted in a socket outlet provided with a protective earth contact. Any
interruption of the protective conductor inside or outside of the instrument
is likely to make the instrument dangerous. Intentional interruption is
prohibited.
WA R N I N G
•
•
•
•
•
•
x
DO NOT operate the product in an explosive atmosphere or in the
presence of flammable gasses or fumes.
DO NOT use repaired fuses or short-circuited fuseholders: For
continued protection against fire, replace the line fuse(s) only with
fuse(s) of the same voltage and current rating and type.
DO NOT perform procedures involving cover or shield removal
unless you are qualified to do so: Operating personnel must not
remove equipment covers or shields. Procedures involving the
removal of covers and shields are for use by service-trained
personnel only.
DO NOT service or adjust alone: Under certain conditions, dangerous
voltages may exist even with the equipment switched off. To avoid
dangerous electrical shock, service personnel must not attempt
internal service or adjustment unless another person, capable of
rendering first aid and resuscitation, is present.
DO NOT operate damaged equipment: Whenever it is possible that
the safety protection features built into this product have been
impaired, either through physical damage, excessive moisture, or
any other reason, REMOVE POWER and do not use the product until
safe operation can be verified by service-trained personnel. If
necessary, return the product to a Agilent Technologies Sales and
Service Office for service and repair to ensure the safety features are
maintained.
DO NOT substitute parts or modify equipment: Because of the danger
of introducing additional hazards, do not install substitute parts or
perform any unauthorized modification to the product. Return the
product to a Agilent Technologies Sales and Service Office for
service and repair to ensure the safety features are maintained.
N1911/1912A P-Series Power Meters User’s Guide
Environmental Conditions
This instrument is designed for indoor use. The table below shows the
general environmental requirements for this instrument.
Environmental condition
Requirement
Temperature
Operating condition
• 0 °C to 55 °C
Storage condition
• –40 °C to 70 °C
Humidity
Operating condition
• Up to 95% RH at 40 °C (non-condensing)
Storage condition
• Up to 90% RH at 65 °C (non-condensing)
Altitude
Up to 3000 m
Pollution degree
2
Regulatory Information
The N1911/1912A P-Series power meters comply with the following
safety and Electromagnetic Compatibility (EMC) compliances:
Safety compliance
•
IEC 61010-1:2010/EN 61010-1:2010 (3rd Edition)
•
Canada: CAN/CSA-C22.2 No. 61010-1-12
•
USA: ANSI/UL 61010-1 (3rd Edition)
EMC compliance
•
IEC 61326-1:2005/EN 61326-1:2006
•
CISPR11:2003/EN 55011:2007, Group 1 Class A
•
Canada: ICES/NMB-001:Issue 4, June 2006
•
Australia/New Zealand: AS/NZS CISPR 11:2004
N1911/1912A P-Series Power Meters User’s Guide
xi
Regulatory Markings
xii
The CE mark is a registered trademark
of the European Community. This CE
mark shows that the product complies
with all the relevant European Legal
Directives.
The C-tick mark is a registered
trademark of the Spectrum
Management Agency of Australia. This
signifies compliance with
the Australia EMC Framework
regulations under the terms of the
Radio Communication Act of 1992.
ICES/NMB-001 indicates that this ISM
device complies with the Canadian
ICES-001.
Cet appareil ISM est confomre a la
norme NMB-001 du Canada.
This instrument complies with the
WEEE Directive (2002/96/EC) marking
requirement. This affixed product label
indicates that you must not discard
this electrical or electronic product in
domestic household waste.
The CSA mark is a registered
trademark of the Canadian Standards
Association.
This symbol indicates the time period
during which no hazardous or toxic
substance elements are expected to
leak or deteriorate during normal use.
Forty years is the expected useful life
of the product.
N1911/1912A P-Series Power Meters User’s Guide
Declaration of Conformity (DoC)
The Declaration of Conformity (DoC) for this instrument is available on the
Agilent Web site. You can search the DoC by its product model or
description at the Web address below.
http://regulations.corporate.agilent.com/DoC/search.htm
NOTE
If you are unable to search for the respective DoC, please contact your
local Agilent representative.
N1911/1912A P-Series Power Meters User’s Guide
xiii
In This Guide ...
1
Introduction Chapter 1 introduces you to the front panel display and
instrument Web browser of the P-Series power meter.
2
General Power Meter Functions Chapter 2 describes the general
operation of the P-Series power meter.
3
Using P-Series Power Sensor Chapter 3 describes how to use your
P-Series power sensor with your P-Series power meter.
4
Using E9320 E-Series Power Sensors Chapter 4 describes how to use
your E9320 E-Series power sensor with your P-Series power meter.
5
Using E9300 E-Series Power Sensors Chapter 5 describes how to use
your E9300 E-Series power sensor with your P-Series power meter.
6
Using E4410 E-Series Power Sensors Chapter 6 describes how to use
your E4410 E-Series power sensor with your P-Series power meter.
7
Using 8480 Series Power Sensors Chapter 7 describes how to use
your 8480 Series power sensor with your P-Series power meter.
8
Using N8480 Series Power Sensors Chapter 8 describes how to use
your N8480 Series power sensorwith your P-Series power meter.
9
Complementary Cumulative Distribution Function (CCDF) Chapter
9 describes the CCDF feature of the P-Series power meter.
10
Maintenance Chapter 10 describes the built in tests, error messages and
general maintenance.
11
xiv
Specifications and Characteristics Chapter 11 describes the
specifications and characteristics of your P-Series power meter.
N1911/1912A P-Series Power Meters User’s Guide
Contents
Notices ii
Certification iii
General Warranty iii
Warranty Service iii
Limitation of Warranty iv
Exclusive Remedies iv
Restricted Rights Legend v
Technology Licenses v
Safety Summary vi
Safety Notices vi
Recommended Calibration Interval vi
Safety Symbols vii
General Safety Information x
Environmental Conditions xi
Regulatory Information xi
Regulatory Markings xii
Declaration of Conformity (DoC) xiii
In This Guide ... xiv
1 Introduction
LXI Class-C Compliant Power Meter 2
Rack Mounting 2
Power Meter and Sensor Capability 3
Conventions Used in this Guide 4
Front Panel Keys and Connections 5
The Display Layout 10
Window Symbols and Pop-ups 18
Using the Instrument Web Browser 22
2 General Power Meter Functions
Setting the Units of Measurement 30
Setting the Measurement Frequency 32
Setting the Resolution 33
N19121A/1912A P-Series Power Meters User’s Guide
xv
Making Relative Measurements 34
Setting the Pulse Reference Levels 36
Setting Offsets 39
Setting Measurement Averaging 49
Step Detection 51
Setting the Video Averaging 52
Setting the Video Bandwidth 54
Setting Measurement Channel Gates 57
Setting up the Channel Trace 62
Setting the Trigger 66
Setting External Trigger for Normal and Average Power Measurement 72
Setting Measurement Limits 86
Setting the Measurement Display 90
Scaling the Analog Display 97
Recorder Output 99
Saving and Recalling Power Meter States 104
Zeroing and Calibrating the P-Series Sensor 107
Presetting the Power Meter 111
3 Using P-Series Power Sensor
Introduction 116
Configuring a Power Measurement 117
Setting the Trace Display 118
4 Using E9320 E-Series Power Sensors
Introduction 132
Power Meter Configuration 134
Configuring a Peak Power Measurement 135
Measurement Accuracy 136
Setting the Trace Display 138
5 Using E9300 E-Series Power Sensors
Introduction 152
Power Meter Configuration 153
Measurement Accuracy 155
xvi
N19121A/1912A P-Series Power Meters User’s Guide
Measuring Spread Spectrum and Multitone Signals 157
Measuring TDMA Signals 160
Electromagnetic Compatibility (EMC) Measurements 162
Measurement Accuracy and Speed 163
6 Using E4410 E-Series Power Sensors
Introduction 168
Power Meter Configuration 169
Measurement Accuracy 171
7 Using 8480 Series Power Sensors
Introduction 174
Power Meter Configuration 175
Measurement Accuracy 179
Frequency Specific Calibration Factors 180
Sensor Calibration Tables 184
8 Using N8480 Series Power Sensors
Introduction 196
Power Meter Configuration Changes 198
Default Channel Setup 199
N8480 Series Sensors Connection Requirements 200
N8480 Series Power Sensors (excluding Option CFT) 201
N8480 Series Power Sensors with Option CFT 203
9 Complementary Cumulative Distribution Function (CCDF)
Introduction 218
Setting the CCDF Table 219
Setting the CCDF Trace 222
10 Maintenance
Self Test 228
Error Messages 232
Operator Maintenance 243
N19121A/1912A P-Series Power Meters User’s Guide
xvii
Contacting Agilent Technologies 245
Erasing Memory Data 248
Returning Your Power Meter for Service 249
Agilent Sales and Service Offices 251
11 Specifications and Characteristics
Introduction 254
Power Meter Specifications 256
Measurement Characteristics 259
Rear Panel Inputs and Output Connections 262
1 mW Power Reference 263
Environmental Conditions 264
Physical Characteristics 265
Regulatory Information 266
System Specifications and Characteristics 267
xviii
N19121A/1912A P-Series Power Meters User’s Guide
List of Figures
Figure 1-1 Dual numeric display 10
Figure 1-2 Single numeric and analog display 12
Figure 1-3 Full screen numeric display 13
Figure 1-4 Trace display in both windows 14
Figure 1-5 Trace display in single enlarged window in markers mode 15
Figure 1-6 Trace display in single enlarged window in trigger delay mode
Figure 1-7 Trace display in single enlarged window in trace control mode
Figure 1-8 Opening the instrument Web interface. 22
Figure 1-9 N1912A P-Series power meter Web browser (Welcome Page)
Figure 1-10 Status message before Toggle ID is selected. 24
Figure 1-11 Status message when Toggle ID is selected. 24
Figure 1-12 Example of Lan Status message. 25
Figure 1-13 Viewing LAN configuration settings from the Web interface.
Figure 1-14 Password security dialog box. 27
Figure 1-15 Changing the instrument LAN interface configuration 28
Figure 2-16 Frequency pop-up 32
Figure 2-17 Typical relative measurement display 34
Figure 2-18 Numeric display 35
Figure 2-19 Measurement configuration screen 36
Figure 2-20 Pulse duration measurement between two reference levels
Figure 2-21 Trace Ref Lvl 1 pop-up 37
Figure 2-22 Trace Ref Lvl 2 pop-up 38
Figure 2-23 Pulse Duration Ref Lvl pop-up 38
Figure 2-24 Simplified measurement path 39
Figure 2-25 Typical channel offset display 40
Figure 2-26 Channel offset indicator 41
Figure 2-27 Typical display offset display 42
Figure 2-28 Frequency dependent offset tables display 44
Figure 2-29 Frequency dependent offset indicator 45
Figure 2-30 “Edit Offset” display with data added 46
Figure 2-31 Edit table title pop-up 47
Figure 2-32 Typical averaged readings 49
Figure 2-33 Meas Avg Count pop-up 50
N19121A/1912A P-Series Power Meters User’s Guide
16
17
23
26
37
xix
Figure 2-34 Video Avg Count pop-up 53
Figure 2-35 Bandwidth filter shapes 55
Figure 2-36 Video bandwidth pop-up 56
Figure 2-37 Example of measurement gates 57
Figure 2-38 Gate Setup screen 58
Figure 2-39 Time Gating Start pop-up 59
Figure 2-40 Time Gating Length pop-up 59
Figure 2-41 Auto Gate Settings display 60
Figure 2-42 Marker 1 Ref Percentage pop-up 60
Figure 2-43 Marker 2 Ref Percentage pop-up 61
Figure 2-44 The placement of gates (markers) in Auto Gating mode 61
Figure 2-45 Trace setup display 62
Figure 2-46 Trace Start Time pop-up 63
Figure 2-47 X Scale/Division pop-up 63
Figure 2-48 Trace Units pop-up 64
Figure 2-49 Y scale maximum value pop-up 64
Figure 2-50 Y Scale/Division pop-up 65
Figure 2-51 Trigger menu - free run mode 66
Figure 2-52 Trigger Setting Menu 1 of 2 67
Figure 2-53 Trigger Level pop-up 68
Figure 2-54 Trigger Delay pop-up 69
Figure 2-55 Trigger setting menu 2 of 2 69
Figure 2-56 Trigger Holdoff pop-up 70
Figure 2-57 Trigger Hysteresis pop-up 71
Figure 2-58 TRIG IN and TRIG OUT connection diagram between power meter and
power source. 74
Figure 2-59 Channel Setup display 74
Figure 2-60 Sensor Mode pop-up. 75
Figure 2-61 Trigger setting menu 1 of 2 76
Figure 2-62 Trigger setting menu 2 of 2 76
Figure 2-63 Limits checking applications 86
Figure 2-64 Limits checking results 86
Figure 2-65 Minimum limit pop-up 88
Figure 2-66 Limit failures 89
Figure 2-67 Sixteen measurements per channel 90
xx
N19121A/1912A P-Series Power Meters User’s Guide
Figure 2-68 Measurement feed example 91
Figure 2-69 Measurement Setup showing single configuration 92
Figure 2-70 Function pop-up 93
Figure 2-71 Measurement type pop-up 93
Figure 2-72 Gating Number pop-up 94
Figure 2-73 Measurement Setup showing combined configuration 95
Figure 2-74 Measurement example display 96
Figure 2-75 Maximum limit pop-up 97
Figure 2-76 Minimum limit pop-up 97
Figure 2-77 Increment and decrement multiplier 98
Figure 2-78 Recorder Minimum pop-up 100
Figure 2-79 Recorder Maximum pop-up 100
Figure 2-80 Increment and decrement multiplier 102
Figure 2-83 Save/Recall screen 104
Figure 2-84 Save confirm pop-up 105
Figure 2-85 File name pop-up 105
Figure 2-86 Recall pop-up 106
Figure 2-87 Zeroing pop-up 107
Figure 2-88 Calibration wait pop-up 108
Figure 2-89 Please zero and calibrate window 110
Figure 2-90 Preset display options 111
Figure 3-92 P-Series sensor default channel setup 119
Figure 3-93 Trace display in dual channel power meter 120
Figure 3-94 Trace display in single enlarged window 121
Figure 3-95 Trace display with gate control menu 122
Figure 3-96 Trace display with trigger delay menu 123
Figure 3-97 Trace display with trace control menu 125
Figure 3-98 Trace display in full screen 126
Figure 3-99 P-Series power sensor default channel setup 127
Figure 3-100 Channel offset display 128
Figure 4-101 Bandwidth Filter Shapes 133
Figure 4-102 E–Series E9320 power sensor default channel setup 134
Figure 4-104 E-Series E9320 power sensor channel setup when trigger is selected 140
Figure 4-105 Trace display in dual channel power meter 140
Figure 4-106 Trace display in single enlarged window 141
N19121A/1912A P-Series Power Meters User’s Guide
xxi
Figure 4-107 Trace display with gate control menu 142
Figure 4-108 Trace display with trigger delay menu 143
Figure 4-109 Trace display with trace control menu 145
Figure 4-110 Trace display in full screen 146
Figure 4-111 E-Series E9320 power sensor dafault channel setup 147
Figure 4-112 Channel offset display 148
Figure 5-113 E9300 E-Series auto-averaging settings 153
Figure 5-114 E9300 E-Series sensor default channel setup 154
Figure 5-115 Frequency pop-up 156
Figure 5-116 Spread spectrum signal 157
Figure 5-117 Wideband CDMA error of E-Series E9300 power sensor versus corrected
CW sensor. 158
Figure 5-118 CDMA (IS-95A): 9Ch Fwd 158
Figure 5-119 Calibration factors versus frequency 159
Figure 6-120 E-Series CW sensor auto-averaging settings 169
Figure 6-121 E-Series E4410 sensor default channel setup 170
Figure 6-122 Frequency pop-up 172
Figure 7-123 8480 Series auto-averaging settings 175
Figure 7-124 8480 Series sensor default channel setup 176
Figure 7-125 Reference Calibration Factor pop-up window 181
Figure 7-126 Calibration factor pop-up window 182
Figure 7-127 Calibration factor display 182
Figure 7-128 Sensor table selected 185
Figure 7-129 Frequency dependent offset indicator 185
Figure 7-130 Frequency/calibration table display 186
Figure 7-131 “Sensor Tbls” screen 188
Figure 7-132 “Edit Cal” display 189
Figure 7-133 Edit table title pop-up 189
Figure 8-134 Auto-averaging settings 198
Figure 8-135 N8480 Series sensor (excluding Option CFT) default channel setup 199
Figure 8-137 Frequency pop-up 202
Figure 8-138 Reference calibration factor pop-up window 204
Figure 8-139 Calibration factor pop-up window 205
Figure 8-140 Calibration factor displayed 206
Figure 8-141 Sensor table selected 209
xxii
N19121A/1912A P-Series Power Meters User’s Guide
Figure 8-142 Frequency dependent offset indicator 210
Figure 8-143 Frequency/calibration table display 211
Figure 8-144 “Sensor Tbls” screen 213
Figure 8-145 “Edit Cal” display 214
Figure 8-146 Edit table title pop-up 214
Figure 9-147 CCDF table in windowed display 219
Figure 9-148 CCDF table in expanded display 220
Figure 9-149 CCDF table in full-screen display 221
Figure 9-150 Trace Display Select control menu 222
Figure 9-151 CCDF trace display with Marker Trace menu 223
Figure 9-152 Scale/Div pop-up 225
Figure 9-153 Selection of CCDF trace to be stored as a reference trace 226
Figure 10-154 Self test complete 229
Figure 10-155 Error indicator position 232
Figure 10-156 Replacing the fuse 244
Figure 10-157 Secure erase status pop-up 248
Figure 11-158 Measured rise time percentage error versus signal under test rise time 261
Figure 11-159 P-Series sensor error in peak-to-average measurements for a two-tone input
268
N19121A/1912A P-Series Power Meters User’s Guide
xxiii
THIS PAGE HAS BEEN INTENTIONALLY LEFT BLANK.
xxiv
N19121A/1912A P-Series Power Meters User’s Guide
List of Tables
Table 1-1 Type of Lan Status message. 25
Table 2-2 Measurement units - Single channel meters 30
Table 2-3 Measurement units - Dual channel meters 30
Table 2-4 P-Series Sensor Video Bandwidth Setting 54
Table 2-5 Power and frequency sweep mode compatibility table 72
Table 2-6 Power and frequency sweep measurement functions table 73
Table 2-7 Range of values for window limits 87
Table 2-8 Ranges of recorder output setting 101
Table 2-9 Preset compatibility matrix for E-Series E9320 power sensor 112
Table 4-10 Sensor Bandwidth 132
Table 5-11 Power sensor connection requirements 155
Table 7-12 8480 Series connection requirements 177
Table 7-13 Installed power sensor models 187
Table 8-14 Power range in the Range setting 196
Table 8-15 N8480 Series connection requirements 200
Table 8-16 Installed power sensor models 212
N19121A/1912A P-Series Power Meters User’s Guide
xxv
THIS PAGE HAS BEEN INTENTIONALLY LEFT BLANK.
xxvi
N19121A/1912A P-Series Power Meters User’s Guide
N1911A/1912A P-Series Power Meters
User’s Guide
1
Introduction
LXI Class-C Compliant Power Meter 2
Rack Mounting 2
Power Meter and Sensor Capability 3
Conventions Used in this Guide 4
Front Panel Keys and Connections 5
The Display Layout 10
Window Symbols and Pop-ups 18
Using the Instrument Web Browser 22
This chapter introduces you to the front panel display and instrument Web browser of the
P-Series power meter.
Agilent Technologies
1
1
Introduction
LXI Class-C Compliant Power Meter
P- Series power meter is a LXI Class C compliant
instrument, developed using LXI Technology. LXI, an
acronym for LAN eXtension for Instrumentation, is an
instrument standard for devices that use the Ethernet
(LAN) as their primary communication interface.
Hence, it is an easy- to- use instrument especially with the usage of an
integrated Web browser that provides a convenient way to configure the
instrument’s functionality.
Rack Mounting
The N1911A/1912A can be mounted in a standard 19- inch rack. Rack
mount kits are available as listed below. Support rails are also required
for rack mounting. These are normally supplied with the rack and are not
included with the rack mount options.
If you are installing an instrument on top of the N1911A/1912A, ensure
that the instrument does not obstruct the ventilation holes at the top of
the N1911A/1912A. If required, use a filler panel above the N1911A/1912A
to ensure adequate space for air circulation.
2
Option
Description
N1911A Option 908
Rack mount kit for one instrument
N1911A Option 909
Rack mount kit for two instruments
N1912A Option 908
Rack mount kit for one instrument
N1912A Option 909
Rack mount kit for two instruments
N1911A/1912A P-Series Power Meters User’s Guide
Introduction
1
Power Meter and Sensor Capability
Your P- Series power meter is compatible with Agilent P- Series, E- Series
E9320, E- Series E9300, E- Series E4410, 8480 Series and the N8480 Series
power sensors. However, not all sensor and meter combinations have the
same features or capabilities. The main differences are as below:
Features
P-Series
N1920
E-Series
E9320
E-Series
E9300
E-Series
E4410
8480
Series
N8480
Series
Average power of CW signal
•
•
•
•
•
•
Average power of modulated signal
•
•
•
•
•
Peak power
•
•
Cal factors stored on EEPROM
•
•
•
•
>200 readings/sec
•
•
•
•
Peak/burst average power
•
•
Time gated measurements
•
•
Rising edge trigger
•
•
Falling edge trigger
•
•
•1
1 Not applicable for N8480 Series power sensors with Option CFT
NOTE
• The E-Series, 8480 Series and N8480 Series power sensors require N1917A/B/C cables
when connected to the P-Series power meters.
• The N8480 Series power sensors used in this user’s guide is refering to all sensors from
the N8480 Series unless otherwise stated.
Specifications
The specifications for the power meter are listed in Chapter 11,
“Specifications and Characteristics,” starting on page 253.
N1911A/1912A P-Series Power Meters User’s Guide
3
1
Introduction
Conventions Used in this Guide
The following conventions are used throughout this guide.
This symbol and text represents a labeled key on the power meter front
panel.
Softkey
This symbol and text represents a labeled softkey and is used to indicate you should press the unmarked key beside the displayed text.
Message
This text represents a displayed message.
Parameter
This is used to represent a parameter, value, or title.
This User’s Guide describes the operation for both the single channel
and the dual channel power meter. To identify channels on a dual
channel meter a Channel softkey on an N1911A meter becomes
Channel A and Channel B an N1912A.
“Channel”
When you are asked to press “the channel” Softkey in a procedure,
make sure you select the relevant channel.
4
N1911A/1912A P-Series Power Meters User’s Guide
Introduction
1
Front Panel Keys and Connections
This section briefly describes the functions of the front panel keys and
connectors.
These keys are located to the left of the display.
Key
Function
Press this key to preset the power meter. An option list of
pre-installed measurement configurations is presented. Select an
option and press the confirm key.
Press this key to control the power meter from the front panel when
it is operating via the remote interfaces (when Local Lock Out is not
enabled).
Press this key to select the upper or lower measurement window.
The selected window is highlighted by a blue line on the right side
of the window. Any measurement setup you create is performed in
the selected window.
Press this key to choose windowed, expanded, or full-screen display of a numeric measurement. It also provides quick access to the
Gate Control screen and menu when a trace window is selected.
Press this key to switch the meter between on and standby. When
power is supplied, the background LED is red. Pressing the key,
switches the power meter on and the background LED is green.
N1911A/1912A P-Series Power Meters User’s Guide
5
1
Introduction
These keys are located along the lower edge of the display.
Key
Function
Press this key to access general configuration-menus, such as GPIB
address. You can also access the Self-Test and Table entry menus.
The measurement screen remains visible.
Press this key to access the channel configuration menus. Channel
parameters such as averaging and offsets are configured from this
menu.
Press this key to access the triggering menu. Unless a P-Series or an
E-Series E9320A Sensor is connected, all the menu keys are disabled
(grayed out).
Press this key to setup relative measurements or set display offsets.
Use this key to configure the selected measurement.
Press this key to access the measurement display menu. You can
choose the displayed measurement resolution, units and display
format.
Use this key together with
displays.
6
to configure measurement
N1911A/1912A P-Series Power Meters User’s Guide
Introduction
1
These keys are all associated with the menu labels and data entry. They
are located to the right of the display.
Key
Function
Press this key to return to the previous screen. This key also cancels pop-up entry.
These unmarked keys are called ‘softkeys’ and are referred to by
the text on the display next to them.
For example, during a Preset, you are given an option to confirm the
command. Press to continue, that is, press the softkey beside the
displayed word ‘confirm’.
The lowest of the unmarked softkeys is used when there is a two
page menu to be displayed. For example, a 1 of 2 is displayed beside
the key indicating the first page of a two page menu. Press the key
to access the next page or second page. (A 2 of 2 is displayed).
N1911A/1912A P-Series Power Meters User’s Guide
7
1
Introduction
These keys and connectors are associated with the measurement channels
and are located on the right- hand side of the front panel.
Key
Function
The arrow keys are used for navigation around the parameter entry
screens. The up and down arrows are used for selecting values
from a pop-up list, they can also be used for stepping two values, X
Scale and Y Scale. They are also used to enter text, for example,
table names.
Press this key to select a highlighted field to allow data entry, check
a checkbox and terminate entry of a popup list.
Press this key to access the zero and calibration menus.
Press this key to start and stop the acquisition of the measurement.
Press these keys to enter numeric values in the pop-up fields, for
example, the offset values. To complete the entry use the softkey.
8
N1911A/1912A P-Series Power Meters User’s Guide
Introduction
Connector
1
Function
The power reference is a 1 mW (0 dBm) 50 MHz signal available
from a 50 W type-N connector. It is used for calibrating an 8480,
E-Series or N8480 Series power sensor and meter system. If the
meter is configured with Option 003, the connector is fitted to
the rear panel. The Green LED beside the connector is lit when
the calibrator is turned on.
The sensor input connectors (N1912A shown, the N1911A has
one input). If the meter is configured with Option 003, the
connectors are fitted to the rear panel.
N1911A/1912A P-Series Power Meters User’s Guide
9
1
Introduction
The Display Layout
Figure 1- 1 shows the display layout when two windows are configured in
dual numeric mode.
Pressing
, Disp Type the other display formats are available.
1
9
2
3
8
4
6
5
7
Figure 1-1 Dual numeric display
1 The status reporting line displays messages and the control status of
the power meter. For example, the status can be either RMT (remote,
GPIB, USB or LAN operation) or LCL (local, front panel operation).
The message fields indicate ERR for any error conditions that occur or
informing you to Please Zero the power sensor.
2 The blue highlight on the right hand side of the window shows it is the
currently selected measurement display line. This measurement line is
the Upper Window/Upper Measurement.
3 The measured channel is shown. With a P- Series or an E- Series E9320
power sensor connected, and channel in trigger mode, the associated
gate number is shown.
4 The associated measurement type is shown below the channel and gate
number.
10
N1911A/1912A P-Series Power Meters User’s Guide
Introduction
1
5 This displays the measurement units, either dBm, dB, Watts, or percent
(%).
NOTE
With a P-Series or an E-Series E9320 power sensor connected, a measurement result of
–270 dBm indicates the input power level is beyond the sensitivity of the sensor.
6 With a P- Series or an E- Series E9320 power sensor connected, you can
make combined measurements with a single channel meter. A dual
channel meter extends this feature across both channels.
7 This displays the number of pages in the current menu. For example, 1
of 2 indicates that there are two pages in the menu and the first page is
currently displayed. Pressing the softkey displays the next page,
indicated by 2 of 2. (Press the softkey to display the previous menu
page.)
8 The available softkey labels are displayed in these four fields.
Additionally, settings associated with the labeled function are displayed
under the label.
9 This field displays the menu title. For example, Channel Setup or press
and the Zero/Cal menu is displayed.
N1911A/1912A P-Series Power Meters User’s Guide
11
1
Introduction
14
13
15
11
10
12
Figure 1-2 Single numeric and analog display
10 Figure 1- 2 shows the default display mode of two measurement
windows. The upper measurement window has a blue highlight on the
right hand side of the window showing it has been selected.
Using the
,
, or
measurement window.
keys you can change the selection of the
Using the
key on numeric measurement results window you
can choose either two rectangular windows, a single enlarged window,
or a full screen display by pressing. The display style is applied to the
currently selected window or measurement line.
11 The upper window is configured to show a single numeric display.
12 The lower window is configured to show an analog meter which
displays the measurement result and the meter scaling.
13 With a P- Series or an E- Series E9320 power sensor connected, the
symbol shows the trigger state
(Free Run),
(Stopped),
(Negative
Slope), or
(Positive Slope).
14 The channel measurement frequency.
15 This displays the connected sensor, the offset value, and the acquisition
mode on the channel. On dual channel models it shows for both
channels.
12
N1911A/1912A P-Series Power Meters User’s Guide
Introduction
21
20
19
1
18
16
17
Figure 1-3 Full screen numeric display
16 Figure 1- 3 shows a single numeric full screen displaying a relative
result.
This field displays Rel if relative mode is on.
17 This field indicates the measurement result is beyond the configured
upper or lower limit. If the measurement is within the limits this field
is empty. If the measurement result is less than the minimum limit set,
Undr Lmt is displayed. If the measurement result is more than the
maximum limit set, Over Lmt is displayed.
18 This field displays Ofs if an offset is set.
19 This field displays Rng Hld if a range is selected.
20 This field displays Dty Cyc if a duty cycle is set.
21 The information in this field is displayed on two lines and depends on
the sensor type, sensor calibration table, frequency dependent offset
table currently selected, and the measurement frequency.
N1911A/1912A P-Series Power Meters User’s Guide
13
1
Introduction
NOTE
The following trace displays are only available when a P-Series or an E-Series E9320 power
sensor is connected.
22
23
Figure 1-4 Trace display in both windows
22 Figure 1- 4 shows both windows configured to trace display mode. This
is only available with an P- Series or an E- Series E9320 power sensor is
connected. The captured trace, channel, and scaling are displayed. The
lower window is the selected window.
23 The
NOTE
indicates the point on the trace where trigger event occurs.
Single or continuous triggering ( Sing Trig or Cont Trig ) must be selected from the Acqn
menu to view a trace window. The Acqn menu is accessed by pressing
, Trigger .
Trace is disabled when Free Run is selected.
14
N1911A/1912A P-Series Power Meters User’s Guide
Introduction
1
24
25
28
26
27
29
Figure 1-5 Trace display in single enlarged window in markers mode
Figure 1- 5 shows a single enlarged window with the Gate Ctrl menu and
associated tables and markers. The Gate Control is the default display
when using trace display.
24 Pressing Gate
scrolls through the 4 gates available for each channel.
25 The markers, 1 and 2, indicate the start and end points of the selected
gate. Pressing Marker toggles between the two markers. You can use the
and
keys to move the active marker along the trace.
NOTE
26 The highlighted table, with the green border, shows the time (Time:) and
the instantaneous power level (Pow:) of the active marker at the
configured point. A negative time value indicates a measurement before
the trigger point.
Gate timing parameters are all related to your chosen trigger point. This may be different
from the timing of the triggering event if you have configured a trigger delay. Refer to item
No 30 for more information.
27 This table shows the time (Time:) and the instantaneous power level
(Pow:) of the inactive marker at the configured point.
28 The highlighted marker shows the active marker at the configured point.
29 This table shows the width of the gate ΔT: (time between the markers),
the average, peak, and peak- to- average ratio power measurements
within the active gate.
N1911A/1912A P-Series Power Meters User’s Guide
15
1
Introduction
31
32
30
Figure 1-6 Trace display in single enlarged window in trigger delay mode
Figure 1- 6 shows a single enlarged window with the Gate Ctrl menu and
associated tables and trigger delay.
30 Pressing Select TgDel removes the gate markers and displays the trigger
marker(s). The
indicates when the trigger event occurs, whilst
shows the delayed trigger point. When the two points coincide only the
trigger is shown.
In the example shown in Figure 1- 6, the
appears ahead of the
as
a trigger delay of –5.00 µs has been configured, placing the
measurement trigger before the trigger event. You can configure the
trigger delay by pressing and entering a numeric value.
To indicate an off- screen trigger event,
off- screen trigger point,
is displayed.
is displayed. To indicate an
31 The selected channel and gate number is displayed.
32 The trigger setting and slope is displayed. Examples shown in
Figure 1- 6 are Internal Channel A and a Positive Slope.
16
N1911A/1912A P-Series Power Meters User’s Guide
Introduction
1
34
33
35
Figure 1-7 Trace display in single enlarged window in trace control mode
Figure 1- 7 shows a single enlarged window with the Trace Ctrl menu with
information on the pulse and associated X and Y control.
33 This is the X and Y trace setup fields. Using the
highlight the item and change its value.
or
keys you can
34 The current settings of the X and Y scale are displayed in this reporting
line.
35 This table shows 8 automatic time measurements performed on the first
complete captured pulse after the trigger. The 8 measurements are rise
time
, fall time
, time to positive occurrence , time to
negative occurrence , pulse period
, pulse width
, duty
cycle 50.0 % and pulse repetitive frequency 12.5 kHz.
N1911A/1912A P-Series Power Meters User’s Guide
17
1
Introduction
Window Symbols and Pop-ups
There are several different graphic symbols and pop- up windows that can
occur on the power meter display. These can occur for a variety of
reasons, for example:
• An error or warning occurs
• You are required to wait while the power meter carries out a procedure
• You are required to select an entry from a list
• You are required to enter a numeric value
There are three different colors used to signify the pop- up status:
• Green - used to allow data entry
• Orange - used to display information
• Red - used to display an error
Warning Symbol Pop-up
The warning symbol is displayed either in a pop- up window or directly in
the measurement window when such an event occurs. A pop- up window
is displayed for approximately two seconds. The text in the pop- up
window gives details of the warning type, for example, to indicate that a
power sensor has insufficient bandwidth or a previous entered frequency
value in a table. Depending on the severity of the warning, the pop- up
may be displayed in Orange or Red.
18
N1911A/1912A P-Series Power Meters User’s Guide
Introduction
1
Wait Symbol Pop-up
The wait symbol is displayed when the power meter is carrying out a
procedure and no action is required from you. The symbol appears in a
pop- up window. It may appear, for example, during a calibration.
Confirm Symbol Pop-up
This type of pop- up window is displayed when you are required to press
Confirm to verify your previous selection. For example, prior to a Save
being carried out.
Numeric Entry Pop-up
This type of pop- up window is displayed when you need to modify
numeric data. The numeric keys allow you to enter the value.
N1911A/1912A P-Series Power Meters User’s Guide
19
1
Introduction
Text Entry Pop-up
This type of pop- up window is displayed when you need to modify
alphanumeric data, for example, table names. The up/down arrow keys
increment and decrement the alphanumeric digit that the cursor is
currently positioned. The left/right arrow keys move the cursor to another
alphanumeric digit.
Trace Scaling Pop-up
This pop- up window is displayed when you are in the Trace Control menu
and you can either use the up/down arrow keys for increment and
decrement, or the numeric keys to set, the values of the X scale and Y
scale.
20
N1911A/1912A P-Series Power Meters User’s Guide
Introduction
1
List Pop-up
This pop- up window is displayed when you are required to select an entry
from a list. Use the up/down arrow keys to highlight your choice. Press
select to complete the entry.
N1911A/1912A P-Series Power Meters User’s Guide
21
1
Introduction
Using the Instrument Web Browser
P- Series power meters network settings can be configured using its
Web- based interface (Web browser). The instrument’s Web browser can be
opened from Agilent Connection Expert as shown in Figure 1- 8.
NOTE
Alternatively, the instrument’s Web- based interface can also be opened
directly from a Web browser by entering the instrument’s IP address or
hostname in the browser’s ‘address’ window.
Select the instrument/
open the web interface
Figure 1-8 Opening the instrument Web interface.
22
N1911A/1912A P-Series Power Meters User’s Guide
Introduction
1
An example of the Web browser is shown in “N1912A P- Series power
meter Web browser (Welcome Page)” on page 23.
Figure 1-9 N1912A P-Series power meter Web browser (Welcome Page)
Instrument on the network can be physically identified through the Status
message on Remote Interfaces screen by clicking Toggle ID within the
Web browser. This changes the status of the Instrument ID to ON or OFF.
Before the instrument identification starts, press
to view the Status message.
, Remote Interfaces
When Instrument ID is toggled to ON, this causes the Status message
“LAN identify start” in Remote Interface screen on the front panel to
blink 3 times. When the Toggle ID is selected again, the default Status
message “Running” is returned. See Figure 1- 10 and Figure 1- 11.
N1911A/1912A P-Series Power Meters User’s Guide
23
1
Introduction
Figure 1-10 Status message before Toggle ID is selected.
Status message “LAN
identity start” to blink 3
times when Toggle ID is
selected.
Figure 1-11 Status message when Toggle ID is selected.
When power meter is configured to LAN, the Lan Status on
Remote Interfaces screen will show the LAN error condition and status of
the LAN configuration connection. There are six types of Lan Status
messages that may occur. See Table 1- 1. See also Figure 1- 12 for the
example of Lan Status message.
24
N1911A/1912A P-Series Power Meters User’s Guide
Introduction
1
Table 1-1 Type of Lan Status message.
Type of message
Description
Lan: No Fault
• A valid IP address is successfully obtained using selected
LAN configuration and the network state is initialized.
Status: Initialized
Lan: No Fault
Status: Running
Lan: Fault
Status: Initialization failed
Lan: Fault
Status: Disconnected
Lan: –
Status: Restarting
Lan: DHCP Not Available
Status: Running
• A valid IP address is successfully obtained using selected
LAN configuration, while network is running.
• IP conflict occurs, or
• IP address failed to be obtained using selected LAN
configuration, or
• No LAN configuration is selected.
• LAN cable is unplugged.
• Restart the network and try to obtain an IP address using
selected LAN configuration.
• Unable to obtain IP address from DHCP server (if user
select DHCP configuration)
• IP address obtained from Auto-IP or manual
configuration.
Figure 1-12 Example of Lan Status message.
NOTE
For more details on remote interface configuration, refer to P-Series Power Meters
Installation Guide.
N1911A/1912A P-Series Power Meters User’s Guide
25
1
Introduction
Editing the Instrument’s LAN Settings
Once communication path to the instrument has been established, the
instrument’s LAN configuration can be viewed and modified using the Web
browser.
On the Welcome Page, click View and Modify Configuration. This opens
the configuration window shown in Figure 1- 13.
Figure 1-13 Viewing LAN configuration settings from the Web interface.
To edit parameters shown, click Modify Configuration. The Enter
Password dialog box appears as shown in Figure 1- 14.
26
N1911A/1912A P-Series Power Meters User’s Guide
Introduction
1
Figure 1-14 Password security dialog box.
Click the Submit (accept the default password) and the window opens as
shown in Figure 1- 15. The default password is “agilent”.
NOTE
For P-Series power meters with latest firmware upgrade to be LXI-C compliant, a LAN reset
needs to be performed to ensure that the password is reset to default. See LAN reset
procedure as below.
Procedure:
1 Press
, Remote Interfaces to display the Remote Interfaces screen.
2 Press 1 of 2 softkey to display the second page of the Remote I/F menu.
3 Press LAN Reset softkey to reset the LAN settings to default.
NOTE
NOTE
When LAN Reset softkey is pressed, it will also change the GPIB address to default.
You can change the password from the Configuring your N1912A Power Meter window as
shown in Figure 1-15. Scroll down the Parameter column until you locate the Change
Password parameter.
N1911A/1912A P-Series Power Meters User’s Guide
27
1
Introduction
Figure 1-15 Changing the instrument LAN interface configuration
28
N1911A/1912A P-Series Power Meters User’s Guide
N1911A/1912A P-Series Power Meters
User’s Guide
2
General Power Meter Functions
Setting the Units of Measurement 30
Setting the Measurement Frequency 32
Setting the Resolution 33
Making Relative Measurements 34
Setting the Pulse Reference Levels 36
Setting Offsets 39
Setting Measurement Averaging 49
Step Detection 51
Setting the Video Averaging 52
Setting the Video Bandwidth 54
Setting Measurement Channel Gates 57
Setting up the Channel Trace 62
Setting the Trigger 66
Setting External Trigger for Normal and Average Power Measurement 72
Setting Measurement Limits 86
Setting the Measurement Display 90
Scaling the Analog Display 97
Recorder Output 99
Saving and Recalling Power Meter States 104
Zeroing and Calibrating the P-Series Sensor 107
Presetting the Power Meter 111
Setting the Cable Short/Long 113
This chapter describes the general operation of the P-Series power meter.
Agilent Technologies
29
2
General Power Meter Functions
Setting the Units of Measurement
The Units menu is used to select the measurement units for the currently
selected window. These can either be logarithmic (dBm or dB) or linear
(Watt or %) units. Presetting (
) the power meter sets the
measurement units to dBm (logarithmic units). Table 2- 2 and Table 2- 3
show units that are applicable to each measurement mode.
Press
, Units . Select the unit of measurement from dBm , W , dB ,
and % . Softkeys which cannot be selected in your particular mode of
operation are grayed out.
NOTE
When the measurement unit is set to Watt (W), it is possible that negative power results
are displayed when measuring low power levels.
Table 2-2 Measurement units - Single channel meters
Measurement Mode
Relative Mode Off
Relative Mode On
Log
dBm
dB
Linear
Watt
%
Table 2-3 Measurement units - Dual channel meters
Measurement Mode
Relative Mode Off
Relative Mode On
Ratio
Log
dB
dB
Linear
%
%
Log
dBm
dB
Linear
Watt
%
Difference
30
N1911A/1912A P-Series Power Meters User’s Guide
General Power Meter Functions
2
Selecting Units of Measurement from the Softkeys
In some menus, for example, units in the Trace Setup menu, you are
required to enter the units of measurement for power. In some cases, due
to the availability of wide power range, the following menu is displayed:
mW
µW
nW
W
Increment
Multiplier
2 of 2
Decrement
Multiplier
Cancel
Pressing Increment Multiplier or Decrement Multiplier increases or decreases
the multiplier shown in front of W .Pressing W after the correct
multiplier has been selected confirms the entry.
NOTE
Invalid softkeys are grayed out so the value cannot be entered.
N1911A/1912A P-Series Power Meters User’s Guide
31
2
General Power Meter Functions
Setting the Measurement Frequency
Entering the frequency of the RF signal you are measuring optimizes the
accuracy and minimizes measurement uncertainty, especially when making
comparative measurements between signals.
Procedure
Set the measurement frequency as follows:
1 Press
2 Use the
. On dual channel meters select the required channel.
and
keys to highlight the Frequency value field and press
to display the Frequency pop- up. Use the numeric keypad to
enter the required value in the Frequency pop- up window.
Figure 2-16 Frequency pop-up
3 Confirm your choice by pressing MHz or GHz .
4 Press
32
key to close the Channel Setup screen.
N1911A/1912A P-Series Power Meters User’s Guide
General Power Meter Functions
2
Setting the Resolution
The resolution of each of the power meter’s numeric type windows can be
set to four different levels (1, 2, 3 or 4).
These four levels represent:
• 1, 0.1, 0.01, 0.001 dB respectively if the measurement suffix is dBm or
dB.
• 1, 2, 3 or 4 significant digits respectively if the measurement suffix is
W or %.
The default value is 0.01 dB (3 digits).
To set the resolution on the currently selected window:
1 Press
the
Resolution
. The current setting of the resolution is highlighted under
softkey.
2 To change this setting, press Resolution
resolution setting is highlighted.
N1911A/1912A P-Series Power Meters User’s Guide
repeatedly until the required
33
2
General Power Meter Functions
Making Relative Measurements
Relative mode enables comparison of a measurement result to a reference
value. The relative reading, or difference, can be displayed in either dB or
% terms. When the measurement result is displayed in % a prefix
multiplier may be shown.
Procedure
1 Press
to display the Measurement Setup menu.
Figure 2- 17 shows a Measurement Setup display and the relative
measurement items labeled.
2 Select the window you wish to set a reference value on by pressing the
Meas Select key. The currently selected window/measurement is
displayed.
3 Use the
and
keys to highlight the Relative setting field.
Selected Window/
Measurement
Relative Setting Field
Result Field
Rel Field
Original Result
Figure 2-17 Typical relative measurement display
4 Press
to check the Relative setting field.
5 Confirm that the power meter is measuring the signal you want to use
as the reference. This is displayed under the Result field.
34
N1911A/1912A P-Series Power Meters User’s Guide
General Power Meter Functions
6 Press the
,
2
, key to highlight the Rel field.
7 Press
and the original result value will appear on the right hand
side of the Rel check field.
8 The relative value displayed under Result field will change as the
measured signal varies.
NOTE
If you return the power meter to display the numeric display, a Rel symbol will be displayed
in the measurement window it is applied to.
Rel Indicator
Figure 2-18 Numeric display
NOTE
The Rel symbol is not displayed when the associated measurement is displayed in Dual
Numeric or Analog format.
N1911A/1912A P-Series Power Meters User’s Guide
35
2
General Power Meter Functions
Setting the Pulse Reference Levels
• Press
and proceed to the second page of Sys/Inputs menu by
pressing the 1 of 2 softkey.
• Press Meas Config softkey to display the Measurement Configuration screen.
• Press the Channel A B softkey to select the desired channel for a dual
channel power meter (N1912A).
Figure 2-19 Measurement configuration screen
36
NOTE
Trace Ref Lvl 1 and Trace Ref Lvl 2 are used in calculation of transition durations and
occurrences.
NOTE
Pulse Duration Ref Lvl allows pulse duration measurements between non-standard
reference levels.
N1911A/1912A P-Series Power Meters User’s Guide
General Power Meter Functions
2
Trace Ref Lvl 2 = 90%
Pulse Duration Ref Lvl = 50%
Measured Pulse Duration
Trace Ref Lvl 1 = 10%
Figure 2-20 Pulse duration measurement between two reference levels
1 Use the
and
keys to highlight the Trace Ref Lvl 1 field.
2 Press
to display the Trace Ref Lvl 1 pop- up, and use the numeric
keypad to enter the intended value in the Trace Ref Lvl 1 pop- up window.
Figure 2-21 Trace Ref Lvl 1 pop-up
3 Complete the entry by pressing the % softkey.
4 Use the
and
keys to highlight the Trace Ref Lvl 2 field.
N1911A/1912A P-Series Power Meters User’s Guide
37
2
General Power Meter Functions
5 Press
to display the Trace Ref Lvl 2 pop- up, and use the numeric
keypad to enter the intended value in the Trace Ref Lvl 2 pop- up window.
Figure 2-22 Trace Ref Lvl 2 pop-up
6 Complete the entry by pressing the % softkey.
7 Use the
and
keys to highlight the Pulse Duration Ref Lvl field.
8 Press
to display the Pulse Duration Ref Lvl pop- up, and use the
numeric keypad to enter the intended value in the Pulse Duration Ref Lvl
pop- up.
Figure 2-23 Pulse Duration Ref Lvl pop-up
9 Complete the entry by pressing the % softkey.
NOTE
38
By default, the Trace Ref Lvl 1, Trace Ref Lvl 2 and Pulse Duration Ref Lvl settings are set
to 10 %, 90 % and 50 % respectively.
N1911A/1912A P-Series Power Meters User’s Guide
General Power Meter Functions
2
Setting Offsets
The power meter can be configured to compensate for a signal loss or gain
in your test setup. The power meter allows you to apply offsets at three
different points in the measurement path.
Window Functions
Channel Functions
Upper Window
Cal
Factor
Freq Dep
Offset
Channel
Offset
Channel B
Cal
Factor
Freq Dep
Offset
Channel
Offset
Measurement Highway
Channel A
Display
Offset
Relative
Display
Offset
Relative
Lower Window
Display
Offset
Relative
Display
Offset
Relative
Figure 2-24 Simplified measurement path
Figure 2- 24 shows that how you can apply a Channel Offset or a
Frequency Dependent Offset prior to any mathematical functions. These
allow you to compensate each channel individually. An overall offset can
be applied if required using the Display Offset.
Setting Channel Offsets
This gain or loss is applied to the measured power before any
mathematical functions, display offsets or relative functions are included.
Offsets are entered in dB and the range is –100 dB to +100 dB.
A positive value compensates for a loss and a negative value compensates
for a gain.
N1911A/1912A P-Series Power Meters User’s Guide
39
2
General Power Meter Functions
Procedure
To enter a channel offset:
1 Press
to display the Channel Setup screen. Confirm the channel
requiring setup is displayed.
2 Press Offsets to display the Offsets Setup.
3 Use the
4 Press
and
keys to highlight the Offset setting field.
to check the Offset setting field.
Offset Setting Field
Offset Value Field
Figure 2-25 Typical channel offset display
5 Press
to highlight the Offset value field and press
to display
the Offset pop- up. Use the numeric keypad to enter the required value
in the Offset pop- up window.
6 Confirm your choice by pressing dB .
7 Press
key to complete the offset entry. If either a channel or a
display offset is set, the Ofs indicator is displayed.
40
N1911A/1912A P-Series Power Meters User’s Guide
General Power Meter Functions
2
Offset Indicator
Figure 2-26 Channel offset indicator
NOTE
The Ofs symbol is not displayed when the associated measurement is displayed in Dual
Numeric or Analog format.
Setting Display Offsets
This gain or loss is applied to the measured power after any channel
offsets or mathematical functions have been included.
Offsets are entered in dB and the range of values is –100 dB to +100 dB.
A positive value compensates for a loss, and a negative value compensates
for a gain.
Procedure
Enter a display offset on the currently selected window:
1 Press
to display the Measurement Setup screen.
2 Select the window you wish to set the offset value on by pressing the
Meas Select
key. The currently selected window/measurement is
displayed.
3 Use the
4 Press
and
keys to highlight the Offset setting field.
to check the Offset setting field.
N1911A/1912A P-Series Power Meters User’s Guide
41
2
General Power Meter Functions
Selected Window/
Measurement
Offset Setting Field
Offset Value Field
Figure 2-27 Typical display offset display
5 Press
to highlight the Offset value field and press
to display
the Display Offset pop- up. Use the numeric keypad to enter the required
value in the Offset pop- up window.
6 Confirm your choice by pressing dB . Press
the offset entry.
NOTE
key to complete
The Ofs indicator is displayed if Display Offset is selected.
Setting Frequency Dependent Offsets
Frequency dependent offset tables provide a quick and convenient method
of compensating for frequency related changes in the response of your test
system. Note that when selected, frequency dependent offset corrections
are applied IN ADDITION to any correction for sensor frequency response.
The power meter is capable of storing 10 frequency dependent offset
tables with a maximum of 80 frequency points each.
42
N1911A/1912A P-Series Power Meters User’s Guide
General Power Meter Functions
2
To use frequency dependent offset tables:
1 Select the table to be applied to a channel. Refer to “Setting Frequency
Dependent Offsets” on page 42 for further information. If you require to
edit the table refer to “Editing Frequency Dependent Offset Tables” on
page 45 for further information.
2 If using an 8480 Series, N8480 Series or an E- Series sensor, zero and
calibrate the power meter. The reference calibration factor used during
the calibration is automatically set by the power meter from the sensor
calibration table (if selected).
3 Specify the frequency of the signal you want to measure. The
calibration factor/offset is automatically set by the power meter from
the sensor calibration table (if selected) and the frequency dependent
offset table. Refer to “Procedure” on page 44 for further information.
4 Make the measurement.
Selecting a Frequency Dependent Offset Table
You can select a frequency dependent offset table from the
menu followed by Tables and Freq. Dep. Offset .
key
The State column indicates if any frequency dependent offset tables are
currently selected. The Offset Tables screen is shown in Figure 2- 28.
NOTE
You can also view which FDO table is being used by pressing the
and use the
and
, Offsets
keys to highlight the FDO Table setting field and press
to
display the table.
N1911A/1912A P-Series Power Meters User’s Guide
43
2
General Power Meter Functions
Procedure
Select an offset table as follows:
1 Press, either:
, Tables , Freq. Dep. Offset .
a.
, Offsets and use the
b.
Table
setting field and press
and
keys to highlight the FDO
to display the table.
Figure 2-28 Frequency dependent offset tables display
2 Use the
and
keys to highlight one of the 10 table titles and press
Table to highlight On .
NOTE
When no data is contained in the highlighted table, the Table key is disabled (grayed out).
3 Press Done to complete the selection of the offset table.
4 Press Done again to display the measurement screen. Figure 2- 29
shows which offset table is selected.
44
N1911A/1912A P-Series Power Meters User’s Guide
General Power Meter Functions
2
Offset Table A Selected
Figure 2-29 Frequency dependent offset indicator
5 To change the frequency, press
highlight the Frequency field.
and use the
and
keys to
6 Press
to display the Frequency pop- up window. Use the numeric
keypad to enter the required value in the Frequency pop- up window.
7 To confirm your choice, press the appropriate unit softkey.
8 Connect the power sensor to the signal to be measured.
9 The measurement result, including offset, is now displayed.
NOTE
If the measurement frequency does not correspond directly to a frequency in the sensor
calibration table (if selected) and the frequency dependent offset table being used, the
power meter calculates the calibration factor and offset using linear interpolation.
If you enter a frequency outside the frequency range defined in the sensor calibration table
or the frequency dependent offset table, the power meter uses the highest or lowest
frequency point in the appropriate table to set the calibration factor and offset.
Editing Frequency Dependent Offset Tables
There are ten frequency dependent offset tables named CUSTOM_A through
CUSTOM_J. They are empty of any data when the power meter is shipped
from the factory.
You cannot delete any of the 10 existing frequency dependent offset tables
or create any additional tables. However, you can enter values into the 10
existing tables. Each frequency dependent offset table can contain a
maximum of 80 frequency points.
N1911A/1912A P-Series Power Meters User’s Guide
45
2
General Power Meter Functions
To view the frequency dependent offset tables currently stored in the
power meter, press
, Tables , Freq. Dep. Offset . The Frequency
Dependent Offset Tables screen is displayed as shown in Figure 2- 28.
Editing frequency dependent offset tables requires the following steps:
1 Identify and select the table you want to edit
2 Rename the table
3 Enter the frequency and offset pairs
4 Save the table
Procedure
First select the table you want to edit as follows:
NOTE
A frequency in the range of 0.001 MHz to 1000.0 GHz can be entered. A calibration factor in
the range of 1 % to 150 % can be entered.
1 Press
, Tables , Freq. Dep. Offset
to display the Offset Tbls screen.
2 Choose the table you want to edit using the
Edit Table
and
keys. Press
to display the Edit Offset screen as shown in Figure 2- 30.
Figure 2-30 “Edit Offset” display with data added
46
N1911A/1912A P-Series Power Meters User’s Guide
General Power Meter Functions
3 Highlight the table title using the
use
and
2
keys. Press Change and
the
,
,
and
keys to select and change the characters in the
Table Name pop- up to create the name you want to use.
Figure 2-31 Edit table title pop-up
•
Pressing Insert Char adds a new character to the right of the
selected character.
• Pressing Delete Char
removes the selected character.
4 Press Enter to complete the entry.
NOTE
The following rules apply to naming sensor calibration tables:
•
The name must consist of no more than 12 characters.
•
All characters must be upper or lower case alphabetic characters, or numeric (0-9), or
an underscore (_).
•
No other characters are allowed.
•
No spaces are allowed in the name.
N1911A/1912A P-Series Power Meters User’s Guide
47
2
General Power Meter Functions
Enter (or edit) the frequency and offset pairs as follows:
1 Press Insert to add a new frequency value (or press Change to edit).
Use the numeric keypad to enter the required value in the Frequency
pop- up window. Complete the entry by pressing the GHz , MHz keys.
2 Enter the new offset value (or press Change to edit). Use the numeric
keypad to enter the required value in the Offset pop- up window.
Complete the entry by pressing the % key.
3 Continue adding/editing values until you have entered all the data you
require.
4 When you have finished editing the table press Done to save the table.
NOTE
48
If you measure a signal with a frequency outside the frequency range defined in the
frequency dependent offset table, the power meter uses the highest or lowest frequency
point in the frequency dependent offset table to calculate the offset
N1911A/1912A P-Series Power Meters User’s Guide
General Power Meter Functions
2
Setting Measurement Averaging
The power meter uses a digital filter to average power readings. The
number of readings averaged can range from 1 to 1024. This filter is used
to reduce noise, obtain the desired resolution and to reduce the jitter in
the measurement results. Increasing the value of the measurement average
reduces measurement noise. However, the measurement time is increased.
You can manually select the measurement average or you can set the
power meter to auto measurement average mode. The default is AUTO.
Resolution Setting
2
3
Minimum Sensor Power
1
10 dB
1
8
128
128
10 dB
1
1
16
256
10 dB
1
1
2
32
10 dB
1
1
1
16
1
1
1
8
4
Number of Averages
Power Sensor
Dynamic Range
When the auto measurement average mode is enabled, the power meter
automatically sets the number of readings averaged together to satisfy the
filtering requirements for most power measurements. The number of
readings averaged together depends on the resolution setting and the
power level currently being measured.
Maximum Sensor Power
Figure 2-32 Typical averaged readings
Figure 2- 32 shows the typical number of averages for each range and
resolution when the power meter is in auto filter mode and is set to
normal speed mode. P- Series power meters recognize different sensor
types when they are connected, and configure suitable averaging
automatically.
N1911A/1912A P-Series Power Meters User’s Guide
49
2
General Power Meter Functions
Resolution is a measurement display function and not a channel function.
In the case where a channel is set up in both the upper and lower
window and the resolution settings are different, the highest resolution
setting is taken to calculate the averaging number.
These four resolution levels represent:
• 1, 0.1, 0.01, 0.001 dB respectively if the measurement suffix is dBm or
dB.
• 1, 2, 3 or 4 significant digits respectively if the measurement suffix is
W or %.
Procedure
Set measurement averaging as follows:
1 Press
. On dual channel meters select the required channel. The
current setting is shown in the Meas Avg field (AUTO, MAN, or OFF) on
the Channel Setup screen. The default is AUTO.
2 Use the
3 Press
settings.
and
keys to select the Filter setting field.
and use the
and
to step through the available
If you have selected AUTO or OFF proceed at step 7. If you have selected
MAN proceed as follows:
4 Use the
5 Press
key to select the Meas Avg: value field.
to display the Meas Avg Count pop- up.
Figure 2-33 Meas Avg Count pop-up
6 Use the numeric keys to enter the required value and press Enter .
7 Press
50
key to close the Channel Setup screen.
N1911A/1912A P-Series Power Meters User’s Guide
General Power Meter Functions
2
Step Detection
To reduce the filter settling time after a significant step in the measured
power the filter can be set to re- initialize upon detection of a step
increase or decrease in the measured power. Step detection can be set in
both manual and automatic measurement average modes.
Procedure
Set step detection as follows:
1 Press
2 Use the
. On dual channel meters select the required channel.
and
keys to select the Step Detect setting field.
3 Press
to check the step detection to on or off.
4 Press
key to close the Channel Setup screen.
N1911A/1912A P-Series Power Meters User’s Guide
51
2
General Power Meter Functions
Setting the Video Averaging
NOTE
This feature is only available when a P-Series or an E-Series E9320 power sensor is
connected.
Video averaging uses a digital filter to average repetitions of a triggered
signal. The number of acquisitions averaged can range from 1 to 256, in
multiples of 2n. With video averaging the average of a number of
acquisitions is calculated to smooth the displayed trace and reduce
apparent noise. The measurement requires a continuously repeating signal.
Increasing the value of this filter reduces noise but increases the time
required to make the measurement.
Procedure
Set the video average as follows:
1 Press
2 Use the
3 Press
4 Use the
5 Press
52
. On dual channel meters select the required channel.
and
keys to select the Video Avg setting field.
to check the video averaging to on or off.
key to select the Video Avg: value field.
to display the Video Avg Count pop- up.
N1911A/1912A P-Series Power Meters User’s Guide
General Power Meter Functions
2
Figure 2-34 Video Avg Count pop-up
6 Use the
and press
7 Press
keys to highlight the required Video Avg Count value
and
.
key to close the Channel Setup screen.
N1911A/1912A P-Series Power Meters User’s Guide
53
2
General Power Meter Functions
Setting the Video Bandwidth
NOTE
This feature is only available when a P-Series or an E-Series E9320 power sensor is
connected.
Selecting a bandwidth value close to or slightly greater than required by
the modulating signal bandwidth can help reduce noise and improve
accuracy on peak measurements (see Table 2- 4). It can however, reduce
the processing speed for long acquisition times.
Table 2-4 P-Series Sensor Video Bandwidth Setting
Low:
Medium:
High:
Off
5.0 MHz
15.0 MHz
30.0 MHz
>30.0 MHz
The Low, Medium, and High pass band shapes achieved by the video
bandwidth settings provide flat filter responses with very sharp cut- off
points by applying digital signal processing techniques to ensure accurate
power measurement within the specified band.
54
N1911A/1912A P-Series Power Meters User’s Guide
General Power Meter Functions
Amplitude
2
P-Series Sensors
0
–3.5 dB
Approx
5 MHz
15 MHz
30 MHz
Frequency
Meter B/W
Low
Setting
Med
High
Off
Figure 2-35 Bandwidth filter shapes
When video bandwidth is set to Off, it removes all digital signal
conditioning. This provides approximately 3 dB roll off at the maximum
sensor’s bandwidth and is best suited for accurate trace capture,
minimizing overshoot, and removing any ringing effects caused by the
sharp cut- off filters used in the Low, Med and High settings. Figure 2- 35
shows the filter shapes associated with the P- Series wideband power
sensors.
Procedure
Set the video bandwidth as follows:
1 Press
2 Use the
3 Press
. On dual channel meters select the required channel.
and
keys to select the Video B/W setting field.
to display the Video B/W pop- up.
N1911A/1912A P-Series Power Meters User’s Guide
55
2
General Power Meter Functions
Figure 2-36 Video bandwidth pop-up
4 Use the
and press
5 Press
56
keys to highlight the required Video Bandwidth setting
and
.
key to close the Channel Setup screen.
N1911A/1912A P-Series Power Meters User’s Guide
General Power Meter Functions
2
Setting Measurement Channel Gates
NOTE
This feature is only available when a P-Series or an E-Series E9320 power sensor is
connected.
A system of gates, controlled by and referenced to a trigger point, is used
to obtain measurement data from a captured trace. The trace data within
each gate period is subsequently used for the individual measurement
calculations. Up to 4 gates can be set up for each channel. Figure 2- 37
shows an example of 4 gates setup to perform the following measurements
simultaneously:
• Average power level of the pulse:
Gate 1, average measurement
• Average “off” power level ahead of the pulse:
Gate 2, average measurement
• Peak to average ratio:
Gate 1, peak- to- average measurement
• Pulse drop:
Gate 3, average measurement, minus Gate 4, average measurement
Gate 4
Gate 3
Trigger
Gate 2
Gate 1
Figure 2-37 Example of measurement gates
N1911A/1912A P-Series Power Meters User’s Guide
57
2
General Power Meter Functions
NOTE
Figure 2-37 shows measurement results using this example of the gates placement.
Procedure
NOTE
This procedure uses the Gates Setup under the Channel Setup menu. Alternatively, you
can use a more visual method, when in the Graphical Trace Mode (Gate Control Menu), to
set the channel’s Gate Control. (See “Setting the Trace Display” on page 118).
• Press Gates Setup . The Channel Gate Setup screen is displayed.
Figure 2-38 Gate Setup screen
1 Highlight the Gate Start you want to configure using the
keys.
NOTE
58
,
,
and
The gate start time is relative to the trigger event. Positive values set a measurement gate,
to a maximum time of 1 second, after the trigger. Negative time gate start values set a
measurement gate, to a maximum time of 1 second, before the trigger.
N1911A/1912A P-Series Power Meters User’s Guide
General Power Meter Functions
2
2 Press
and use the numeric keypad to enter the required value in
the Time Gating Start pop- up window.
Figure 2-39 Time Gating Start pop-up
3 Complete the entry by pressing the required second, millisecond,
microsecond or nanosecond ( s , ms , us or ns ) softkey.
4 Highlight the Gate Length you want to configure using the
and
,
,
,
keys.
Figure 2-40 Time Gating Length pop-up
5 Complete the entry by pressing the required second, millisecond, or
microsecond or nanosecond ( s , ms , us or ns ) softkey.
6 Repeat this process until you have setup all the required gates.
Auto Gate
This feature will automatically set the gates (start and stop times of the
user defined time interval) for each measurement relative to the rising
and falling edges’ trigger point.
• Proceed to the second page of Gate Ctrl menu and press Auto Gate
softkey.
N1911A/1912A P-Series Power Meters User’s Guide
59
2
General Power Meter Functions
• To change the Auto Gate setup:
1 Press Auto Gate Settings
softkey.
Figure 2-41 Auto Gate Settings display
NOTE
Auto Gate Settings enables the placing of markers (gates) at different positions.
2 Press Gate 1 Ref 1 0.0% softkey. The Marker 1 Ref Percentage pop- up is
displayed.
Figure 2-42 Marker 1 Ref Percentage pop-up
3 Use the numeric keys to complete the entry and press % softkey.
4 Press Gate 1 Ref 2 0.0% softkey. The Marker 2 Ref Percentage pop- up is
displayed.
60
N1911A/1912A P-Series Power Meters User’s Guide
General Power Meter Functions
2
Figure 2-43 Marker 2 Ref Percentage pop-up
5 Use the numeric keys to complete the entry and press % softkey.
Ref 1 x PD
Ref 2 x PD
Pulse Duration (PD)
Figure 2-44 The placement of gates (markers) in Auto Gating mode
NOTE
Enabling the Perpetual Off On softkey allows the gates to be repositioned automatically
according to the changes of pulse duration.
N1911A/1912A P-Series Power Meters User’s Guide
61
2
General Power Meter Functions
Setting up the Channel Trace
NOTE
This feature is only available when a P-Series or an E-Series E9320 power sensor is
connected.
NOTE
The Trace Setup is the only location where you can change the Y-axis units from dBm to
Watts.
Procedure
NOTE
This procedure uses the Trace Setup under the Channel Setup menu. Alternatively, you can
use a more visual method, when in the Graphical Trace Mode (Trace Control Menu), to set
the channel’s Trace Control. (See “Setting the Trace Display” on page 118).
1 Press
, Trace Setup
to display the Trace Setup menu.
Figure 2-45 Trace setup display
2 Use the
62
and
keys to highlight the X Start field.
N1911A/1912A P-Series Power Meters User’s Guide
General Power Meter Functions
2
3 Press
to display the Trace Start Time pop- up and use the numeric
keypad to enter the required value in the Trace Start Time pop- up
window.
Figure 2-46 Trace Start Time pop-up
4 Complete the entry by pressing the required second, millisecond,
microsecond or nanosecond ( s , ms , us or ns ) softkey.
5 Use the
6 Press
keys to highlight the X Scale field.
and
to display the X Scale/Division pop- up.
a. Use the numeric keypad to enter the required value in the X
Scale/Division pop- up window.
b. Use the
and
keys to increase or decrease the value.
Figure 2-47 X Scale/Division pop-up
7 Complete the entry by pressing:
a. The required second, millisecond, microsecond or nanosecond ( s ,
ms , us or ns ) softkey.
b. The Enter softkey.
N1911A/1912A P-Series Power Meters User’s Guide
63
2
General Power Meter Functions
8 Use the
keys to highlight the Units field.
and
If you want to view the trace in linear scale, use this field. Otherwise
the default scale is in logarithmic.
9 Press
to display the Units pop- up, and use the
highlight Watt or dBm.
and
to
Figure 2-48 Trace Units pop-up
10 Press
11 Use the
to complete the entry.
keys to highlight the Y Max field.
and
12 Press
to display the Trace Maximum pop- up, and use the numeric
keypad to enter the required value in the Trace Maximum pop- up
window.
Figure 2-49 Y scale maximum value pop-up
13 Complete the entry by pressing the dBm or the linear value.
14 Use the
15 Press
keys to highlight the Y Scale field.
and
to display the Y Scale/Division pop- up.
a. Use the numeric keypad to enter the required value in the Y
Scale/Division pop- up window.
b. Use the
64
and
keys to increase or decrease the value.
N1911A/1912A P-Series Power Meters User’s Guide
General Power Meter Functions
2
Figure 2-50 Y Scale/Division pop-up
16 Complete the entry by pressing the dB or the linear value.
17 Press
key to complete the setup and display the
measurements results.
Auto Scale
Auto Scale automatically configures the window’s X- axis and Y- axis to
best display the input trace.
1 Press Trace Control softkey under Gate Ctrl menu.
2 Auto Scale softkey is pressed to accomplish auto scaling.
NOTE
This feature will work reliably with well behaved pulses. Modulated pulses may cause the
meter to auto-scale on the details within the pulse envelope.
N1911A/1912A P-Series Power Meters User’s Guide
65
2
General Power Meter Functions
Setting the Trigger
NOTE
This feature is only available when a P-Series power sensor is connected.
The trigger can be taken from a rising or falling measured power level or
controlled externally using the Ext Trig input. Additional control features
such as; hold- off, hysteresis, and delay are provided to help you achieve a
stable and reliable trigger. To use the measurement gates, the power meter
must be triggered.
• Press
. The Trigger menu is displayed.
The trigger status is displayed below the Acqn label in the Trigger menu.
Figure 2- 51 shows the power meter display in Free Run mode. In this mode
the meter is not synchronized to any modulated RF signal at the sensor
input. Consequently, power levels within the configured time gates are
random and the displayed measurement results are not valid.
Trigger status
Figure 2-51 Trigger menu - free run mode
NOTE
66
The
symbol in the upper window indicates the power meter is in free run mode.
N1911A/1912A P-Series Power Meters User’s Guide
General Power Meter Functions
2
Procedure
1 Press Acqn softkey to configure a trigger.
2 Select either Sing Trig or Cont Trig .
• Sing Trig is a single shot mode. After triggering, the measurement is
halted, the
symbol is displayed. You can start another
measurement by pressing the
key.
• Cont Trig is a continuos trigger mode. The symbol
displayed.
or
is
3 Press Settings to configure the remaining trigger parameters. The
trigger Settings menu have two pages. Figure 2- 52 shows page one and
Figure 2- 55 shows page two.
Channel A is
Trigger Source
Rising Edge Source
Figure 2-52 Trigger Setting Menu 1 of 2
To help you quickly check the triggering setup, the current settings for all
the trigger parameters are shown with their respective softkey labels.
Source
The current setting is shown below the Source label.
To change the setting press Source and choose Ext or Int .
The trigger source is shown beside the trigger symbol when a
measurement window is configured in single numeric mode. When an
external trigger ( Ext ) is selected, the power meter can be triggered via the
Ext Trig input.
N1911A/1912A P-Series Power Meters User’s Guide
67
2
General Power Meter Functions
NOTE
For N1912A, by pressing Source , you can choose your source through the three
different softkeys: Ext , Ch.A , and Ch.B .
Mode The Mode key is only available when trigger Source Int is selected.
To change the setting press Mode and choose Norm or AutoLvl .
The current setting is displayed below the label. When Norm is selected
you can choose the RF power level transition used as the trigger. The
power meter automatically finds a triggering power level transition when
AutoLvl is selected.
Level Level is only available when Norm trigger mode has been selected.
The current value is shown below the Level label. The minimum power
level you can enter is limited to 40 dB below the maximum sensor power.
To change the setting press Level and use the numeric keypad to enter
the required value in the Trigger Level pop- up window to enter the new
value.
Figure 2-53 Trigger Level pop-up
Complete the entry by pressing dBm .
The current setting is displayed below the Delay label. The delay
time is applied between the trigger event and all the gate start times. This
allows you to time- shift all the gates by the same amount with one setting
change. A delay of up to 1 second can be entered. To enter or change the
setting press Delay and use the numeric keypad to enter the required
value in the Trigger Delay pop- up window to enter the new value.
Delay
68
N1911A/1912A P-Series Power Meters User’s Guide
General Power Meter Functions
2
Figure 2-54 Trigger Delay pop-up
Complete the entry by pressing the required second, millisecond,
microsecond or nanosecond ( s , ms , us or ns ) softkey.
NOTE
The trigger delay time can also be entered or changed in the Trace Display mode when the
Gate Control menu is displayed. See “Setting the Trace Display” on page 118 for further
detail.
Press 1 of 2
to display the second menu page.
Figure 2-55 Trigger setting menu 2 of 2
N1911A/1912A P-Series Power Meters User’s Guide
69
2
General Power Meter Functions
The current setting is displayed below the Slope label and the
or
symbol is displayed in single numeric display mode. + (and ) is
used to generate the trigger from an increasing power level. Similarly, –
(and ) is used to generate the trigger from a decreasing power level. To
change the setting, press Slope to highlight + or – as required.
Slope
Holdoff The current setting is displayed below the Holdoff label. After a
trigger event occurs, the trigger mechanism is disabled for the configured
time period. This allows stable triggering to be achieved even when a
signal has multiple edges, for example, a TDMA signal with non- constant
amplitude modulation. Values up to 400 ms can be configured.
To change the setting press Holdoff and use the numeric keypad to enter
the required value in the Trigger Holdoff pop- up window to enter the new
value.
Figure 2-56 Trigger Holdoff pop-up
Complete the entry by pressing ms , us or ns .
Hysteresis Hysteresis is only available when Norm trigger mode has been
selected. The current setting is displayed below the Hysteresis label. You
can use the hysteresis function to help generate a more stable trigger by
preventing triggering unless the RF power level achieves the trigger level
and the additional hysteresis value. It can be applied to both rising and
falling edge trigger generation. A maximum of 3 dB hysteresis can be
entered.
Rising Edge
When a rising power transition triggers the power meter, the triggering
system is disabled. The power meter does not trigger again if another
rising power transition is presented. The triggering system is re- armed
only when the input power falls below a level equal to the trigger level
minus the configured hysteresis value.
70
N1911A/1912A P-Series Power Meters User’s Guide
General Power Meter Functions
2
Falling Edge
When a falling power transition triggers the power meter, the triggering
system is disabled. The power meter does not trigger again if another
falling power transition is presented. The triggering system is rearmed
only when the input power rises above a level equal to the trigger level
plus the configured hysteresis value.
To change the setting, press Hysteresis and use the numeric keypad to
enter the required value in the Trigger Hysteresis pop- up window to enter
the new value.
Figure 2-57 Trigger Hysteresis pop-up
Complete the entry by pressing dB .
The current setting is displayed below the Output label. A TTL
level high is produced at the rear panel TRIG OUT BNC connector when the
power meter is triggered when On is configured.
Output
To change the setting, press Output to highlight On or Off as required.
N1911A/1912A P-Series Power Meters User’s Guide
71
2
General Power Meter Functions
Setting External Trigger for Normal and Average Power
Measurement
There are two modes featured in peak and average power measurement
• Power sweep mode
• Frequency sweep mode
These modes are used to eliminate the need for lengthy test routines,
while increasing measurement throughput by reducing overhead of
communication with the controller. The sweep feature allows you to make
power measurement by quickly stepping through a series of frequencies or
power levels. Configuration shown in Figure 2- 58 illustrates the triggering
connection required to synchronize power meter measurement to the
power source settings.
Table 2- 5 below shows the power and frequency sweep mode compatibility
in normal and average mode. Measurement averaging and trace display
will be turned OFF in E- Series E9320 and P- Series N1920 power sensors
while performing power or frequency sweep during normal mode.
Table 2-5 Power and frequency sweep mode compatibility table
Sensor
*
NOTE
72
Normal Mode
Average Mode
848x
—
✔
E441x
—
✔
E930x
—
✔
E932x
✔
✔
N848x
—
N192x
✔
✔
✔(emulated*)
Average only mode measurement is calculated based on peak measurement operation
for the P-Series N1920 power sensor.
Auto CAL will be temporary disabled in P-Series N1920 power sensors during power or
frequency sweep.
N1911A/1912A P-Series Power Meters User’s Guide
General Power Meter Functions
2
Table 2- 6 shows the available measurement functions during normal and
average mode when in power or frequency sweep.
Table 2-6 Power and frequency sweep measurement functions table
Measurement functions
Normal Mode
Hold off
✔
—
Trigger delay
✔
—
Measurement averaging
—
✔
Gate setting
✔
—
Channel offset
—
✔
Hysteresis
Measurement types
supported
NOTE
Average Mode
—
Peak, peak-to-average,
average, minimun power
—
Average only
Refer to the P-Series Power Meters Programming Guide for the commands usage details.
Example of command set:
SENSe:BUFFer:MTYPe “PEAK”
Power Sweep Mode
Power sweep is generally used in power level calibration setup where the
frequency is fixed, and the amplitude of the power source signal is swept.
This mode can be used to characterize the flatness, linearity or gain
compression of a device under test.
NOTE
This feature is applicable for 8480 Series, N8480 Series, E-Series E4410, E-Series E9300,
E-Series E9320 or P-Series N1920 sensor when connected.
Procedures
1 Connect sensor to a power source.
2 Connect power meter TRIG OUT to power source TRIG IN using a
BNC cable. The same connection is applied for power source TRIG OUT
to power meter TRIG IN. See Figure 2- 58 on page 84.
N1911A/1912A P-Series Power Meters User’s Guide
73
2
General Power Meter Functions
(optional connection)
TRIG
IN
TRIG
IN
TRIG
OUT
TRIG
OUT
Power Source
Power Meter
Power Sensor
Figure 2-58 TRIG IN and TRIG OUT connection diagram between power meter and power
source.
3 Press
. The Channel Setup screen displays as below.
Figure 2-59 Channel Setup display
NOTE
74
When 8480 Series, N8480 Series, E-Series E4410 or E-Series E9300 sensor is connected,
Sensor Mode is set to AVG only by default.
N1911A/1912A P-Series Power Meters User’s Guide
General Power Meter Functions
NOTE
2
When E-Series E9320 or P-Series N1920 sensor is connected, the default sensor mode is
Normal. User can use this Normal mode to perform power or frequency sweep, or change
the mode to AVG only to perform power or frequency sweep. Refer Table 2-6 on the
differences in measurement functions supported under these two modes.
To change the sensor mode from the default Normal mode to AVG only mode, follow the
instructions below:
• Press
. Use the
and
keys to highlight the Sensor Mode field.
• Press
to display the Sensor Mode pop-up.
Figure 2-60 Sensor Mode pop-up.
• Use the
4 Press
and
keys to highlight the AVG and press
.
. The Trigger menu is displayed.
5 Press Acqn softkey to configure the trigger.
6 Select either Sing Trig or Cont Trig .
• Sing Trig is a single shot mode. After triggering, the measurement is
halted, and the
symbol is displayed. You can start another
measurement by pressing the
key.
• Cont Trig is a continuos trigger mode. The symbol
displayed.
N1911A/1912A P-Series Power Meters User’s Guide
or
is
75
2
General Power Meter Functions
7 Press Settings to configure the remaining trigger parameters. The trigger
Settings menu consists of two pages. Figure 2- 61 shows page 1 and
Figure 2- 62 shows page 2.
External Trigger Source
Figure 2-61 Trigger setting menu 1 of 2
Figure 2-62 Trigger setting menu 2 of 2
8 Press Source and Ext will be automatically enabled.
9 Press 1 of 2 , select Output On to allow a TTL level high to be produced
at the rear panel TRIG OUT BNC port upon the meter completed a
measurement. Refer to note on page 87 for details.
76
N1911A/1912A P-Series Power Meters User’s Guide
General Power Meter Functions
NOTE
2
In both power sweep and frequency sweep mode, the meter TRIG OUT to power source
TRIG IN connection is optional. If this connection was not setup previously, you need to
setup the proper Dwell time. You may choose to setup the Dwell time in the power source
step setting to cater the maximum settling time required by the power meter. However, to
achieve maximum speed in power sweep, this setup is recommended. Once the power
reading is settled, the meter will output a TTL signal at the TRIG OUT to the power source
TRIG IN to trigger the power source to step to the next point.
10 Press Slope and select + or – to set the trigger edge.
11 Set the trigger buffer size by sending SENSE:BUFFer:COUNt
<buffer_size> command to meter using remote interface.
NOTE
Refer to the P-Series Power Meters Programming Guide for the commands usage details.
Example of command set:
SENSE:BUFFer:COUNt 20
NOTE
The power meter can be remotely controlled by LAN, USB and GPIB (IEEE488)
programming interfaces. Refer to P-Series Power Meters Installation Guide for details.
12 Press
or
to setup measurement setting such as
measurement averaging, measurement frequency, offsets, duty cycle and
so forth. Refer to “General Power Meter Functions” on page 29 for the
setup procedures.
13 Send *OPC (OPeration Complete) command to meter to set the
operation complete bit in the Standard Event Status register when all
pending device operations are completed.
14 Set the meter to continuous trigger mode by sending
INITiate:CONTinuous ON command to meter.
15 Configure and set the required power sweep range and step on the
power source accordingly.
16 Set the power source trigger input and trigger output, then start
sweeping.
N1911A/1912A P-Series Power Meters User’s Guide
77
2
General Power Meter Functions
17 Poll the status of the power meter by sending *ESR?. *ESR? will return
a 1 when buffering is completed. Use FETCh? to retrieve all the
buffered measurement.
Example of SCPI commands set
Refer to the following SCPI commands for normal and average mode in
power sweep measurement.
NOTE
Refer to the P-Series Power Meters Programming Guide for the commands usage details.
Normal mode
This feature is applicable for E9320 and N1920 Series power sensor when
connected. Below are examples of SCPI commands when used in normal
mode. Send the SCPI commands below to meter using remote interface.
• SENS:DET:FUNC NORM
• TRIG:SOUR EXT
• SENS:BUFF:COUN 2048
Optional measurement configurations:
• TRIG:DEL 1ms
• TRIG:HOLD 10us
• OUTP:TRIG ON
• SENS:SWE1:OFFS:TIME 100us
• SENS:SWE1:TIME 100us
• INIT:CONT ON
• *OPC
• *ESR?
• FETC?
78
N1911A/1912A P-Series Power Meters User’s Guide
General Power Meter Functions
2
Average mode
This feature is applicable for 8480 Series, N8480 Series, E- Series E4410,
E- Series E9300, E- Series E9320 or P- Series N1920 sensor when connected.
Below are examples of SCPI commands when used in average mode. Send
the SCPI commands below to meter using remote interface.
• SENS:DET:FUNC AVER
• TRIG:SOUR EXT
• SENS:BUFF:COUN 2048
Optional measurement configurations:
• OUTP:TRIG ON
• SENS:MRAT DOUB
• SENS:AVER:COUN 128
• INIT:CONT ON
• *OPC
• *ESR?
• FETC?
N1911A/1912A P-Series Power Meters User’s Guide
79
2
General Power Meter Functions
Frequency Sweep Mode
Frequency sweep is generally used in a frequency response calibration
system where the amplitude is fixed, and the frequency of the power
source signal is swept. This mode can be used to determine the frequency
response of a device under test.
NOTE
This feature is only available when N8480 Series, E-Series E4410, E-Series E9300, E-Series
E9320 or P-Series N1920 sensor is connected.
Procedures
1 Connect sensor to a power source.
2 Connect power meter TRIG OUT to power source TRIG IN using a
BNC cable. The same connection is applied for power source TRIG OUT
to power meter TRIG IN. See Figure 2- 58.
3 Press
NOTE
80
. The Channel Setup displays as shown in Figure 2-59.
When N8480 Series, E-Series E4410 or E-Series E9300 sensor is connected, Sensor Mode
is set to AVG only by default.
N1911A/1912A P-Series Power Meters User’s Guide
General Power Meter Functions
NOTE
2
When E-Series E9320 or P-Series N1920 sensor is connected, the default sensor mode is
Normal. User can use this Normal mode to perform power or frequency sweep, or change
the mode to AVG only to perform power or frequency sweep. Refer Table 2-6 on the
differences in measurement functions supported under these two modes.
To change the sensor mode from the default Normal mode to AVG only mode, follow the
instructions below:
• Press
. Use the
• Press
to display the Sensor Mode pop-up.
• Use the
4 Press
and
and
keys to highlight the Sensor Mode field.
keys to highlight the AVG and press
.
. The Trigger menu is displayed.
5 Press Acqn softkey to configure a trigger.
6 Select either Sing Trig or Cont Trig .
7 Press Settings to configure the remaining trigger parameters. The trigger
Settings menu consists of two pages. Figure 2- 61 shows page 1 and
Figure 2- 62 shows page 2.
8 Press Source and Ext will be automatically enabled.
9 Press 1 of 2 , select Output On to allow a TTL level high to be produced
at the rear panel TRIG OUT BNC port upon the meter completed a
measurement. Refer to note below for details.
NOTE
In both power sweep and frequency sweep mode, the meter TRIG OUT to power source
TRIG IN connection is optional. If this connection was not setup previously, you need to
setup the proper Dwell time. You may choose to setup the Dwell time in the power source
step setting to cater the maximum settling time required by the power meter. However, to
achieve maximum speed in frequency sweep, this setup is recommended. Once the power
reading is settled, the meter will output a TTL signal at the TRIG OUT to the power source
TRIG IN to trigger the power source to step to the next point.
N1911A/1912A P-Series Power Meters User’s Guide
81
2
General Power Meter Functions
10 Press
or
to setup measurement settings such as
measurement averaging, measurement frequency, offsets, duty cycle and
so forth. Refer to “General Power Meter Functions” on page 29 for the
setup procedures.
11 Set the frequency range and step by sending the below commands to
meter using remote interface.
• SENSe:FREQuency:STARt
<start_frequency><frequency_unit>
• SENSe:FREQuency:STOP <stop_frequency><frequency_unit>
• SENSe:FREQuency:STEP <frequency_step_size>
NOTE
Refer to the P-Series Power Meters Programming Guide for the commands usage details.
Example of commands set:
SENSe:FREQuency:STARt 10MHz
SENSe:FREQuency:STOP 500MHz
SENSe:FREQuency:STEP 10
NOTE
The power meter can be remotely controlled by LAN, USB and GPIB (IEEE488)
programming interfaces. Refer to P-Series Power Meters Installation Guide for details.
12 Send *OPC (OPeration Complete) command to meter; to set the
operation complete bit in the Standard Event Status register when all
pending device operations are completed.
13 Set the meter to continuous trigger cycles by sending
INITiate:CONTinuous ON command to meter.
14 Configure and set the required frequency sweep range and frequency
step size of the power source.
15 Set the power source trigger input and trigger output.
16 Set the power source to sweep.
17 Poll the status of the power meter by sending *ESR?. *ESR? will return
a 1 when buffering is completed. Use FETCh? to retrieve all the
buffered measurement.
82
N1911A/1912A P-Series Power Meters User’s Guide
General Power Meter Functions
2
Example of SCPI commands set
Refer to the following SCPI commands set for normal mode and average
mode in frequency sweep measurement.
NOTE
Refer to the P-Series Power Meters Programming Guide for the commands usage details.
Normal mode
This feature is applicable for E9320 and N1920 Series power sensor when
connected. Below are examples of SCPI commands when used in normal
mode. Send the SCPI commands below to meter using remote interface.
• SENS:DET:FUNC NORM
• TRIG:SOUR EXT
• SENS:FREQ:START 50 MHz
• SENS:FREQ:STOP 4 GHz
• SENS:FREQ:STEP 2048
Optional measurement configurations:
• TRIG:DEL 1ms
• TRIG:HOLD 10us
• OUTP:TRIG ON
• SENS:SWE1:OFFS:TIME 100us
• SENS:SWE1:TIME 100us
• INIT:CONT ON
• *OPC
• *ESR?
• FETC?
N1911A/1912A P-Series Power Meters User’s Guide
83
2
General Power Meter Functions
Average mode
This feature is applicable for 8480 Series, N8480 Series, E- Series E4410,
E- Series E9300, E- Series E9320 or P- Series N1920 sensor when connected.
Below are examples of SCPI commands when used in average mode. Send
the SCPI commands below to meter using remote interface.
• SENS:DET:FUNC AVER
• TRIG:SOUR EXT
• SENS:FREQ:START 50 MHz
• SENS:FREQ:STOP 4 GHz
• SENS:FREQ:STEP 2048
Optional measurement configurations:
• OUTP:TRIG ON
• SENS:MRAT DOUB
• SENS:AVER:COUN 128
• INIT:CONT ON
• *OPC
• *ESR?
• FETC?
84
N1911A/1912A P-Series Power Meters User’s Guide
General Power Meter Functions
2
Determine the Right Step to be Set
Number of frequency step can be calculated by using equation below:
Step = fstop – fstart + Interval
Interval
where,
Step = Number of frequency step
fstart = Frequency sweep’s start point
fstop = Frequency sweep’s stop point
Interval = Frequency step size
Example
When fstart = 1 GHz and fstop = 5 GHz with given interval of 0.5 GHz, the
Step should be set to
Step = fstop – fstart + Interval
Interval
= 5 GHz – 1 GHz + 0.5 GHz
0.5 GHz
= 9
N1911A/1912A P-Series Power Meters User’s Guide
85
2
General Power Meter Functions
Setting Measurement Limits
You can configure the power meter to detect when a measurement has
crossed over a predefined upper and/or lower limit value.
Limits are boundaries set for a certain power range and it can be applied
to power, ratio or difference measurement.
Power Meter
Swept Source
Device
Under Test
OUT
OUT
Figure 2-63 Limits checking applications
In this application a swept frequency signal is applied to the input of the
Device Under Test. The power meter measures the output power. The
limits have been set at +4 dBm and +10 dBm. A fail occurs each time the
output power is outside these limits as shown in Figure 2- 64.
Amplitude
Upper Limit Line
Fail
o
+10 dBm
o
o
o
Lower Limit Line
o
o
+4 dBm
o
Fail
Figure 2-64 Limits checking results
86
F
N1911A/1912A P-Series Power Meters User’s Guide
General Power Meter Functions
2
Setting Limits
The power meter can be configured to verify the current measurement in
any measurement line against predefined upper and/or lower limit values.
The range of values that can be set for the upper and lower limits and the
default values depends on the measurement units in the currently selected
measurement line (see Table 2- 7).
Table 2-7 Range of values for window limits
Window
Units
Maximum
Minimum
Default
Maximum
Default
Minimum
dB
+200 dB
–180 dB
60 dB
–120 dB
dBm
+230 dBm
–150 dBm
90 dBm
–90 dBm
%
999.9 X%
100.0 a%
100.0 M%
100.0 p%
W
100.000 XW
1.000 aW
1.000 MW
1.000 pW
Procedure
Set the limits as follows:
NOTE
Ensure you have selected the channel you wish to set up.
1 Press
2 Use the
3 Press
4 Use the
, Meas Select to display the Measurement Setup menus.
and
keys to highlight the Limits: setting field.
to check the Limits: setting field.
key to highlight the Minimum Limits: value field.
N1911A/1912A P-Series Power Meters User’s Guide
87
2
General Power Meter Functions
5 Press
to display the Minimum Limit pop- up.
Figure 2-65 Minimum limit pop-up
6 Use the numeric keys to enter the required value and press dBm .
7 Use the
8 Press
key to highlight the Maximum Limits: value field.
to display the Maximum Limit pop- up.
9 Use the numeric keys to enter the required value and press dBm .
10 Press
NOTE
88
key to close the Measurement Setup screen.
The Limits can be disabled and re-enabled by checking the Limits: setting field.
N1911A/1912A P-Series Power Meters User’s Guide
General Power Meter Functions
2
Checking for Limit Failures
Limit failures are displayed in the appropriate field in the measurement
window on the power meter’s display as shown in Figure 2- 66.
This measurement has failed as the
result is greater than the set limit
level.
This measurement has failed as the
result is less than the set limit level.
Figure 2-66 Limit failures
N1911A/1912A P-Series Power Meters User’s Guide
89
2
General Power Meter Functions
Setting the Measurement Display
Using the gate settings, up to four measurements or a combination of
measurements can be shown on the display. Any of the 4 measurement
display lines can show any of the measurement results from any of the 4
gates, allowing you complete control of the displayed information.
The power meter cannot display all 16 (or 32) measurements
simultaneously.
Average, peak, peak- to- average ratio, and minimum measurements are
made within each gate period generating possible measurement results per
channel as shown in Figure 2- 67.
Gates 1 to 4
Peak
Gate 1
Feed 1
Average
Pk-to-Avg
Feed 2
Peak
Gate 2
Average
Pk-to-Avg
Min
Peak
Gate 3
Average
Pk-to-Avg
Min
Peak
Gate 4
16 measurements per channel
Min
Feed 1
Feed 2
Feed 1
Feed 2
Feed 1
Average
Pk-to-Avg
Feed 2
Min
Figure 2-67 Sixteen measurements per channel
90
N1911A/1912A P-Series Power Meters User’s Guide
General Power Meter Functions
2
Measurement Feeds
(single or combined)
Peak
Gate 1
Single
Feed 1
Average
Feed 1-Feed 2
Pk-to-Avg
Feed 2
Combined
Min
Gate 2
Average
Pk-to-Avg
Min
Peak
Gate 3
Average
Pk-to-Avg
Min
16/32 Measurement Highway
Peak
Feed 1/Feed 2
Peak
Gate 4
Single
Feed 1
Feed 1-Feed 2
Feed 2
Combined
Feed 1/Feed 2
Single
Feed 1
Feed 1-Feed 2
Feed 2
Combined
Feed 1/Feed 2
Single
Feed 1
Average
Pk-to-Avg
Feed 1-Feed 2
Feed 2
Combined
Min
Feed 1/Feed 2
Figure 2-68 Measurement feed example
Each displayed line has a measurement feed. Each measurement feed has
two independent inputs, Feed 1 and Feed 2. The two Feeds, 1 and 2, can
carry any of the 16 measurement results from the 4 gates. (32
measurements from 8 gates in the dual channel N1912A). Only Feed 1 can
be displayed in Single Mode. In Combined Mode, Feed 1 - Feed 2 or Feed
1 / Feed 2 can be displayed.
Numeric Format
Configure a measurement displayed in Single Numeric or Dual Numeric
format as follows:
N1911A/1912A P-Series Power Meters User’s Guide
91
2
General Power Meter Functions
• Press
, Meas Select to select the measurement window or
measurement line you want to configure.
Selected Window/
Measurement
Gate Field
Function Field
Measurement Field
Figure 2-69 Measurement Setup showing single configuration
Single Function Measurement
Figure 2- 69 shows Gate 1 with an average measurement assigned in the
upper measurement line of the lower window. (For single channel power
meter (N1911A), the Channel field will be disabled, as shown in
Figure 2- 69).
NOTE
The gate field is disabled if trigger acquisition is Free Run.
1 Use the
92
,
,
,
, to highlight the Combination function field.
N1911A/1912A P-Series Power Meters User’s Guide
General Power Meter Functions
2 Press
to display the Function pop- up, and use the
to highlight Single.
2
and
Figure 2-70 Function pop-up
3 Press
4 Use the
5 Press
and
to complete the entry.
,
,
,
, to highlight the measurement type field.
to display the Feed Measurement pop- up, and use the
in assign a measurement type.
Figure 2-71 Measurement type pop-up
6 Press
7 Use the
to complete the entry.
,
,
,
N1911A/1912A P-Series Power Meters User’s Guide
, to highlight the Gate field.
93
2
General Power Meter Functions
8 Press
to display the Gate Number pop- up, and use the numeric
keypad to enter the required value in the Gate Number pop- up window.
Figure 2-72 Gating Number pop-up
9 Press Enter to complete the entry.
10 Repeat this process until you have setup all the required gates and
measurements.
11 Press
results.
94
key to complete the setup and display the measurement
N1911A/1912A P-Series Power Meters User’s Guide
General Power Meter Functions
2
Combined Measurement
Figure 2- 73 shows a Combined Measurement configuration; Channel A,
gate 1 peak power minus gate 3 peak power, to be displayed in the lower
measurement line of the lower display window. (For single channel power
meter (N1911A), the Channel field will be disabled, as shown in
Figure 2- 73).
Selected Window/
Measurement
Gate Fields
Function Field
Combination Field
Measurement Fields
Figure 2-73 Measurement Setup showing combined configuration
NOTE
The Gate field is disabled if Trigger Acquisition is Free Run.
1 Use the
,
2 Press
the
,
, to highlight the Combination function field.
to display the Function pop- up (see Figure 2- 70) and use
to highlight Combined.
and
3 Press
4 Use the
,
to complete the entry.
,
,
,
N1911A/1912A P-Series Power Meters User’s Guide
, to highlight the measurement type field.
95
2
General Power Meter Functions
5 Press
to display the Feed Measurement pop- up (see Figure 2- 71)
and use the
6 Press
7 Use the
and
in assign a measurement type.
to complete the entry.
,
,
,
, to highlight the Gate field.
8 Press
to display the Gate Number pop- up, see Figure 2- 72, and
use the numeric keypad to enter the required value in the Gate Number
pop- up window.
9 Press Enter to complete the entry.
10 Repeat this process until you have setup all the required gates and
measurements.
11 Press
results.
key to complete the setup and display the measurements
Figure 2-74 Measurement example display
96
N1911A/1912A P-Series Power Meters User’s Guide
General Power Meter Functions
2
Scaling the Analog Display
NOTE
Ensure you have highlighted an Analog window.
Use the
,
, or
keys to select the analog measurement window.
Press dBm , mW , uW , or nW , to complete the entry.
Configure a measurement displayed in Analog
1 Press
format as follows:
, Anlg Mtr Scaling to display the Analog Scaling softkeys.
The Max and Min scale values are shown on the analog display and
adjacent to the softkey labels.
2 Press Max to display the Meter Maximum pop- up.
Figure 2-75 Maximum limit pop-up
3 Use the numeric keys to enter the required value and press dB .
4 Press Min to display the Meter Minimum pop- up.
Figure 2-76 Minimum limit pop-up
5 Use the numeric keys to enter the required value and press dB .
N1911A/1912A P-Series Power Meters User’s Guide
97
2
General Power Meter Functions
Tip If you have selected linear scaling for the analog measurement and
the units you require are beyond the range of the displayed menu, an
additional menu is available. When the pop- up is displayed, you can press
1 of 2 to access the increment/decrement multiplier menu.
Press these keys to select the units required
Figure 2-77 Increment and decrement multiplier
Use the Increment Multiplier or Decrement Multiplier
units.
to display the required
Press the units softkey ( xW ) to complete the entry.
98
N1911A/1912A P-Series Power Meters User’s Guide
General Power Meter Functions
2
Recorder Output
The rear panel Recorder Output connectors (1 and 2) produce a dc
voltage that corresponds to the power level in Watts of the channel
depending on the measurement mode. This dc voltage ranges from 0 to
+1 Vdc. The output impedance is typically 1 kΩ. Channel and display
offsets, and duty cycle have no effect on the Recorder Outputs.
For example, the Recorder Outputs can be used to:
• Record swept measurements
• Level an output from a source using external leveling
• Monitor the output power
To access the Recorder menu press
, and enable Rec o/p. This
allows you to switch the Recorder Output signal either on or off. The
Max Power and Min Power softkeys allow you to scale the power levels to
represent the 1 Vdc maximum and 0 Vdc minimum output voltage of the
Recorder Output.
Procedure
Set the recorder output as follows:
NOTE
Ensure you have selected the channel you want to set up.
1 Press
2 Use the
3 Press
, Meas Select
and
to display the Measurement Setup menus.
keys to highlight the Rec o/p: setting field.
to reveal the Recorder option menu.
N1911A/1912A P-Series Power Meters User’s Guide
99
2
General Power Meter Functions
4 Use the
and
keys to highlight the option you require.
• The N1911A has only two options, On or Off.
• The N1912A have three options: 1, 2 or Off.
5 Press
6 Use the
7 Press
.
key to highlight the Recorder Minimum: value field.
to display the Recorder Minimum pop- up.
Figure 2-78 Recorder Minimum pop-up
8 Use the numeric keys to enter the power level you want to generate a 1
Vdc output in the Recorder Maximum pop- up and press dBm .
9 Use the
10 Press
key to highlight the Recorder Maximum: value field.
to display the Recorder Maximum pop- up.
Figure 2-79 Recorder Maximum pop-up
100
N1911A/1912A P-Series Power Meters User’s Guide
General Power Meter Functions
2
11 Use the numeric keys to enter the power level you want to generate a 0
Vdc output in the Recorder Minimum pop- up and press dBm .
12 Press
key to close the Measurement Setup screen.
NOTE
The recorder output can be disabled and re-enabled by checking the Rec o/p: setting field.
NOTE
The highest power you are going to measure is used to determine the value which you
should set for the Recorder Output maximum setting. For example, if you are measuring a
power less than 1 mW and greater than 100 μW, then set the recorder maximum value to
1 mW.
Table 2-8 Ranges of recorder output setting
Log
50
40
30
20
10
0
Lin
100 W
10 W
1W
100 mW
10 mW
1 mW
Log
–10
–20
–30
–40
–50
–60
Lin
100 mW
10 mW
1 mW
100 nW
10 nW
1 nW
N1911A/1912A P-Series Power Meters User’s Guide
101
2
General Power Meter Functions
Tip If you have selected linear scaling for the recorder output and the
units you require are beyond the range of the displayed menu, an
additional menu is available. When the pop- up is displayed, you can press
1 of 2 to access the increment/decrement multiplier menu.
Press these keys to select the units required
Figure 2-80 Increment and decrement multiplier
Use the Increment Multiplier or Decrement Multiplier to display the required
units. Press the units softkey ( xW ) to complete the entry.
N1911A/N1912A Option H02
NOTE
102
N1911A/N1922A Option H01 replaces the recorder output on the rear panel with video
output. The video output is the direct signal output detected by the sensor diode, with no
correction applied. The video output provides a DC voltage proportional to the measured
input power through a BNC connector on the rear panel. The DC voltage can be displayed
on an oscilloscope for time measurement. The video output impedance is 50 Ω..
N1911A/1912A P-Series Power Meters User’s Guide
General Power Meter Functions
2
Figure 2-81 Measurement example for Option H02
Measurement example for Option H02
For this example, N1912A P- Series power sensors, MXG N5182A signal
generator, and Infiniium 54832D oscilloscope will be used.
1 Connect the power sensor input to the RF input of the signal generator.
2 Connect the video output of the power meter (Option H02) to the
channel 1 of the oscilloscope with a BNC cable.
3 Generate an RF Multitone waveform from the signal generator.
4 Set the oscilloscope to Auto Trigger mode to capture the waveform.
Figure 2-82 Example screenshot of the RF Multitone waveform
N1911A/1912A P-Series Power Meters User’s Guide
103
2
General Power Meter Functions
Saving and Recalling Power Meter States
To reduce repeated setup sequences, you can save a maximum of ten
power meter states in the non- volatile memory.
The save/recall functions are part of the Sys/Inputs menu, accessed by
pressing the
NOTE
key.
Your power meter has measurement configurations suitable for common wireless
communication and radar (pulse) formats already saved as Instrument Presets. These
require P-Series or E-Series E9320 power sensors.
To save a measurement setup:
1 Press
, Save/Recall
in Figure 2- 83.
to display the Save/Recall screen as shown
Figure 2-83 Save/Recall screen
2 Using the
and
keys, select an available name from the displayed
list. To change the name of a register - See Chapter 2, “Editing a
Register’s Name,” starting on page 105, otherwise press Save .
104
N1911A/1912A P-Series Power Meters User’s Guide
General Power Meter Functions
2
3 The power meter prompts you to press Confirm to proceed.
Figure 2-84 Save confirm pop-up
Editing a Register’s Name
1 If you have not already done so, press
2 Use the
and
, Save/Recall .
keys to select the required register and press
Edit Name . The selected name is displayed in a pop- up window. Modify
this as required:
Figure 2-85 File name pop-up
3 Use
and
keys to modify the character on which the cursor is
currently positioned.
4 Use
or
to move to other characters.
5 Use Insert Char and Delete Char
as required.
6 To confirm your choice press Enter .
N1911A/1912A P-Series Power Meters User’s Guide
105
2
General Power Meter Functions
Recalling a Measurement Setup
1 Press
2 Use the
Recall .
, Save/Recall .
and
keys to select the required register and press
The Recall key is disabled (grayed out) when an unused register is
selected.
Figure 2-86 Recall pop-up
3 Press Confirm .
106
N1911A/1912A P-Series Power Meters User’s Guide
General Power Meter Functions
2
Zeroing and Calibrating the P-Series Sensor
This section describes how to zero and calibrate the power meter when
using a P- Series wideband power sensor.
Zeroing
Zeroing adjusts the power meter for a zero power reading on each power
meter channel and P- Series sensor combination. This is achieved without
removing it from a power source. The power meter can be set to
automatically zero on- the- fly while you are using it. Alternatively, you can
perform a zero at your preference. During zeroing a wait symbol is
displayed.
Figure 2-87 Zeroing pop-up
When the P- Series power sensor is initially connected to the power meter,
it automatically performs a Zero and Calibration routine.
When to Zero?
Zeroing of the power meter is recommended:
• When a 5 oC change in temperature occurs.
• Every 24 hours.
• Prior to measuring low level signals. For example, 10 dB above the
lowest specified power for your power sensor.
Automatic Zero
The automatic zero can be enabled as follows:
N1911A/1912A P-Series Power Meters User’s Guide
107
2
General Power Meter Functions
• Press
, 1 of 2 and toggle the Auto Zero A
to On.
The Zeroing pop- up is displayed when a zero occurs.
NOTE
When you are performing measurements, this may cause delays in obtaining results.
During this time, it is recommended to disable the automatic zeroing.
Manual Zeroing
To manually zero the power meter and sensor:
• Press
and the channel Zero softkey.
The Zeroing pop- up is displayed.
NOTE
On dual channel meters you can zero each channel independently or both channels
sequentially by pressing the Zero softkey - choosing Zero A , Zero B or Zero Both
Calibration
Calibration sets the gain of each power meter channel and P- Series sensor
combination. This is achieved without the need to connect it to the
1.0 mW Power Reference. The power meter can be set to automatically
calibrate on- the- fly while you are using it. Alternatively, you can perform
the calibration manually. The reference calibration factor is automatically
set for all P- Series power sensors.
During calibration, the wait symbol is displayed.
Figure 2-88 Calibration wait pop-up
108
N1911A/1912A P-Series Power Meters User’s Guide
General Power Meter Functions
2
Offset and relative settings are ignored during calibration.
Manual Calibration
To manually calibrate the power meter and sensor combination:
and the channel Cal softkey to start the calibration
1 Press
routine.
The Calibrating pop- up is then displayed.
NOTE
For N1912A, you calibrate each channel independently by pressing the Cal softkey by
choosing Cal A or Cal B .
Tip You can reduce the steps required to carry out the manual zero and
calibration procedure as follow:
and Zero + Cal . (For dual channel meters, press
Press
Zero + Cal
Zero + Cal A
,
or Zero + Cal B
N1911A/1912A P-Series Power Meters User’s Guide
as required).
109
2
General Power Meter Functions
Zero/Cal Lockout
The Zero/Cal Lockout facility can help you make sure that a measurement
cannot be made until the power meter and sensor combination has been
zeroed and calibrated.
When the Zero/Cal Lockout facility is enabled and a sensor is initially
connected, the message Please Zero and Cal is displayed.
Figure 2-89 Please zero and calibrate window
When you zero the sensor the message changes to Please Cal. If you
calibrate the sensor before zeroing it, the message changes to Please Zero.
Dual channel meters display channel specific messages when a sensor is
connected. The Zero/Cal Lockout configuration is applied to both channels
- it cannot be applied to one channel only.
You can enable and disable the Zero/Cal Lockout facility from the System
menu or the Cal menu as follow:
Press
, 1 of 2 , Must Cal Off or On .
Similarly,
press
110
, 1 of 2 , Must Cal Off or On .
N1911A/1912A P-Series Power Meters User’s Guide
General Power Meter Functions
2
Presetting the Power Meter
This section details the power meter’s preset conditions.
Press the
to display the preset options as shown in Figure 2- 90.
Figure 2-90 Preset display options
The remote addresses, the data stored in the sensor calibration tables, the
calibration table selected, and the zeroing and calibration data are not
affected by a preset.
For presetting with E- Series E9320 power sensors, refer to Table 2- 9.
N1911A/1912A P-Series Power Meters User’s Guide
111
2
General Power Meter Functions
Table 2-9 Preset compatibility matrix for E-Series E9320 power sensor
NOTE
112
Preset
Compatible E-Series E9320 Sensors
GSM900
E9321A/E9322A/E9323A/E9325A/E9326A/E9327A
EDGE
E9321A/E9322A/E9323A/E9325A/E9326A/E9327A
NADC
Bluetooth
E9321A/E9322A/E9323A/E9325A/E9326A/E9327A
E9322A/E9323A/E9326A/E9327A
cdmaOne
E9322A/E9323A/E9326A/E9327A
W-CDMA
E9323A/E9327A
cdma2000
E9323A/E9327A
iDEN
E9321A/E9322A/E9323A/E9325A/E9326A/E9327A
Radar
E9321A/E9322A/E9323A/E9325A/E9326A/E9327A
MCPA
E9321A/E9322A/E9323A/E9325A/E9326A/E9327A
802.11a
Not applicable
802.11b/g
Not applicable
1*EV-DO
E9321A/E9322A/E9323A/E9325A/E9326A/E9327A
1*EV-DV
E9321A/E9322A/E9323A/E9325A/E9326A/E9327A
TD-SCDMA
E9321A/E9322A/E9323A/E9325A/E9326A/E9327A
DVB
E9323A/E9327A
HyperLan2
Not applicable
WIMAX
E9323A/E9327A
HSDPA
E9323A/E9327A
DME
E9323A/E9327A
DME-PRT
E9323A/E9327A
LTE
E9323A/E9327A
For all preset states, total of two windows are displayed.
N1911A/1912A P-Series Power Meters User’s Guide
General Power Meter Functions
2
Setting the Cable Short/Long
When connecting the power sensor with any Agilent power sensor cable
with length of 10 m (32 ft) and above, you are required to change the
cable setting from Short (default setting) to Long, or an error will occur
when the power sensor is connected.
Short
This is the default setting and for sensor cable length less than or equal to
10 m (32 ft).
Long
This setting is for sensor cable length more than 10 m (32 ft). The
maximum supported sensor cable length is 31 m (100 ft).
To access the cable setting,
1 Press
, 1 of 2
and select Service .
2 In the Service menu, press 1 of 2 and select Cable Short/Long to toggle
between the short or long cable options.
The LCB indicator will appear in blue at the bottom of the display to
indicate that the long cable option is selected as shown in Figure 2- 91.
Figure 2-91 Short/long cable option
N1911A/1912A P-Series Power Meters User’s Guide
113
2
General Power Meter Functions
THIS PAGE HAS BEEN INTENTIONALLY LEFT BLANK.
114
N1911A/1912A P-Series Power Meters User’s Guide
N1911A/1912A P-Series Power Meters
User’s Guide
3
Using P-Series Power Sensor
Introduction 116
Configuring a Power Measurement 117
Setting the Trace Display 118
This chapter describes how to use your P-Series power sensors (N1921A, N1922A,
N1923A[1], N1924A[1]) with your P-Series power meters.
[1] The N1923/24A power sensors can be used with the P-Series power meters but there will be
some compromise on the rise/fall time measurement capability.
Agilent Technologies
115
3
Using P-Series Power Sensor
Introduction
The P- Series wideband power sensor’s mode of operation is optimized to
measure the peak and average power of pulsed or modulated signals with
a wide bandwidth.
The power meter automatically recognizes a P- Series wideband power
sensor when it is connected. The sensor’s calibration data, characterizing
the sensor output versus input power, frequency and temperature, is
automatically read by the power meter. After the sensor’s data is read, the
power meter automatically performs a zero and calibration, this process is
described in “Zeroing and Calibrating the P- Series Sensor” on page 107.
The power meter and P- Series wideband power sensor continuously
sample the RF signal at a 100 mega- samples per second. Similarly, the
dual channel meter samples both channels at the same rate.
The instantaneous power of an RF signal can be detected with up to
30 MHz of video[1] bandwidth (modulation bandwidth).
The triggering methods used by the system (power meter and sensor)
enable the continuous measurement of modulated signals or single events.
A trigger can be taken from a rising or falling edge of an RF signal pulse
or controlled externally.
NOTE
Maximum dynamic range is related to the maximum sensor bandwidth. Refer to the
documentation supplied with your P-Series wideband power sensor for specification
information.
[1]The term video is applied to a signal that has been amplitude
demodulated from an RF carrier, but contains components in the RF
part of the spectrum. For a power meter it refers to the output of
the sensor diodes.
116
N1911A/1912A P-Series Power Meters User’s Guide
Using P-Series Power Sensor
3
Configuring a Power Measurement
While the P- Series power meter may at first seem complex, configuring a
measurement and displaying the results can be quickly achieved.
You can configure the required measurements using the data entry from
the channel setup gate and trace menus.
However, it is easier using the trace display’s Gate Control and Trace Control
menus to configure your initial set up, as it is a more interactive process
and may require less iterations between channel, triggering, gate, and
display functions to make a measurement.
Before configuring the measurements, you should have some information
about the signal you want to measure. For example, the following
information can help you quickly establish stable triggering and reliable
measurement data:
• The Center Frequency (CF)
• The bandwidth of any modulating signal
• The expected maximum and minimum power levels
• Timing information for any pulsed signals
N1911A/1912A P-Series Power Meters User’s Guide
117
3
Using P-Series Power Sensor
Setting the Trace Display
The P- Series power meter is optimized to operate in the trace display
mode when measuring a pulsed signal.
The swiftest method to get the power meter into a trace display is
described in the following procedure:
NOTE
The procedure assumes you are starting from a default preset.
1 Connect the power sensor to the power meter and connect it to the
power source
2 Set the Channel Frequency
3 Set the Trigger to Continuous
4 Set the Display to Trace
5 Expand window and use the Gate control and Trace control menus to set
the gate markers, trigger delay, and scale.
NOTE
You can return to other menus later to add more accuracy on the measurement, for
example, Channel Setup, to set the measurement average, the video average and the
bandwidth of a modulating signal.
6 When you are satisfied with the configuration you may want to save it
for future use. See “Saving and Recalling Power Meter States” on
page 104 for further information.
118
N1911A/1912A P-Series Power Meters User’s Guide
Using P-Series Power Sensor
3
Step 1. Connecting the Power Sensor
When you initially connect a P- Series wideband power sensor to the
power meter, the sensor’s calibration data is automatically read by the
power meter. After the sensor’s data is read, the power meter
automatically performs a zero and calibration, see “Zeroing and Calibrating
the P- Series Sensor” on page 107 for further information.
Connect the sensor to the power source.
Step 2. Setting the Channel Frequency
• Press
. The Channel Setup screen is displayed. If using an
N1912A, select the channel you want to configure.
Use the
,
,
, and
keys to highlight the frequency field. Press
to configure the setting. See “Setting the Measurement
Frequency” on page 32 for further information.
Figure 3-92 P-Series sensor default channel setup
NOTE
By default the sensor mode is set to Normal, users are allowed to change to AVG only
mode whereby all the peak power measurement functions will be disabled.
When you have completed the procedure you can return to this menu later
to add more accuracy to the measurement.
N1911A/1912A P-Series Power Meters User’s Guide
119
3
Using P-Series Power Sensor
Step 3. Setting the Trigger
To use the measurement gates the power meter must be triggered.
A trigger can be taken from a rising or falling measured power level or
controlled externally using the Ext Trig input.
• Press
. The Trigger menu is displayed.
The trigger status is displayed below the Acqn label in the Trigger
menu. Press the Acqn softkey and select Cont Trig to configure
continuous triggering.
When you have completed the procedure you may return to the Trigger
menu later to add more accuracy to the remaining trigger parameters,
to help you achieve a stable and reliable trigger.
Step 4. Setting the Display to Trace
Using trace display provides a visual representation of the signal of
interest.
• Press
, Disp Type , Trace to display the Trace window.
Figure 3-93 Trace display in dual channel power meter
120
N1911A/1912A P-Series Power Meters User’s Guide
Using P-Series Power Sensor
3
• Use the
,
, or
keys to select a measurement window.
Choose the type of display you require from the menu.
Step 5. Expanding the Trace Display
Expanding the trace to display a Single Enlarged Window provides a more
detailed visual representation of the signal of interest and display of the
measured results. Figure 3- 94 is an example of this display. This display
type also provides a visual method of setting up the gate, trigger delay,
and trace controls.
Use the
key to configure the display from two rectangular windows
to a single enlarged window, or a full screen display by pressing
repeatedly. The display style is applied to the currently highlighted
window.
Figure 3-94 Trace display in single enlarged window
NOTE
When you alter a parameter in another menu, you are returned to a two window
display. Use the
use the
,
, or
keys to highlight the trace measurement window and
key to enlarge the display.
N1911A/1912A P-Series Power Meters User’s Guide
121
3
Using P-Series Power Sensor
NOTE
If the bandwidth of a modulated signal is unknown, you may discover that during the set up
process, a power sensor of lesser or greater bandwidth is required.
After you have completed this initial set up, you can, if required, return to
the following setup to improve your measurement results:
• The Channel Setup to configure any averaging and offsets.
• The Trigger setup to configure any additional setting there.
• The Meas Setup to configure any additional setting there.
Gate Control in a Single Enlarged Window
When you initially display a Single Enlarged Window, the Gate Control menu
is available. Setting the gate features are described in greater detail in
“Setting Measurement Channel Gates” on page 57. However, the following
sections are to give you an overview of the control and their impact on
the displayed results.
Gate 1 Active
Active Marker
Marker 1 Active
Figure 3-95 Trace display with gate control menu
Gate Pressing Gate scrolls through the 4 gates available for each channel.
The gate displayed is highlighted below the Gate softkey. It is also
displayed in the channel/gate annotation in the top left of the screen.
122
N1911A/1912A P-Series Power Meters User’s Guide
Using P-Series Power Sensor
3
Select Pressing Select Mrks Tgdel displays the gate markers or trigger
markers.
When Mrks is selected, Markers 1 and 2 indicate the start and
end points of the selected measurement gate. Pressing Marker toggles
between the two markers, the highlighted marker is the currently active
Markers
marker. Use the
the display.
and
keys to move the markers left or right across
The tables on the lower left of the screen show the time (Time:) and the
instantaneous power level (Pow:) of the markers at their configured points.
The table highlighted with the green border represents the active marker,
also highlighted in green. A negative time value indicates a measurement
before the trigger point. (See Figure 3- 95).
NOTE
Gate timing parameters are all related to your chosen trigger point. This may be different
from the timing of the triggering event if you have configured a trigger delay.
Trigger Delay Value
Figure 3-96 Trace display with trigger delay menu
TgDel When TgDel is selected you can adjust the trigger delay. The
display changes to remove the gate markers and displays the trigger
marker(s). The
indicates when the trigger event occurs, whilst
shows
the delayed trigger point. When the two points coincide, only the
N1911A/1912A P-Series Power Meters User’s Guide
123
3
Using P-Series Power Sensor
trigger is shown.
The configured value is displayed below the Trig Delay softkey. This value
is shown in Figure 3- 96.
To indicate an off- screen trigger event,
off- screen trigger point,
is displayed.
NOTE
is displayed. To indicate an
Your chosen trigger point is used as the reference point for the timing of all the
measurement gates.
Trig Delay The trigger delay value is shown below the Trig Delay softkey.
You configure the trigger delay by pressing Trig Delay and entering a
numeric value in the pop- up window.
Pressing Select
NOTE
highlights Mrks to display the trace markers again.
You can also setup the trigger delay in the Trigger menu, by pressing Settings , Delay and
entering a value in the pop-up window.
Trace Control Press Trace Control
to display the Trace Control menu. Setting
the trace features are described in greater details in “Setting up the
Channel Trace” on page 62.
124
N1911A/1912A P-Series Power Meters User’s Guide
Using P-Series Power Sensor
3
Gate 2 Active
Rising Edge
Falling Edge
Trace Setting
Duty Cycle
Pulse Width
Pulse Repetitive Frequency
Pulse Period
Figure 3-97 Trace display with trace control menu
The fields on the lower left of the screen are the X and Y trace setup
fields. Using the
or
value. (See Figure 3- 97)
keys you can highlight the item and change its
The table on the lower right of the screen shows the eight automatic time
measurements performed on the first complete captured pulse after the
trigger. The eight measurements are rise time, fall time, time to positive
occurrence, time to negative occurrence, pulse width, pulse period (pulse
repetitive interval), pulse repetitive frequency and duty cycle.
The current settings of the X and Y scale are displayed on the reporting
line above both tables.
NOTE
If you want to view the trace in linear mode, the Trace Setup is the only location where you
can change the Y-scale units from dBm to Watts; otherwise the default unit is in logarithmic.
Gate Control Press Gate Control to display the Gate Ctrl menu. Setting the
gate features are described in greater details in “Gate Control in a Single
Enlarged Window” on page 122”.
N1911A/1912A P-Series Power Meters User’s Guide
125
3
Using P-Series Power Sensor
Viewing the Results in a Full Screen Window
Use the
key to display the trace in a full screen window display.
This provides a better resolution on the display. You can press Trace Meas
or Gate Meas to display the results as set in Single Enlarged Window mode.
The current settings of the X and Y scale are displayed on the reporting
line above
the results. You need to toggle the
displayed.
key to allow the softkeys to be
Pulse Period
Scale Settings
Rising Edge
Falling Edge
Pulse Repetitive Frequency
Pulse Width
Duty Cycle
Figure 3-98 Trace display in full screen
126
N1911A/1912A P-Series Power Meters User’s Guide
Using P-Series Power Sensor
3
Improving the Accuracy with Additional Settings
You can now return to the setup menus and adjust the default setting to
obtain greater measurement accuracy.
Channel Setup
• Press
. The Channel Setup screen is displayed. If using an
N1912A, select the channel you want to configure.
Figure 3-99 P-Series power sensor default channel setup
NOTE
For E-Series E9320 power sensors range settings, only UPPER and LOWER ranges are
available in Normal and Triggered mode.
Use the
,
,
, and
keys to highlight the setting field and press
to configure the setting. For further detail on these settings, refer
to the appropriate sections.
• Meas Avg: “Setting Measurement Averaging” on page 49
• Video Avg: “Setting the Video Averaging” on page 52
• Step Detect: “Step Detection” on page 51
N1911A/1912A P-Series Power Meters User’s Guide
127
3
Using P-Series Power Sensor
• Video B/W: “Setting the Video Bandwidth” on page 54
Setting Offsets
Press Offsets . The Offsets Setup screen is displayed.
Figure 3-100Channel offset display
Use the
,
,
, and
keys to highlight any parameters you want to
change. Press
to configure the required settings. For further detail
on setting these, refer to the appropriate section.
• Offset: “Setting Channel Offsets” on page 39
• FDO Table: “Setting Frequency Dependent Offsets” on page 42
Trigger Setup
Press
. The Trigger menu is displayed.
The trigger status is displayed below the Acqn label in the Trigger menu.
Press the Settings softkey and add more accuracy to the remaining trigger
parameters, for example, hold- off and hysteresis, to help you achieve a
stable and reliable trigger. Hence, this ensures that the gates you have set
up are capturing the required signal information. See Chapter 2, “Setting
128
N1911A/1912A P-Series Power Meters User’s Guide
Using P-Series Power Sensor
3
the Trigger,” starting on page 66 for further information.
Measurement Setup
. The Measurement Setup menu is displayed.
Press
Use the
,
,
, and
keys to highlight the setting field and press
to configure the setting.
When you have configured the measurements gates, you can assign the
measurement feed and display the results in numeric formats. For
example, dual numeric display with Gate 1 peak measurement minus Gate
3 peak measurement. Also, from this menu you can add offsets and
measurement limits. For further detail on these settings, refer the
appropriate section.
• Feed1/2 “Setting the Measurement Display” on page 90
• Offset “Setting Display Offsets” on page 41
• Limits “Setting Measurement Limits” on page 86
Display
Press
. The Display Form menu is displayed.
Choose the display format to present the measurements results. The
options, other than trace, are as follows:
Single Numeric If you need to configure the numeric format when using a
P- Series sensor, refer to “Numeric Format” on page 91 for more details.
Dual Numeric If you need to configure the numeric format when using a
P- Series sensor, refer to “Numeric Format” on page 91 for more details.
Analog If you need to configure the analog format when using a P- Series
sensor refer to “Scaling the Analog Display” on page 97 for more details.
N1911A/1912A P-Series Power Meters User’s Guide
129
3
Using P-Series Power Sensor
THIS PAGE HAS BEEN INTENTIONALLY LEFT BLANK.
130
N1911A/1912A P-Series Power Meters User’s Guide
N1911A/1912A P-Series Power Meters
User’s Guide
4
Using E9320 E-Series Power Sensors
Introduction 132
Power Meter Configuration 134
Configuring a Peak Power Measurement 135
Measurement Accuracy 136
Setting the Trace Display 138
This chapter describes how to use your E9320 E-Series power sensors with P-Series power
meter.
Agilent Technologies
131
4
Using E9320 E-Series Power Sensors
Introduction
The E9320 E- Series power sensors have dual modes of operation.
• The normal mode is optimized for a wider bandwidth but with reduced
dynamic range. The instantaneous power of an RF signal can be
detected with, depending on the sensor type, up to 5 Mhz of video
bandwidth (modulation bandwidth). Use this mode to measure the peak
and average power of pulsed or modulated signals.
• The average- only mode is optimized for high accuracy and wide
dynamic range. Use this mode to measure the average power of signals
below the dynamic range of normal mode.
NOTE
The term ‘video’ is applied here to a signal that has been amplitude demodulated from an
RF carrier but contains components in the RF part of the spectrum. For a power meter it
refers to the output of the sensor diodes in normal mode.
In normal mode the P- Series power meters and E9320 E- Series power
sensors continuously sample the RF signal at a 20 Msamples/s rate. A
trigger can be taken from a rising or falling edge of an RF signal pulse or
controlled externally via GPIB or TTL input.
Table 4-10 Sensor Bandwidth
Video Bandwidth Setting
Sensor
Low
Medium
High
Off
E9321A
E9325A
30 kHz
100 kHz
300 kHz
300 kHz*
E9322A
E9326A
100 kHz
300 kHz
1.5 MHz
1.5 MHz*
E9323A
E9327A
300 kHz
1.5 MHz
5 MHz
5 MHz*
* The Low, Medium, and High settings provide flat filter responses with very sharp cutoff points by
applying digital signal processing techniques. The Off setting removes all signal conditioning. Refer
to Figure 4-101.
132
N1911A/1912A P-Series Power Meters User’s Guide
Using E9320 E-Series Power Sensors
NOTE
4
Maximum dynamic range is related to the maximum sensor bandwidth. Please refer to the
documentation supplied with your E-Series E9320 power sensor for specification
information.
Figure 4- 101 shows the filter shapes associated with the E9323A and
E9327A power sensors
Amplitude
E9323A and E9327A sensors
0
–3.5 dB
Approx
300 kHz 1.5 MHz
5 MHz
Frequency
Meter B/W
Low
Setting
Med
High
Off
Figure 4-101 Bandwidth Filter Shapes
N1911A/1912A P-Series Power Meters User’s Guide
133
4
Using E9320 E-Series Power Sensors
Power Meter Configuration
The P Series power meters automatically recognize an E- Series E9320
power sensor when it is connected. The sensor calibration data,
characterizing the sensor output versus input power, frequency, and
temperature, is automatically read by the power meter.
Default Channel Setup
When an E- Series E9320 power sensor is connected the following Channel
Setup is automatically configured. Carrying out a Preset returns the power
meter to this configuration.
Figure 4-102 E–Series E9320 power sensor default channel setup
134
N1911A/1912A P-Series Power Meters User’s Guide
Using E9320 E-Series Power Sensors
4
Configuring a Peak Power Measurement
While the P- Series power meter may at first seem complex, configuring a
measurement and displaying the results are quickly achieved using trace
markers or by following a step- by- step process of numeric data entry.
Before configuring the measurements, you should have some information
about the signal you want to measure. The following information for
example, can help you quickly establish stable triggering and reliable
measurement data:
• the Center Frequency (CF)
• the bandwidth of any modulating signal
• the expected maximum and minimum power levels
• timing information for any pulsed signals
You can configure the required measurements using numeric data entry
from the keypad or remote interface or, by manually positioning trace
markers using the front panel controls.
Setting up the power meter using the trace markers is a more interactive
process and may require more iterations between channel, triggering, gate,
and display functions to make a measurement. However, it is ideally suited
to measuring an unknown signal.
TIP
NOTE
If pulsed signal timing information is unavailable or incomplete,
you may prefer to use the trace and marker functions to
configure your measurement.
You must select continuous or single triggered mode to enable the use of trace markers.
N1911A/1912A P-Series Power Meters User’s Guide
135
4
Using E9320 E-Series Power Sensors
Measurement Accuracy
Power sensors have small errors in their response over frequency. The
response of each sensor is measured during manufacture (and during
periodic calibration). With E- Series power sensors, the resulting frequency
compensation information is written into Electrically Eraseable
Programmable Read Only Memory (EEPROM). This allows the frequency
and calibration data to be downloaded to the power meter automatically.
Using calibration factors enables you to achieve improved measurement
accuracy. This section describes making continuous wave measurements
using the E9320 E- Series power sensors.
Making a measurement requires the following steps:
1 Zero and calibrate the power meter/sensor combination.
2 Set the frequency for the signal you want to measure.
3 Make the measurement.
Procedure
First zero and calibrate the power meter/sensor combination.
1 Ensure the power sensor is disconnected from any signal source.
2 Press
displayed.
and the channel Zero softkey. The Zeroing pop- up is
3 Connect the power sensor to the POWER REF output.
4 Press
and the channel Cal softkey to start the calibration
routine. The Calibrating pop- up is then displayed.
136
N1911A/1912A P-Series Power Meters User’s Guide
Using E9320 E-Series Power Sensors
NOTE
4
You can reduce the steps required to carry out the zero and calibration procedure as
follows:
1 Connect the power sensor to the POWER REF output.
2 Press
Zero + Cal
and Zero + Cal
, Zero + Cal A
. (For dual channel meters, press
or Zero + Cal B
as required).
Now set the frequency of the signal you want to measure. The power
meter automatically selects the appropriate calibration factor.
5 Press
6 Use the
. On dual channel meters select the required channel.
and
keys to highlight the Frequency value field and press
to display the Frequency pop- up. Use the numeric keypad to
enter the required value in the Frequency pop- up window.
Figure 4-103Frequency pop-up
7 Confirm your choice by pressing MHz or GHz .
8 Press
key to close the Channel Setup screen.
Now make the measurement.
9 Connect the power sensor to the signal to be measured.
The corrected measurement result is displayed.
N1911A/1912A P-Series Power Meters User’s Guide
137
4
Using E9320 E-Series Power Sensors
Setting the Trace Display
The P- Series power meter is optimized to operate in the trace display
mode when measuring a pulsed signal.
The swiftest method to get the power meter into a trace display is
described in the following procedure:
NOTE
The procedure assumes you are starting from a default preset.
1 Connect the power sensor to the power meter and connect it to the
power source
2 Set the Channel Frequency
3 Set the Trigger to Continuous
4 Set the Display to Trace
5 Expand window and use the Gate control and Trace control menus to set
the gate markers, trigger delay, and scale.
NOTE
You can return to other menus later to add more accuracy on the measurement, for
example, Channel Setup, to set the measurement average, the video average and the
bandwidth of a modulating signal.
6 When you are satisfied with the configuration you may want to save it
for future use. See “Saving and Recalling Power Meter States” on
page 104 for further information.
138
N1911A/1912A P-Series Power Meters User’s Guide
Using E9320 E-Series Power Sensors
4
Step 1. Connecting the Power Sensor
When you initially connect an E- Series E9320 power sensor to the power
meter, the sensor’s calibration data is automatically read by the power
meter. After every power cycle, the E9320 must perform zero and
calibration as the P- Series power meters do not retain the states and
settings upon power cycle (warm start feature).
Connect the sensor to the power source.
Step 2. Setting the Channel Frequency
• Press
. The Channel Setup screen is displayed. If using an
N1912A, select the channel you want to configure.
• Use the
,
,
, and
keys to highlight the frequency field. Press
to configure the setting. See “Setting the Measurement
Frequency” on page 32 for further information.
When you have completed the procedure you can return to this menu later
to add more accuracy to the measurement.
Step 3. Setting the Trigger
To use the measurement gates the power meter must be triggered.
A trigger can be taken from a rising or falling measured power level or
controlled externally using the Ext Trig input.
• Press
. The Trigger menu is displayed.
The trigger status is displayed below the Acqn label in the Trigger
menu. Press the Acqn softkey and select Cont Trig to configure
continuous triggering.
When you have completed the procedure you may return to the Trigger
menu later to add more accuracy to the remaining trigger parameters,
to help you achieve a stable and reliable trigger.
N1911A/1912A P-Series Power Meters User’s Guide
139
4
Using E9320 E-Series Power Sensors
Figure 4-104 E-Series E9320 power sensor channel setup when trigger is selected
Step 4. Setting the Display to Trace
Using trace display provides a visual representation of the signal of
interest.
• Press
, Disp Type , Trace to display the Trace the highlighted
window.
Figure 4-105Trace display in dual channel power meter
• Use the
,
, or
keys to select a measurement window.
Choose the type of display you require from the menu.
140
N1911A/1912A P-Series Power Meters User’s Guide
Using E9320 E-Series Power Sensors
4
Step 5. Expanding the Trace Display
Expanding the trace to display a Single Enlarged Window provides a more
detailed visual representation of the signal of interest and display of the
measured results. Figure 4- 106 is an example of this display. This display
type also provides a visual method of setting up the gate, trigger delay,
and trace controls.
Use the
key to configure the display from two rectangular windows
to a single enlarged window, or a full screen display by pressing
repeatedly. The display style is applied to the currently highlighted
window.
Figure 4-106Trace display in single enlarged window
NOTE
When you alter a parameter in another menu, you are returned to a two window
display. Use the
use the
,
, or
keys to highlight the trace measurement window and
key to enlarge the display.
N1911A/1912A P-Series Power Meters User’s Guide
141
4
Using E9320 E-Series Power Sensors
NOTE
If the bandwidth of a modulated signal is unknown, you may discover that during the set up
process, a power sensor of lesser or greater bandwidth is required.
After you have completed this initial set up, you can, if required, return to
the following setup to improve your measurement results:
• The Channel Setup to configure any averaging and offsets.
• The Trigger setup to configure any additional setting there.
• The Meas Setup to configure any additional setting there.
Gate Control in a Single Enlarged Window
When you initially display a single enlarged window, the Gate Control menu
is available. Setting the gate features are described in greater detail in
“Setting Measurement Channel Gates” on page 57. However, the following
sections are to give you an overview of the control and their impact on
the displayed results.
Gate 1 Active
Active Marker
Marker 1 Active
Figure 4-107Trace display with gate control menu
Gate Pressing Gate scrolls through the 4 gates available for each channel.
The gate displayed is highlighted below the Gate softkey. It is also
displayed in the channel/gate annotation in the top left of the screen.
142
N1911A/1912A P-Series Power Meters User’s Guide
Using E9320 E-Series Power Sensors
4
Select Pressing Select Mrks Tgdel displays the gate markers or trigger
markers.
When Mrks is selected, Markers 1 and 2 indicate the start and
end points of the selected measurement gate. Pressing Marker toggles
between the two markers, the highlighted marker is the currently active
Markers
marker. Use the
the display.
and
keys to move the markers left or right across
The tables on the lower left of the screen show the time (Time:) and the
instantaneous power level (Pow:) of the markers at their configured points.
The table highlighted with the green border represents the active marker,
also highlighted in green. A negative time value indicates a measurement
before the trigger point. (See Figure 4- 107).
NOTE
Gate timing parameters are all related to your chosen trigger point. This may be different
from the timing of the triggering event if you have configured a trigger delay.
Trigger Delay Value
Figure 4-108Trace display with trigger delay menu
TgDel When TgDel is selected you can adjust the trigger delay. The
display changes to remove the gate markers and displays the trigger
marker(s). The
indicates when the trigger event occurs, whilst
shows
the delayed trigger point. When the two points coincide, only the
trigger is shown.
N1911A/1912A P-Series Power Meters User’s Guide
143
4
Using E9320 E-Series Power Sensors
The configured value is displayed below the Trig Delay softkey. This value
is shown in Figure 4- 108.
To indicate an off- screen trigger event,
off- screen trigger point,
is displayed.
NOTE
is displayed. To indicate an
Your chosen trigger point is used as the reference point for the timing of all the
measurement gates.
Trig Delay The trigger delay value is shown below the Trig Delay softkey.
You configure the trigger delay by pressing Trig Delay and entering a
numeric value in the pop- up window.
Pressing Select
NOTE
highlights Mrks to display the trace markers again.
You can also setup the trigger delay in the Trigger menu, by pressing Settings , Delay and
entering a value in the pop-up window.
Trace Control Press Trace Control
to display the Trace Control menu. Setting
the trace features are described in greater details in “Setting up the
Channel Trace” on page 62.
144
N1911A/1912A P-Series Power Meters User’s Guide
Using E9320 E-Series Power Sensors
4
Gate 2 Active
Rising Edge
Falling Edge
Trace Setting
Duty Cycle
Pulse Width
Pulse Period
Pulse Repetitive Frequency
Figure 4-109Trace display with trace control menu
The fields on the lower left of the screen are the X and Y trace setup
fields. Using the
or
keys you can highlight the item and change its
value. (See Figure 4- 109)
The table on the lower right of the screen shows the 8 automatic time
measurements performed on the first complete captured pulse after the
trigger. The 8 measurements are rise time, fall time, time to positive
occurrence, time to negative occurrence, pulse width, pulse period (pulse
repetitive interval), pulse repetitive frequency and duty cycle.
The current settings of the X and Y scale are displayed on the reporting
line above both tables.
NOTE
If you want to view the trace in linear mode, the Trace Setup is the only location where you
can change the Y-scale units from dBm to Watts; otherwise the default unit is in logarithmic.
N1911A/1912A P-Series Power Meters User’s Guide
145
4
Using E9320 E-Series Power Sensors
Gate Control Press Gate Control to display the Gate Ctrl menu. Setting the
gate features are described in greater details in “Gate Control in a Single
Enlarged Window” on page 142”.
Viewing the Results in a Full Screen Window
Use the
key to display the trace in a full screen window display.
This provides a better resolution on the display. You can press Trace Meas
or Gate Meas to display the results as set in Single Enlarged Window mode.
The current settings of the X and Y scale are displayed on the reporting
line above
the results. You need to toggle the
displayed.
key to allow the softkeys to be
Pulse Period
Scale Settings
Rising Edge
Pulse Repetitive Frequency
Falling Edge
Pulse Width
Duty Cycle
Figure 4-110Trace display in full screen
146
N1911A/1912A P-Series Power Meters User’s Guide
Using E9320 E-Series Power Sensors
4
Improving the Accuracy with Additional Settings
You can now return to the setup menus and adjust the default setting to
obtain greater measurement accuracy.
Channel Setup
• Press
. The Channel Setup screen is displayed. If using an
N1912A, select the channel you want to configure.
Figure 4-111E-Series E9320 power sensor dafault channel setup
NOTE
For range settings, only UPPER and LOWER ranges are available in Normal and Triggered
mode.
Use the
,
,
, and
keys to highlight the setting field and press
to configure the setting. For further detail on these settings, refer
to the appropriate sections.
• Meas Avg: “Setting Measurement Averaging” on page 49
• Video Avg: “Setting the Video Averaging” on page 52
• Step Detect: “Step Detection” on page 51
• Video B/W: “Setting the Video Bandwidth” on page 54
N1911A/1912A P-Series Power Meters User’s Guide
147
4
Using E9320 E-Series Power Sensors
Setting Offsets
Press Offsets . The Offsets Setup screen is displayed.
Figure 4-112Channel offset display
Use the
,
,
, and
keys to highlight any parameters you want to
change. Press
to configure the required settings. For further detail
on setting these, refer to the appropriate section.
• Offset: “Setting Channel Offsets” on page 39
• FDO Table: “Setting Frequency Dependent Offsets” on page 42
Trigger Setup
Press
. The Trigger menu is displayed.
The trigger status is displayed below the Acqn label in the Trigger menu.
Press the Settings softkey and add more accuracy to the remaining trigger
parameters, for example, hold- off and hysteresis, to help you achieve a
stable and reliable trigger. Hence, this ensures that the gates you have set
up are capturing the required signal information. See Chapter 2, “Setting
the Trigger,” starting on page 66 for further information.
148
N1911A/1912A P-Series Power Meters User’s Guide
Using E9320 E-Series Power Sensors
4
Measurement Setup
. The Measurement Setup menu is displayed.
Press
Use the
,
,
, and
keys to highlight the setting field and press
to configure the setting.
When you have configured the measurements gates, you can assign the
measurement feed and display the results in numeric formats. For
example, dual numeric display with Gate 1 peak measurement minus Gate
3 peak measurement. Also, from this menu you can add offsets and
measurement limits. For further detail on these settings, refer the
appropriate section.
• Feed1/2 “Setting the Measurement Display” on page 90
• Offset “Setting Display Offsets” on page 41
• Limits “Setting Measurement Limits” on page 86
Display
Press
. The Display Form menu is displayed.
Choose the display format to present the measurements results. The
options, other than trace, are as follows:
Single Numeric If you need to configure the numeric format when using a
P- Series sensor, refer to “Numeric Format” on page 91 for more details.
Dual Numeric If you need to configure the numeric format when using a
P- Series sensor, refer to “Numeric Format” on page 91 for more details.
Analog If you need to configure the analog format when using a P- Series
sensor refer to “Scaling the Analog Display” on page 97 for more details.
N1911A/1912A P-Series Power Meters User’s Guide
149
4
Using E9320 E-Series Power Sensors
THIS PAGE HAS BEEN INTENTIONALLY LEFT BLANK.
150
N1911A/1912A P-Series Power Meters User’s Guide
N1911A/1912A P-Series Power Meters
User’s Guide
5
Using E9300 E-Series Power Sensors
Introduction 152
Power Meter Configuration 153
Measurement Accuracy 155
Measuring Spread Spectrum and Multitone Signals 157
Measuring TDMA Signals 160
Electromagnetic Compatibility (EMC) Measurements 162
Measurement Accuracy and Speed 163
This chapter describes how to use your E9300 E-Series power sensors with P-Series power
meter.
Agilent Technologies
151
5
Using E9300 E-Series Power Sensors
Introduction
The E9300 E- Series power sensors are true average, wide dynamic range
RF microwave power sensors. They are based on a dual sensor
diode pair/attenuator/diode pair. This technique ensures the diodes in the
selected signal path are kept in their square law region, thus the output
current (and voltage) is proportional to the input power. The diode
pair/attenuator/diode pair assembly can yield the average of complex
modulation formats across a wide dynamic range, irrespective of signal
bandwidth. Further refinements are included to improve power handling
allowing accurate measurement of high level signals with high crest factors
without incurring damage to the sensor.
These sensors measure average RF power on a wide variety of modulated
signals and are independent of the modulation bandwidth. They are ideally
suited to the average power measurement of multi- tone and spread
spectrum signals such as CDMA, W- CDMA and digital television formats.
Please refer to the documentation supplied with your E- Series E9300
power sensor for specification and calibration information.
152
N1911A/1912A P-Series Power Meters User’s Guide
Using E9300 E-Series Power Sensors
5
Power Meter Configuration
Lower Range
E9300/1/4A
E9300/1H
E9300/1B
10 dBm
20 dBm
40 dBm
2 dBm
12 dBm
32 dBm
-4 dBm
6 dBm
26 dBm
-10 dBm
0 dBm
20 dBm
-20 dBm
-10 dBm
10 dBm
-30 dBm
-20 dBm
0 dBm
-40 dBm
-30 dBm
-10 dBm
-50 dBm
-40 dBm
-20 dBm
Maximum
Sensor Power
1
Resolution Setting
2
3
4
1
1
1
4
1
1
4
16
1
1
8
32
1
4
16
128
1
16
64
128
1
1
1
4
1
1
2
16
1
2
16
64
4
16
128
256
32
64
256
256
Number of Averages
Sensor Dynamic Range
Upper Range
The P- Series power meters automatically recognize an E- Series E9300
power sensor when it is connected. The sensor calibration data is
automatically read by the power meter. The power meter also configures
the auto- averaging settings shown in Figure 5- 113 to suit the power
sensor characteristics.
Minimum
Sensor Power
Figure 5-113E9300 E-Series auto-averaging settings
NOTE
These values are valid only for the power meter channel connected with E-Series E9300
power sensor. You can also configure the settings manually – refer to “Achieving Stable
Results with TDMA Signals” on page 160 if required.
N1911A/1912A P-Series Power Meters User’s Guide
153
5
Using E9300 E-Series Power Sensors
Default Channel Setup
When an E- Series E9300 power sensor is connected the following Channel
Setup is automatically configured. Carrying out a Preset returns the power
meter to this configuration.
Figure 5-114 E9300 E-Series sensor default channel setup
154
N1911A/1912A P-Series Power Meters User’s Guide
Using E9300 E-Series Power Sensors
5
Measurement Accuracy
Power sensors have small errors in their response over frequency. The
response of each sensor is measured during manufacture to determine
correction factors. With E- Series power sensors, correction factors are
held in Electrically Erasable Programmable Read Only Memory (EEPROM)
and are downloaded to the power meter automatically.
Using calibration factors enables improved measurement accuracy. This
section describes making average power measurements using the E9300
E- Series power sensors.
Making a measurement requires the following steps:
1 Zero and calibrate the power meter/sensor combination.
2 Set the frequency for the signal you want to measure.
3 Make the measurement.
Table 5-11
Power sensor connection requirements
Sensor
Connection Requirements
E9300A
E9300H
E9301A
E9301H
E9304A
These power sensors connect directly to the POWER REF.
E9300B
E9301B
These power sensors are configured with an attenuator. Prior to calibration this
attenuator must be removed. Replace the attenuator before making measurements.
Procedure
First zero and calibrate the power meter/sensor combination.
1 Ensure the power sensor is disconnected from any signal source.
2 Press
displayed.
and the channel Zero softkey. The Zeroing pop- up is
3 Connect the power sensor to the POWER REF output.
N1911A/1912A P-Series Power Meters User’s Guide
155
5
Using E9300 E-Series Power Sensors
4 Press
and the channel Cal softkey to start the calibration
routine. The Calibrating pop- up is then displayed.
NOTE
You can reduce the steps required to carry out the zero and calibration procedure as
follows:
1 Connect the power sensor to the POWER REF output.
2 Press
Zero + Cal
and Zero + Cal
, Zero + Cal A
. (For dual channel meters, press
or Zero + Cal B
as required).
Now set the frequency of the signal you want to measure. The power
meter automatically selects the appropriate calibration factor.
5 Press
6 Use the
. On dual channel meters select the required channel.
and
keys to highlight the Frequency value field and press
to display the Frequency pop- up. Use the numeric keypad to
enter the required value in the Frequency pop- up window.
Figure 5-115Frequency pop-up
7 Confirm your choice by pressing MHz or GHz .
8 Press
key to close the Channel Setup screen.
Now make the measurement.
9 Reconnect any required attenuators or adaptors and connect the power
sensor to the signal to be measured.
The corrected measurement result is displayed.
156
N1911A/1912A P-Series Power Meters User’s Guide
Using E9300 E-Series Power Sensors
5
Measuring Spread Spectrum and Multitone Signals
To achieve high data transfer rates within a given bandwidth, many
transmission schemes are based around phase and amplitude (I and Q)
modulation. These include CDMA, W- CDMA and digital television. The
signals are characterized by their appearance on a spectrum analyzer
display — a high amplitude noise- like signal of bandwidths up to 20 MHz.
An 8 MHz bandwidth digital television signal is shown in Figure 5- 116.
Figure 5-116Spread spectrum signal
The diode pair/attenuator/diode pair architecture of the E9300 E- Series
power sensors is ideally suited to the average power measurement of these
signals. The sensors have wide dynamic range (80 dB max, sensor
dependent) and are bandwidth independent.
Some signal modulation formats such as orthogonal- frequency- division
multiplexing (OFDM) and CDMA have large crest factors. The
E- Series E9300/1/4A power sensors can measure +20 dBm average power
even in the presence of +13 dB peaks but the peak pulse duration must be
less than 10 microseconds. For high power applications, such as
base- station testing, the E9300/1B and E9300/1H are recommended.
N1911A/1912A P-Series Power Meters User’s Guide
157
5
Using E9300 E-Series Power Sensors
CDMA Signal Measurements
Figure 5- 117 and Figure 5- 118 show typical results obtained when
measuring a CDMA signal. In these examples, the error is determined by
measuring the source at the amplitude of interest, with and without
CDMA modulation, adding attenuation until the difference between the
two values stops changing. The CW sensor in Figure 5- 117 uses correction
factors to correct for power levels beyond its square law operating region.
1.2
Lower Range Error
Upper Range Error
1
CW Sensor Error
Error (dB)
0.8
0.6
0.4
0.2
0
-30
-20
-10
0
0.2
Power (dBm)
10
20
30
Modulation Error (dB)
Figure 5-117Wideband CDMA error of E-Series E9300 power sensor versus corrected CW
sensor.
0.1
Lower Range Error
0.05
Upper Range Error
0
-30
-20
10
0
-10
20
30
-0.05
-0.1
-0.15
-0.2
Power (dBm)
(E9300 E-Series power
sensor only shown)
Figure 5-118CDMA (IS-95A): 9Ch Fwd
158
N1911A/1912A P-Series Power Meters User’s Guide
Using E9300 E-Series Power Sensors
5
Multitone Signal Measurements
In addition to wide dynamic range, the E9300 E- Series power sensors also
have an exceptionally flat calibration factor versus frequency response as
shown in Figure 5- 119. This is ideal for amplifier intermodulation
distortion measurements where the components of the two- tone or
multitone test signal can be separated by hundreds of MHz.
110 %
Cal Factor
105 %
Typical Upper Range
Calibration Factor
100 %
95 %
90 %
0
5
10
Frequency (GHz)
15
20
110 %
Cal Factor
105 %
Typical Lower Range
Calibration Factor
100 %
95 %
90 %
0
5
10
Frequency (GHz)
15
20
Figure 5-119Calibration factors versus frequency
N1911A/1912A P-Series Power Meters User’s Guide
159
5
Using E9300 E-Series Power Sensors
Measuring TDMA Signals
Power Meter and Sensor Operation
The voltages generated by the diode detectors in the power sensor can be
very small. Gain and signal conditioning are required to allow accurate
measurement. This is achieved using a 440 Hz square wave output from
the power meter to drive a chopper- amplifier in the power sensor. Digital
Signal Processing (DSP) of the generated square wave is used by the
power meter to recover the power sensor output and accurately calculate
the power level.
The chopper- amplifier technique provides noise immunity and allows large
physical distances between power sensor and power meter (Agilent 11730
Series cables available up to 61 metres). Additional averaging helps reduce
noise susceptibility.
Achieving Stable Results with TDMA Signals
The averaging settings in the power meter are designed to reduce noise
when measuring continuous wave (CW) signals. Initial measurement of a
pulsed signal may appear unstable with jitter on the less significant
displayed digits. With pulsed signals the averaging period must be
increased to allow measurement over many cycles of the pulsed signal.
Procedure
Set the averaging as follows:
1 Press
. On dual channel meters, select the required channel.
2 Use the
and
keys to select the Filter setting field.
3 Press
and use the
settings. Select MAN.
4 Use the
160
and
keys to step through the available
key to to select the Meas Avg: value field.
N1911A/1912A P-Series Power Meters User’s Guide
Using E9300 E-Series Power Sensors
5 press
5
to display the Meas Avg Count pop- up.
6 Use the numeric keys to enter the required value.
7 Press Enter to complete the entry.
NOTE
You should also ensure the filter is not reset when a step increase or decrease in power is
detected by switching the step detection off.
Procedure
Switch off step detection as follows:
1 Press
. On dual channel meters, select the required channel.
2 Use the
and
3 Press
4 Press
keys to select the Step Detect setting field.
to check the step detection to Off.
key to close the Channel Setup screen.
Achieving Stable Results with GSM Signals
Signals with a pulse repetition frequency (PRF) close to a multiple or
sub- multiple of the 440 Hz chopper- amplifier signal generate a beat note
at a frequency between the PRF and 440 Hz. Control over the filter
settings is again required to obtain stable results.
TIP
The PRF of a GSM signal is approximately 217 Hz and thus
requires more averaging than most other TDMA signals. To
achieve a stable measurement use the filter setting procedures
to set the Length . Experimentally, a Length setting of 148
gives optimum results although settings in the order of 31 or 32
give acceptable results if a faster measurement is required.
N1911A/1912A P-Series Power Meters User’s Guide
161
5
Using E9300 E-Series Power Sensors
Electromagnetic Compatibility (EMC) Measurements
The low frequency range of the E9304A make it the ideal choice for
making EMC measurements to CISPR (Comite International Special
Perturbations Radioelectriques) requirements, and electromagnetic
interference (EMI) test applications such as the radiated immunity test
(IEC61000- 4- 3).
DC coupling of the E9304A input allows excellent low frequency coverage.
However, the presence of any dc voltages mixed with the signal has an
adverse effect on the accuracy of the power measurement.
CAUTION
162
The E9304A sensor is DC coupled. DC voltages in excess of the maximum value (5 Vdc)
can damage the sensing diode.
N1911A/1912A P-Series Power Meters User’s Guide
Using E9300 E-Series Power Sensors
5
Measurement Accuracy and Speed
The power meter has no internal ranges. The only ranges you can set are
those of the E9300 E- Series power sensors (and other Agilent
Technologies E- Series power sensors). With an E- Series E9300 power
sensor the range can be set either automatically or manually. Use
autoranging when you are not sure of the power level you are about to
measure.
CAUTION
To prevent damage to your sensor do not exceed the power levels specified in the sensor
user’s guide.
The E9304A sensor is DC coupled. DC voltages in excess of the maximum value (5 Vdc)
can damage the sensing diode.
Setting the Range
There are two manual settings, LOWER and UPPER. The LOWER range
uses the more sensitive path and the UPPER range uses the attenuated
path in the E9300 E- Series power sensors.
Sensor
LOWER range
UPPER range
E9300/1/4A
–60 dBm to –10 dBm
–10 dBm to +20 dBm
E9300/1B
–30 dBm to +20 dBm
+20 dBm to +44 dBm
E9300/1H
–50 dBm to 0 dBm
0 dBm to +30 dBm
The default is AUTO. In AUTO the range crossover value depends on the
sensor model being used.
E9300/1/4A
E9300/1B
E9300/1H
–10 dBm ±0.5 dBm
+20 dBm ±0.5 dBm
0 dBm ±0.5 dBm
N1911A/1912A P-Series Power Meters User’s Guide
163
5
Using E9300 E-Series Power Sensors
Procedure
Set the range as follows:
1 Press
. On dual channel meters, select the required channel.
2 Use the
and
3 Press
to display the Range pop- up.
4 Use the
and
5 Press
to complete the entry.
keys to select the Range: setting field.
keys to select the required setting.
Measurement Considerations
While autoranging is a good starting point, it is not ideal for all
measurements. Signal conditions such as crest factor or duty cycle may
cause the power meter to select a range which is not the optimum
configuration for your specific measurement needs. Signals with average
power levels close to the range switch point require you to consider your
needs for measurement accuracy and speed. For example, using an
E9300/1/4A sensor, where the range switch point is –10 ± 0.5 dBm in a
pulsed signal configured as follows:
Characteristic
Value
Peak Amplitude
–6 dBm
Duty Cycle
25%
The calculated average power is –12 dBm.
164
N1911A/1912A P-Series Power Meters User’s Guide
Using E9300 E-Series Power Sensors
5
Accuracy
The value of –12 dBm lies in the lower range of the E- Series E9300
power sensor. In autoranging mode (“AUTO”), the power meter
determines the average power level is below –10 dBm and selects the low
power path. However, the peak amplitude of –6 dBm is beyond the
specified, square law response range of the low power path diodes.The
high power path (–10 dBm to +20 dBm) should be used to ensure a more
accurate measurement of this signal. However, range holding in “UPPER”
(the high power path), for a more accurate measurement, results in
considerably more filtering.
Speed and Averaging
The same signal also requires that consideration is given to measurement
speed. As shown above, in autoranging mode the power meter selects the
low power path in the E- Series E9300 power sensor. With auto- averaging
also configured, minimal filtering is applied. Values of 1 to 4 for average
power levels above –20 dBm are used in the low power path. (Refer to
“E9300 E- Series auto- averaging settings” on page 153.)
If the range is held in “UPPER” for more accuracy, the measurement is
slower. More filtering is applied due to the increase in noise susceptibility
at the less sensitive area of the high power path. Values of 1 to 128 for
average power levels less than –10 dBm are used. (Again, refer to “E9300
E- Series auto- averaging settings” on page 153.) Manually lowering the
filter settings speeds up the measurement but can result in an unwanted
level of jitter.
Summary
Attention must be paid to signals whose average power levels are in the
low power path range whilst their peaks are in the high power path range.
You can achieve best accuracy by selecting the high power path or best
speed by selecting the low power path.
N1911A/1912A P-Series Power Meters User’s Guide
165
5
Using E9300 E-Series Power Sensors
THIS PAGE HAS BEEN INTENTIONALLY LEFT BLANK.
166
N1911A/1912A P-Series Power Meters User’s Guide
N1911A/1912A P-Series Power Meters
User’s Guide
6
Using E4410 E-Series Power Sensors
Introduction 168
Power Meter Configuration 169
Measurement Accuracy 171
This chapter describes how to use your E4410 E-Series power sensors with P-Series power
meter.
Agilent Technologies
167
6
Using E4410 E-Series Power Sensors
Introduction
The E4410 E- Series power sensors are diode based power sensors. They
are intended for the measurement of CW microwave power levels in a
wide dynamic range from –70 dBm to +20 dBm (100 pW to 100 mW).
These are high- speed power sensors, and do not incorporate
narrow- bandwidth averaging used in average- power sensors. Signals with
digital, pulse, or other forms of amplitude modulation may introduce
measurement errors.
Multi- tone signals (containing multiple frequency components), or signals
with significant harmonic content (> –45 dBc) may introduce measurement
errors at high power levels.
Please refer to the documentation supplied with your E- Series E4410
power sensor for specification and calibration information.
168
N1911A/1912A P-Series Power Meters User’s Guide
Using E4410 E-Series Power Sensors
6
Power Meter Configuration
The P- Series power meters automatically recognize an E- Series E4410
power sensor when it is connected. The sensor calibration data is
automatically read by the power meter. Also, the power meter
automatically configures the averaging as shown in Figure 6- 120.
1
Resolution Setting
2
3
4
1
1
1
8
10 dB
1
1
1
16
10 dB
1
1
2
32
10 dB
1
1
16
256
10 dB
1
8
128
128
Number of Averages
Power Sensor
Dynamic Range
Maximum Sensor Power
Minimum Sensor Power
Figure 6-120E-Series CW sensor auto-averaging settings
NOTE
These values are valid only for the power meter channel connected with E-Series E4410
power sensor. Averaging settings can also be manually configured.
N1911A/1912A P-Series Power Meters User’s Guide
169
6
Using E4410 E-Series Power Sensors
Default Channel Setup
When an E- Series E4410 power sensor is connected the following Channel
Setup is automatically configured. Carrying out a Preset returns the
channel to this configuration.
Figure 6-121E-Series E4410 sensor default channel setup
170
N1911A/1912A P-Series Power Meters User’s Guide
Using E4410 E-Series Power Sensors
6
Measurement Accuracy
Power sensors have small errors in their response over frequency. The
response of each sensor is measured during manufacture (and during
periodic calibration). With E- Series power sensors, the resulting frequency
compensation information is written into Electrically Eraseable
Programmable Read Only Memory (EEPROM). This allows the frequency
and calibration data to be downloaded to the power meter automatically.
Using calibration factors enables you to achieve improved measurement
accuracy. This section describes making continuous wave measurements
using the E4410 E- Series power sensors.
Making a measurement requires the following steps:
1 Zero and calibrate the power meter/sensor combination.
2 Set the frequency for the signal you want to measure.
3 Make the measurement.
Procedure
First zero and calibrate the power meter/sensor combination.
1 Ensure the power sensor is disconnected from any signal source.
2 Press
displayed.
and the channel Zero softkey. The Zeroing pop- up is
3 Connect the power sensor to the POWER REF output.
4 Press
and the channel Cal softkey to start the calibration
routine. The Calibrating pop- up is then displayed.
N1911A/1912A P-Series Power Meters User’s Guide
171
6
Using E4410 E-Series Power Sensors
NOTE
You can reduce the steps required to carry out the zero and calibration procedure as
follows:
1 Connect the power sensor to the POWER REF output.
2 Press
Zero + Cal
and Zero + Cal
, Zero + Cal A
. (For dual channel meters, press
or Zero + Cal B
as required).
Now set the frequency of the signal you want to measure. The power
meter automatically selects the appropriate calibration factor.
5 Press
6 Use the
. On dual channel meters select the required channel.
and
keys to highlight the Frequency value field and press
to display the Frequency pop- up. Use the numeric keypad to
enter the required value in the Frequency pop- up window.
Figure 6-122Frequency pop-up
7 Confirm your choice by pressing MHz or GHz .
8 Press
key to close the Channel Setup screen.
Now make the measurement.
9 Connect the power sensor to the signal to be measured.
The corrected measurement result is displayed.
172
N1911A/1912A P-Series Power Meters User’s Guide
N1911A/1912A P-Series Power Meters
User’s Guide
7
Using 8480 Series Power Sensors
Introduction 174
Power Meter Configuration 175
Measurement Accuracy 179
Frequency Specific Calibration Factors 180
Sensor Calibration Tables 184
This chapter describes how to use your 8480 Series power sensors with P-Series power
meter.
Agilent Technologies
173
7
Using 8480 Series Power Sensors
Introduction
The 8480 Series offers a wide range of both thermocouple and diode
based power sensors. Many have very specific applications, for example
the 110GHz W8486A or the +44 dBm 8482B. However, they do not have
their calibration factors stored in EEPROM, unlike all E- Series, and
require that you use default calibration tables or manually enter the
required correction factors. Likewise, they cannot be used to make peak or
time gated measurements.
Please refer to the documentation supplied with your Agilent 8480 Series
power sensors for specification and calibration information.
174
N1911A/1912A P-Series Power Meters User’s Guide
Using 8480 Series Power Sensors
7
Power Meter Configuration
The P- Series power meters automatically recognize an 8480 Series power
sensor when it is connected. The averaging settings shown in Figure 7- 123
are automatically configured.
1
Resolution Setting
2
3
4
1
1
1
8
10 dB
1
1
1
16
10 dB
1
1
2
32
10 dB
1
1
16
256
10 dB
1
8
128
128
Number of Averages
Power Sensor
Dynamic Range
Maximum Sensor Power
Minimum Sensor Power
Figure 7-1238480 Series auto-averaging settings
NOTE
These values are valid only for the power meter channel connected with Agilent 8480
Series power sensors. Averaging settings can also be manually configured.
N1911A/1912A P-Series Power Meters User’s Guide
175
7
Using 8480 Series Power Sensors
Default Channel Setup
Figure 7- 124 shows the Channel Setup configured automatically.
Presetting returns the power meter to this configuration.
Figure 7-1248480 Series sensor default channel setup
176
N1911A/1912A P-Series Power Meters User’s Guide
Using 8480 Series Power Sensors
7
8480 Series Sensors Connection Requirements
Table 7-12 8480 Series connection requirements
Sensor
Connection Requirements
8481A
8481H
8482A
8482H
These power sensors connect directly to the POWER REF.
8481D
8484A
Prior to calibration, an Agilent 11708A 30 dB reference attenuator
should be connected between the power sensor and the POWER
REF. Remove this attenuator from the power sensor input before
making measurements.
8483A
This power sensor requires a 75 Ω (f) to 50 Ω (m) N-Type adapter
(1250-0597) to connect to the POWER REF. Remove this adapter
before making measurements.
R8486A
Q8486A
V8486A
W8486A
E8486A
R8486D
Q8486D
These waveguide power sensors have two connectors. Use the
N-Type connector to calibrate the power meter.
8481B
8482B
These power sensors are configured with an attenuator. Prior to
calibration this attenuator must be removed. Replace the attenuator
before making measurements.
8485A
This power sensor requires an APC 3.5 (f) to 50 Ω (m) N-Type
adapter (08485-60005) to connect to the POWER REF.Remove this
adapter before making measurements.
8485D
Prior to calibration, an Agilent 11708A 30 dB reference attenuator
and an APC 3.5 (f) to 50 Ω (m) N-Type adapter (08485-60005) should
be connected between the power sensor and the POWER REF.
Remove this attenuator and adaptor before making measurements.
N1911A/1912A P-Series Power Meters User’s Guide
177
7
Using 8480 Series Power Sensors
Sensor
178
Connection Requirements
8487A
This sensor requires an APC 2.4 (f) to 50 Ω (m) N-Type adapter
(08487-60001) to connect to the POWER REF. Remove this adapter
before making measurements.
8487D
Prior to calibration, an Agilent 11708A 30 dB reference attenuator
and an APC 2.4 (f) to 50 Ω (m) N-Type adapter (08487-60001) should
be connected between the power sensor and the Power Ref.
Remove this adapter before making measurements.
N1911A/1912A P-Series Power Meters User’s Guide
Using 8480 Series Power Sensors
7
Measurement Accuracy
Power sensors have small errors in their response over frequency. The
response of each sensor is measured during manufacture (and during
periodic calibration) and the resulting frequency compensation information
is supplied in the form of calibration factors. Using calibration factors
enables you to achieve improved measurement accuracy. The P- Series
power meters provide two methods of using the calibration factors:
– inputting the individual calibration factor for a frequency prior to
making the measurement, or
– using sensor calibration tables.
If you are making most of your measurements at a single frequency, or in
a narrow range of frequencies, entering a specific calibration factor is a
more effective method. Only a minimal amount of data entry is required.
However, if you are making measurements on a wide range of signal
frequencies, a sensor table is more effective as you only need to enter the
frequency of the signal you are measuring. The power meter automatically
selects and applies the calibration factor from the selected table.
N1911A/1912A P-Series Power Meters User’s Guide
179
7
Using 8480 Series Power Sensors
Frequency Specific Calibration Factors
This section shows you how to make a measurement using the calibration
factor for the frequency of the signal you want to measure.
TIP
This method is best suited to making several measurements at
one frequency as you need only enter a small amount of data.
Using this method requires the following steps:
1 Zero and calibrate the power meter/sensor combination.
2 Set the calibration factor value for the frequency of the
signal you want to measure.
3 Make the measurement.
Procedure
First select and enter the reference calibration factor for the sensor you
are using as follows:
1 Ensure the power sensor is disconnected from any signal source.
2 Refer to the connection requirements in Table 7- 12 and ensure the
sensor is ready for connection to the Power Reference.
3 Check the current reference calibration factor setting by pressing
, REF CFs . The value is displayed under the channel Ref CF
softkey.
Does this setting match the value for the sensor? (The power sensor
reference calibration factor can normally be found above the calibration
factors table on the power sensor body.)
4 To change the settings, press the channel REF CF . The reference
calibration factor pop up window is displayed as shown in
Figure 7- 125. Use the numeric keypad to enter the required value in
the Ref Cal Factor pop- up menu.
180
N1911A/1912A P-Series Power Meters User’s Guide
Using 8480 Series Power Sensors
7
Figure 7-125Reference Calibration Factor pop-up window
5 Press % to complete the entry.
Now zero and calibrate the power meter/sensor combination as follows:
6 Press
displayed.
and the channel Zero softkey. The Zeroing pop- up is
7 Connect the power sensor to the POWER REF output.
8 Press
and the channel Cal softkey to start the calibration
routine. The Calibrating pop- up is then displayed.
NOTE
You can reduce the steps required to carry out the zero and calibration procedure as
follows:
1 Connect the power sensor to the POWER REF output.
2 Press
Zero + Cal
and Zero + Cal
, Zero + Cal A
. (For dual channel meters, press
or Zero + Cal B
as required).
Now set the sensor calibration factor for the frequency of the signal you
want to measure.
9 Check the current reference calibration factor setting by pressing
, Offset . The value is displayed on the Cal Fac field.
N1911A/1912A P-Series Power Meters User’s Guide
181
7
Using 8480 Series Power Sensors
Does this setting match the value for the sensor? (The power sensor
reference calibration factor can normally be found above the calibration
factors table on the power sensor body.)
10 To change the settings, use the
and
keys to highlight the Cal Fac
value field and press
to display the Cal Factor pop- up. Use the
numeric keypad to enter the required value in the Cal Factor pop- up
window.
Figure 7-126Calibration factor pop-up window
11 Press % to complete the entry.
12 Connect the power sensor to the signal to be measured.
13 The corrected measurement result is displayed.
Calibration Factor
Figure 7-127Calibration factor display
182
N1911A/1912A P-Series Power Meters User’s Guide
Using 8480 Series Power Sensors
7
Example
To make a measurement on channel A with a power sensor which has a
reference calibration factor of 99.8% and a calibration factor of 97.6% at
the measurement frequency.
• Disconnect the power sensor from any signal source.
• Press
, REF CFs and the channel REF CF softkey.
• Use the numeric keypad to enter 99.8 in the Ref Cal Factor pop- up
window.
• Press % to complete the entry.
• Press
displayed.
and the channel Zero softkey. The Zeroing pop- up is
• Connect the power sensor to the POWER REF output.
• Press
and the channel Cal softkey to start the calibration
routine. The Calibrating pop- up is then displayed.
• Press
, Offset . The value is displayed on the Cal Fac field.
• Use the
and
keys to highlight the Cal Fac value field and press
to display the Cal Factor pop- up. Use the numeric keypad to enter
97.6 in the Cal Factor pop- up window.
• Press % to complete the entry.
• Connect the power sensor to the signal to be measured.
• The corrected measurement result is displayed.
NOTE
When no sensor tables are selected and Single Numeric display mode is chosen, the
calibration factor used for the measurement is displayed in the upper window as shown in
Figure 7-127.
N1911A/1912A P-Series Power Meters User’s Guide
183
7
Using 8480 Series Power Sensors
Sensor Calibration Tables
This section describes how to use sensor calibration tables. Sensor
calibration tables store the measurement calibration factors, for a power
sensor model or for a specific power sensor, in the power meter. They are
used to correct measurement results.
Use sensor calibration tables when you want to make power measurements
over a range of frequencies using one or more power sensors.
The P- Series power meters are capable of storing 20 sensor calibration
tables each containing up to 80 frequency points. The power meter is
supplied with a set of 9 predefined sensor calibration tables plus a “100%”
default table. The data in these tables is based on statistical averages for
a range of Agilent Technologies power sensors. Your own sensor will most
likely differ from the typical to some degree. If you require best accuracy,
create a custom table for each sensor you use as shown
in“Editing/Generating Sensor Calibration Tables” on page 187.
To use calibration factor tables:
1 Select the sensor calibration table to be applied to a channel.
2 Zero and calibrate the power meter. The reference calibration factor
used during the calibration is automatically set by the power meter
from the sensor calibration table.
3 Specify the frequency of the signal you want to measure. The
calibration factor is automatically set by the power meter from the
sensor calibration table.
4 Make the measurement.
184
N1911A/1912A P-Series Power Meters User’s Guide
Using 8480 Series Power Sensors
7
Procedure
First select the table for the sensor you are using as follows:
1 Press
2 Use the
, Tables , Sensor Cal Tables .
and
keys to highlight one of the 20 table titles and press
Table to highlight On .
Figure 7-128Sensor table selected
NOTE
When no data is contained in the highlighted table, the Table key is disabled (grayed out).
3 Press Done to complete the selection of the calibration factor table.
4 Press Done again to display the measurement screen. Figure 7- 129
shows which offset table is selected.
Sensor Table 2 Selected
Figure 7-129Frequency dependent offset indicator
N1911A/1912A P-Series Power Meters User’s Guide
185
7
Using 8480 Series Power Sensors
5 To change the frequency, press
highlight the Frequency field.
and use the
and
keys to
6 Press
to display the Frequency pop- up window. Use the numeric
keypad to enter the required value in the Frequency pop- up window.
7 To confirm your choice, press the appropriate unit softkey.
8 Connect the power sensor to the signal to be measured.
9 The corrected measurement result is now displayed.
NOTE
If the measurement frequency does not correspond directly to a frequency in the sensor
calibration table, the power meter calculates the calibration factor using linear
interpolation.
If you enter a frequency outside the frequency range defined in the sensor calibration table,
the power meter uses the highest or lowest frequency point in the sensor calibration table
to set the calibration factor.
NOTE
When Single Numeric display mode is chosen, the frequency you entered and the
sensor table identifier is displayed in the upper window. Also, pressing
, Offset
displays the frequency you entered and calibration factor for each channel derived from the
selected sensor tables.
Figure 7-130Frequency/calibration table display
186
N1911A/1912A P-Series Power Meters User’s Guide
Using 8480 Series Power Sensors
7
Editing/Generating Sensor Calibration Tables
To help achieve the best accuracy in your measurement you can enter the
values supplied for the sensors you are using by editing the installed
sensor calibration tables or by generating your own custom tables.
You cannot delete any of the 20 existing calibration tables or create any
additional tables. However, you can edit or delete the content of each
table. If you need another table you should edit and re- name one of the
tables.Each calibration table can contain a maximum of 80 frequency
points.
To view the calibration tables currently stored in the power meter, press
, Tables , Sensor Cal Tables . The Sensor Tbls screen is displayed as
shown in Figure 7- 128.
Table 7-13 Installed power sensor models
Table
Sensor Model
Table
Sensor Model
0
DEFAULT1
5
8485A
1
8481A
6
R8486A
2
8482A2
7
Q8486A
3
8483A
8
R8486D
4
8481D
9
8487A
1
DEFAULT is a sensor calibration table where the reference calibration factor and calibration
factors are 100%. This sensor calibration table can be used during the performance testing of the
power meter.
2 The Agilent
8482B and Agilent 8482H power sensors use the same data as the Agilent 8482A.
There are also ten sensor calibration tables named CUSTOM_0 through
CUSTOM_9. These tables do not contain any data when the power meter
is shipped from the factory.
N1911A/1912A P-Series Power Meters User’s Guide
187
7
Using 8480 Series Power Sensors
Editing frequency dependent offset tables requires the following steps:
1 Identify and select the table you want to edit
2 Rename the table
3 Enter the frequency and offset pairs
4 Save the table
Procedure
First select the table you want to edit as follows:
1 Press
screen.
, Tables , Sensor Cal Tables
to display the Sensor Tbls
Figure 7-131“Sensor Tbls” screen
2 Choose the table you want to edit using the
Edit Table
188
and
keys. Press
to display the Edit Cal screen as shown in Figure 7- 132.
N1911A/1912A P-Series Power Meters User’s Guide
Using 8480 Series Power Sensors
7
Figure 7-132“Edit Cal” display
3 Highlight the table title using the
use
and
keys. Press Change and
the
,
,
and
keys to select and change the characters in the
Table Name pop- up to create the name you want to use.
Figure 7-133Edit table title pop-up
•
Pressing Insert Char adds a new character to the right of the
selected character.
• Pressing Delete Char
N1911A/1912A P-Series Power Meters User’s Guide
removes the selected character.
189
7
Using 8480 Series Power Sensors
4 Press Enter to complete the entry.
NOTE
A calibration factor in the range of 1 % to 150 % can be entered.
The following rules apply to naming sensor calibration tables:
•
The name must consist of no more than 12 characters.
•
All characters must be upper or lower case alphabetic characters, or numeric (0-9), or
an underscore (_).
•
No other characters are allowed.
•
No spaces are allowed in the name.
Enter (or edit) the frequency and cal factor pairs as follows:
1 Press Insert to add a new frequency value (or press Change to edit).
Use the numeric keypad to enter the required value in the Frequency
pop- up window. Complete the entry by pressing the GHz , MHz keys.
2 Enter the new cal factor value (or press Change to edit). Use the
numeric keypad to enter the required value in the Cal Factor pop- up
window. Complete the entry by pressing the % key.
3 Continue adding/editing values until you have entered all the data you
require.
4 When you have finished editing the table press Done to save the table.
NOTE
190
Ensure that the frequency points you use cover the frequency range of the signals you want
to measure. If you measure a signal with a frequency outside the frequency range defined
in the sensor calibration table, the power meter uses the highest or lowest frequency point
in the sensor calibration table to calculate the offset
N1911A/1912A P-Series Power Meters User’s Guide
Using 8480 Series Power Sensors
7
Pre-installed Calibration Table Contents
The following lists detail the contents of the installed sensor calibration
tables.
RCF
0.1 MHz
110 GHz
RCF
50 MHz
100 MHz
2 GHz
3 GHz
4 GHz
5 GHz
6 GHz
7 GHz
8 GHz
9 GHz
10 GHz
11 GHz
12.4 GHz
13 GHz
14 GHz
15 GHz
16 GHz
17 GHz
18 GHz
RCF
0.1 MHz
0.3 MHz
1 MHz
3 MHz
10 MHz
30 MHz
100 MHz
300 MHz
1 GHz
2 GHz
3 GHz
DEFAULT
100
100
100
Agilent 8481A
100
100
99.8
99
98.6
98
97.7
97.4
97.1
96.6
96.2
95.4
94.9
94.3
94.3
93.2
93
93
92.7
91.8
Agilent 8482A
98
98
99.5
99.3
98.5
98.5
98.1
97.6
97.5
97
95
93
N1911A/1912A P-Series Power Meters User’s Guide
Agilent 8483A
94.6
94
97.9
98.4
98.4
99.3
98.7
97.8
97.5
97.2
96.4
93
91
Agilent 8481D
RCF
99
50 MHz
99
500 MHz
99.5
1 GHz
99.4
2 GHz
99.5
3 GHz
98.6
4 GHz
98.6
5 GHz
98.5
6 GHz
98.5
7 GHz
98.6
8 GHz
98.7
9 GHz
99.5
10 GHz
98.6
11 GHz
98.7
12 GHz
99
12.4 GHz
99.1
13 GHz
98.9
14 GHz
99.4
15 GHz
98.9
16 GHz
99.1
17 GHz
98.4
18 GHz
100.1
RCF
0.1 MHz
0.3 MHz
1 MHz
3 MHz
10 MHz
30 MHz
100 MHz
300 MHz
1 GHz
2 GHz
3 GHz
4 GHz
191
7
Using 8480 Series Power Sensors
4.2 GHz
91
Agilent R8486A
100
100
94.9
94.9
95.4
94.3
94.1
93.5
93.7
93.7
94.9
94.5
94.4
93.7
94.9
93.5
93.9
92.3
Agilent 8485A
RCF
100
50 MHz
100
2 GHz
99.5
4 GHz
98.9
6 GHz
98.5
8 GHz
98.3
10 GHz
98.1
11 GHz
97.8
12 GHz
97.6
12.4 GHz
97.6
14 GHz
97.4
16 GHz
97
RCF
50 MHz
26.5 GHz
27 GHz
28 GHz
29 GHz
30 GHz
31 GHz
32 GHz
33 GHz
34 GHz
34.5 GHz
35 GHz
36 GHz
37 GHz
38 GHz
39 GHz
40 GHz
192
Agilent N8485A continued
17 GHz
96.7
18 GHz
96.6
19 GHz
96
20 GHz
96.1
21 GHz
96.2
22 GHz
95.3
23 GHz
94.9
24 GHz
94.3
25 GHz
92.4
26 GHz
92.2
26.5 GHz
92.1
Agilent R8486D
RCF
97.6
50 MHz
97.6
26.5 GHz
97.1
27 GHz
95.3
28 GHz
94.2
29 GHz
94.5
30 GHz
96.6
31 GHz
97.6
32 GHz
98
33 GHz
98.9
34 GHz
99.5
34.5 GHz
99
35 GHz
97.6
36 GHz
99
37 GHz
98.2
38 GHz
97.4
39 GHz
97.6
40 GHz
100
N1911A/1912A P-Series Power Meters User’s Guide
Using 8480 Series Power Sensors
RCF
50 MHz
100 MHz
500 MHz
1 GHz
2 GHz
3 GHz
4 GHz
5 GHz
6 GHz
7 GHz
8 GHz
9 GHz
10 GHz
11 GHz
12 GHz
13 GHz
14 GHz
15 GHz
16 GHz
17 GHz
18 GHz
19 GHz
20 GHz
21 GHz
22 GHz
23 GHz
24 GHz
25 GHz
26 GHz
27 GHz
28 GHz
29 GHz
30 GHz
31 GHz
32 GHz
33 GHz
34 GHz
Agilent 8487A
100
100
99.9
98.6
99.8
99.5
98.9
98.8
98.6
98.5
98.4
98.3
98.3
98.3
98.1
97.9
98
98.2
97.7
96.8
97
96.3
95.9
95.2
95.6
95.5
95.4
95
95.4
95.2
95.1
95
94.4
94
93.7
93.8
93
93.2
N1911A/1912A P-Series Power Meters User’s Guide
7
Agilent 8487A continued
34.5 GHz
93.5
35 GHz
93.1
36 GHz
92
37 GHz
92.4
38 GHz
90.9
39 GHz
91.3
40 GHz
91.4
41 GHz
90.6
42 GHz
89.9
43 GHz
89.1
44 GHz
88.1
45 GHz
86.9
46 GHz
85.8
47 GHz
85.4
48 GHz
83.2
49 GHz
81.6
50 GHz
80.2
Agilent Q8486A
RCF
100
50 MHz
100
33.5 GHz
91.3
34.5 GHz
92
35 GHz
91.7
36 GHz
91.5
37 GHz
92.1
38 GHz
91.7
39 GHz
91
40 GHz
90.7
41 GHz
90.3
42 GHz
89.5
43 GHz
88.5
44 GHz
88.7
45 GHz
88.2
46 GHz
87
47 GHz
86.4
48 GHz
85.3
49 GHz
84.7
50 GHz
82.9
193
7
Using 8480 Series Power Sensors
THIS PAGE HAS BEEN INTENTIONALLY LEFT BLANK.
194
N1911A/1912A P-Series Power Meters User’s Guide
N1911A/1912A P-Series Power Meters
User’s Guide
8
Using N8480 Series Power Sensors
Introduction 196
Power Meter Configuration Changes 198
Default Channel Setup 199
N8480 Series Sensors Connection Requirements 200
N8480 Series Power Sensors (excluding Option CFT) 201
N8480 Series Power Sensors with Option CFT 203
This chapter describes how to use your N8480 Series power sensors with P-Series power
meter.
Agilent Technologies
195
8
Using N8480 Series Power Sensors
Introduction
The N8480 Series power sensors is a replacement for the 8480 Series
power sensors (excluding the D- model sensors) with build- in Electrically
Erasable Programmable Read- Only Memory (EEPROM)1.
The N8480 Series power sensors is used for measuring the average power
supplied by RF or microwave source or a device- under- test (DUT). The
N8480 Series power sensors places a 50 ohm load on the RF or microwave
source. The power meter indicates the power dissipated in this load in W
or dBm.
The N8480 sensors (excluding Option CFT) measure power levels from
–35 dBm to +20 dBm (316 nW to 100 mW), at frequencies from 10 MHz to
33 GHz and have two independent power measurement path (upper and
lower range).
Table 8-14 Power range in the Range setting
Sensor
Range Setting
Lower Range
Upper Range
N8481/2/5/7/8A
and N8486AQ/AR
excluding Option CFT
AUTO (Default)
–35 dBm to –1 dBm
–1 dBm to +20 dBm
LOWER
–35 dBm to –1 dBm
-
UPPER2
-
–35 dBm to +20 dBm
AUTO (Default)
–5 dBm to +29 dBm
+29 dBm to +44 dBm
LOWER
–5 dBm to +29 dBm
-
UPPER
-
+29 dBm to +44 dBm
AUTO (Default)
–15 dBm to +17 dBm
+17 dBm to +35 dBm
LOWER
–15 dBm to +17 dBm
-
UPPER2
-
+17 dBm to +35 dBm
N8481/2B excluding
Option CFT
N8481/2H excluding
Option CFT
2
Meanwhile, the N8480 sensors with Option CFT only measure power levels
from –35 dBm to +20 dBm (1 µW to 100 mW) in single range.
Similiar to the E- Series power sensors, the N8480 Series power sensors
are also equipped with EEPROM to store sensor’s characteristics such as
model number, serial number, linearity, temperature compensation,
calibration factor1 and so forth. However, the calibration factor table
stored in EEPROM is not applicable for N8480 Series power sensors with
196
N1911A/1912A P-Series Power Meters User’s Guide
Using N8480 Series Power Sensors
8
Option CFT, and require that you use default calibration tables or
manually enter the required correction factors. Likewise, they cannot be
used to make peak or time gated measurements.
The N8480 Series power sensors consist of four sensor model types with
respective power range:
• A- models (–35 dBm to +20 dBm)
• N8481A, N8482A, N8485A, N8487A, and N8488A
• B- models (–5 dBm to +44 dBm)
• N8481B and N8482B
• H- models (–15 dBm to +35 dBm)
• N8481H and N8482H
• Waveguide- models (–35 dBm to +20 dBm)
• N8486AQ and N8486AR
Please refer to the documentation supplied with your Agilent N8480 Series
power sensors for specification and calibration information.
1 The calibration factor table stored in the EEPROM is not applicable for N8480 Series sensors with
Option CFT.
2 Recommended for pulse signals measurement with period of more than one second.
N1911A/1912A P-Series Power Meters User’s Guide
197
8
Using N8480 Series Power Sensors
Power Meter Configuration Changes
The Agilent P- Series power meter recognizes when an Agilent N8480
Series power sensor is connected. The N8480 Series power sensors
(excluding Option CFT) sensor calibration data is automatically read by
the power meter. In addition, the auto- averaging settings shown in
Figure 8- 134 are automatically configured.
Upper Range
Lower Range
0 dBm
30 dBm
20 dBm
–1 dBm
29 dBm
17 dBm
–10 dBm
20 dBm
10 dBm
–20 dBm
10 dBm
0 dBm
–30 dBm
0 dBm
–10 dBm
Maximum
Sensor Power
1
Resolution Setting
2
3
4
1
1
2
8
2
2
4
32
2
2
4
32
2
2
16
256
2
8
128
128
4
64
256
512
Number of Averages
Sensor Dynamic Range
N8481/2/5/7A
N8486AQ/AR N8481/2B N8481/2H
Minimum
Sensor Power
Figure 8-134Auto-averaging settings
NOTE
198
These values are valid only for the power meter channel connected to an Agilent N8480
Series power sensor. Averaging settings can also be manually configured. Refer to “Setting
Measurement Averaging” on page 49 for more details.
N1911A/1912A P-Series Power Meters User’s Guide
Using N8480 Series Power Sensors
8
Default Channel Setup
When a N8480 Series power sensor is connected, the following Channel
Setup is automatically configured. carrying out a Preset returns the
channel to this configuration.
Figure 8-135N8480 Series sensor (excluding Option CFT) default channel setup
Figure 8-136N8480 Series sensor with Option CFT default channel setup
N1911A/1912A P-Series Power Meters User’s Guide
199
8
Using N8480 Series Power Sensors
N8480 Series Sensors Connection Requirements
Table 8-15 N8480 Series connection requirements
Sensor
N8481A
N8481H
N8482A
N8482H
These power sensors connect directly to the POWER REF.
N8481B
N8482B
These power sensors are configured with an attenuator. Prior to
calibration this attenuator must be removed. Replace the attenuator
before making measurements.
N8485A
This power sensor requires an APC 3.5 (f) to 50 Ω (m) N-Type adapter
(08485-60005) to connect to the POWER REF.Remove this adapter before
making measurements.
N8486AR
N8486AQ
N8487A
N8488A
200
Connection Requirements
These waveguide power sensors have two connectors. Use the
N-Type connector to calibrate the power meter.
This sensor requires an APC 2.4 (f) to 50 Ω (m) N-Type adapter
(08487-60001) to connect to the POWER REF. Remove this adapter
before making measurements.
N1911A/1912A P-Series Power Meters User’s Guide
Using N8480 Series Power Sensors
8
N8480 Series Power Sensors (excluding Option CFT)
Power sensors have small errors in their response over frequency. The
response of each sensor is measured during manufacture (and during
periodic calibration). With N8480 Series power sensors (excluding Option
CFT), the resulting frequency compensation information is written into
Electrically Eraseable Programmable Read Only Memory (EEPROM). This
allows the frequency and calibration data to be downloaded to the power
meter automatically.
Using calibration factors enables you to achieve improved measurement
accuracy. This section describes making continuous wave measurements
using the N8480 Series power sensors (excluding Option CFT).
Making a measurement requires the following steps:
1 Zero and calibrate the power meter/sensor combination.
2 Set the frequency for the signal you want to measure.
3 Make the measurement.
Procedure
1 First zero and calibrate the power meter/sensor combination.
2 Ensure the power sensor is disconnected from any signal source.
3 Press
displayed.
and the channel Zero softkey. The Zeroing pop- up is
4 Connect the power sensor to the POWER REF output.
5 Press
and the channel Cal softkey to start the calibration
routine. The Calibrating pop- up is then displayed.
N1911A/1912A P-Series Power Meters User’s Guide
201
8
Using N8480 Series Power Sensors
NOTE
You can reduce the steps required to carry out the zero and calibration procedure as
follows:
1 Connect the power sensor to the POWER REF output.
2 Press
Zero + Cal
and Zero + Cal
, Zero + Cal A
. (For dual channel meters, press
or Zero + Cal B
as required).
Now set the frequency of the signal you want to measure. The power
meter automatically selects the appropriate calibration factor.
6 Press
7 Use the
. On dual channel meters select the required channel.
and
keys to highlight the Frequency value field and press
to display the Frequency pop- up. Use the numeric keypad to
enter the required value in the Frequency pop- up window.
Figure 8-137Frequency pop-up
8 Confirm your choice by pressing MHz or GHz .
9 Press
key to close the Channel Setup screen.
Now make the measurement.
10 Connect the power sensor to the signal to be measured.
The corrected measurement result is displayed.
202
N1911A/1912A P-Series Power Meters User’s Guide
Using N8480 Series Power Sensors
8
N8480 Series Power Sensors with Option CFT
Power sensors have small errors in their response over frequency. The
response of each sensor is measured during manufacture (and during
periodic calibration). The calibration factor table written into Electrically
Eraseable Programmable Read Only Memory (EEPROM) is not applicable
for N8480 Series power sensors with Option CFT. Therefore, the response
of each sensor is measured during manufacture (and during periodic
calibration) and the resulting frequency compensation information is
supplied in the form of calibration factors. The P- Series power meters
provide two methods of using the calibration factors:
• inputting the individual calibration factor for a frequency prior to
making the measurement, or
• using sensor calibration tables.
If you are making most of your measurements at a single frequency, or in
a narrow range of frequencies, entering a specific calibration factor is a
more effective method. Only a minimal amount of data entry is required.
However, if you are making measurements on a wide range of signal
frequencies, a sensor table is more effective as you only need to enter the
frequency of the signal you are measuring. The power meter automatically
selects and applies the calibration factor from the selected table.
Frequency Specific Calibration Factors
This section shows you how to make a measurement using the calibration
factor for the frequency of the signal you want to measure.
Tip This method is best suited to making several measurements at one
frequency as you need only enter a small amount of data.
Using this method requires the following steps:
1 Zero and calibrate the power meter/sensor combination.
2 Set the calibration factor value for the frequency of the signal you want
to measure.
3 Make the measurement
N1911A/1912A P-Series Power Meters User’s Guide
203
8
Using N8480 Series Power Sensors
Procedure
1 Ensure the power sensor is disconnected from any signal source.
2 Refer to the connection requirements in Table 8- 15 and ensure the
sensor is ready for connection to the Power Reference.
3 Check the current reference calibration factor setting by pressing
, REF CFs . The value is displayed under the channel Ref CF
softkey.
Does this setting match the value for the sensor? (The power sensor
reference calibration factor can normally be found above the calibration
factors table on the power sensor body.)
4 To change the settings, press the channel REF CF . The reference
calibration factor pop up window is displayed as shown in
Figure 8- 138. Use the numeric keypad to enter the required value in
the Ref Cal Factor pop- up menu.
Figure 8-138Reference calibration factor pop-up window
5 Press % to complete the entry.
Now zero and calibrate the power meter/sensor combination as follows:
6 Press
displayed.
and the channel Zero softkey. The Zeroing pop- up is
7 Connect the power sensor to the POWER REF output.
8 Press
and the channel Cal softkey to start the calibration
routine. The Calibrating pop- up is then displayed.
204
N1911A/1912A P-Series Power Meters User’s Guide
Using N8480 Series Power Sensors
NOTE
8
You can reduce the steps required to carry out the zero and calibration procedure as
follows:
1 Connect the power sensor to the POWER REF output.
2 Press
Zero + Cal
and Zero + Cal
, Zero + Cal A
. (For dual channel meters, press
or Zero + Cal B
as required).
Now set the sensor calibration factor for the frequency of the signal you
want to measure.
9 Check the current reference calibration factor setting by pressing
, Offset . The value is displayed on the Cal Fac field.
Does this setting match the value for the sensor? (The power sensor
reference calibration factor can normally be found above the calibration
factors table on the power sensor body.)
10 To change the settings, use the
and
keys to highlight the Cal Fac
value field and press
to display the Cal Factor pop- up. Use the
numeric keypad to enter the required value in the Cal Factor pop- up
window.
Figure 8-139Calibration factor pop-up window
11 Press % to complete the entry.
12 Connect the power sensor to the signal to be measured.
13 The corrected measurement result is displayed.
N1911A/1912A P-Series Power Meters User’s Guide
205
8
Using N8480 Series Power Sensors
Calibration Factor
Figure 8-140Calibration factor displayed
Example
To make a measurement on channel A with a power sensor which has a
reference calibration factor of 99.8% and a calibration factor of 97.6% at
the measurement frequency.
• Disconnect the power sensor from any signal source.
• Press
, REF CFs and the channel REF CF softkey.
• Use the numeric keypad to enter 99.8 in the Ref Cal Factor pop- up
window.
• Press % to complete the entry.
• Press
displayed.
and the channel Zero softkey. The Zeroing pop- up is
• Connect the power sensor to the POWER REF output.
• Press
and the channel Cal softkey to start the calibration
routine. The Calibrating pop- up is then displayed.
• Press
206
, Offset . The value is displayed on the Cal Fac field.
N1911A/1912A P-Series Power Meters User’s Guide
Using N8480 Series Power Sensors
8
• Use the
and
keys to highlight the Cal Fac value field and press
to display the Cal Factor pop- up. Use the numeric keypad to enter
97.6 in the Cal Factor pop- up window.
• Press % to complete the entry.
• Connect the power sensor to the signal to be measured.
• The corrected measurement result is displayed.
NOTE
When no sensor tables are selected and Single Numeric display mode is chosen, the
calibration factor used for the measurement is displayed in the upper window as shown in
Figure 8-140.
N1911A/1912A P-Series Power Meters User’s Guide
207
8
Using N8480 Series Power Sensors
Sensor Calibration Tables
This section describes how to use sensor calibration tables. Sensor
calibration tables store the measurement calibration factors, for a power
sensor model or for a specific power sensor, in the power meter. They are
used to correct measurement results.
Use sensor calibration tables when you want to make power measurements
over a range of frequencies using one or more power sensors.
The P- Series power meters are capable of storing 20 sensor calibration
tables each containing up to 80 frequency points. The power meter is
supplied with a set of 9 predefined sensor calibration tables plus a “100%”
default table. The data in these tables is based on statistical averages for
a range of Agilent Technologies power sensors. Your own sensor will most
likely differ from the typical to some degree. If you require best accuracy,
create a custom table for each sensor you use as shown
in“Editing/Generating Sensor Calibration Tables” on page 212.
To use calibration factor tables:
1 Select the sensor calibration table to be applied to a channel.
2 Zero and calibrate the power meter. The reference calibration factor
used during the calibration is automatically set by the power meter
from the sensor calibration table.
3 Specify the frequency of the signal you want to measure. The
calibration factor is automatically set by the power meter from the
sensor calibration table.
4 Make the measurement.
208
N1911A/1912A P-Series Power Meters User’s Guide
Using N8480 Series Power Sensors
8
Selecting a Sensor Calibration Table
You can select a calibration factor table from the
followed by Tables and Sensor Cal Table .
key menu
The State column indicates if any calibration factor tables are currently
selected. The Sensor Tbls screen is shown in Figure 8- 141.
NOTE
You can also view which sensor table is being used by pressing the
and
, Offset
use the
and
keys to highlight the CF Table setting field and press
to display the table.
Procedure
Select sensor calibration table as follows:
1 Press
2 Use the
, Tables , Sensor Cal Tables .
and
keys to highlight one of the 20 table titles and press
Table to highlight On .
Figure 8-141Sensor table selected
N1911A/1912A P-Series Power Meters User’s Guide
209
8
Using N8480 Series Power Sensors
NOTE
When no data is contained in the highlighted table, the Table key is disabled (grayed out).
3 Press Done to complete the selection of the calibration factor table.
4 Press Done again to display the measurement screen. Figure 8- 142
shows which offset table is selected.
Sensor Table 2 Selected
Figure 8-142Frequency dependent offset indicator
5 To change the frequency, press
highlight the Frequency field.
and use the
and
keys to
6 Press
to display the Frequency pop- up window. Use the numeric
keypad to enter the required value in the Frequency pop- up window.
7 To confirm your choice, press the appropriate unit softkey.
8 Connect the power sensor to the signal to be measured.
9 The corrected measurement result is now displayed.
NOTE
210
If the measurement frequency does not correspond directly to a frequency in the sensor
calibration table, the power meter calculates the calibration factor using linear
interpolation.
If you enter a frequency outside the frequency range defined in the sensor calibration table,
the power meter uses the highest or lowest frequency point in the sensor calibration table
to set the calibration factor.
N1911A/1912A P-Series Power Meters User’s Guide
Using N8480 Series Power Sensors
NOTE
8
When Single Numeric display mode is chosen, the frequency you entered and the
sensor table identifier is displayed in the upper window. Also, pressing
, Offset
displays the frequency you entered and calibration factor for each channel derived from the
selected sensor tables.
Figure 8-143Frequency/calibration table display
N1911A/1912A P-Series Power Meters User’s Guide
211
8
Using N8480 Series Power Sensors
Editing/Generating Sensor Calibration Tables
NOTE
Predefined sensor calbration factor table stored in power meter is not applicable for
Agilent N8480 Series power sensors with Option CFT. Therefore, users are required to
create a new sensor calibration table for the sensors when a sensor calibration table is
needed.
To help achieve the best accuracy in your measurement you can enter the
values supplied for the sensors you are using by editing the installed
sensor calibration tables or by generating your own custom tables.
You cannot delete any of the 20 existing calibration tables or create any
additional tables. However, you can edit or delete the content of each
table. If you need another table you should edit and re- name one of the
tables.Each calibration table can contain a maximum of 80 frequency
points.
To view the calibration tables currently stored in the power meter, press
, Tables , Sensor Cal Tables . The Sensor Tbls screen is displayed as
shown in Figure 8- 141.
Table 8-16 Installed power sensor models
Table
Sensor Model
Table
Sensor Model
0
DEFAULT1
5
8485A
1
8481A
6
R8486A
2
8482A2
7
Q8486A
3
8483A
8
R8486D
4
8481D
9
8487A
1
DEFAULT is a sensor calibration table where the reference calibration factor and calibration
factors are 100%. This sensor calibration table can be used during the performance testing of the
power meter.
212
N1911A/1912A P-Series Power Meters User’s Guide
Using N8480 Series Power Sensors
2
8
The Agilent 8482B and Agilent 8482H power sensors use the same data as the Agilent 8482A.
There are also ten sensor calibration tables named CUSTOM_0 through
CUSTOM_9. These tables do not contain any data when the power meter
is shipped from the factory.
Editing frequency dependent offset tables requires the following steps:
1 Identify and select the table you want to edit
2 Rename the table
3 Enter the frequency and offset pairs
4 Save the table
Procedure
First select the table you want to edit as follows:
1 Press
screen.
, Tables , Sensor Cal Tables
to display the Sensor Tbls
Figure 8-144“Sensor Tbls” screen
2 Choose the table you want to edit using the
Edit Table
and
keys. Press
to display the Edit Cal screen as shown in Figure 8- 145.
N1911A/1912A P-Series Power Meters User’s Guide
213
8
Using N8480 Series Power Sensors
Figure 8-145“Edit Cal” display
3 Highlight the table title using the
use
and
keys. Press Change and
the
,
,
and
keys to select and change the characters in the
Table Name pop- up to create the name you want to use.
Figure 8-146Edit table title pop-up
•
Pressing Insert Char adds a new character to the right of the
selected character.
• Pressing Delete Char
214
removes the selected character.
N1911A/1912A P-Series Power Meters User’s Guide
Using N8480 Series Power Sensors
8
4 Press Enter to complete the entry.
NOTE
A calibration factor in the range of 1 % to 150 % can be entered.
The following rules apply to naming sensor calibration tables:
•
The name must consist of no more than 12 characters.
•
All characters must be upper or lower case alphabetic characters, or numeric (0-9), or
an underscore (_).
•
No other characters are allowed.
•
No spaces are allowed in the name.
Enter (or edit) the frequency and cal factor pairs as follows:
1 Press Insert to add a new frequency value (or press Change to edit).
Use the numeric keypad to enter the required value in the Frequency
pop- up window. Complete the entry by pressing the GHz , MHz keys.
2 Enter the new cal factor value (or press Change to edit). Use the
numeric keypad to enter the required value in the Cal Factor pop- up
window. Complete the entry by pressing the % key.
3 Continue adding/editing values until you have entered all the data you
require.
4 When you have finished editing the table press Done to save the table.
NOTE
Ensure that the frequency points you use cover the frequency range of the signals you want
to measure. If you measure a signal with a frequency outside the frequency range defined
in the sensor calibration table, the power meter uses the highest or lowest frequency point
in the sensor calibration table to calculate the offset
N1911A/1912A P-Series Power Meters User’s Guide
215
8
Using N8480 Series Power Sensors
THIS PAGE HAS BEEN INTENTIONALLY LEFT BLANK.
216
N1911A/1912A P-Series Power Meters User’s Guide
N1911A/1912A P-Series Power Meters
User’s Guide
9
Complementary Cumulative Distribution
Function (CCDF)
Introduction 218
Setting the CCDF Table 219
This chapter describes the CCDF feature of the P-Series power meter.
Agilent Technologies
217
9
CCDF
Introduction
Many of the present digitally modulated signals now look noise- like in the
time and frequency domains. This means that statistical measurements of
the signals can be a useful characterization. Power Complementary
Cumulative Distribution Function (CCDF) curves characterize the higher
level power statistics of a digitally modulated signal. The curves can be
useful in determining design parameters for digital communication
systems.
A CCDF curve is defined by how much time the waveform spends at or
above a given power level. This is expressed in dB relative to the average
power. A CCDF curve is a plot of relative power levels versus probability
where the X- axis represents the dB above the average signal power, while
the Y- axis represents the percent of time the signal spends at or above the
power level specified by the X- axis.
The most important application of power CCDF curves is to specify,
completely and without ambiguity, the power characteristics of the signals
that will be mixed, amplified, and decoded in communication systems. For
example, baseband DSP signal designers can completely specify the power
characteristics of signals to the RF designers by using CCDF curves. This
helps avoid costly errors at system integration time. Similarly, system
manufacturers can avoid ambiguity by completely specifying the test signal
parameters to their amplifier suppliers.
CCDF curves apply to many design applications. Some of these
applications are:
• Visualizing the effects of modulation formats.
• Combining multiple signals via system’s components (for example,
amplifiers).
• Evaluating spread- spectrum systems.
• Designing and testing RF components.
218
N1911A/1912A P-Series Power Meters User’s Guide
CCDF
9
Setting the CCDF Table
To view the CCDF table, press
, Disp Type , 1 of 2 , and
CCDF Table . In the CCDF table, you can view the data in 3 ways
- windowed, expanded and full screen. The CCDF table is shown in
windowed format by default. However
you can press
NOTE
once for expanded format and twice for full- screen.
CCDF is only allowed in Free Run mode, it cannot be used in Triggered mode. CCDF is only
applicable to P-Series wideband power sensors (N192xA family).
Windowed CCDF Table
The CCDF table is shown in windowed format by default.
Figure 9-147CCDF table in windowed display
N1911A/1912A P-Series Power Meters User’s Guide
219
9
CCDF
Expanded CCDF Table
Press
once for an expanded view of the CCDF table.
Figure 9-148CCDF table in expanded display
In expanded format, you are allowed to query the power (dB) and the
probability (%) based on your input. You can also vary the sample count of
the CCDF table.
To set the sample count, press Statistical Settings then Counts 100.0M . You
can also set the mode to single or continuous. In single mode, the graph
and table readings will stop refreshing after the desired elapsed count is
acquired. In continuous mode, the graph and table readings will reset
after each cycle of elapsed count.
The mode can be set by pressing Mode Single Cont .
NOTE
220
The minimum elapsed count is 100 M, while the maximum is 10 G.
N1911A/1912A P-Series Power Meters User’s Guide
CCDF
NOTE
9
Statistical Settings can also be accessed in Marker Ctrl menu.
Full Screen CCDF Table
Press
twice for a full- screen view of the CCDF table.
Figure 9-149CCDF table in full-screen display
N1911A/1912A P-Series Power Meters User’s Guide
221
9
CCDF
Setting the CCDF Trace
The CCDF Trace display allows you to view the CCDF traces for Channel
A, Channel B, Gaussian and Reference. You can read the data by moving
the markers on the trace. In addition, the difference between markers on
Channel A, Channel B, Gaussian and Reference traces can be observed.
To view the CCDF trace, press
, Disp Type and CCDF Trace .
Step 1: Display the Trace
• Press Trace Control , Trace Display and select the trace that you wish to
display. The trace which is not selected is grayed out, as in
Figure 9- 150.
Figure 9-150Trace Display Select control menu
NOTE
222
Yellow - Channel A, Red - Channel B, Turquoise - Gaussian and Pink - Reference.
N1911A/1912A P-Series Power Meters User’s Guide
CCDF
9
Step 2: Setting the Marker
By using the marker, you can retrieve the data in between the limits of
the X- axis that have been set.
• Return to Marker Ctrl menu.
• Press Marker Trace .
• Press
and
to select Marker 1 or Marker 2.
• Press Chan A , Chan B , Gaussian , or Reference to select the trace that
you wish the marker to be placed on.
NOTE
Selected marker will have a green line outlining either Row 1 or Row 2.
Row 1
Row 2
Figure 9-151CCDF trace display with Marker Trace menu
to return to the Marker Ctrl menu.
• Press
• Press Marker 1 2 to select the marker.
• Press
and
to move the marker to get to the required location.
N1911A/1912A P-Series Power Meters User’s Guide
223
9
CCDF
While the marker is moving along the trace, the power (dB) and the
probability (%) will be reflected at the lower left corner as shown in
Figure 9- 151. Row 1 shows the reading for Marker 1 while row 2 shows
the reading for Marker 2. The lower right corner shows the delta reading
for Marker 2- Marker 1, average measurement, peak measurement and the
peak- to- average ratio for the respective channel that you have selected.
NOTE
The alphabet in the parenthesis after Average, Peak and Peak-Average measurements
represents: (A) - Channel A, (B) - Channel B, (G) - Gaussian, and (R) - Reference.
NOTE
Press
NOTE
once to view the displayed trace in full-screen.
Marker control menu is also accessible in the Trace Control menu.
Step 3: Setting the Scale/Div
• You are allowed to optimize the view of the trace by setting the
appropriate scale/div. The lowest limit is 0.1 dB while the highest limit
is 50 dB. A warning message will appear if the lower or upper limit has
been exceeded.
224
N1911A/1912A P-Series Power Meters User’s Guide
CCDF
9
Figure 9-152Scale/Div pop-up
Step 4: Store the Trace for Reference
• The function of Store to Reference is to save the trace of either Channel
A or Channel B into the volatile memory of the power meter.
• Press Reference under the Trace Display menu to retrieve the stored
trace.
N1911A/1912A P-Series Power Meters User’s Guide
225
9
CCDF
Figure 9-153Selection of CCDF trace to be stored as a reference trace
226
N1911A/1912A P-Series Power Meters User’s Guide
N1911A/1912A P-Series Power Meters
User’s Guide
10
Maintenance
Self Test 228
Error Messages 232
Operator Maintenance 243
Contacting Agilent Technologies 245
Erasing Memory Data 248
Returning Your Power Meter for Service 249
Agilent Sales and Service Offices 251
This chapter describes the built in tests, error messages and general maintenance.
Agilent Technologies
227
10
Maintenance
Self Test
The power meter has two self test modes:
• Power on self test - occurs automatically when you turn on the power
meter.
• Troubleshooting mode - accessed via the front panel or remotely. The
front panel softkey menu allows you to run individual tests, whereas
the remote command runs a complete series of tests as listed
in“Remote Testing” on page 230.
Power On Self Test
The power on self test is performed automatically when the power meter
is turned on and takes approximately 10 seconds to complete.
As the power on self test occurs, the message “Testing...” appears next to
the name of the test which is being performed. When each test is
complete, the message Testing... is replaced by either the message Passed
or Failed. If a failure occurs the message Power- up H/W Err appears.
Any errors are also written to the error queue and can be examined in
, Error List .
the Errors screen by pressing
Front Panel Selection of Self Tests
Press
, 1 of 2 , Service , Self Test
consisting of the following:
to access the Self Test menu
• Instrument Self Test
• Keyboard
• Bitmaps Displays
228
N1911A/1912A P-Series Power Meters User’s Guide
Maintenance
10
Instrument Self Test
If Self Test is selected, the following tests are run: (These are the same
tests which are run using the *TST? command.)
• Test Point Voltages
• Calibrator
• Fan
• Battery
• Channel Peak Path
• Channel CW Path
• Channel DAP Check
As each test takes place, the name of the test is listed on the screen.
While a test is running, the message Testing... appears beside the name of
the test. As each stage of the test is completed, the Testing... message is
replaced by either Passed or Failed.
Figure 10-154Self test complete
When the test is complete, the result is displayed. Press Done to return to
the Service menu.
If the self test failed, information about the failure is displayed on the
screen.
N1911A/1912A P-Series Power Meters User’s Guide
229
10
Maintenance
Remote Testing
To invoke the remote self test, the IEEE 488.1 compliant standard
command, *TST? is used. This command runs a full self test and returns
one of the following codes:
• 0 - no tests failed
• 1 - one or more tests failed
The remote self test consists of the following tests:
The communications assembly is tested implicitly, in that the command
will not be accepted or return a result unless the remote interface is
functioning correctly.
Refer to “Test Descriptions” on page 230 if you require a description of
each individual test.
When the *TST? command is executed, the screen is cleared. As each test
takes place, the name of the test is listed on the screen. While a test is
running, the message Testing... appears beside the name of the test. As
each stage of the test is completed, the message Testing... is replaced by
either the message Passed or Failed.
Test Descriptions
This section specifies what is actually checked by each of the tests. Some
of the tests may only be applicable to one method of invocation (for
example, from the front panel). If this is the case, it is specified in the
test description. Most of the tests have an associated error message which
is added to the error queue if the test fails. The exception to this is the
bitmap display test. Refer to “Error Messages” on page 232 for more
details.
Fan
This test confirms that the internal cooling fan is operating.
Calibrator
The reference calibrator is turned on (indicated by the POWER REF LED)
230
N1911A/1912A P-Series Power Meters User’s Guide
Maintenance
10
and measured internally. A pass or fail result is returned.
Display
Three tests are available for the display: the display assembly, display
RAM and bitmap display.
A read/write is performed on the display RAM. If the value which is
written is read back correctly, a pass is recorded, otherwise a fail is
recorded.
The liquid crystal display/ light emitting diode (LCD/LED) control circuits
are tested by making separate voltage measurements via the multiplexer
and digital signal processor. If the expected voltages are measured, a pass
is recorded, otherwise a fail is recorded. The three circuits tested are the
LCD contrast control, the LED brightness control, and the display
temperature sensing diode.
N1911A/1912A P-Series Power Meters User’s Guide
231
10
Maintenance
Error Messages
Introduction
This section contains information about error messages. It explains how to
read the power meter’s error queue and lists all error messages and their
probable causes.
When there is a hardware related problem, for example, a power sensor
overload, the error message is displayed on the status line at the top of
the display. In addition, the errors are also written to the error queue. If
there are any errors in the error queue the front panel error indicator is
displayed as shown in Figure 10- 155.
Other errors can also be generated when the power meter is being
operated over the remote interface. These errors also display the error
indicator and are written to the error queue.
Error Indicator
Figure 10-155Error indicator position
To read the error queue from the front panel:
• Press
, 1 of 2 , Service , Error List and use Next
through each error message.
232
to scroll
N1911A/1912A P-Series Power Meters User’s Guide
Maintenance
10
To read the error queue from the remote interface use:
• the SYSTem:ERRor? command.
Error queue messages have the following format:
Error
Number
,
“
Error
Description
;
Device
Dependent Info
”
Error Queue Message
For example, –330, “Self- test Failed;Battery Fault”.
Errors are retrieved in a first in first out (FIFO) order. If more than 30
errors occur, the error queue overflows and the last error in the queue is
replaced with error –350, “Queue Overflow”. Any time the queue overflows
the most recent error is discarded.
When the errors are read they are removed from the error queue. This
opens a position at the end of the queue for a new error message, if one
is subsequently detected. When all errors have been read from the queue,
further error queries return +0, “No errors”.
To delete all the errors in the queue from the front panel press:
• Press
, 1 of 2 , Service , Error List and use Clear Errors .
To delete all the errors in the queue remotely use:
• the *CLS (clear status) command.
The error queue is also cleared when the instrument power has been
switched off.
N1911A/1912A P-Series Power Meters User’s Guide
233
10
Maintenance
Error Message List
–101
Invalid character
An invalid character was found in the command string. You may have inserted a
character such as #, $, or % in the command header or within a parameter.
For example, LIM:LOW O#.
–102
Syntax error
Invalid syntax was found in the command string.
For example, LIM:CLE:AUTO, 1 or LIM:CLE: AUTO 1.
–103
Invalid separator
An invalid separator was found in the command string. You may have used a comma
instead of a colon, semicolon, or blank space; or you may have used a blank space
instead of a comma.
For example, OUTP:ROSC,1.
-105
GET not allowed
A Group Execute Trigger (GET) is not allowed within a command string.
–108
Parameter not allowed
More parameters were received than expected for the command. You may have entered
an extra parameter, or added a parameter to a command that does not accept a
parameter.
For example, CAL 10.
–109
Missing parameter
Fewer parameters were received than expected for the command. You omitted one or
more parameters that are required for this command. For example, AVER:COUN.
–112
Program mnemonic too long
A command header was received which contained more than the maximum 12
characters allowed.
For example, SENSeAVERageCOUNt 8.
234
N1911A/1912A P-Series Power Meters User’s Guide
Maintenance
–113
10
Undefined header
A command was received that is not valid for this power meter. You may have misspelled
the command, it may not be a valid command or you may have the wrong interface
selected. If you are using the short form of the command, remember that it may contain
up to four letters.
For example, TRIG:SOUR IMM.
–121
Invalid character in number
An invalid character was found in the number specified for a parameter value.
For example, SENS:AVER:COUN 128#H.
–123
Exponent too large
A numeric parameter was found whose exponent was larger than 32,000.
For example, SENS:COUN 1E34000.
–124
Too many digits
A numeric parameter was found whose mantissa contained more than 255 digits,
excluding leading zeros.
–128
Numeric data not allowed
A numeric value was received within a command which does not accept a numeric
value.
For example, MEM:CLE 24.
–131
Invalid suffix
A suffix was incorrectly specified for a numeric parameter. You may have misspelled the
suffix.
For example, SENS:FREQ 200KZ.
–134
Suffix too long
A suffix used contained more than 12 characters.
For example, SENS:FREQ 2MHZZZZZZZZZZZ.
–138
Suffix not allowed
A suffix was received following a numeric parameter which does not accept a suffix.
For example, INIT:CONT 0Hz.
N1911A/1912A P-Series Power Meters User’s Guide
235
10
Maintenance
–148
Character data not allowed
A discrete parameter was received but a character string or a numeric parameter was
expected. Check the list of parameters to verify that you have used a valid parameter
type.
For example, MEM:CLE CUSTOM_1.
–151
Invalid string data
An invalid string was received. Check to see if you have enclosed the character string in
single or double quotes.
For example, MEM:CLE “CUSTOM_1.
–158
String data not allowed
A character string was received but is not allowed for the command. Check the list of
parameters to verify that you have used a valid parameter type.
For example, LIM:STAT ‘ON’.
–161
Invalid block data
A block data element was expected but was invalid for some reason. For example,
*DDT #15FET. The 5 in the string indicates that 5 characters should follow, whereas in
this example there are only 3.
–168
Block data not allowed
A legal block data element was encountered but not allowed by the power meter at this
point.
For example, SYST:LANG #15FETC?.
–178
Expression data not allowed
A legal expression data was encountered but not allowed by the power meter at this
point.
For example, SYST:LANG (5+2).
–211
Trigger ignored
Indicates that <GET> or *TRG, or TRIG:IMM was received and recognized by the device
but was ignored because the power meter was not in the wait for trigger state.
236
N1911A/1912A P-Series Power Meters User’s Guide
Maintenance
–213
10
Init ignored
Indicates that a request for a measurement initiation was ignored as the power meter
was already initiated.
For example, INIT:CONT ON
INIT.
–214
Trigger deadlock
TRIG:SOUR was set to HOLD or BUS and a READ? or MEASure? was attempted,
expecting TRIG:SOUR to be set to IMMediate.
–220
Parameter error;Frequency list must be in ascending order.
Indicates that the frequencies entered using the MEMory:TABLe:FREQuency command
are not in ascending order.
–221
Settings conflict
This message occurs under a variety of conflicting conditions. The following list gives a
few examples of where this error may occur:
If the READ? parameters do not match the current settings.
If you are in fast mode and attempting to switch on for example, averaging, duty cycle or
limits.
Trying to clear a sensor calibration table when none is selected.
–222
Data out of range
A numeric parameter value is outside the valid range for the command.
For example, SENS:FREQ 2 kHZ.
–224
Illegal parameter value
A discrete parameter was received which was not a valid choice for the command. You
may have used an invalid parameter choice.
For example, TRIG:SOUR EXT.
–226
Lists not same length
This occurs when SENSe:CORRection:CSET[1]|CSET2:STATe is set to ON and the
frequency and calibration/offset lists do not correspond in length.
N1911A/1912A P-Series Power Meters User’s Guide
237
10
Maintenance
–230
Data corrupt or stale
This occurs when a FETC? is attempted and either a reset has been received or the
power meter state has changed such that the current measurement is invalidated (for
example, a change of frequency setting or triggering conditions).
–230
Data corrupt or stale;Please zero and calibrate Channel A
When CAL[1|2]:RCAL is set to ON and the sensor currently connected to Channel A has
not been zeroed and calibrated, then any command which would normally return a
measurement result (for example FETC?, READ?, or MEAS?) will generate this error
message.
–230
Data corrupt or stale;Please zero and calibrate Channel B
When CAL[1|2]:RCAL is set to ON and the sensor currently connected to Channel B has
not been zeroed and calibrated, then any command which would normally return a
measurement result (for example FETC?, READ?, or MEAS?) will generate this error
message.
–230
Data corrupt or stale;Please zero Channel A
When CAL[1|2]:RCAL is set to ON and the sensor currently connected to Channel A has
not been zeroed, then any command which would normally return a measurement result
(for example FETC?, READ?, or MEAS?) will generate this error message.
–230
Data corrupt or stale;Please zero Channel B
When CAL[1|2]:RCAL is set to ON and the sensor currently connected to Channel B has
not been zeroed, then any command which would normally return a measurement result
(for example FETC?, READ?, or MEAS?) will generate this error message
–230
Data corrupt or stale;Please calibrate Channel A
When CAL[1|2]:RCAL is set to ON and the sensor currently connected to Channel B has
not been calibrated, then any command which would normally return a measurement
result (for example FETC?, READ?, or MEAS?) will generate this error message
–230
Data corrupt or stale;Please calibrate Channel B
When CAL[1|2]:RCAL is set to ON and the sensor currently connected to Channel B has
not been calibrated, then any command which would normally return a measurement
result (for example FETC?, READ?, or MEAS?) will generate this error message
238
N1911A/1912A P-Series Power Meters User’s Guide
Maintenance
–231
10
Data questionable;CAL ERROR
Power meter calibration failed. The most likely cause is attempting to calibrate without
applying a 1 mW power to the power sensor.
–231
Data questionable;CAL ERROR ChA
Power meter calibration failed on Channel A. The most likely cause is attempting to
calibrate without applying a 1 mW power to the power sensor.
–231
Data questionable;CAL ERROR ChB
Power meter calibration failed on Channel B. The most likely cause is attempting to
calibrate without applying a 1 mW power to the power sensor.
–231
Data questionable;Input Overload
The power input to Channel A exceeds the power sensor’s maximum range.
–231
Data questionable;Input Overload ChA
The power input to Channel A exceeds the power sensor’s maximum range.
–231
Data questionable;Input Overload ChB
The power input to Channel B exceeds the power sensor’s maximum range.
–231
Data questionable;Lower window log error
This indicates that a difference measurement in the lower window has given a negative
result when the units of measurement were logarithmic.
–231
Data questionable;Upper window log error
This indicates that a difference measurement in the upper window has given a negative
result when the units of measurement were logarithmic.
–231
Data questionable;ZERO ERROR
Power meter zeroing failed. The most likely cause is attempting to zero when some
power signal is being applied to the power sensor.
–231
Data questionable;ZERO ERROR ChA
Power meter zeroing failed on Channel A. The most likely cause is attempting to zero
when some power signal is being applied to the power sensor.
N1911A/1912A P-Series Power Meters User’s Guide
239
10
Maintenance
–231
Data questionable;ZERO ERROR ChB
Power meter zeroing failed on Channel B. The most likely cause is attempting to zero
when some power signal is being applied to the power sensor.
–241
Hardware missing
The power meter is unable to execute the command because either no power sensor is
connected or it expects an E-series power sensor and one is not connected.
–310
System error;Dty Cyc may impair accuracy with ECP sensor
This indicates that the sensor connected is for use with CW signals only.
–310
System error;Ch A Dty Cyc may impair accuracy with ECP sensor
This indicates that the sensor connected to Channel A is for use with CW signals only.
–310
System error;Ch B Dty Cyc may impair accuracy with ECP sensor
This indicates that the sensor connected to Channel B is for use with CW signals only.
–310
System error;Sensor EEPROM Read Failed - critical data not found or unreadable
This indicates a failure with your E-Series or N8480 Series power sensor. Refer to your
power sensor manual for details on returning it for repair.
–310
System error;Sensor EEPROM Read Completed OK but optional data block(s) not found
or unreadable
This indicates a failure with your E-Series or N8480 Series power sensor. Refer to your
power sensor manual for details on returning it for repair.
–310
System error;Sensor EEPROM Read Failed - unknown EEPROM table format
This indicates a failure with your E-Series or N8480 Series power sensor. Refer to your
power sensor manual for details on returning it for repair.
–310
System error;Sensor EEPROM < > data not found or unreadable
Where < > refers to the sensor data block covered, for example, Linearity, Temp - Comp
(temperature compensation).
This indicates a failure with your E-Series or N8480 Series power sensor. Refer to your
power sensor manual for details on returning it for repair.
240
N1911A/1912A P-Series Power Meters User’s Guide
Maintenance
–310
10
System error;Sensors connected to both front and rear inputs.
You cannot connect two power sensors to the one channel input. In this instance the
power meter detects power sensors connected to both it’s front and rear channel inputs.
–321
Out of memory
The power meter required more memory than was available to run an internal operation.
–330
Self-test Failed;
The -330, “Self-test Failed” errors indicate that you have a problem with your power
meter. Refer to “Contacting Agilent Technologies” on page 245 for details of what to do
with your faulty power meter.
–330
Self-test Failed;Measurement Channel Fault
–330
Self-test Failed;Measurement Channel A Fault
–330
Self-test Failed;Measurement Channel B Fault
–330
Self-test Failed;Calibrator Fault
Refer to “Calibrator” on page 230 if you require a description of the calibrator test.
–330
Self-test Failed;ROM Check Failed
–330
Self-test Failed;RAM Check Failed
–330
Self-test Failed;Display Assy. Fault
Refer to “Display” on page 231 if you require a description of the Display test.
–350
Queue overflow
The error queue is full and another error has occurred which could not be recorded.
–361
Parity error in program
The serial port receiver has detected a parity error and consequently, data integrity
cannot be guaranteed.
N1911A/1912A P-Series Power Meters User’s Guide
241
10
Maintenance
–362
Framing error in program
The serial port receiver has detected a framing error and consequently, data integrity
cannot be guaranteed.
–363
Input buffer overrun
The serial port receiver has been overrun and consequently, data has been lost.
–410
Query INTERRUPTED
A command was received which sends data to the output buffer, but the output buffer
contained data from a previous command (the previous data is not overwritten). The
output buffer is cleared when power has been off, or after *RST (reset) command has
been executed.
–420
Query UNTERMINATED
The power meter was addressed to talk (that is, to send data over the interface) but a
command has not been received which sends data to the output buffer. For example you
may have executed a CONFigure command (which does not generate data) and then
attempted to read data from the remote interface.
–430
Query DEADLOCKED
A command was received which generates too much data to fit in the output buffer and
the input buffer is also full. Command execution continues but data is lost.
–440
Query UNTERMINATED after indefinite response
The *IDN? command must be the last query command within a command string.
242
N1911A/1912A P-Series Power Meters User’s Guide
Maintenance
10
Operator Maintenance
This section describes how to replace the power line fuse and clean the
power meter. If you need additional information about replacing parts or
repairing the power meter, refer to the P- Series Power Meter Service
Guide.
To clean the power meter, disconnect its supply power and wipe with a
damp cloth only.
The power line fuse is located within the power meter’s fuse holder
assembly on the rear panel. For all voltages the power meter uses a 250 V,
F3.15 AH, 20 mm fast blow fuse with high breaking capacity (Agilent part
number 2110- 0957).
NOTE
The power meter also has an internal fuse. If you suspect that this fuse needs to be
replaced, it must be done by trained service personnel. Please refer to “Returning Your
Power Meter for Service” on page 249.
Replacing the Power Line Fuse
1 Slide the fuse holder assembly from the rear panel as shown in
Figure 10- 156.
2 Install the correct fuse in the “In line” position as shown in
Figure 10- 156. (A spare fuse can be stored in the fuse holder
assembly.)
3 Replace the fuse holder assembly in the rear panel.
N1911A/1912A P-Series Power Meters User’s Guide
243
10
Maintenance
In-line Fuse
Spare Fuse
Figure 10-156Replacing the fuse
244
N1911A/1912A P-Series Power Meters User’s Guide
Maintenance
10
Contacting Agilent Technologies
This section details what to do if you have a problem with your power
meter.
If you have a problem with your power meter, first refer to the section
“Before calling Agilent Technologies”. This chapter contains a checklist
that will help identify some of the most common problems.
If you wish to contact Agilent Technologies about any aspect of the power
meter, from service problems to ordering information, refer to “Agilent
Sales and Service Offices” on page 251.
If you wish to return the power meter to Agilent Technologies refer to
“Returning Your Power Meter for Service” on page 249.
Before calling Agilent Technologies
Before calling Agilent Technologies or returning the power meter for
service, please make the checks listed in “Check the Basics” on page 245.
If you still have a problem, please read the warranty printed at the front
of this guide. If your power meter is covered by a separate maintenance
agreement, please be familiar with the terms.
Agilent Technologies offers several maintenance plans to service your
power meter after warranty expiration. Call your Agilent Technologies
Sales and Service Center for full details.
If the power meter becomes faulty and you wish to return the faulty
instrument, follow the description on how to return the faulty instrument
in the section “Contacting Agilent Technologies” on page 245.
Check the Basics
Problems can be solved by repeating what was being performed when the
problem occurred. A few minutes spent in performing these simple checks
may eliminate time spent waiting for instrument repair. Before calling
Agilent Technologies or returning the power meter for service, please make
the following checks:
N1911A/1912A P-Series Power Meters User’s Guide
245
10
Maintenance
• Check that the line socket has power.
• Check that the power meter is plugged into the proper ac power
source.
• Check that the power meter is switched on.
• Check that the line fuse is in working condition.
• Check that the other equipment, cables, and connectors are connected
properly and operating correctly.
• Check the equipment settings in the procedure that was being used
when the problem occurred.
• Check that the test being performed and the expected results are
within the specifications and capabilities of the power meter.
• Check the power meter display for error messages.
• Check operation by performing the self tests.
• Check with a different power sensor.
Instrument serial numbers
Agilent Technologies makes frequent improvements to its products to
enhance their performance, usability and reliability. Agilent Technologies
service personnel have access to complete records of design changes for
each instrument. The information is based on the serial number and
option designation of each power meter.
Whenever you contact Agilent Technologies about your power meter have a
complete serial number available. This ensures you obtain the most
complete and accurate service information. The serial number can be
obtained by:
• interrogating the power meter over the remote interface using the
*IDN? command.
• from the front panel by pressing
, 1 of 2
, Service , Version .
• from the serial number label.
246
N1911A/1912A P-Series Power Meters User’s Guide
Maintenance
10
The serial number label is attached to the rear of each Agilent
Technologies instrument. This label has two instrument identification
entries. The first provides the instruments serial number and the second
provides the identification number for each option built into the
instrument.
The serial number is divided into two parts: the prefix (two letters and
the first four numbers), and the suffix (the last four numbers).
• The prefix letters indicate the country of manufacture. This code is
based on the ISO international country code standard, and is used to
designate the specific country of manufacture for the individual
product. The same product number could be manufactured in two
different countries. In this case the individual product serial numbers
would reflect different country of manufacture codes. The prefix also
consists of four numbers. This is a code identifying the date of the last
major design change.
• The suffix indicates an alpha numeric code which is used to ensure
unique identification of each product throughout Agilent Technologies.
SERIAL NUMBER
SER MY12345678
OPT
Agilent
MADE IN MALAYSIA
N1911A/1912A P-Series Power Meters User’s Guide
247
10
Maintenance
Erasing Memory Data
If you need to erase the P- Series power meter’s memory, for example,
before you return it to Agilent Technologies for repair or calibration, of all
data stored in it.
The memory data erased includes the save/recall states and power on last
states.
The following procedure explains how to do this.
1. Press the
key.
2. Press 1 of 2 .
3. Press Service .
4. Press Secure Erase .
5.
If you are sure, press the Confirm key.
6. A pop- up appears, as shown in Figure 10- 157 informing you of the
status of the procedure.
Figure 10-157Secure erase status pop-up
248
N1911A/1912A P-Series Power Meters User’s Guide
Maintenance
10
Returning Your Power Meter for Service
Use the information in this section if you need to return your power
meter to Agilent Technologies.
Packaging the Power Meter for Shipment
Use the following steps to package the power meter for shipment to
Agilent Technologies for service:
• Fill in a blue service tag (available at the end of this guide) and attach
it to the power meter. Please be as specific as possible about the nature
of the problem. Send a copy of any or all of the following information:
• Any error messages that appeared on the power meter display.
• Any information on the performance of the power meter.
CAUTION
Power meter damage can result from using packaging materials other than those specified.
Never use styrene pellets in any shape as packaging materials. They do not adequately
cushion the power meter or prevent it from shifting in the carton. Styrene pellets cause
power meter damage by generating static electricity and by lodging in the rear panel.
• Use the original packaging materials or a strong shipping container
that is made of double- walled, corrugated cardboard with 159 kg (350
lb) bursting strength. The carton must be both large enough and strong
enough to accommodate the power meter and allow at least 3 to 4
inches on all sides of the power meter for packing material.
• Surround the power meter with at least 3 to 4 inches of packing
material, or enough to prevent the power meter from moving in the
carton. If packing foam is not available, the best alternative is SD- 240
Air Cap TM from Sealed Air Corporation (Commerce, CA 90001). Air
Cap looks like a plastic sheet covered with 1- 1/4 inch air filled
bubbles. Use the pink Air Cap to reduce static electricity. Wrap the
power meter several times in the material to both protect the power
meter and prevent it from moving in the carton.
N1911A/1912A P-Series Power Meters User’s Guide
249
10
Maintenance
• Seal the shipping container securely with strong nylon adhesive tape.
• Mark the shipping container “FRAGILE, HANDLE WITH CARE” to
ensure careful handling.
• Retain copies of all shipping papers.
250
N1911A/1912A P-Series Power Meters User’s Guide
Maintenance
10
Agilent Sales and Service Offices
In any correspondence or telephone conversations, refer to the power
meter by its model number and full serial number. With this information,
the Agilent representative can quickly determine whether your unit is still
within its warranty period.
UNITED STATES
Agilent Technologies
(tel) 1 800 829 4444
CANADA
Agilent Technologies Canada Inc.
Test & Measurement
(tel) 1 877 894 4414
EUROPE
Agilent Technologies
Test & Measurement
European Marketing Organization
(tel) (31 20) 547 2000
JAPAN
Agilent Technologies Japan Ltd.
(tel) (81) 426 56 7832
(fax) (81) 426 56 7840
LATIN AMERICA
Agilent Technologies
Latin America Region Headquarters, USA
(tel) (305) 267 4245
(fax) (305) 267 4286
AUSTRALIA and
NEW ZEALAND
Agilent Technologies Australia Pty Ltd.
(tel) 1-800 629 4852 (Australia)
(fax) (61 3) 9272 0749 (Australia)
(tel) 0-800 738 378 (New Zealand)
(fax) (64 4) 802 6881 (New Zealand)
ASIA PACIFIC
Agilent Technologies, Hong Kong
(tel) (852) 3197 7777
(fax) (852) 2506 9284
Or visit Agilent’s Website at http://www.agilent.com/find/assist.
N1911A/1912A P-Series Power Meters User’s Guide
251
10
Maintenance
THIS PAGE HAS BEEN INTENTIONALLY LEFT BLANK.
252
N1911A/1912A P-Series Power Meters User’s Guide
N1911A/1912A P-Series Power Meters
User’s Guide
11
Specifications and Characteristics
Introduction 254
Power Meter Specifications 256
Measurement Characteristics 259
Rear Panel Inputs and Output Connections 262
1 mW Power Reference 263
Environmental Conditions 264
Physical Characteristics 265
Regulatory Information 266
System Specifications and Characteristics 267
This chapter describes the specifications and characteristics of your P-Series power meter.
Agilent Technologies
253
11
Specifications and Characteristics
Introduction
This chapter details the P- Series power meters’s specifications and
supplemental characteristics. Information contained in this chapter refers
to operation with P- Series wideband power sensors.
Specification Definitions
There are two types of product specifications:
• Warranted specifications
• Characteristic specifications
Warranted specifications
Warranted specifications are covered by the product warranty and apply
over 0 oC to 55 oC, unless otherwise noted. Warranted specifications
include Measurement Uncertainty calculated with 95 % confidence.
Characteristic specifications
Characteristic specifications are not warranted. They describe product
performance that is useful in the application of the power sensors by
giving typical, but non- warranted performance parameters. These
characteristics are shown in italics or denoted as “typical”, “nominal” or
“approximate”.
Characteristic information is representative of the product. In many cases,
it may also be supplemental to a warranted specification. Characteristic
specifications are not verified on all power sensors. The types of
characteristic specifications can be placed in two groups:
• The first group of characteristic types describes 'attributes' common to
all products of a given model or option.
Examples of characteristics that describe 'attributes' are product
weight, and 50 W input Type- N connector. In these examples product
weight is an approximate value and a 50 W input is nominal. These
two terms are most widely used when describing a product's
'attributes'.
254
N1911A/1912A P-Series Power Meters User’s Guide
Specifications and Characteristics
11
• The second group of characteristic types describes 'statistically' the
aggregate performance of the population of products.
These characteristics describe the expected behavior of the population
of products. They do not guarantee the performance of any individual
product. No measurement uncertainty value is accounted for in the
specification. These specifications are referred to as typical.
Conditions
The power meter and sensor meet its specifications when:
• Stored for a minimum of two hours at a stable temperature within the
operating temperature range, and turned on for at least 30 minutes.
• The power meter and power sensor are within their recommended
calibration periods.
• Used in accordance to the information provided in the power meter’s
user's guide.
Measurement uncertainties
For information on measurement uncertainty calculations, refer to Agilent
AN 1449- 1 to Agilent AN 1449- 4 “Fundamentals of RF and Microwave
Power Measurements”, Literature Number 5988- 9213EN to 5988- 9216EN.
N1911A/1912A P-Series Power Meters User’s Guide
255
11
Specifications and Characteristics
Power Meter Specifications
Number of Channels
• N1911A P- Series power meter, single channel
• N1912A P- Series power meter, dual channel
Frequency Range
• N1921A P- Series wideband power sensor, 50 MHz to 18 GHz
• N1922A P- Series wideband power sensor, 50 MHz to 40 GHz
Dynamic Range
• –35 dBm to +20 dBm (> 500 MHz)
• –30 dBm to +20 dBm (50 MHz - 500 MHz)
Measurements
The following Power measurements are provided with free- run or time
gated definition.
• Average
• Peak
• Minimum
• Peak- to- Average
Time parameter measurements of pulse rise time, fall time, pulse width,
time to positive occurrence, time to negative occurrence, pulse repetitive
frequency and duty cycle are also provided.
256
N1911A/1912A P-Series Power Meters User’s Guide
Specifications and Characteristics
11
Power Sensors Compatibility
P- Series power meters are compatible with all Agilent P- Series wideband
power sensors.
The P- Series power meters also operates with N8480 Series power sensors
and the existing 8480 Series and E- Series (E4410, E9300, and E9320)
ranges of power sensors.1
Meter Uncertainty
Instrumentation Linearity
±0.8 %
Average Power Measurement Accuracy2
• N1921A:
≤± 0.2 dB or ±4.5 %
• N1922A:
≤± 0.3 dB or ±6.7 %
1 For specifications when using an 8480, N8480 Series and E-Series sensors (except E9320A
range), refer to Lit Number 5965-6382E. For specifications when using an E932XA sensors, refer to
Lit Number 5980-1469E.
2 Specification is valid over –15 to +20 dBm, and a frequency range 0.5 to 10 GHz, DUT Max. SWR
< 1.27 for the N1921A, and a frequency range 0.5 to 40 GHz, DUT Max. SWR < 1.2 for the N1922A.
Averaging set to 32, in Free Run mode.
N1911A/1912A P-Series Power Meters User’s Guide
257
11
Specifications and Characteristics
Remote Programming
Interface:
GPIB interface operates to IEEE 488.2 and IEC-625
10/100BaseT Lan Interface
USB 2.0 Interface
Command Language:
SCPI standard interface commands3
GPIB Compatibility:
SH1, AH1, T6, TE0, L4, LE0, SR1, RL1, PP1, DC1, DT1, C0
3 The P-Series power meters are not compatible with the 436A, 437B, or the 438A power meter
command sets.
Timebase
Timebase Range
2 ns to 100 msec/div
Accuracy
±10 ppm
Jitter
≥ 1 ns
Bandwidth
NOTE
258
Video Bandwidth
≥ 30 MHz
Single Shot Bandwidth
≥ 30 MHz
The video bandwidth represents the ability of the power sensor and meter to follow the
power envelope of the input signal. The power envelope of the input signal is, in some
cases, determined by the signal’s modulation bandwidth, hence, video bandwidth is
sometimes referred to as modulation bandwidth.
N1911A/1912A P-Series Power Meters User’s Guide
Specifications and Characteristics
11
Measurement Characteristics
Trigger
Internal Trigger
Range: –20 to +20 dBm
Resolution: 0.1 dB
Level Accuracy: ±0.5 dB
Latency:4 160 ns±10 ns
Jitter: ≤ 5 ns rms
External TTL Trigger
Input
High: >2.4 V
Low: <0.7 V
Latency:4 90 ns±10 ns
Minimum trigger pulse width: 15 ns
Minimum trigger repetition period: 50 ns
Impedance: 50 Ω
Jitter: ≤ 5 ns rms
External TTL Trigger
Output
Low to High transition on trigger event.
High: >2.4 V
Low: <0.7 V
Latency:4 30 ns ±10 ns
Impedance: 50 Ω
Jitter: ≤ 5 ns rms
Trigger Delay
Delay range: ±1.0 s, maximum
Delay resolution: 1 % of delay setting
(10 ns maximum)
Trigger Hold-off
Range: 1 µs to 400 ms
Resolution: 1 % of selected value
(to a minimum of 10 ns)
Trigger Level Threshold
Hysteresis
Range: ±3 dB
Resolution: 0.05 dB
4
Latency is defined as the delay between the applied RF crossing the trigger level and the power
meter switching into the triggered state.
N1911A/1912A P-Series Power Meters User’s Guide
259
11
Specifications and Characteristics
Measurement Speed
Measurement speed using remote
interface
≥ 1500 readings per second
Pulse Characteristic
These pulse characteristics are only applicable when a P- Series wideband
sensor is used.
Rise Time and Fall Time
≤ 13 ns5,6
Minimum Pulse Width
50 ns7
Overshoot
≤ 5%
Maximum Pulse Repetition Rate
10 MHz8
5 Applies to frequencies >500 MHz (See Figure 11-158).
6 Applies only when Off is selected for video bandwidth.
7 The Minimum Pulse Width is the recommended minimum pulse width viewable on the power
meter, where power measurements are meaningful and accurate, but not warranted.
8 Based on 10 samples per period.
Maximum Sample Rate and Capture Length
260
Maximum Sampling Rate
100 Msamples/second,
continuous sampling
Maximum Capture Length
1 second
N1911A/1912A P-Series Power Meters User’s Guide
Specifications and Characteristics
11
% Error
35
30
25
20
15
10
5
0
15 20 25 30 35 40 45 50 55 60 65 70 75 80 85 90 95 100
Signal under test rise time (ns)
Figure 11-158Measured rise time percentage error versus signal under test rise time
Although the rise time specification is ≤13 ns, this does not mean that the
P- Series meter and sensor combination can accurately measure a signal
with a known rise time of 13 ns. The measured rise time is the root sum
of the squares (RSS) of the signal under test rise time and the system rise
time (13 ns).
2
2
( ( SignalUnderTestRiseTime ) + ( SystemRiseTime ) )
( MeasuredRiseTime – SignalUnderTestRiseTime )
--------------------------------------------------------------------------------------------------------------------------------------( SignalUnderTestRiseTime ) × 100
N1911A/1912A P-Series Power Meters User’s Guide
261
11
Specifications and Characteristics
Rear Panel Inputs and Output Connections
Recorder Output(s):9
Analog 0 to 1 V, 1 kW output impedance, BNC connector
GPIB
Interfaces allow communication with an external
controller
USB 2.0
10/100BaseT LAN
Trigger Input:
Input has TTL compatible logic levels and uses a BNC
connector
Trigger Out:
Output provides TTL compatible logic levels and uses a
BNC connector
Ground:
Binding post, accepts 4 mm plug or bare wire connection
9 Two recorder outputs are available on the dual channel N1912A P-Series power meter.
Line Power
Input Voltage Range
100 to 240 Vac
100 to 120 Vac
Automatic voltage selection
Fluctuations not exceeding ±10%
262
Input Frequency Range
50 to 60 Hz (100 to 240 Vac)
440 Hz (100 to 120 Vac)
Power Requirement
70 VA (maximum)
N1911A/1912A P-Series Power Meters User’s Guide
Specifications and Characteristics
11
1 mW Power Reference
NOTE
The 1mW Power Reference is provided for calibration of the E-Series, 8480 Series and the
N8480 Series power sensors. The P-Series sensors are automatically calibrated, hence, do
not need this power reference for calibration.
Power Output:
1.00 mW (0.0 dBm)
Factory set to ±0.4 % traceable to the National Physical
Laboratories (NPL), UK
Accuracy:
(over 2-years)
±1.2 % (0 - 55 ºC)
±0.4 % (25 ± 10 ºC)
Frequency:
50 MHz nominal
SWR:
1.08 (0 - 55 ºC)
1.05 typical
Connector Type:
Type N (f), 50 W
N1911A/1912A P-Series Power Meters User’s Guide
263
11
Specifications and Characteristics
Environmental Conditions
General
Complies with the requirements of the EMC Directive 89/336/EEC.
Operating Environment
Temperature:
0 oC to 55 oC
Maximum Humidity:
95 % at 40 oC (non-condensing)
Minimum Humidity:
15 % at 40 oC (non-condensing)
Maximum Altitude:
3,000 meters (9,840 feet)
Storage Conditions
264
Non-Operating Storage Temperature:
–40 oC to +70 oC
Non-Operating Maximum Humidity:
90 % at 65 oC (non-condensing)
Non-Operating Maximum Altitude:
15,240 meters (50,000 feet)
N1911A/1912A P-Series Power Meters User’s Guide
Specifications and Characteristics
11
Physical Characteristics
Dimensions
The following dimensions exclude front and rear panel protrusions:
• 88.5 mm H x 212.6 mm W x 348.3 mm D (3.5 in x 8.5 in x 13.7 in)
Weight
Weight (Net):
N1911A: ≤ 3.5 kg (7.7 lb) approximately
N1912A: ≤ 3.7 kg (8.1 lb) approximately
Weight (Shipping):
N1911A: ≤ 7.9 kg (17.4 lb) approximately
N1912A: ≤ 8.0 kg (17.6 lb) approximately
N1911A/1912A P-Series Power Meters User’s Guide
265
11
Specifications and Characteristics
Regulatory Information
Electromagnetic Compatibility
This product complies with the protection requirements of European
Council Directive 89/336/EEC for Electromagnetic Compatibility (EMC).
The conformity assessment requirements have been met using the
technical construction file route to compliance, using EMC test
specifications EN 55011:1991 (Group 1, Class A) and EN 50082- 1:1992. In
order to preserve the EMC performance of the product, any cable which
becomes worn or damaged must be replaced with the same type and
specification.
The product also meets the following EMC standards:
• IEC 61326- 1:2005/EN61326- 1:2006
• CISPR11:2003/EN55011:2007, Group 1 Class A
• Canada: ICES/NMB- 001:Issue 4, June 2006
• Australia/New Zealand: AS/NZS CISPR 11:2004
Product Safety
This product conforms to the requirements of the following safety
standards:
• IEC 61010- 1:2010/EN 61010- 1:2010 (3rd Edition)
• Canada: CAN/CSA- C22.2 No. 61010- 1- 12
• USA: ANSI/UL 61010- 1 (3rd Edition)
Low Voltage Directive
This product conforms to the requirements of European Council Directive
73/23/EEC.
266
N1911A/1912A P-Series Power Meters User’s Guide
Specifications and Characteristics
11
System Specifications and Characteristics
The video bandwidth in the meter can be set to High, Medium, Low and
Off. The video bandwidths stated in the table below are not the 3 dB
bandwidths, as the video bandwidths are corrected for optimal flatness
(except the Off filter). Refer to Figure 11- 159 for information on the
flatness response of the High, Medium, Low and Off filters. The Off video
bandwidth setting provides the warranted rise time and fall time
specification and is the recommended setting for minimizing overshoot on
pulse signals.
Rise Time, Fall Time, and Overshoot versus Video Bandwidth
Settings
Parameter
Video Bandwidth Setting
Rise Time/ Fall Time
Overshoot10
9
Low:
5 MHz
Medium:
15 MHz
High:
30 MHz
Off
< 500 MHz
> 500 MHz
< 56 ns
< 25 ns
≤ 13 ns
< 36 ns
≤ 13 ns
-
-
-
<5%
<5%
9 Specified as 10 % to 90 % for rise time and 90 % to 10 % for fall time on a 0 dBm pulse.
10 Specified as the overshoot relative to the settled pulse top power.
NOTE
For option 107 (10 m cable), add 5 ns to the rise time and fall time specifications.
N1911A/1912A P-Series Power Meters User’s Guide
267
11
Specifications and Characteristics
Characteristic Peak Flatness
The peak flatness is the flatness of a peak- to- average ratio measurement
for various tone- separations for an equal magnitude two- tone RF input.
Figure 11- 159 refers to the relative error in peak- to- average ratio
measurements as the tone separation is varied. The measurements were
performed at –10 dBm with power sensors with 1.5 m cable lengths.
0.5
HIGH
0.0
-0.5
-1.0
Error (dB)
MEDIUM
OFF
( < 500MHz)
OFF
( > 500MHz)
-1.5
LOW
-2.0
-2.5
-3.0
-3.5
0
5
10
15
20
25
30
Input tone separation frequency (MHz)
Figure 11-159P-Series sensor error in peak-to-average measurements for a two-tone input
268
N1911A/1912A P-Series Power Meters User’s Guide
Specifications and Characteristics
11
Noise and Drift
Sensor
Model
Zeroing
Zero Set
<500 MHz
N1921A /
N1922A
No RF at
input
Noise per
Sample
Measurement
Noise
(Free Run)12
100 nW
2 µW
50 nW
> 500 MHz
200 nW
550 nW
RF Present
Zero
Drift11
200 nW
11 Within 1 hour after a zero, at a constant temperature, after 24 hour warm-up of the power meter.
This component can be disregarded with Auto-zero mode set to ON.
12 Measured over a one-minute interval, at a constant temperature, two standard deviations, with
averaging set to 1.
Measurement
Average Setting
1
2
4
8
16
32
64
128
256
512
1024
Free Run Noise
Multiplier
1
0.9
0.8
0.7
0.6
0.5
0.45
0.4
0.3
0.25
0.2
Video BW setting
Noise per Sample
Multiplier
Low
5 MHz
Medium
15 MHz
High
30 MHz
Off
< 500 MHz
0.5
1
2
1
≥ 500 MHz
0.45
0.75
1.1
1
Effect of Video Bandwidth Setting:
The noise per sample is reduced by applying the meter video bandwidth filter setting (High,
Medium or Low). If averaging is implemented, this will dominate any effect of changing the
video bandwidth.
N1911A/1912A P-Series Power Meters User’s Guide
269
11
Specifications and Characteristics
Effect of time-gating on measurement noise
The measurement noise on a time- gated measurement depends on the
time gate length. 100 averages are carried out every 1 µs of gate length.
The Noise- per- Sample contribution in this mode can approximately be
reduced by ÷(gate length / 10 ns) to a limit of 50 nW.
270
N1911A/1912A P-Series Power Meters User’s Guide
www.agilent.com
Contact us
To obtain service, warranty, or technical support
assistance, contact us at the following phone
numbers:
United States:
(tel) 800 829 4444
(fax) 800 829 4433
Canada:
(tel) 877 894 4414
(fax) 800 746 4866
China:
(tel) 800 810 0189
(fax) 800 820 2816
Europe:
(tel) 31 20 547 2111
Japan:
(tel) (81) 426 56 7832 (fax) (81) 426 56 7840
Korea:
(tel) (080) 769 0800
(fax) (080) 769 0900
Latin America:
(tel) (305) 269 7500
Taiwan:
(tel) 0800 047 866
(fax) 0800 286 331
Other Asia Pacific Countries:
(tel) (65) 6375 8100
(fax) (65) 6755 0042
Or visit Agilent World Wide Web at:
www.agilent.com/find/assist
Product specifications and descriptions in this
document are subject to change without notice.
Always refer to the English version at the Agilent
Web site for the latest revision.
© Agilent Technologies, Inc. 2006–2014
Printed in Malaysia
Twelfth Edition, April 4, 2014
N1912-90002
Agilent Technologies